1. Introduction
The Belt and Road Initiative (BRI), introduced by China in 2013, aims to enhance trade, foster infrastructure development, and facilitate international collaboration across Asia, Africa, and Europe. As part of this expansive initiative, there was considerable attention directed towards the trade of solar photovoltaic (PV) products due to their potential to drive green and sustainable development [
1]. These nations, positioned along the Belt and Road, possess strategic resources such as oil, coal, natural gas, and uranium, endowing them with pivotal roles in global supply chains and offering prospects for mutually beneficial partnerships. Approaching its 10th anniversary, the BRI places a heightened emphasis on achieving green and sustainable growth, given the escalating global greenhouse gas emissions [
2]. Solar PV products encompass a broad array of technologies and equipment designed to convert sunlight into electricity through the photovoltaic effect. These include solar cells, which are the basic units for electricity generation, and solar panels, which are assemblies of these cells. Inverters play a crucial role in converting the direct current generated into usable alternating current. Mounting systems, such as racks and trackers, secure the panels and may adjust their orientation for optimal sunlight capture. The system also requires specialized solar cables and connectors for efficient electrical transmission, as well as charge controllers to regulate voltage and current to batteries. Energy storage is facilitated through batteries, which store excess generated electricity. Monitoring systems provide real-time performance tracking, and solar PV kits offer pre-packaged sets of equipment for specific applications. Additional components such as junction boxes, grounding equipment, and specialized solar PV glass are also part of the Balance of System (BoS), ensuring the safe and efficient operation of the entire solar PV system.
Aligned with the carbon reduction goals stipulated in the Paris Agreement, the global energy sector is increasingly prioritizing environmentally friendly recycling and low-carbon advancement [
3]. Against this backdrop, collaborative efforts in clean energy, particularly in the solar domain, assume paramount significance for China’s bilateral energy engagements with BRI member states [
4]. Diverging from conventional fossil fuels, solar energy emerges as a promising and sustainable source, carrying substantial business potential [
5,
6]. Its role in harmonizing the energy composition of Belt and Road countries is pivotal, while also serving as a crucial conduit for realizing the Sustainable Development Goals (SDGs) [
2,
7]. It is imperative to formulate a comprehensive network model and conduct an in-depth analysis of the influential factors within this context.
Given the pronounced importance of fostering environmentally sustainable Belt and Road initiatives and evaluating the “Five Connectivity” framework after a decade of BRI implementation, it becomes imperative to re-evaluate the unfolding patterns in solar PV trade and discern the socio-economic variables shaping this trade landscape. This meticulous analysis assumes a crucial role in offering real-time insights into the advancement of the green Belt and Road endeavor and the efficacy of construction endeavors, all within the context of the 10-year BRI timeline and the profound impacts of the COVID-19 pandemic.
This thesis embarks on three distinct and specific research objectives: Firstly, it seeks to construct an intricate trade network dedicated to photovoltaic products, which subsequently serves as a foundational platform for scrutinizing the intricate evolutionary trends, structural compositions, clustering dynamics, and other intrinsic features of this trade network. Secondly, the research endeavors to devise a centrality influence model tailored to the PV trade network, thereby facilitating a comprehensive analysis of pertinent influencing factors from the vantage point of the “Five Connectivity” dimensions. Thirdly, the study aims to champion the establishment of a Solar PV Trade Center, fostering an optimal environment to enhance the efficiency and quality of solar PV products trade among the diverse BRI countries.
Social network analysis (SNA) stands at the intersection of diverse disciplines, seamlessly integrating social psychology, sociology, statistics, and graph theory. Its origins can be traced to Euler’s innovative exploration of the “Seven Bridges Problem” in “The Seven Bridges of Königsberg”, which not only contributed to the evolution of graph theory, but also laid the groundwork for the inception of SNA [
8]. The subsequent advancement of SNA gained momentum with the introduction of stochastic network theory, exemplified by the ER random graph theory and the WS small-world network model. These developments marked the emergence of the intricate field of complex network science, with profound implications across disciplines [
9,
10].
In the realm of international trade, complex network theory found fertile ground, prompting pioneering studies that harnessed its insights to model complex international trade networks. These endeavors unveiled the intriguing “core-edge” configuration inherent within such trade networks [
11]. Building upon this foundational knowledge, the domain of energy trade research embraced complex network theory, enabling the deciphering of intricate network systems and the visual representation of energy trade pathways [
12,
13,
14].
As this body of research continues its progressive trajectory, the versatile framework of SNA finds resonance in the analysis of the solar PV trade network. This involves delving into the network’s structural characteristics, discerning pivotal nodes, and unraveling clustering patterns. Here, countries assume the role of nodes, trade flows manifest as edges, and trade volume imparts significance to edge weight [
12,
15]. The application of SNA assumes a pivotal role, offering nuanced insights into the intricate dynamics and interdependencies woven into the fabric of the solar PV trade network. By fostering a holistic comprehension of the underlying complexities, SNA emerges as an invaluable tool in advancing our understanding of this intricate network.
The intricate dynamics governing the establishment of trade networks within the BRI context can be effectively examined through the utilization of the Quadratic Assignment Procedure (QAP) model, a robust analytical tool renowned for its adeptness in unraveling network mechanisms [
14,
16]. Situated within this meticulously structured research framework, the “Five Connectivity” paradigm, conceived by the Chinese government to underpin the BRI, emerges as the fundamental determinants shaping the trajectory of trade networks [
17].
The “Five Connectivity” encompasses: (1) Policy connectivity: streamlining policy coordination and harmonization among participating nations. (2) Infrastructure connectivity: pioneering the development and enhancement of physical infrastructure, encompassing vital elements such as roads, railways, ports, and airports. (3) Trade connectivity: nurturing the flow of trade, advocating for trade and investment liberalization. (4) Financial connectivity: reinforcing financial cooperation, fostering investment endeavors, and advocating for resilient financing mechanisms. (5) People-to-people connectivity: cultivating cultural exchange, fostering tourism, and nurturing collaborative efforts in education and healthcare.
Synthesizing these dimensions alongside insightful considerations of consumption disparities, population scales, and geographical proximities among nations, this inquiry embarks on a joint exploration of the evolutionary trajectories within photovoltaic energy trading networks. The primary objective of this analysis is to shed light on the intricate interplay of factors steering the development of photovoltaic energy trade within the expansive narrative of the BRI.
A comprehensive elucidation of the rationale for selecting variables, countries, and other analytical inputs is imperative to anchor the research methodology. The chosen variables, which encompass key metrics related to solar PV products trade, were meticulously handpicked to provide a holistic understanding of trade dynamics. These variables are anticipated to shed light on critical aspects such as trade volume, trade balance, and trade density, offering multifaceted insights into the evolving trade patterns and relationships within the BRI network. The selection of countries within the BRI framework was informed by a strategic consideration of their geographical locations, economic significance, and relevance to the solar PV products trade. By including a diverse range of countries, spanning varying economic stages and levels of development, the analysis aims to capture the nuanced interplay of trade dynamics across a spectrum of socio-economic contexts. This multifarious selection seeks to unravel both common trends and distinctive patterns that emerge within the BRI network. The decision to employ SNA as a methodology stems from its robust ability to capture the intricate connections and interactions between countries, mirroring the complex trade relationships within the BRI. SNA’s framework allows for the identification of influential nodes, revealing countries with substantial trade centrality. Additionally, its capability to decipher clustering patterns provides insights into trade communities and the degree of cohesion within the solar PV products trade network. The utilization of the “Five Connectivity” paradigm as a foundational lens for analysis adds a layer of depth and contextual understanding to the study. These connectivity dimensions—policy, infrastructure, trade, financial, and people-to-people—essentially serve as the guiding principles shaping trade interactions within the BRI. Integrating this paradigm provides a structured framework to assess how these connectivity dimensions influence solar PV products trade, facilitating a comprehensive exploration of the interconnected factors that drive trade patterns.
The solar PV products trade data sourced from UN Comtrade present a valuable and expansive timeframe, spanning from 2001 to 2022, which serves as a robust foundation for comprehensively analyzing trade dynamics among the 65 countries aligned with the BRI [
18]. This dataset encapsulates a pivotal duration marked by significant milestones, enabling a thorough exploration of the intricate solar PV products trade network. Encompassing the pre-2008 economic crisis era, where the solar energy sector and its trade were nascent, to the post-crisis phase marked by governments’ endeavors to invigorate economies via the solar PV products industry. Moreover, it encapsulates the periods prior to and following the BRI’s inception, alongside the seismic impact of the COVID-19 pandemic that profoundly disrupted global trade. This expansive temporal span offers a holistic vantage point to observe alterations within the solar PV products trade network before and after these pivotal historical junctures.
Through a meticulous analysis of this dataset, researchers glean valuable insights into the nuanced dynamics, shifts, and influences steering the trajectory of the solar PV products trade network over time. This not only contributes to a deeper understanding of the intricate interplay of historical events within the BRI, but also unveils the subtle undercurrents impacting trade patterns. In essence, this data-driven inquiry illuminates the intricate ways in which historical milestones resonated across the solar PV products trade landscape within the expansive narrative of the Belt and Road Initiative.
The utilization of social network analysis offers a valuable avenue for exploring the intricate dynamics and patterns that characterize the trade of solar PV products among the participating countries within the BRI network. This methodological approach not only aids in pinpointing key nations functioning as pivotal nodes within the trade network, but also facilitates an in-depth assessment of the overarching structure and the clustering of social communities present within the solar PV products trade network across BRI nations. Furthermore, the application of social network analysis serves as a conduit for evaluating the tangible impact exerted by the “Five Connectivity” paradigm on the domain of solar PV products trade within the realm of the BRI.
Through the strategic utilization of this analytical framework, researchers can unlock profound insights into the intricate web of interconnectedness, relationships, and the subtle interplay of multifarious factors influencing the trade of solar PV products. This endeavor contributes substantially to the holistic understanding of the multifaceted trade dynamics residing within the expansive narrative of the Belt and Road Initiative. By navigating through this methodological prism, an intricate exploration emerges, encompassing the intertwined threads of nations, trade patterns, and the ripple effects induced by the “Five Connectivity”. Ultimately, this meticulous approach enriches the comprehension of the intricate trade dynamics inherent to the expansive and multifarious BRI network.
Previous research primarily focused on traditional fossil energy sources such as petroleum and gas, examining energy security and patterns of international energy trade [
16,
19]. The influencing factors in these studies are typically analyzed using methods such as the difference-in-difference model and trade gravity model, which consider various economic and social elements but often overlook the “Five Connectivity” [
20,
21]. Thus, this paper contributes to the existing literature in the following ways: (1) It establishes a solar PV trade network and provides insights into the evolution and characteristics of the trade networks over an extended time frame. (2) It explores the factors influencing the evolution of the photovoltaic energy trade network, considering the construction of the “Five Connectivity” and other socio-economic factors. (3) Based on the evolution of national nodes within the photovoltaic energy trading network of countries along the Belt and Road, it proposes a new international energy governance order that prioritizes green energy. Throughout history, the geographical dependence on traditional energy sources and the economic reliance on fossil fuels shaped the geopolitical and economic attributes of traditional energy [
21]. The current global energy governance order primarily revolves around the fossil energy system, marginalizing emerging countries in decision-making processes. As the new energy trade pattern evolves, it becomes imperative to timely adjust the energy political landscape and reshape the international energy governance order.
This research seeks to enhance our comprehension of the dynamics of solar PV products trade, investigate the factors that shape this trade, and propose a comprehensive and sustainable international energy governance framework that aligns with the evolving trade patterns and the increasing significance of renewable energy sources. The study consists of several sections.
Section 2 provides a detailed overview of the materials and methods employed in the research. In
Section 3, the network structure analysis is conducted to gain insights into the underlying structure of the solar PV products trade network.
Section 4 focuses on the block model analysis, examining trade patterns and clusters within the network. In
Section 5, the factors influencing solar PV trade in BRI countries are explored and analyzed. Finally,
Section 6 concludes the research with a discussion of the findings and their implications. Through this comprehensive examination and analysis, the research aims to contribute to our understanding of solar PV products trade dynamics and the factors shaping it within the Belt and Road Initiative context. Furthermore, it seeks to provide valuable insights for the development of a more inclusive and sustainable international energy governance order, considering the evolving trade patterns and the growing importance of renewable energy sources in the global energy landscape.
2. Materials and Methods
The presented study employs a coherent set of methodologies that intertwine to provide a comprehensive exploration of solar PV products trade within the BRI context. The foundation for analysis is built upon SNA, a multidisciplinary approach that effectively integrates elements of social psychology, sociology, statistics, and graph theory. SNA’s origins trace back to Euler’s innovative work on the “Seven Bridges Problem”, which spurred the evolution of graph theory and laid the groundwork for SNA. The subsequent integration of stochastic network theory, exemplified by the ER random graph theory and WS small-world network model, established the complex network science field. These theoretical underpinnings form the basis for examining intricate trade relationships.
The application of SNA within international trade scenarios evolved from the exploration of complex international trade networks. Notably, this application revealed the distinctive “core-edge” configuration within these networks. Drawing upon this knowledge, the study embraces complex network theory within energy trade research, facilitating the understanding of complex network systems and visual representations of energy trade pathways. The application of SNA to the solar PV trade network underscores its adaptability across different trade contexts.
Intersecting with the SNA approach is the QAP model. Positioned as a robust analytical tool, the QAP model specializes in unraveling network mechanisms. Within the research framework, this model is utilized to delve into the formation mechanisms of trade networks within the BRI. This approach is anchored in the meticulous exploration of the “Five Connectivity” paradigm, a conceptual framework introduced by the Chinese government to underpin the BRI. This model not only sheds light on the establishment of trade networks, but also facilitates the assessment of how policy coordination, infrastructure development, trade facilitation, financial cooperation, and people-to-people connectivity collectively shape trade dynamics. Adding depth to the analysis is the integration of comprehensive solar PV trade data from UN Comtrade, spanning from 2001 to 2022. This dataset spans pivotal periods including pre- and post-economic crisis phases, BRI inception, and the COVID-19 pandemic’s disruptive impact. By delving into this expansive temporal span, researchers can discern patterns, shifts, and the influence of historical milestones on trade dynamics.
Collectively, the interplay between SNA, the QAP model, the “Five Connectivity” paradigm, and comprehensive trade data constructs a robust analytical framework. This framework unravels the intricate tapestry of solar PV products trade within the multifaceted narrative of the BRI. It systematically examines network structures, assesses influential factors, and provides insights into the dynamics of trade relationships. This approach not only enriches the academic discourse but also contributes substantively to the understanding of trade dynamics in the evolving BRI landscape.
Drawing on complex system theory and small-world network theory, we can establish a theoretical research framework to examine solar PV products trading networks. Within this framework, solar PV trade is viewed as a complex system, acknowledging the interdependence and interconnectedness of all nodes in the network, which may exhibit small-world network characteristics. By incorporating relevant knowledge from SNA, a social network diagram can be constructed to represent the solar PV products trade network
, comprising nodes
, and edge set
[
6,
22]. In this context, nodes represent social actors, organizations, or sectors, while the number of points indicates the graph’s order, and the number of edges measures the graph’s scale and, consequently, the sectoral relationships impacted by policy introductions.
The solar PV products trading network can be systematically analyzed from the following perspectives: (1) Network structure analysis: examining the overall structure of the solar PV products trade network and identifying key patterns and connections. (2) Influencing factors of the “Five Connectivity”: investigating how the “Five Connectivity” affects the evolution and dynamics of the trade network. (3) Variable and data sources: considering the variables and data used in analyzing the network and exploring their sources and reliability.
2.1. Network Structure Analysis
Trade networks were studied across various disciplines, including social and complex network analysis, to understand the evolution of world trade [
23,
24,
25]. The Belt and Road Initiative (BRI) led to increased interest in analyzing trade networks among the 65 BRI countries. Scholars employed methods such as social network analysis, fuzzy analytical network, and cohesive sub-groups to uncover the characteristics of the BRI trade networks [
26]. Additionally, complex network analysis methods were utilized by other researchers [
27,
28,
29].
In this context, the structure of the solar PV products trade network is explored using the small-world network theory. Key parameters, such as nodal degree and distance, are examined to determine if the network exhibits small-world characteristics. By doing so, the network’s topology and evolution patterns are further elucidated.
- (1)
Density and Reciprocity:
The interrelationships between policy subjects in the network can be determined based on nodality, which refers to the number of edges originating from each node. By combining nodes and edges, the policy network’s structure and connectivity can be analyzed. To assess the network’s denseness, we calculate the average nodality by averaging the number of edges across all nodes and measure the average distance between nodes. The density of the network is determined by dividing the sum of existing edges by the theoretically maximum possible number of edges between nodes [
30].
In the context of the solar PV energy trade-directed relationship network, with n country nodes, the actual number of relationships is represented by m, while the maximum theoretical number of relationships is n(n−1). Thus, the network density is calculated as follows:
Solar network density
The network density is a measure that falls within the range of 0 to 1. A value closer to 0 indicates a loosely connected network, whereas a value closer to 1 suggests a tightly connected network. Generally, the closer the relationships between members in the network, the higher the level of information flow, resource support, and cooperation. This leads to stronger capabilities in terms of absorption, transmission, and processing functions for the actors within the network.
Network reciprocity is a metric used to assess the interdependence among trade members within a network. It quantifies the extent of bidirectional relationships compared to the total relationships in the directed network. To calculate the reciprocity of solar PV trade, we consider the number of pairs of trading partners with two-way relationships (t) and the total trade connections in the undirected trade network (s). The reciprocity of solar PV trade is then expressed as:
Solar network reciprocity = s/t.
In analyzing the importance of nodes as policy subjects within the solar PV products trade network, various methods based on node centrality are employed.
- (2)
Weight Degree:
In a weighted solar PV energy trade network, the weighted degree of a node country is determined by summing up the edge weights of that node along with its directly connected nodes. This measurement effectively and comprehensively assesses the diversity of trading partners and the scale of trade volume for a specific country. The weighted degree for country i () can be further divided into two components: the weight in degree () and the weight out degree () for country i.
The use of weighted degree to measure centrality provided a comprehensive explanation of the real-world solar PV product trade situation. The conclusions of betweenness centrality and closeness centrality are similar to those presented earlier. The exclusion of betweenness and closeness centralities from the analysis could be attributed to a variety of methodological or contextual reasons. The study was designed with a specific focus on certain aspects of the solar PV products trade network, and computational complexity associated with these measures, especially in large networks, led to their omission in favor of simpler metrics.
The weight in degree of a country (node) is calculated by summing up the edge weights of all incoming connections from other countries to that specific node. On the other hand, the weight out degree of a country is determined by summing up the edge weights of all outgoing connections from that node to other countries. Their formulas are:
2.2. Block Model Cluster Analysis
Block model analysis, initially proposed by White et al. [
31], is a method that divides nodes within a network into distinct “blocks” based on pre-established criteria. The analysis then examines the characteristics and relationships present in each block. In this study, we adopt the division method outlined by Wasserman et al. [
32] and Chong et al. [
33]. This approach (see
Table 1) categorizes the n countries in the network into four blocks, with each block containing
countries. The division process considers various factors. Firstly, it examines the expected proportion of each block’s internal trade volume to its total trade volume in the network, denoted as
. Additionally,
and
represent the internal trade volume and total trade volume of block k, which evaluates the actual proportion of internal trade volume,
, within each block. A higher-than-expected internal trade proportion indicates closer trade relations among the countries within the block.
Moreover, the analysis looks at the ratio of a block’s exports to other blocks () to its imports from other blocks (). A ratio greater than 1 implies that countries in the block are exporting more to other blocks. Blocks satisfying both criteria, and , are labeled as two-way trade blocks, indicating strong trade links both internally and externally. On the other hand, blocks with and resemble isolated and peripheral structures in the social network, with relatively weak trade connections both internally and externally.
2.3. The Analysis of the Influencing Factors of “Five Connectivity”
The trade dynamics between two countries are not solely influenced by their direct trade relationship, but are also affected by the broader “third-party effect” within the trade network [
34]. Solar photovoltaic (solar PV) products trade can be influenced by various factors, including trade barriers, transportation, environment, finance, and cultural aspects [
35,
36]. The Chinese government’s introduction of the “Five Connectivity” for the BRI, comprising policy coordination, facilities connectivity, unimpeded trade, financial integration, and people-to-people bonds, significantly impacts international solar PV trade. Hence, this study aims to establish a comprehensive research framework to analyze the specific impacts of the “Five Connectivity” on solar PV trade.
The aspect of policy coordination plays a crucial role in the cooperation between China and the countries participating in the BRI regarding solar photovoltaic (solar PV) products trade. Due to differences in histories, cultures, economic states, and development needs, Chinese solar PV manufacturers navigated trade barriers, and policy coordination is fundamental for fostering cooperation within the BRI framework [
37]. Aligning trade objectives and fostering bilateral cooperation were instrumental in shaping the trade evolution [
38]. However, the investigations conducted by the US and European Union governments, imposing countervailing duties (CVD) and anti-dumping (AD) measures on Chinese solar PV products, negatively impacted Sino–US solar PV products trade [
39]. Although tariff barriers may not have a profound structural impact on solar PV products trade, such punitive trade policies altered the global supply chain and reshaped the trade pattern of Chinese solar PV exports [
40].
Regarding facilities connectivity, the BRI, proposed in 2013, aims to establish a cooperative platform that utilizes existing bilateral and multilateral mechanisms between China and countries along the route. Energy infrastructure cooperation became a pivotal aspect within BRI. As a comprehensive initiative, BRI encompasses policy dialogue, unimpeded trade, financial support, and people-to-people exchange [
41]. Significant investments in energy infrastructure by China positively impacted the socioeconomic development of BRI countries, most of which are developing nations [
42]. These investments create favorable conditions for the energy transition and low-carbon development in host countries [
43]. As facilities become increasingly interconnected and efficient, trade, cooperation, and exchanges between countries will become more seamless and accessible. For example, the development of transportation infrastructure, such as high-speed rail, aviation, and logistics, will reduce time and space distances between countries and foster the growth of solar PV products trade networks. Furthermore, improvements in shipping, ports, and highways will create new opportunities for the production, transportation, and sales of solar PV products.
Regarding unimpeded trade, it holds great significance within the BRI. Leaders at the Belt and Road Forum for International Cooperation are committed to fostering an open economy and ensuring free and inclusive trade. The BRI serves as a platform for numerous countries to explore and promote universal, rule-based, open, non-discriminatory, and equitable multilateral trade [
44]. Trade facilitation, including domestic transportation, is a vital focus of the World Bank’s trade-related efforts [
45]. Innovations in electronic customs are considered essential improvements in government infrastructure to streamline trade [
46]. Research by Zhang indicates a positive correlation between trade facilitation and bilateral trade [
47]. Unimpeded trade creates a fundamental environment that can influence the evolution of the solar PV products trade network.
Regarding financial integration, China showed proactive investments in cleaner energy overseas since the inception of the BRI [
42]. BRI countries became financially interconnected through foreign capital flows, with the real exchange rate playing a significant and positive role in economic growth. Implementing a competitive exchange rate policy can help address capital shortages [
48]. The establishment of new multilateral financial institutions, the development of trade and investment rules, adoption of production and technical standards, and transformation of regional transportation and logistics systems are some of the outcomes of China’s foreign economic activities that can potentially reshape the regional economic landscape [
49]. The promotion of financial integration will likely impact the node degree, community organization structure, and overall configuration of the solar PV products trade network.
Regarding people-to-people bonds, international trade’s significance is influenced by cultural and institutional distance. The BRI garnered global attention, and China’s trade with BRI countries faces challenges due to these differences. Cultural distance has a stronger impact on China’s bilateral trade with B&R countries compared to institutional distance. However, the announcement of BRI reduced the effect of cultural distance on trade [
50]. Policymakers should consider social–cultural factors to enhance trade opportunities for BRI countries [
51]. With increased people-to-people exchanges and friendly relations, cooperation between countries will deepen and expand. Civil society organizations and social media exchanges can foster understanding and trust among people, promoting the development and cooperation of solar PV products trade networks. Additionally, people-to-people connections can enhance photovoltaic companies’ brand image and reputation, bolstering the competitiveness of their products in the international market.
In conclusion, the establishment and promotion of the “Five Connectivity” play a crucial role in the BRI and have a direct impact on the dynamic changes in the solar PV products trade network. Drawing on complex system theory and small-world network theory, we formulated a theoretical research framework for analyzing solar PV products trade networks. This framework serves as a valuable reference for understanding the development, evolution, and stability of the solar PV products trade network and provides essential support for the green Belt and Road construction. Based on our theoretical analysis of the solar PV products trading network, we put forward hypotheses, as outlined in
Table 2. The study proposes six hypotheses, grounded in economic theory, to understand the factors influencing the development of solar PV products trade within the BRI countries. By investigating these hypotheses, the research aims to provide valuable insights into the dynamics of solar PV products trade within the BRI and contribute to the understanding of the evolving trade patterns and renewable energy’s growing importance in the global market.
2.4. Variable and Data Sources
The dependent variable in this study is the solar PV products trade volume, obtained from the United Nations Commodity Trade Statistics Database (UN Comtrade). The dataset covers 16 solar PV products traded between 65 countries along the Belt and Road Initiative (BRI) from 2001 to 2022. These products are identified using 6-digit HS codes, as shown in
Table 3 [
18]. The 6-digit HS codes and their corresponding product descriptions are essential for international trade and customs purposes. They provide a standardized classification system for categorizing various solar PV products, including items such as glass mirrors, precious metal articles, radiators, frames, engines, water heaters, heat exchange units, machines, and optical elements. The Harmonized System (HS) is an international classification system used to ensure consistency in product categorization for trade across countries. Each HS code represents a specific product category, simplifying the tracking of imports and exports, and facilitating the application of relevant tariffs and regulations.
Regarding the independent variables, this study focuses on the “Five Connectivity” as the core explanatory variable for the evolution of the solar PV products trading network. The aim is to assess how the development of the “Five Connectivity” impacts the solar PV products trade pattern. To measure the progress of the “Five Connectivity” construction, Peking University developed the Belt and Road Five Connectivity Index, which consists of 5 first-level indicators, 13 second-level indicators, and 32 third-level indicators [
52]. However, due to the large number of data indicators involved, it is challenging to find data that covers all countries along the BRI since 2001. Despite efforts by various researchers to address this issue, the problem of missing a substantial amount of data still persists [
53,
54]. In this paper, we approach the measurement of the “Five Connectivity” construction progress from different perspectives.
Policy coordination (P): To assess policy interoperability between countries in China’s BRI, we utilize bilateral documents available online. We create a matrix based on the agreements signed between countries. If an agreement is signed in the current year, it is represented as 1; otherwise, it is marked as 0. If the agreement remains valid, subsequent relationships are unchanged. However, if the agreement expires or a country withdraws, the corresponding entry is set to 0. We source the agreement data from the bilateral documents section of the China Belt and Road Network (
https://www.yidaiyilu.gov.cn/list/c/10008, accessed on 1 August 2023).
Unimpeded trade (T): To examine the impact of trade connectivity, we utilize the difference matrix derived from total trade between countries. The data are sourced from the United Nations Commodity Trade Statistics Database (UN Comtrade), encompassing import and export data of commodity trade among 65 countries in China, five Central Asian countries, and 20 countries in West Asia from 2001 to 2022. These datasets are combined to form the total trade matrix.
Facilities connectivity (D): To assess the role of facility connectivity, we employ a weighted distance matrix based on trade quotas between capitals. This matrix helps us understand how distances between countries’ capitals impact their trade relationships. The data are obtained from CEPII’s GeoDist datasets.
People-to-people bonds (C): To explore the impact of people-to-people bonding, we construct a matrix of cultural differences, considering whether countries share the same language. This matrix allows us to analyze how cultural similarities or differences influence trade interactions. The data are sourced from CEPII’s GeoDist datasets. The study’s focus on language as the exclusive criterion for assessing cultural integration and people-to-people bonds appears to be a methodological limitation. Language is but one aspect of cultural integration, and its singular use could yield an overly narrow understanding of people-to-people bonds, especially within the diverse linguistic landscape of the BRI. Few countries within the BRI share a common language such as Mandarin, making language an insufficient metric for capturing the complexity of cultural bonds. Cultural integration is a multi-faceted phenomenon influenced by various factors, including shared history, cultural exchanges, and economic interdependencies.
Financial integration (F): To evaluate the role of financing, we utilize a matrix of differences in foreign direct investment (FDI) between countries. This matrix provides insights into the level of financial integration and its influence on trade patterns. The data are obtained from the World Bank.
Regarding the control variables, we consider the following indicators:
Per capita GDP (pgdp): This indicator measures the level of per capita income among countries, reflecting their economic development. We obtained the per capita GDP data for different countries from 2001 to 2022 from the World Bank.
Population size (pop): Population size affects both production capacity and effective demand. It can influence commodity production costs and consumption patterns. We used population data for different countries from 2001 to 2022, sourced from the World Bank.
Photovoltaic products consumption (consum): Photovoltaic products consumption represents an upgraded form of energy consumption compared to traditional fossil fuels. It relies on a country’s consumption level. To express consumption differences between countries, we used per capita consumption data for photovoltaic products from 2001 to 2022, obtained from the World Bank.
Contiguous countries (contig): This binary variable indicates whether countries share a border or not. Data regarding contiguous countries were sourced from CEPII’s GeoDist datasets.
This paper focuses on analyzing the Belt and Road Initiative, as defined by academics and the Ministry of Commerce of China. Our research includes 65 countries along the Belt and Road, comprising China, Mongolia, Russia, Kazakhstan, Kyrgyzstan, Tajikistan, Uzbekistan, Turkmenistan, Vietnam, Laos, Cambodia, Thailand, Malaysia, Singapore, Indonesia, Brunei, Philippines, Myanmar, Timor-Leste, India, Pakistan, Bangladesh, Afghanistan, Nepal, Bhutan, Sri Lanka, Maldives, Poland, Czech Republic, Slovakia, Hungary, Slovenia, Croatia, Romania, Bulgaria, Serbia, Montenegro, Macedonia, Bosnia and Herzegovina, Albania, Estonia, Lithuania, Latvia, Ukraine, Belarus, Moldova, Turkey, Iran, Syria, Iraq, United Arab Emirates, Saudi Arabia, Qatar, Bahrain, Kuwait, Lebanon, Oman, Yemen, Jordan, Israel, Palestine, Armenia, Georgia, Azerbaijan, and Egypt.
It is worth noting that the Belt and Road Initiative saw increasing participation from more countries in recent years, leading to some changes in its regional concept. However, to maintain academic consistency, we chose to focus on these 65 countries for our research purposes, following the established practice in academic studies [
26,
44].
3. Network Structure Analysis
This section is divided into three subheadings: Network Evolution, Network Density and Reciprocity, and Centrality Measures. It aims to provide a concise and precise description of the experimental results, their interpretation, and the conclusions drawn from the experiments.
3.1. Network Evolution
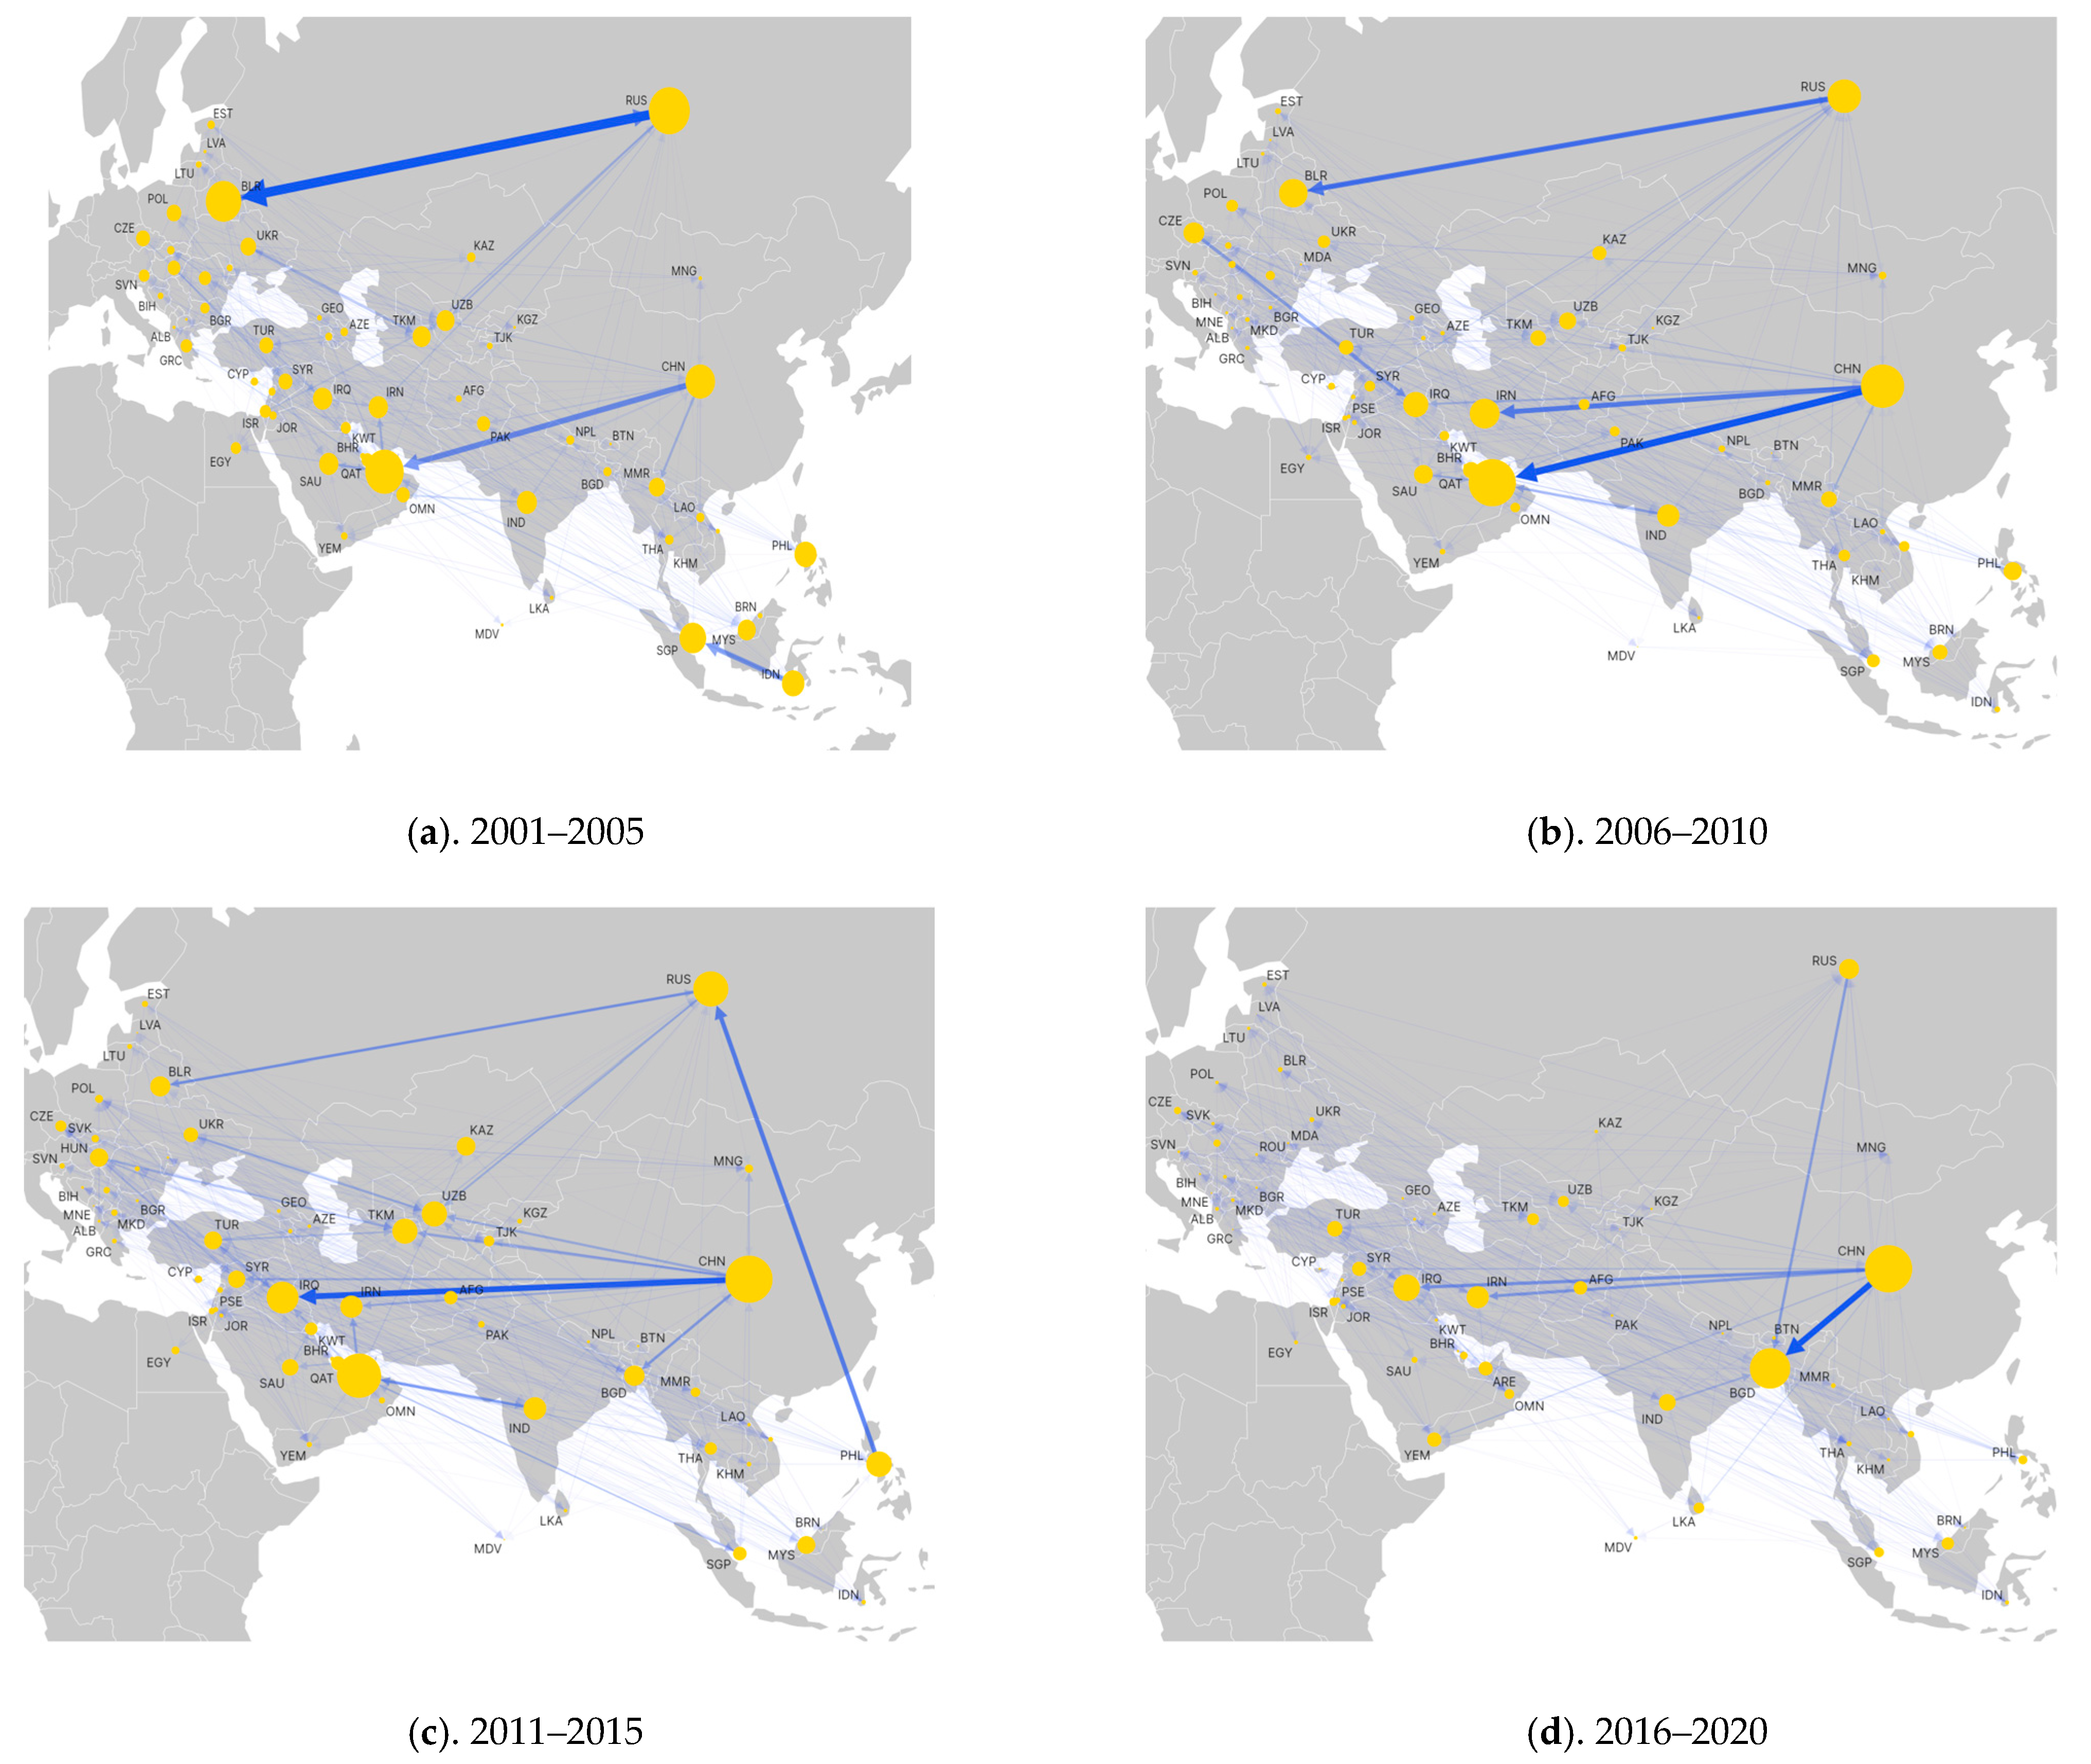
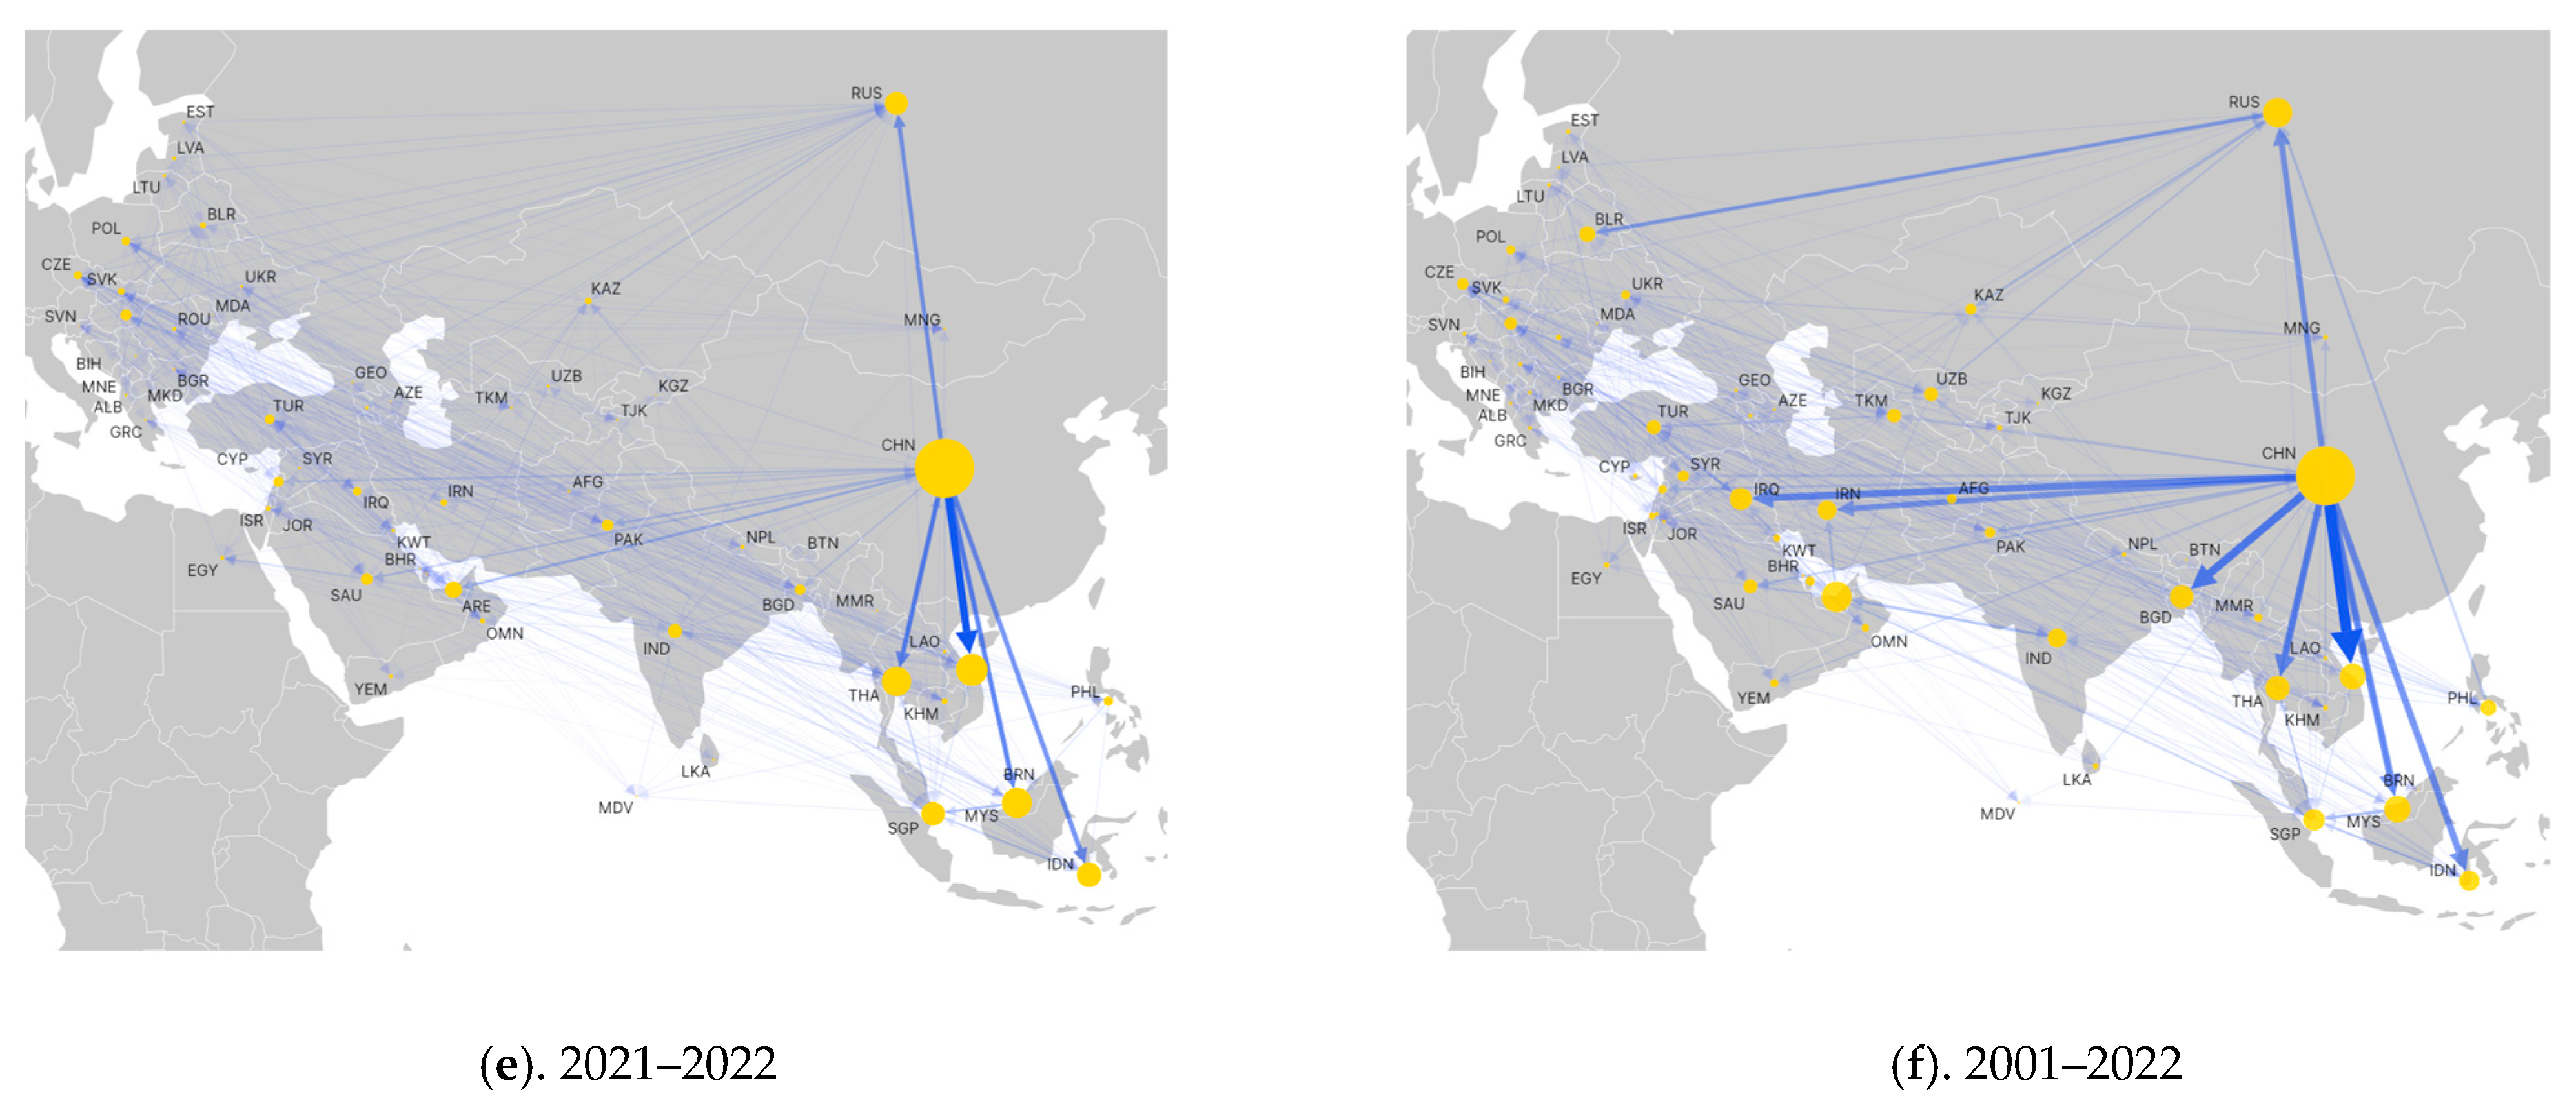
To analyze the trade data of solar photovoltaic products, we utilized Gephi to create directed weighted node network diagrams for different time intervals: 2001–2005 (see
Figure 1a), 2006–2010 (see
Figure 1b), 2011–2015 (see
Figure 1c), 2016–2020 (see
Figure 1d), 2021–2022 (see
Figure 1e), and 2001–2022 (see
Figure 1f), between countries along the BRI. In the diagrams, each node represents a country along the BRI, and the connections between nodes, which are ISO codes of BRI countries (see
Table 4), represent the volume of photovoltaic products trade exports between these countries. Arrows are used to indicate the direction of trade flow. The utilization of trade data to imply unimpeded trade between countries is a methodological choice often based on the assumption that high trade volumes signify fewer trade barriers. However, this is not always a direct indicator, as high trade volumes could also result from trade agreements, subsidies, or a lack of alternative trading partners. In the study’s context, consistent and significant flow of solar PV products among BRI countries might suggest minimal trade barriers. However, this is an indirect measure and should be interpreted cautiously. For a more comprehensive understanding of trade barriers, a nuanced analysis incorporating tariff and non-tariff barriers, trade policies, and qualitative data such as trader interviews would be necessary. Therefore, while trade data can offer initial insights, they should ideally be supplemented by additional types of data and analyses for a more robust understanding of trade barriers.
The analysis of
Figure 1a–f offers a comprehensive insight into the evolutionary trajectory of the solar photovoltaic (PV) products trade network among countries within the Belt and Road Initiative (BRI) from 2001 to 2022. This temporal examination reveals substantial shifts in trade dynamics and network density, reflecting the evolving nature of trade interactions and collaboration.
In the earlier phase, spanning 2001 to 2010, the trade exchanges within the solar PV products network were relatively constrained, corresponding to a low network density. This suggests a period characterized by limited trade interactions and less pronounced interconnections. However, from 2011 to 2020, a notable turning point occurred as the network experienced a peak in density. This surge points to an era of heightened cooperation and increased collaboration among BRI countries, reflecting a deeper level of engagement and shared economic interests.
In the subsequent period of 2021–2022, a decline in network density is evident. This decrease could potentially be attributed to a convergence of factors, including the global pandemic’s disruptive impact, intensified market competition, and reductions in subsidies. These influences collectively contributed to a slowdown in trade interactions and a decrease in overall network density.
A significant aspect of the analysis pertains to the shifting core countries within the solar PV trade network over time. Before 2005, Russia (RUS), the United Arab Emirates (ARE), and Belarus (BLR) played central roles in the trade network, potentially influenced by regional resource availability and corresponding market demand. In the subsequent period, from 2006 to 2010, China emerged as a dominant core country. This shift was accompanied by the rise of other nations such as Malaysia (MYS), Thailand (THA), and Vietnam (VNM), leading to a diversified and closely interconnected trade network.
Moreover, it is noteworthy that key nodes in the solar PV trade network predominantly emerged in regions lacking abundant fossil energy, albeit with some exceptions. Areas characterized by non-fossil energy scarcity exhibited distinct characteristics, including considerations of energy security, cost advantages for solar PV development, and smoother transitions toward green production and consumption. Notably, fossil energy-rich regions such as the United Arab Emirates (ARE) embraced solar PV energy adoption to address sustainability concerns.
In conclusion, the analysis underscores the substantial changes and advancements witnessed in the solar PV products trade network over the course of the BRI’s evolution. The network’s ability to navigate challenges, sustain cooperation, and align with sustainable development goals is pivotal for its continued growth and resilience in the face of market fluctuations. This exploration sheds light on the dynamic interplay of economic forces, global events, and policy initiatives that shape the intricate solar PV trade network within the expansive canvas of the BRI.
3.2. Network Density and Reciprocity
The outcomes of the social network analysis (see
Table 5) offer a coherent depiction of the solar PV trade network’s dynamics from 2001 to 2022, revealing trends in both overall density and reciprocity that reflect the evolving nature of trade interactions.
Across the examined period, spanning from 2001 to 2022, the solar PV trade network consistently maintained a relatively high level of density and reciprocity. These indicators, however, exhibited fluctuations over time, encapsulating distinctive trends that shed light on the network’s behavior.
The years 2001 to 2005 were characterized by relatively low density and reciprocity metrics. This outcome is attributed to factors such as limited photovoltaic production capacity and subdued consumer demand. These circumstances resulted in decreased trade activities among countries, reflecting a less active phase within the network.
Between 2011 and 2015, a notable upsurge in density and reciprocity emerged. This phase witnessed a global surge in new energy production and consumption, driven by endeavors to stimulate economic growth and foster sustainable development. Nations heavily invested in new energy subsidies, thereby propelling trade and reciprocity in photovoltaic products to unprecedented heights.
The emergence of the COVID-19 pandemic in 2020 introduced disruptive measures that reverberated across international trade activities, including the solar PV trade. The ensuing impact on photovoltaic product trade, compounded by intense market competition within the industry and shifts in new energy subsidies, engendered fluctuations in trade exchanges and reciprocity.
Against the backdrop of these intricate trends, the imperative to closely monitor alterations within the trade network becomes apparent. Such vigilance is vital to adapting strategies that effectively address emerging challenges and underpin sustainable development in the future. This analysis underscores the necessity of staying attuned to the network’s dynamics, as well as the capacity to evolve strategies that enable continued resilience and growth in the face of an ever-changing landscape.
3.3. Centrality Measures
Drawing insights from
Table 6, a strategic approach to evaluate the centrality of countries along the Belt and Road Initiative (BRI) within the solar photovoltaic (PV) products trade network is adopted. Acknowledging the limitations of assessing centrality solely based on trading partners, a weighted degree methodology is employed. This nuanced approach integrates the trade volume, effectively capturing the trade centrality of BRI countries in the context of solar PV products.
The culmination of this analysis highlights the top 10 countries exhibiting the highest weighted degrees in solar PV products trade from 2001 to 2022. The distinguished list encompasses countries such as CHN, ARE, RUS, MYS, and VNM. Of these, China distinctly emerges as a standout player with significantly elevated trade centrality in contrast to its counterparts. Delving into specific time intervals, a comprehensive examination reveals China’s evolving trajectory in the solar PV products trade network.
In the initial period from 2001 to 2005, China’s weighted degree registers at a comparatively modest level of USD 127 billion in trade. However, the subsequent phase spanning from 2006 to 2010 witnesses an impressive surge, elevating China’s weighted degree to USD 879 million. This marked acceleration signifies the commencement of an upward trajectory characterized by prominence and influence. Evidently, China commands a trade volume that substantially outpaces that of other nations, underscoring its pivotal position as a central player within the network.
Meanwhile, Russia’s role emerges as distinct, propelled by a robust raw material processing capacity. Russian enterprises adeptly navigate the import of lithium carbonate from countries such as Argentina, Chile, Bolivia, and China, subsequently processing and producing it to cater to domestic demand and global exports. While Russia occupies a critical trading role for both imported and exported solar PV energy, a notable discrepancy becomes evident when juxtaposed with China’s trade volume.
Noteworthy are nations such as Vietnam, Malaysia, and Indonesia, among others, which prominently exhibit high weighted degrees for both import and export activities. This underscores their status as pivotal entrepot trading countries, channeling trade flows with substantial impact.
Collectively, the assimilation of weighted degree analysis augments our comprehension of the multifaceted dynamics shaping the solar PV products trade network within the Belt and Road Initiative. This approach unveils China’s ascendancy as a dominant trade force, highlights Russia’s specialized processing role, and reaffirms the strategic significance of certain countries in facilitating trade exchanges. Such insights furnish a richer understanding of the network’s intricate fabric, guiding future strategies and initiatives.
4. Block Model Analysis
4.1. Identification of Trade Blocks
Using the CONCOR function, hierarchical clustering was conducted to create a Pearson correlation square matrix based on the original data matrix. By iterating to convergence with a maximum segmentation depth of 2, a convergence criterion of 0.2, and a maximum of 25 iterations, the matrix was divided into four blocks. These blocks represent different time intervals: 2001–2005, 2006–2010, 2011–2015, 2016–2020, 2021–2022, and the entire period from 2001 to 2022.
4.2. Evolution of the Trade Network
Table 7 offers an intricate analysis of the solar photovoltaic (PV) products trade network within the Belt and Road Initiative (BRI) countries from 2001 to 2022, unveiling four distinct categories that shed light on the multifaceted trade dynamics within this expansive region. Through this comprehensive examination, the trade patterns and interactions among BRI countries come into sharper focus, with each category representing a unique facet of the evolving trade landscape.
(1) Isolated states: Across the examined period, a notable cluster of 45 isolated trading nations emerges within the BRI network. These nations predominantly engage in minimal import and export activities involving photovoltaic products. This observation suggests that a significant proportion of BRI countries are yet to fully embrace large-scale solar photovoltaic product development and consumption. This phenomenon is particularly prominent in the developing countries along the BRI route. Importantly, an intriguing trend emerges when considering isolated countries over distinct time intervals. This dynamic trend underscores the evolving nature of solar energy development, with countries progressively entering the realm of photovoltaic industry and trade through sustainable growth initiatives.
(2) Surplus countries: Over the evaluated timeframe, a distinct cohort of 15 surplus countries takes center stage. These nations are marked by economies driven by manufacturing, prominently including China, India, the Philippines, and Singapore. This category underscores the emergence of trade patterns primarily characterized by pronounced export activities. These countries leverage their manufacturing prowess, resource richness, and favorable labor dynamics to establish trade configurations that prominently feature exports. Importantly, the number of surplus countries shows variations over time, highlighting the dynamic nature of the trade landscape shaped by economic fluctuations, evolving new energy policies, and shifts in manufacturing capacities. China, as a representative example, epitomizes this category, with a trade reach spanning South Asia, West Asia, and the Commonwealth of Independent States.
(3) Deficit countries: A smaller subset of five deficit countries comes into focus, encompassing Kuwait, Bhutan, Oman, Palestine, and Qatar. These countries exhibit a preference for greater imports of photovoltaic products as a strategic means to augment their energy consumption structures. A discernible pattern emerges as these countries transition toward import-oriented strategies aimed at enhancing their energy consumption profiles. Notably, a number of deficit countries display fluctuations over time, with the disruptions introduced by the COVID-19 pandemic in 2021–2022 leading to reduced photovoltaic energy consumption, thereby reshaping the deficit landscape. These deficit countries are characterized by lower consumption capacity and a susceptibility to economic fluctuations and external shocks.
(4) Reciprocal countries: Interestingly, the analysis reveals the absence of systematic reciprocal trade modules within the solar photovoltaic products trade network among BRI countries during the period spanning 2001 to 2022. This absence of distinct reciprocal patterns arises from the varying geographical considerations, resource endowments, and strategic trade priorities of BRI nations. These countries predominantly adopt production-centric, import-oriented, or isolated trade patterns based on their specific resource allocations and unique strategic positioning. Consequently, a discernible absence of robust mutual trade relationships is evident.
In conclusion, this comprehensive analysis underscores the inherently diverse nature of solar PV products trade within BRI countries. While certain nations, such as China, emerge as dominant exporters, the overall consumption capacity remains moderate, and a significant portion of countries is in the developmental stages of both the solar PV industry and trade practices. The positions of some countries may shift over distinct intervals, yet the fundamental structure of the solar PV products trade network maintains a degree of relative stability. This dynamic trade landscape emphasizes the necessity for strategic coordination, sustained trade cooperation, and robust efforts toward sustainable development to cultivate mutually beneficial relationships and foster a resilient trade ecosystem within the expansive narrative of the Belt and Road Initiative.
5. Factors Influencing solar PV Trade in BRI Countries
To examine the impact of the trade network, the QAP regression analysis method can be employed [
55,
56]. QAP is a nonparametric approach used for estimating relationships between two or more matrices. It effectively addresses the issue of “multicollinearity” by not requiring independence between variables, making it more robust than parametric testing.
QAP regression involves analyzing the displacement of matrix data and testing the regression relationship between a single matrix and multiple matrices. The coefficient of determination is obtained, and significance tests are performed. The specific steps include: (1) Conventional multiple regression analysis of the long vector elements corresponding to the independent variable matrix and the dependent variable matrix. (2) Simultaneously, randomly replace the rows and columns of the dependent variable, recalculate the regression, save the coefficient estimate and , repeat the process multiple times, and obtain the standard error for each statistic.
5.1. Model Settings
In this study, a model is developed for solar PV products trade among countries along the BRI using a what-if analysis. The model is structured as follows:
Here is the breakdown of the variables: (1) ST represents the relationship matrix for solar PV products trade between BRI countries. (2) P is the matrix indicating the relations between countries to issue joint communiqués and achieve political interconnection. (3) T is a matrix representing the relationship between countries for all categories of trade. (4) D is the weighted distance matrix, using the distance between capitals weighted by trade quota to evaluate facility interoperability. (5) C is a matrix that indicates that people are connected and that language is a tool for residents to communicate, and thus, whether or not they speak the same language is used. (6) F is the matrix of foreign direct investment (FDI) differences between countries, used to examine financial integration. (7) In addition, the control variables pgdp (gdp per capita), pop (population size), consumption (level of consumption), and contig (proximity of countries to each other) were chosen to measure influences other than the “Five Connectivity”. Data for each indicator are sourced from the World Bank, the CEPII website, and the Global Carbon Project. To eliminate the impact of different dimensions, each difference matrix is normalized within a specific range.
5.2. QAP Correlation Analysis
The application of the UCINET software played a pivotal role in conducting a comprehensive analysis, involving the utilization of 5000 random permutations to facilitate an in-depth exploration. The outcomes of this analysis, as presented in
Table 8, offer a nuanced insight into the intricate interplay between the solar PV products trade network and various key variables. This analytical approach involved computing actual correlation coefficients by systematically comparing the solar PV products trade network matrix with matrices representing other pertinent variables. Such a meticulous evaluation enables the exploration of intricate relationships and their subsequent influence on the solar PV trade network dynamics.
The analysis of the solar PV products trade network within the context of the Belt and Road Initiative (BRI) elucidates the profound impact of diverse factors on the trade interactions among the countries encompassing this expansive route. Specifically, variables such as the “Five Connectivity” construction matrix, population size, consumption levels, spatial proximity, and various socio-economic factors are identified as crucial determinants that significantly shape the evolving patterns of solar PV products trade over the examined time frame.
Upon dissecting the findings spanning the years 2001 to 2022, distinctive patterns of correlation emerge, unveiling the intricate relationships between different variables and their effects on the solar PV trade network: (1) Policy connectivity (matrix P): This variable, representing policy communication, exhibits a positive correlation (0.294) with the solar PV trade network. This underscores the pivotal role of policy coordination and alignment in fostering trade development among BRI countries. (2) Trade connectivity (matrix T): A strong positive correlation (0.528) is evident between trade connectivity and the formation and expansion of the solar PV products trade network. This highlights the crucial role of nurturing trade flows and advocating for trade liberalization in driving trade growth.
(3) Infrastructure connectivity (matrix D): Facility interconnection, represented by this variable, displays a positive correlation (0.47) albeit with a moderate impact. This suggests that the development of physical infrastructure contributed to enhanced trade exchanges between countries, thereby mitigating the influence of geographical distance on trade expansion. (4) People-to-people connectivity (matrix C): people-to-people connections exhibit a lower correlation (0.055), underscoring the significant influence of language and cultural differences on solar PV trade patterns. (5) Financial connectivity (matrix F): in contrast, the financing matrix reveals a negative correlation (−0.289), indicating that financing interactions between frontier countries exert a limited impact on solar PV products trade dynamics.
In terms of the correlation between different time periods, the correlation between the policy matrix P, the trade matrix T and the solar products trade matrix continues to be significantly positive; the correlation between the financial interoperability difference matrix and the solar products trade matrix continues to be significantly negative; and the correlation between the facilities interoperability matrix D and the people-to-people communication matrix C continues to be weakened. Moreover, per capita GDP level differences had a significant impact in the early period (2001–2005), while population size differences show a positive relationship with solar PV trade. Additionally, per capita consumption level and geographic adjacency are also vital factors influencing solar PV products trade.
In summation, the integration of the UCINET software and rigorous analysis of these correlations elucidates the intricate web of relationships and causalities that underpin the solar PV products trade network within the Belt and Road Initiative. These findings underscore the significance of policy alignment, trade connectivity, infrastructural development, cultural considerations, and financial interactions as critical factors that collectively shape the evolving trade landscape. This analytical insight is instrumental in fostering a more comprehensive understanding of the mechanisms steering the solar PV trade network’s evolution and offers valuable guidance for fostering strategic development and cooperation among BRI countries.
5.3. QAP Regression Analysis
The present study employs a comprehensive framework, utilizing the solar PV products trade network as the primary explanatory variable, while considering the “Five Connectivity” dimensions within the Belt and Road Initiative (policy communication, trade connectivity, facility interconnection, financing, and people-to-people connectivity) as explanatory variables. In addition, control variables, including per capita GDP difference levels, per capita consumption difference levels, and geographical adjacency between countries, are introduced. To scrutinize the intricate interplay between these variables and the solar PV products trade network, an exhaustive analysis involving 5000 random transformations is conducted. The culmination of this analysis is encapsulated in the regression results, presented in
Table 9.
The meticulous exploration of the “Five Connectivity” dimensions within the BRI unravels pivotal insights as follows:
- (1)
Policy communication network: The analysis underscores that policy communication exhibited a positive influence on solar PV products trade, particularly from 2016 to 2020. Notably, the influence slightly weakened in 2021–2022, coinciding with the pandemic-induced disruptions to trade. Overall, these findings substantiate the beneficial impact of policy communication on solar PV trade, corroborating the assumptions posited by Hypothesis 2.
- (2)
Trade connectivity network: The trade connectivity network emerges as a significant promoter of solar PV products trade, exerting a consistent influence across the entire period spanning 2001 to 2022. The well-established trade network provides a mature trading framework for solar PV products, aligning with the expectations laid out by Hypothesis 3.
- (3)
Facility interconnection: The study unveils a noteworthy revelation that the disparity in distance networks between countries significantly and positively impacts solar PV products trade. Initiatives such as the Belt and Road Initiative and projects such as the “China-Europe train” played a pivotal role in reducing geographical distances, thereby fostering enhanced interconnection and convenience in trade. This resonates with the tenets of Hypothesis 4.
- (4)
Financing matrix: The analysis underscores that, contrary to expectations, financial integration did not significantly promote solar PV products trade before 2000 and remained negative and insignificant in 2021–2022. Limited financial connectivity and a reliance on US dollars for trade settlement were identified as impediments hindering the development of solar PV products trade. Thus, the findings challenge the postulations of Hypothesis 5.
- (5)
People-to-people network: The people-to-people connection network emerges as a significant influencer of solar PV products trade from 2001 to 2022. However, the significance diminishes between 2001 and 2020 and becomes non-significant between 2021 and 2022. This change aligns with technological advancements and the Belt and Road Initiative’s construction, which contributed to the reduction in language barriers, thereby facilitating communication and trade. This aligns with the expectations set by Hypothesis 6.
In essence, the study’s rigorous analysis provides a comprehensive understanding of the intricate relationships between the “Five Connectivity” dimensions, control variables, and the solar PV products trade network within the dynamic context of the Belt and Road Initiative. These findings illuminate the multifaceted interplay of factors that shape the trade landscape and provide valuable insights for policymakers, practitioners, and stakeholders aiming to foster sustainable development and cooperation among the participating countries.
The analysis of trade relationships within the BRI countries in the solar PV sector yields several key insights:
- (1)
Economic development level difference network: The impact of economic development level variables on solar PV products trade exhibits significance in specific time periods, such as 2001–2005 and 2021–2022. This aligns with the “horizontal intra-industry trade” competition model, wherein countries with similar economic development levels tend to establish more trade connections. However, as the “Five Connectivity” and the Green Belt and Road Initiative facilitate renewable energy trade and demand discrepancies among countries become influential, the impact of economic development differences on solar PV trade diminishes in later stages. This departure from Lindell’s “Overlapping Demand Theory” underscores the intricate dynamics of global economic integration, where countries engage in a blend of competition and cooperation for mutual benefit. This theory delineates three trade modes: substitute trade involving competitive similar products, complementary trade with synergistic relationships among different products, and interdependent trade characterizing high interconnections between products or services across countries.
- (2)
Population gap network: The population difference’s influence on solar PV products trade within the network emerges as significant. Nations with larger populations tend to establish more trade links with both smaller populous countries and other populous countries, thereby experiencing heightened trade flows. Although the impact of demographic changes on trade links diminishes over time, it gains prominence in influencing trade volume selection.
- (3)
Resident consumption network: The analysis highlights that the difference in household consumption significantly impacts solar PV products trade, especially after the initiation of the Belt and Road Initiative. Countries with higher consumption levels exhibit greater energy supply demands, making solar PV trade a fitting solution to meet this demand.
- (4)
“Terrestrial 0–1 net” variable: The “Terrestrial 0–1 net” variable, which indicates the presence of land neighbors between countries, emerges as a notable influencer. Regression results in
Table 9 validate that this variable significantly and positively affects both trade linkages and trade volume selection. It passes the 1% significance threshold in most years. This phenomenon can be attributed to transportation modes such as natural gas pipelines and road tank trucks, which are more feasible between neighboring countries due to the relatively short straight-line distances and frequent information exchanges. Consequently, countries sharing land borders are inclined to establish more trade links and have a broader array of trade volume options.
That geographical distance affects trade relationships is often based on the gravity model of trade, which suggests a relationship between economic size and distance. However, the observation about the diminishing relevance of distance due to advancements in maritime trade and logistics is valid. In today’s globalized trade environment, the impact of geographical distance is mitigated by technological advancements and efficient supply chains. Moreover, “distance” should be understood not just in geographical terms, but also as encompassing cultural, administrative, and economic barriers. While geographical distance may still have some relevance, especially for perishable goods or within regional trade agreements, its role is increasingly nuanced. Therefore, the study’s claim about the impact of distance on trade relationships should be interpreted as one factor among many, and a more multi-dimensional approach would provide a more comprehensive understanding.
In essence, this analysis underscores the intricate interplay of economic, demographic, consumption, and geographical factors in shaping solar PV products trade within the Belt and Road Initiative. It underscores the evolving nature of trade dynamics and the multifaceted influence of various variables on trade relationships and volumes, providing valuable insights for policymakers and stakeholders navigating the complexities of international trade within this expansive network.


