

Optimal Scheduling Strategy for Multi-Energy Microgrid Considering Integrated Demand Response
Key Laboratory of Power System Intelligent Dispatch and Control of Ministry of Education, Shandong University, Jinan 250061, China
Energies 2023, 16(12), 4694; https://doi.org/10.3390/en16124694
Submission received: 25 April 2023
/
Revised: 7 June 2023
/
Accepted: 9 June 2023
/
Published: 14 June 2023
(This article belongs to the Topic Advanced Operation, Control, and Planning of Intelligent Energy Systems)
Abstract
:Research on energy storage plants has gained significant interest due to the coupled dispatch of new energy generation, energy storage plants, and demand-side response. While virtual power plant research is prevalent, there is comparatively less focus on integrated energy virtual plant station research. This study aims to contribute to the integrated energy virtual plant station research by exploring the relationship between the integrated energy electro-thermal coupling capacity, various forms of electro-thermal integrated energy response, and electro-thermal integrated energy storage. Analyzing the attributes of an integrated energy microgrid, including energy storage characteristics, time-of-use tariffs, and electric and thermal loads, is crucial. A grid-connected microgrid with cogeneration systems, electric boilers, fuel cells, and energy storage systems is used as an illustrative example. The dispatching method prioritizes multiple complementary energy sources while considering the integrated energy demand response. The study presents different models for the electricity demand and thermal energy demand response and introduces the design of a wholesale power trader involved in building energy storage facilities and participating in the demand response. To verify the feasibility and rationality of the integrated energy demand response scenario, three different schemes are compared, and an economic analysis is conducted.
1. Introduction
The future new power system will rely on multiple integrated energy sources [1,2,3,4], including hydrogen energy [5], which is clean, efficient, and environmentally friendly. Power traders are becoming involved in constructing energy storage power plants, along with distributed power sources and demand-side responses, to enable the clustering and scheduling control of virtual power plants [6,7,8,9]. The smart scheduling and management of microgrids in smart communities is also crucial for future growth. Therefore, studying the demand-side response and energy storage coupling for multi-energy complementary microgrid scheduling is essential.
Integrated energy systems combine electrical and thermal energy storage, enabling long-term dispatch and demand response activation for thermal and electric energy [10]. Long-term storage options include compressed air, liquefied hydrogen, liquefied natural gas, and more [11]. However, ensuring sufficient energy storage in the day-ahead market becomes challenging due to reserve constraints, risk factors, network congestion, and increased transaction costs [11,12]. The complexity introduced by multi-energy coupling and the varying conversion efficiency further affects transaction clearing prices [13]. Consequently, determining optimal energy transaction prices requires decision making, such as through multilateral negotiations and peer-to-peer trading models [14]. To address these economic constraints, distributed settlement methods are proposed to mitigate spot market risks and improve spot prices for different energy carriers [15].
The main trend in integrated energy systems is shifting towards clean fuels such as hydrogen. Combined heat and power, with natural gas as the dominant clean fuel, is currently prevalent in integrated energy setups, but hydrogen energy is emerging as a potential replacement for natural gas. Several key issues require attention: (1) identifying the optimal energy source for hydrogen production, (2) enhancing the hydrogen production efficiency, and (3) effectively storing hydrogen energy. The existing literature [16] addresses some of these challenges by exploring hydrogen production from various renewable energy sources, optimizing current and temperature controls for improved efficiency, and predicting the hydrogen demand based on the spatial and temporal load characteristics to mitigate the volatility of renewable energy sources. While the first two problems have been addressed with similar approaches in the literature, a better approach for the third problem remains a topic of investigation. Research studies [17,18] suggest methanation as a viable solution for the preparation of natural gas, liquid hydrogen, and other gas and liquid forms. Great research prospects lie in modeling the entire industry chain of hydrogen energy generation, handling, storage, and transportation, as well as maximizing revenue through the synergy and complementarity of different forms of hydrogen energy.
As mentioned earlier, the demand response plays a vital role in addressing scheduling flexibility, and the coordinated control of the demand response and energy storage systems is instrumental in managing uncertainties in new energy consumption and maximizing profits in the power market [19]. Notably, an intriguing approach involves quantitatively addressing the curtailment of wind and photovoltaic power through load shifting or demand response balancing, followed by the full utilization of the generated power via energy storage [20]. Moreover, the inclusion of multiple forms of electric and thermal energy, along with their corresponding electric and thermal demand responses, including the cold demand response, further expands the possibilities for flexible system dispatch [21,22,23,24]. Similar to the challenges of modeling the conversion efficiency in multi-energy systems, the accurate modeling and collaborative dispatching of the electric-energy-based demand response and integrated energy demand response are pressing issues that need to be resolved. At the market level, the trading mechanisms of both the electric energy market and the natural gas market [25,26] have paved the way for the introduction of a price-based electric energy demand response and integrated energy demand response. However, to effectively manage the uncertainties stemming from renewable energy, diverse load types, and spot prices in the energy market, the establishment of a smart energy center with accurate modeling and a clear mechanism becomes imperative. The relevant literature [27] contributes significantly to addressing this challenge.
This study aims to address key aspects, such as combined heat and power, clean energy utilization, and an integrated energy demand response. Moreover, it focuses on addressing the core concerns of investors, including the community equipment configuration model, the profitability of electric and thermal decoupling, and the quantification of the microgrid demand response in relation to electricity prices. To tackle these challenges, we investigate the scheduling methods of energy storage power plants within a complementary microgrid, considering the active participation of power trading wholesalers. The objective is to optimize the dispatch costs by minimizing them through the integration of energy storage power plants in a multi-energy complementary dispatch.
The novelties of this paper include (1) a model description of thermal energy storage power construction by wholesale electricity traders to participate in the electricity market; (2) modeling different types of demand-side response load characteristics; and (3) an integrated energy system with clean fuels as a representative of electrical cooling and multiple thermal energy forms complementary to each other as a background.
In Section 2, the definition and operational architecture of the integrated energy system are introduced; Section 3 introduces the integrated energy demand response based on the integrated energy system; in Section 4, the optimal scheduling model of the integrated energy system is introduced; Section 5 conducts a simulation analysis to quantify the economics of the integrated energy demand response; and, finally, a summary is given.
2. Integrated Energy System
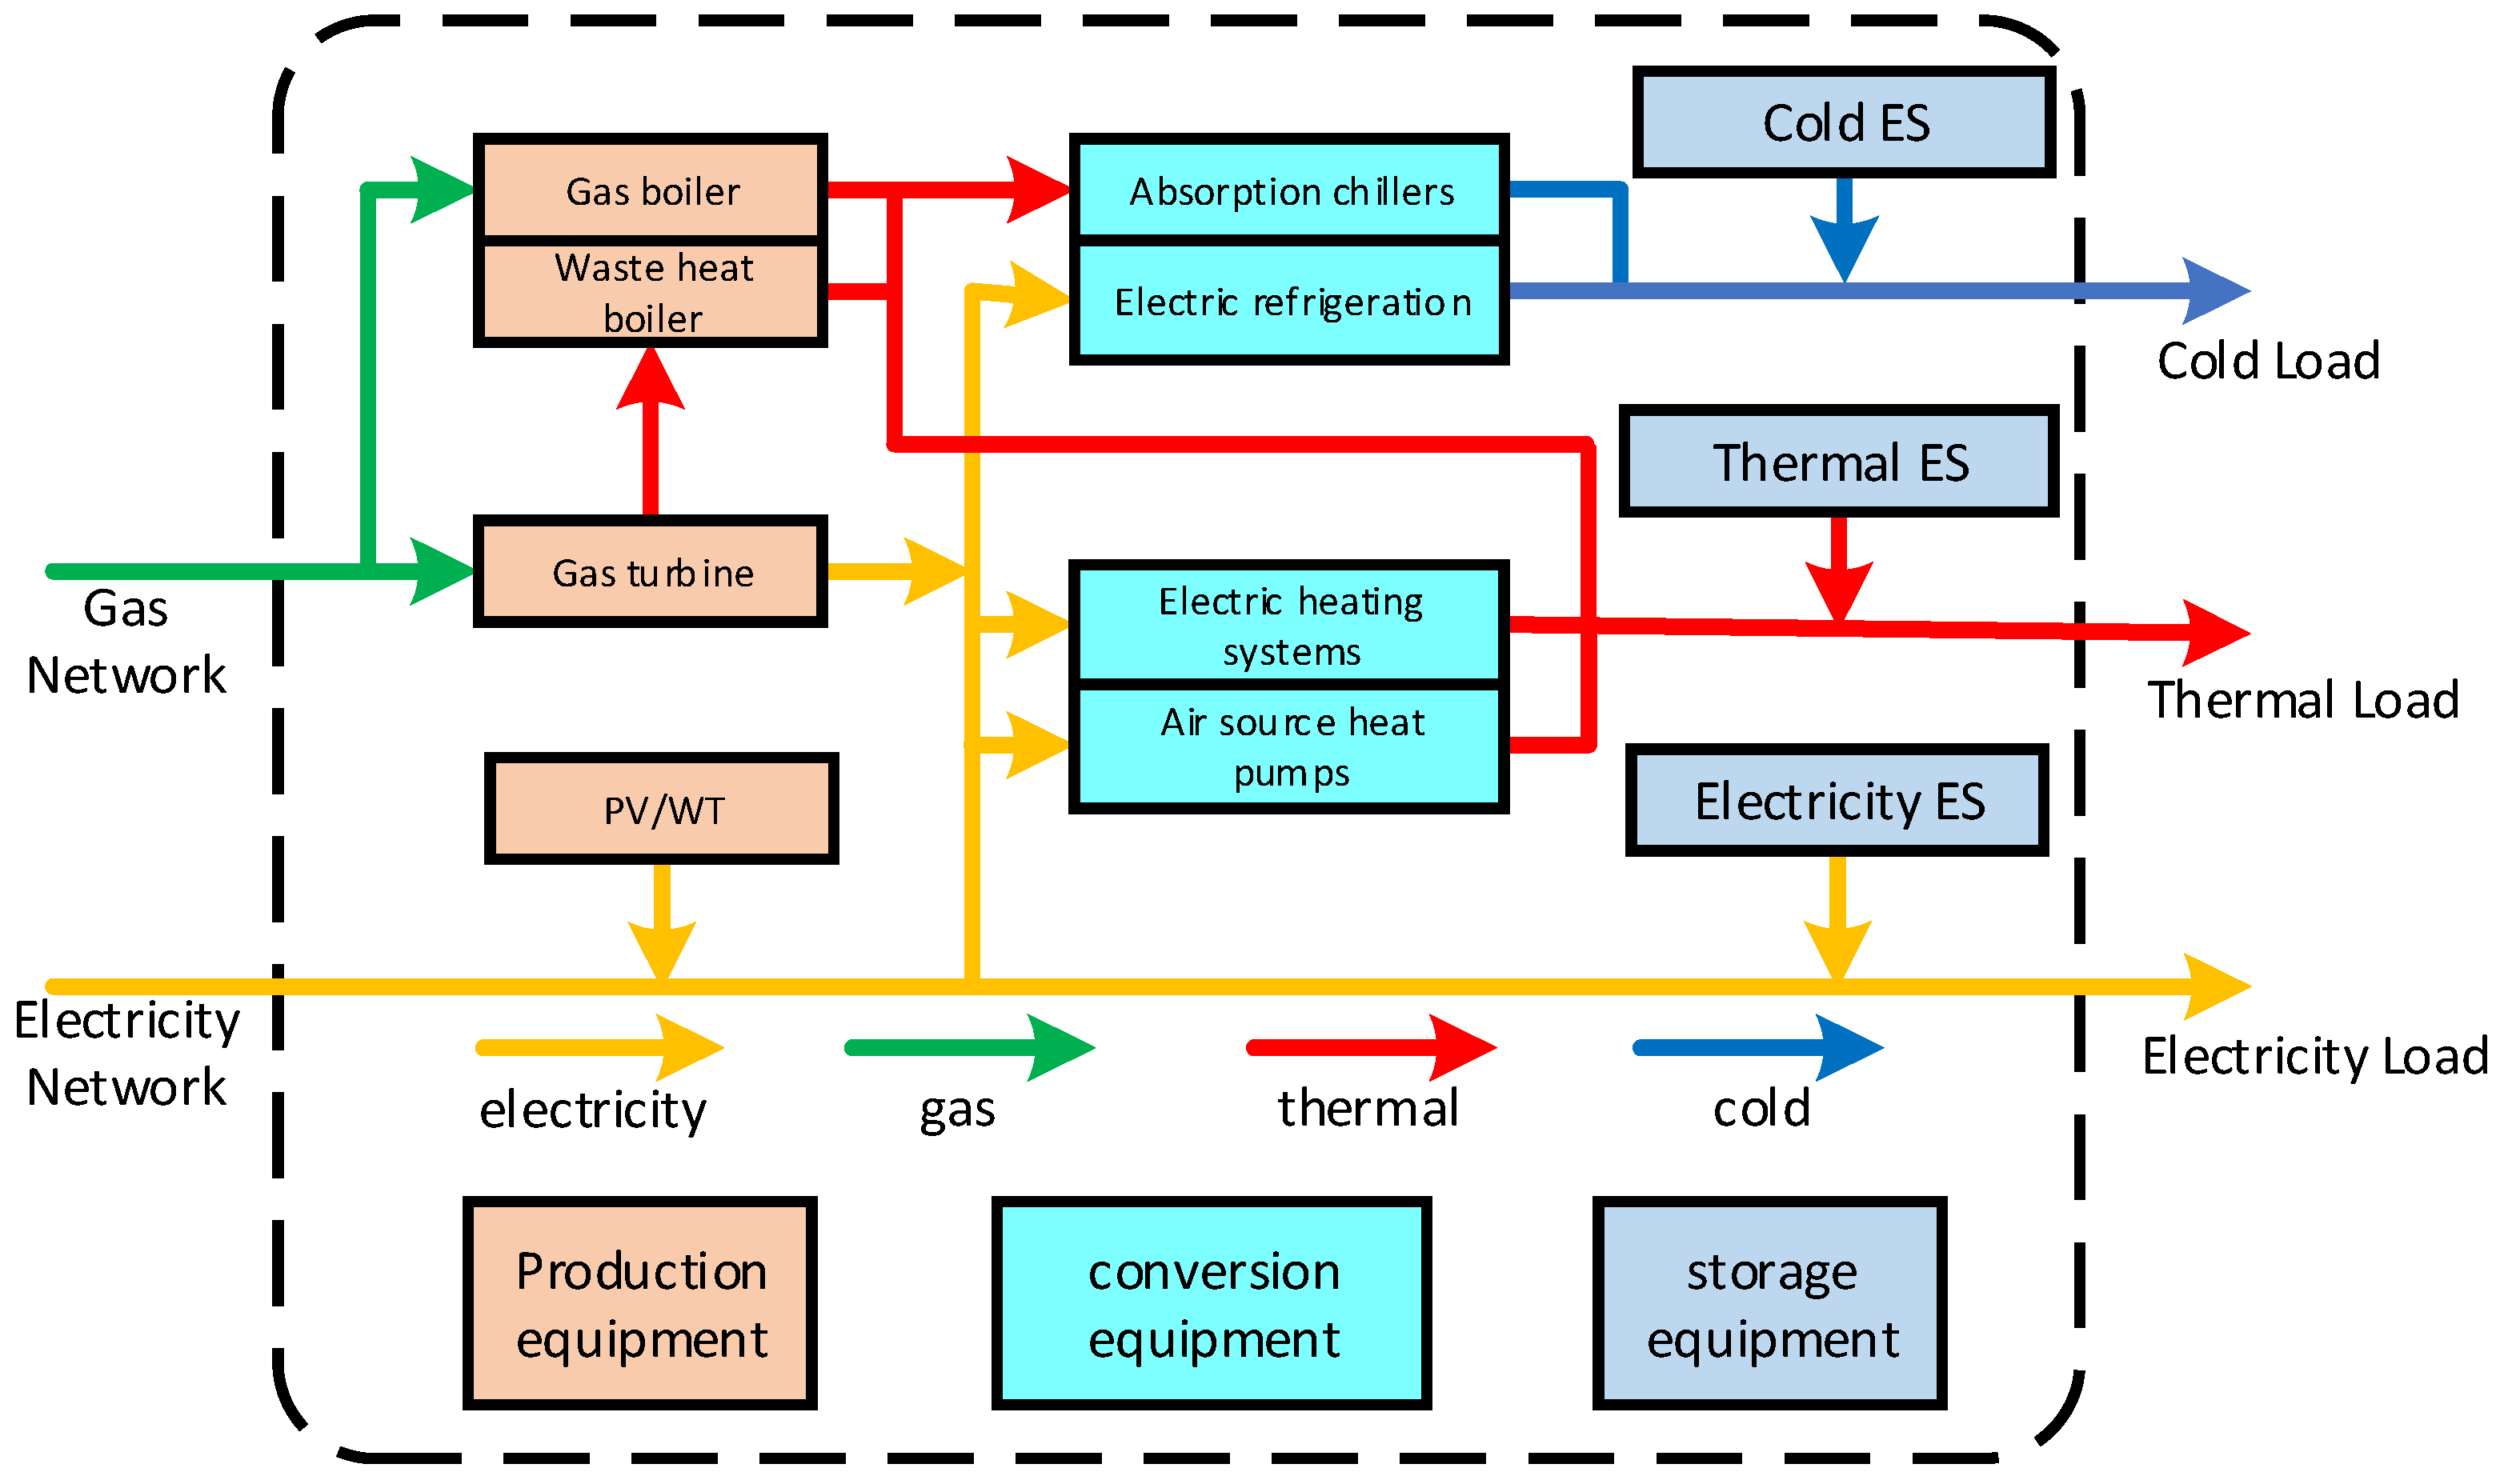
An integrated energy system (IES) encompasses the coordination and optimization of energy generation, transmission, distribution, conversion, storage, and consumption. It involves various components, such as energy supply networks (e.g., power, gas, cooling/heat), energy exchange links (e.g., combined cooling, heating, and power unit; generator set; boiler; air conditioner; heat pump), energy storage links (e.g., electricity, gas, heat, cooling), terminal integrated energy supply units (e.g., microgrid), and numerous end-users [28,29]. The specific operational flow is shown in Figure 1.
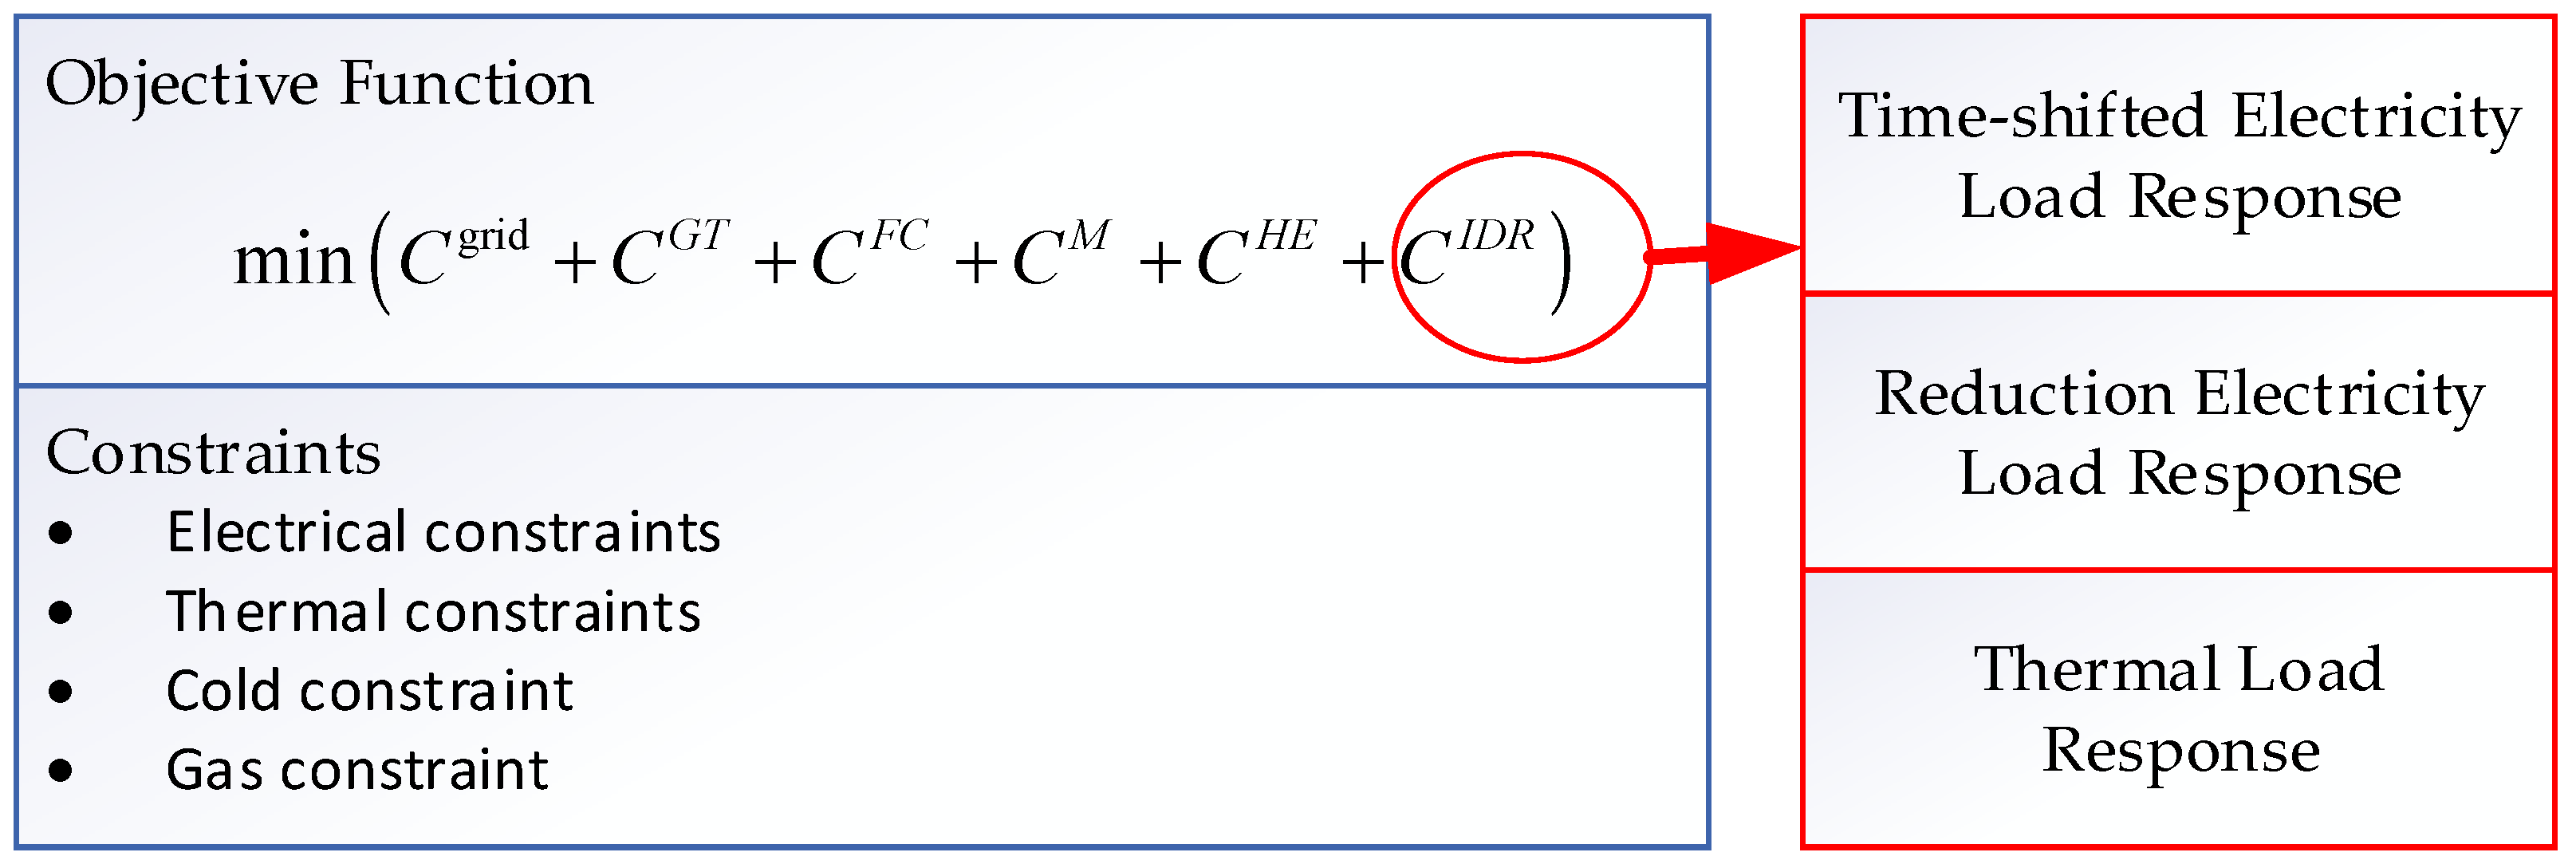
The IES is widely recognized as a means to enhance energy efficiency, promote renewable energy adoption, and improve energy supply security, affordability, and adaptability. However, the optimization of integrated energy operation faces challenges due to the unpredictable nature of distributed energy production and fluctuating energy consumption in IES. Researching the integrated demand response for multi-energy synergy is crucial to establish a favorable interaction between the supply and demand sides of IES. The integrated demand response expands upon the classic paradigm by encouraging consumers to modify their demand for multiple energy sources through incentives or discounts, thereby influencing their demand for additional energy sources [30,31]. This approach moves beyond the traditional concept of the demand response, which focuses on modifying the electricity demand through prices or incentives to achieve supply–demand equilibrium. Accordingly, this paper proposes a scheme of electric and thermal integrated energy demand response participation dispatch (as shown in Figure 2) and mainly analyzes the operating benefits under different electricity prices.
3. Integrated Energy Demand Response Model
The integrated demand response relies on supply-side electrothermal coupling technology, which not only encourages power users to decrease and move electrical loads via electricity pricing but also makes it possible to transfer both gas and electric heating loads. The model presented in this paper makes some minor improvements on the basis of the literature [32].
3.1. Time-Shifted Electricity Load Response
A time-shifted load is one whose power consumption time may alter in response to user demands and whose duration varies depending on the type of load. Controllable loads, such as electric cars, etc., may participate in scheduling more flexibly and meet the power limitations within a certain timeframe. They can be represented by the following model:
where and denote the lower and upper limits of the controllable load; and in the equation denote the lower and upper limits of the controllable load shifting time, and, at the same time, the load sum within the time interval must be equal to ; and there is no load shifting control outside the time interval.
3.2. Reduction Electricity Load Response
The controllable load refers to the power load that the system partly decreases for the user and typically compensates for. Additionally, as demonstrated in the equation, a controlled load’s regulated power should be maintained within a certain range when scheduling it. We specify the following expression for load reduction over the period t:
where is the controllable load power of the ith user in the period t before IDR adjustment; is the power consumption of the ith user in the period t that is cut off after being adjusted by IDR; is the total time of users participating in a controlled load response; is the minimum power consumption in the period t.
3.3. Thermal Load Response
The peak hours of air conditioners, electric furnaces, and other loads can essentially coincide with the peak hours of the grid power supply. Under IDR regulation, users with certain conditions may eliminate heating strategies such as air conditioners and electric furnaces in favor of centralized heating methods, which can maintain the user’s thermal energy demand while reducing the strain on the power grid’s supply.
If the replacement response power of the user i adjusted by IDR is in the period t, then the system heating load adjusted by IDR is
The system gas heat load after IDR regulation of the gas boiler is
where is the heat power required for the gas heat load of the user i in the period t before adjustment by IDR; is the substitution factor.
3.4. IDR Compensation Mechanism
A fee compensation scheme is implemented for customers to encourage more demand response participation; the energy supply system is responsible for covering the associated expenses, which are shown in the following equation:
In the formula, , , and are the unit prices for reducing electrical power, transferring electrical power, and adjusting electric heating power in the period t, respectively, and the price is related to the amount of income obtained by the system before and after participating in the response.
4. Multi-Energy Complementary Combined Heating and Power (CHP)-Based Optimal Operation Model
The thermoelectric connection via the energy storage system (ESS) is decoupled, the multi-energy complementing qualities are taken into account, and the CHP-optimized operation model with IDR creates the best output plan for each piece of cogeneration equipment from both the supply and demand sides. The system model is derived from the literature [33].
4.1. Objective Function
The objective function of the CHP day-ahead planning model is to minimize operating expenses:
- Electricity purchase cost
- 2.
- Microturbines and fuel cell gas cost
- 3.
- Maintenance and equipment loss cost
Equipment operation generates power that causes equipment losses. To simplify the calculation, the maintenance cost and equipment loss cost is expressed as a linear relationship between the power generated by the equipment and the losses.
where is the maintenance cost; denotes the unit maintenance cost for unit i; and is the output of the period t for unit i.
- 4.
- Heat sales revenue
4.2. Constraints
In addition to taking into consideration the operating limits for the equipment, the system constraints must satisfy the electrical and thermal power balance as well as switching power restrictions.
- Micro gas turbine model
In this paper, a mathematical model of the thermoelectric relationship is established, ignoring the influence of the external environment and combustion efficiency, and the exhaust waste heat power is expressed as an equation:
where and are the electrical power and power generation efficiency of micro gas turbines in the period t; is the heat dissipation loss coefficient.
Micro gas turbines satisfy the output power and climb rate constraints below:
where and are the lower and upper limits of the output power of gas turbines; and are the lower and upper climbing rate limits for gas turbines, respectively.
- 2.
- Electric heating model
Electric heating equipment obtains heat energy through electrical energy, such as electric air conditioners, electric boilers, etc., and this paper uses the mathematical model presented in the literature:
where and are the heating power and electricity consumption of the electric heating equipment in the period t, respectively; and is the conversion factor.
- 3.
- Power and thermal energy storage model
Consider the battery or thermal charge state model represented as follows:
where the equation represents the battery and thermal dynamic model of the charge state; and denote the battery charge and discharge efficiency; and denote the battery or thermal charge and discharge power; and denote the lower and upper charge state constraints to prevent the battery from deep discharge and overshoot. and denote the thermal charge and discharge efficiency, and and denote the thermal charge and discharge power; and denote the lower and upper charge state constraints to prevent the thermal device from deep discharge and overshoot.
The charging and discharging power constraints and charge state constraints of the battery or thermal device are as follows:
where denote the maximum battery charge and discharge power. denote the maximum thermal charge and discharge power.
- 4.
- Exchange power constraint
- 5.
- Electrical and thermal power balance
The sum of power purchased from the grid, distributed generation, and energy storage charging and discharging are equal to the sum of electrical load and heating load:
where is the predicted power of the fixed electrical load in the period t.
The sum of thermal output power is equal to the sum of electric heating and gas heating load ; the terms
,
, indicate the thermal output power of the micro gas turbine, electric heating, and thermal energy storage system:
4.3. Solving Algorithms
The objective function contains nonlinear terms and the standard form of its solution is
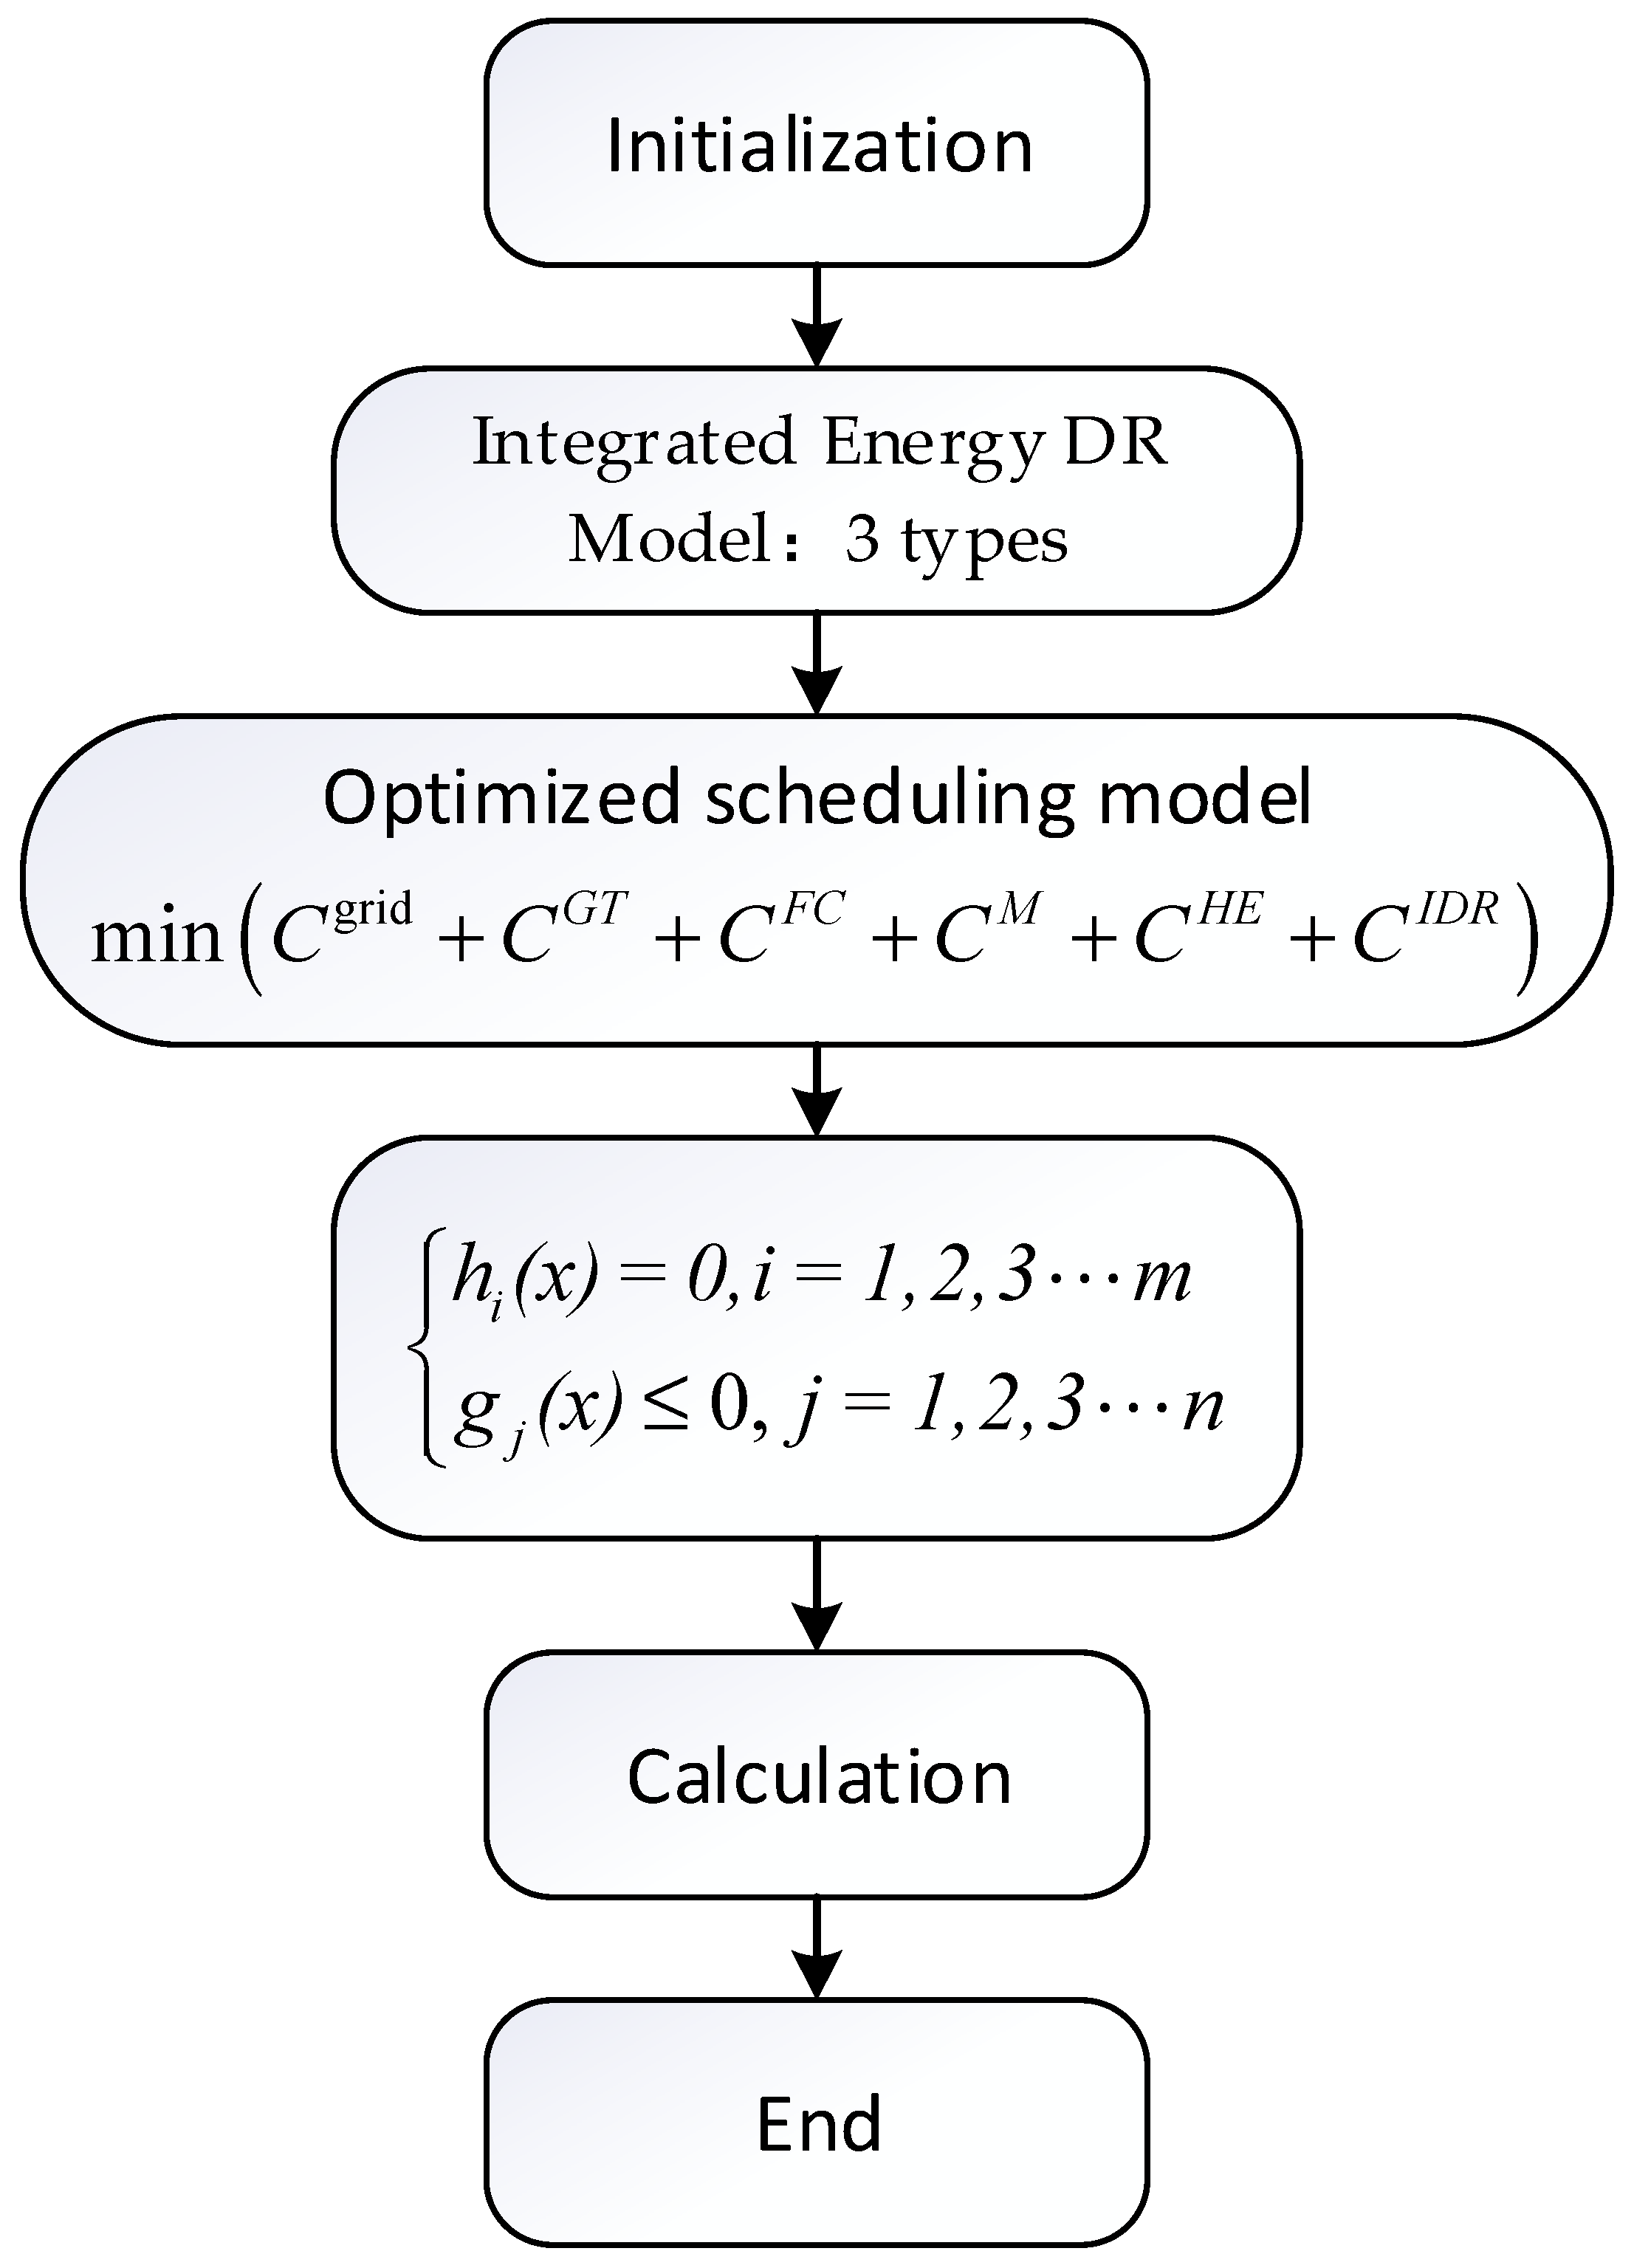
In Equation (31), the optimization variable x includes the output of various micro-power sources, energy storage, and interactive power; the equation constraint includes the energy balance and the energy relation equation of the energy storage device; the inequality constraint includes the operation constraint of each unit, etc. The sub-objective functions in the objective function (8) are linear expressions of the variables multiplied by the individual cost coefficients. The integrated energy demand response includes equation constraints (1), (3), (5)–(6) and inequality constraints (2), (4); equation constraints (15), (18)–(19), (25)–(26) and inequality constraints (16)–(17), (20)–(24) are linear terms in the constraints. A commercial optimization solver can tackle the problem described above. In addition, it should be noted that the robust method is an important approach to dealing with uncertainty problems such as scenery [34,35]; however, this paper focuses on intuitively analyzing the benefits of different community scenarios from an economic perspective, assuming that the scenery is all deterministic output. The specific solution steps are shown in Figure 3.
MATLAB 2017 and the Cplex optimization program are used to solve the mixed integer linear programming issue for the aforementioned model.
5. Simulation Analysis
5.1. Experimental Settings
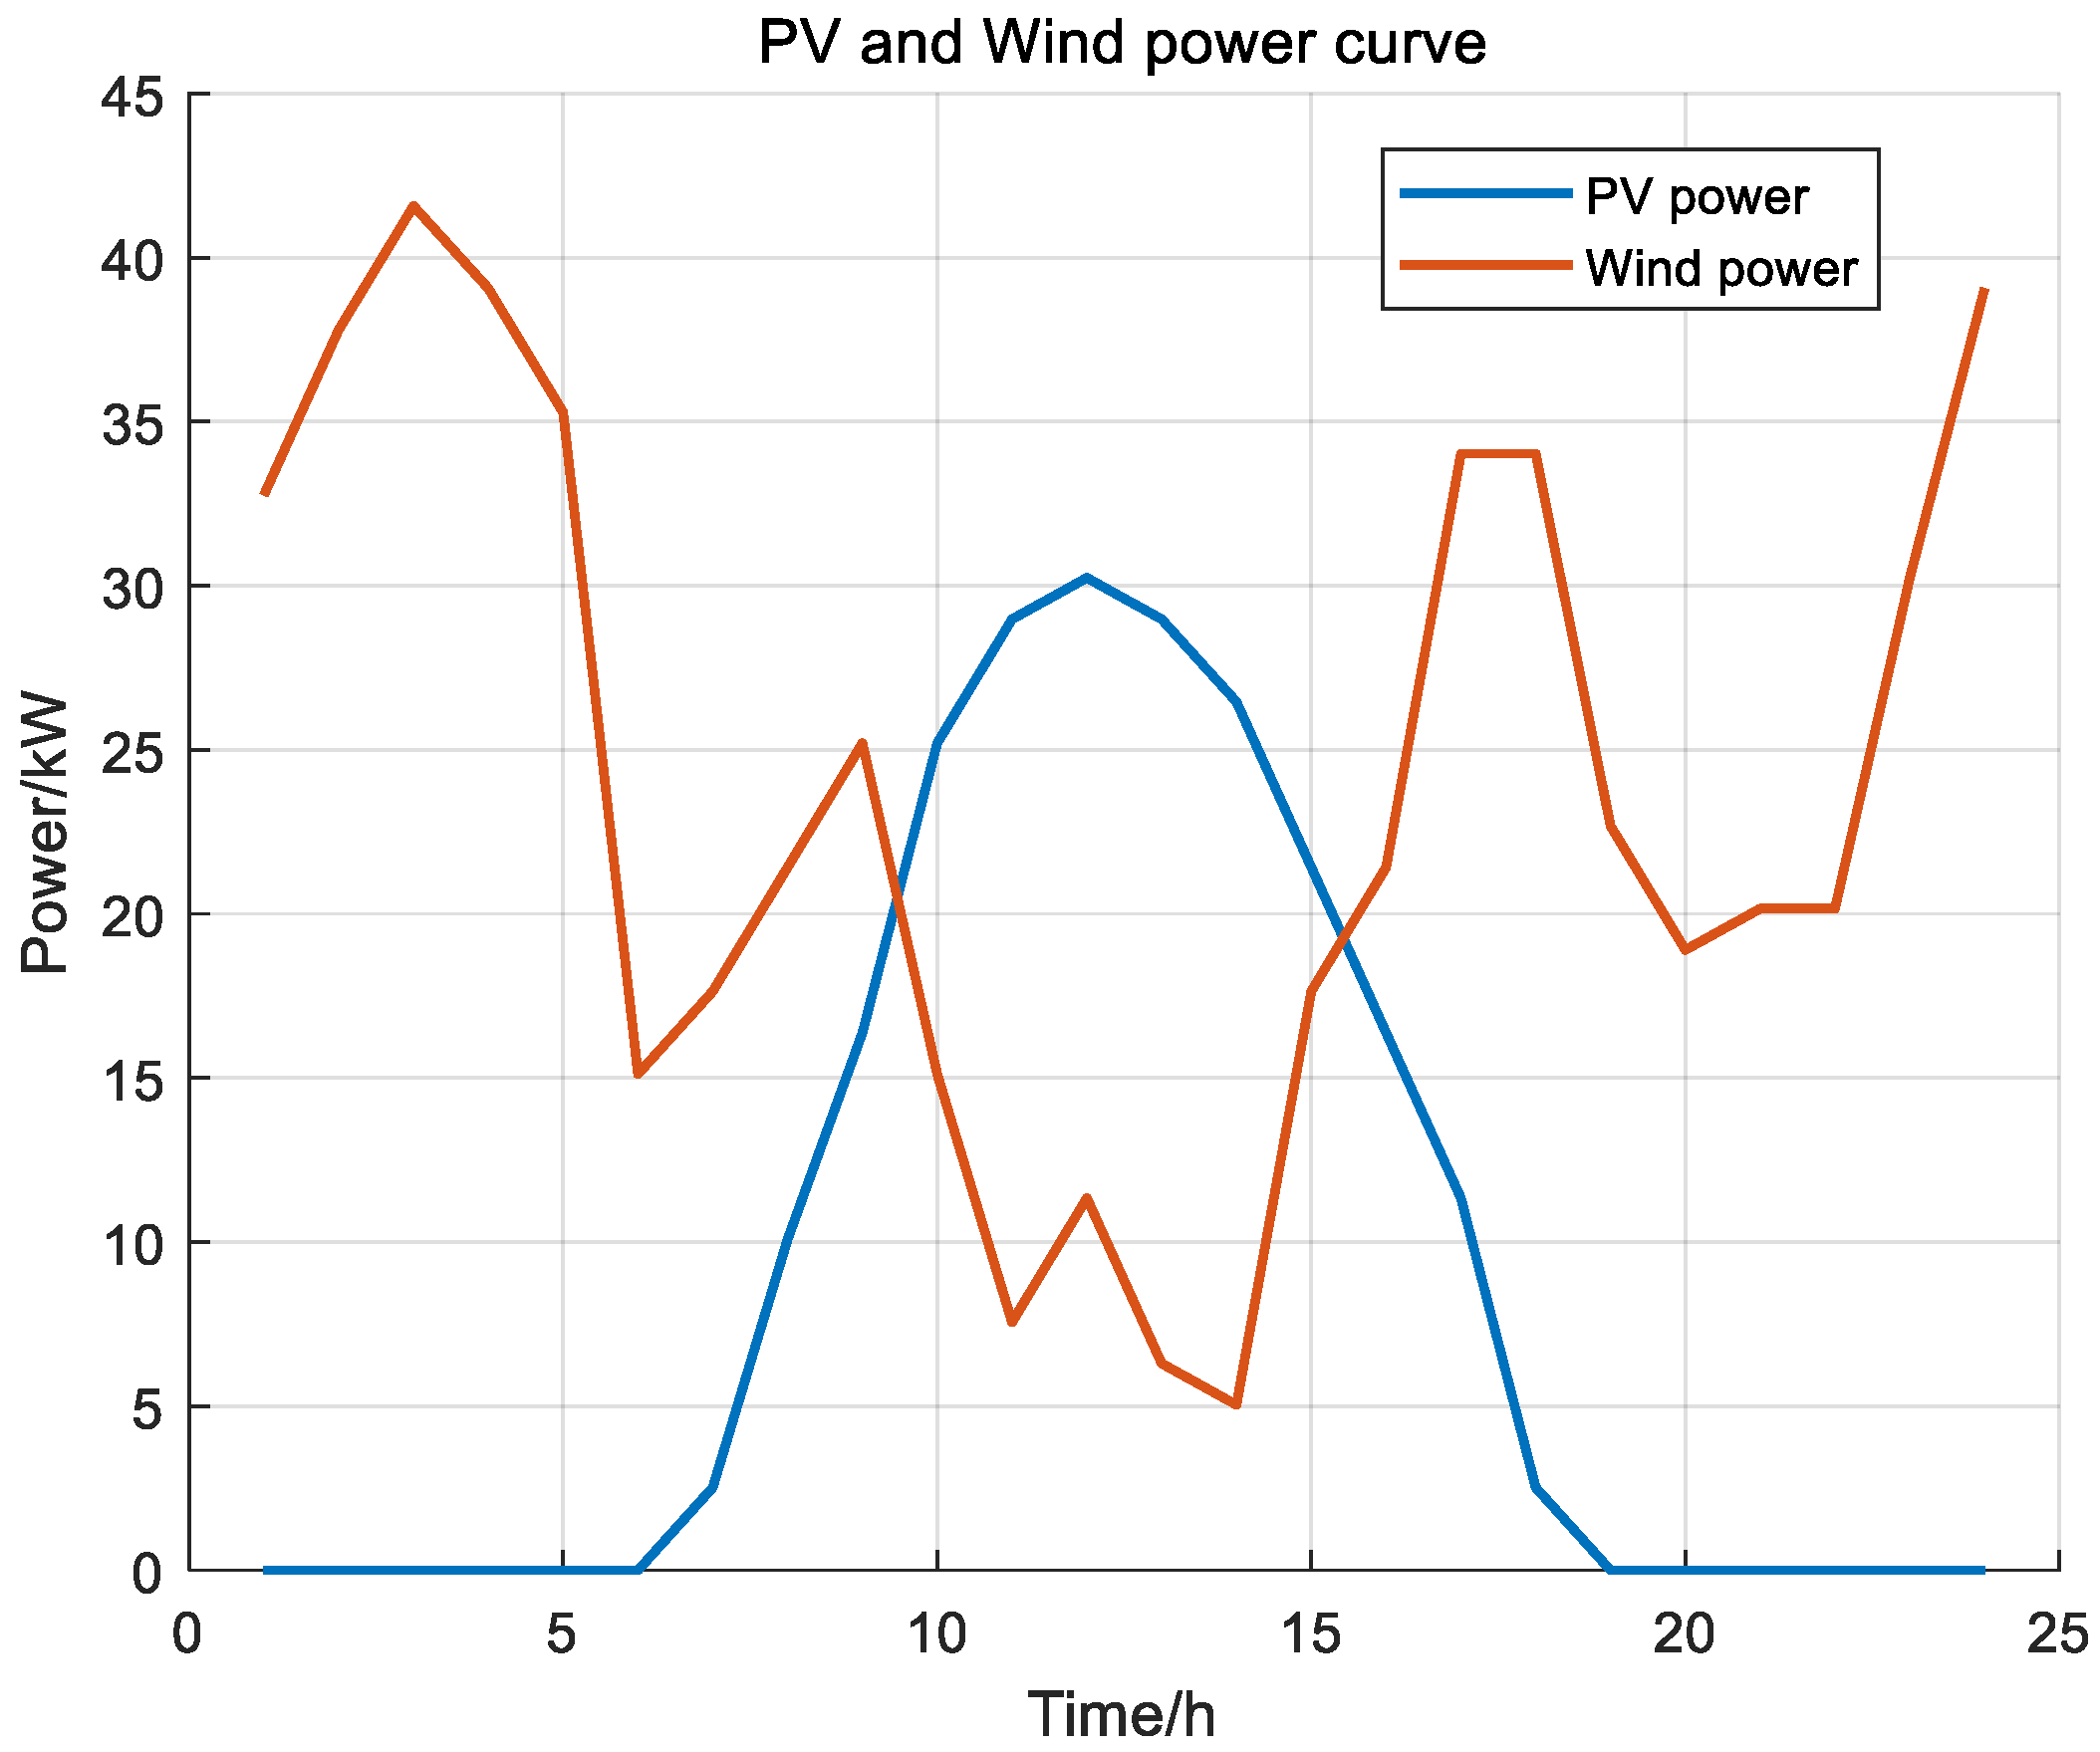
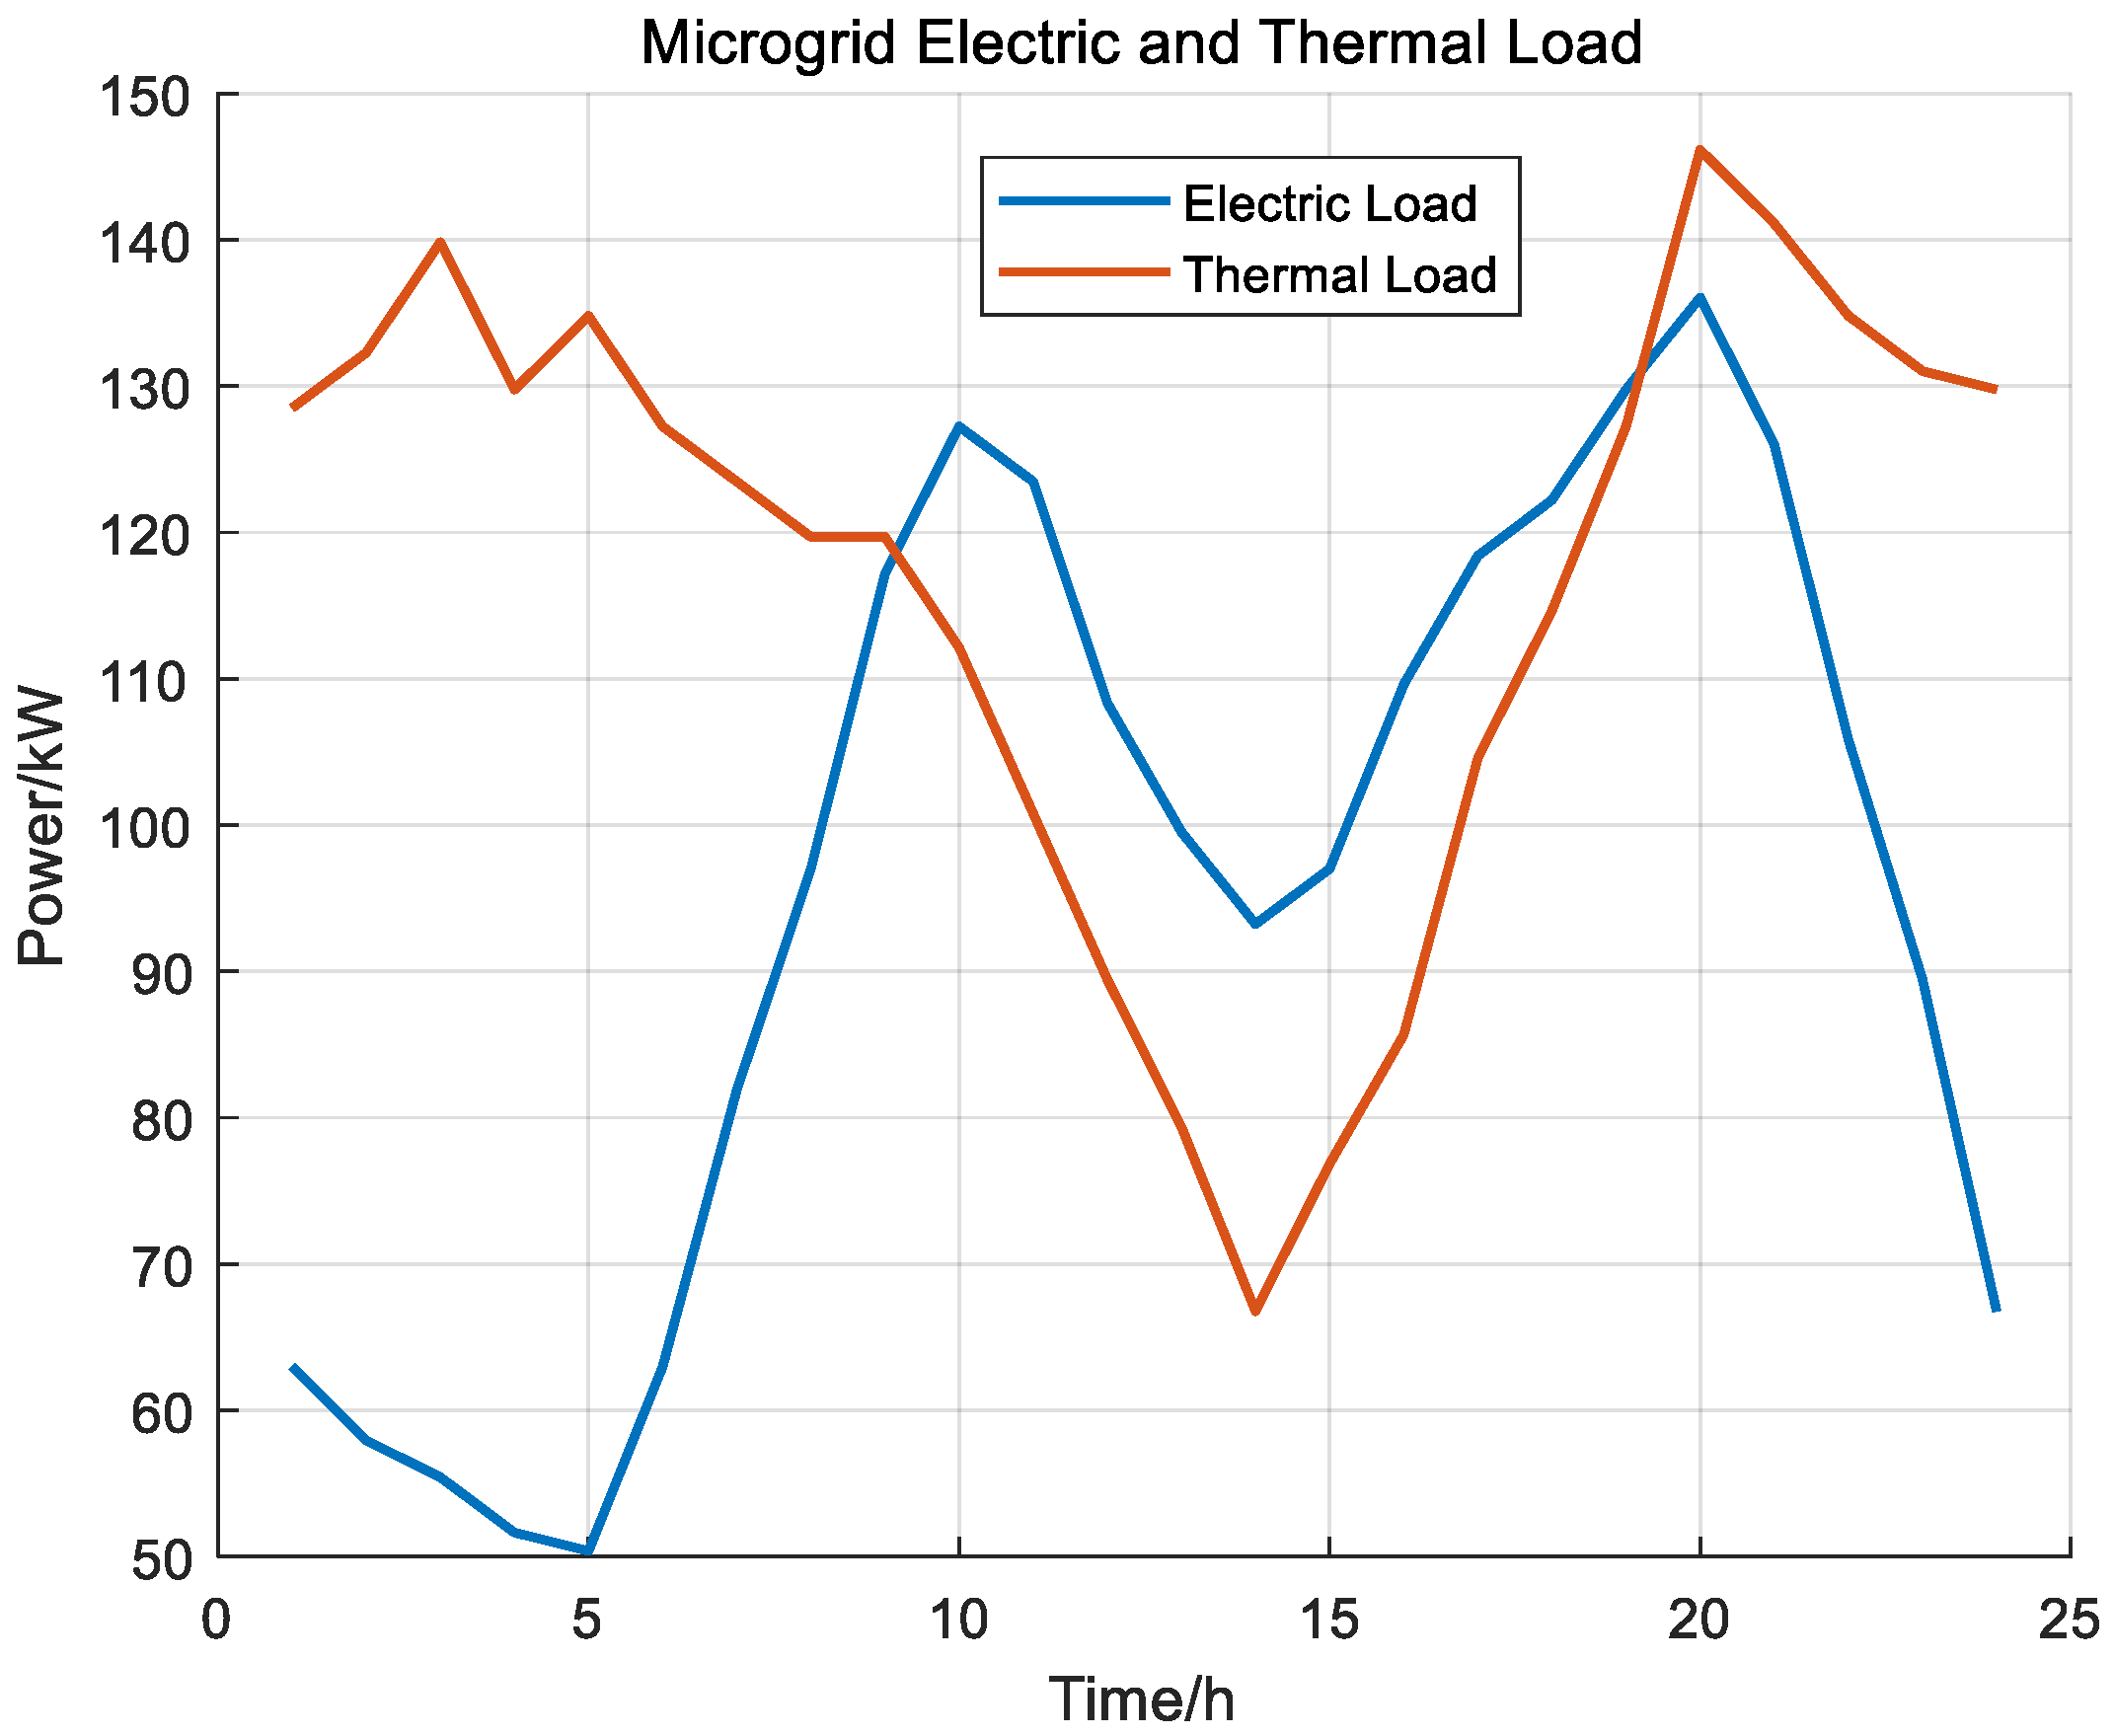
In this research, a grid-connected microgrid is chosen, which consists of electric boilers, fuel cells, solar cells, cogeneration systems, wind turbines, and electric and thermal energy storage units. The interactive tariff follows the time-of-use tariff; the length of the dispatching period is 24 h, the unit dispatching time is 1 h, and the power output and interactive power of each unit are constant. In this paper, a day’s worth of photovoltaic and wind power data are simulated using the MATLAB simulation software, as shown in Figure 4 and Figure 5.
Table 1 shows the exact characteristics of the energy storage system, assuming that the starting capacity of the energy storage is the smallest number. EES and TES indicate the battery energy storage and thermal energy storage systems; indicates the charging and discharging efficiency of electrical or thermal energy; and indicate the lower and upper limits of charging and discharging energy or thermal energy; indicates the initial test state of charging and discharging energy or thermal energy, respectively.
Storage batteries are utilized for electric energy storage, and thermal storage tanks are used for thermal energy storage because of the lengthy dispatch times per unit, and partial parameter references. The tariff periods in this paper are divided as follows: peak hours are 10:00–15:00 and 18:00–21:00; flat hours are 07:00–10:00, 15:00–18:00, and 21:00–23:00; valley hours are 00:00–07:00 and 23:00–24:00. The time-of-day tariffs are shown in Table 2.
5.2. Scheme 1 Results
The objective function of Scheme 1 is as follows:
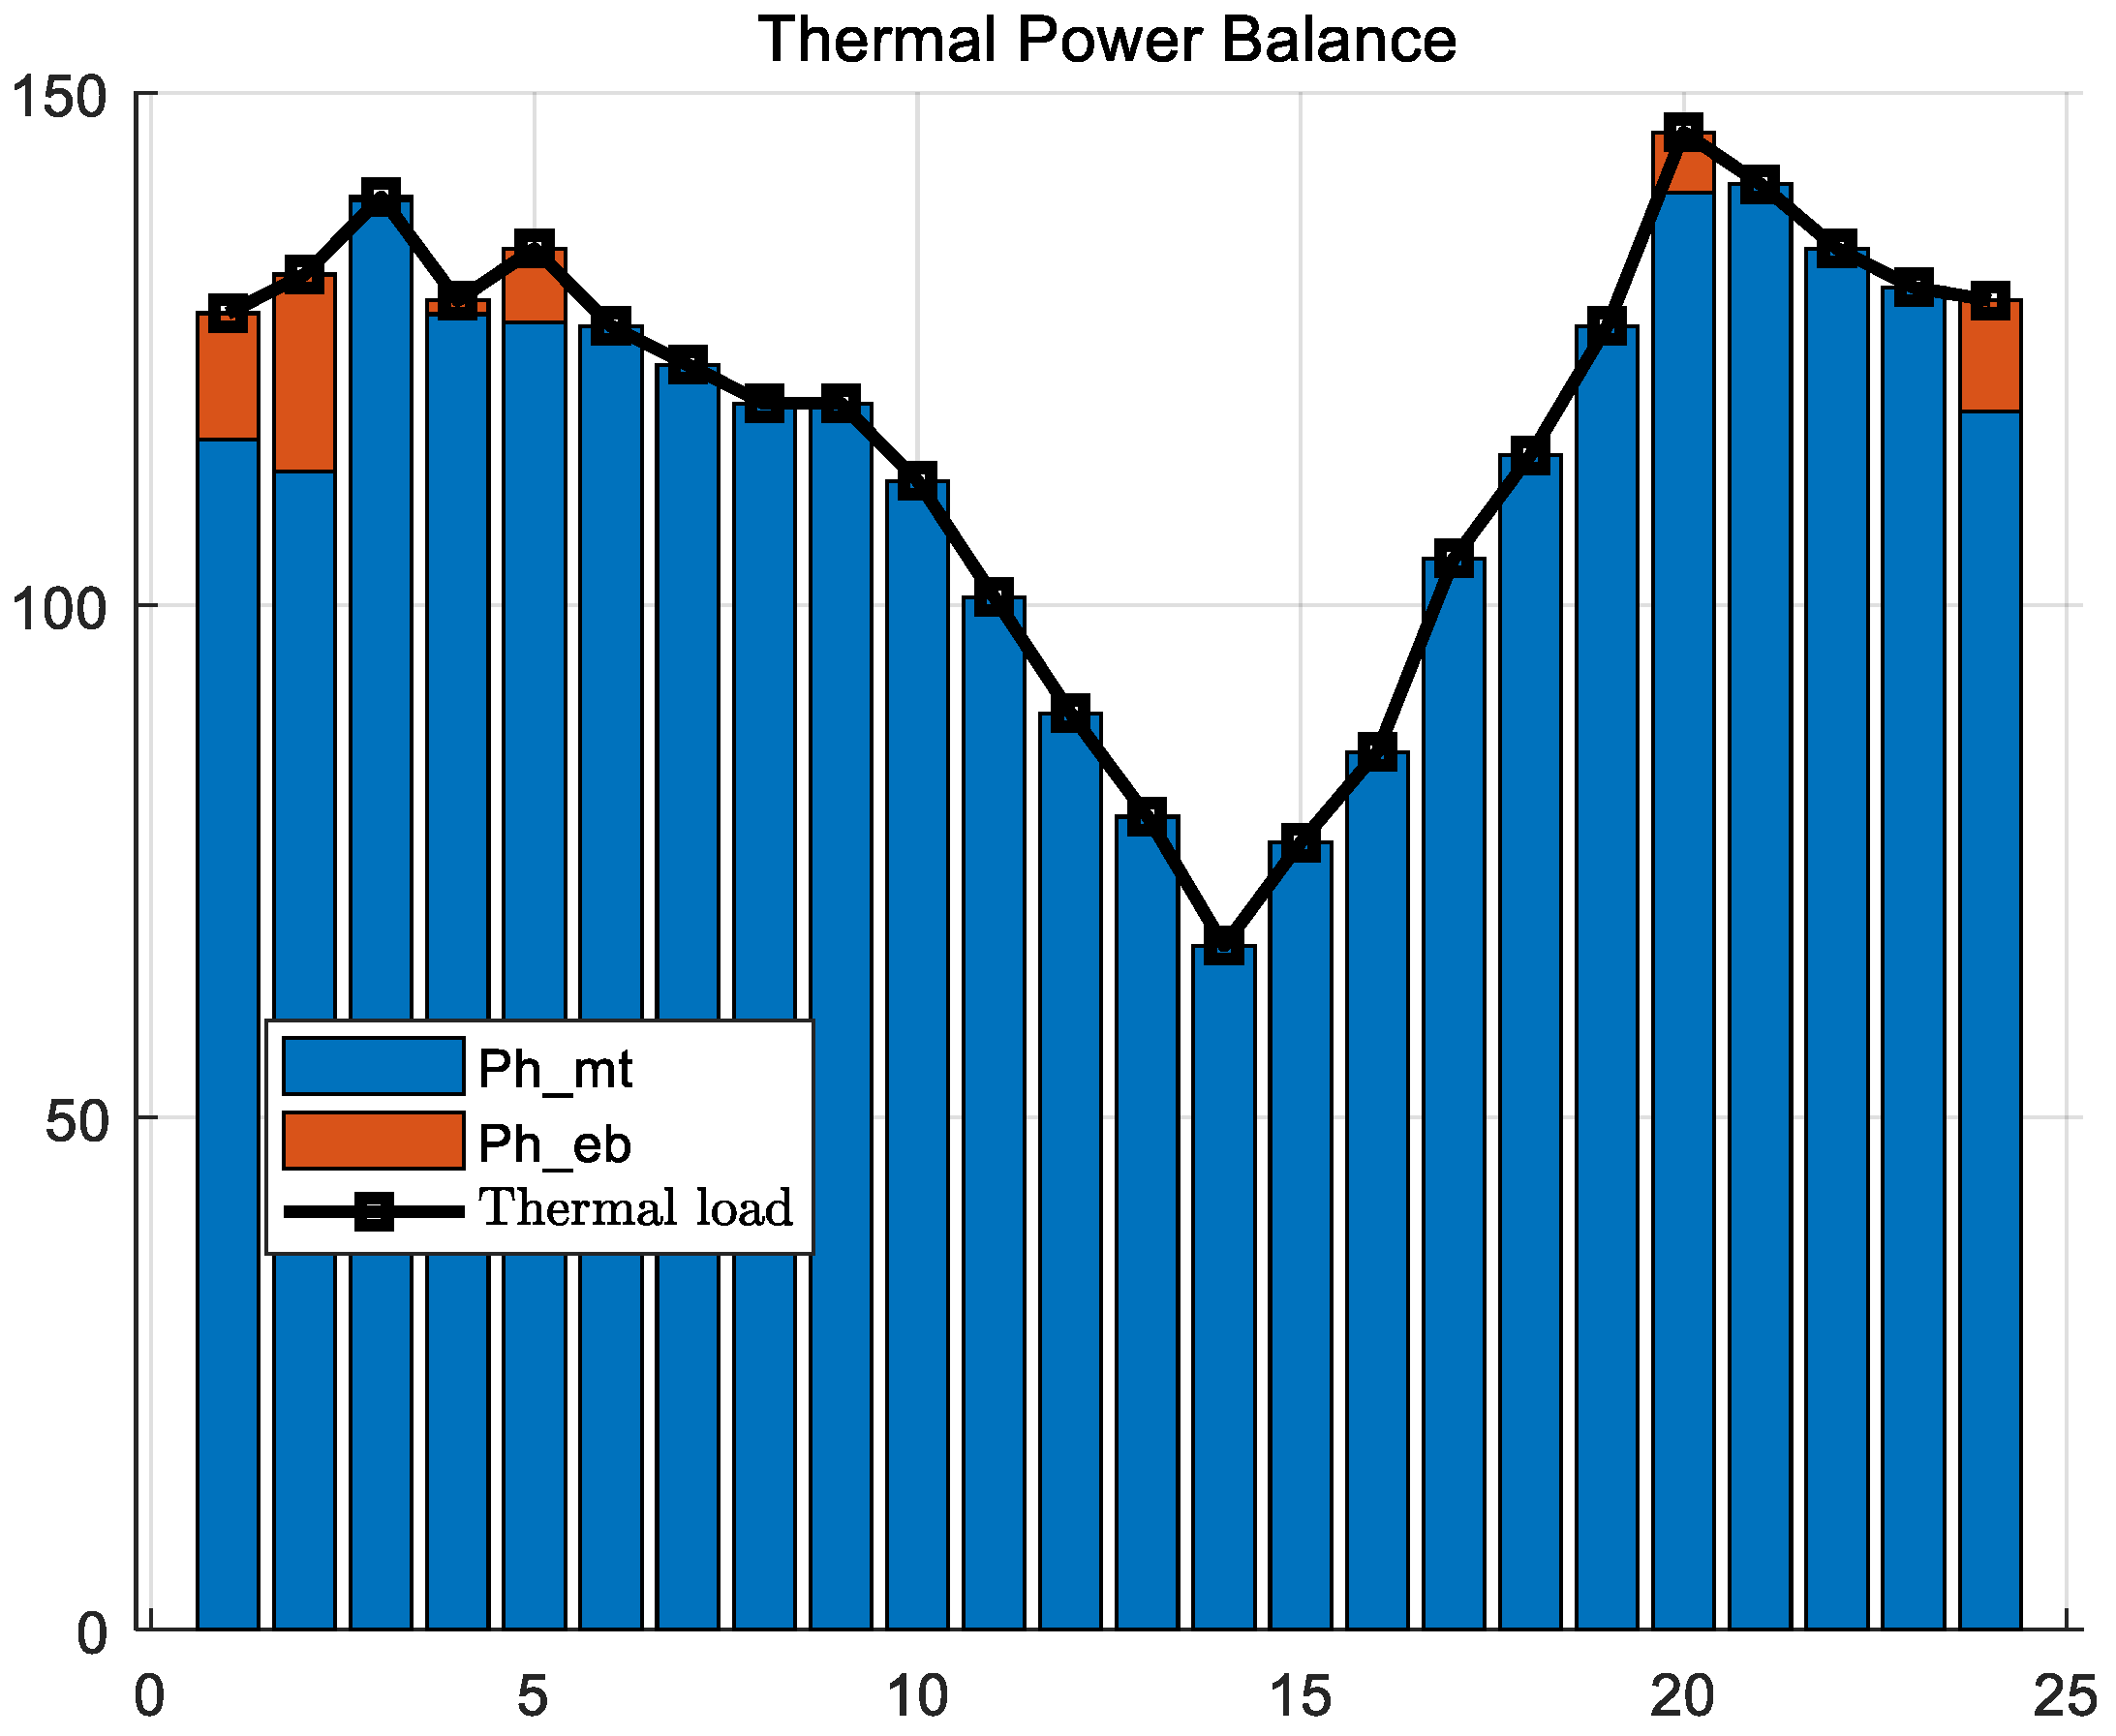
Scenario 1’s heat load is provided by the CHP system, the CHP system works in the “heat to power” mode during the dispatch cycle, and the remaining heat load is met by the electric boiler, while the electric output determined by both is used to meet the grid electric load together with the output of fuel cells, electric storage, and interactive power.
In Scheme 1, the heat load is provided by the cogeneration system, and the cogeneration system works in the “heat to power” mode during the dispatch cycle, and the remaining heat load is met by the electric boiler, while the electric output determined by both is used to meet the grid electric load together with the output of fuel cells, electric energy storage, and interactive power.
5.3. Scheme 2 Results
The objective function of Scheme 2 is as follows:
In mode 2, the cogeneration load is satisfied by the cogeneration system, fuel cells, energy storage, electric boilers, and interactive power based on the generation costs and operational constraints. With the introduction of thermal energy storage, the “heat-determined power” approach of the cogeneration system is decoupled, and the electric power output of micro-combustion engines and electric boilers is lifted. By optimizing both the power supply and heat supply costs through a unified objective function, the optimal power output of each unit can be obtained to meet the operating constraints of the microgrid, i.e., the joint dispatch of electricity and heat is realized.
5.4. Scheme 3 Results
The objective function of Scheme 3 is as follows:
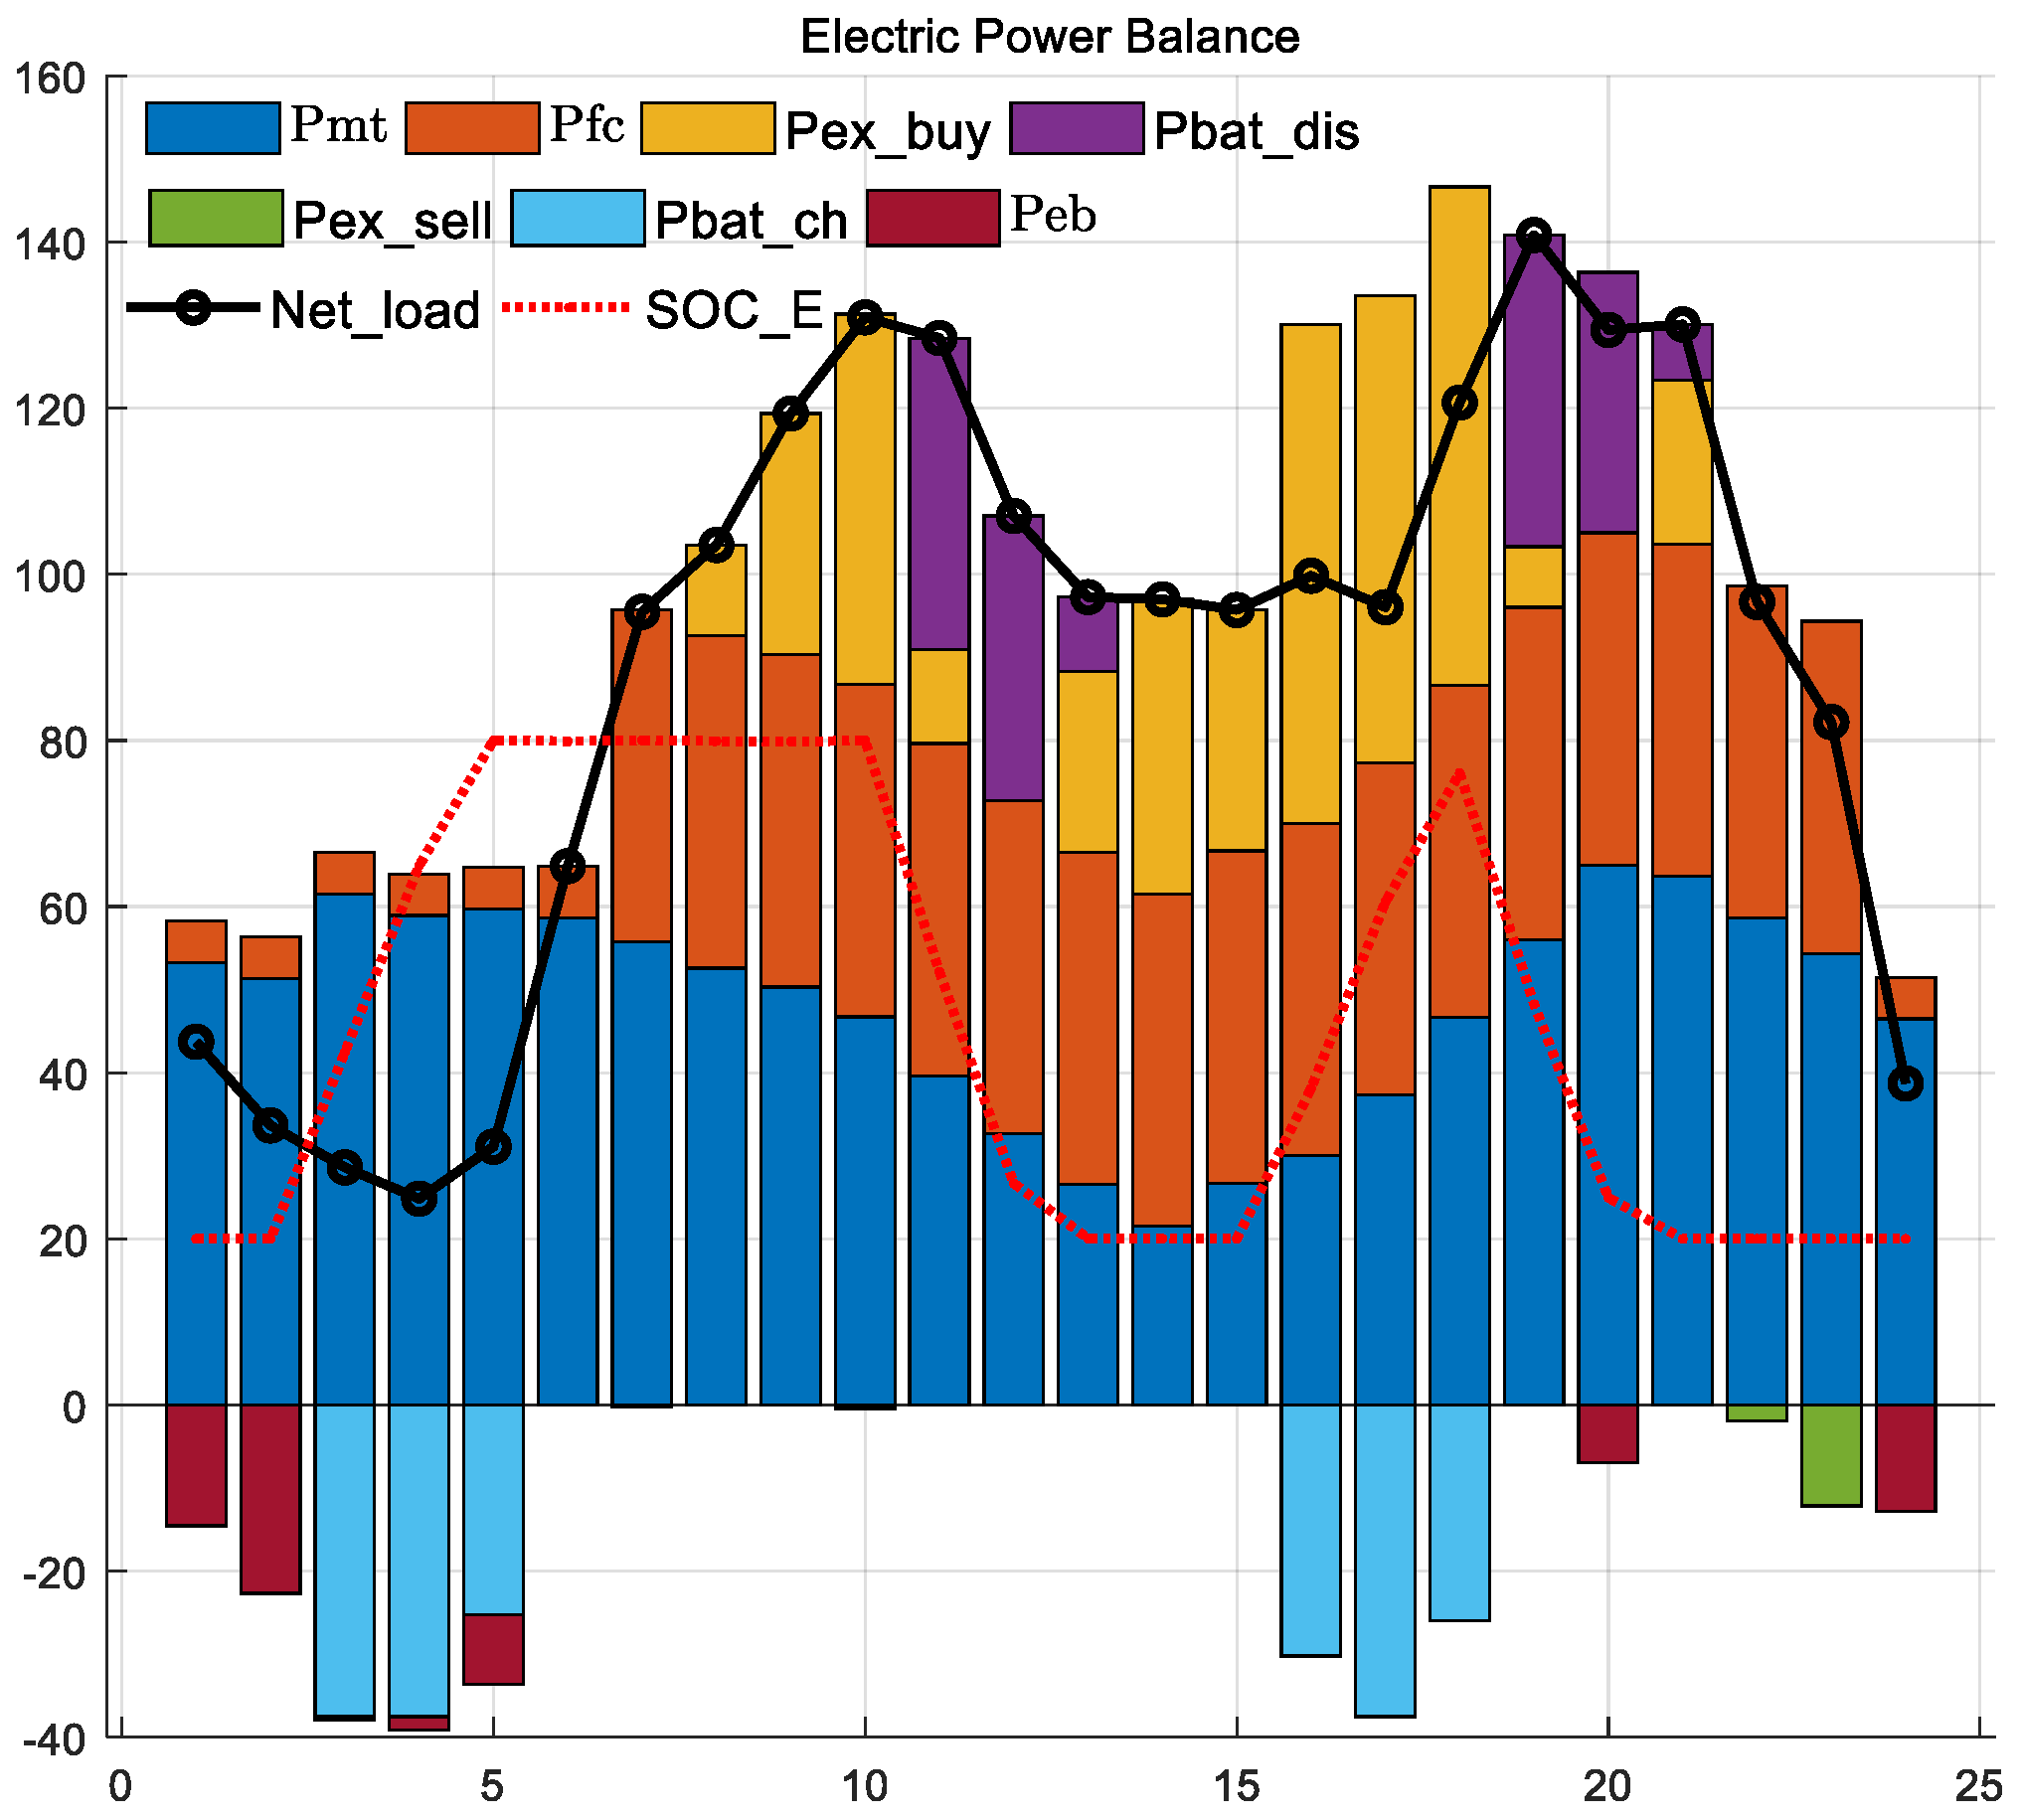
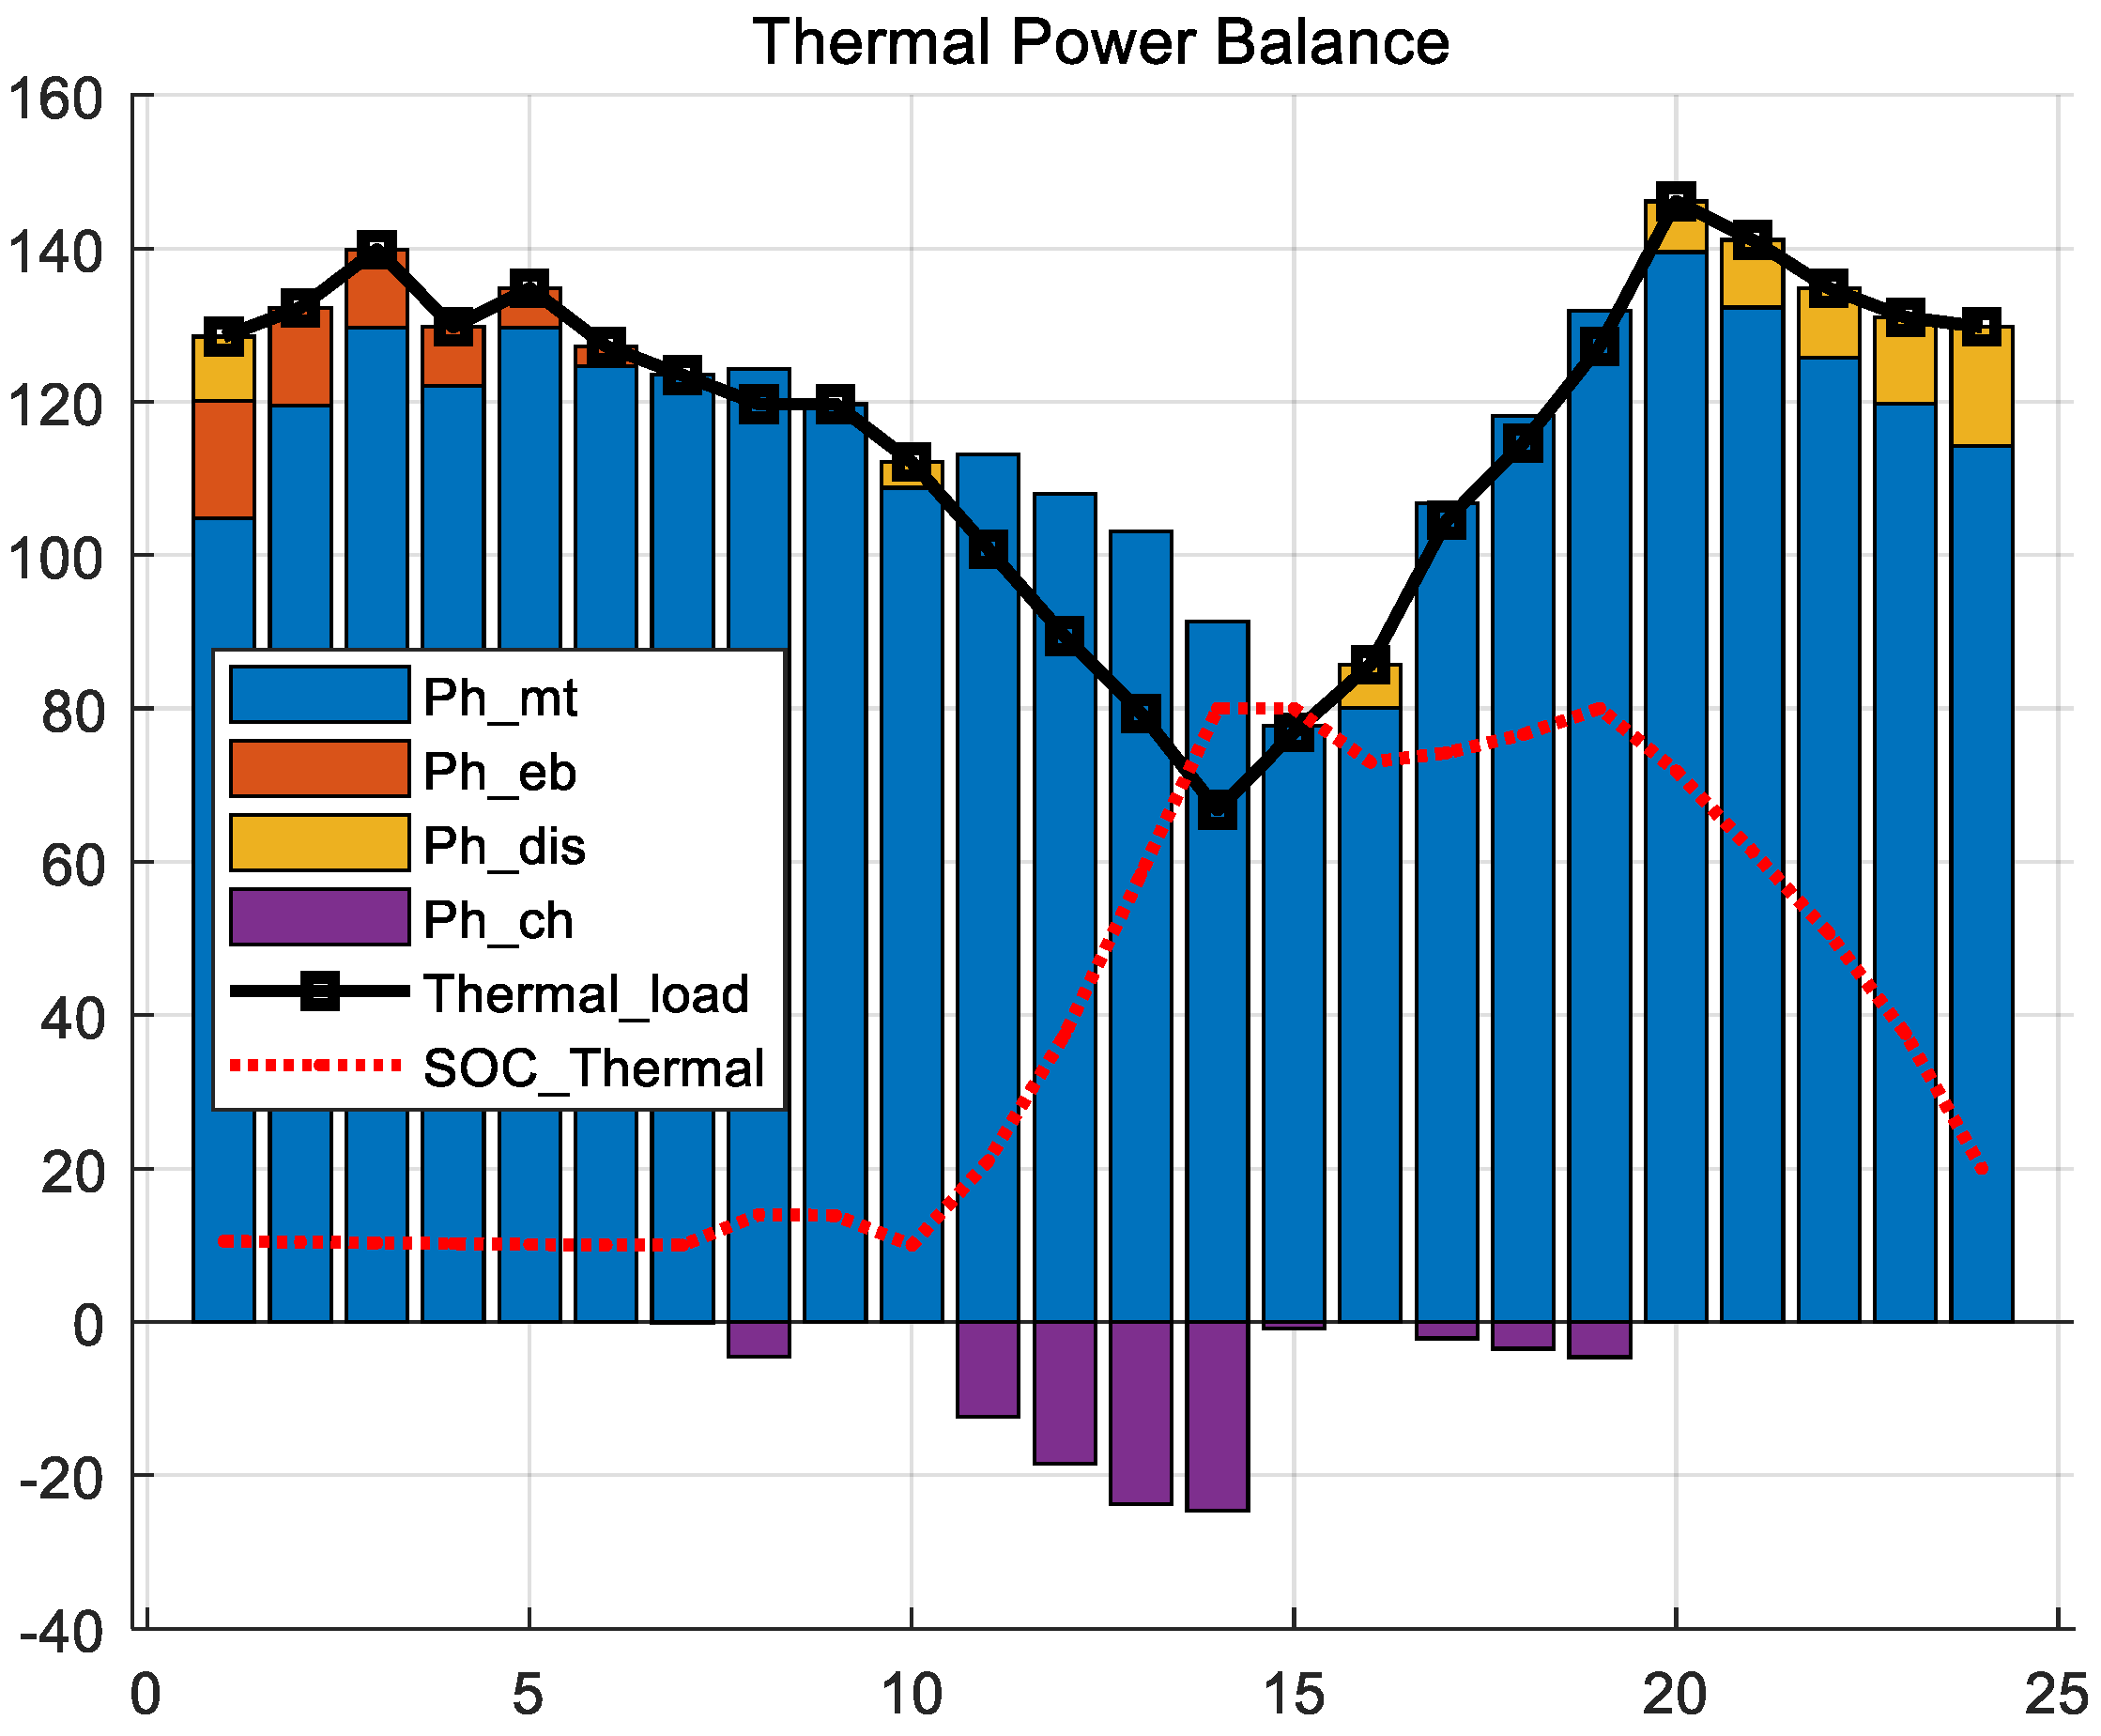
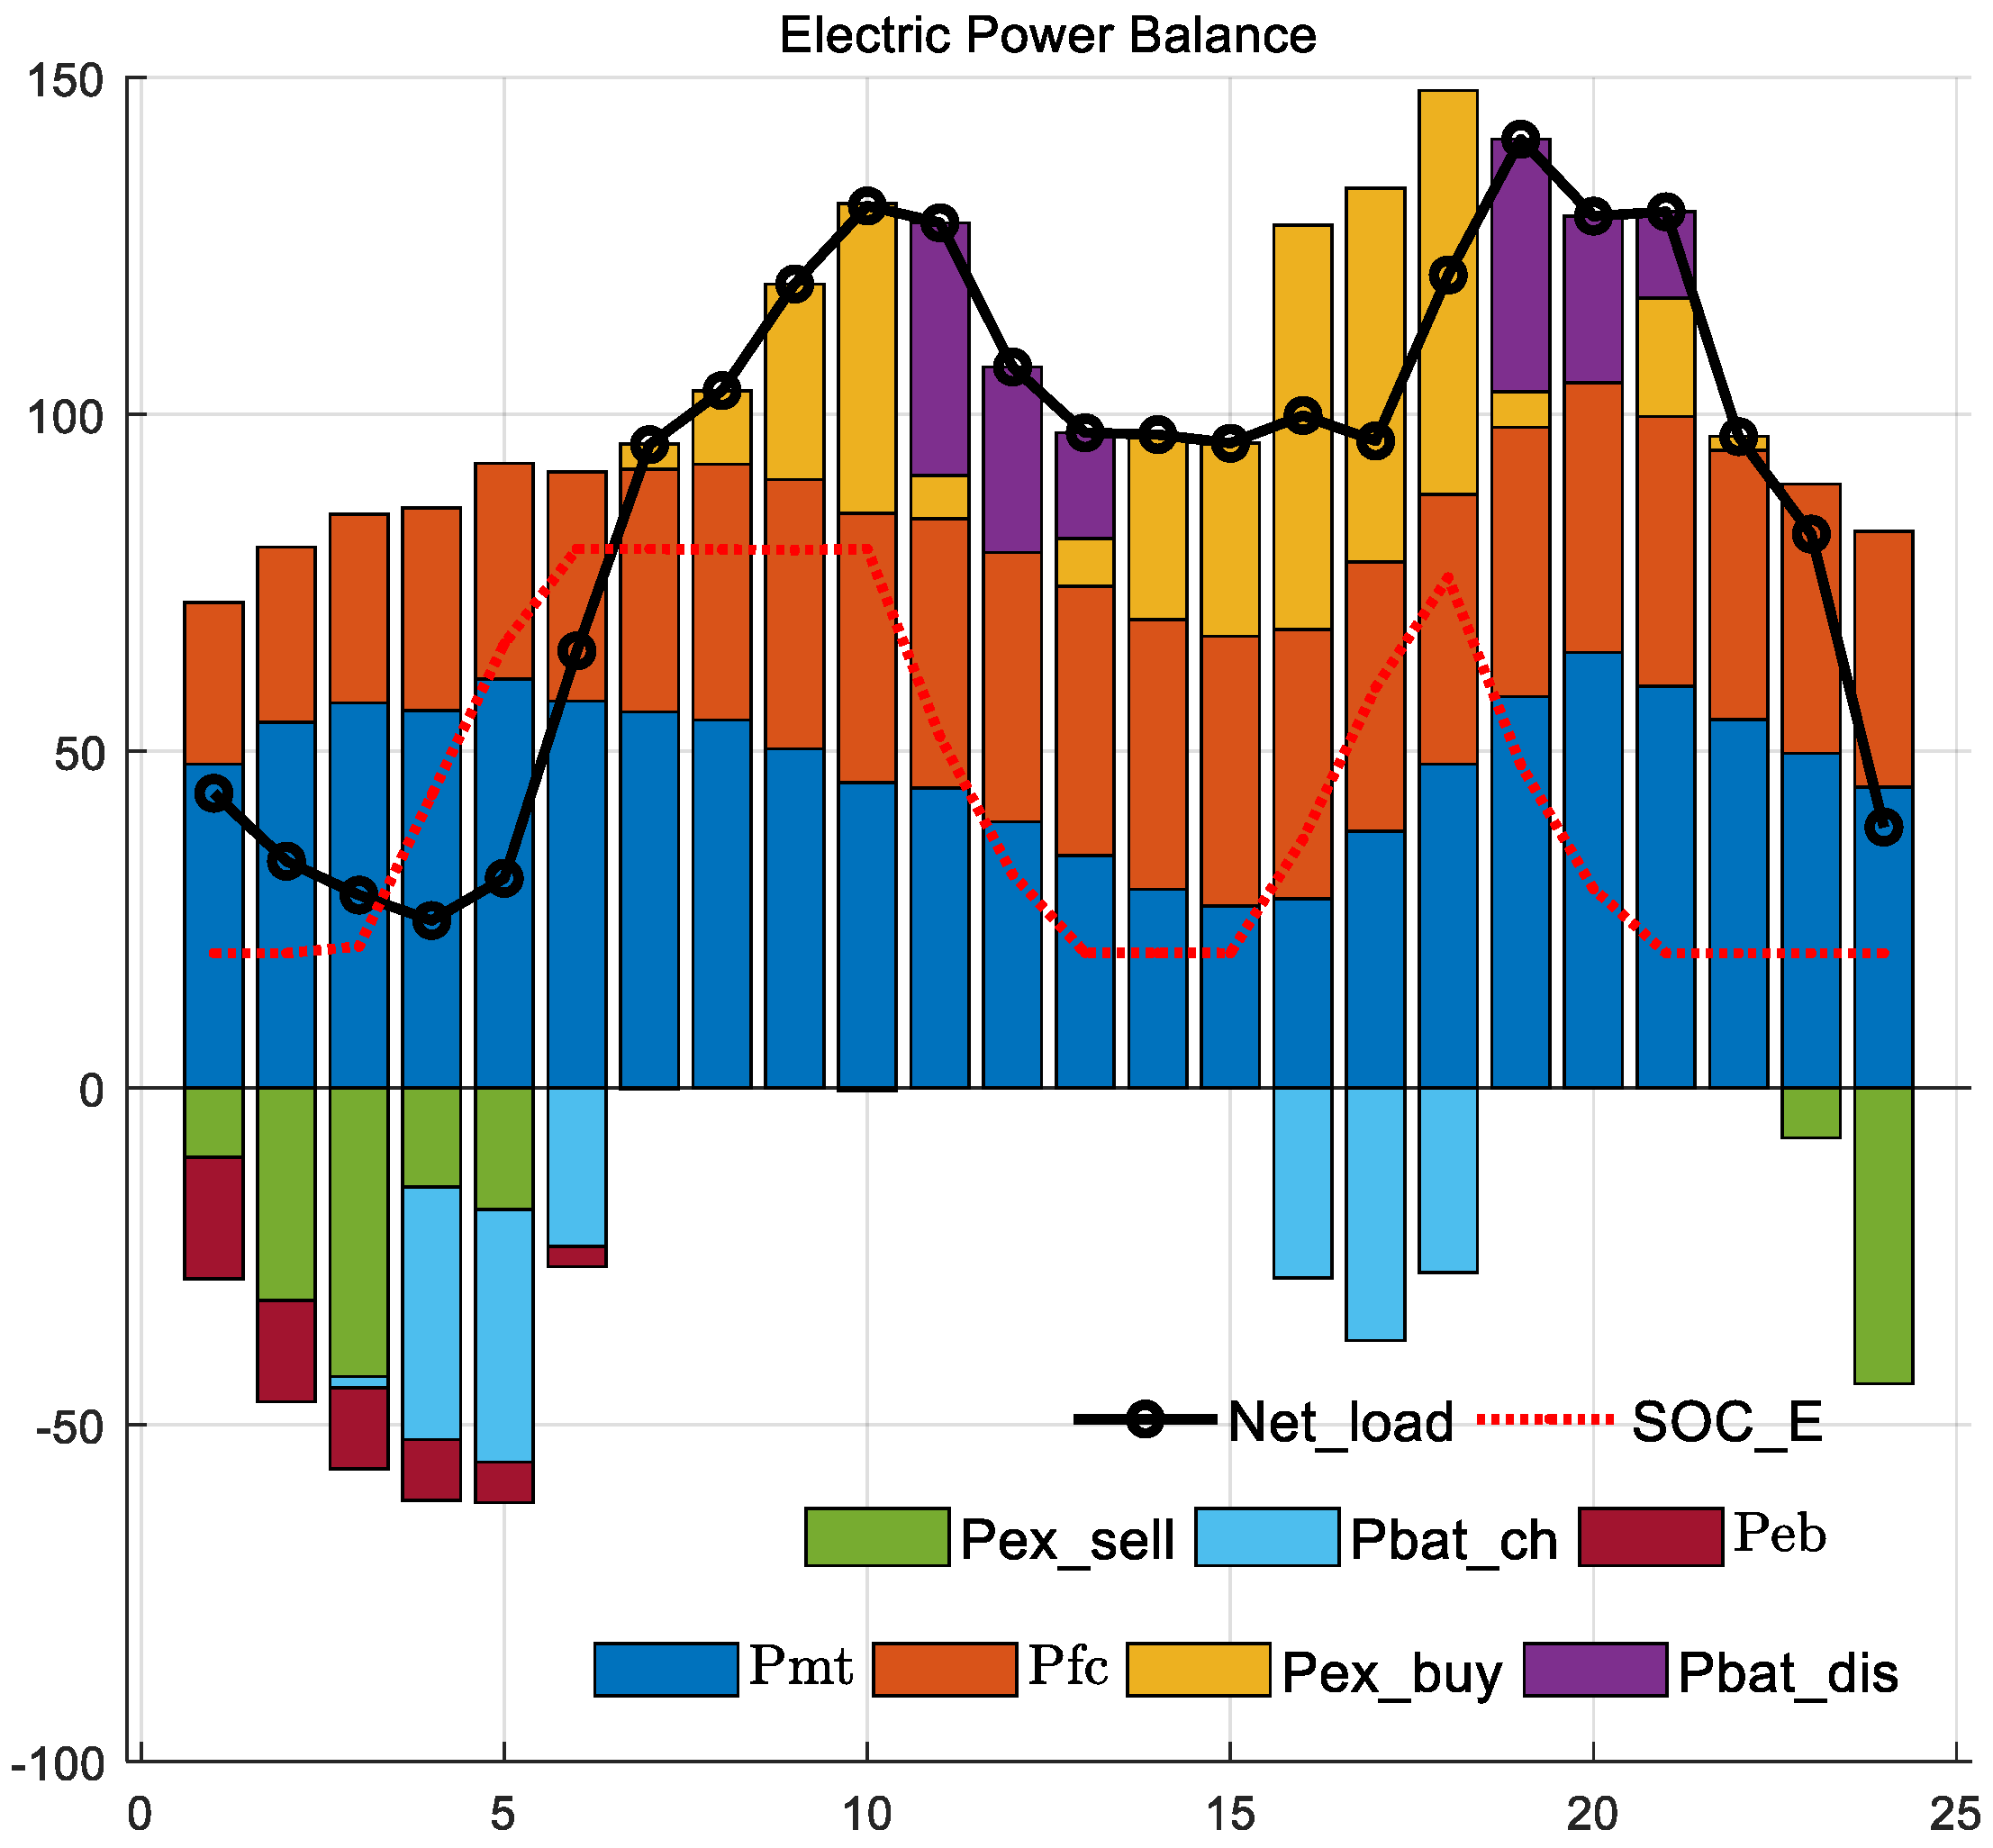
In Scheme 3, the cogeneration load is met by the cogeneration system, fuel cells, energy storage, electric boilers, and interactive power generation cost and operating constraints, with the addition of the integrated energy demand response. The thermal load dispatch results are consistent with the above strategy; the dispatch results from the electric load dispatch show that the electric power of the gas turbine and fuel cell is still relatively smooth; the excess power is stored in the battery, used for electric heat production, and sold to the grid. Through the demand response, the load curve is relatively smooth, less power is bought from the grid, and the battery releases relatively less power.
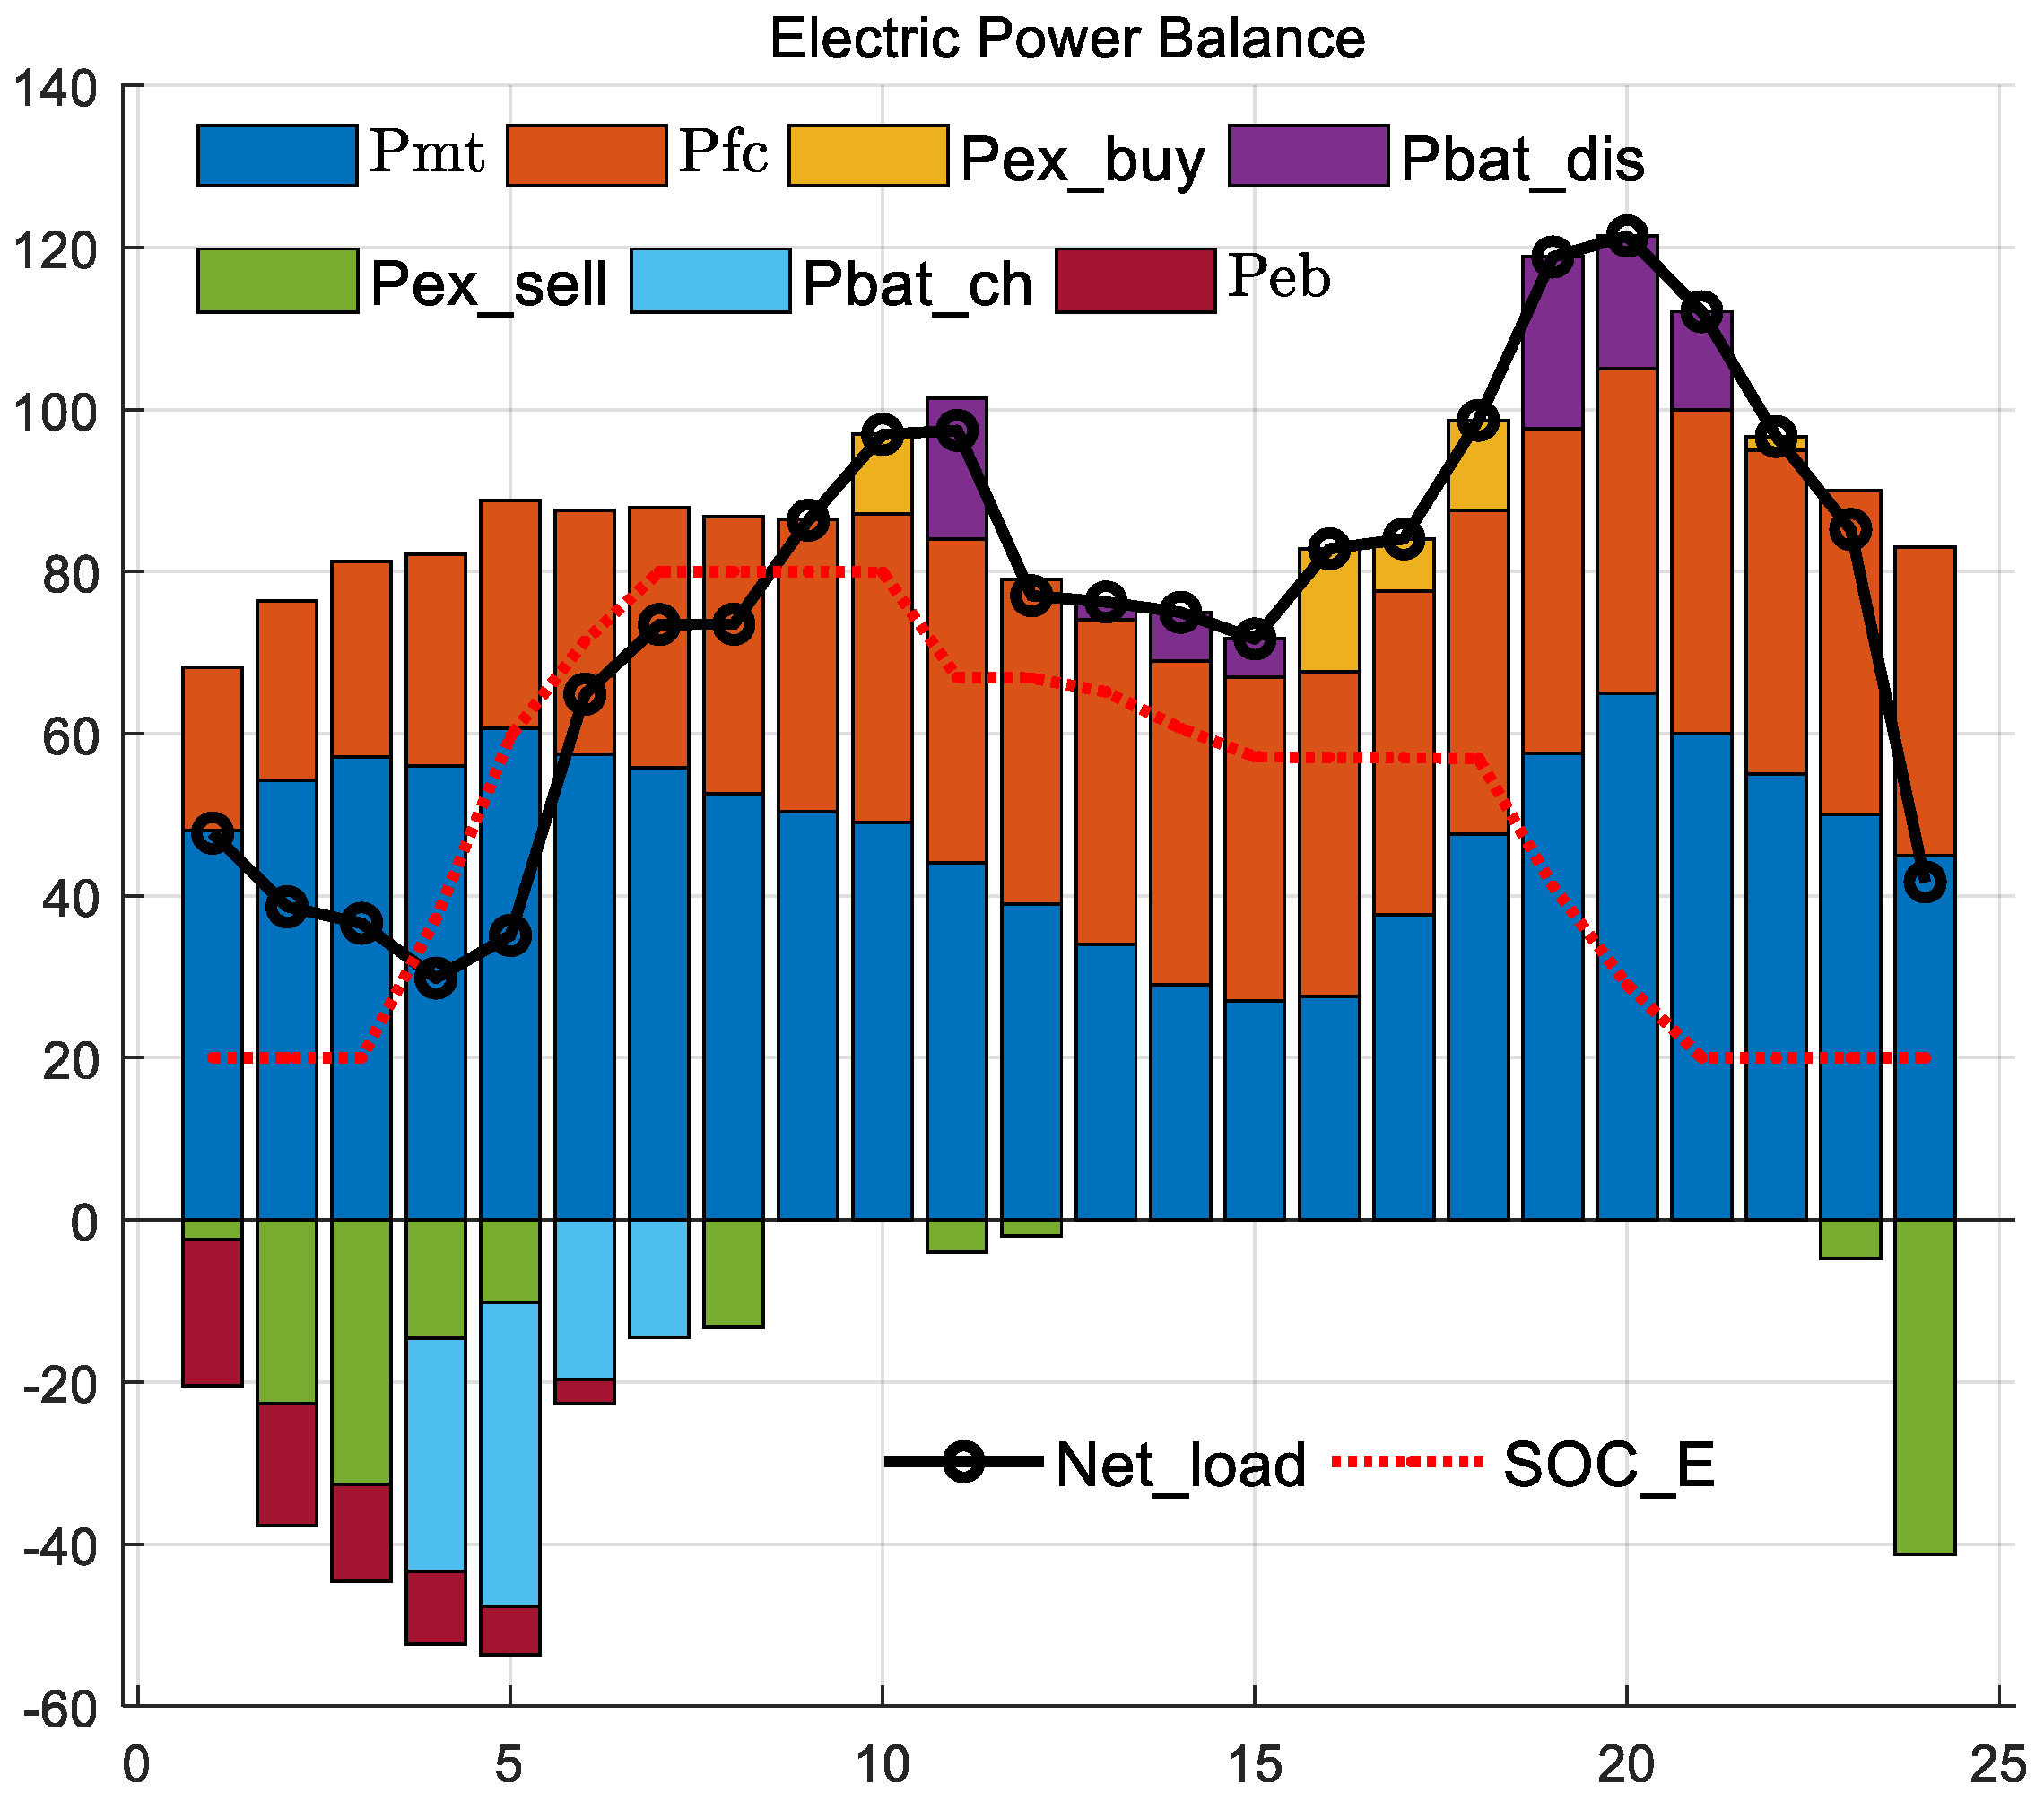
Figure 10 (named Scheme 3) depicts the particular thermal energy dispatch results, whereas Figure 11 (named Scheme 3) depicts the specific electrical energy dispatch results. The specific simulation results of this model are shown in Table 3 for six items.
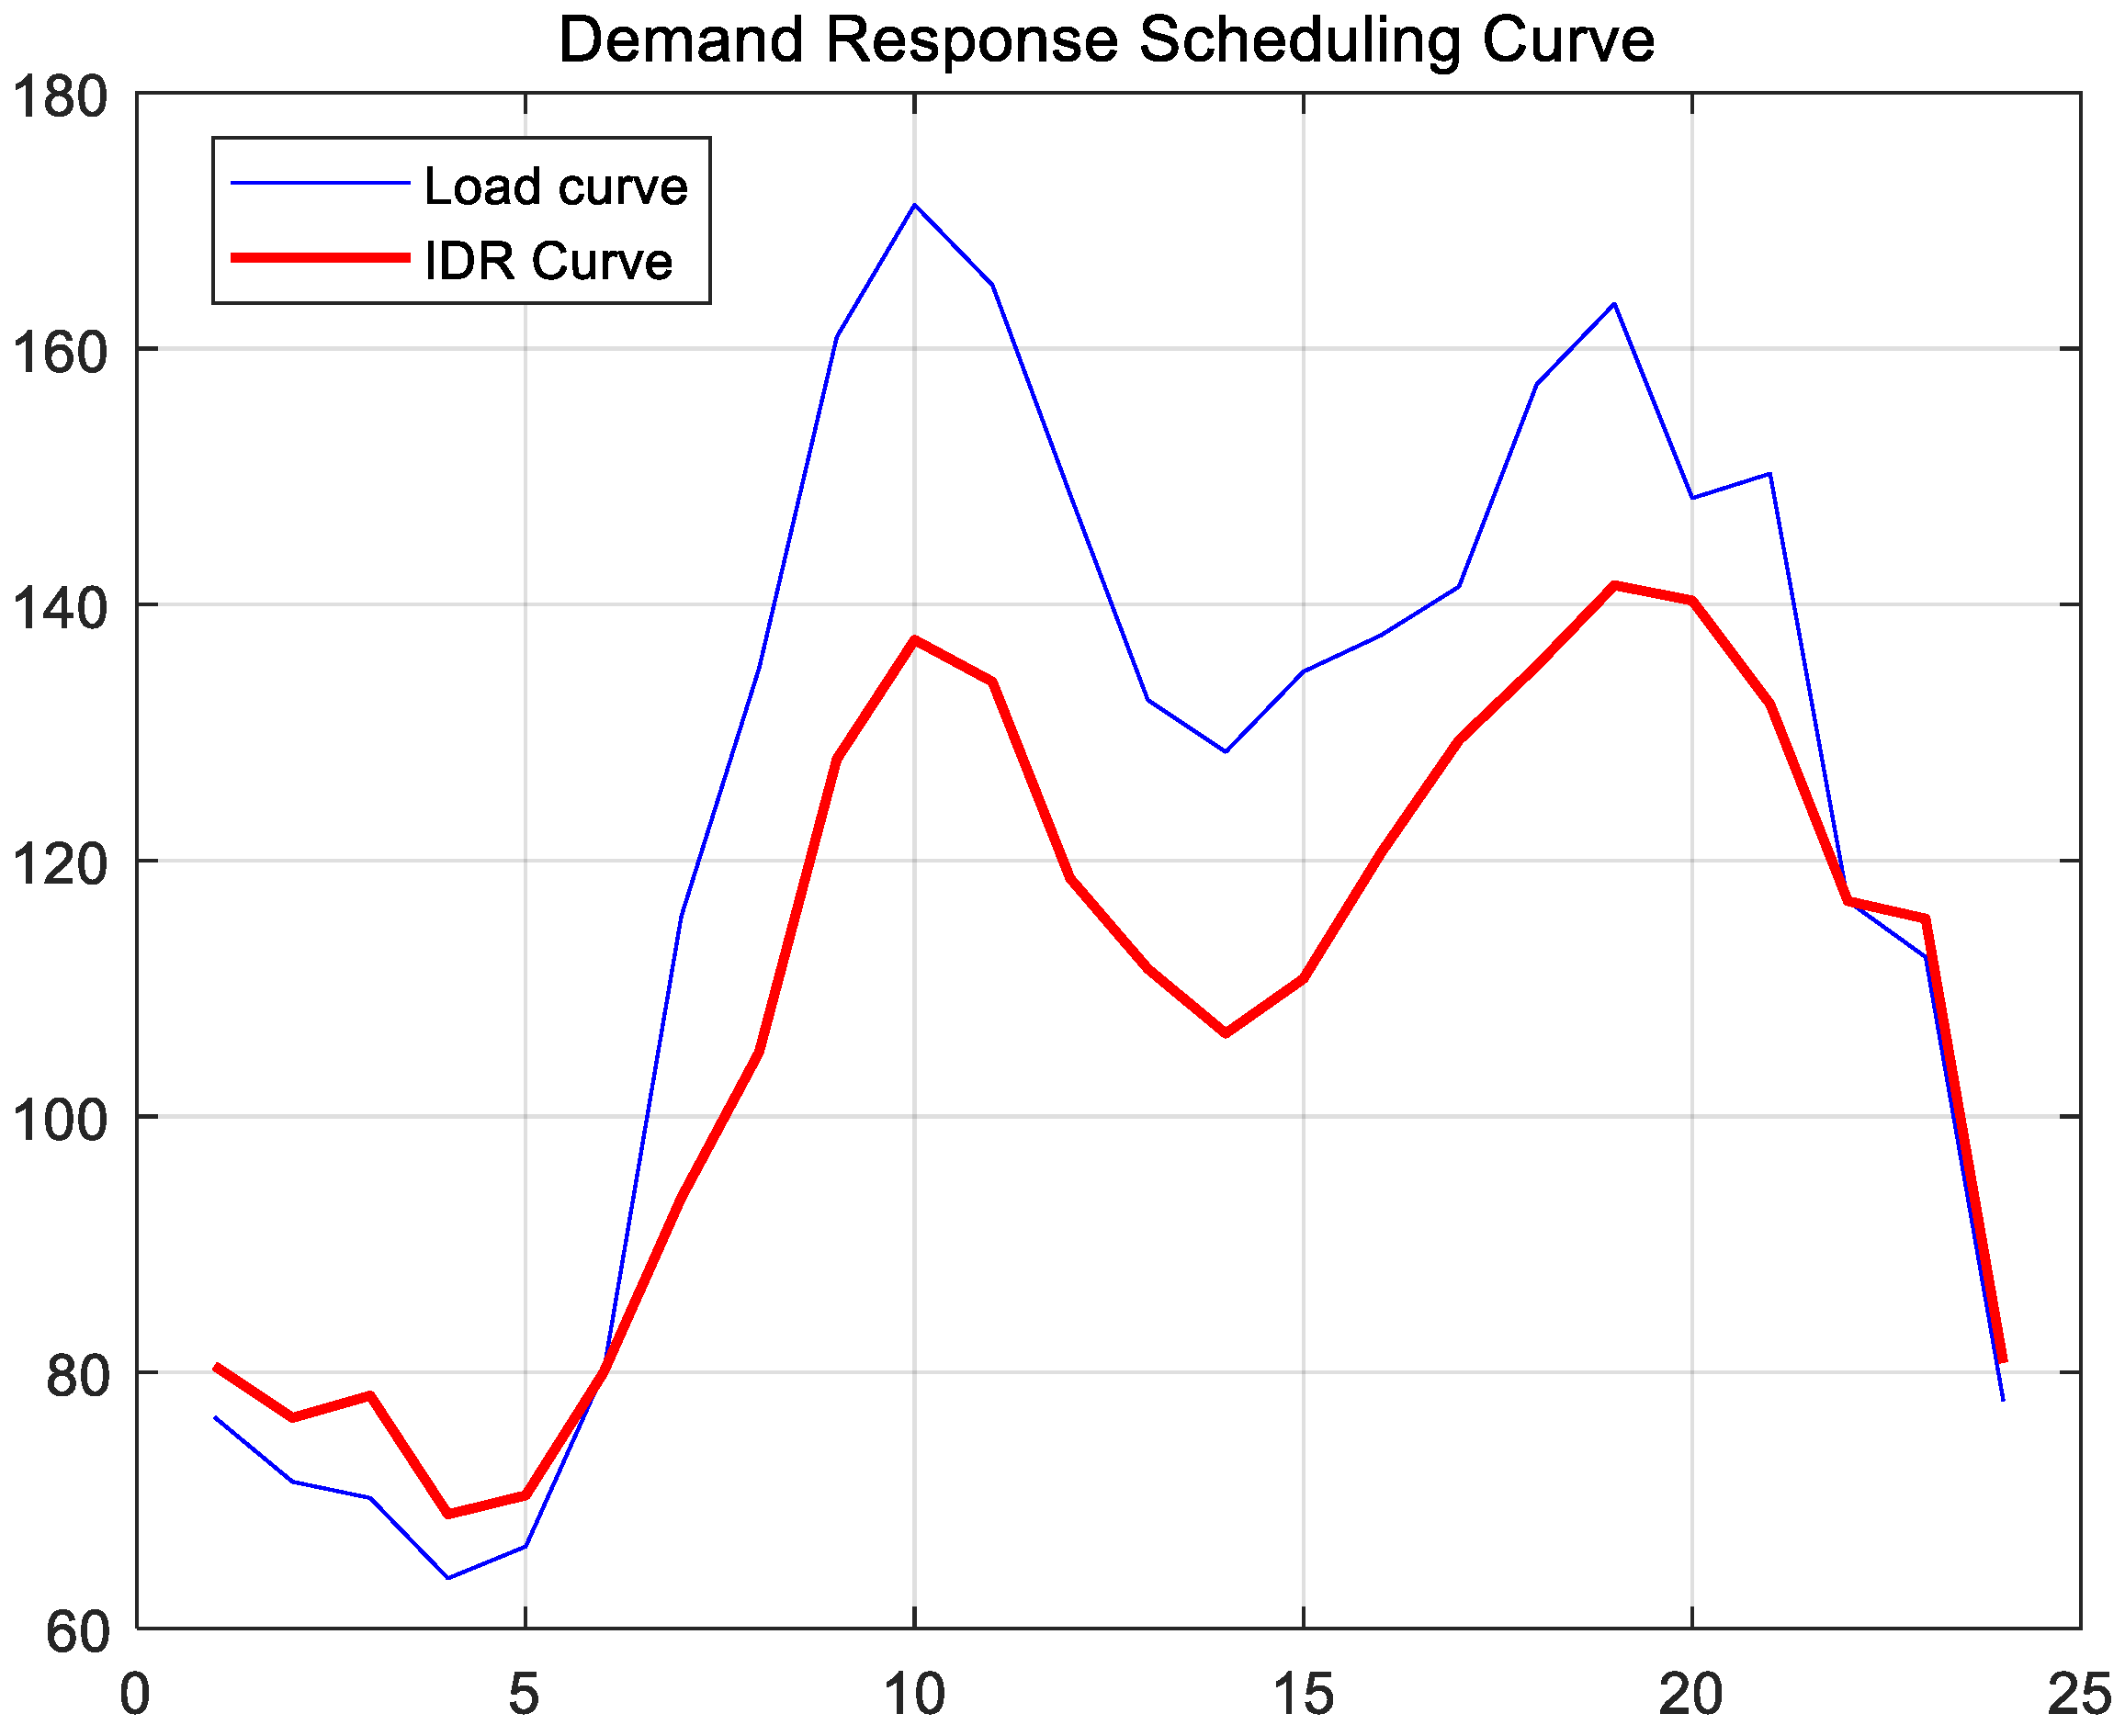
The results of demand response dispatch for integrated energy, compared with the original load, are shown in Figure 12.
5.5. Similarity of Three Schemes
Due to the low cost of fuel cell generation in power dispatch, the fuel cell is given priority to generate power when the electricity price is in the valley. When the purchased or sold power price is in normal or peak hours, the fuel cell takes the initiative to produce power, and the fuel cell generates full power to reduce the purchased power.
When micro-combustion engines are involved in power dispatch, they are only active when they meet the thermal operating constraints of the microgrid or when the cost of generation is lower than the price of electricity. Moreover, the electric and thermal power of the gas turbine maintains the same trend, and the generation power is influenced by the thermal power.
The SOC curve shows that the energy storage is charged and discharged under the guidance of the electricity price, charging during the valley hours and discharging during the peak hours, thus effectively reducing the peak-to-valley difference to a low level.
5.6. Comparison of Three Schemes
Compared to Scheme 3, Schemes 1 and 2 require the purchase of large amounts of electricity, while the addition of the integrated energy demand response makes the electricity supply fully self-sufficient and profitable. The integrated energy demand response smooths out the heat load somewhat, and cogeneration can be supported by lower-cost fuel cells and gas turbines, which in turn can lead to profitable electricity scenarios.
Compared with Schemes 1 and 2, without the thermal storage system, the fuel cell produces a large amount of power only at high electricity prices; it produces less power at low electricity prices, and fuel cells generate little electricity and are used for electric heating. With fuel cells’ low-cost power generation for heat production, the efficiency is very low; with thermal energy storage, the fuel cell can also maintain high-efficiency power generation in the valley hours.
5.7. Quantitative Comparison of Scheme 2 and Scheme 3
A comparison of the results of the integrated energy demand response without participation in dispatch and with participation in dispatch is shown in Table 3. Here, the “No IDR Scheme” is Scheme 2, and the “IDR Scheme” is Scheme 3.
Compared to Scheme 2, Scheme 3 achieves a 290.6 reduction in pass-through costs; a 12.2 reduction in gas costs; a 6.8 profit on electricity, equivalent to a 275.9 reduction in costs; a 1.3 reduction in maintenance costs; and the same revenue from the sales of thermal energy, for a combined energy demand response benefit of 346.1. The data validate the integrated energy demand response, which demonstrates excellent economic performance in all metrics.
6. Conclusions
The optimal operation model of CHP based on multi-energy complementarity is established in this paper for CHP with renewable distributed generation by decoupling thermoelectric connections through ESS so that the supply side can increase the energy supply capacity through conversion equipment; thus, users can change their energy consumption choices to improve the demand side’s ability to respond, and to provide optimization space for the thermal and electricity products. The following conclusions may be drawn from the analysis of the findings.
- Without thermal energy storage equipment and electric and thermal coupling, the system operates inefficiently and the power generation is affected by the heat generation efficiency constraint.
- Configuring thermal energy storage equipment decouples electric and thermal co-generation to a certain extent. The electric energy storage and thermal energy storage can realize the free power generation of different power generation units and the free heat generation of different heat generation units, respectively.
- The objective of this paper was to quantify and analyze the economics of a good integrated energy demand response. Through the results, it was found that via integrated energy control, all cost indicators were reduced, and the grid achieved a transformation from loss to profit; the reduction in each cost is also an indication of the reduction in equipment losses and the improvement in synergistic operation.
Funding
This research received no external funding.
Data Availability Statement
Not applicable.
Acknowledgments
The author acknowledges support from the Key Laboratory of Power System Intelligent Dispatch and Control, Ministry of Education, Shandong University.
Conflicts of Interest
The author declares no conflict of interest.
References
- Li, Z.; Xu, Y.; Fang, S.; Zheng, X.; Feng, X. Robust Coordination of a Hybrid AC/DC Multi-Energy Ship Microgrid with Flexible Voyage and Thermal Loads. IEEE Trans. Smart Grid 2020, 11, 2782–2793. [Google Scholar] [CrossRef]
- Li, Z.; Wu, L.; Xu, Y.; Zheng, X. Stochastic-Weighted Robust Optimization Based Bilayer Operation of a Multi-Energy Building Microgrid Considering Practical Thermal Loads and Battery Degradation. IEEE Trans. Sustain. Energy 2022, 13, 668–682. [Google Scholar] [CrossRef]
- Mansouri, S.A.; Ahmarinejad, A.; Nematbakhsh, E.; Javadi, M.S.; Jordehi, A.R.; Catalao, J.P.S. Energy Hub Design in the Presence of P2G System Considering the Variable Efficiencies of Gas-Fired Converters. In Proceedings of the 2021 International Conference on Smart Energy Systems and Technologies (SEST), Virtual Conference, 6–8 September 2021; IEEE: Piscataway, NJ, USA, 2021; pp. 1–6. [Google Scholar]
- Nasir, M.; Jordehi, A.R.; Tostado-Véliz, M.; Tabar, V.S.; Amir Mansouri, S.; Jurado, F. Operation of energy hubs with storage systems, solar, wind and biomass units connected to demand response aggregators. Sustain. Cities Soc. 2022, 83, 103974. [Google Scholar] [CrossRef]
- Wang, S.; Wang, S.; Zhao, Q.; Dong, S.; Li, H. Optimal dispatch of integrated energy station considering carbon capture and hydrogen demand. Energy 2023, 269, 126981. [Google Scholar] [CrossRef]
- Karimi, H.; Jadid, S. Multi-layer energy management of smart integrated-energy microgrid systems considering generation and demand-side flexibility. Appl. Energy 2023, 339, 120984. [Google Scholar] [CrossRef]
- Javadi, M.S.; Gough, M.; Mansouri, S.A.; Ahmarinejad, A.; Nematbakhsh, E.; Santos, S.F.; Catalão, J.P.S. A two-stage joint operation and planning model for sizing and siting of electrical energy storage devices considering demand response programs. Int. J. Electr. Power Energy Syst. 2022, 138, 107912. [Google Scholar] [CrossRef]
- Mansouri, S.A.; Ahmarinejad, A.; Ansarian, M.; Javadi, M.S.; Catalao, J.P.S. Stochastic planning and operation of energy hubs considering demand response programs using Benders decomposition approach. Int. J. Electr. Power Energy Syst. 2020, 120, 106030. [Google Scholar] [CrossRef]
- Mansouri, S.A.; Ahmarinejad, A.; Javadi, M.S.; Catalão, J.P.S. Two-stage stochastic framework for energy hubs planning considering demand response programs. Energy 2020, 206, 118124. [Google Scholar] [CrossRef]
- Sharma, S.; Verma, A.; Xu, Y.; Panigrahi, B.K. Robustly Coordinated Bi-Level Energy Management of a Multi-Energy Building Under Multiple Uncertainties. IEEE Trans. Sustain. Energy 2021, 12, 3–13. [Google Scholar] [CrossRef]
- Khatami, R.; Oikonomou, K.; Parvania, M. Look-Ahead Optimal Participation of Compressed Air Energy Storage in Day-Ahead and Real-Time Markets. IEEE Trans. Sustain. Energy 2020, 11, 682–692. [Google Scholar] [CrossRef]
- Habibi, M.; Vahidinasab, V.; Mohammadi-Ivatloo, B.; Aghaei, J.; Taylor, P. Exploring Potential Gains of Mobile Sector-Coupling Energy Systems in Heavily Constrained Networks. IEEE Trans. Sustain. Energy 2022, 13, 2092–2105. [Google Scholar] [CrossRef]
- Mansouri, S.A.; Nematbakhsh, E.; Ahmarinejad, A.; Jordehi, A.R.; Javadi, M.S.; Matin, S.A.A. A Multi-objective dynamic framework for design of energy hub by considering energy storage system, power-to-gas technology and integrated demand response program. J. Energy Storage 2022, 50, 104206. [Google Scholar] [CrossRef]
- Yang, J.; Xu, W.; Ma, K.; Li, C. A Three-Stage Multi-Energy Trading Strategy Based on P2P Trading Mode. IEEE Trans. Sustain. Energy 2023, 14, 233–241. [Google Scholar] [CrossRef]
- Shariat Torbaghan, S.; Madani, M.; Sels, P.; Virag, A.; Le Cadre, H.; Kessels, K.; Mou, Y. Designing day-ahead multi-carrier markets for flexibility: Models and clearing algorithms. Appl. Energy 2021, 285, 116390. [Google Scholar] [CrossRef]
- Zhang, K.; Zhou, B.; Or, S.W.; Li, C.; Chung, C.Y.; Voropai, N. Optimal Coordinated Control of Multi-Renewable-to-Hydrogen Production System for Hydrogen Fueling Stations. IEEE Trans. Ind. Appl. 2022, 58, 2728–2739. [Google Scholar] [CrossRef]
- Wang, X.; Huang, W.; Wei, W.; Tai, N.; Li, R.; Huang, Y. Day-Ahead Optimal Economic Dispatching of Integrated Port Energy Systems Considering Hydrogen. IEEE Trans. Ind. Appl. 2022, 58, 2619–2629. [Google Scholar] [CrossRef]
- Zhang, J.; Sun, K.; Li, C.; Liu, H.; Huang, W.; Zhou, B.; Hou, X. Economic Scheduling of Gaseous-liquid Hydrogen Generation and Storage Plants Considering Complementarity of Multiple Products. J. Mod. Power Syst. Clean Energy 2023, 11, 223–233. [Google Scholar] [CrossRef]
- Jamali, A.; Aghaei, J.; Esmaili, M.; Nikoobakht, A.; Niknam, T.; Shafie-khah, M.; Catalao, J.P.S. Self-Scheduling Approach to Coordinating Wind Power Producers with Energy Storage and Demand Response. IEEE Trans. Sustain. Energy 2020, 11, 1210–1219. [Google Scholar] [CrossRef] [Green Version]
- Bitaraf, H.; Rahman, S. Reducing Curtailed Wind Energy through Energy Storage and Demand Response. IEEE Trans. Sustain. Energy 2018, 9, 228–236. [Google Scholar] [CrossRef]
- Mansouri, S.A.; Ahmarinejad, A.; Sheidaei, F.; Javadi, M.S.; Rezaee Jordehi, A.; Esmaeel Nezhad, A.; Catalão, J.P.S. A multi-stage joint planning and operation model for energy hubs considering integrated demand response programs. Int. J. Electr. Power Energy Syst. 2022, 140, 108103. [Google Scholar] [CrossRef]
- Zheng, S.; Sun, Y.; Li, B.; Qi, B.; Shi, K.; Li, Y.; Tu, X. Incentive-Based Integrated Demand Response for Multiple Energy Carriers Considering Behavioral Coupling Effect of Consumers. IEEE Trans. Smart Grid 2020, 11, 3231–3245. [Google Scholar] [CrossRef]
- Honarmand, H.A.; Ghaderi Shamim, A.; Meyar-Naimi, H. A robust optimization framework for energy hub operation considering different time resolutions: A real case study. Sustain. Energy Grids Netw. 2021, 28, 100526. [Google Scholar] [CrossRef]
- Honarmand, H.A.; Rashid, S.M. A sustainable framework for long-term planning of the smart energy hub in the presence of renewable energy sources, energy storage systems and demand response program. J. Energy Storage 2022, 52, 105009. [Google Scholar] [CrossRef]
- Manshadi, S.D.; Khodayar, M.E. Coordinated Operation of Electricity and Natural Gas Systems: A Convex Relaxation Approach. IEEE Trans. Smart Grid 2019, 10, 3342–3354. [Google Scholar] [CrossRef]
- Belderbos, A.; Valkaert, T.; Bruninx, K.; Delarue, E.; D’haeseleer, W. Facilitating renewables and power-to-gas via integrated electrical power-gas system scheduling. Appl. Energy 2020, 275, 115082. [Google Scholar] [CrossRef]
- Lasemi, M.A.; Arabkoohsar, A.; Hajizadeh, A.; Mohammadi-Ivatloo, B. A comprehensive review on optimization challenges of smart energy hubs under uncertainty factors. Renew. Sustain. Energy Rev. 2022, 160, 112320. [Google Scholar] [CrossRef]
- Li, Z.; Wu, L.; Xu, Y.; Wang, L.; Yang, N. Distributed tri-layer risk-averse stochastic game approach for energy trading among multi-energy microgrids. Appl. Energy 2023, 331, 120282. [Google Scholar] [CrossRef]
- Li, Z.; Xu, Y.; Wang, P.; Xiao, G. Coordinated preparation and recovery of a post-disaster Multi-energy distribution system considering thermal inertia and diverse uncertainties. Appl. Energy 2023, 336, 120736. [Google Scholar] [CrossRef]
- Yao, W.; Wang, C.; Yang, M.; Wang, K.; Dong, X.; Zhang, Z. A tri-layer decision-making framework for IES considering the interaction of integrated demand response and multi-energy market clearing. Appl. Energy 2023, 342, 121196. [Google Scholar] [CrossRef]
- Li, K.; Ye, N.; Li, S.; Wang, H.; Zhang, C. Distributed collaborative operation strategies in multi-agent integrated energy system considering integrated demand response based on game theory. Energy 2023, 273, 127137. [Google Scholar] [CrossRef]
- Shan, C.; Zhaobin, W.; Tianli, H.; Chang, H.E.; Mengyu, Z. Multi-energy complementation based optimal operation of a microgrid with combined heat and power. Power Syst. Prot. Control 2020, 48, 160–168. [Google Scholar]
- Li, Z.; Zhang, F.; Liang, J.; Yun, Z.; Zhang, J. Optimization on Microgrid with Combined Heat and Power System. Proc. CSEE 2015, 35, 3569–3576. [Google Scholar]
- Sperstad, I.; Korpås, M. Energy Storage Scheduling in Distribution Systems Considering Wind and Photovoltaic Generation Uncertainties. Energies 2019, 12, 1231. [Google Scholar] [CrossRef] [Green Version]
- Carli, R.; Cavone, G.; Pippia, T.; De Schutter, B.; Dotoli, M. Robust Optimal Control for Demand Side Management of Multi-Carrier Microgrids. IEEE Trans. Autom. Sci. Eng. 2022, 19, 1338–1351. [Google Scholar] [CrossRef]
Figure 1.
Integrated energy system.

Figure 2.
Methodology flow diagram.

Figure 3.
Algorithm steps.

Figure 4.
Photovoltaic and wind power output.

Figure 5.
Thermal and electricity load.

Figure 6.
Thermal load scheduling results.

Figure 7.
Electricity load scheduling results.

Figure 8.
Thermal load scheduling results.

Figure 9.
Electricity load scheduling results.

Figure 10.
Thermal load scheduling results.

Figure 11.
Electricity load scheduling results.

Figure 12.
Integrated energy demand response dispatch results.


Table 1.
Energy storage parameters.
| Type | ||||
|---|---|---|---|---|
| EES | 0.9 | 0.2 | 0.8 | 30 |
| TES | 0.9 | 0.2 | 0.8 | 0 |
Table 2.
Time-of-use tariffs.
| Period | Buy from Grid | Sell to Grid | |
|---|---|---|---|
| Peak | 10:00–15:00 | 1.15 | 0.90 |
| 18:00–21:00 | |||
| Flat | 07:00–10:00 | 0.75 | 0.55 |
| 15:00–18:00 | |||
| 21:00–23:00 | |||
| Valley | 23:00–07:00 | 0.40 | 0.20 |
Table 3.
Comparison of two schemes.
| Cost | No IDR Scheme | IDR Scheme |
|---|---|---|
| Total cost | 1163.9 | 873.3 |
| Gas cost | 1102.9 | 1090.7 |
| Grid cost | 269.1 | −6.8 |
| Maintenance cost | 71.6 | 70.3 |
| Thermal revenue | 279.5 | 279.5 |
| IDR revenue | ---- | 346.1 |
Disclaimer/Publisher’s Note: The statements, opinions and data contained in all publications are solely those of the individual author(s) and contributor(s) and not of MDPI and/or the editor(s). MDPI and/or the editor(s) disclaim responsibility for any injury to people or property resulting from any ideas, methods, instructions or products referred to in the content. |
© 2023 by the author. Licensee MDPI, Basel, Switzerland. This article is an open access article distributed under the terms and conditions of the Creative Commons Attribution (CC BY) license (https://creativecommons.org/licenses/by/4.0/).
Share and Cite
MDPI and ACS Style
Wang, L. Optimal Scheduling Strategy for Multi-Energy Microgrid Considering Integrated Demand Response. Energies 2023, 16, 4694. https://doi.org/10.3390/en16124694
AMA Style
Wang L. Optimal Scheduling Strategy for Multi-Energy Microgrid Considering Integrated Demand Response. Energies. 2023; 16(12):4694. https://doi.org/10.3390/en16124694
Chicago/Turabian StyleWang, Long. 2023. "Optimal Scheduling Strategy for Multi-Energy Microgrid Considering Integrated Demand Response" Energies 16, no. 12: 4694. https://doi.org/10.3390/en16124694
Note that from the first issue of 2016, this journal uses article numbers instead of page numbers. See further details here.