1. Introduction
LNG is a colorless liquid in its liquid state. The main components are usually methane, ethane, propane, butane, pentane, and nitrogen, and its density is about 45% of that of water. Once a LNG leakage accident occurs, a small amount of liquid can produce a large amount of gas. In general, its volume is about 1/625 of the volume of the same amount of gaseous natural gas. The vaporized gas first flows along the surface of the ground until it has been heated up from the atmosphere. When the temperature of pure methane rises to −113 °C, or the temperature of LNG rises to −80 °C, it will be less dense than the surrounding air, causing the mixture to move upward. Subsequently, there will be fog clouds due to the condensation of water vapor in the atmosphere.
LNG bunker vessels provide an important means of fueling LNG-powered vessels and promote the use of clean fuels for vessels, which is vital in achieving the strategic goal of carbon neutrality and carbon peaking [
1]. As fuel carriers for marine LNG, bunker vessels share many characteristics of ordinary LNG carriers. However, the nature of their work means that they are subject to frequent LNG cargo operations and travel through heavily trafficked waters (e.g., anchorages, ports), making them subject to greater risks than ordinary LNG carriers. In the event of a spill from an LNG bunker vessel, serious damage to the ship’s personnel, hull, equipment, and facilities will occur. According to incomplete statistics, LNG bunker vessels are responsible for relatively few casualties, accounting for about 8% of total marine accidents compared with 16% for liquid cargo tanks. However, various accidents on LNG bunker vessels account for up to 30% of equipment or system damage and 38% of damage to hull structures [
2].
Various studies have examined the consequences of LNG spill accidents [
3,
4,
5]. For example, Pareek [
6] carried out dynamic simulations of the hazard consequences of LNG vessel-to-vessel refueling and studied the diffusion behavior of combustible vapor clouds and fire radiation hazards depending on the leakage location. Lehr and Simecek-Beatty [
7] carried out a comparative analysis of LNG spill fires and crude oil spill fires and performed a quantitative risk assessment of several aspects of such accidents. Shi [
8] used fault tree analysis to conduct a risk analysis of the loading and unloading process of CNG carriers. Based on the design principles and expected functions of the risk index of CNG carriers, a mathematical model was established according to risk evaluation theory and index theory. Meanwhile, a method for determining the model weights was proposed. Jiao et al. [
9] analyzed the consequences and risks of LNG storage tank leakages considering wind speed, surface roughness, leakage rate, and other factors, and identified the relevant hazard areas. Xu et al. [
10] performed numerical simulations of LNG leaks from LNG filling barges by establishing a simplified point source model and a solid flame model. An ignition source near the liquid pool in a 1.0 m × l.0 m × 0.6 m liquid collection tray was selected as the initial scenario. In addition, the hazard distance formed by igniting the liquid pool was investigated. However, to date, no quantitative analysis of the consequences of typical high-risk scenarios during the simultaneous operation of LNG refueling barges has been reported.
This paper investigates the leakage consequences during the simultaneous operation of an LNG bunker vessel and a container carrier. Based on the FLACS software, we quantified the spread of combustible vapor clouds under typical high-risk scenarios such as hose ruptures and leakages at valve joints, both under ballast and laden conditions of the container carrier. The results provide important technical guidance and reference values for the safe simultaneous operation of LNG bunker vessels.
2. Numerical Calculation Model
2.1. Governing Equations
The diffusion process of a combustible gas leakage should satisfy the equations of mass conservation, momentum conservation, energy conservation, and chemical component balance. The partial differential form of each conservation equation can be expressed by the following equation [
11,
12,
13]:
where
φ is the generic solution variable, namely the mass, momentum, energy, or chemical components;
ρ is the gas density, kg/m
3;
t is time, s;
uj is the velocity vector in the
j direction, m/s;
xj is the length coordinate in the
j direction, m; Γ
φ is the diffusion coefficient;
Sφ is the source term.
Turbulence has an important influence on the diffusion process of a gas leakage. The high accuracy and small cost of the
k-ε model makes it sufficient for most engineering needs. Thus, the standard
k-ε model is often used to describe turbulence in the diffusion process through the following expressions [
14,
15,
16]:
where
k is the turbulent kinetic energy, m
2/s
2;
ε is the turbulent dissipation rate, m
2/s
3;
βv is the bulk porosity;
βj is the surface porosity in the
j direction;
μeff is the effective viscosity of the fluid, Pa·s;
Pk is the generation term of the turbulent kinetic energy, N;
Pε is the generation term of the turbulent dissipation rate, N;
σk and
σε are the Prandtl–Schmidt numbers;
C2 = 1.92 is the model constant.
2.2. Leakage Model
2.2.1. Gas-Phase Leakage
The leakage flow rate depends on the flow state of the gas in the pipeline. The critical pressure ratio (CPR) is introduced to describe the flow state of the gas at the leakage point [
17]:
When the gas pressure in the pipeline is less than the critical pressure, the combustible gas leak forms a subsonic flow, and then the leak flow rate is as follows [
17]:
When the gas pressure in the pipeline is greater than the critical pressure, the combustible gas leak forms a supersonic flow, and then the leak flow rate is as follows [
17]:
where
Q is the mass flow rate, kg/s;
A is the area of the leakage port, m
2;
P1 is the leakage pressure, Pa;
P2 is the ambient pressure, Pa;
r is the gas adiabatic index;
M is the molar mass of gas, g/mol;
R = 8314 is the gas constant, J/(kmol·K);
T is the pipe gas temperature, K;
C0 is the leakage port diffusion coefficient.
2.2.2. Liquid-Phase Leakage
When the energy required for flash evaporation is less than the heat of evaporation of the liquid, the leaking liquid will not flash. Thus, the instantaneous leakage is as follows [
18]:
where
Q is the mass flow rate, kg/s;
A is the area of the leakage port, m
2;
ρ is the liquid density, kg/m
3;
P0 is the ambient pressure, Pa;
g is the gravitational acceleration;
hL is the distance between the leak and the liquid level, m;
C0 is the leakage port diffusion coefficient.
For volatile liquids, the mass flow rate of evaporation in the liquid pool is expressed as follows [
18]:
where
Q is the mass flow rate, kg/s;
K is the mass transfer coefficient,
M is the molar mass of liquid, g/mol;
Psat is the saturated vapor pressure of the liquid, Pa;
R is the gas constant, J/(kmol·K);
TL is the liquid temperature, K.
2.3. Diffusion Model
The diffusive motion of the liquid pool is based on the two-dimensional shallow-water equation, which is expressed as follows [
19,
20,
21]:
Under the conservation of momentum, Equation (7) becomes
where,
The friction factor for laminar flow is as follows:
For turbulent flow, the friction factor is determined by the following equations:
For cryogenic liquids (e.g., liquid nitrogen and LNG), where there is an exchange of heat and mass, the ground heat transfer is usually controlled by the following equation:
The evaporative heat transfer equation is
and the convective heat transfer equation is
where
In the event of exposure to sunlight, the ambient heat transfer is expressed as
and the mass lost due to evaporation is determined by
where
εg is the ground roughness;
λg is the ground thermal conductivity;
αg is the ground thermal diffusion coefficient;
tgw is the time from the start of leakage of the liquid to contact with the ground;
ω is the albedo;
εg and
εp are the emission coefficients of the surrounding gas and liquid pool, respectively;
σ is the Stefan–Boltzmann constant.
2.4. Physical and Computational Models
The main parameters of an 8500 m
3 LNG bunker vessel are detailed in
Table 1 and the main scale parameters of 14,800 TEU series dual-fuel container carriers are displayed in
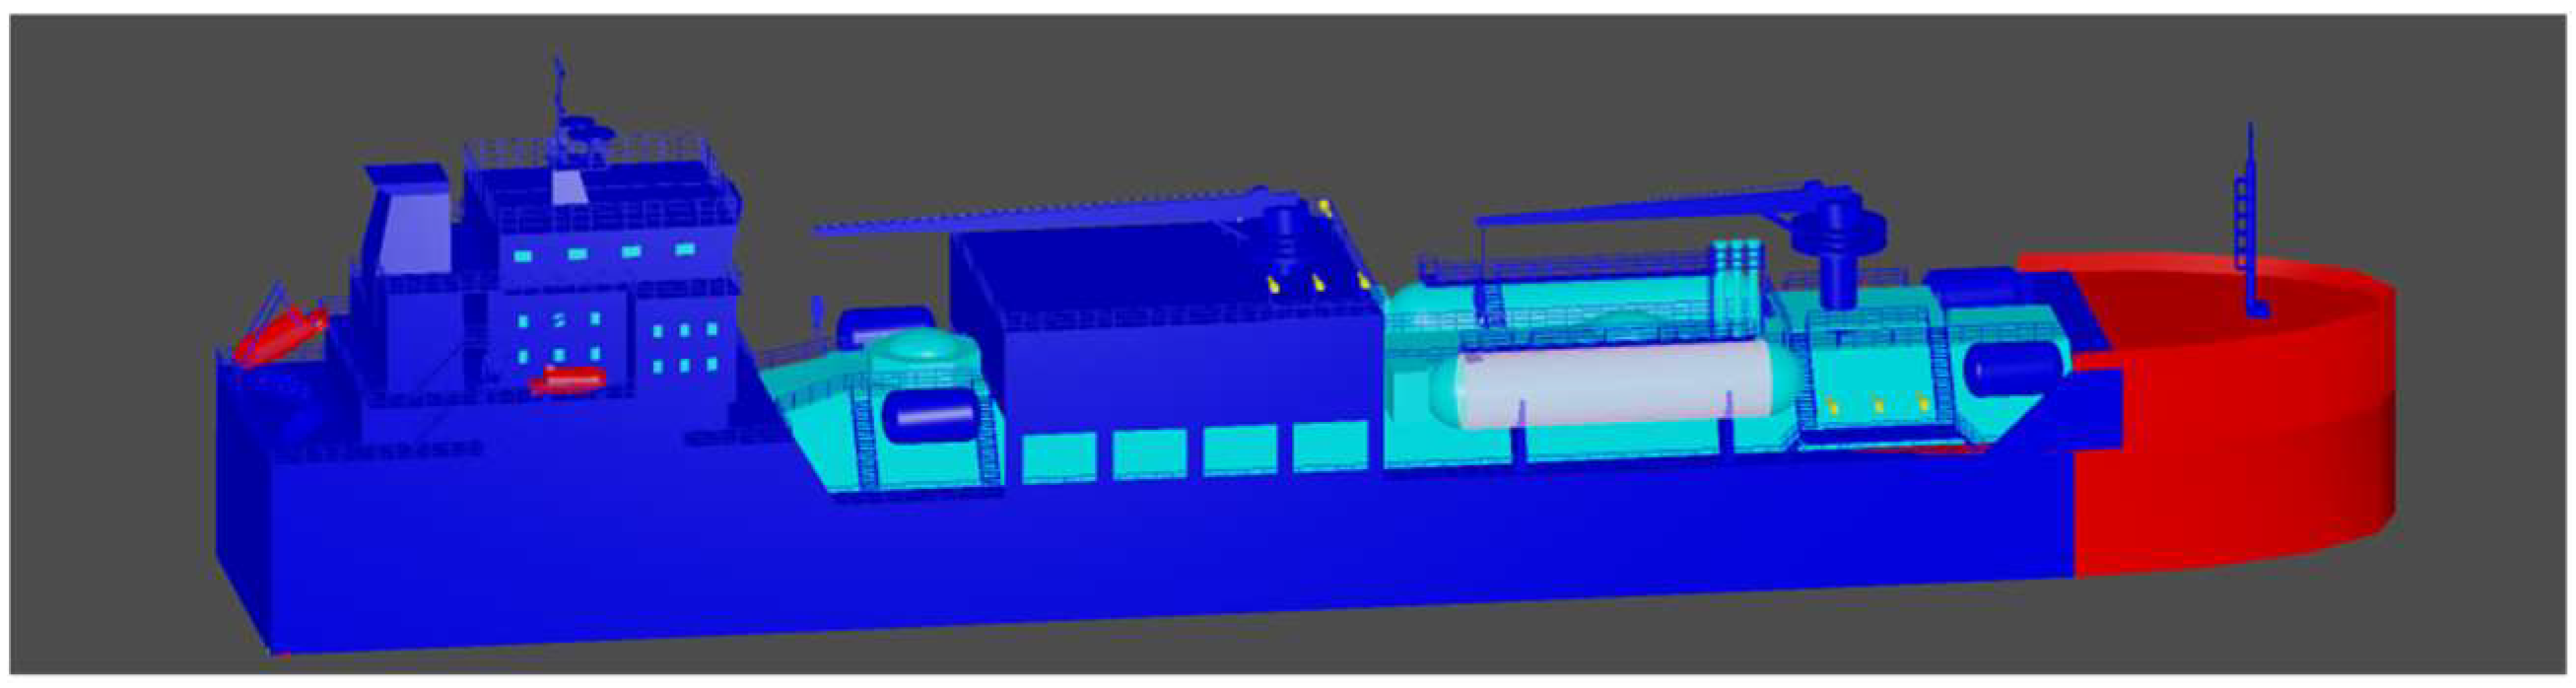
Table 2. Based on these parameters, 3D models were established using the FLACS software, as shown in
Figure 1 and
Figure 2. The model of the hose connection between the two vessels is shown in
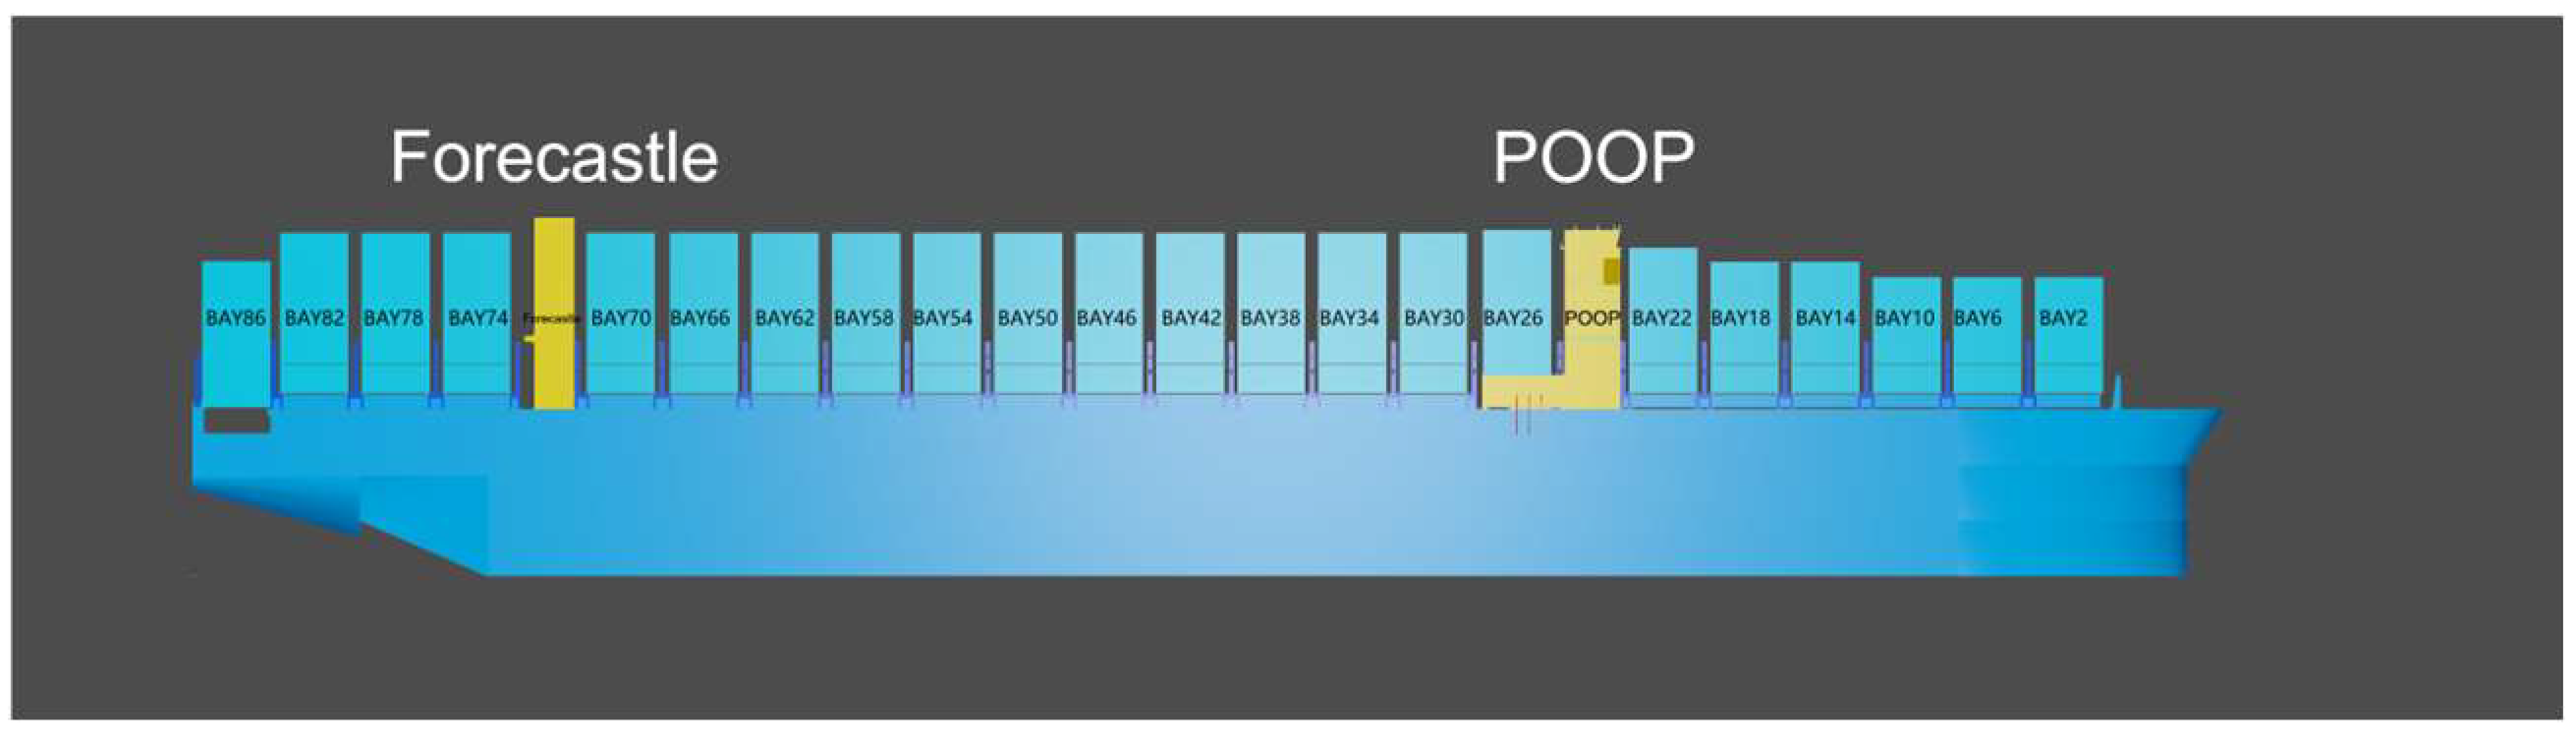
Figure 3. As can be seen from
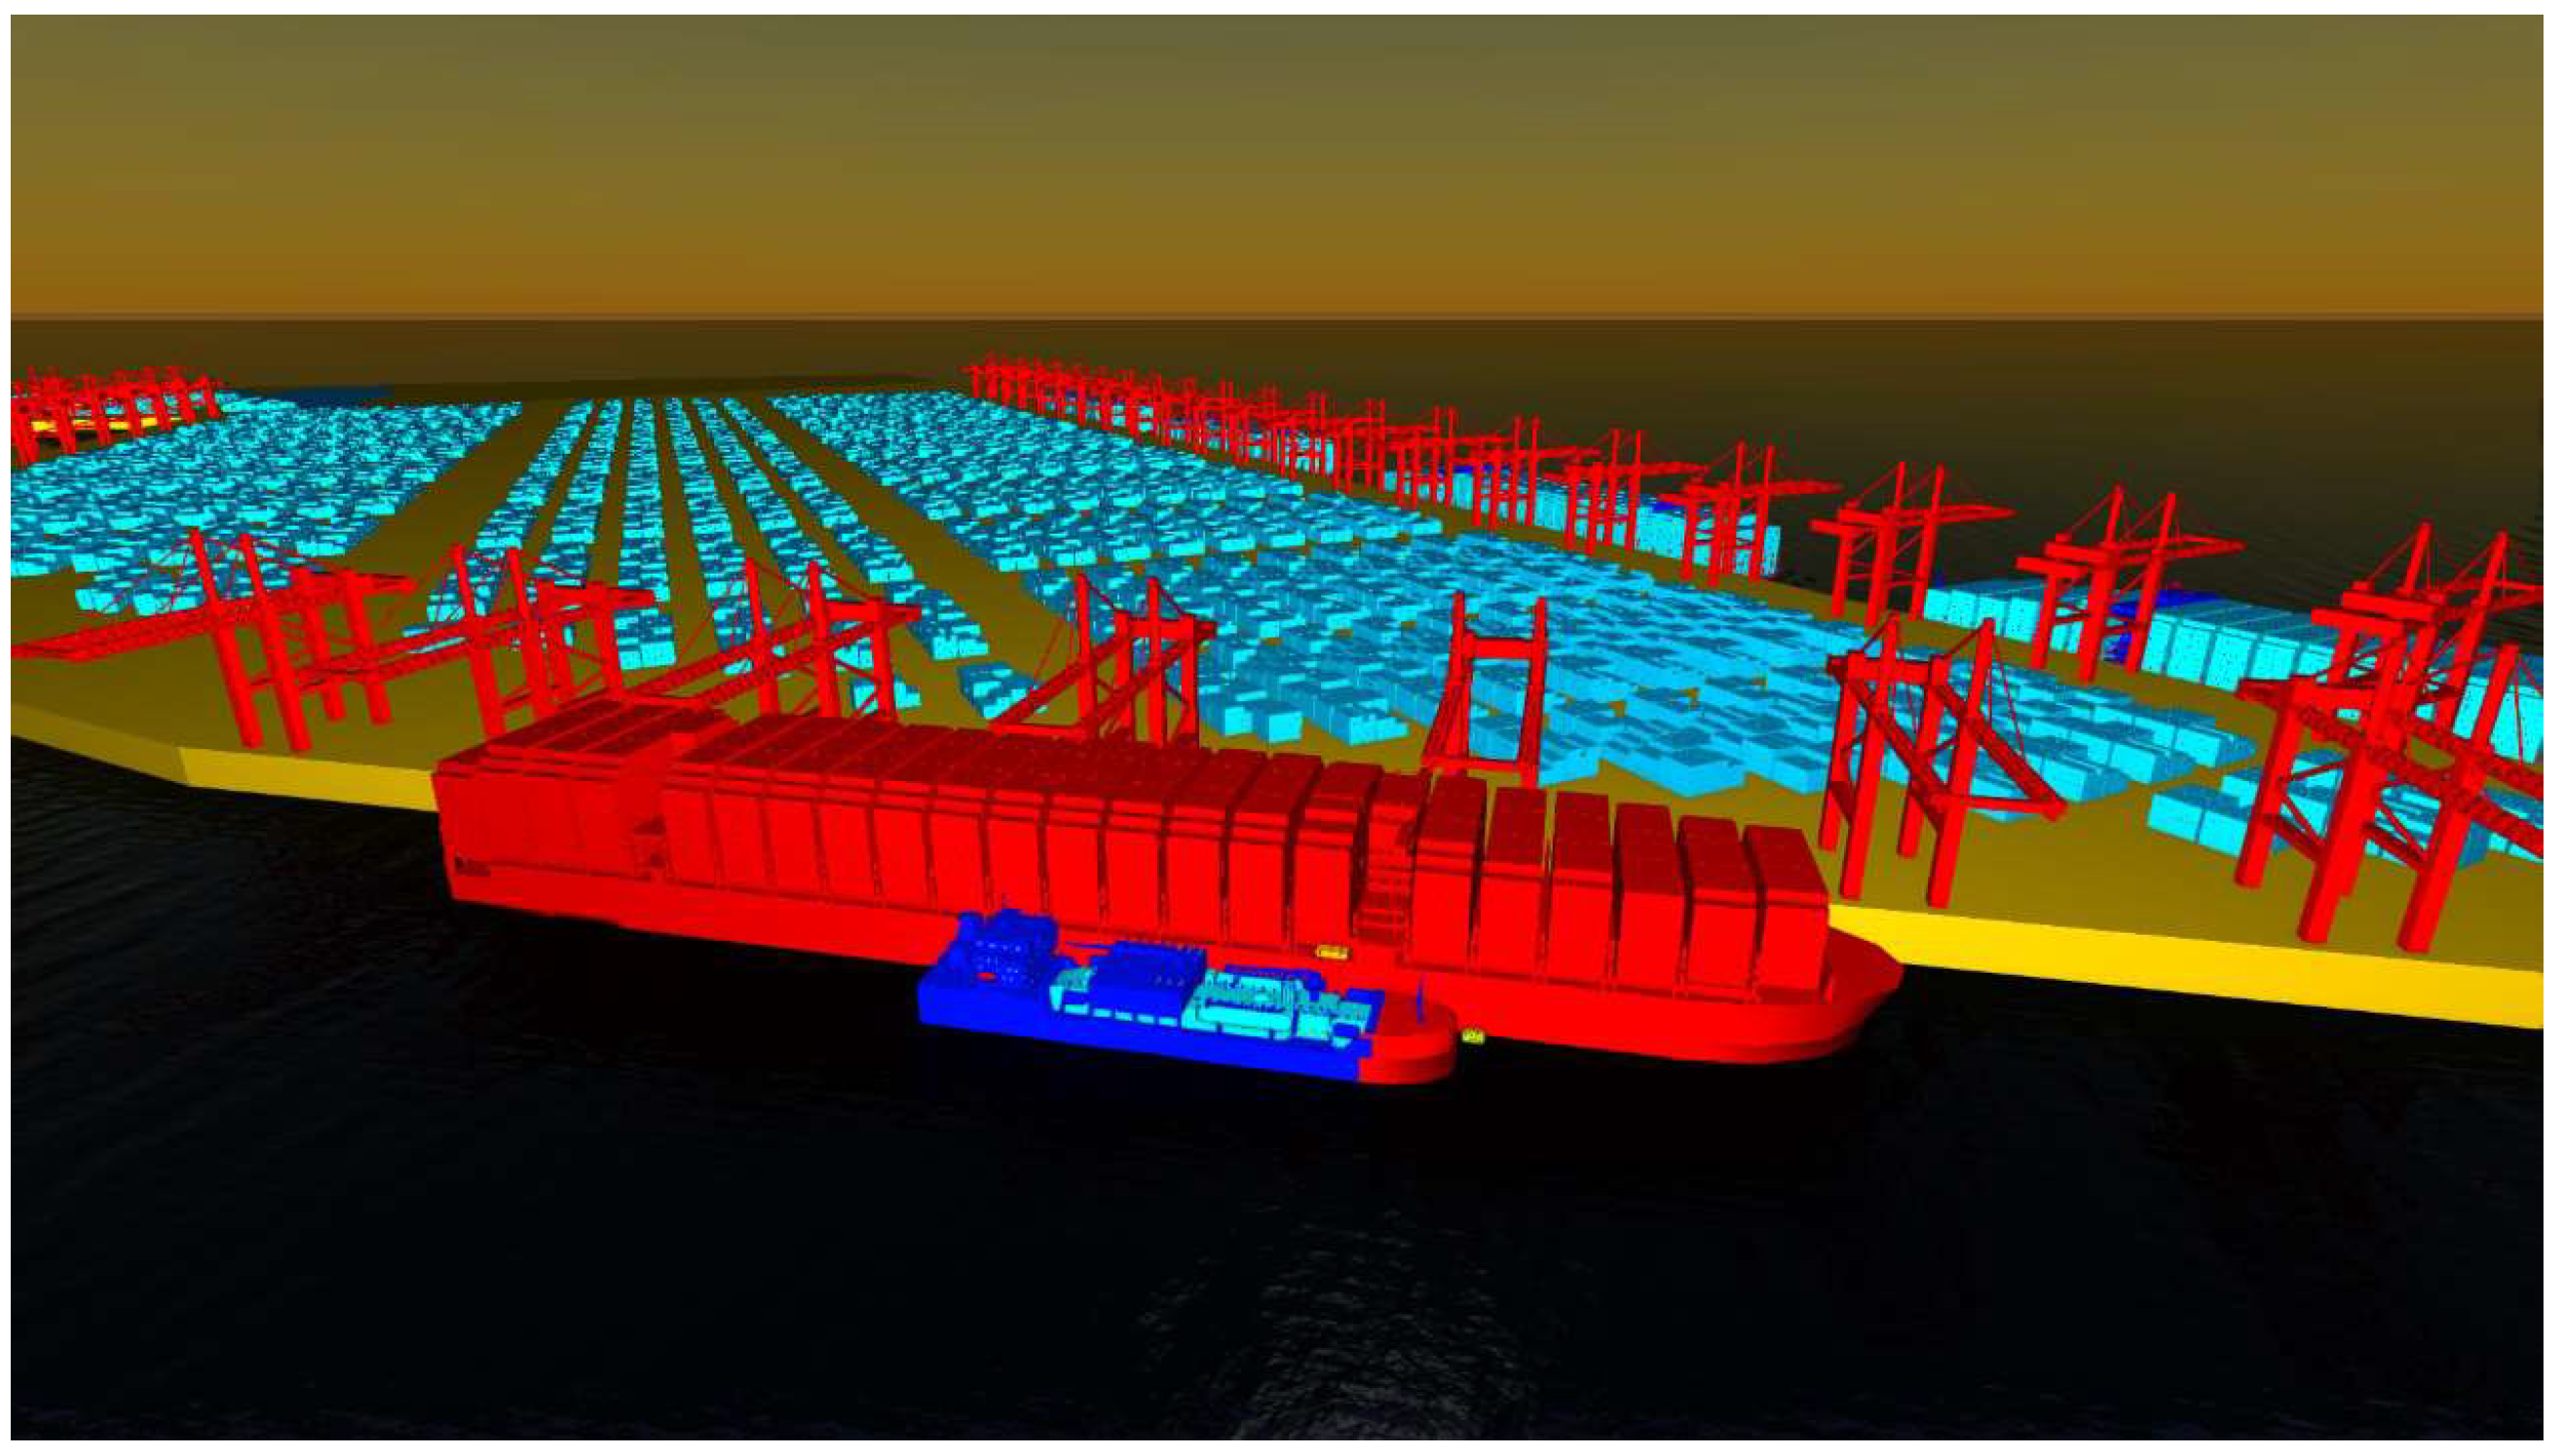
Figure 2, each bay position on the container vessel is 12.2 m 40 wide, with a gap of 1.2 m between bays. BAY2–BAY22 are located before the bow building, BAY22–BAY26 are located either side of the bow building, BAY26 is the bay position at which the bunkering station is located, BAY26–BAY70 lie between the bow building and the stern building, and BAY74–BAY86 are located after the stern building. There are 16 large container deep-water berths in Yantian Port. The total length of the inlet channel from the mouth of Dapeng Bay to the Yantian Port area is about 26 km, with a channel depth of 17.4 m and a channel width of 400 m. A three-dimensional model based on the FLACS satellite map of Yantian Port II is shown in
Figure 4.
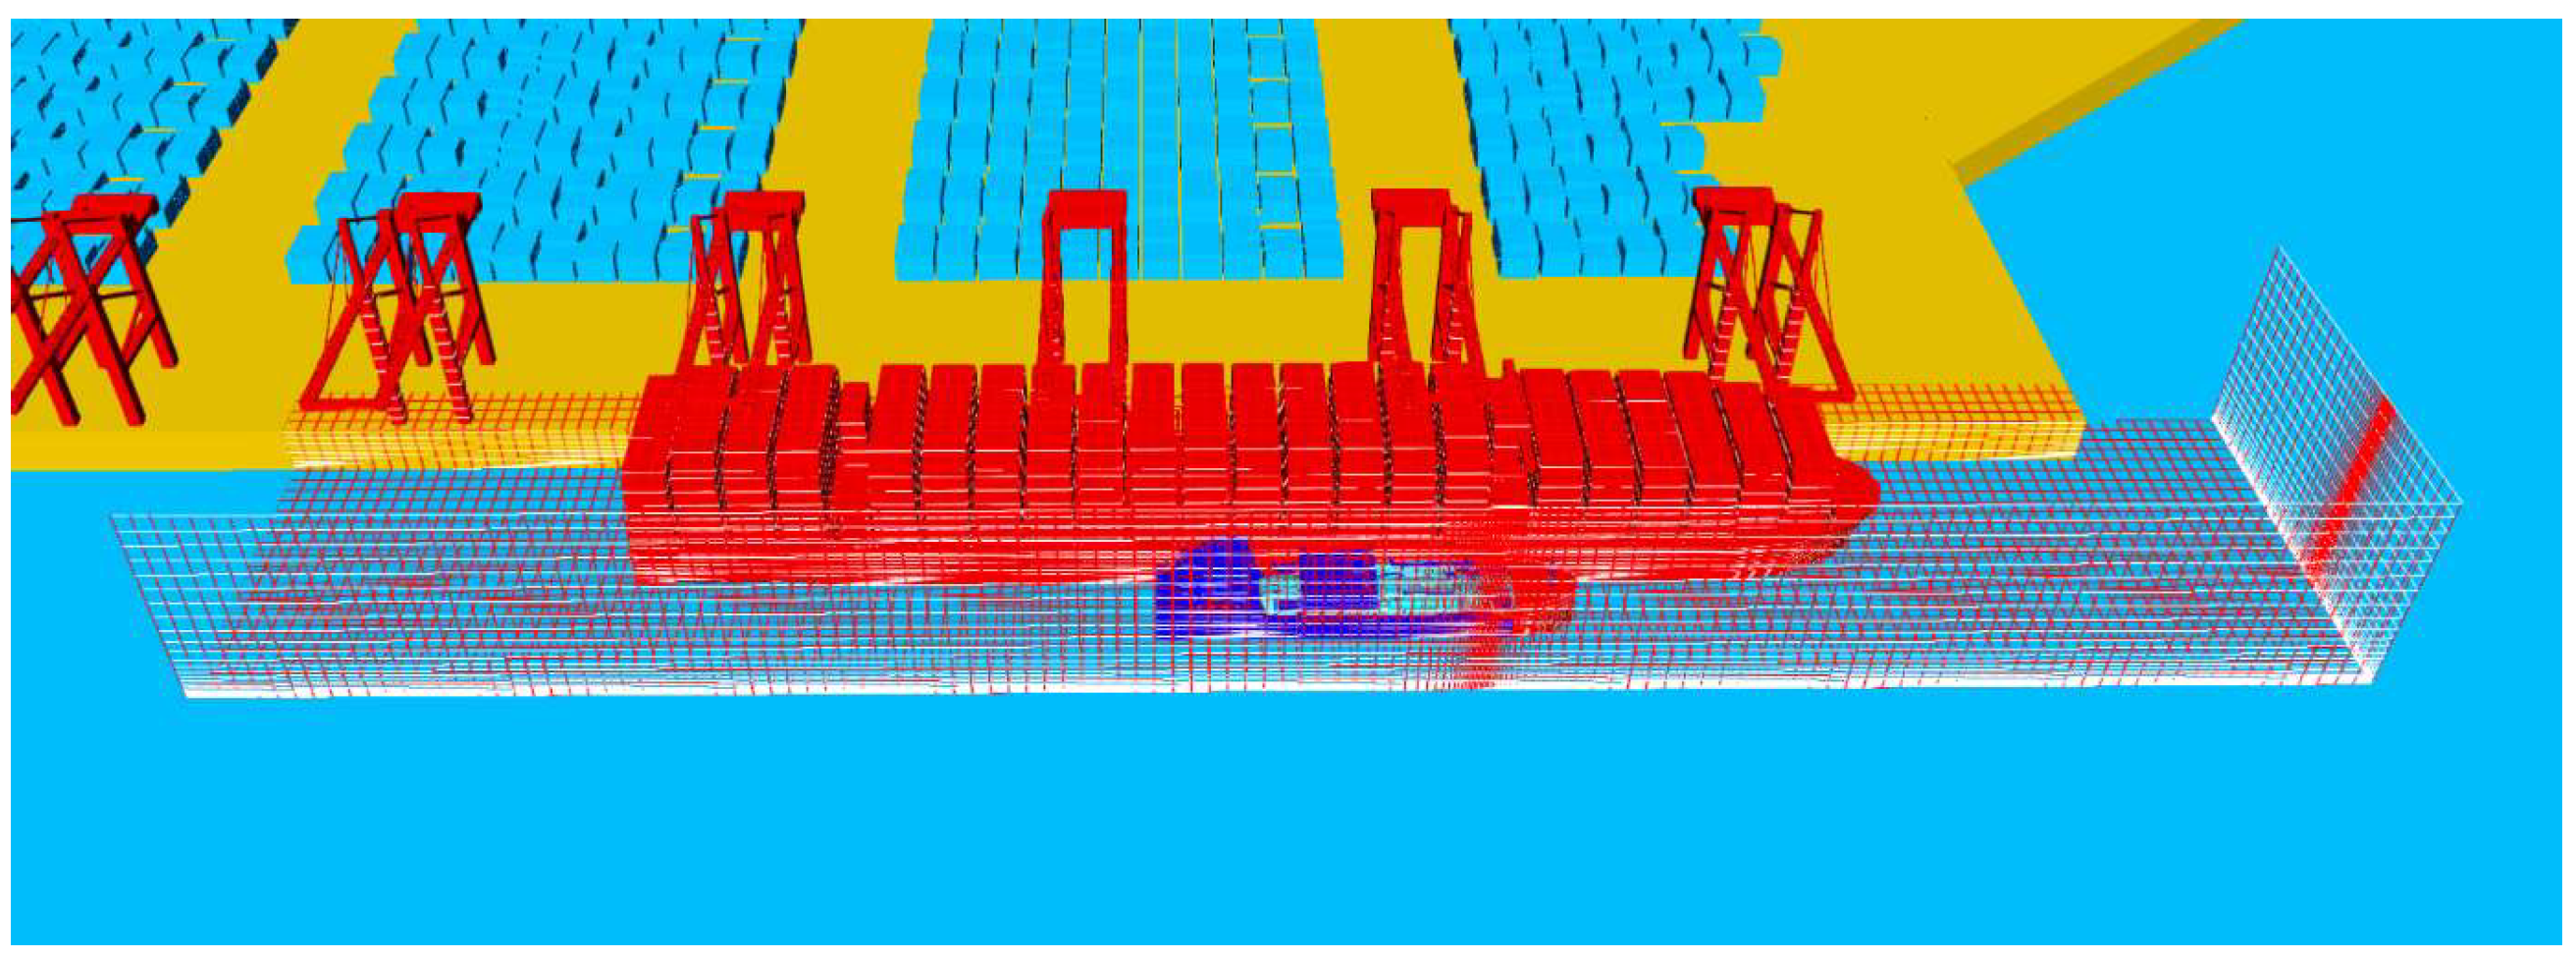
The FLACS software was used to grid the area where the gas phase or liquid phase may diffuse. The leakage area was taken as the core area and was considered separately according to the leakage location of each condition. The core area has a dimension of 4 × 4 × 4 m. The area covered by the gas cloud is taken as the extended area [
22], having an overall dimension with 600 × 100 × 80 m. To ensure a reasonable calculation speed with acceptable calculation accuracy, the grid edge length of the core area was taken as the variable for grid sensitivity calculations. The results show that a grid edge length of 0.5 m for the core region is reasonable. The grid edge length of the core region is greater than the leakage radius, so virtual spout technology was used to ensure the calculation accuracy. In the core region and the extended region, a smooth function transition with a scale factor of 1.2 was applied, and the maximum grid size of the extended region was set to 5 m. The specific grid division is shown in
Figure 5. In FLACS, CFLC and CFLV are usually adopted to represent the time step. According to the FLACS user’s manual, CFLC and CFLV are usually set as 20 and 2 for the dispersion simulation, respectively [
22].
2.5. Initial and Boundary Conditions
In this paper, the high-risk scenarios, such as hose ruptures and leakages at valve joints, are mainly considered. To analyze the diffusion range of combustible gas cloud, the quantitative risk assessments for typical scenarios are conducted, such as liquid-phase hose leakage, gas-phase hose leakage, leakage at the bunkering station flange joints of the bunker vessel, and leakage at the bunkering station flange joints of the receiving vessel. Considering that a unit volume of LNG will be vaporized to produce 600 times the volume of NG after leakage, a liquid-phase leakage at the bunkering station flange will produce more NG and spread further than a gas-phase leakage under the same conditions. Thus, only the liquid-phase flange joint leakage at the bunkering station is considered in this paper. In summary, four typical scenarios for quantitative analysis of the consequences of LNG leakage are selected, including leakage from a gas-phase hose, leakage from a liquid-phase hose, leakage from a bunkering station flange joint on the bunker vessel, and leakage from a bunkering station flange joint on the receiving vessel.
The basic calculation parameters for each leakage scenario are as follows: the pipeline arrangement includes two liquid stages and one gas stage (i.e., L-V-L); the gas-phase/liquid-phase pipes and joints measure 20 cm in diameter (i.e., the DN 200 standard); the transmission pressure is controlled within 10 bar; the Emergency Shutdown Device (i.e., ESD) response time is taken as the maximum time required by the specification of 30 s, and the gas leakage detection time is taken as 30 s. Consequently, the cumulative leakage time is 60 s for conservative consideration. The height difference on the filling pipe (bunker vessel full, receiving vessel ballast) is about 8.6 m (receiving vessel higher than bunker vessel), and the difference in elevation under the filling pipe (bunker vessel ballast, receiving vessel full) is about 17.3 m (receiving vessel higher than bunker vessel). According to the relevant standards [
23,
24,
25,
26], the volume concentration of combustible gas in air was selected as 50% of the lower combustible limit (i.e., 2.5% for methane) as the diffusion boundary acceptance criterion.
3. Quantitative Analysis of Leakage Consequences
3.1. Leakage from Gas-Phase Hose
Scenario 1 is a leak in the filling gas-phase hose. The leakage location is shown in
Figure 6. According to the relevant databases [
27,
28,
29], a typical leakage diameter of 10% of the hose diameter (i.e., 20 mm) was selected. The cumulative leakage time is 60 s, and 2.5% of the volume concentration of methane in air was chosen as the diffusion boundary. The wind velocities in the sixteen wind directions of a wind rose diagram were considered, as well as the six leakage directions relative to the leakage opening: vertical up (+Z), vertical down (−Z), horizontal left (+X), horizontal right (−X), vertical vessel-side outboard (+Y), and negative vertical vessel-side outboard (−Y). The simulation results for this scenario under ballast and laden conditions are shown in
Figure 7 and
Figure 8, respectively.
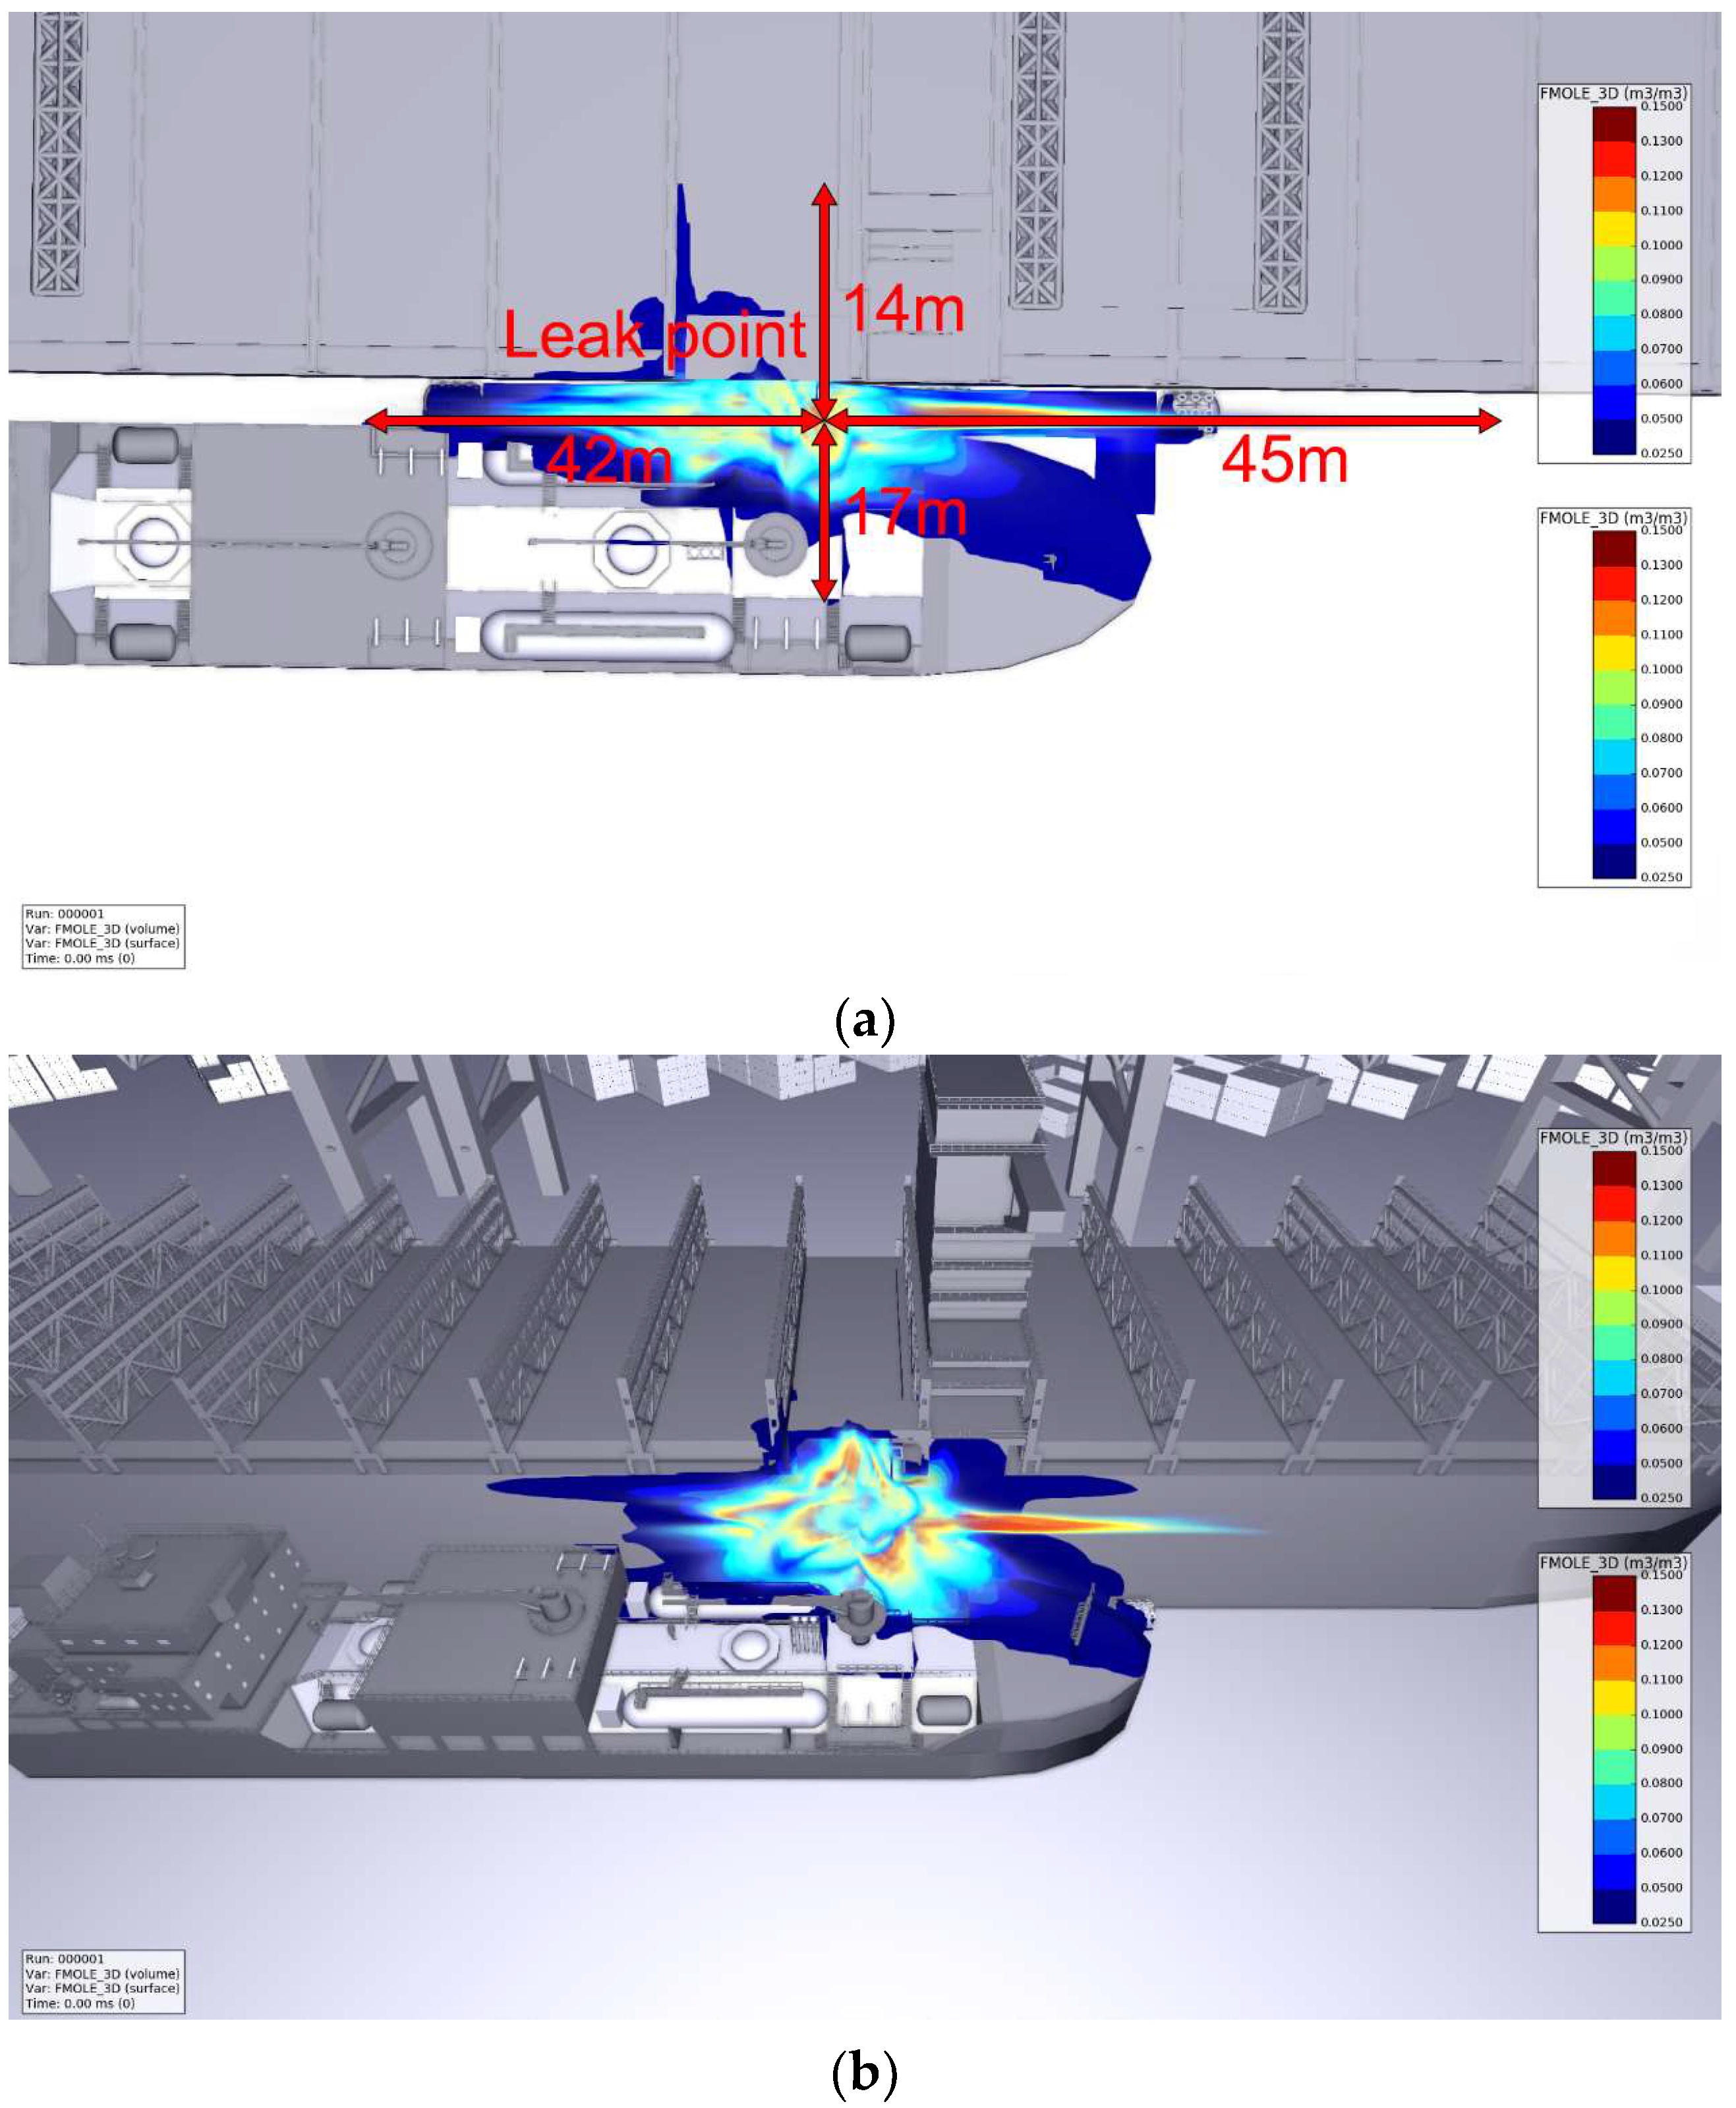
As can be seen from
Figure 7, under the ballast condition of the container carrier, the shallow draft of the container carrier and the large height difference between the two vessels mean that most of the combustible vapor cloud accumulates at the side of the receiving vessel. Part of the vapor cloud spread to the deck of the bunker vessel and a small amount spread to the deck of the receiving vessel, reaching a distance of six box positions inwards at BAY26 (the bay at which the refueling station is located) and three box positions inwards at BAY30 (i.e., one bay after the refueling station). The maximum spread of the combustible vapor cloud extends 87 m in the vessel length direction and 31 m in the vessel width direction.
As shown in
Figure 8, under the laden condition of the container carrier, the container carrier has a deeper draft and the height difference between the two vessels is smaller than when the container carrier is empty. The combustible vapor cloud leaking from the container carrier accumulates in the sandwich channel of the two vessels and spreads to the deck of the bunker vessel. The highest point of the vapor cloud reaches two container layers above the bunker vessel at BAY26 and BAY30. The maximum spread of the combustible vapor cloud is 127 m in the vessel length direction and 31 m in the vessel width direction.
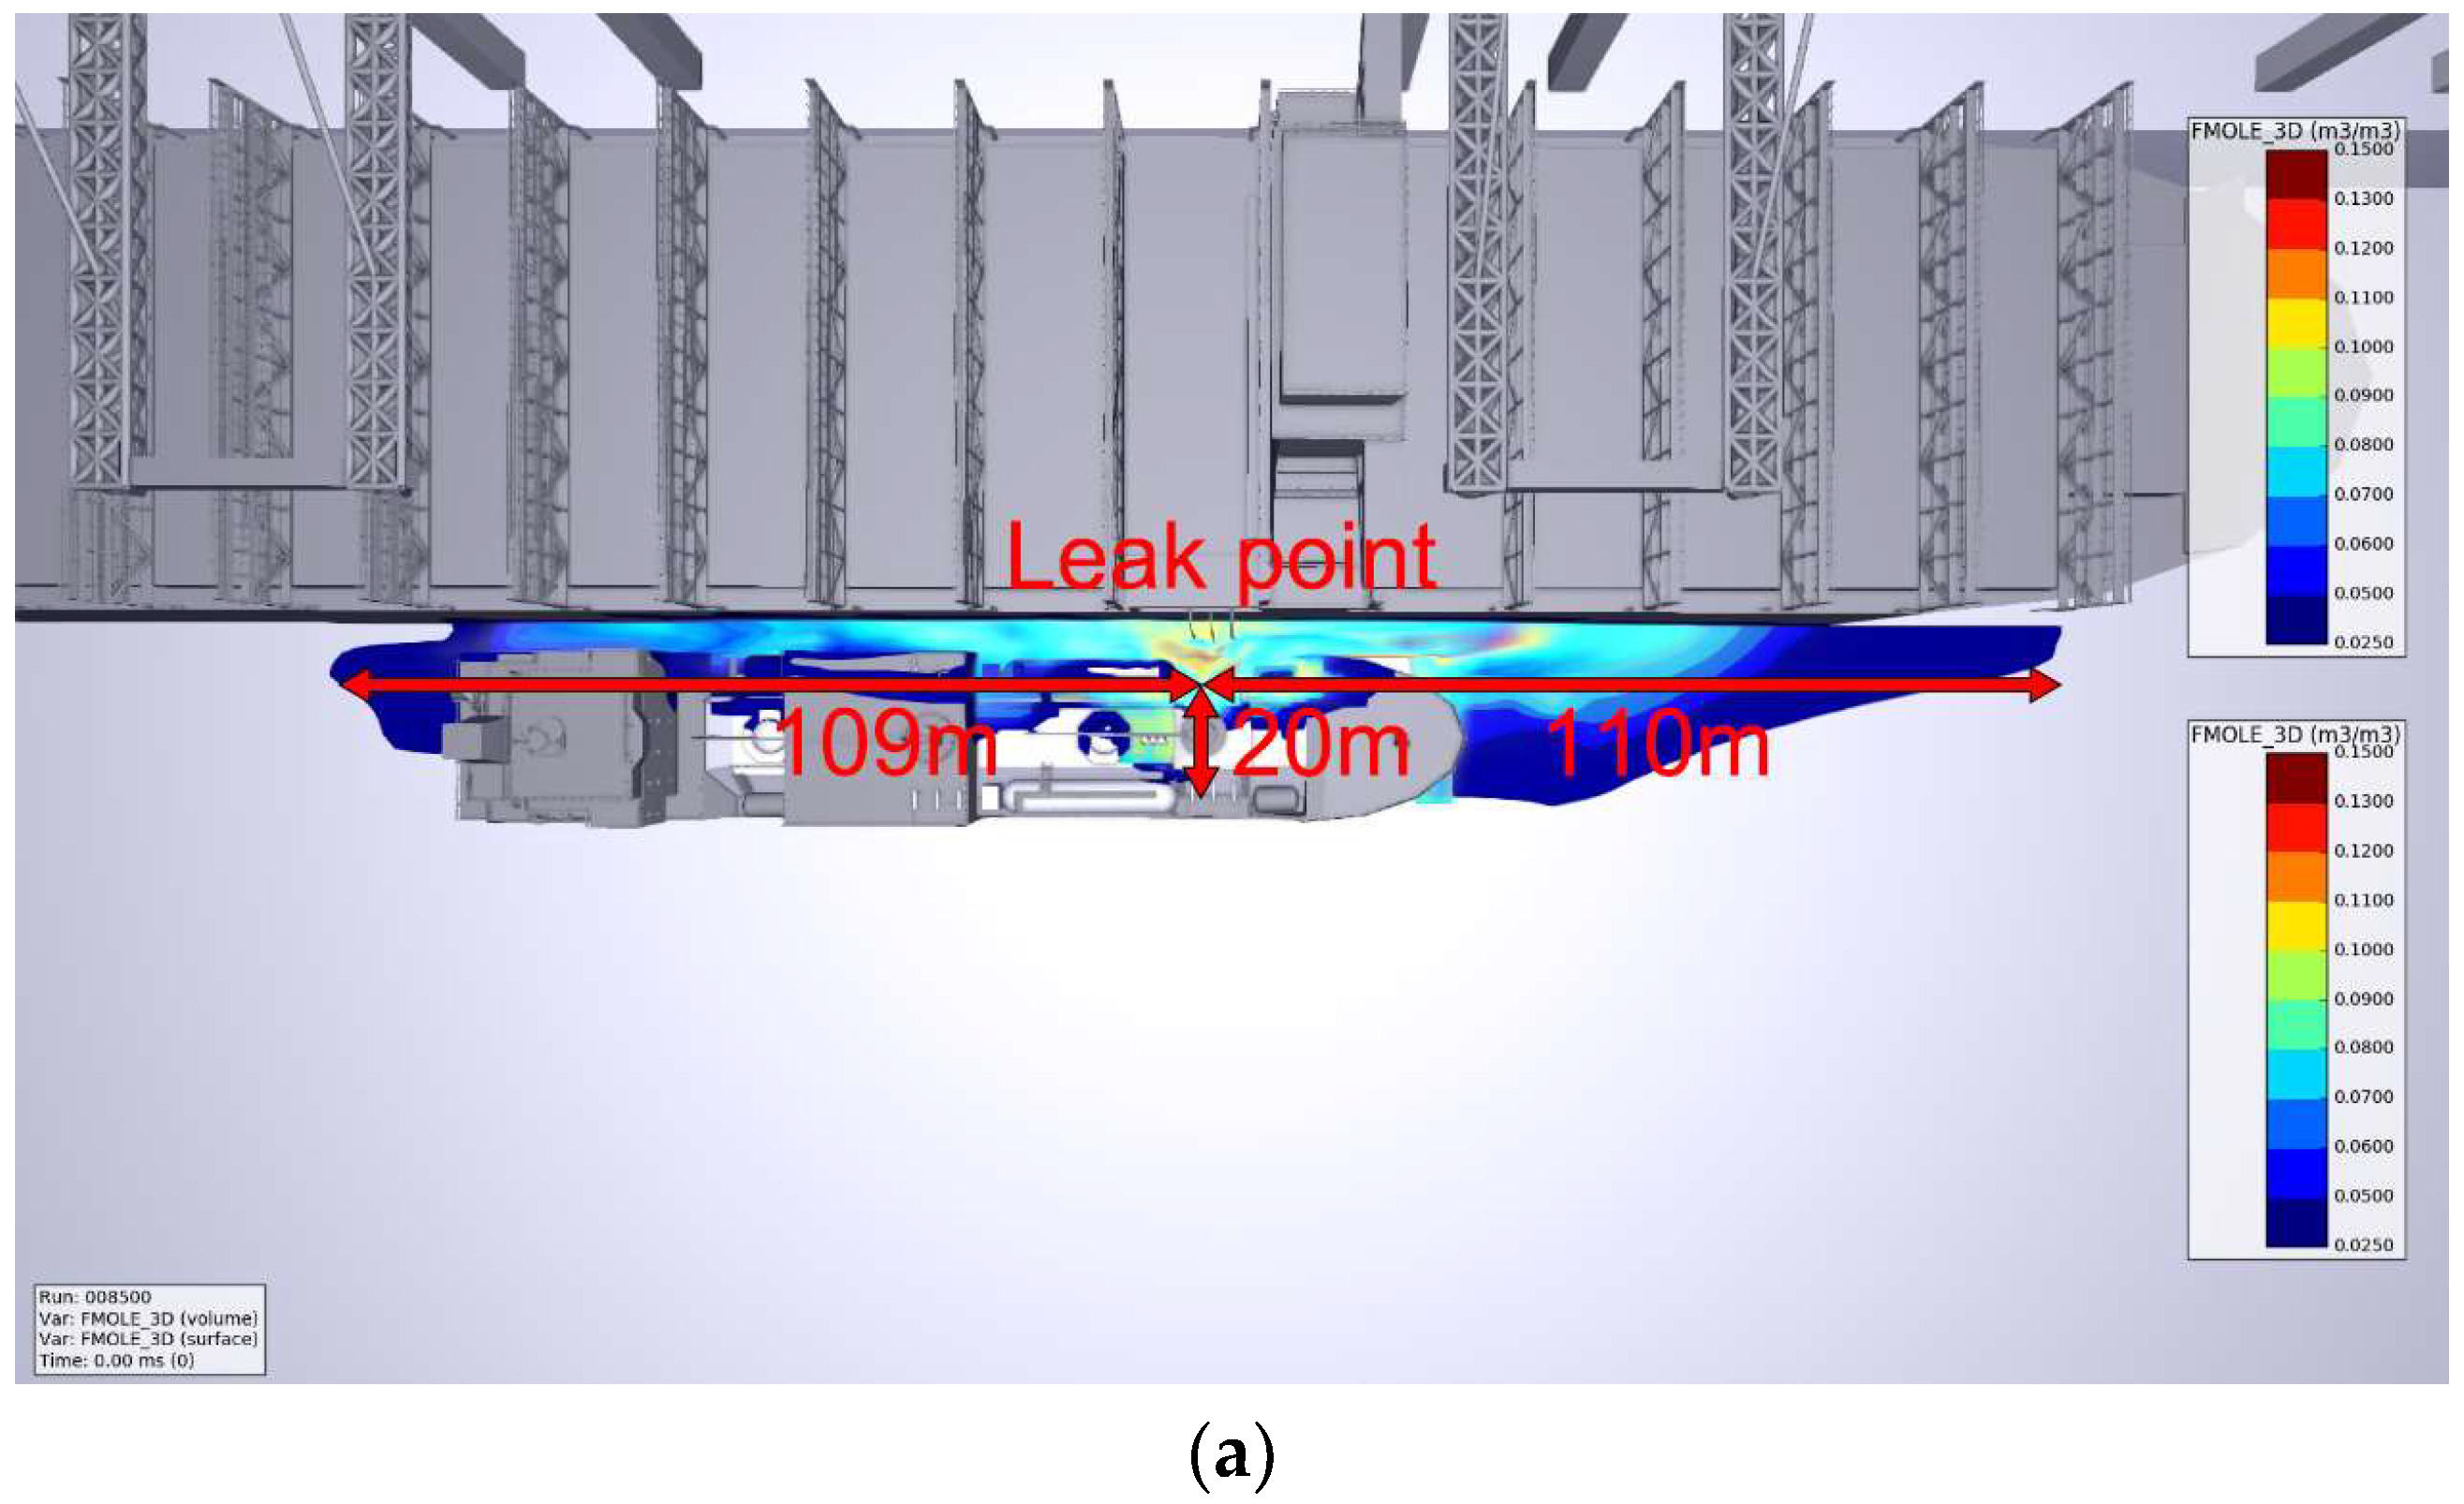
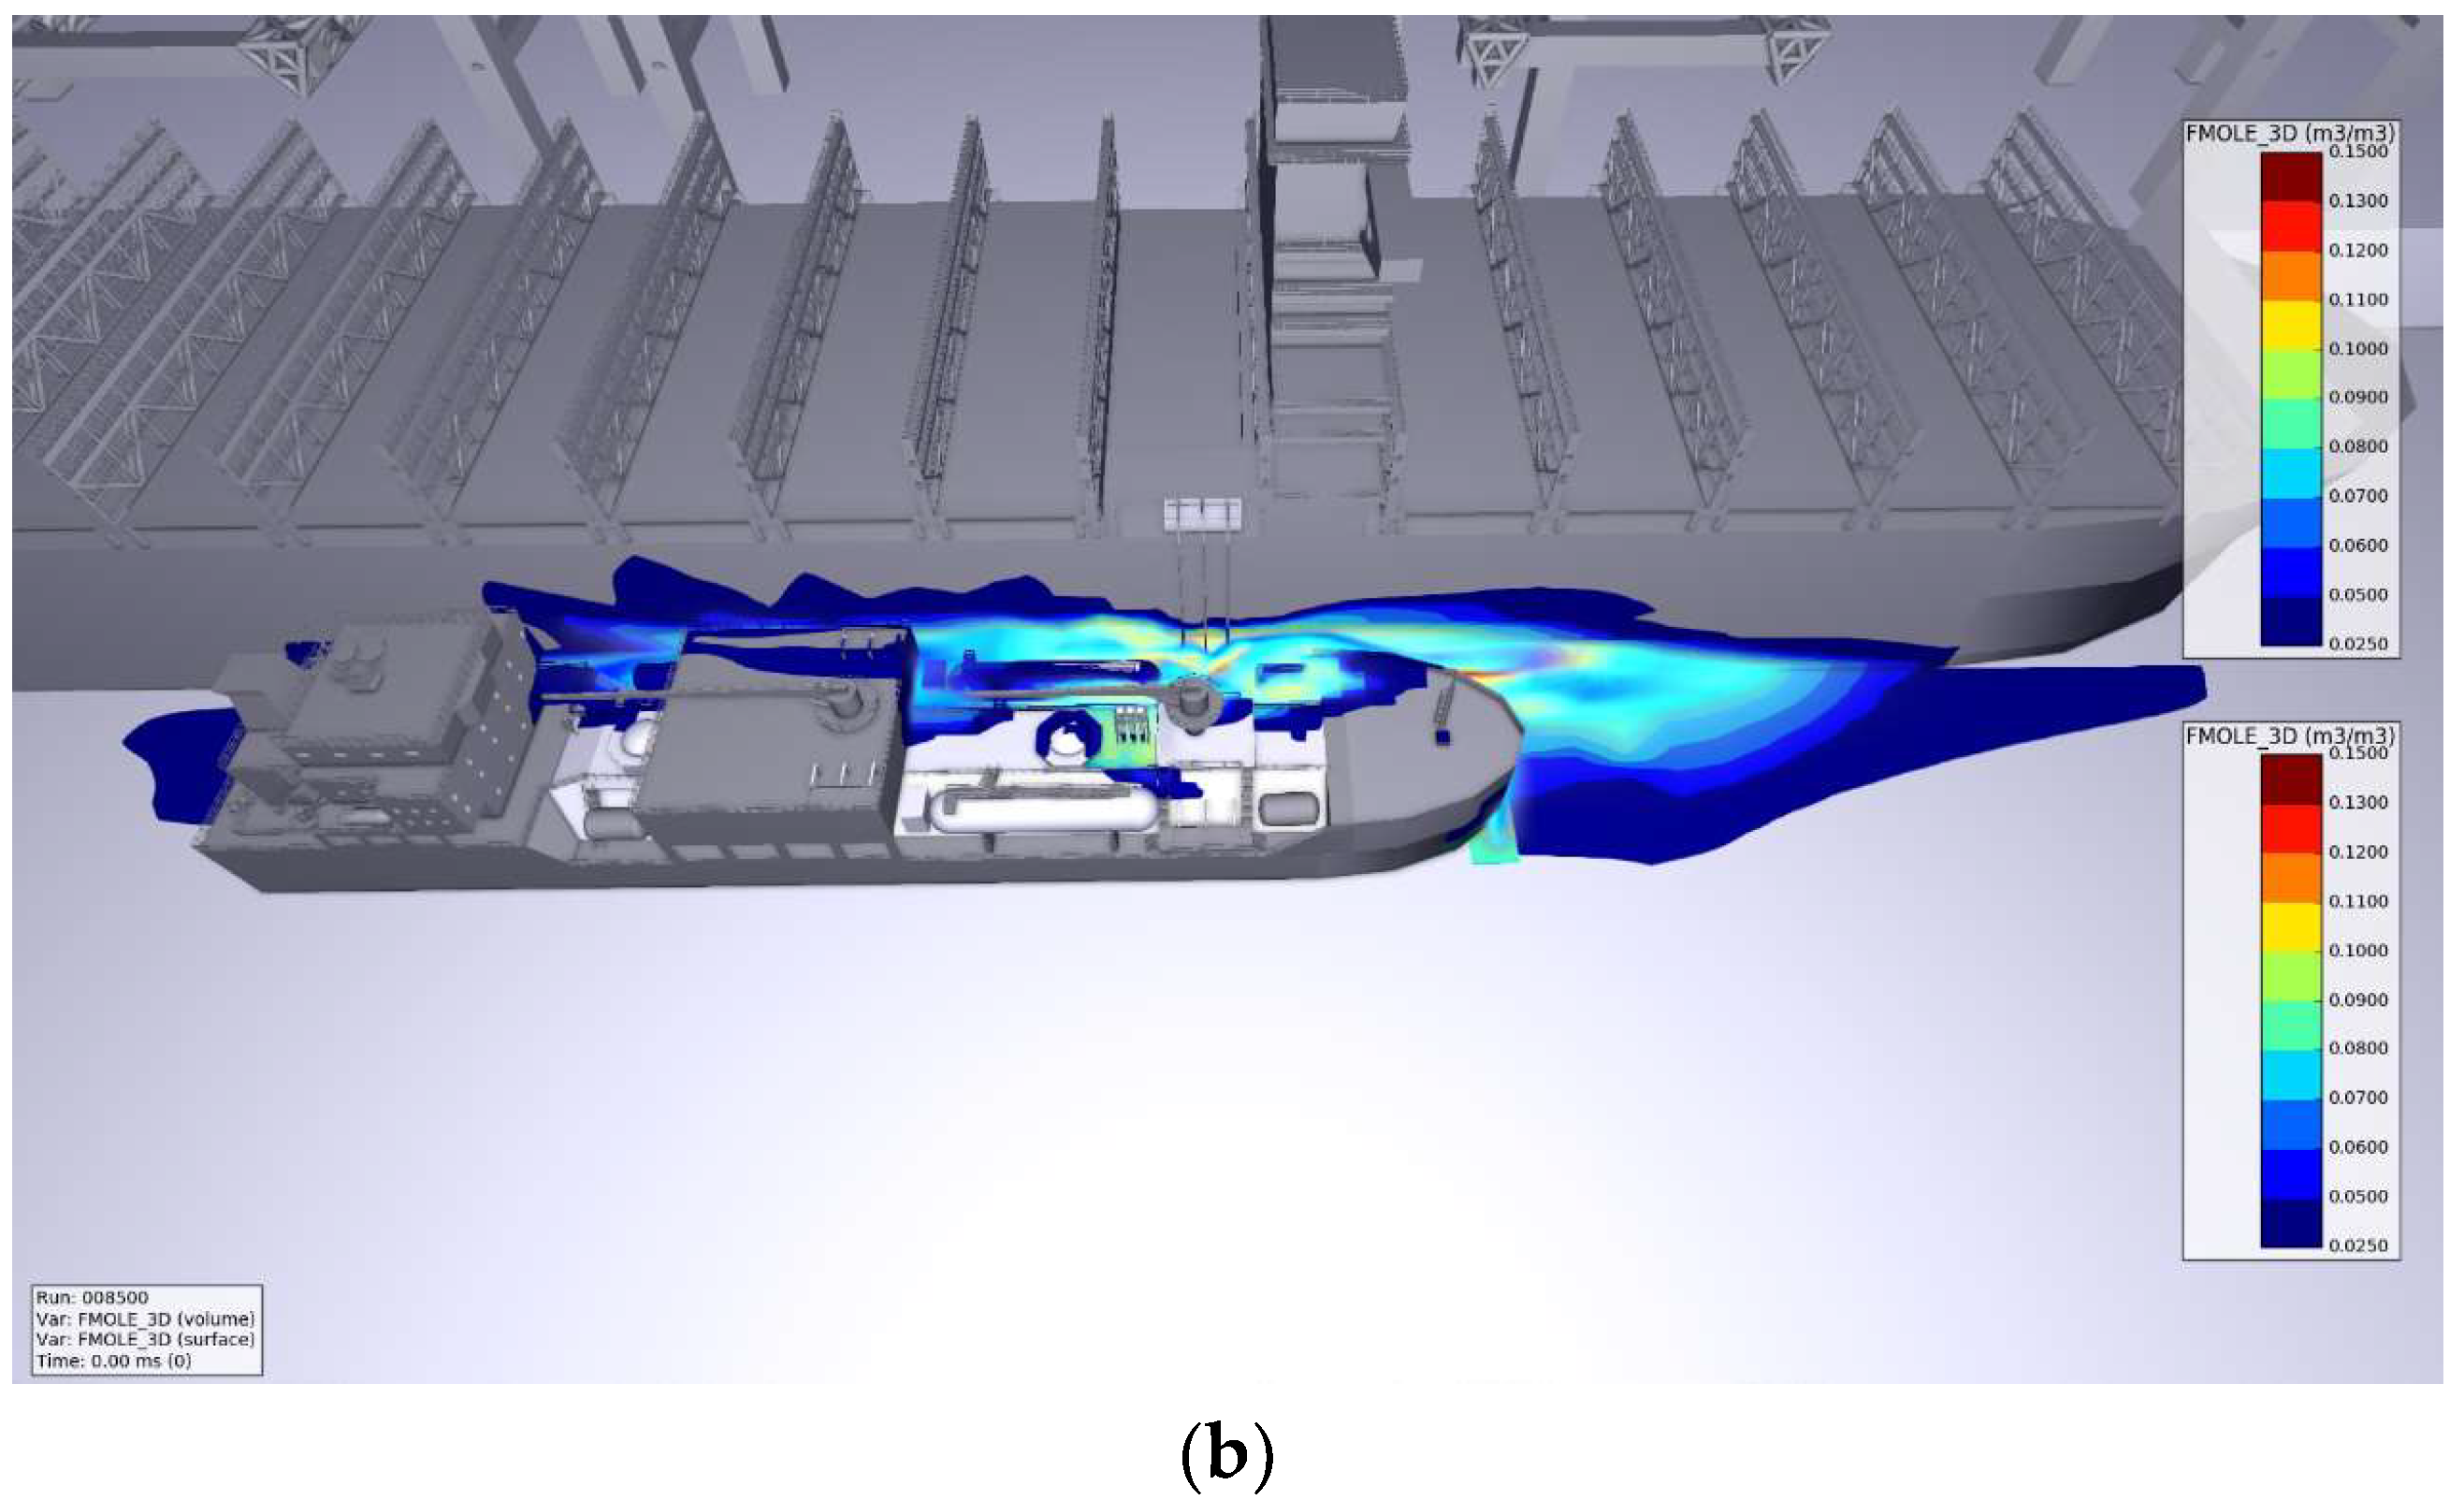
3.2. Leakage from Liquid-Phase Hose
Scenario 2 is a leak in the liquid-phase filling hose at the location shown in
Figure 9. According to the relevant databases [
27,
28,
29], the typical leakage diameter is 10% of the hose diameter, namely 20 mm. The cumulative leakage time is 60 s, and 2.5% of the volume concentration of methane in air is chosen as the diffusion boundary. Considering the wind velocities in the sixteen wind directions of the wind rose diagram, the direction of liquid-phase LNG leakage is vertically downwards. The simulation results for this scenario are shown in
Figure 10 and
Figure 11 for the ballast and laden conditions, respectively.
As shown in
Figure 10, under the ballast condition of the container carrier, the shallow draft of the container carrier and the large difference in height between the two vessels mean that the combustible vapor cloud leaks and accumulates on the side of the bunker vessel and does not spread to the deck of the recipient vessel. The maximum length of the combustible vapor cloud reaches 230 m in the vessel length direction and 30 m in the vessel width direction.
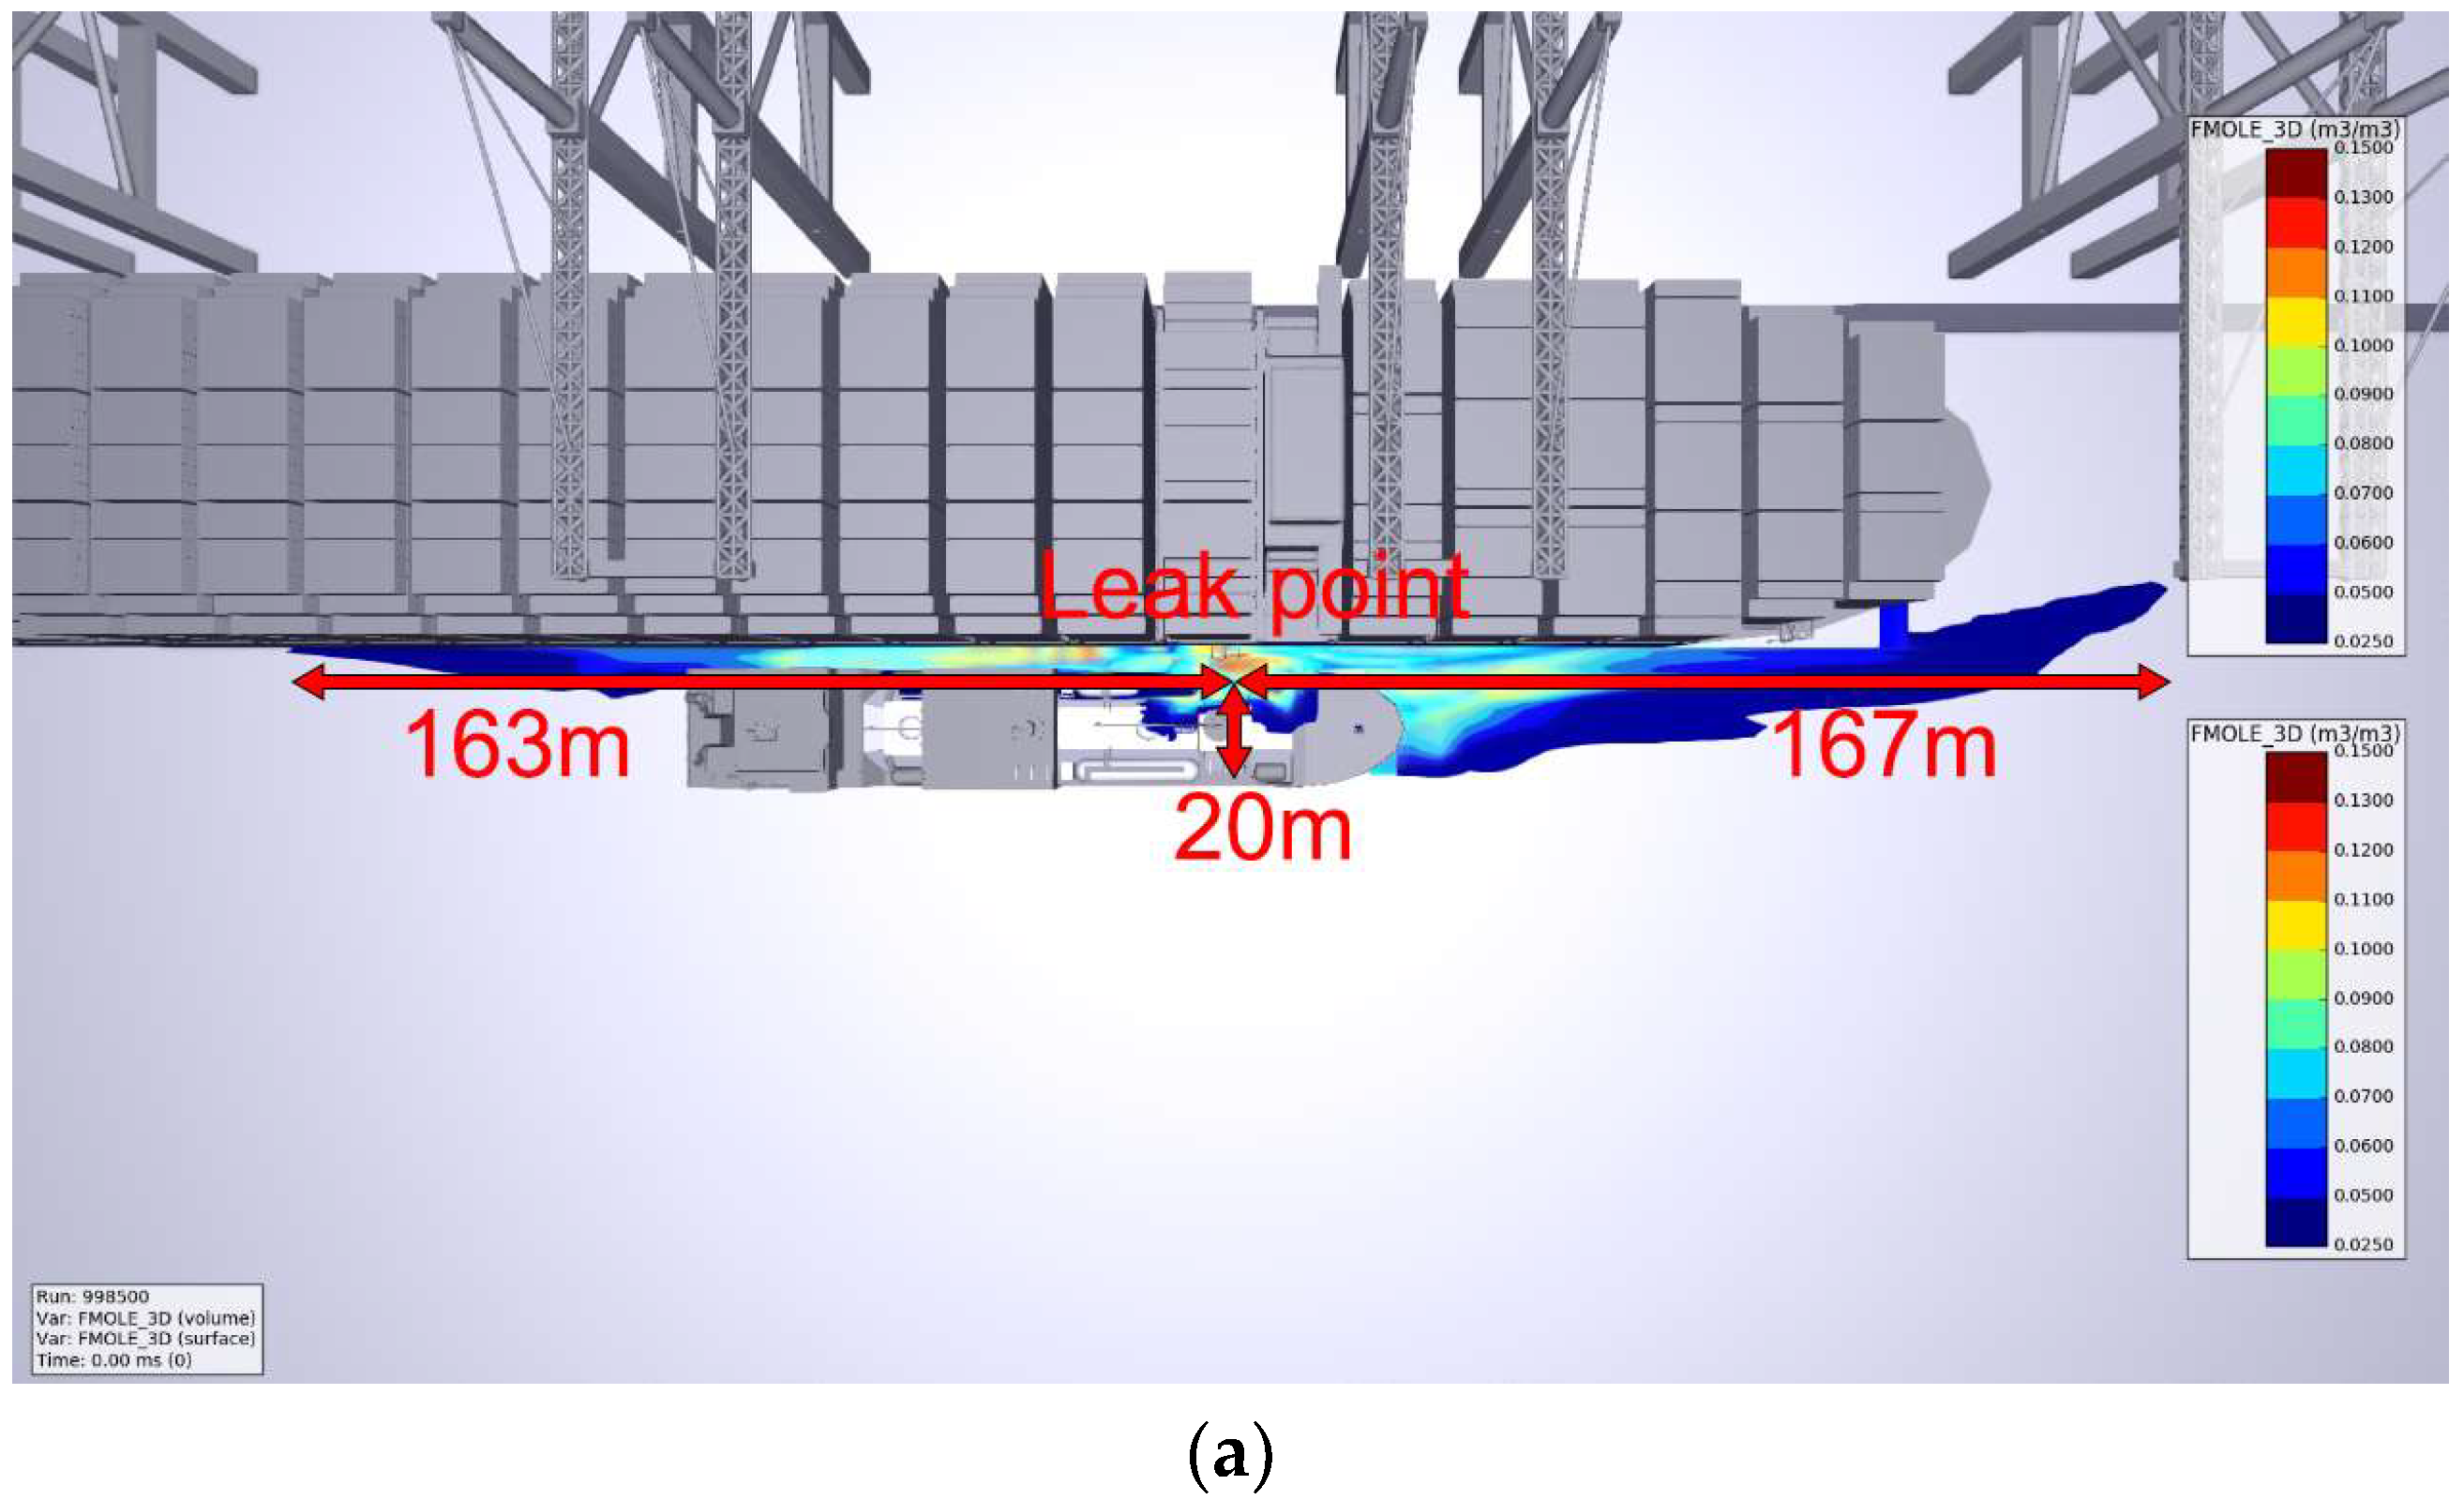
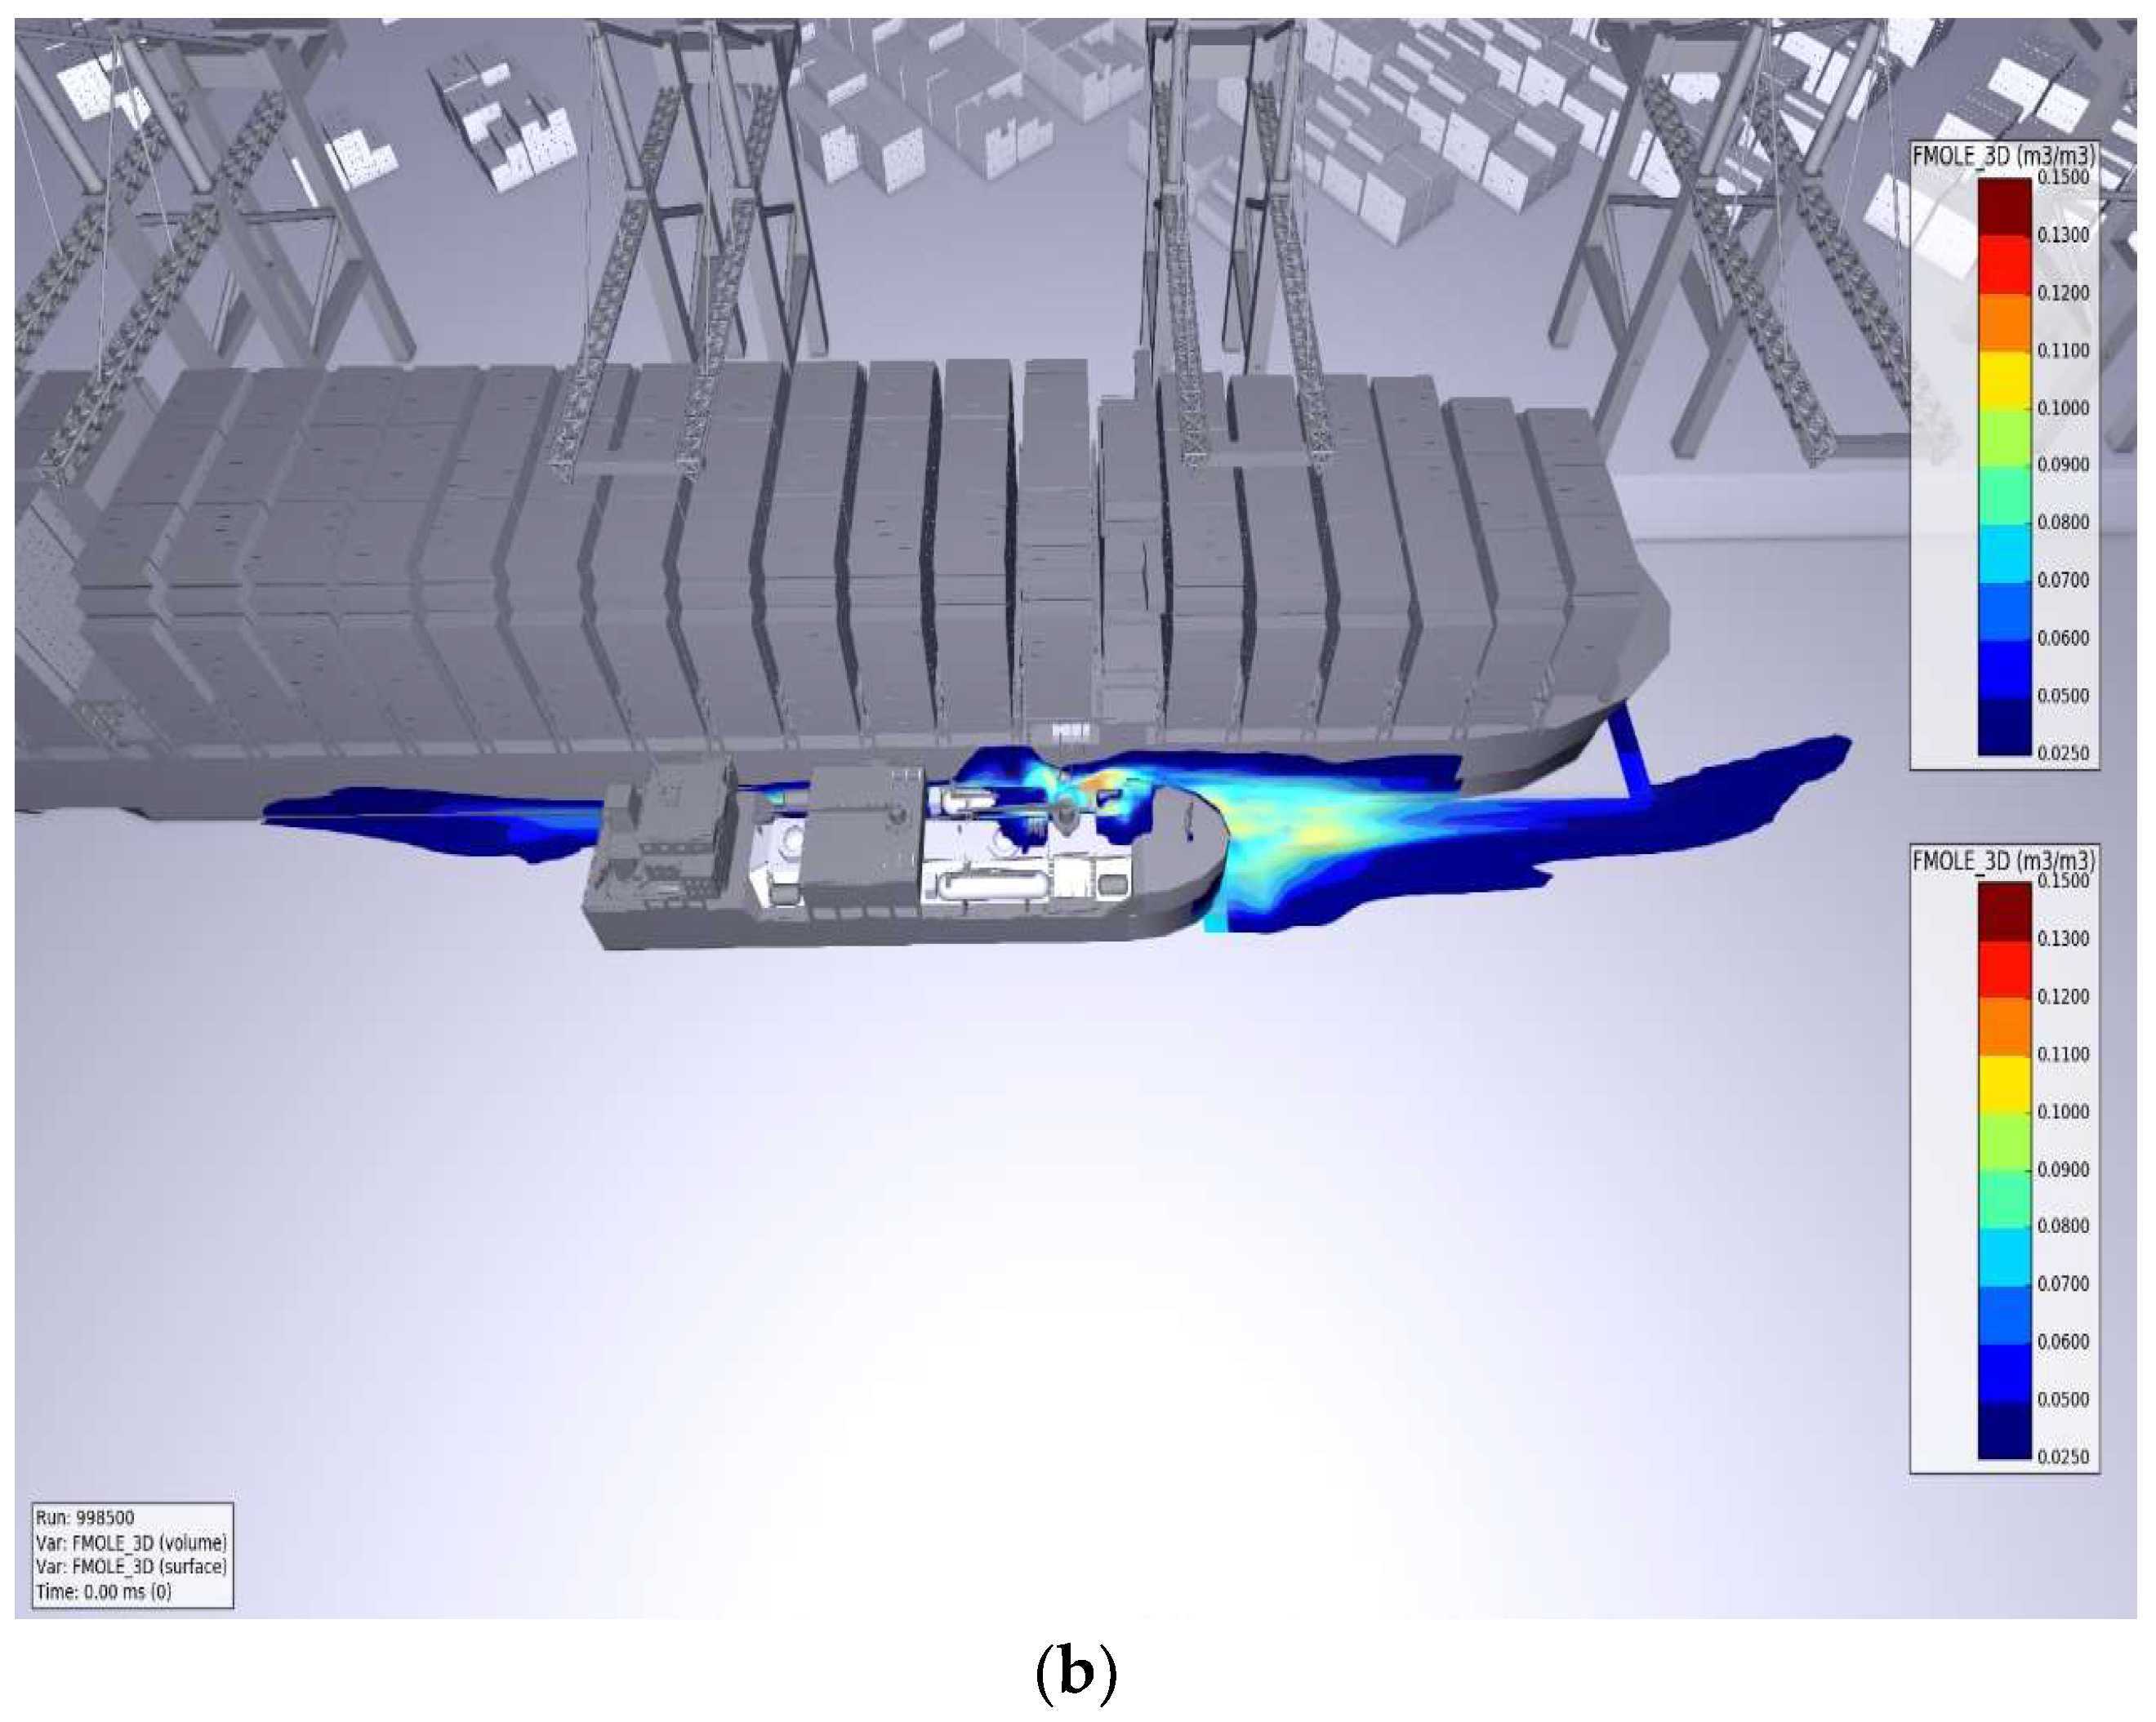
As shown in
Figure 11, if the liquid-phase hose breaks when the container carrier is laden, the leaking LNG will form a strong heat exchange effect with the water, generating a large amount of NG and forming a combustible vapor cloud. The combustible vapor cloud spreads between the mezzanines of the two vessels and onto the deck of the bunker vessel but fails to reach the deck of the receiving vessel. The vapor cloud spreads up to 227 m in the vessel length direction and 30 m in the vessel width direction.
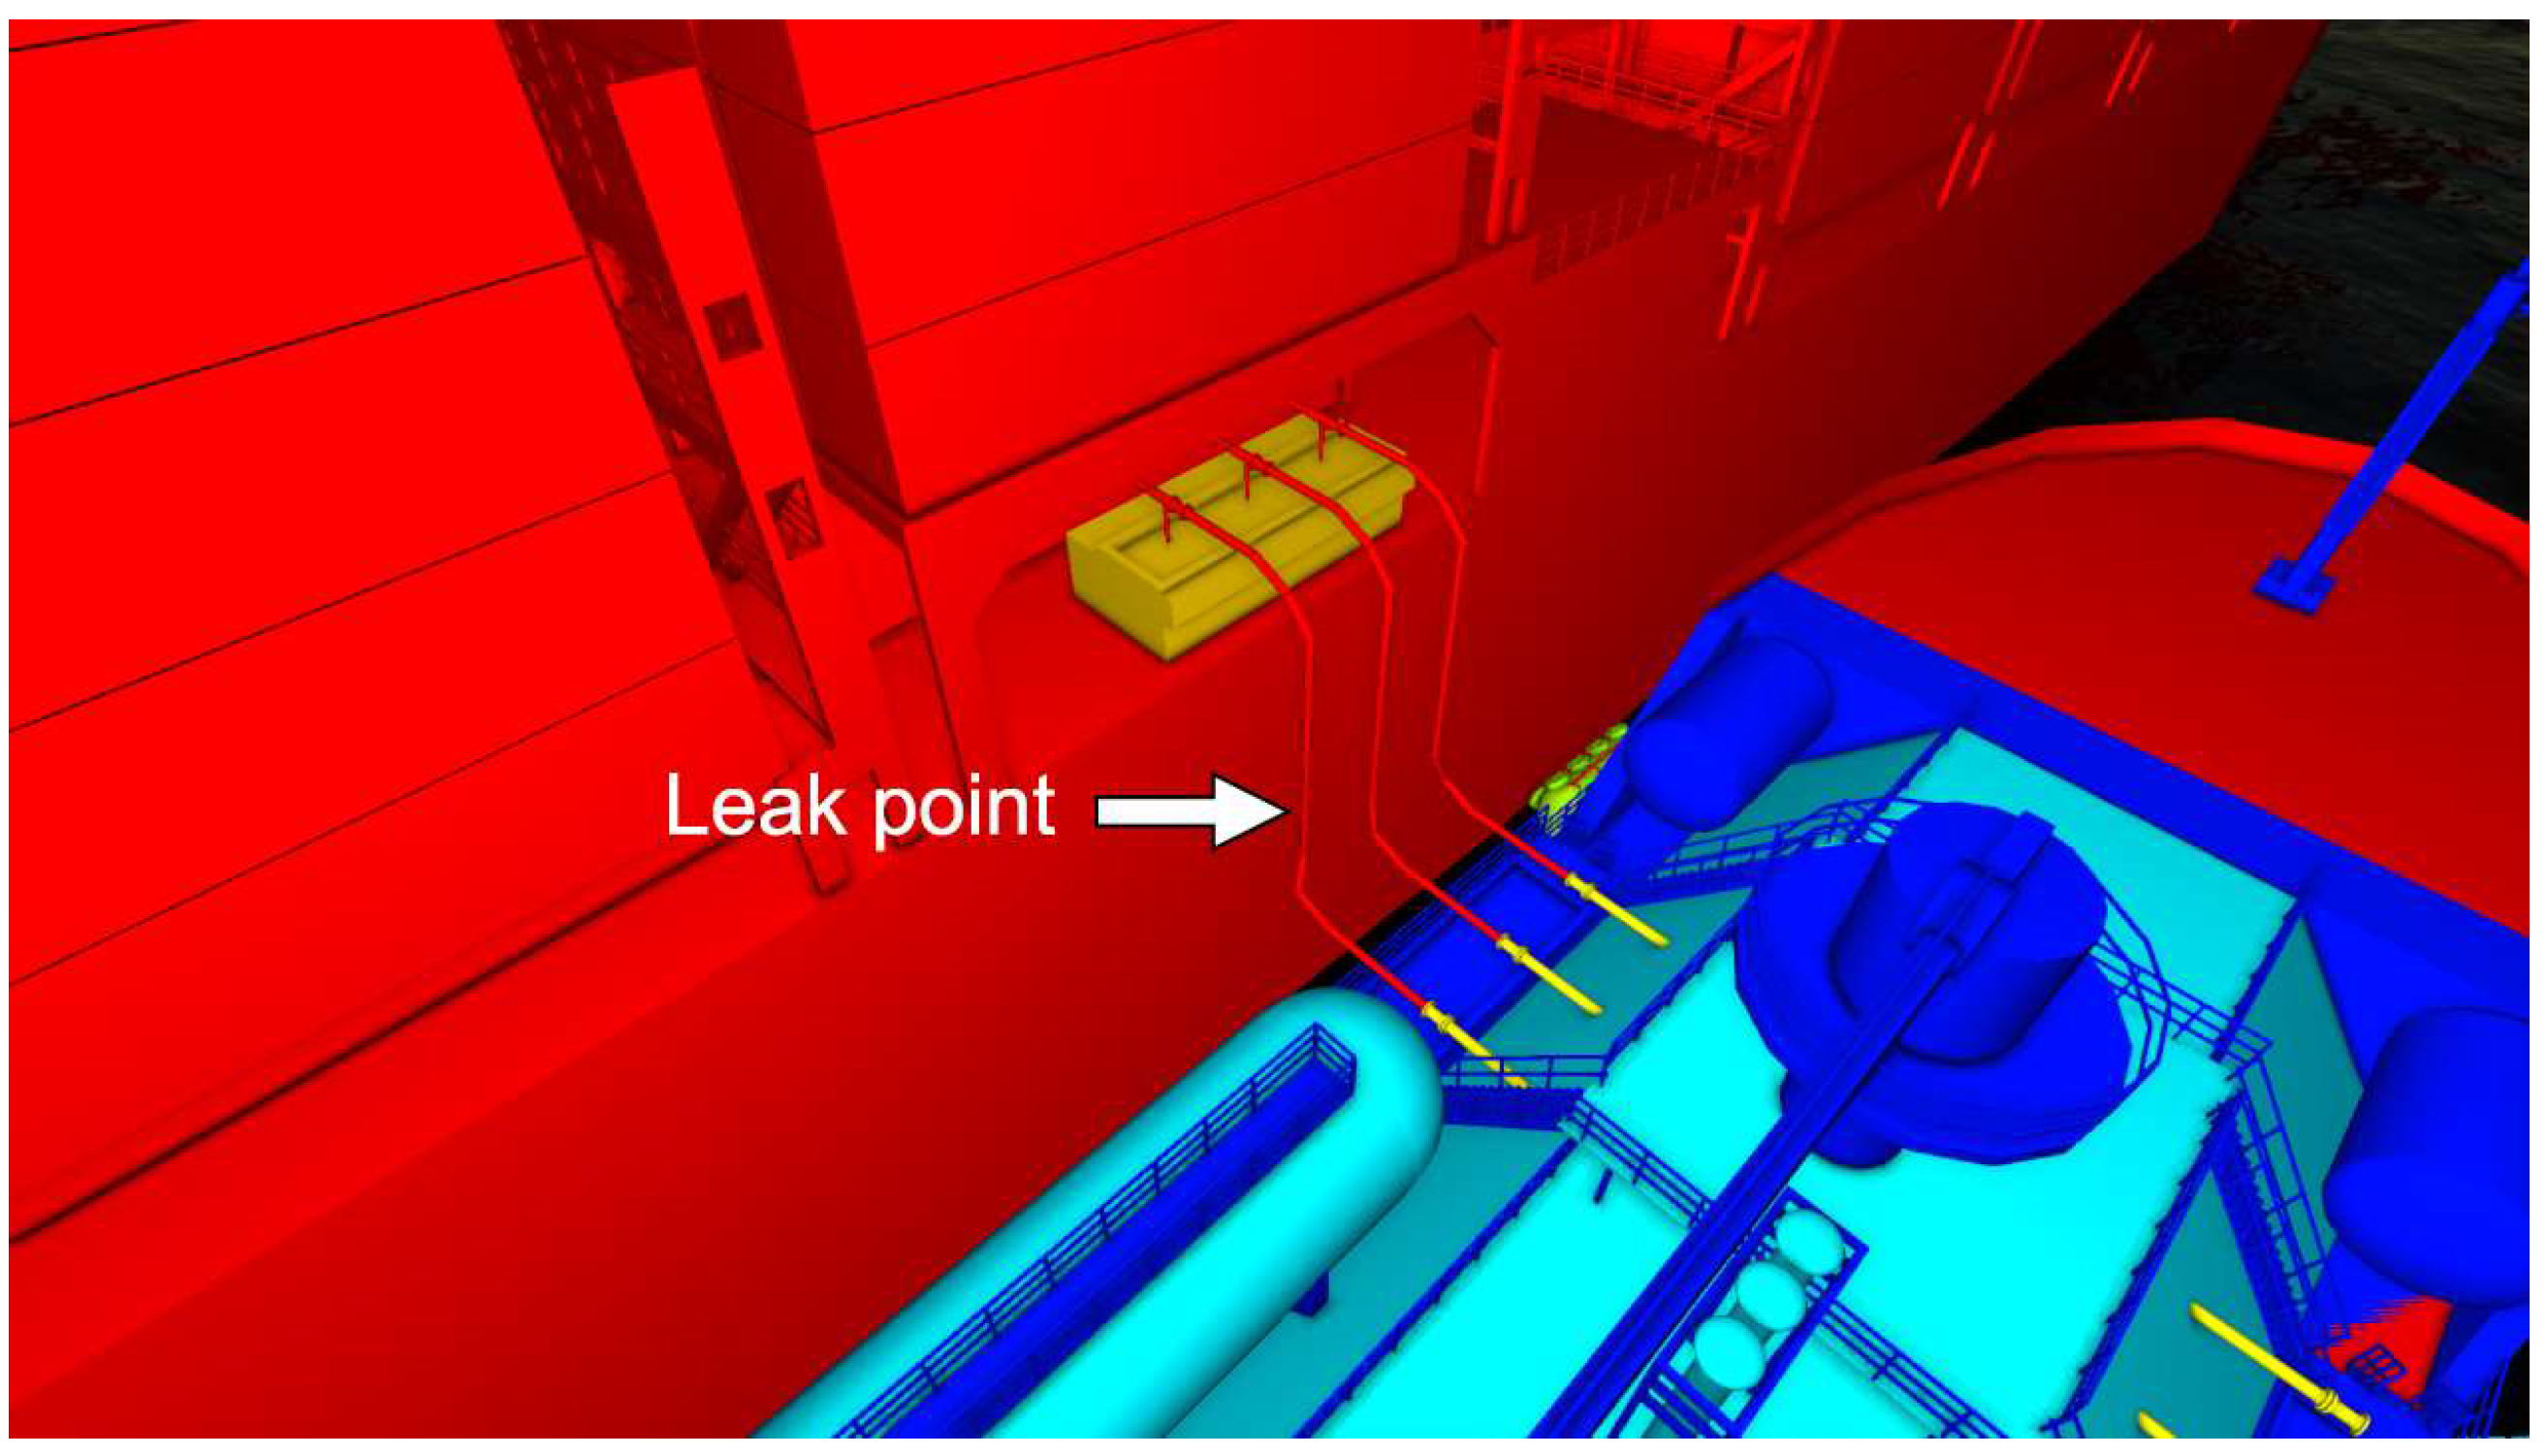
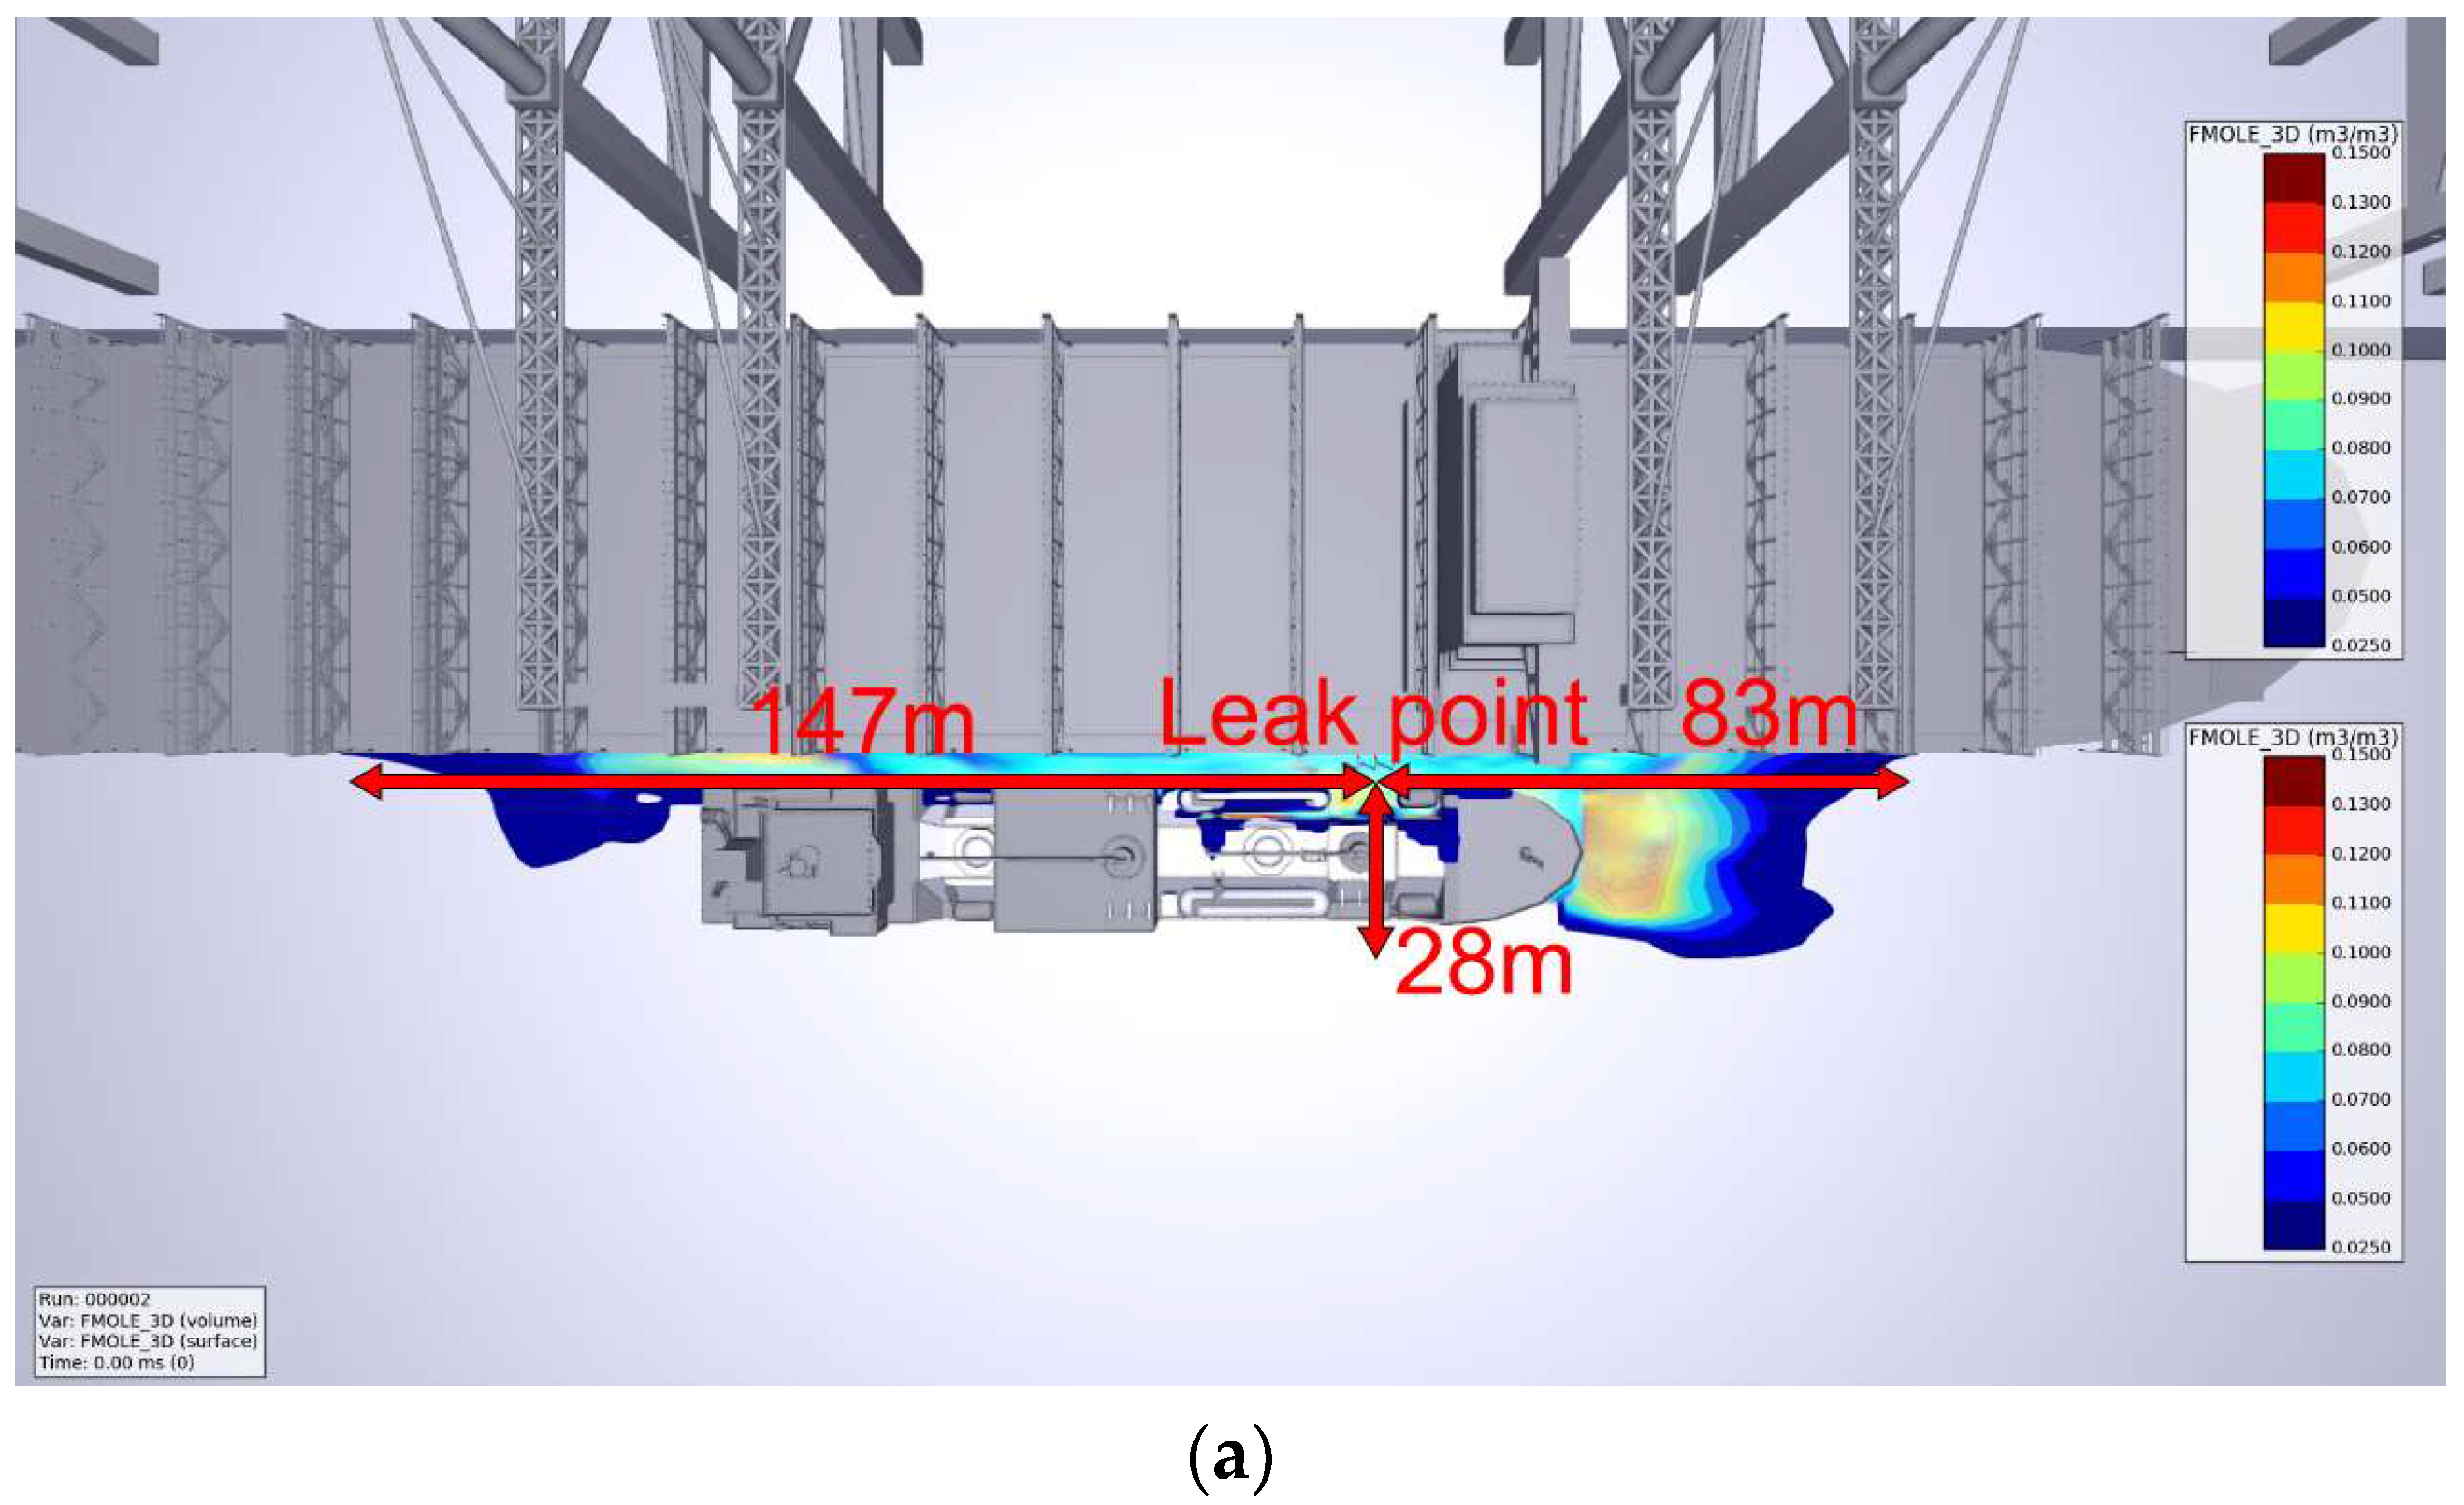
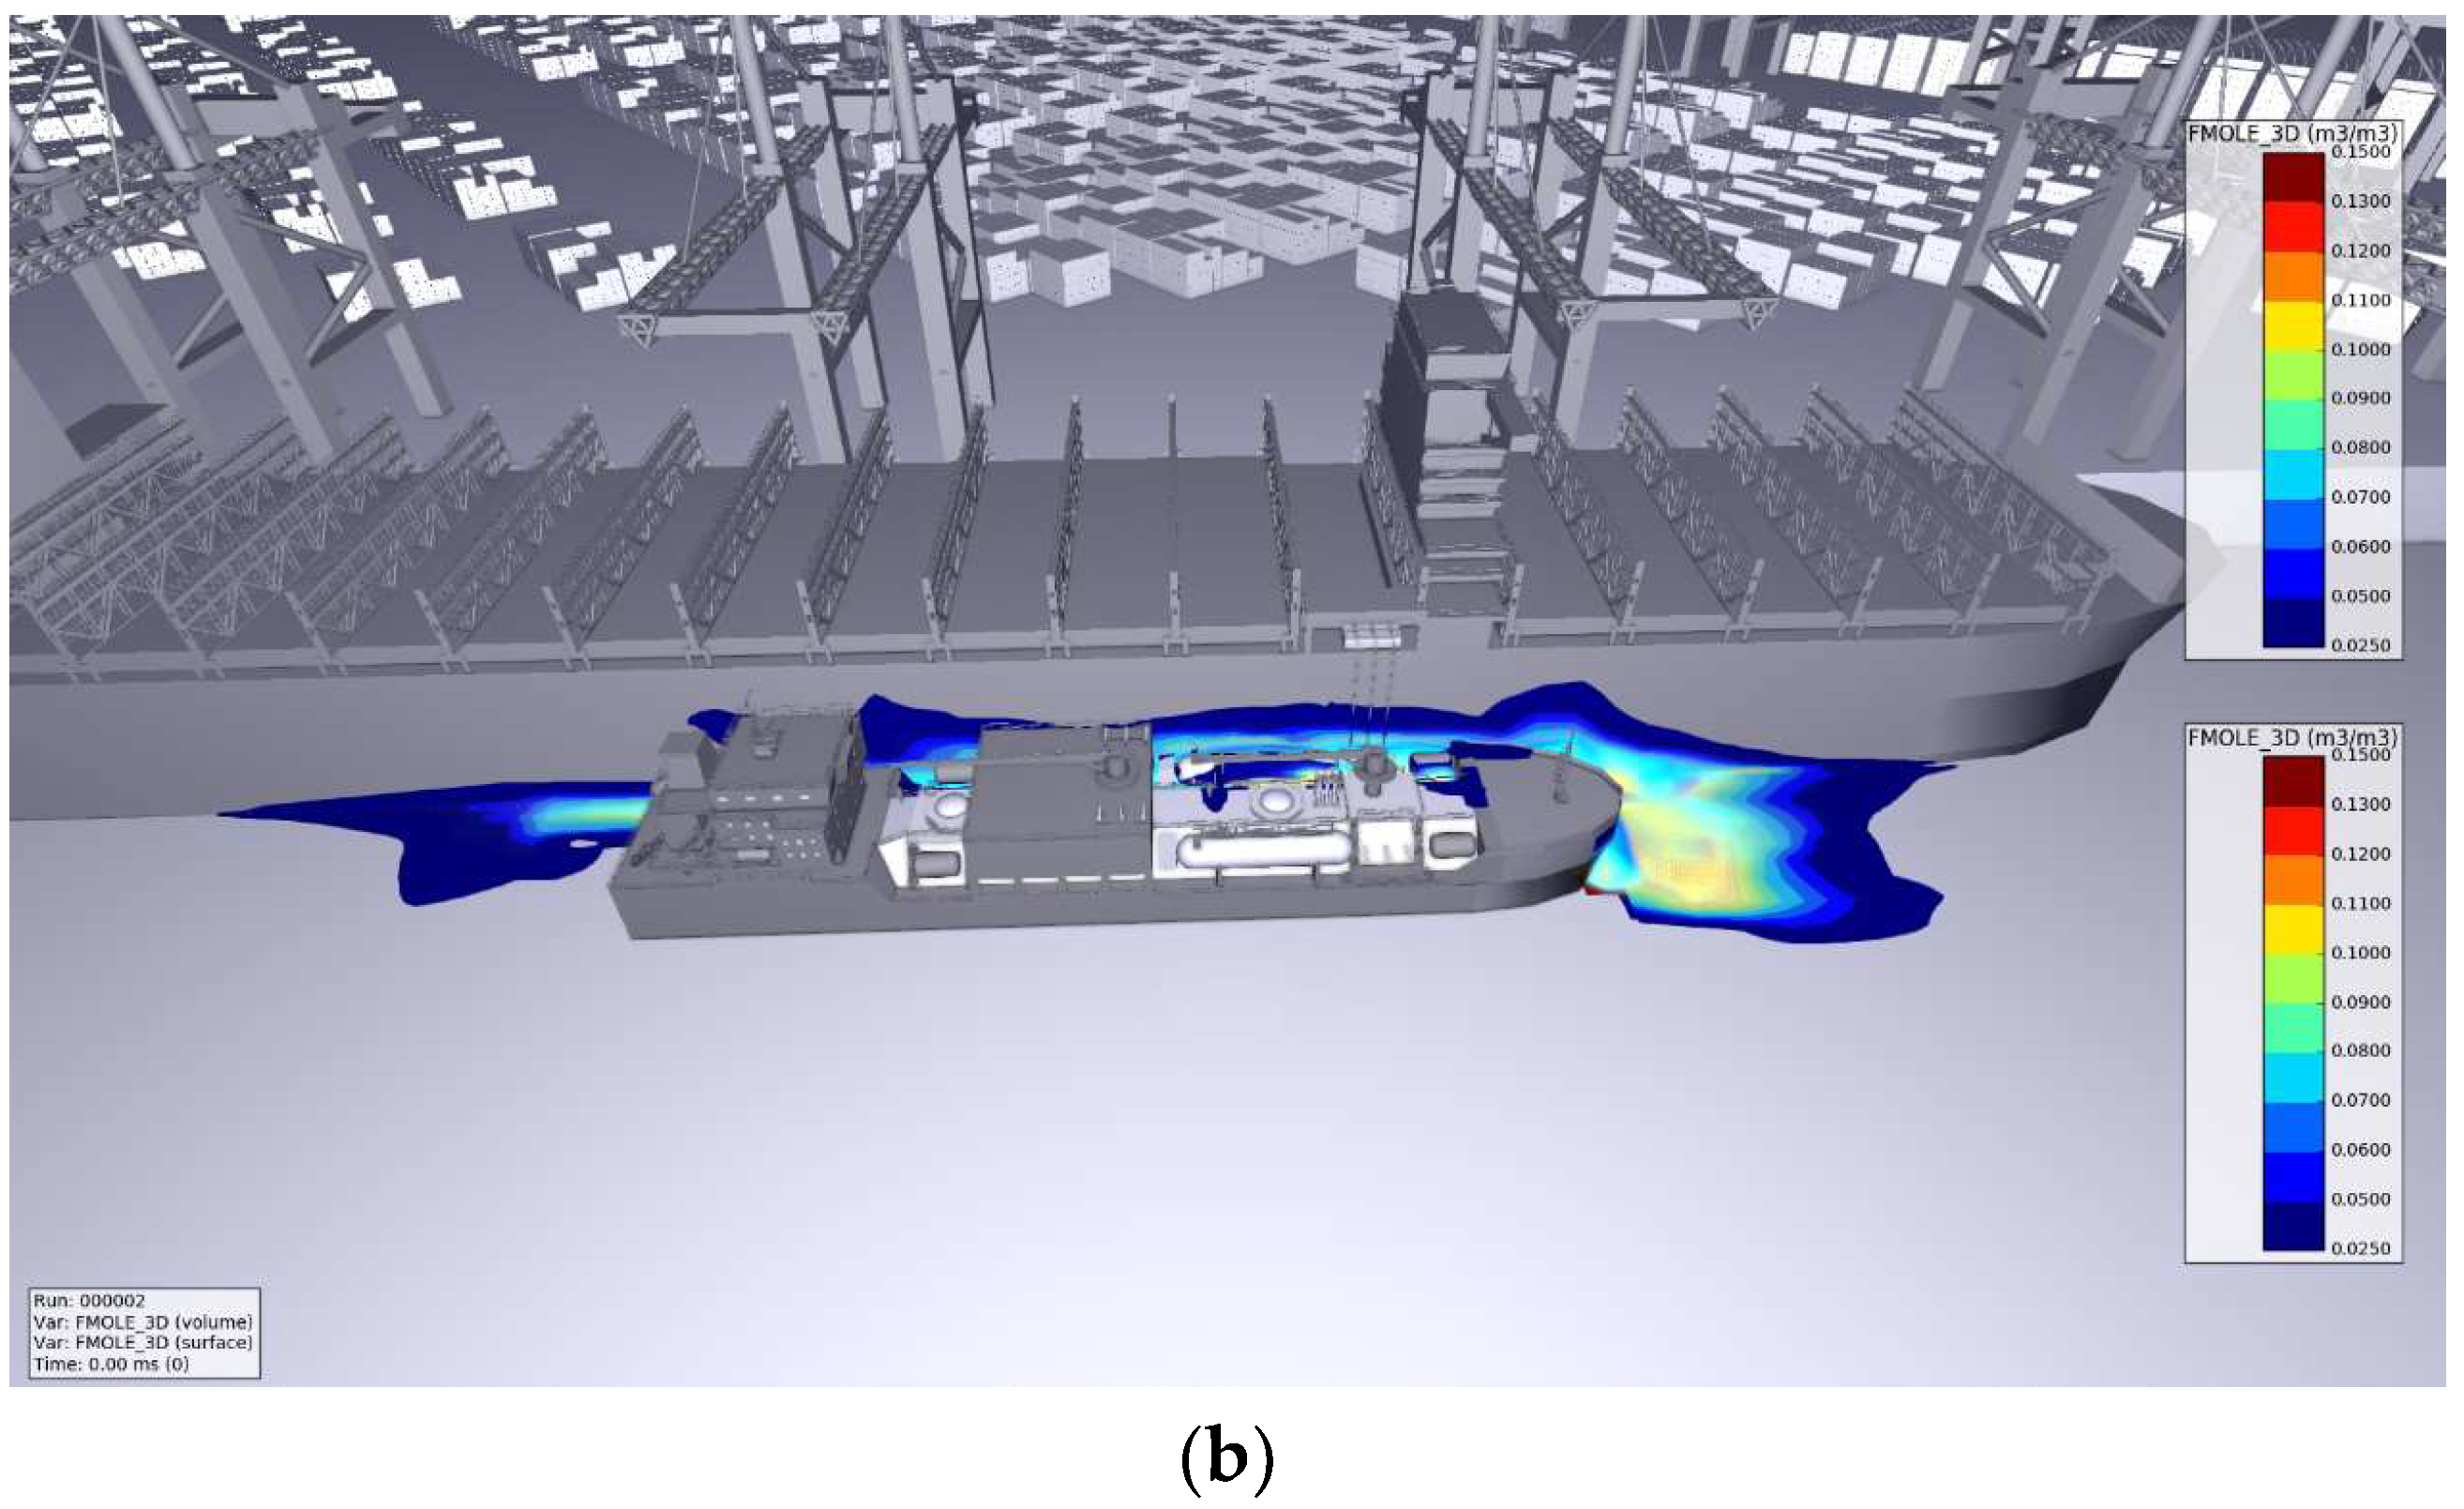
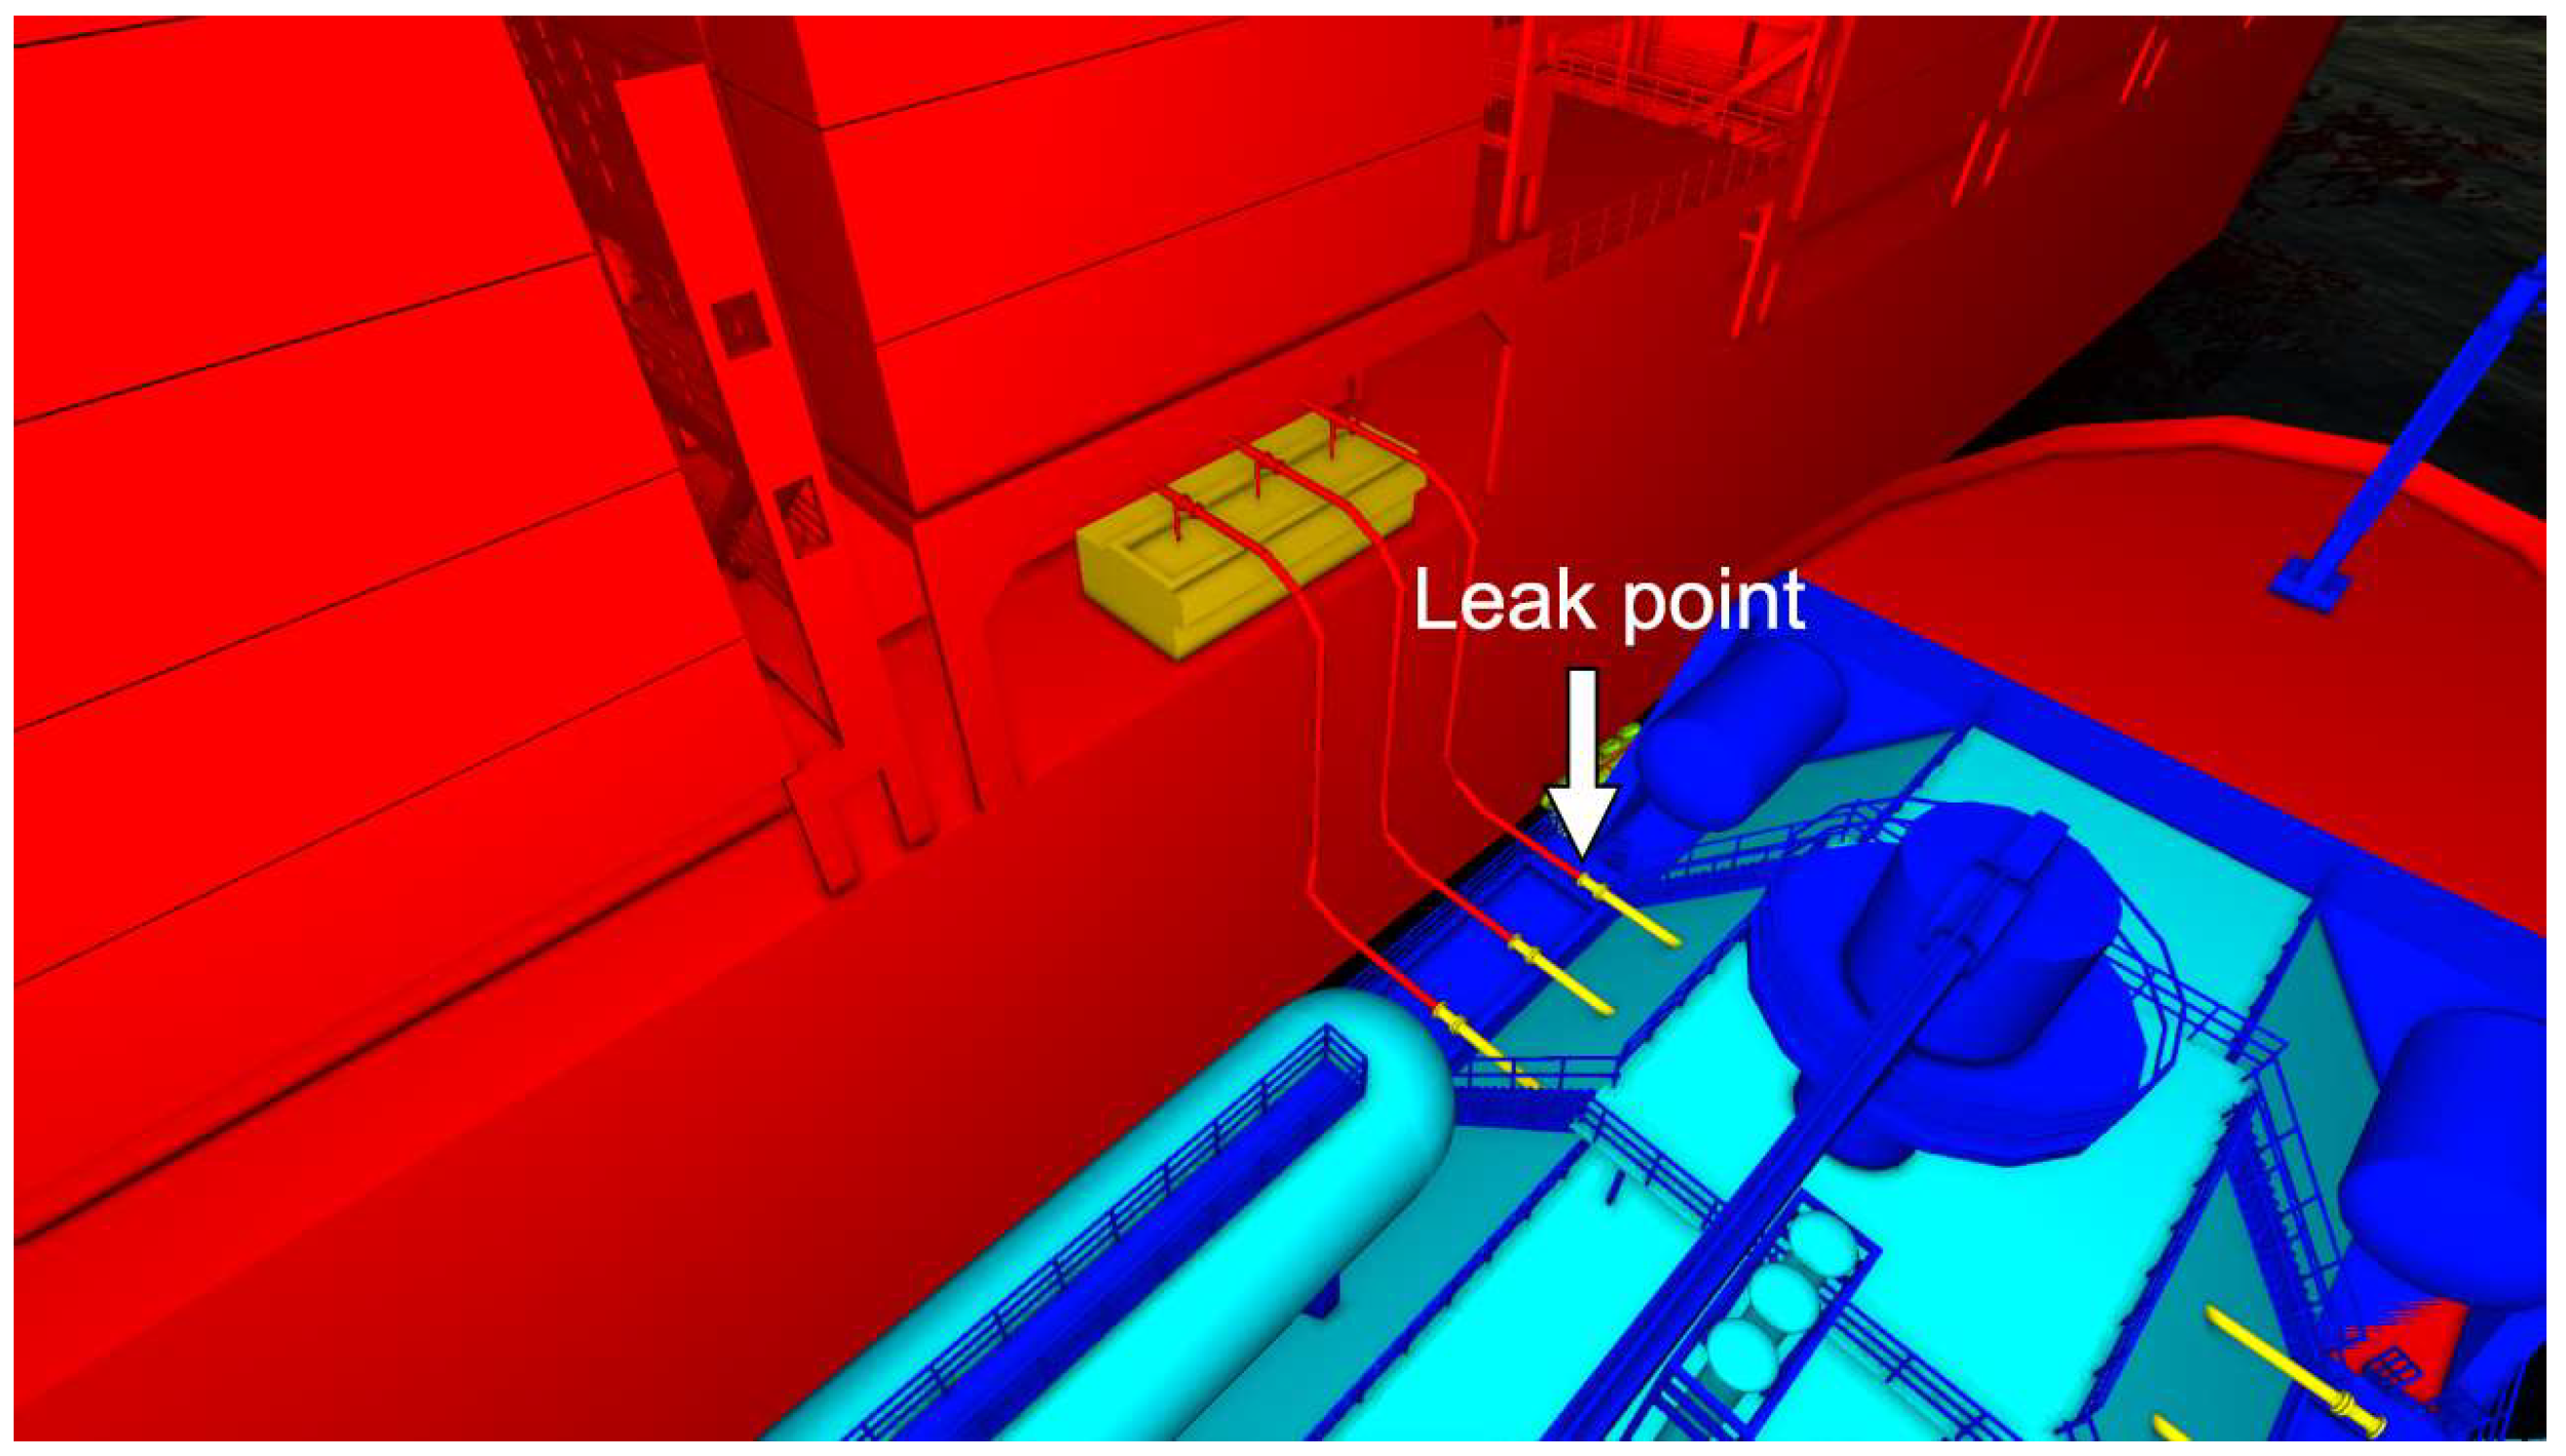
3.3. Leakage at the Bunkering Station Flange Joints of Bunker Vessel
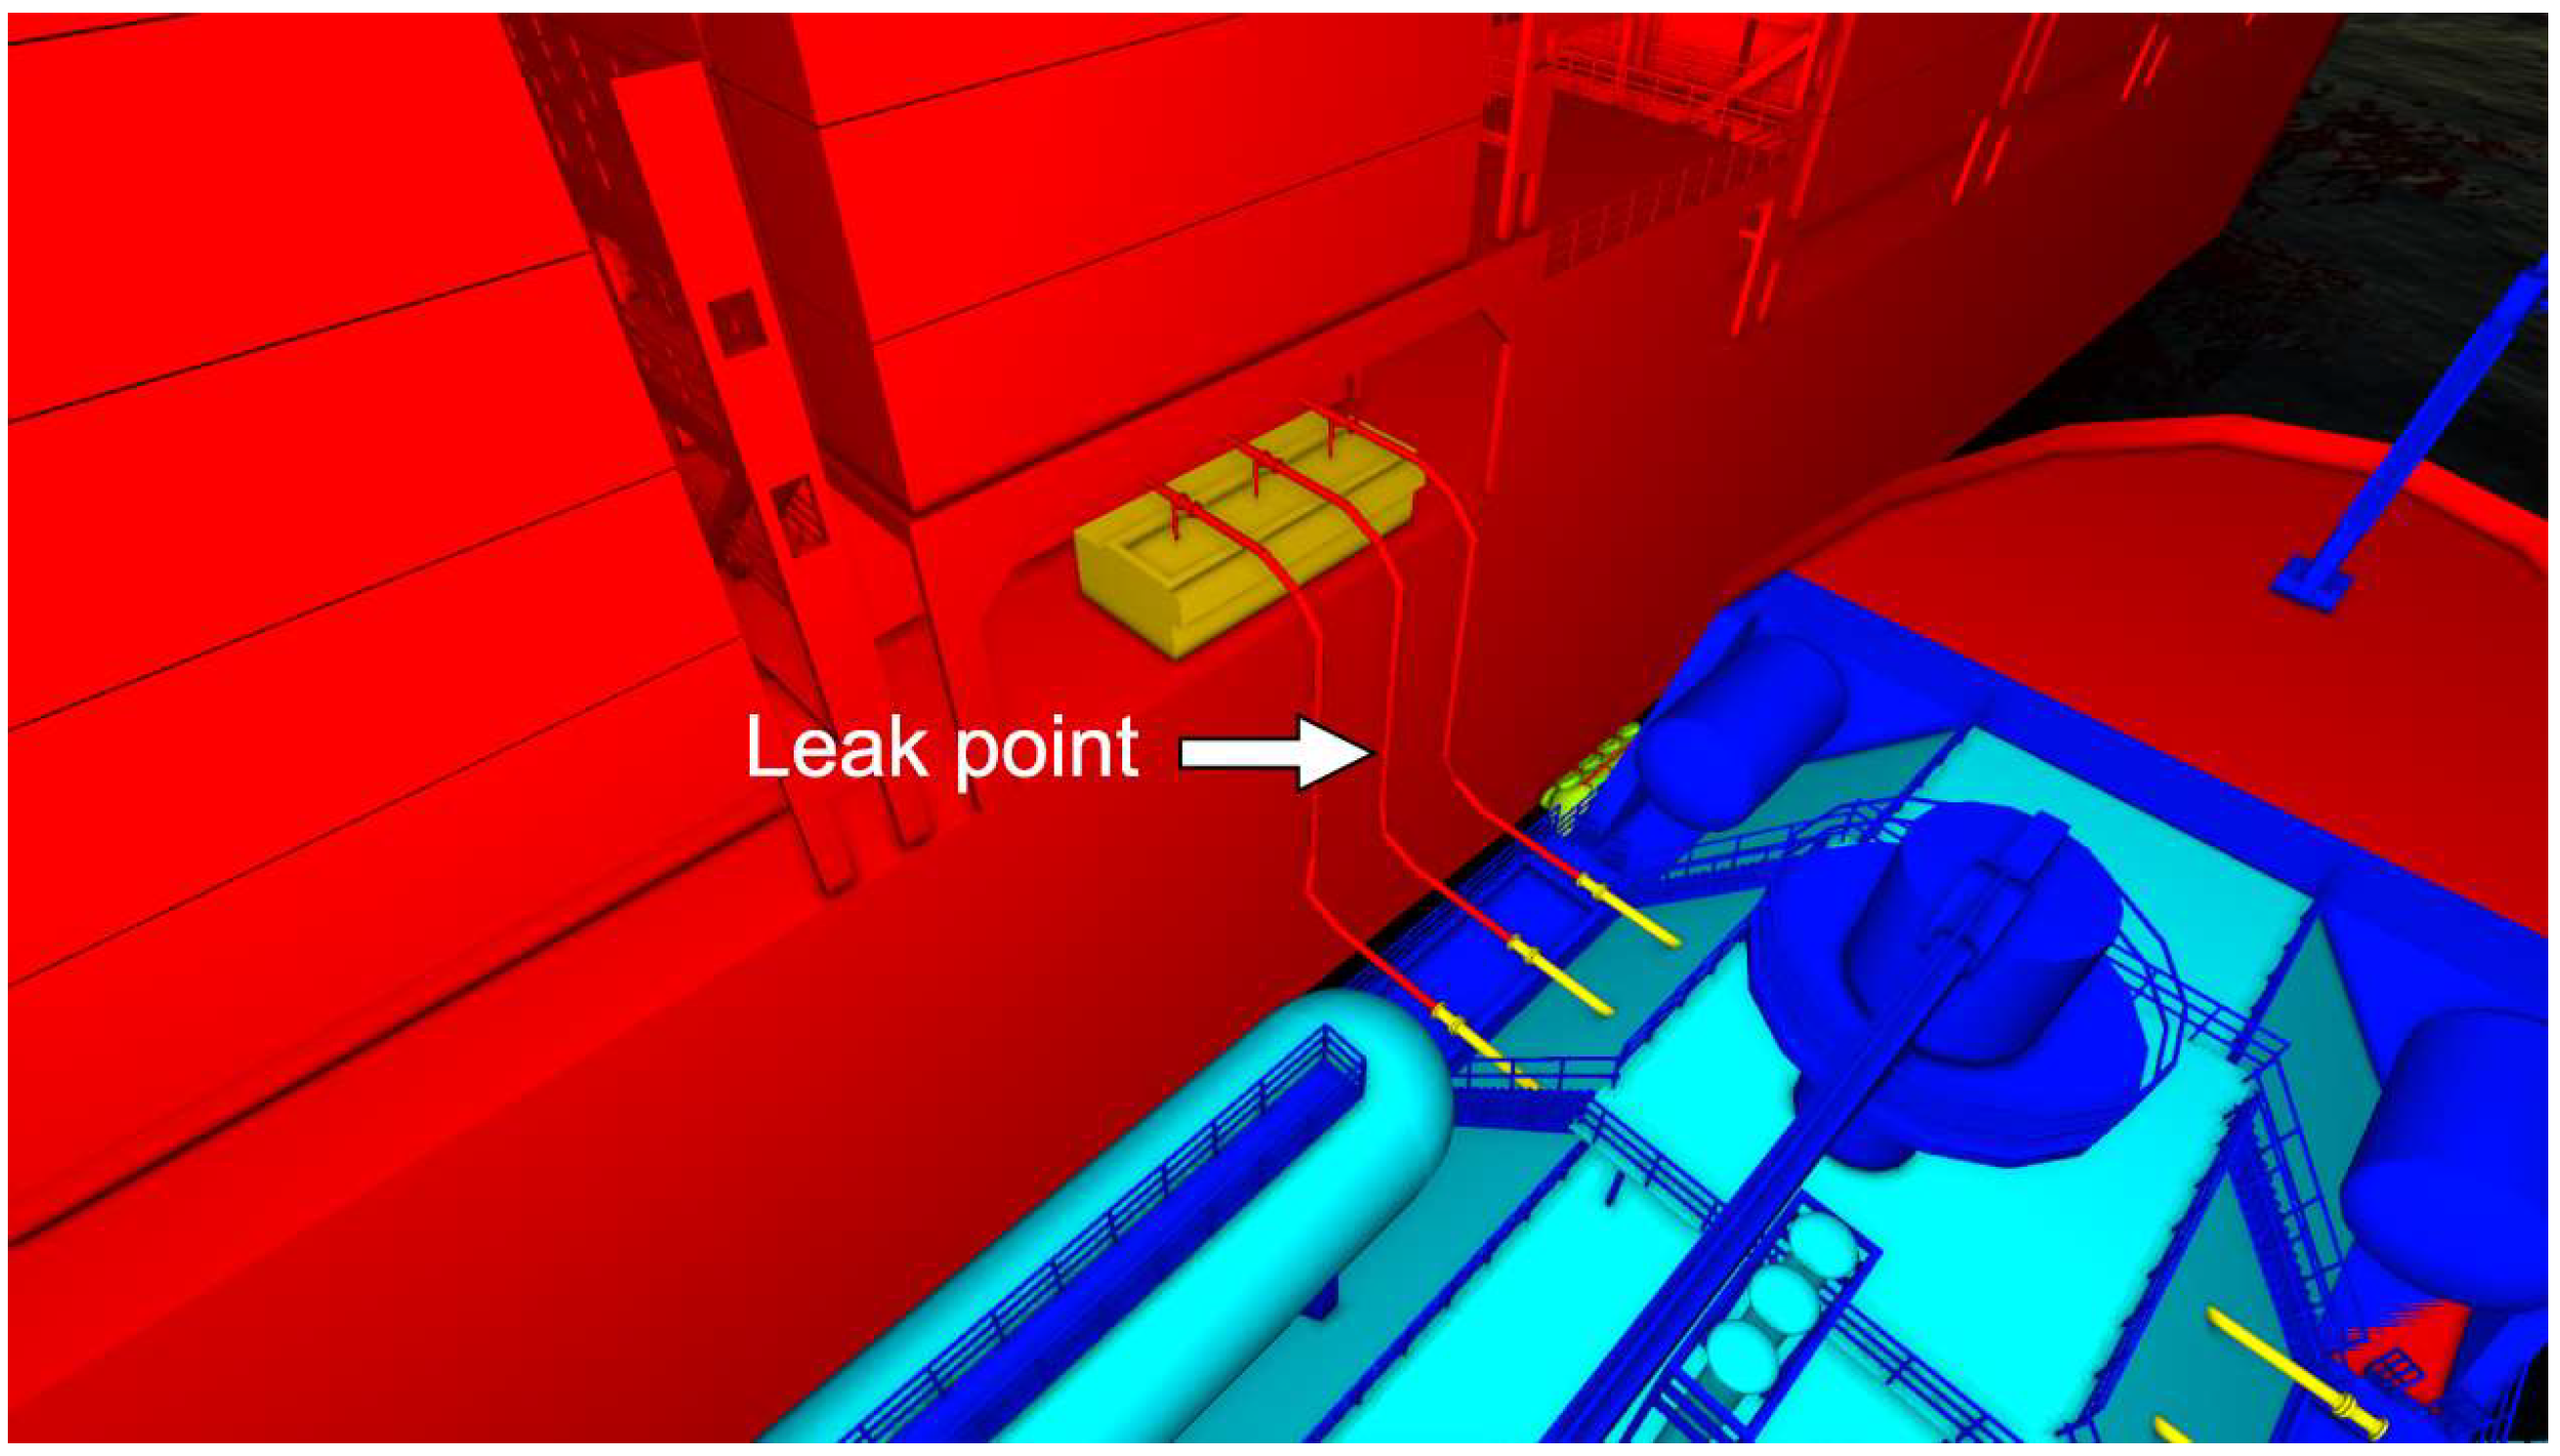
Scenario 3 considers a leak at a flange joint of the bunkering station of a bunker vessel, the location of which is shown in
Figure 12. Based on the relevant databases [
27,
28,
29], a typical leakage diameter of 30 mm and a cumulative leakage time of 60 s are selected, and 2.5% of the volume concentration of methane in the air is chosen as the diffusion boundary. The direction of the liquid-phase LNG leakage is vertically downwards, considering the wind velocity in the sixteen wind directions of the rising wind diagram. The simulation results for the ballast and laden conditions are shown in
Figure 13 and
Figure 14, respectively.
As can be seen from
Figure 13, under the ballast condition of the container carrier, the shallow draft of the container carrier and the large height difference between the two vessels mean that the combustible vapor cloud leaks and accumulates on the side of the bunker vessel but does not spread to the deck of the receiving vessel. The maximum extent of the combustible vapor cloud is 219 m in the vessel length direction and 25.5 m in the vessel width direction.
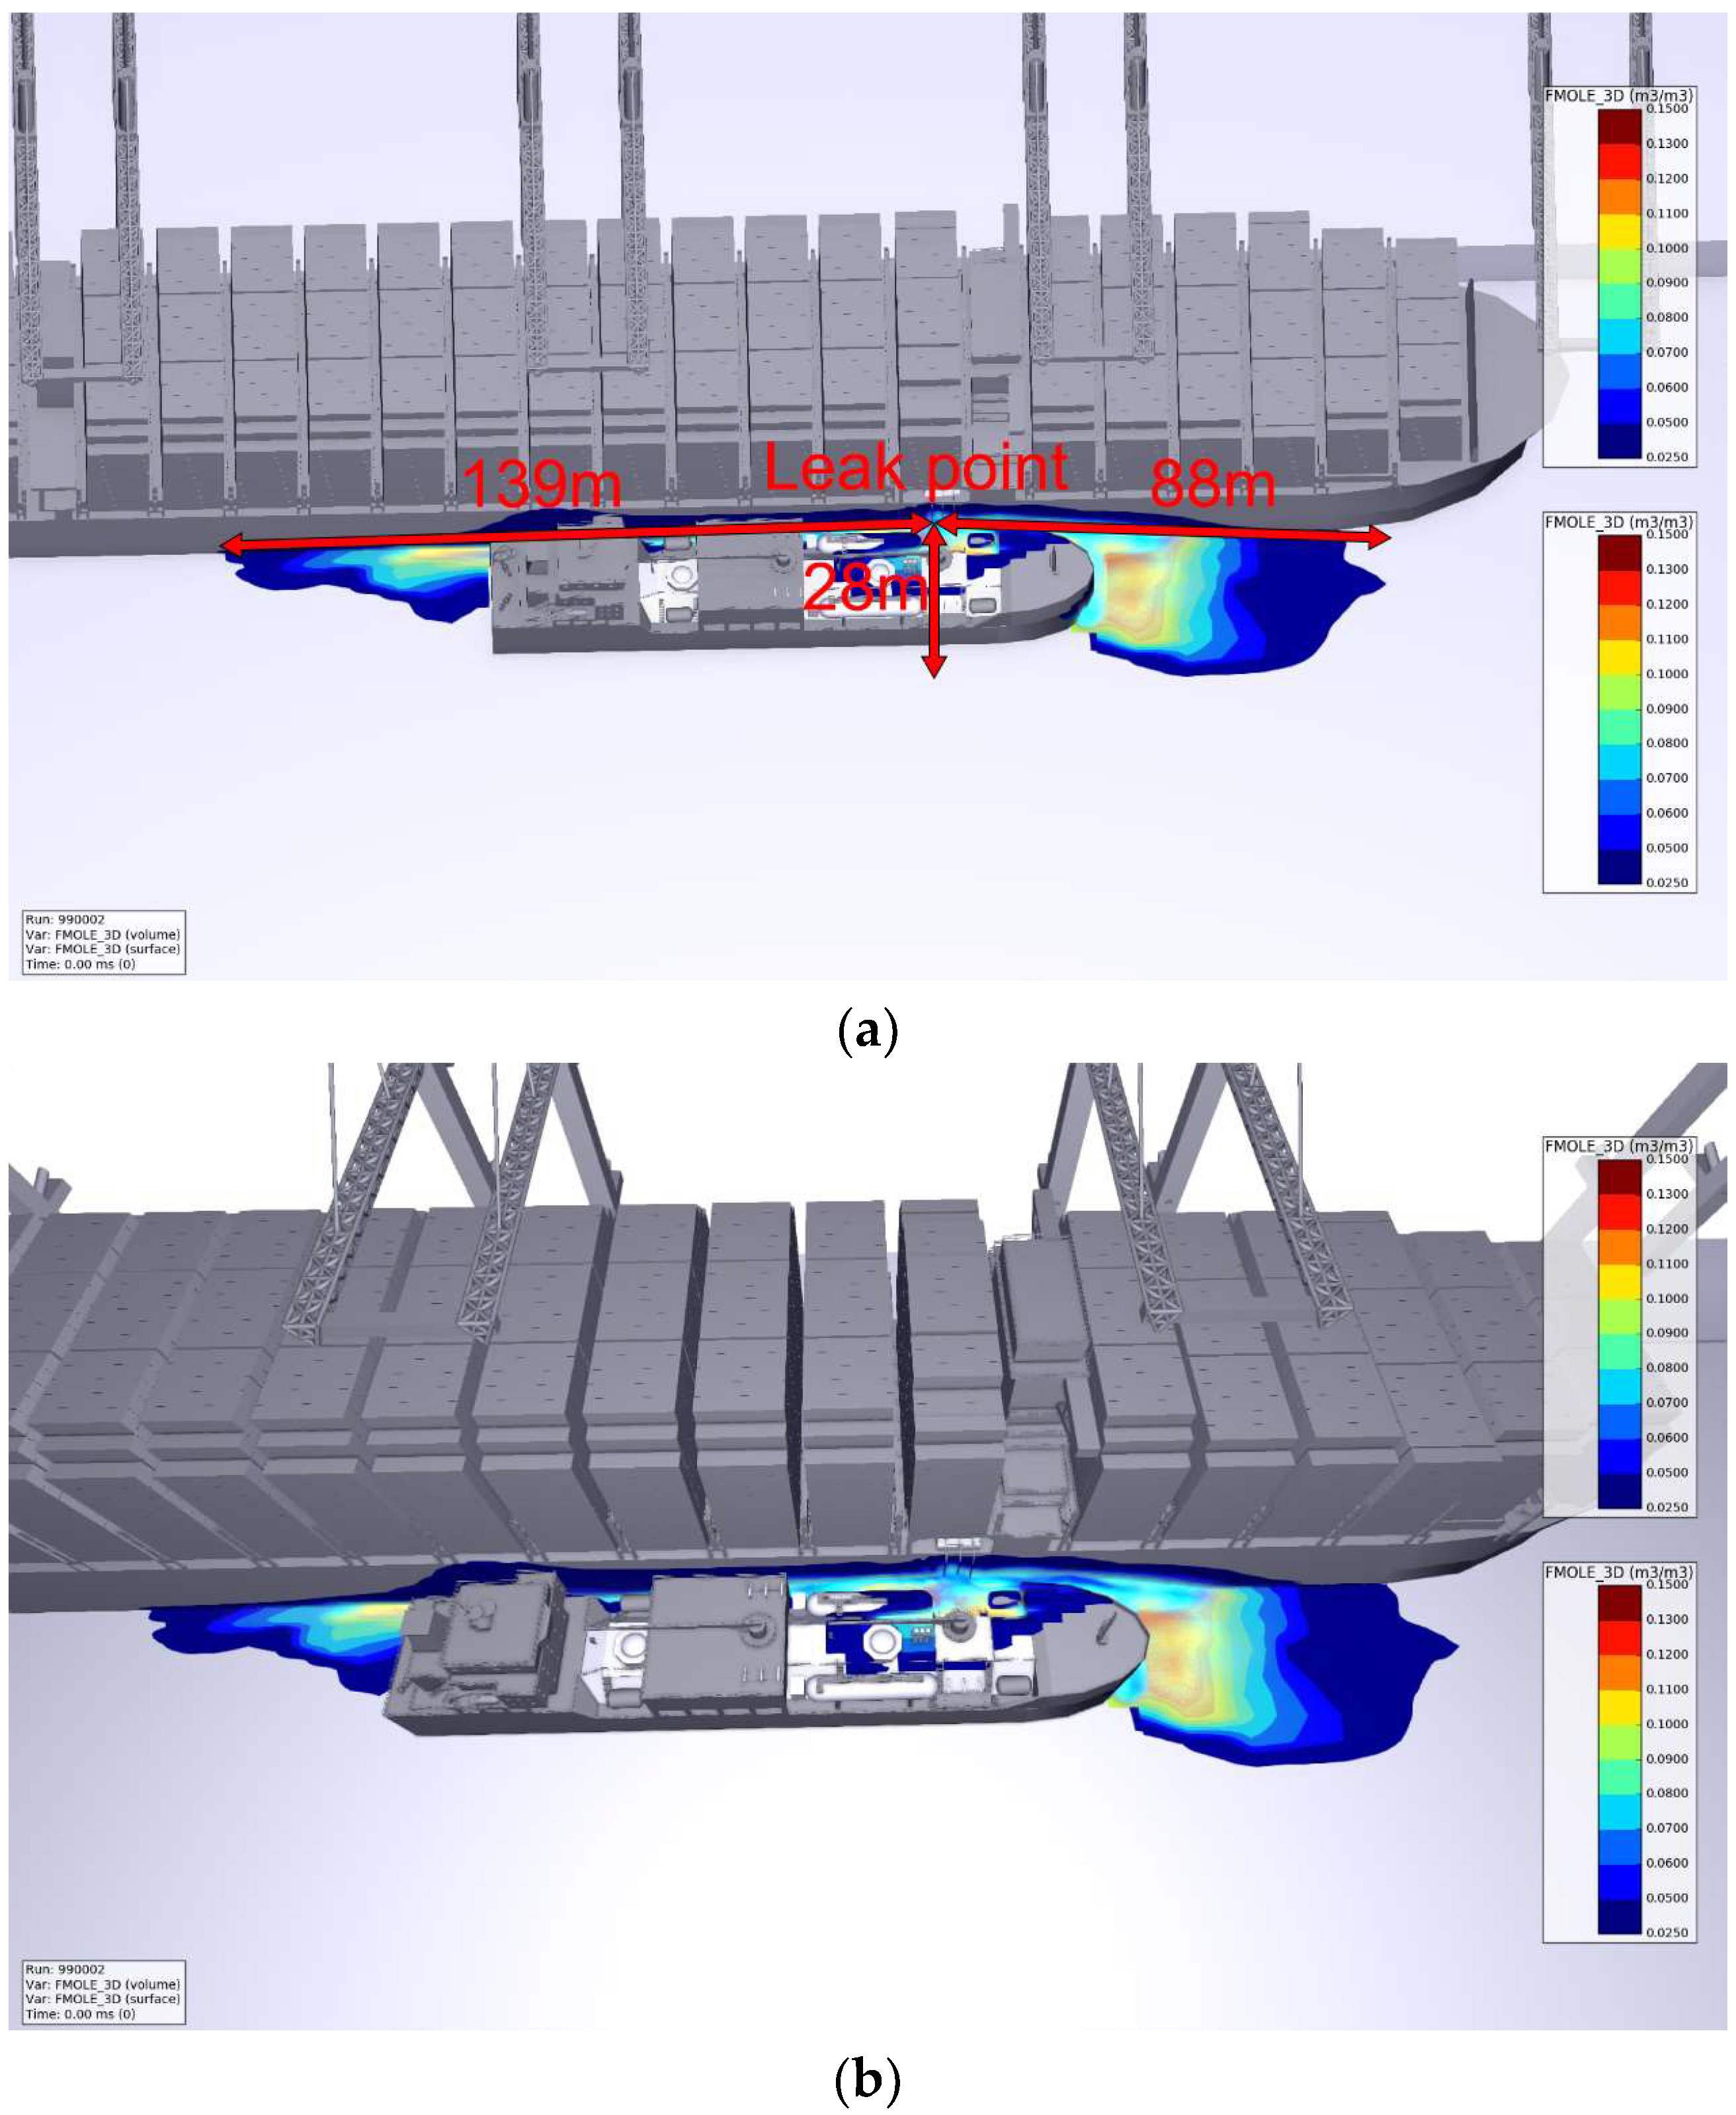
As can be seen from
Figure 14, when the container carrier is laden, if a leak occurs in a flange joint of the bunkering station of the bunker vessel, the combustible vapor cloud formed by the leak spreads along the inside of the sandwich channel of the two vessels and a small amount spread to the deck of the bunker vessel. The vapor fails to reach above the deck of the receiving vessel. The maximum spread of the combustible vapor cloud is 330 m in the vessel length direction and 25.5 m in the vessel width direction.
When comparing the empty and laden conditions of the container carrier, there is a significant difference in the diffusion range of the combustible vapor cloud along the side of the bunker vessel. This is caused by changes in the local wind field and wind shear (i.e., distribution of wind speed in space) resulting from the change in the height difference between the two vessels, which affects the extent of combustible vapor cloud dispersion.
3.4. Leakage at the Bunkering Station Flange Joints of Receiving Vessel
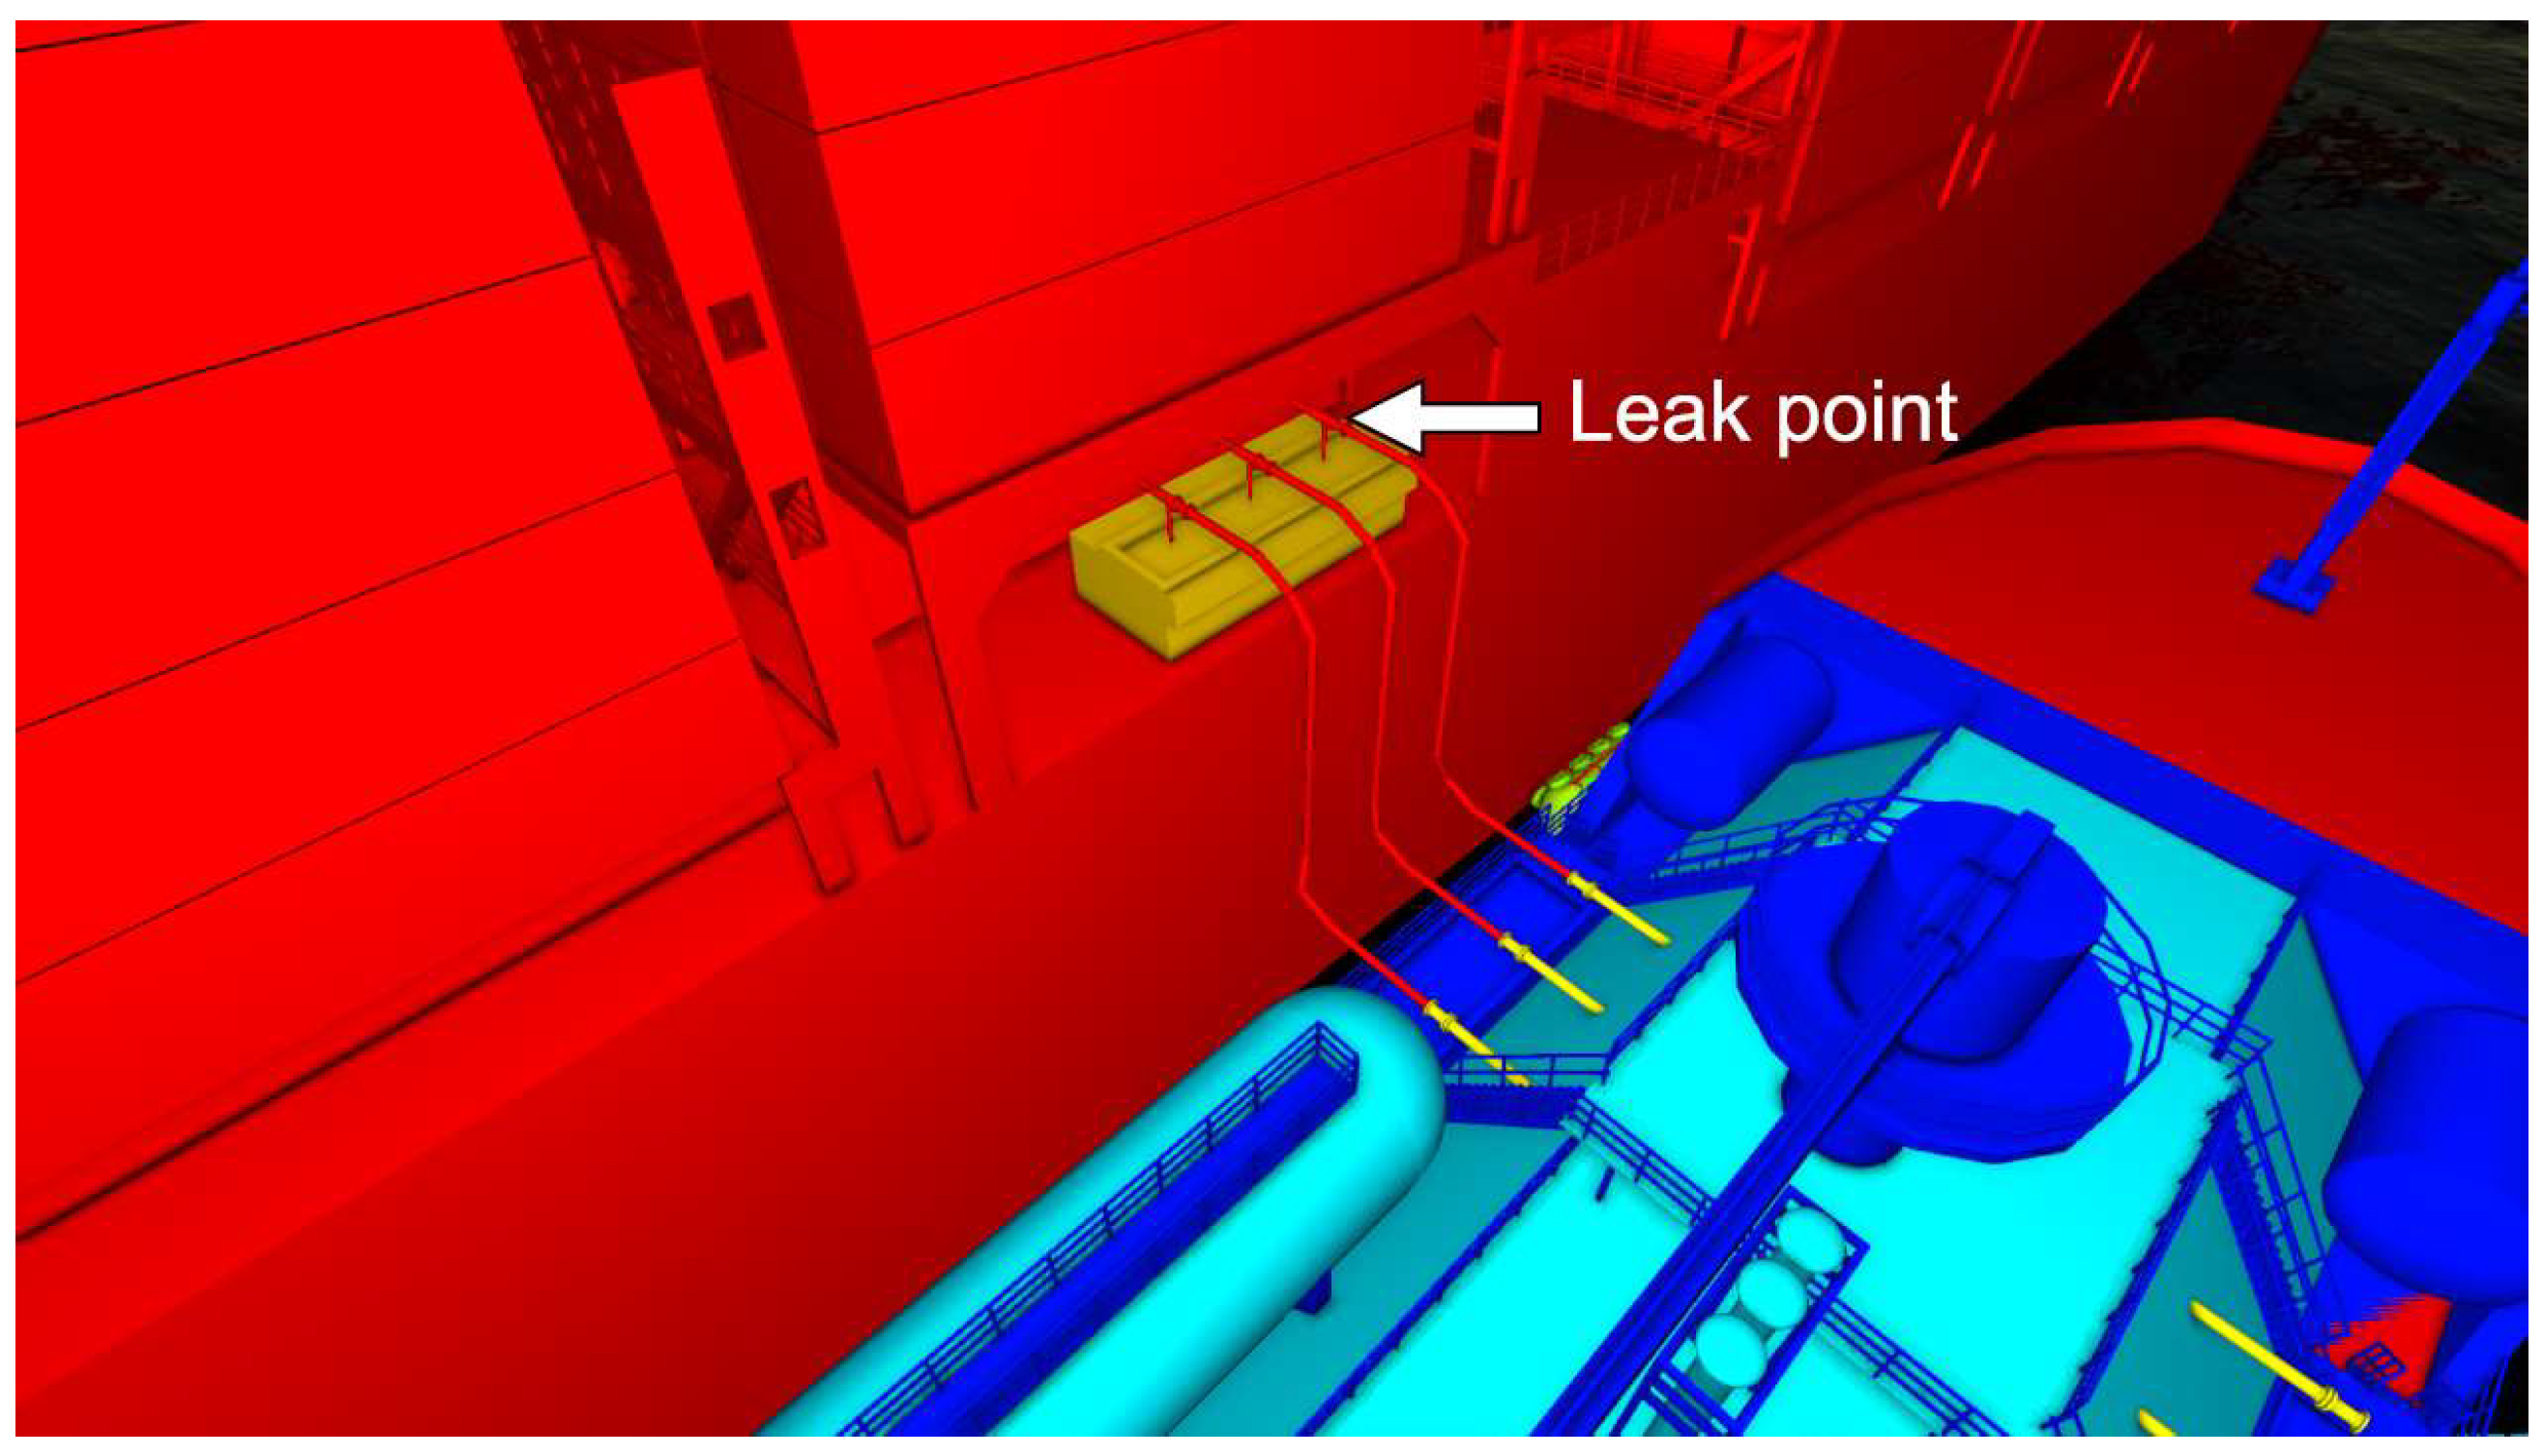
Scenario 4 considers a leak at a flange joint of the bunkering station of the receiving vessel, the location of which is shown in
Figure 15. Based on the relevant databases [
27,
28,
29], a typical rupture diameter of 30 mm and a cumulative leakage time of 60 s were selected, and 2.5% of the volume concentration of methane in the air was chosen as the diffusion boundary. Considering the wind velocity in the sixteen wind directions of the wind rose diagram, the direction of liquid-phase LNG leakage is vertically downwards. The simulation results for the ballast and laden conditions are shown in
Figure 16 and
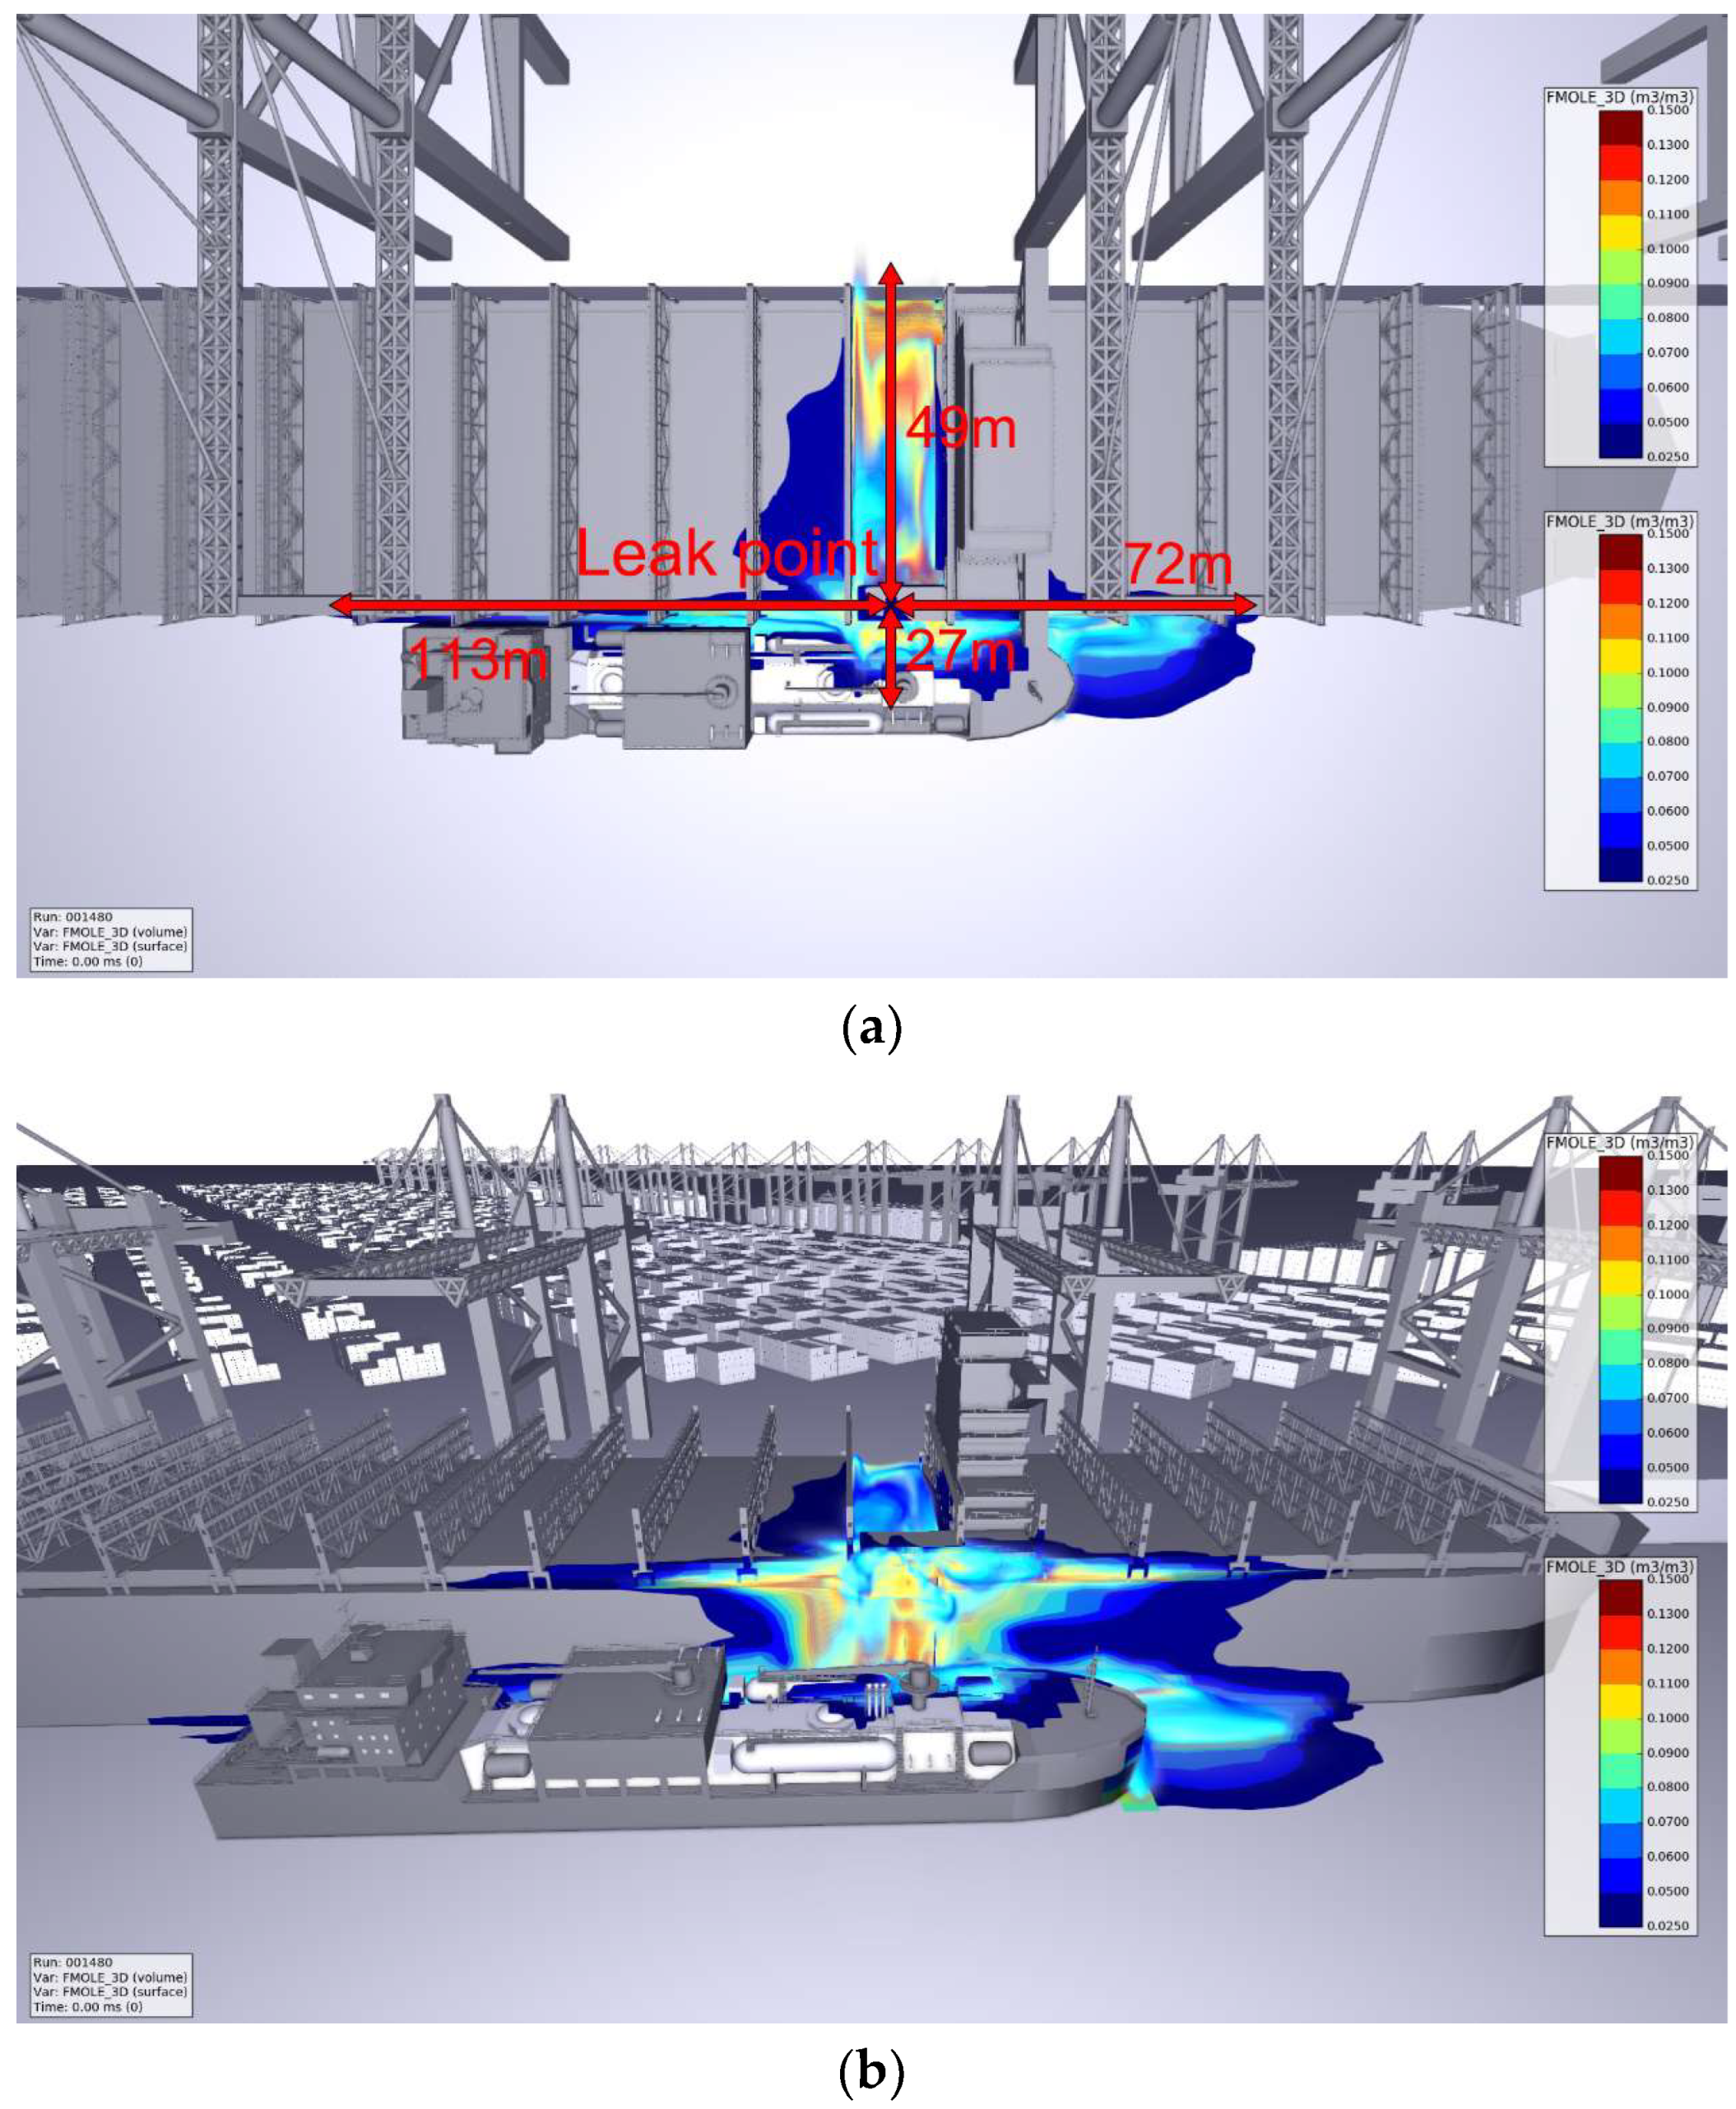
Figure 17, respectively.
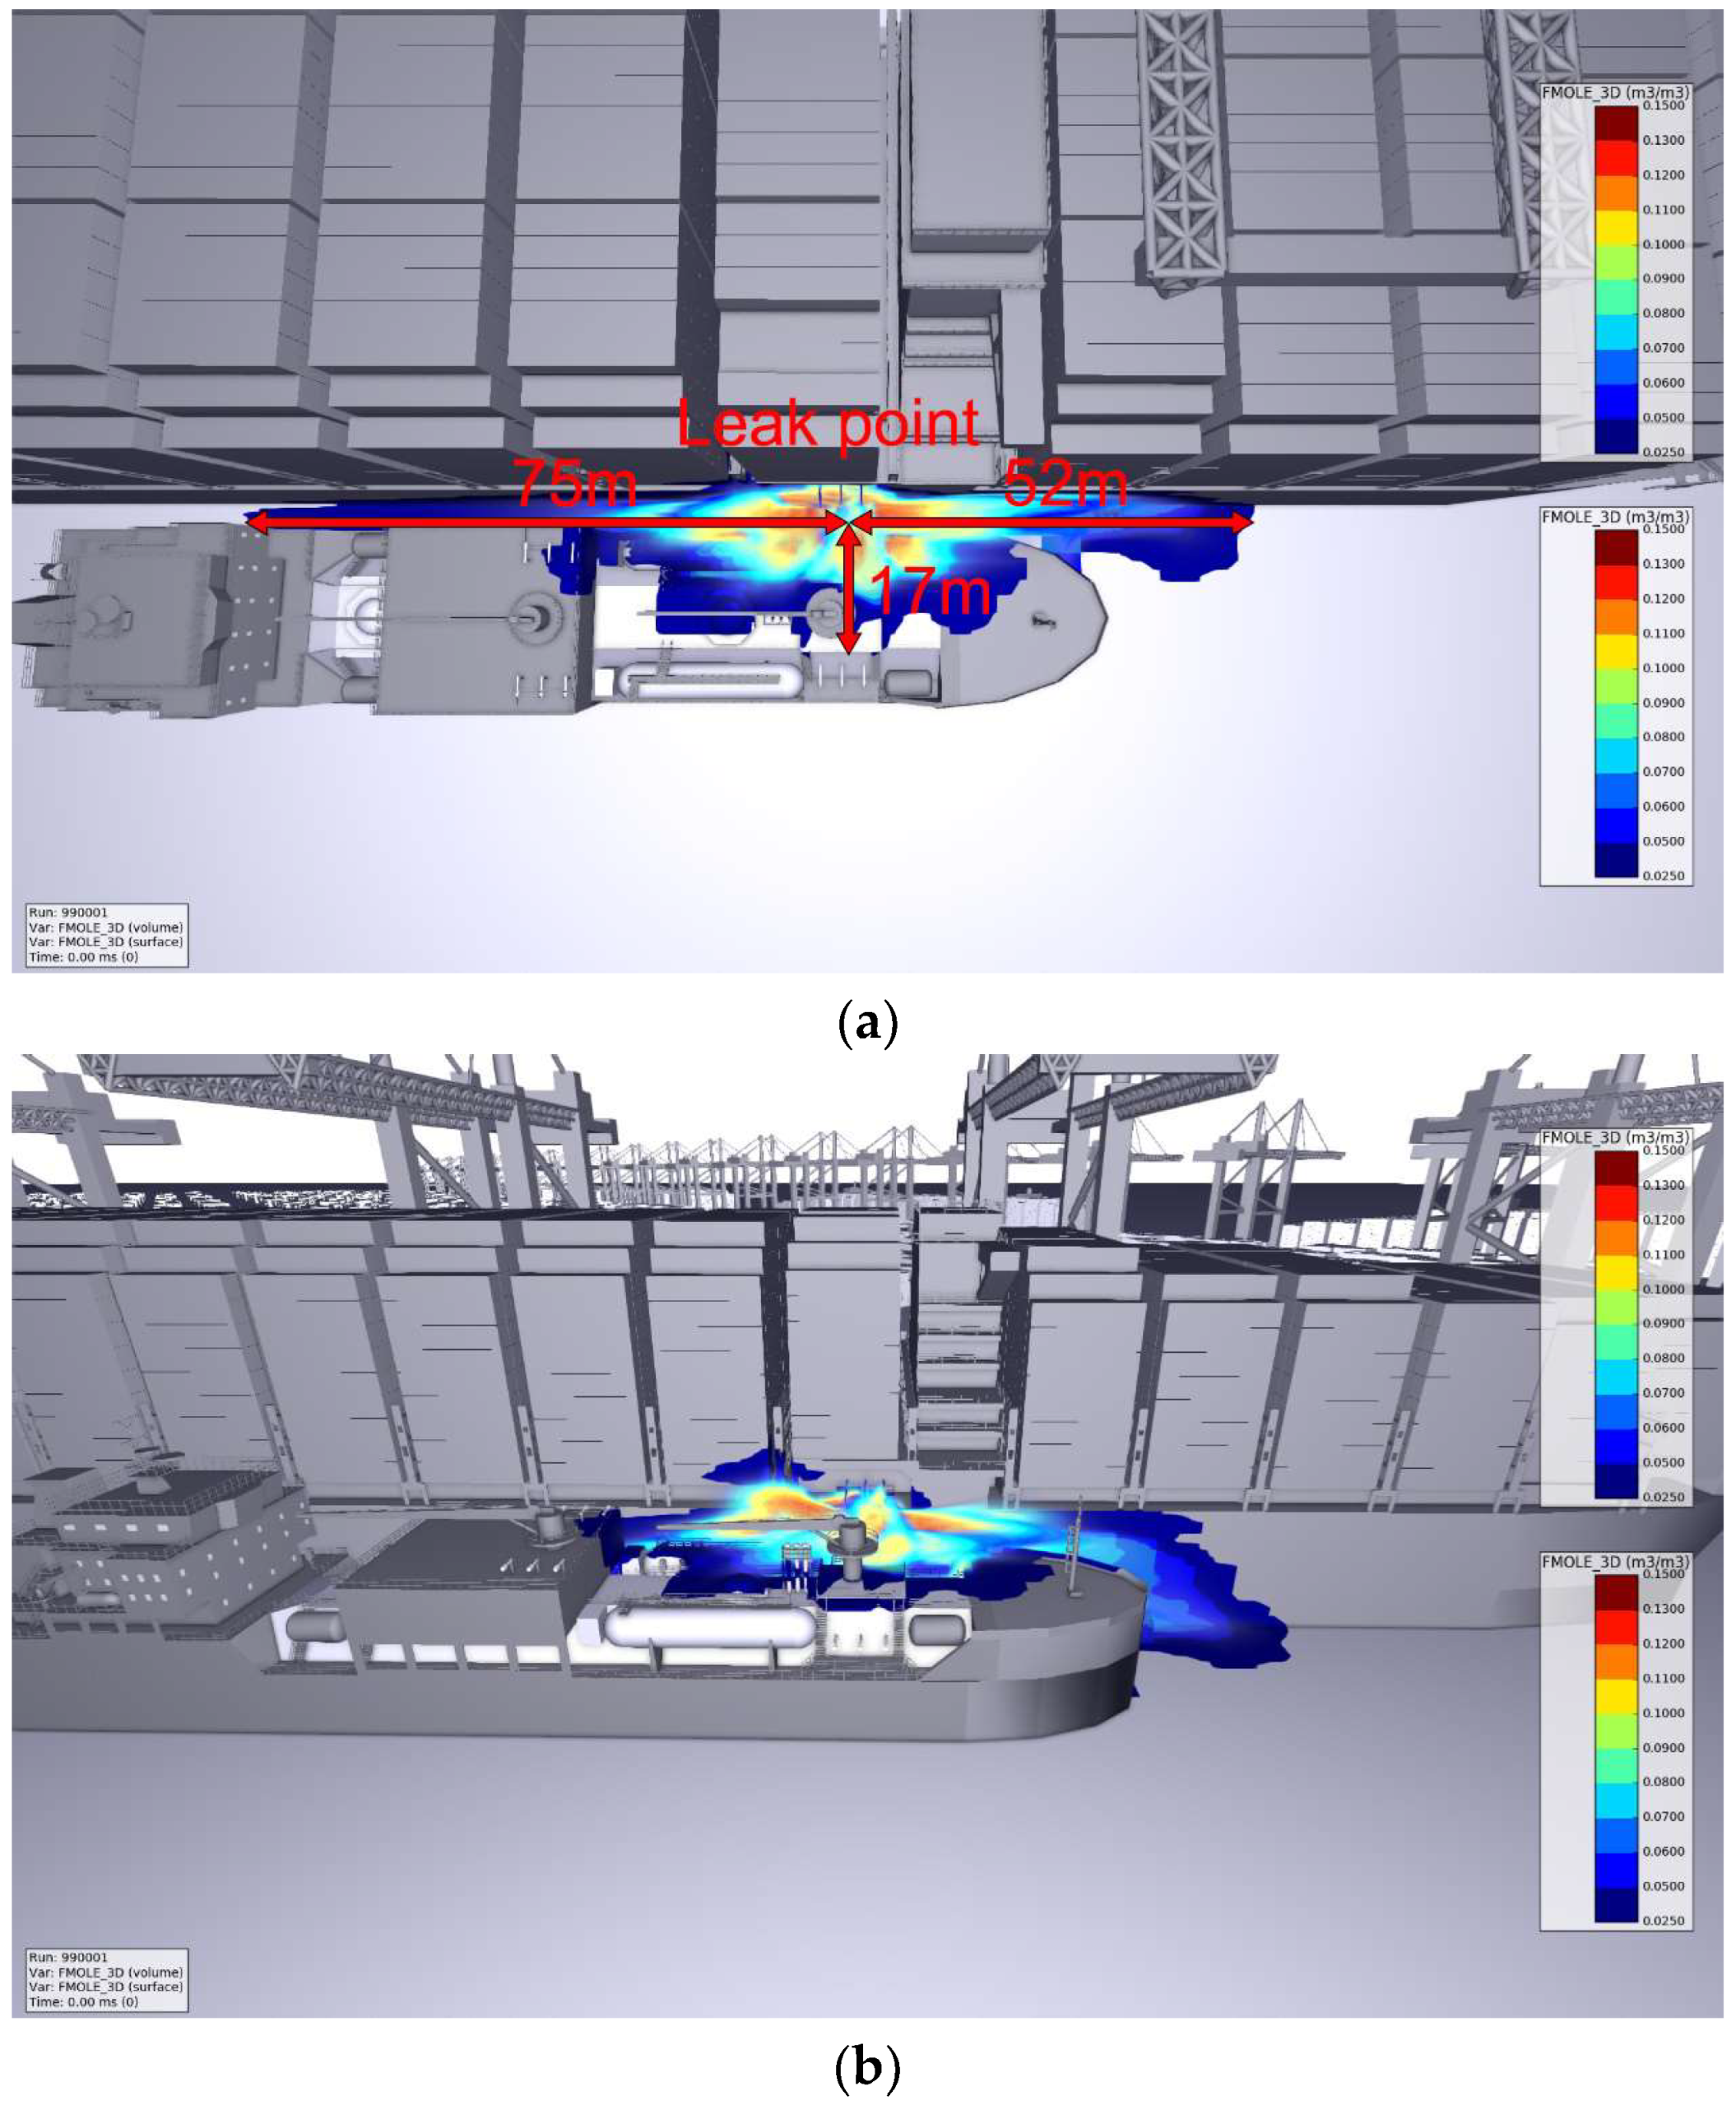
As can be seen from
Figure 16, when a leak occurs in a flange joint of the bunkering station on the container carrier under ballast conditions, the leaking LNG will evaporate in large quantities to produce NG, forming a combustible vapor cloud. The combustible vapor cloud spreads upwards to the deck of the receiving vessel and runs through all the container positions of BAY26 and BAY30, as well as approximately six container positions inwards of BAY34 (i.e., two bays after the bunkering station), two container positions inwards of BAY38 (i.e., two bays after the bunkering station) and BAY42 (i.e., four bays after the bunkering station), four container positions inwards of BAY22 (i.e., one bay before the bow building), and two container positions inwards of BAY18 (i.e., two bays before the bow building). The combustible vapor cloud spreads downwards into the mezzanine areas of the two vessels and onto the deck of the bunker vessel. The maximum spread of the combustible vapor cloud is 185 m in the vessel length direction and 76 m in the vessel width direction.
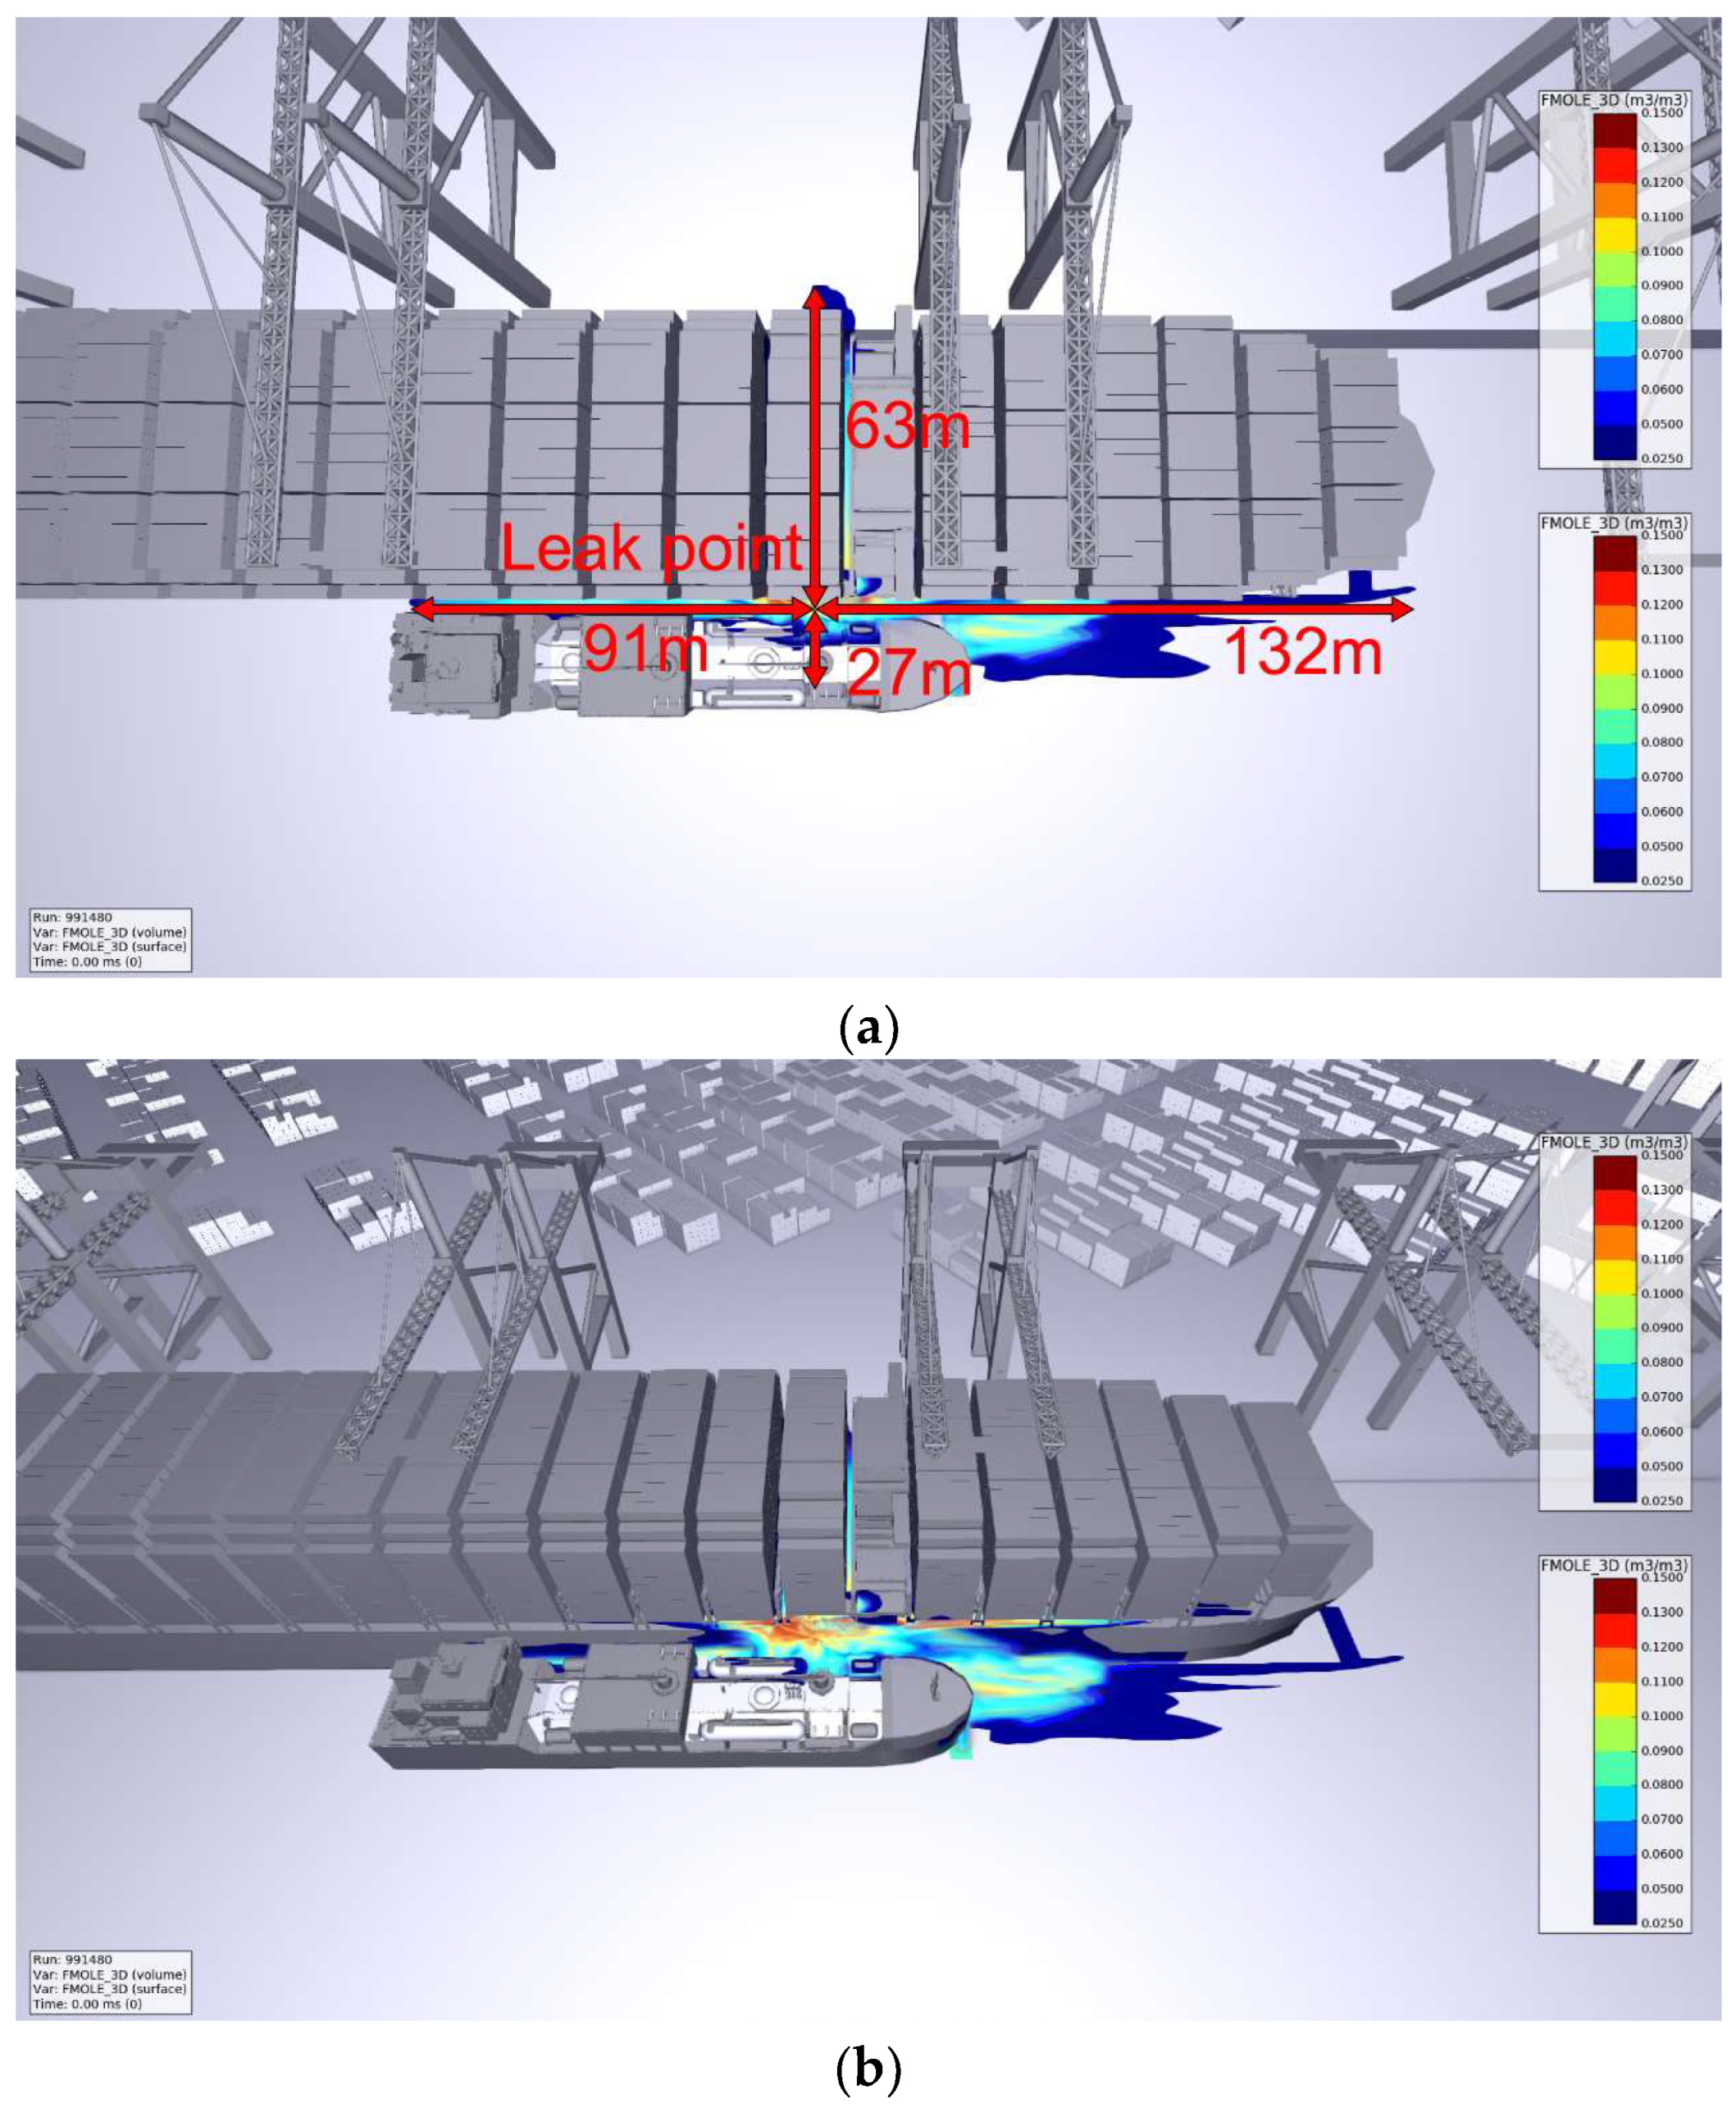
As shown in
Figure 16, under the laden working conditions of the container carrier, when there is a leak at a flange joint of the bunkering station of the receiving vessel, the combustible vapor cloud will spread to the container deck through all the box positions of BAY26 and BAY30, about one box position inwards at BAY34 and BAY38, about six box positions inwards at BAY22, and about one box position inwards at BAY18, BAY14, BAY10 (i.e., four bays before the bow building), and BAY6 (i.e., five bays before the bow building). On the bunker vessel side, a small amount of vapor spreads to the deck and the rest spreads to the sandwich channel of the two vessels and the bow of the bunker vessel. The maximum spread of the combustible vapor cloud is 223 m in the vessel length direction and 90 m in the vessel width direction.
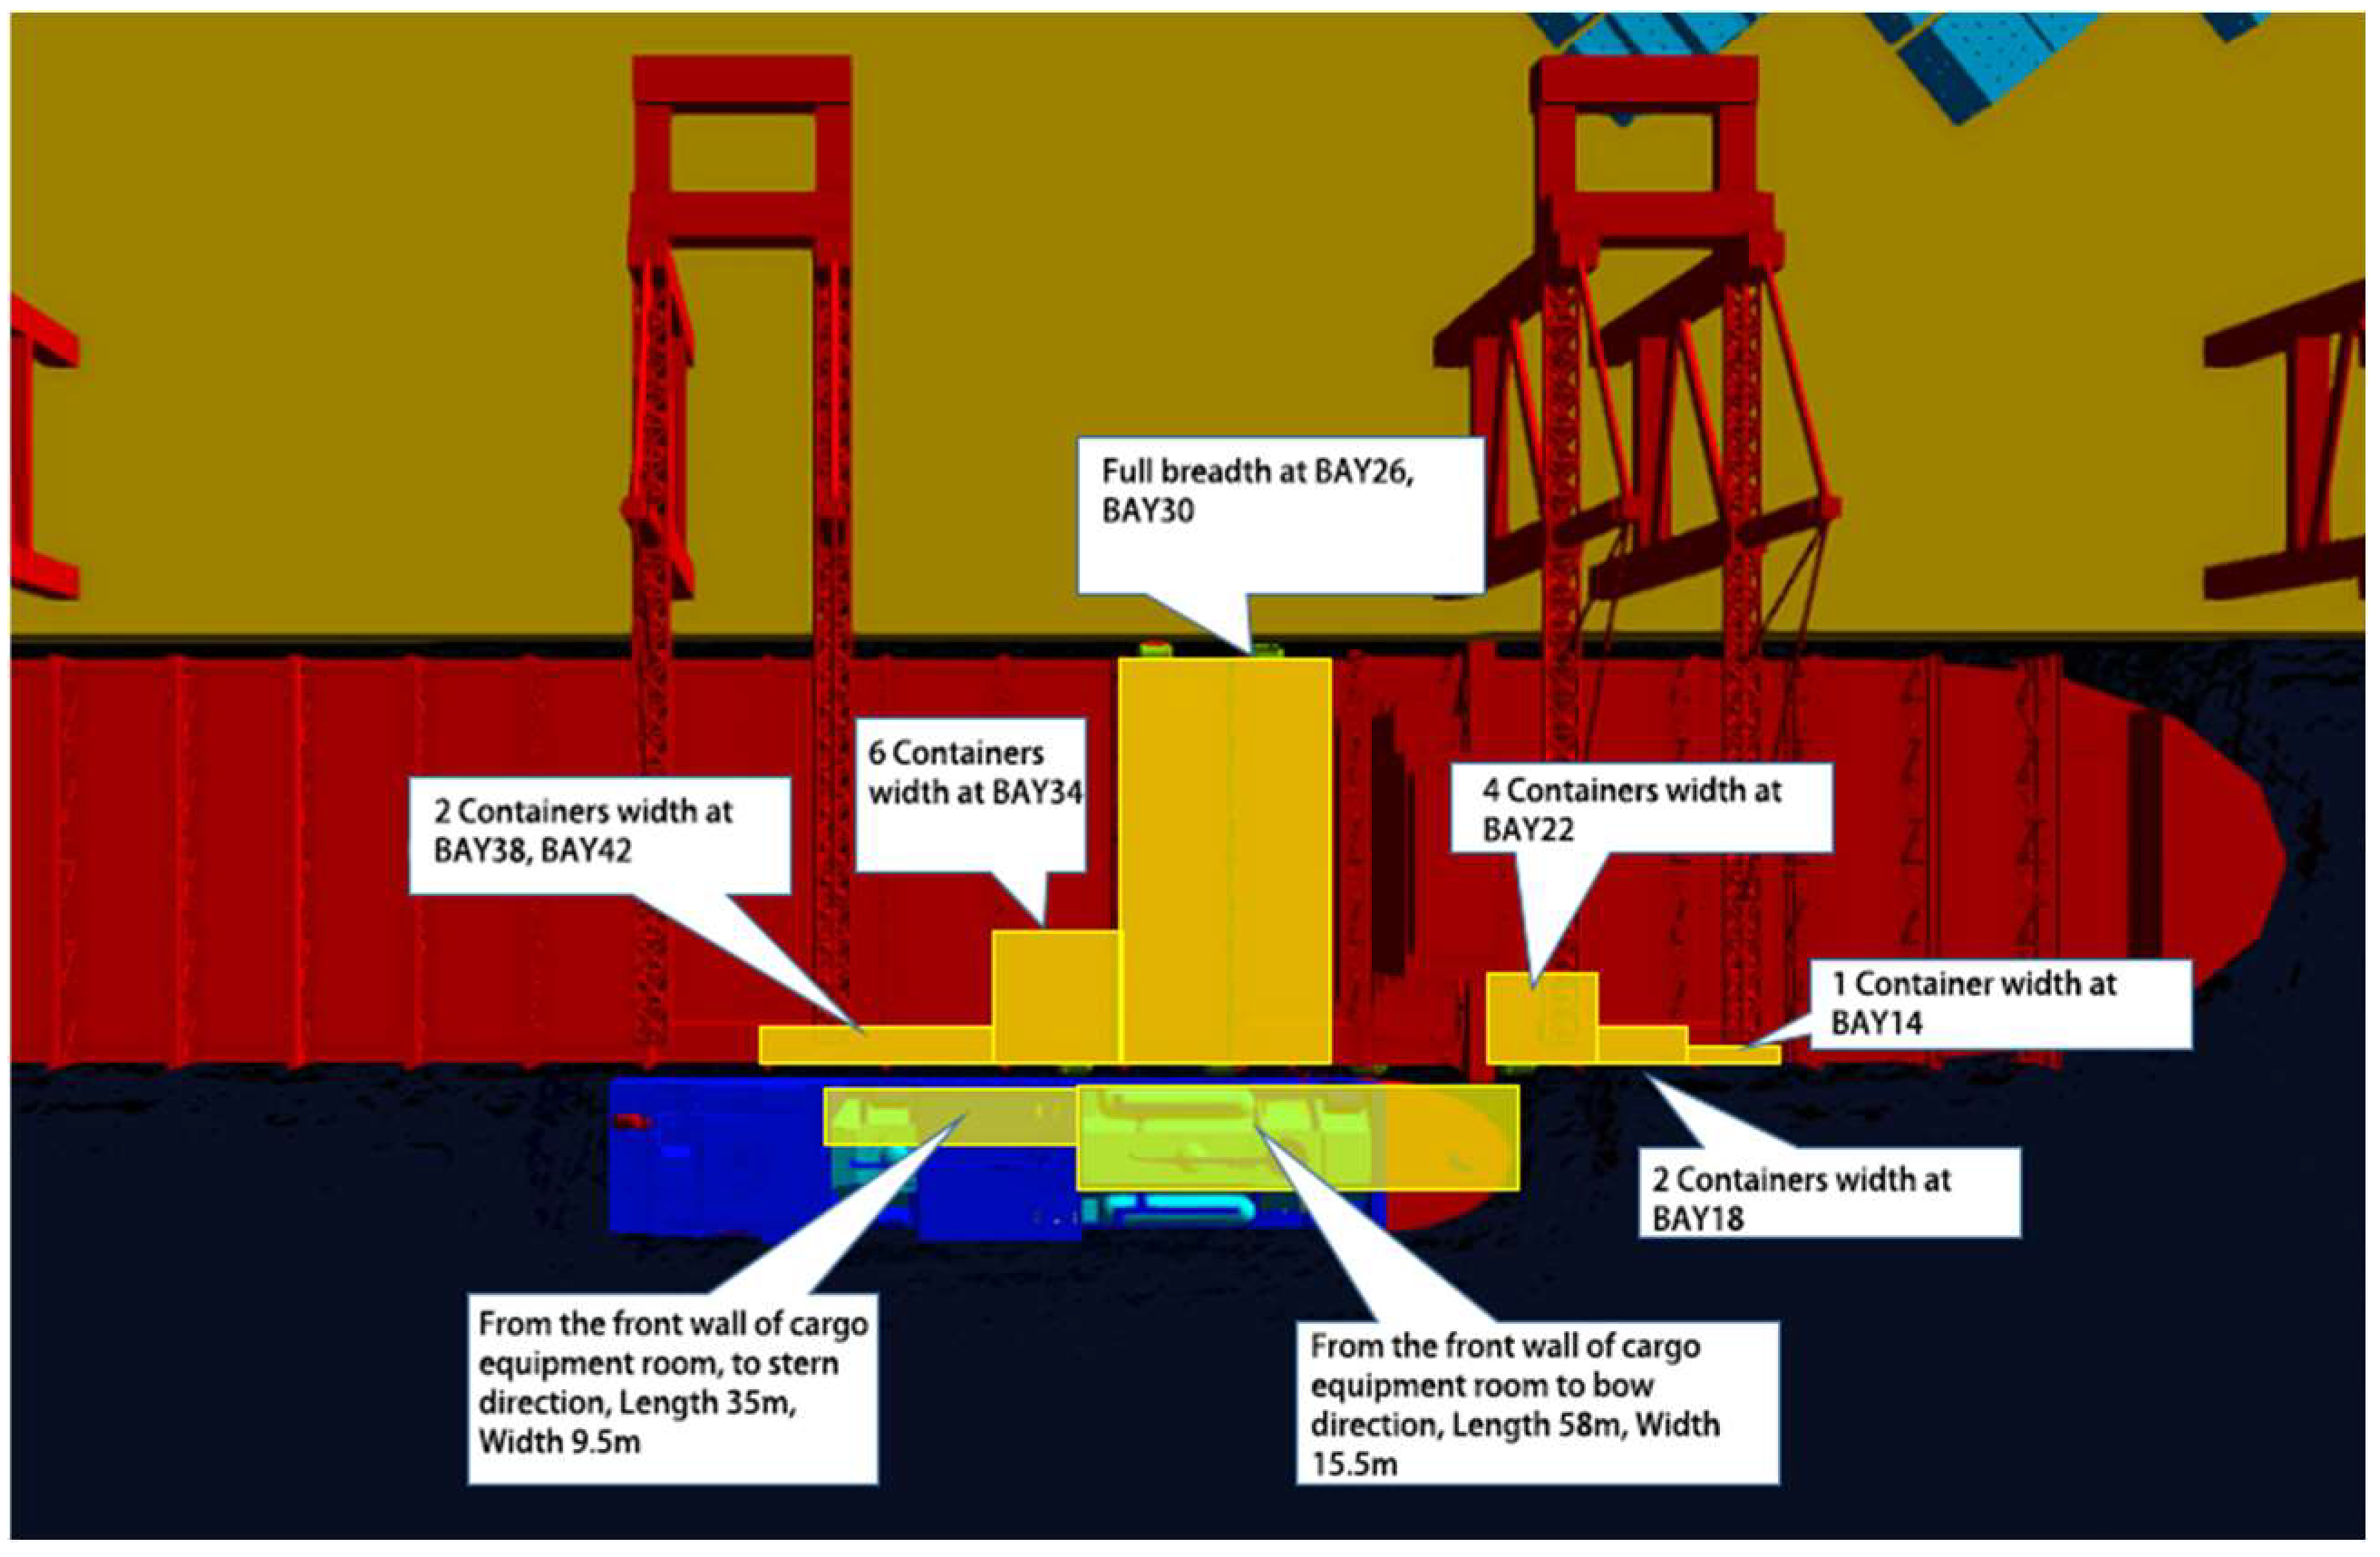
4. Results and Discussion
Under the ballast conditions of the container carrier, the spread of the combustible vapor cloud (i.e., 2.5%~15%) in the four scenarios is shown in
Figure 18. The combustible vapor cloud on the receiving vessel penetrates all the bins of BAY26 and BAY30; through about six bins of BAY34; through about 22 bins of BAY18, BAY38, and BAY42; through about four bins of BAY22; and through about one bin of BAY14. The vessel-side combustible vapor cloud forms a rectangular area of approximately 58 m in length and 15.5 m in width between the forward wall of the cargo equipment room and the bow of the vessel. A rectangular area that was approximately 35 m in length and 9.5 m in width formed between the cargo equipment room and the transom of the vessel.
Under the laden working condition of the container carrier, the diffusion range of the combustible vapor cloud (2.5%~15%) in the four scenarios is shown in
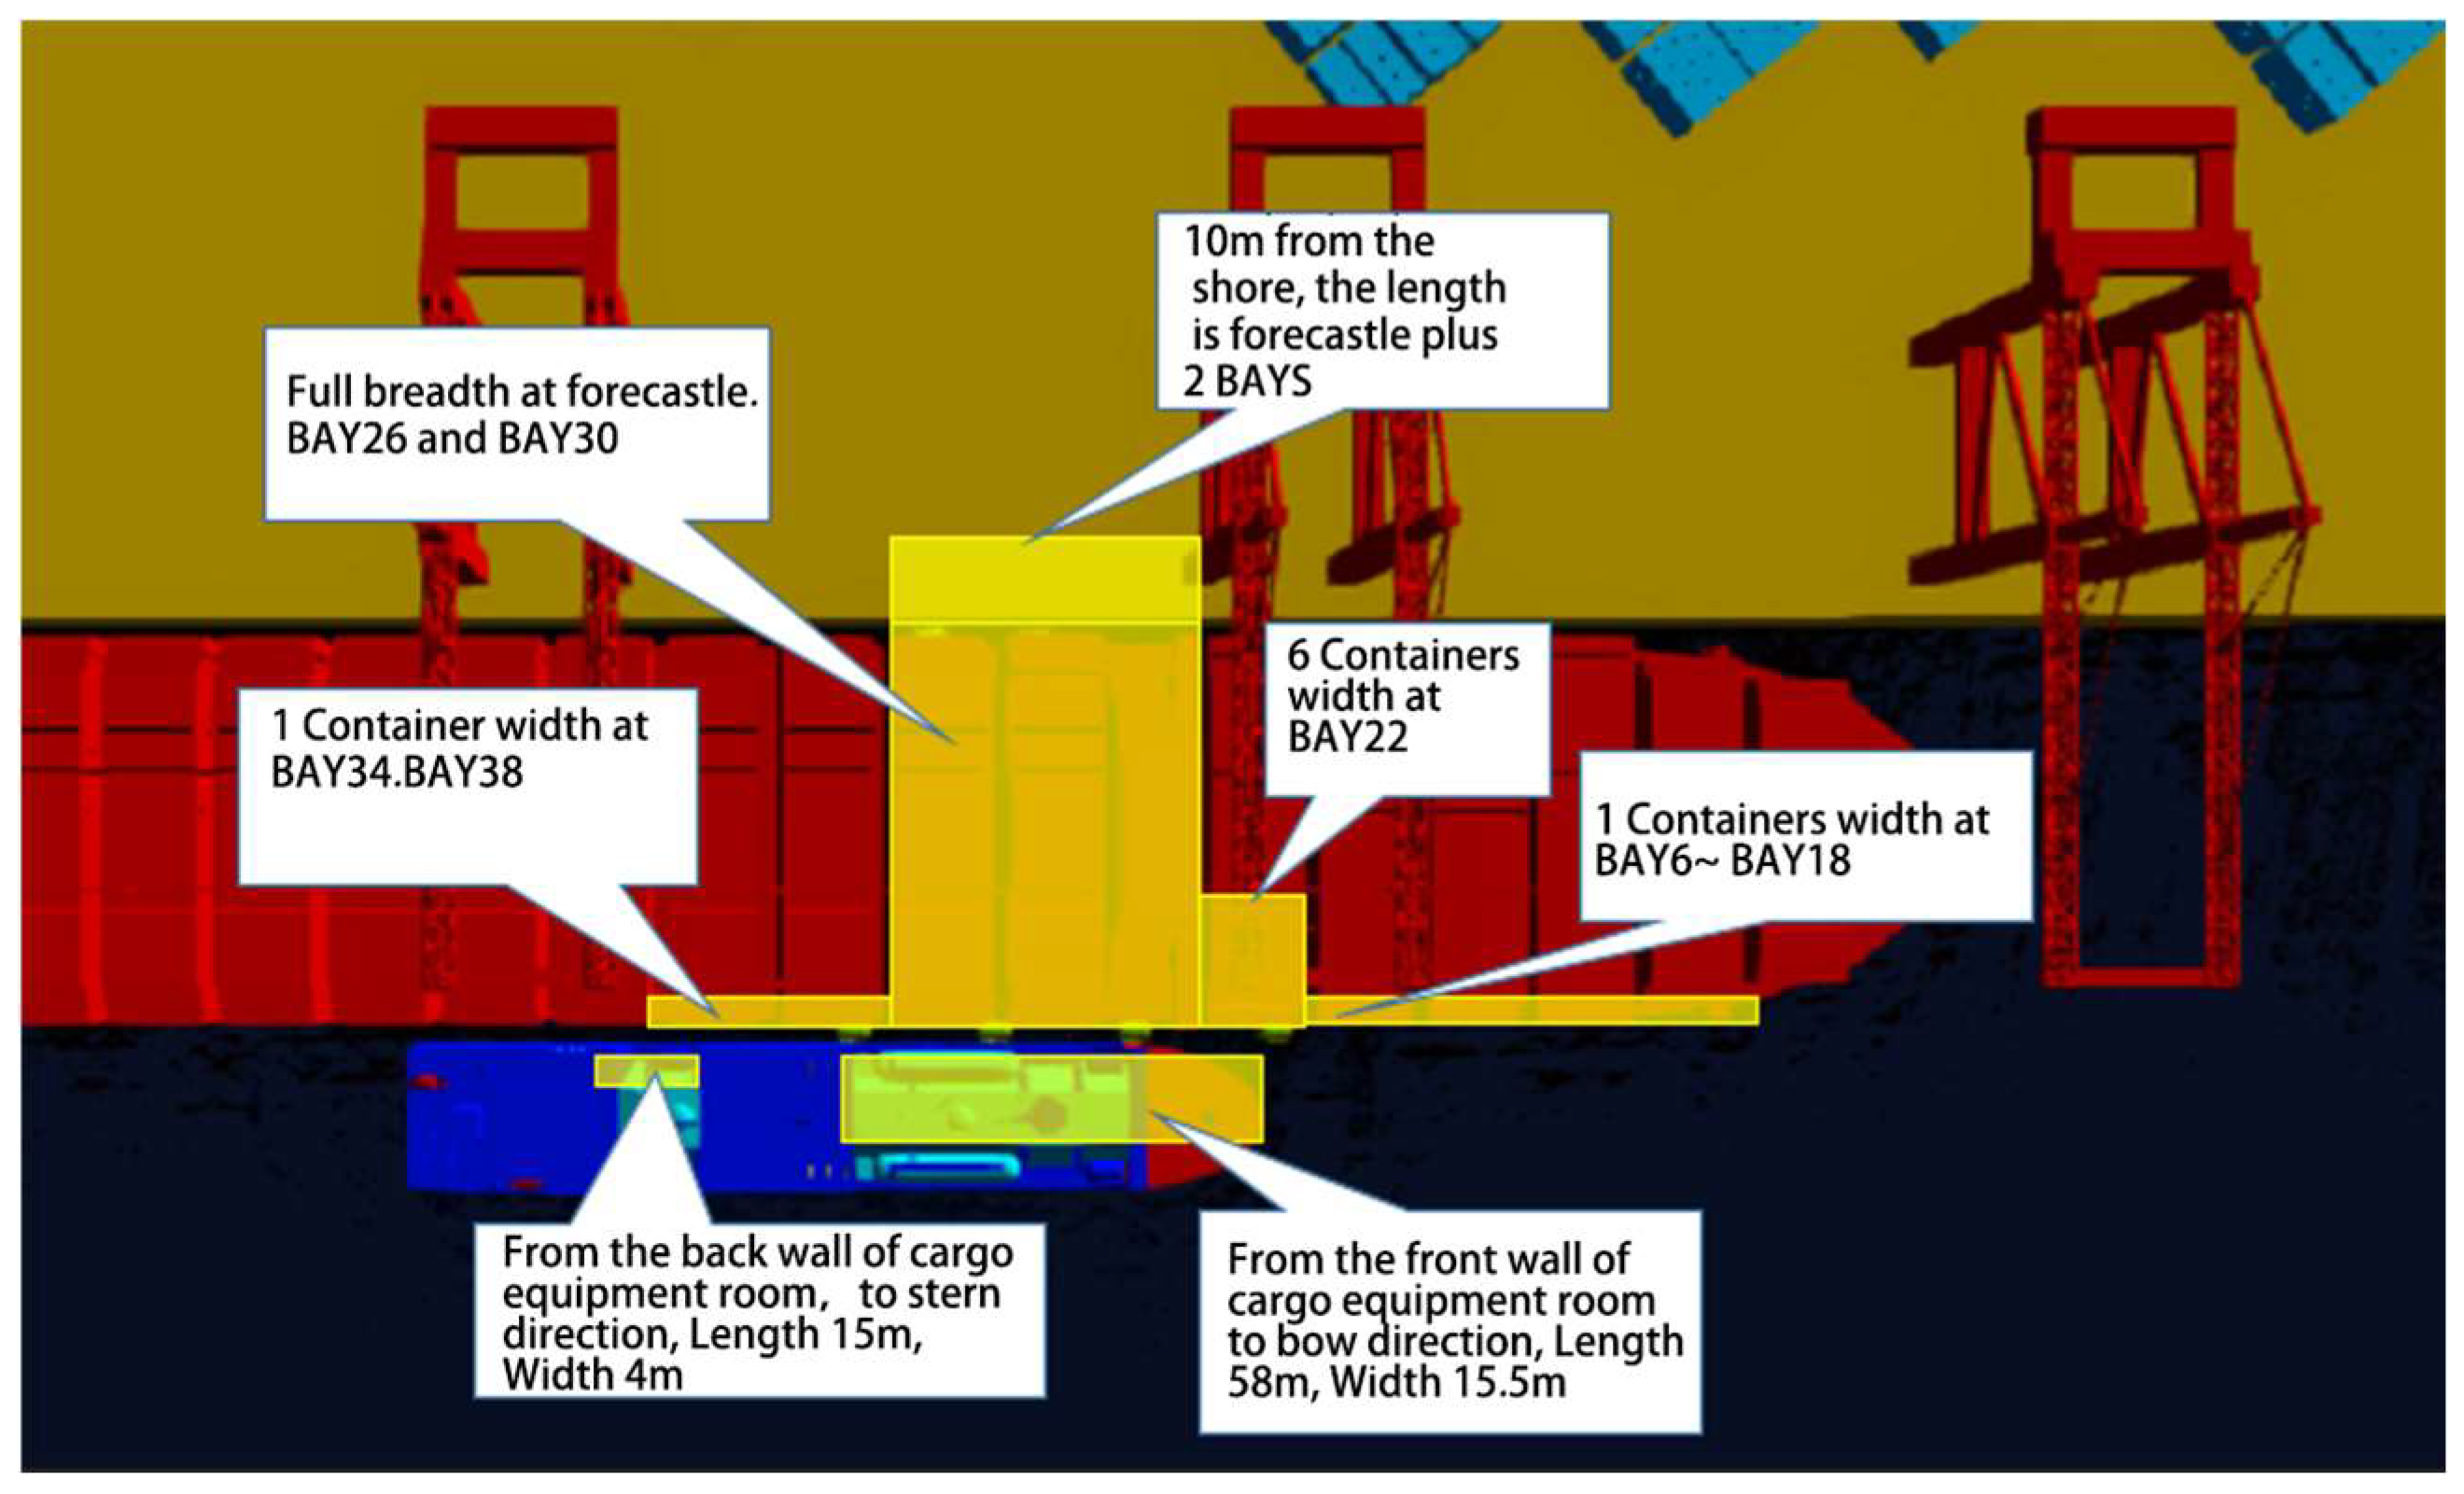
Figure 19. The combustible vapor cloud on the receiving vessel runs through the whole bow building; through all the box positions of BAY26 and BAY30, through BAY22 for about six box positions, and through BAY34, BAY38, and BAY6 to BAY18 for about one box position. The vessel-side combustible vapor cloud forms a rectangular area of approximately 58 m in length and 15.5 m in width between the forward wall of the cargo equipment room and the bow of the vessel. A rectangular area of approximately 15 m in length and 4 m in width forms between the aft wall of the cargo equipment room and the forward wall of the vessel’s stern building. The combustible vapor cloud on the quayside forms a rectangular area 10 m in length from the container carriers and 10 m in width from the bow building, with the addition of two container spaces.
In summary, the restricted area is defined as a rectangular area with a total length of 330 m (i.e., 165 m from the side of the bunkering ship to the bow direction of the bunkering station and 165 m along the stern direction) and a width of 30 m. In the restricted area, only authorized personnel are allowed to enter, and the warning signs should be set up. In addition, it is recommended that the operations that may generate electrostatic sparks should be prohibited. Furthermore, ventilation and air intake system entrances try to avoid the entry of combustible gas. If there is a breathable system entrance to the enclosed space, it is recommended that a temporary combustible gas detector is installed near the entrance during the filling operation. Moreover, it is recommended that no ash blowing operations are allowed during the filling operation to prevent the NG from igniting accidental leakage.
5. Conclusions
(1) When the gas-phase hose is broken and leaking, the maximum diffusion range of combustible vapor cloud is 87 × 31 m under the ballast condition of container carrier and 127 × 31 m under the laden condition.
(2) When the liquid-phase hose is broken and leaking, the maximum diffusion range of combustible vapor cloud is 227 × 30 m under the ballast condition of container carrier and 230 × 30 m under the laden condition.
(3) When there is a leak at a flange joint of the bunkering station of bunker vessel, the maximum diffusion range of combustible vapor cloud is 219 × 25.5 m under the ballast condition of container carrier and 330 × 25.5 m under the laden condition.
(4) When there is a leak at a flange joint of the bunkering station of receiving vessel, the maximum diffusion range of combustible vapor cloud is 185 m × 76 m under the ballast condition of container carrier and 223 × 90 m under the laden condition.
Author Contributions
Conceptualization, W.X.; methodology, W.J.; software, X.K.; formal analysis, J.C.; investigation, Q.W.; resources, W.X. and L.H.; writing—original draft preparation, X.K.; writing—review and editing, W.J. and X.K. All authors have read and agreed to the published version of the manuscript.
Funding
This article is supported by the National Natural Science Foundation of China (No. 51774092, No. 52174021), the Industry Foresight and Key Technology Projects of Su Zhou (No. SYC2022149), and the National Natural Science Foundation of Heilongjiang Province (No. LH2020E012).
Data Availability Statement
Not applicable.
Conflicts of Interest
The authors declare no conflict of interest.
References
- Ha, M.; Park, H.; Seo, Y. Understanding core determinants in LNG bunkering port selection: Policy implications for the maritime industry. Mar. Policy 2023, 152, 105608. [Google Scholar] [CrossRef]
- The Society for Gas as a Marine Fuel. Simultaneous Operations (SIMOPs) During LNG Bunkering; The Society for Gas as a Marine Fuel: London, UK, 2018. [Google Scholar]
- Uflaz, E.; Seze, S.L.; Akyuz, E.; Arslan, O.; Kurt, R.E. A human reliability analysis for ship-to-ship LNG bunkering process under D-S evidence fusion HEART approach. J. Loss Prevent Proc. 2022, 80, 104887. [Google Scholar] [CrossRef]
- Fan, H.; Enshaei, H.; Jayasinghe, S.G. Dynamic quantitative risk assessment of LNG bunkering SIMOPs based on Bayesian network. J. Ocean Eng. Sci. 2022, 2, 1–19. [Google Scholar] [CrossRef]
- Park, S.I.; Paik, J.K. A hybrid method for the safety zone design in truck-to-ship LNG bunkering. Ocean Eng. 2022, 243, 11020. [Google Scholar] [CrossRef]
- Vinnem, J.E. Introduction to Risk Analysis; Risk and Reliability in Marian Technology: Trondheim, Norway, 1998. [Google Scholar]
- Lehr, W.; Simecek-Beatty, D. Comparison of Hypothetical LNG and Fuel Oil Fires on Water; The National Oceanic and Atmospheric Administration: Washington, DC, USA, 2003. [Google Scholar]
- Shi, T.F. Risk Analysis of Loading and Unloading Process of CNG Carrier and Comprehensive Risk Index Model Design; Jiangsu University of Science and Technology: Zhenjiang, China, 2017. [Google Scholar]
- Jiao, G.W.; Zhou, R.; Zhang, W. Calculation of LNG tank leakage risk and analysis of influencing factors. Ind. Saf. Environ. Prot. 2015, 4, 15–17. [Google Scholar]
- Xu, J.Y.; Fan, H.J. Assessment of the hazard distance of pool fire for LNG bunkering pontoon. Shipbuild. China 2013, 4, 186–195. [Google Scholar]
- Eberwein, R.; Rogge, A.; Behrendt, F.; Knaust, C. Dispersion modelling of LNG-Vapor on land-A CFD Model evaluation study. J. Loss Prevent. Proc. 2020, 65, 104116. [Google Scholar] [CrossRef]
- Siddiqui, M.; Jayanti, S.; Swaminathan, T. CFD analysis of dense gas dispersion in an indoor environment for risk assessment and risk mitigation. J. Hazard. Mat. 2012, 209–210, 177–185. [Google Scholar] [CrossRef] [PubMed]
- Qian, J.; Li, X.; Gao, Z.; Jin, Z.J. A numerical study of hydrogen leakage and diffusion in a hydrogen refueling station. Int. J. Hydrogen Energy 2020, 28, 14428–14439. [Google Scholar] [CrossRef]
- Ama, B.; Lm, B.; Vdn, C. Comparison of k-ε models in gaseous release and dispersion simulations using the CFD code FLACS. Process. Saf Environ. 2019, 130, 306–316. [Google Scholar]
- Tauseef, S.M.; Rashtchian, D.; Abbasi, S.A. CFD-based simulation of dense gas dispersion in presence of obstacles. J. Loss Prevent. Proc. 2011, 24, 371–376. [Google Scholar] [CrossRef]
- Sun, B.; Utikar, R.P.; Pareek, V.K.; Guo, K. Computational fluid dynamics analysis of liquefied natural gas dispersion for risk assessment strategies. J. Loss Prevent. Proc. 2013, 26, 117–128. [Google Scholar] [CrossRef]
- Lu, H.; Huang, K.; Fu, L.; Zhang, Z.; Wu, S.; Lyu, Y.; Zhang, X. Study on leakage and ventilation scheme of gas pipeline in tunnel. J. Nat. Gas Sci. Eng. 2018, 53, 347–358. [Google Scholar] [CrossRef]
- Li, C.; Wang, Y.; Li, C.; Xiao, G. On the model for the pool spill and evaporation of LNG for the Computation Fluid Dynamics (CFD). J. Saf. Environ. 2020, 20, 2286–2294. [Google Scholar]
- Dasgotra, A.; Teja, G.V.; Sharma, A.; Mishra, K.B. CFD modelling of large-scale flammable cloud dispersion using FLACS. J. Loss Prevent. Proc. 2018, 56, 531–536. [Google Scholar] [CrossRef]
- Mcnay, J.; Hilditch, R. Evaluation of computational fluid dynamics (CFD) vs. target gas cloud for indoor gas detection design. J. Loss Prevent. Proc. 2017, 50, 75–79. [Google Scholar] [CrossRef]
- Pontiggia, M.; Landucci, G.; Busini, V.; Derudi, M.; Alba, M.; Scaioni, M.; Bonvicini, S.; Cozzani, V.; Rota, R. CFD model simulation of LPG dispersion in urban areas. Atmos. Environ. 2011, 45, 3913–3923. [Google Scholar] [CrossRef]
- GexCon. FLACS v10.4 User’s Manual; GexCon: Bergen, Norway, 2015. [Google Scholar]
- GB/T 20368; Production, Storage and Handling of Liquefied Natural Gas (LNG). Chinese GB Standards: Beijing, China, 2006.
- China Classification Society. Guidelines for Quantitative Oil and Gas Risk Assessment; China Classification Society: Beijing, China, 2020. [Google Scholar]
- China Classification Society. Guidelines for LNG Filling Operations; China Classification Society: Beijing, China, 2021. [Google Scholar]
- NFPA 59A; Standard for the Production, Storage, and Handling of Liquefied Natural Gas. National Fire Protection Association: Washington, DC, USA, 2013.
- GB/T 26610; Guideline for Implementation of Risk-based Inspection of pressure equipment system—Part 4: Quantitative Analysis Approach of Failure Likelihood. Chinese GB Standards: Beijing, China, 2022.
- UK Heatth and Safety Executive. Canvey: An Investigation of Potential Hazards from Operations in the Canvey Island/Thurrock Area; Health and Safety Executive: London, UK, 1978. [Google Scholar]
- OGP Praft 118683; Guideline for Systems and Installations for Supply of LNG as Fuel to Ships. The International Association of Oil and Gas Producers: London, UK, 2013.
Figure 1.
3D model of LNG bunkering vessel.
Figure 1.
3D model of LNG bunkering vessel.
Figure 2.
3D model of container carriers.
Figure 2.
3D model of container carriers.
Figure 3.
3D model of the hose connection between the two vessels.
Figure 3.
3D model of the hose connection between the two vessels.
Figure 4.
3D model of Yantian Port II.
Figure 4.
3D model of Yantian Port II.
Figure 6.
Schematic diagram of the leakage location in a gas-phase hose.
Figure 6.
Schematic diagram of the leakage location in a gas-phase hose.
Figure 7.
Scenario 1 Spread of combustible vapor cloud under no-load conditions: (a) Top view; (b) Side view.
Figure 7.
Scenario 1 Spread of combustible vapor cloud under no-load conditions: (a) Top view; (b) Side view.
Figure 8.
Scenario 1 Range of combustible vapor cloud dispersion under laden conditions: (a) Top view; (b) Side view.
Figure 8.
Scenario 1 Range of combustible vapor cloud dispersion under laden conditions: (a) Top view; (b) Side view.
Figure 9.
Schematic diagram of the leakage location of a liquid-phase hose.
Figure 9.
Schematic diagram of the leakage location of a liquid-phase hose.
Figure 10.
Scenario 2 Range of combustible vapor cloud dispersion under ballast conditions: (a) Top view; (b) Side view.
Figure 10.
Scenario 2 Range of combustible vapor cloud dispersion under ballast conditions: (a) Top view; (b) Side view.
Figure 11.
Scenario 2 Range of combustible vapor cloud dispersion under laden conditions: (a) Top view; (b) Side view.
Figure 11.
Scenario 2 Range of combustible vapor cloud dispersion under laden conditions: (a) Top view; (b) Side view.
Figure 12.
Illustration of the location of a flange joint leak at the bunkering station of the bunker vessel.
Figure 12.
Illustration of the location of a flange joint leak at the bunkering station of the bunker vessel.
Figure 13.
Scenario 3 Range of combustible vapor cloud dispersion under ballast conditions: (a) Top view; (b) Side view.
Figure 13.
Scenario 3 Range of combustible vapor cloud dispersion under ballast conditions: (a) Top view; (b) Side view.
Figure 14.
Scenario 3 Range of combustible vapor cloud dispersion under laden conditions: (a) Top view; (b) Side view.
Figure 14.
Scenario 3 Range of combustible vapor cloud dispersion under laden conditions: (a) Top view; (b) Side view.
Figure 15.
Schematic diagram of the location of a flange joint leak at the bunkering station of the receiving vessel.
Figure 15.
Schematic diagram of the location of a flange joint leak at the bunkering station of the receiving vessel.
Figure 16.
Scenario 4 Spread of combustible vapor cloud under no-load conditions: (a) Top view; (b) Side view.
Figure 16.
Scenario 4 Spread of combustible vapor cloud under no-load conditions: (a) Top view; (b) Side view.
Figure 17.
Scenario 4 Range of combustible vapor cloud dispersion under laden conditions: (a) Top view; (b) Side view.
Figure 17.
Scenario 4 Range of combustible vapor cloud dispersion under laden conditions: (a) Top view; (b) Side view.
Figure 18.
Combustible vapor cloud dispersion range for four scenarios under no-load conditions.
Figure 18.
Combustible vapor cloud dispersion range for four scenarios under no-load conditions.
Figure 19.
Combustible vapor cloud dispersion range for four scenarios at full working load.
Figure 19.
Combustible vapor cloud dispersion range for four scenarios at full working load.
Table 1.
Main parameters of the LNG bunker vessel.
Table 1.
Main parameters of the LNG bunker vessel.
| Main Parameters | Value |
|---|
| Overall length × width × depth | 119.30 × 19.8 × 11 m |
| Laden draught | 6.475 m |
| Ballast draft | 4.264 m |
| Laden Displacement | 11,109 t |
| Ballast discharge | 6729 t |
| No.1–No.2 Type C Independent Liquid Cargo Hold | 4100 m3/4100 m3 |
| Tubes | Interface form | Caliber (“) | Quantity (single side) | Distance to tail plumb line (m) | Distance from baseline (m) |
| Liquid Phase Tubes | Flange | 8 | 2 | 86.4/83.4 | 16.03 |
| Gas phase tubes | Flange | 8 | 1 | 84.9 | 16.03 |
| Range of flat sections of the hull | Laden (m) | Ballast (m) |
| Distance from stern plumb line to the rear intersection point of parallel mid-body/waterline | 9.00 | 21.46 |
| Distance between parallel mid-body/waterline forward intersection and bow and stern plumb lines | 80.07 | 75.50 |
Table 2.
Main scale parameters of 14,800 TEU-injected vessels.
Table 2.
Main scale parameters of 14,800 TEU-injected vessels.
| Main Parameters | Value |
|---|
| Overall length × width × depth | 366 × 51 × 29.85 m |
| Design draught | 14.524 m |
| Structural draft | 16.024 m |
| Ballast draft | 8.27 m |
| Design Draft Displacement | 180,331 t |
| Ballast Draft Displacement | 90,279 t |
| Type B Independent Liquid Cargo Tank | 12,000 m3 |
| Liquid Cargo Tank Evaporation Rate BOR | 0.17% |
| LNG bunkering station interface | spread pattern L-V-L |
| Tubes | Interface form | Caliber (“) | Quantity (single side) | Distance to tail plumb line (m) | Distance from baseline (m) |
| Liquid Phase Tubes | Flange | 8 | 2 | 231.55/235.75 | 32.448 |
| Gas phase tubes | Flange | 12 | 1 | 233.75 | 32.448 |
| Range of flat sections of the hull | Design draft (m) | Ballast draft |
| Distance from stern plumb line to the rear intersection point of parallel mid-body/waterline | 57.20 | 120.28 |
| Distance between parallel mid-body/waterline forward intersection and bow and stern plumb lines | 265.88 | 247.01 |
| Disclaimer/Publisher’s Note: The statements, opinions and data contained in all publications are solely those of the individual author(s) and contributor(s) and not of MDPI and/or the editor(s). MDPI and/or the editor(s) disclaim responsibility for any injury to people or property resulting from any ideas, methods, instructions or products referred to in the content. |
© 2023 by the authors. Licensee MDPI, Basel, Switzerland. This article is an open access article distributed under the terms and conditions of the Creative Commons Attribution (CC BY) license (https://creativecommons.org/licenses/by/4.0/).


