
Life Cycle Assessment of Biomethane vs. Fossil Methane Production and Supply

 , , ,
, , , 

Abstract
:1. Introduction
- biomethane produced from a biogas plant, coupled with CO2 capture
- liquefied natural gas (LNG) extracted in Qatar and delivered by gas tanker to a regasification plant
- compressed natural gas extracted in Algeria and delivered to Italy by a gas pipeline
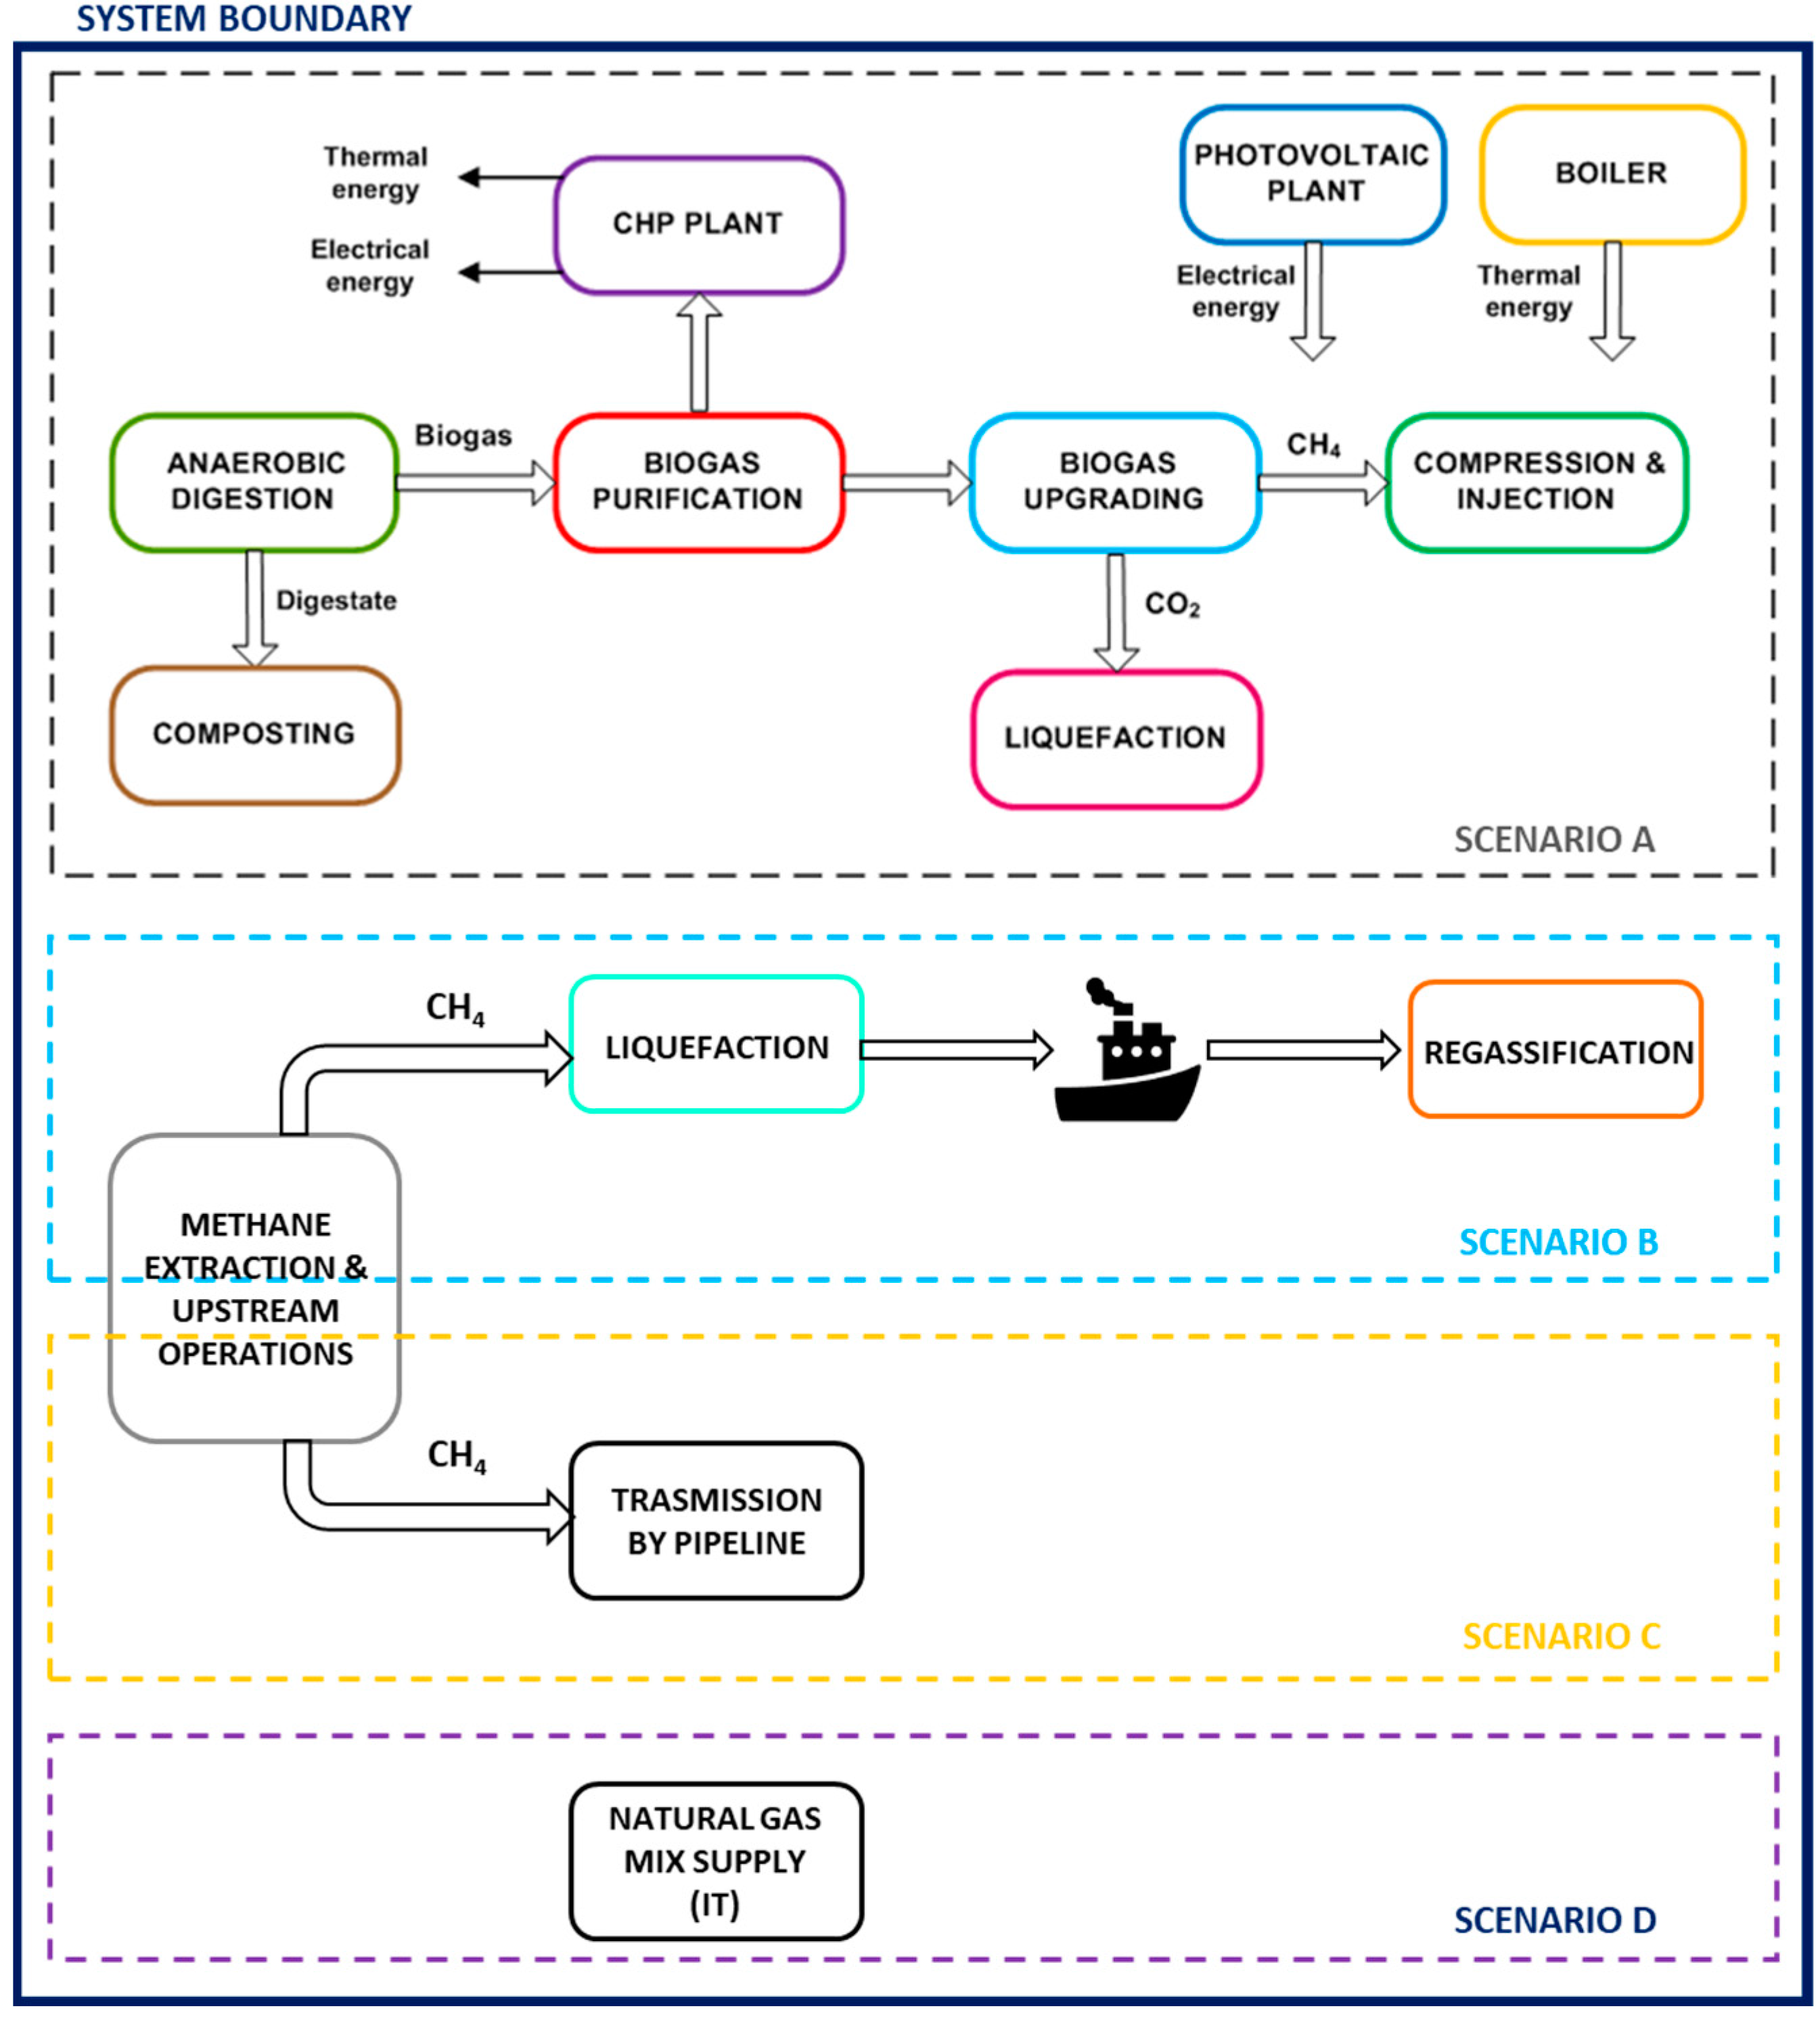
2. Description of the Production Scenarios
2.1. Scenario A: Biomethane from Biogas
- -
- trenches for the storage of solid biomasses
- -
- one circular closed tank for the storage and mixing of pumpable wastes
- -
- one circular open tank, which could be loaded by mechanical means, for the homogenization of the milled solid feedstocks
- -
- primary bioreactors (2 × 4800 m3, mesophilic conditions, heated by steel coils)
- -
- secondary bioreactors (2 × 4800 m3, mesophilic conditions, heated by steel coils)
- -
- purification of the biogas with the removal of H2S, NH3, H2O, siloxanes, and volatile organic compounds (VOCs), where a rough desulphurization was carried out in the primary and secondary bioreactors through the addition of FeCl3 addition; nevertheless, a deep removal was required to protect the membranes that separated the CH4 from the CO2, and in particular, one alkaline scrubber, one chiller, and one fixed-bed column with activated carbon were installed upstream of the membrane module
- -
- a combined heat and power (CHP, 330 kWe) engine for the electrical and thermal self-consumption of the plant
- -
- a containerized biogas upgrading plant based on a three-stage hollow-fiber membrane technology (EVONIK© Sepuran or equivalent), working at 16 bar with a biogas capacity of 1000 Nm3/h
- -
- a biomethane storage tank
- -
- a compression, measuring, odorization, and injection station
- -
- a composting plant where the digestate was treated by a screw separator and the liquid was stored in a tank from which a certain percentage was recycled back to the primary bioreactors and the solid fraction was used to produce a fertilizer by the addition of wood scraps and pruning. The liquid digestate was thus continuously sprayed on the solid mass, avoiding its treatment for nitrogen removal. The digestate could not be scattered on the fields as it was since the area was vulnerable to nitrates, and the Italian environmental regulation allows a maximum amount of 170 kg of nitrogen per hectare per year.
- -
- one 960 kWp photovoltaic power station (240 kWp × four trenches), installed on the roofs of the composting plant, which produced 1,248,000 kWh/y with an average amount of solar irradiation for the area
- -
- a plant for the compression and liquefaction of the CO2, which was compressed to 15 bar and cooled to −28 °C. This plant was installed free of charge by a company that paid back the cost of the electrical energy and purchased food-grade CO2 at a low agreed-upon price (CO2 is usually sold to the beverage industry).
- a total of 6.804 million Nm3/year biomethane was injected into the national distribution network
- a total of 9247 tons/year of CO2 were recovered (i.e., emissions were avoided)
- a total of 2,496,000 kWh/year of renewable electrical energy was produced by the photovoltaic panels
- nearly 16,000 tons/year of certified slow-release fertilizer was produced
2.2. Scenario B: LNG from Qatar
- extraction and upstream operations
- liquefaction
- shipping
- regasification
2.3. Scenario C: CNG from Algeria
- extraction and upstream operations
- compression (several stages along the pipeline)
3. Materials and Methods
LCA Methodology
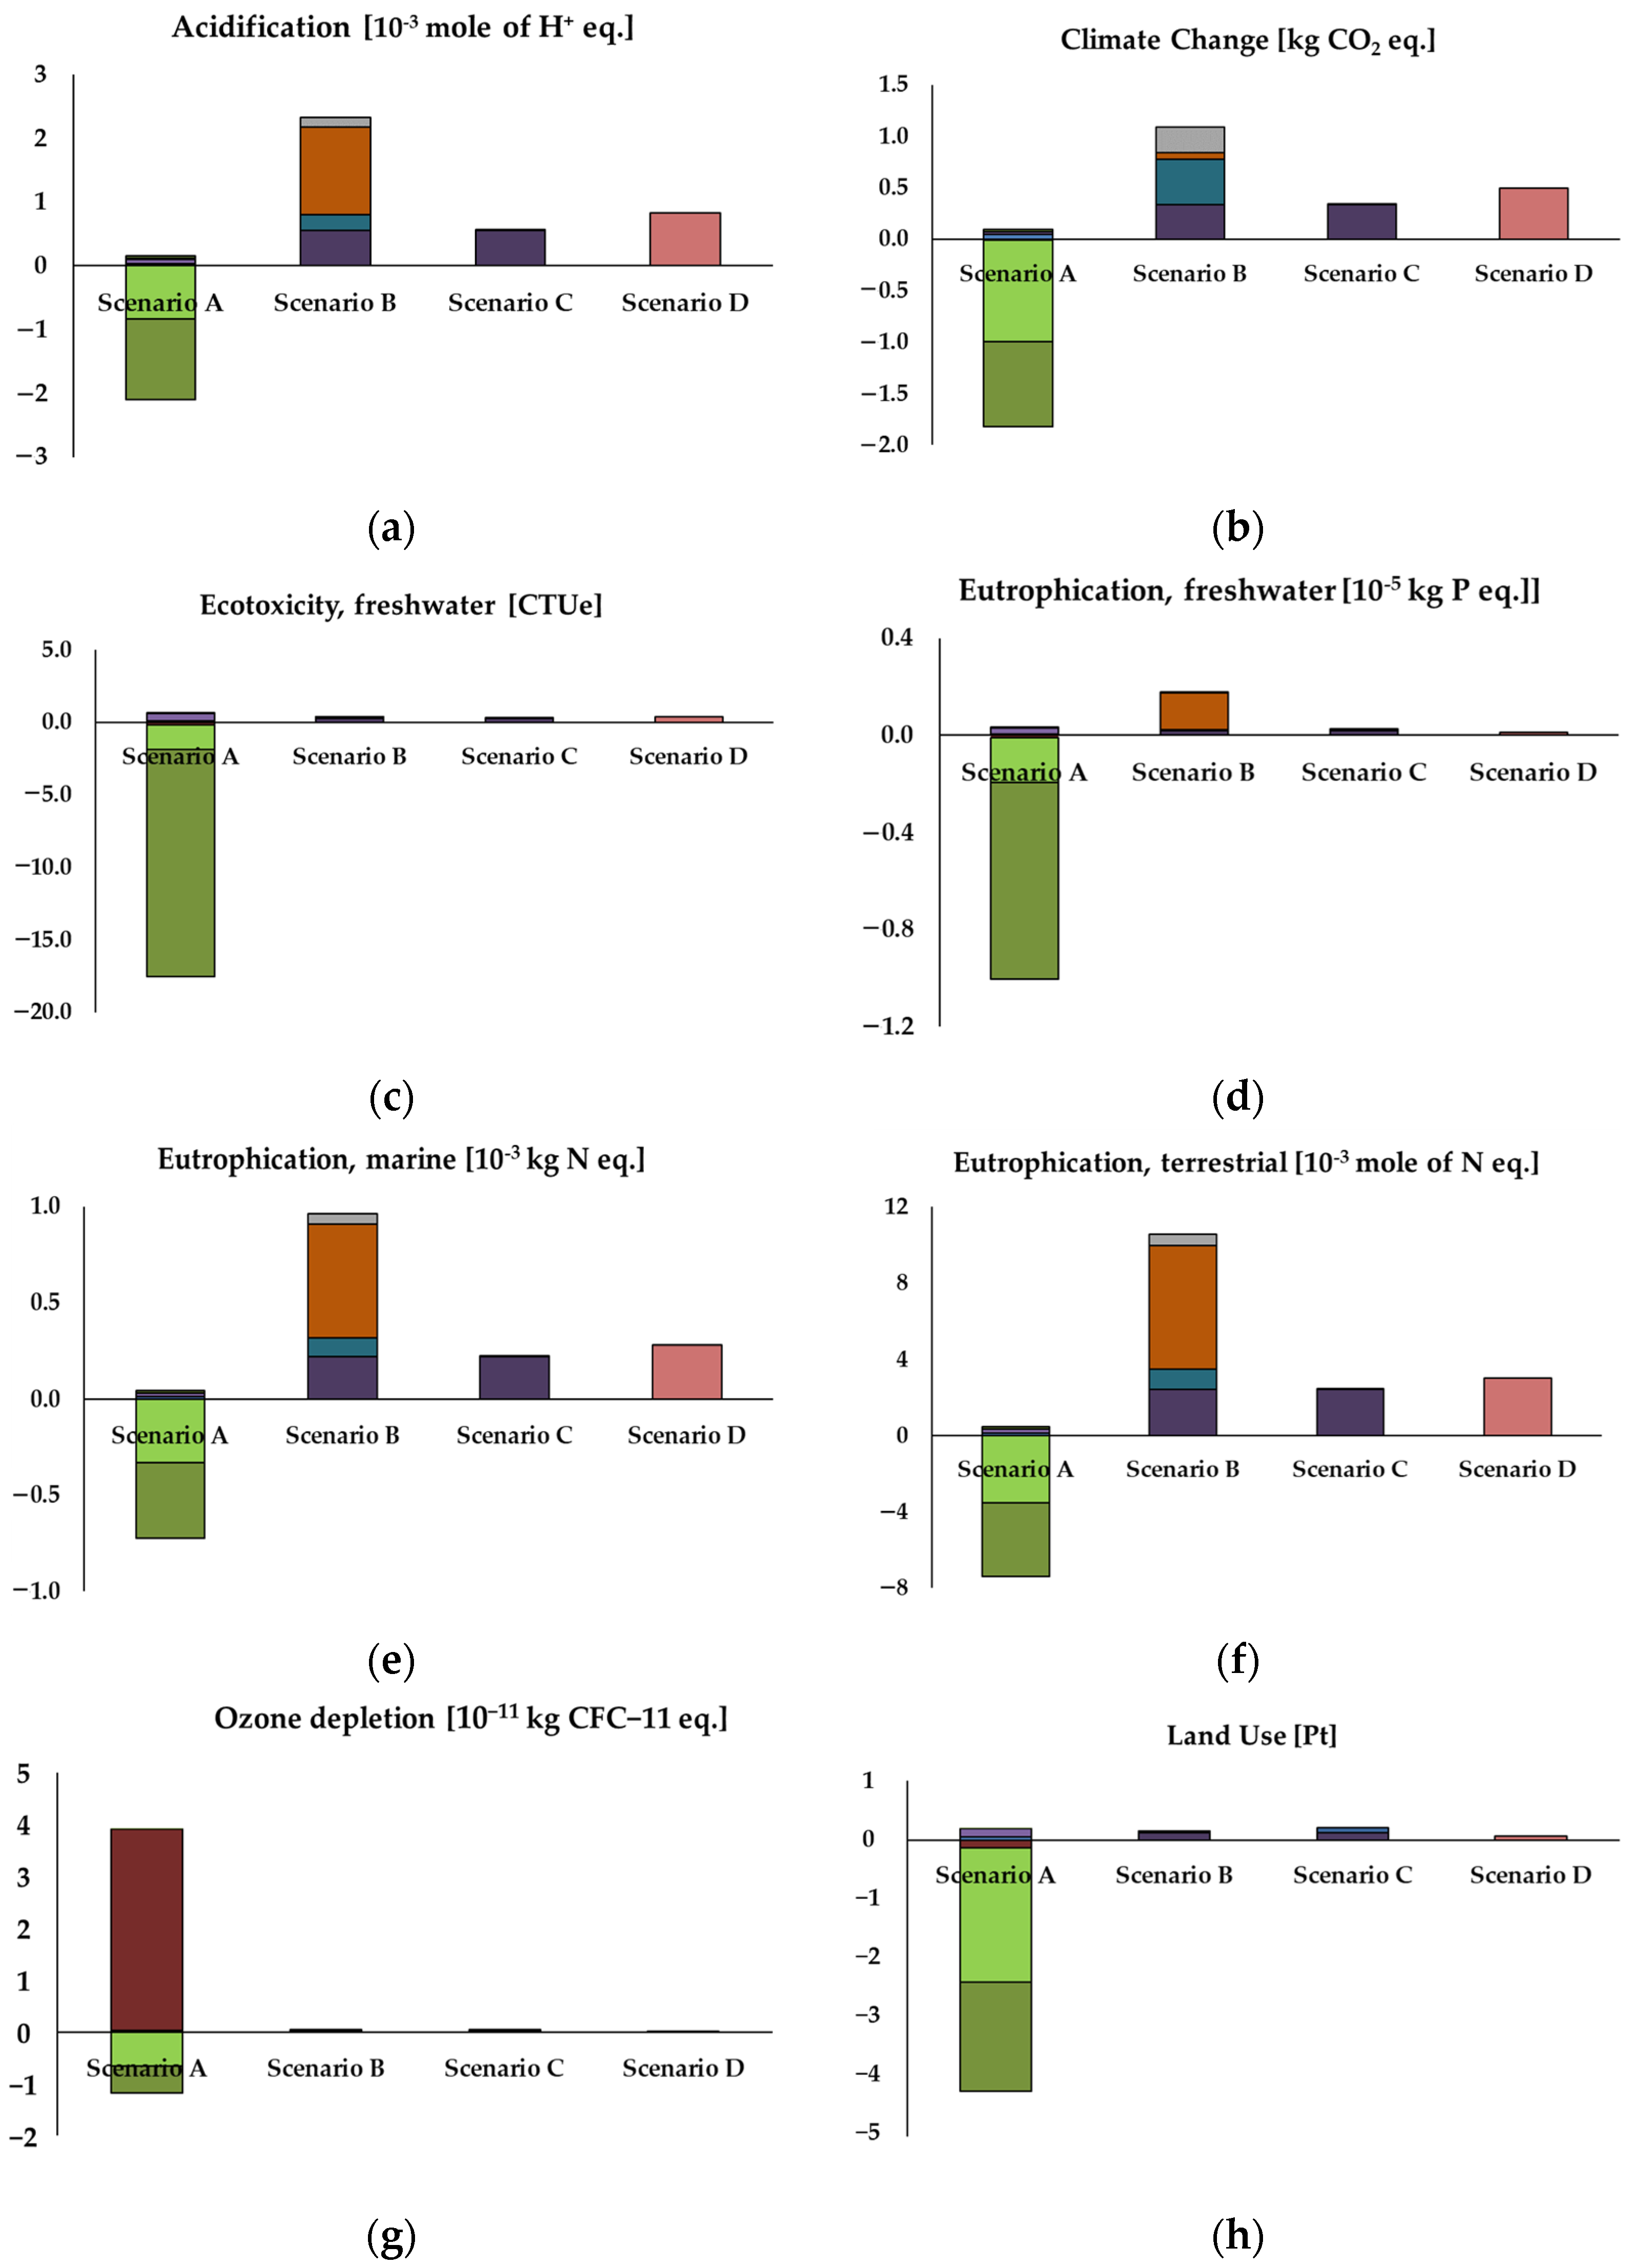
4. Results
4.1. The Life Cycle Impact Assessments
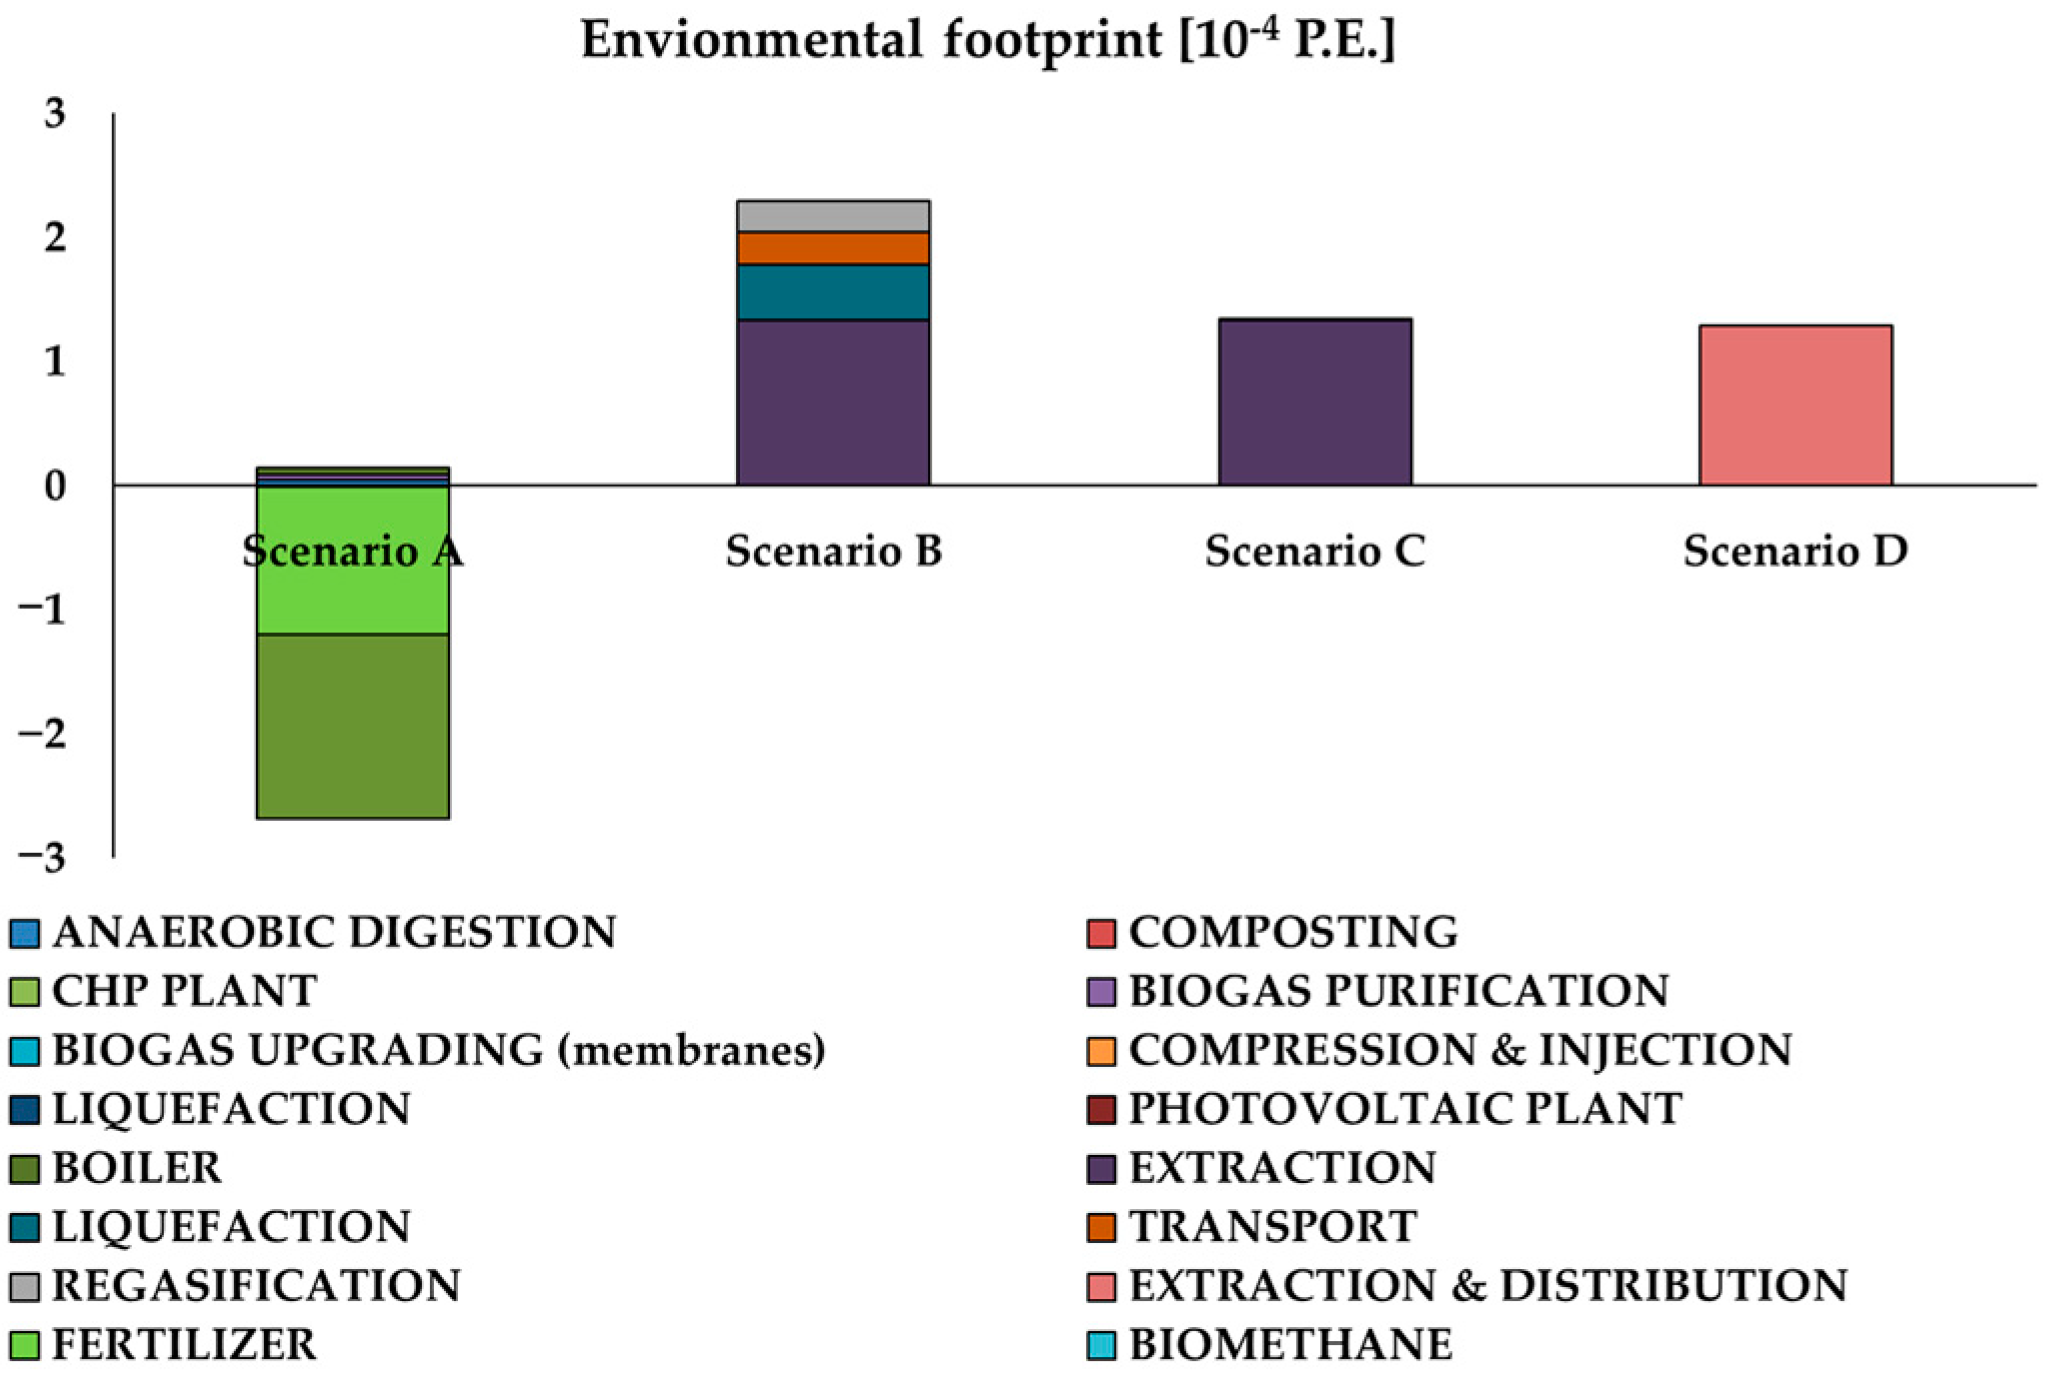
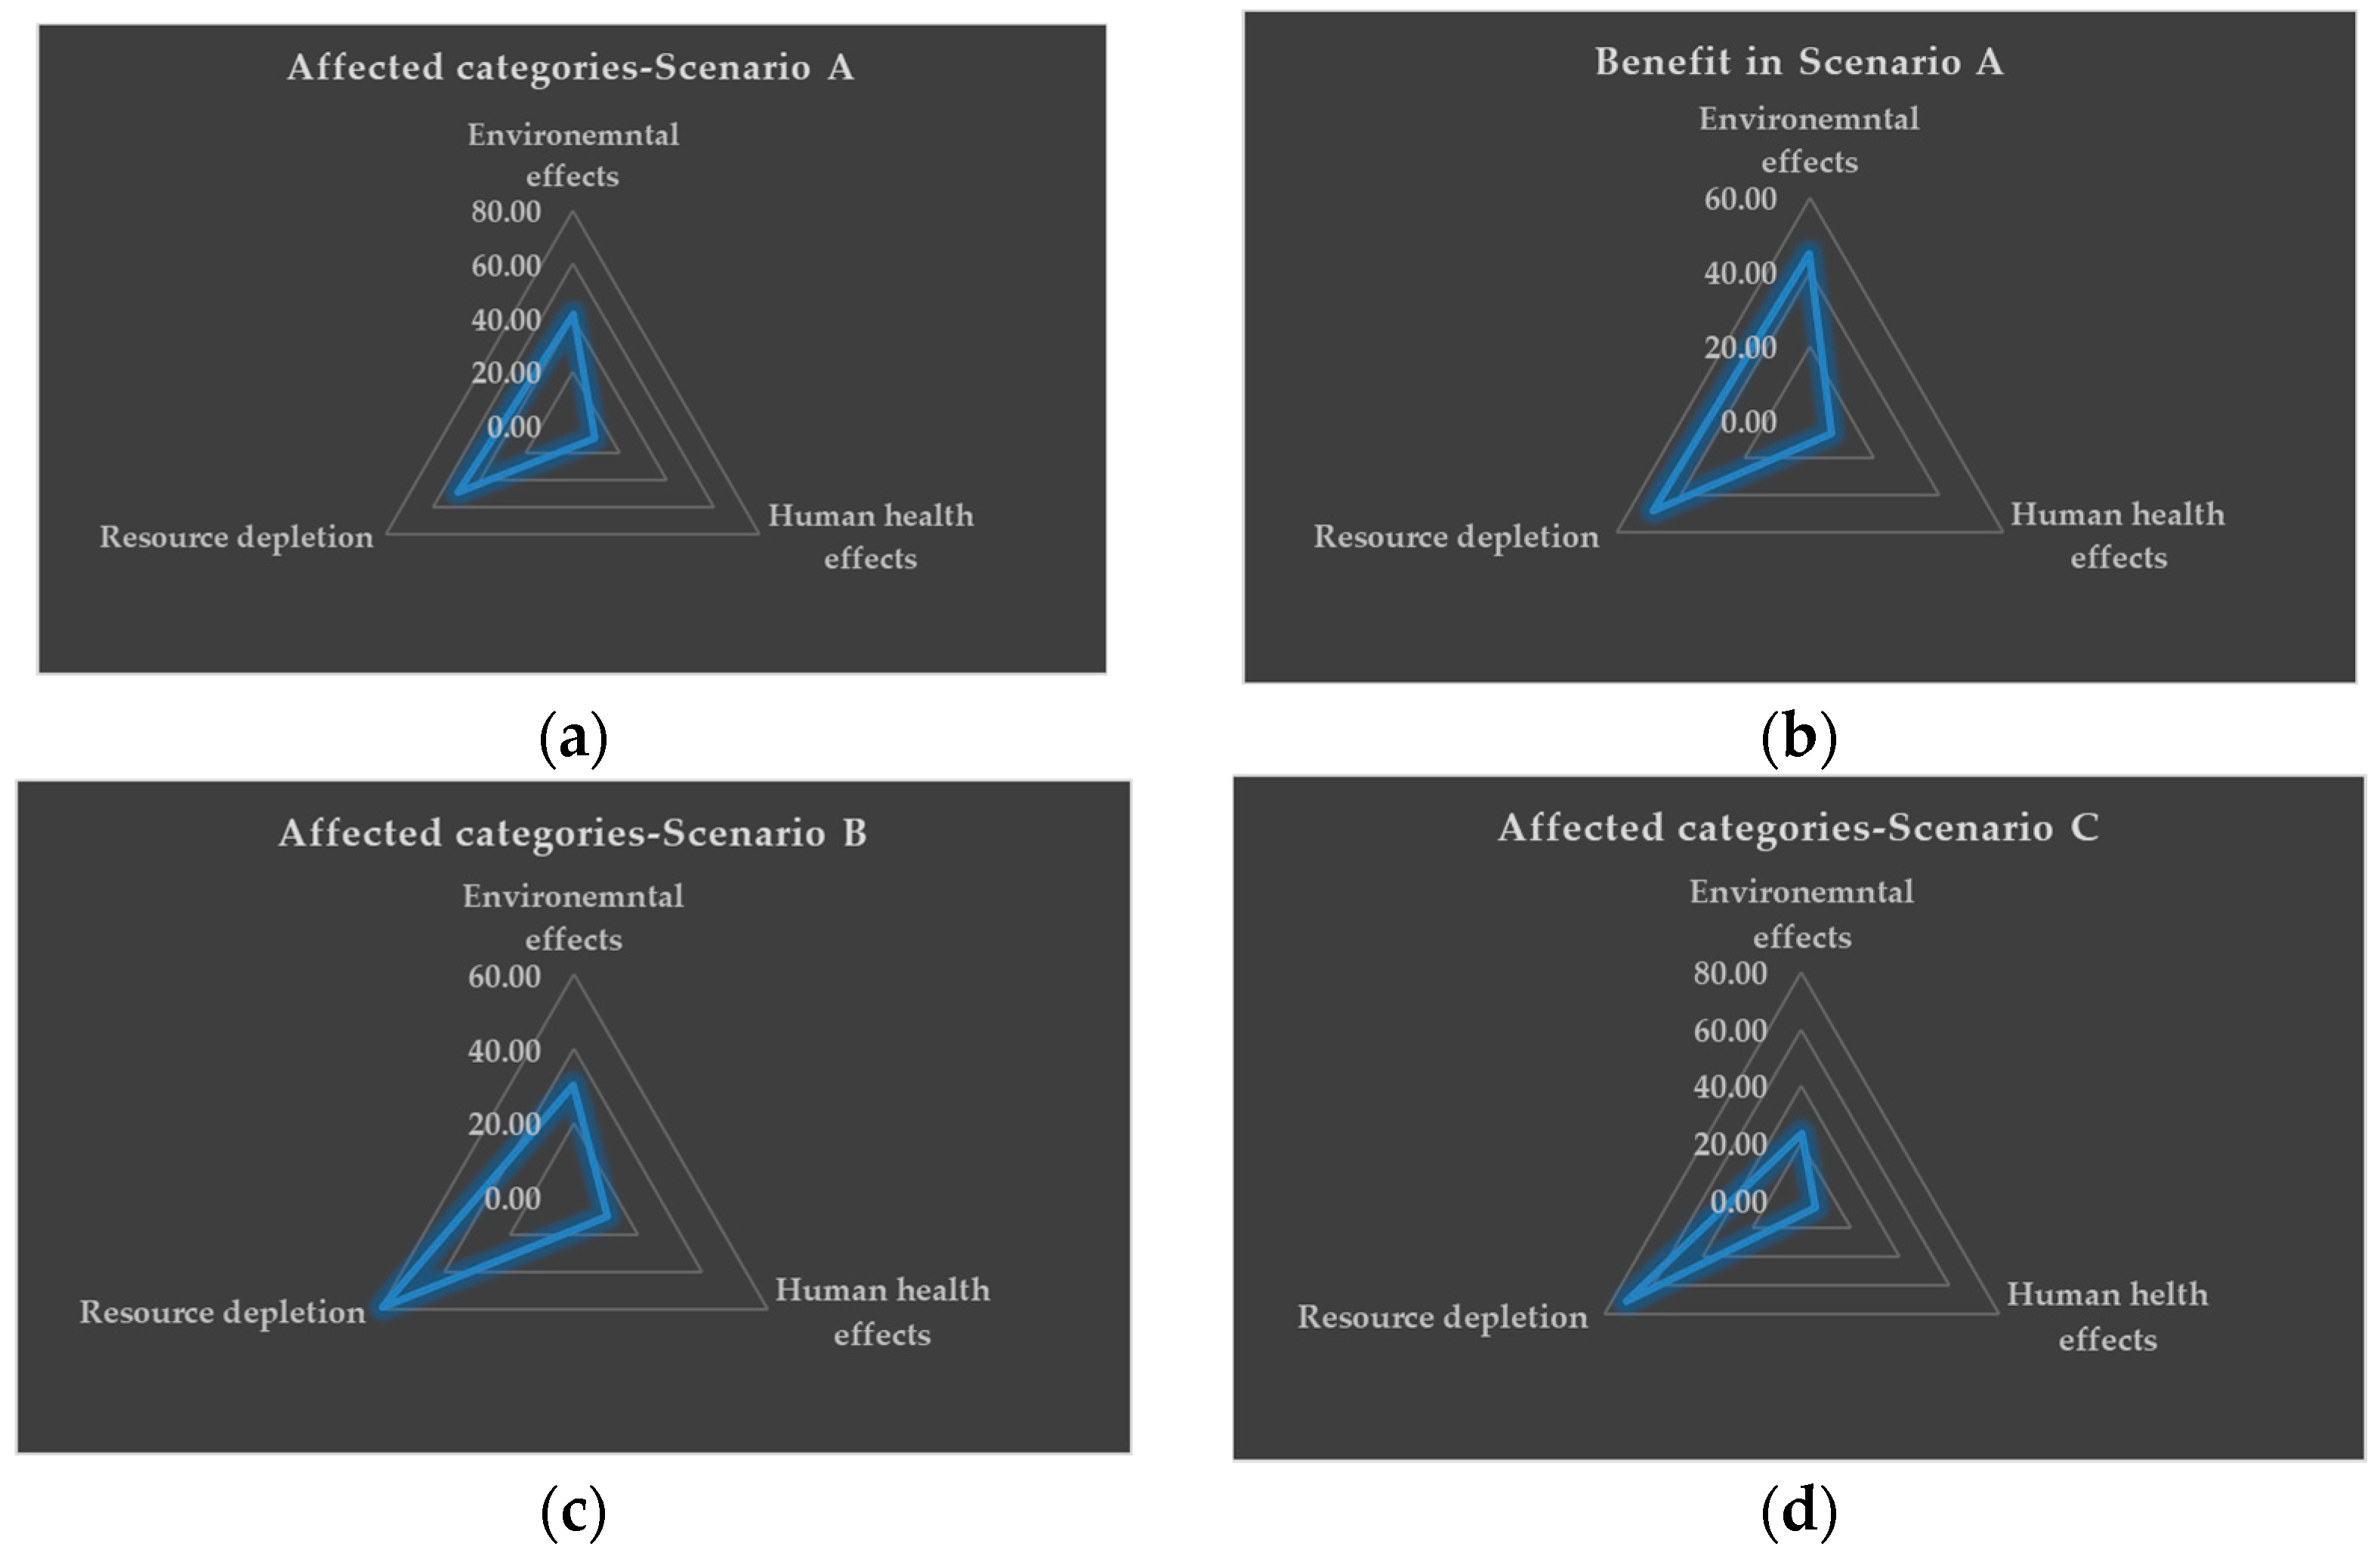
4.2. The Estimation of the Environmental Footprints
4.3. Evaluation of Data Quality
5. Discussion
Supplementary Materials
Author Contributions
Funding
Data Availability Statement
Acknowledgments
Conflicts of Interest
Abbreviations
| AD | Anaerobic digestion |
| BBP | Biochemical biogas potential |
| BMP | Biochemical methane potential |
| CHP | Combined heat and power |
| CNG | Compressed natural gas |
| EF | Environmental footprint |
| H&M | Heat and material |
| LCA | Lifecycle assessment |
| LNG | Liquefied natural gas |
| TS | Total solids |
| VOC | Volatile organic compounds |
| VS | Volatile solids |
References
- Rafiee, A.; Khalilpour, K.R.; Prest, J.; Skryabin, I. Biogas as an Energy Vector. Biomass Bioenergy 2021, 144, 105935. [Google Scholar] [CrossRef]
- D’Adamo, I.; Falcone, P.M.; Ferella, F. A Socio-Economic Analysis of Biomethane in the Transport Sector: The Case of Italy. Waste Manag. 2019, 95, 102–115. [Google Scholar] [CrossRef] [PubMed]
- Tsigkou, K.; Zagklis, D.; Parasoglou, M.; Zafiri, C.; Kornaros, M. Proposed Protocol for Rate-Limiting Step Determination during Anaerobic Digestion of Complex Substrates. Bioresour. Technol. 2022, 361, 127660. [Google Scholar] [CrossRef]
- United Nations The 17 Sustainable Development Goals (SDGs) to Transform Our World. Available online: https://sdgs.un.org/goals (accessed on 21 January 2023).
- Schroeder, P.; Anggraeni, K.; Weber, U. The Relevance of Circular Economy Practices to the Sustainable Development Goals. J. Ind. Ecol. 2019, 23, 77–95. [Google Scholar] [CrossRef] [Green Version]
- Zhang, S.; Xiao, M.; Liang, C.; Chui, C.; Wang, N.; Shi, J.; Liu, L. Multivariate Insights into Enhanced Biogas Production in Thermophilic Dry Anaerobic Co-Digestion of Food Waste with Kitchen Waste or Garden Waste: Process Properties, Microbial Communities and Metagenomic Analyses. Bioresour. Technol. 2022, 361, 127684. [Google Scholar] [CrossRef]
- Tsigkou, K.; Tsafrakidou, P.; Kopsahelis, A.; Zagklis, D.; Zafiri, C.; Kornaros, M. Used Disposable Nappies and Expired Food Products Valorisation through One- & Two-Stage Anaerobic Co-Digestion. Renew. Energy 2020, 147, 610–619. [Google Scholar] [CrossRef]
- Dareioti, M.A.; Vavouraki, A.I.; Tsigkou, K.; Kornaros, M. Assessment of Single-vs. Two-Stage Process for the Anaerobic Digestion of Liquid Cow Manure and Cheese Whey. Energies 2021, 14, 5423. [Google Scholar] [CrossRef]
- Tsigkou, K.; Kornaros, M. Development of a High-Rate Anaerobic Thermophilic Upflow Packed Bed Reactor for Efficient Bioconversion of Diluted Three-Phase Olive Mill Wastewater into Methane. Fuel 2022, 310, 122263. [Google Scholar] [CrossRef]
- Aravani, V.P.; Tsigkou, K.; Papadakis, V.G.; Kornaros, M. Biochemical Μethane Potential of Most Promising Agricultural Residues in Northern and Southern Greece. Chemosphere 2022, 296, 133985. [Google Scholar] [CrossRef]
- Tsigkou, K.; Zagklis, D.; Vasileiadi, A.; Kostagiannakopoulou, C.; Sotiriadis, G.; Anastopoulos, I.; Kostopoulos, V.; Zafiri, C.; Kornaros, M. Used Disposable Nappies: Environmental Burden or Resource for Biofuel Production and Material Recovery? Resour. Conserv. Recycl. 2022, 185, 106493. [Google Scholar] [CrossRef]
- Papavasileiou, P.; Zervou, M.-E.; Tsigkou, K.; Koutra, E.; Birbas, E.; Kornaros, M. Dilute Acid Pretreatment of Hippophae Rhamnoeides Prunings towards Their Biotechnological Exploitation through Anaerobic Digestion. Biomass Convers. Biorefinery 2022, 12, 4585–4597. [Google Scholar] [CrossRef]
- Quiroz, M.; Varnero, M.T.; Cuevas, J.G.; Sierra, H. Cactus Pear (Opuntia Ficus-Indica) in Areas with Limited Rainfall for the Production of Biogas and Biofertilizer. J. Clean. Prod. 2021, 289, 125839. [Google Scholar] [CrossRef]
- Atelge, M.R.; Atabani, A.E.; Banu, J.R.; Krisa, D.; Kaya, M.; Eskicioglu, C.; Kumar, G.; Lee, C.; Yildiz, Y.Ş.; Unalan, S. A Critical Review of Pretreatment Technologies to Enhance Anaerobic Digestion and Energy Recovery. Fuel 2020, 270, 117494. [Google Scholar] [CrossRef]
- Khan, M.U.; Lee, J.T.E.; Bashir, M.A.; Dissanayake, P.D.; Ok, Y.S.; Tong, Y.W.; Shariati, M.A.; Wu, S.; Ahring, B.K. Current Status of Biogas Upgrading for Direct Biomethane Use: A Review. Renew. Sustain. Energy Rev. 2021, 149, 111343. [Google Scholar] [CrossRef]
- Lombardi, L.; Francini, G. Techno-Economic and Environmental Assessment of the Main Biogas Upgrading Technologies. Renew. Energy 2020, 156, 440–458. [Google Scholar] [CrossRef]
- Kapoor, R.; Ghosh, P.; Kumar, M.; Vijay, V.K. Evaluation of Biogas Upgrading Technologies and Future Perspectives: A Review. Environ. Sci. Pollut. Res. 2019, 26, 11631–11661. [Google Scholar] [CrossRef]
- Ferella, F.; Cucchiella, F.; D’Adamo, I.; Gallucci, K. A Techno-Economic Assessment of Biogas Upgrading in a Developed Market. J. Clean. Prod. 2019, 210, 945–957. [Google Scholar] [CrossRef]
- Ferella, F.; Puca, A.; Taglieri, G.; Rossi, L.; Gallucci, K. Separation of Carbon Dioxide for Biogas Upgrading to Biomethane. J. Clean. Prod. 2017, 164, 1205–1218. [Google Scholar] [CrossRef]
- Ahmed, S.F.; Mofijur, M.; Tarannum, K.; Chowdhury, A.T.; Rafa, N.; Nuzhat, S.; Kumar, P.S.; Vo, D.-V.N.; Lichtfouse, E.; Mahlia, T.M.I. Biogas Upgrading, Economy and Utilization: A Review. Environ. Chem. Lett. 2021, 19, 4137–4164. [Google Scholar] [CrossRef]
- Angelidaki, I.; Treu, L.; Tsapekos, P.; Luo, G.; Campanaro, S.; Wenzel, H.; Kougias, P.G. Biogas Upgrading and Utilization: Current Status and Perspectives. Biotechnol. Adv. 2018, 36, 452–466. [Google Scholar] [CrossRef] [Green Version]
- Prussi, M.; Padella, M.; Conton, M.; Postma, E.D.; Lonza, L. Review of Technologies for Biomethane Production and Assessment of Eu Transport Share in 2030. J. Clean. Prod. 2019, 222, 565–572. [Google Scholar] [CrossRef] [PubMed]
- Brunetti, A.; Barbieri, G. Membrane Engineering for Biogas Valorization. Front. Chem. Eng. 2021, 3, 1–8. [Google Scholar] [CrossRef]
- International Energy Agency Scaling up Biomethane in the European Union: Background Paper. Available online: https://iea.blob.core.windows.net/assets/9c38de0b-b710-487f-9f60-f19d0bf5152a/IEAWorkshop_Scalingupbiomethane_backgroundpaper.pdf (accessed on 10 February 2023).
- Scarlat, N.; Dallemand, J.F.; Fahl, F. Biogas: Developments and Perspectives in Europe. Renew. Energy 2018, 129, 457–472. [Google Scholar] [CrossRef]
- Eurostat Natural Gas Supply Statistics- Statistics Explained. Available online: https://ec.europa.eu/eurostat/statistics-explained/index.php?title=Natural_gas_supply_statistics (accessed on 16 February 2023).
- Ardolino, F.; Parrillo, F.; Arena, U. Biowaste-to-Biomethane or Biowaste-to-Energy? An LCA Study on Anaerobic Digestion of Organic Waste. J. Clean. Prod. 2018, 174, 462–476. [Google Scholar] [CrossRef]
- Ardolino, F.; Cardamone, G.F.; Parrillo, F.; Arena, U. Biogas-to-Biomethane Upgrading: A Comparative Review and Assessment in a Life Cycle Perspective. Renew. Sustain. Energy Rev. 2021, 139, 110588. [Google Scholar] [CrossRef]
- Ardolino, F.; Arena, U. Biowaste-to-Biomethane: An LCA Study on Biogas and Syngas Roads. Waste Manag. 2019, 87, 441–453. [Google Scholar] [CrossRef] [PubMed]
- Masilela, P.; Pradhan, A. A Life Cycle Sustainability Assessment of Biomethane versus Biohydrogen—For Application in Electricity or Vehicle Fuel? Case Studies for African Context. J. Clean. Prod. 2021, 328, 129567. [Google Scholar] [CrossRef]
- Zang, J.W.; Martins, K.F.; Da Fonseca-Zang, W.A. Life Cycle Inventory for Biomethane as a Diesel Substitute for the Brazilian Ethanol Industry—Case Study. Energy Procedia 2018, 153, 444–449. [Google Scholar] [CrossRef]
- Gustafsson, M.; Svensson, N. Cleaner Heavy Transports—Environmental and Economic Analysis of Liquefied Natural Gas and Biomethane. J. Clean. Prod. 2021, 278, 123535. [Google Scholar] [CrossRef]
- Adelt, M.; Wolf, D.; Vogel, A. LCA of Biomethane. J. Nat. Gas Sci. Eng. 2011, 3, 646–650. [Google Scholar] [CrossRef]
- Ferrari, G.; Holl, E.; Steinbrenner, J.; Pezzuolo, A.; Lemmer, A. Environmental Assessment of a Two-Stage High Pressure Anaerobic Digestion Process and Biological Upgrading as Alternative Processes for Biomethane Production. Bioresour. Technol. 2022, 360, 127612. [Google Scholar] [CrossRef] [PubMed]
- Adams, P.W.R.; McManus, M.C. Characterisation and Variability of Greenhouse Gas Emissions from Biomethane Production via Anaerobic Digestion of Maize. J. Clean. Prod. 2019, 218, 529–542. [Google Scholar] [CrossRef]
- Tratzi, P.; Torre, M.; Paolini, V.; Tomassetti, L.; Montiroli, C.; Manzo, E.; Petracchini, F. Liquefied Biomethane for Heavy-Duty Transport in Italy: A Well-to-Wheels Approach. Transp. Res. Part D Transp. Environ. 2022, 107, 103288. [Google Scholar] [CrossRef]
- Khan, J.; Saif-ul-Allah, M.W.; Qyyum, M.A.; Ahmed, F.; Yasin, M.; Hussain, A.; Gillani, Z.; Bazmi, A.A. Reduction in Specific Energy Consumption of Overall Biogas Upgrading and Biomethane Liquefaction Process: Energy and Exergy Analysis. Energy Convers. Manag. 2022, 271, 116269. [Google Scholar] [CrossRef]
- Bidart, C.; Wichert, M.; Kolb, G.; Held, M. Biogas Catalytic Methanation for Biomethane Production as Fuel in Freight Transport—A Carbon Footprint Assessment. Renew. Sustain. Energy Rev. 2022, 168, 112802. [Google Scholar] [CrossRef]
- Hollas, C.E.; do Amaral, K.G.C.; Lange, M.V.; Higarashi, M.M.; Radis Steinmetz, R.L.; Barros, E.C.; Mariani, L.F.; Nakano, V.; Kunz, A.; Sanches-Pereira, A.; et al. Life Cycle Assessment of Waste Management from the Brazilian Pig Chain Residues in Two Perspectives: Electricity and Biomethane Production. J. Clean. Prod. 2022, 354, 131654. [Google Scholar] [CrossRef]
- Rossi, E.; Pasciucco, F.; Iannelli, R.; Pecorini, I. Environmental Impacts of Dry Anaerobic Biorefineries in a Life Cycle Assessment (LCA) Approach. J. Clean. Prod. 2022, 371, 133692. [Google Scholar] [CrossRef]
- Gupta, R.; Miller, R.; Sloan, W.; You, S. Economic and Environmental Assessment of Organic Waste to Biomethane Conversion. Bioresour. Technol. 2022, 345, 126500. [Google Scholar] [CrossRef]
- Czyrnek-Delêtre, M.M.; Rocca, S.; Agostini, A.; Giuntoli, J.; Murphy, J.D. Life Cycle Assessment of Seaweed Biomethane, Generated from Seaweed Sourced from Integrated Multi-Trophic Aquaculture in Temperate Oceanic Climates. Appl. Energy 2017, 196, 34–50. [Google Scholar] [CrossRef]
- Surra, E.; Esteves, I.A.A.C.; Lapa, N. Life Cycle Analysis of a Biorefinery for Activated Carbon and Biomethane Production. Biomass Bioenergy 2021, 149, 106080. [Google Scholar] [CrossRef]
- Park, T.; So, S.; Jeong, B.; Zhou, P.; Lee, J. ung Life Cycle Assessment for Enhanced Re-Liquefaction Systems Applied to LNG Carriers; Effectiveness of Partial Re-Liquefaction System. J. Clean. Prod. 2021, 285, 124832. [Google Scholar] [CrossRef]
- Jang, H.; Jeong, B.; Zhou, P.; Ha, S.; Nam, D. Demystifying the Lifecycle Environmental Benefits and Harms of LNG as Marine Fuel. Appl. Energy 2021, 292, 116869. [Google Scholar] [CrossRef]
- Balcombe, P.; Staffell, I.; Kerdan, I.G.; Speirs, J.F.; Brandon, N.P.; Hawkes, A.D. How Can LNG-Fuelled Ships Meet Decarbonisation Targets? An Environmental and Economic Analysis. Energy 2021, 227, 120462. [Google Scholar] [CrossRef]
- Pourahmadiyan, A.; Ahmadi, P.; Kjeang, E. Dynamic Simulation and Life Cycle Greenhouse Gas Impact Assessment of CNG, LNG, and Diesel-Powered Transit Buses in British Columbia, Canada. Transp. Res. Part D Transp. Environ. 2021, 92, 102724. [Google Scholar] [CrossRef]
- Song, H.; Ou, X.; Yuan, J.; Yu, M.; Wang, C. Energy Consumption and Greenhouse Gas Emissions of Diesel/LNG Heavy-Duty Vehicle Fleets in China Based on a Bottom-up Model Analysis. Energy 2017, 140, 966–978. [Google Scholar] [CrossRef]
- Sun, S.; Ertz, M. Life Cycle Assessment and Monte Carlo Simulation to Evaluate the Environmental Impact of Promoting LNG Vehicles. MethodsX 2020, 7, 101046. [Google Scholar] [CrossRef]
- Arteconi, A.; Brandoni, C.; Evangelista, D.; Polonara, F. Life-Cycle Greenhouse Gas Analysis of LNG as a Heavy Vehicle Fuel in Europe. Appl. Energy 2010, 87, 2005–2013. [Google Scholar] [CrossRef]
- Li, J.; Zhang, Z.; Zhang, S.; Shi, F.; Nie, Y.; Xu, L.; Ma, X. Life Cycle Assessment of Liquefied Natural Gas Production from Coke Oven Gas in China. J. Clean. Prod. 2021, 329, 129609. [Google Scholar] [CrossRef]
- Munagala, M.; Shastri, Y.; Nagarajan, S.; Ranade, V. Production of Bio-CNG from Sugarcane Bagasse: Commercialization Potential Assessment in Indian Context. Ind. Crop. Prod. 2022, 188, 115590. [Google Scholar] [CrossRef]
- Papong, S.; Rotwiroon, P.; Chatchupong, T.; Malakul, P. Life Cycle Energy and Environmental Assessment of Bio-CNG Utilization from Cassava Starch Wastewater Treatment Plants in Thailand. Renew. Energy 2014, 65, 64–69. [Google Scholar] [CrossRef]
- Khan, M.I.; Yasmin, T.; Shakoor, A. Technical Overview of Compressed Natural Gas (CNG) as a Transportation Fuel. Renew. Sustain. Energy Rev. 2015, 51, 785–797. [Google Scholar] [CrossRef]
- Ryan, F.; Caulfield, B. Examining the Benefits of Using Bio-CNG in Urban Bus Operations. Transp. Res. Part D Transp. Environ. 2010, 15, 362–365. [Google Scholar] [CrossRef]
- Meng, Q. The Impacts of Fracking on the Environment: A Total Environmental Study Paradigm. Sci. Total Environ. 2017, 580, 953–957. [Google Scholar] [CrossRef] [PubMed]
- Wong, W.C.J.; Zi, J.P.; Yang, H.F.; Su, J.R. Spatial-Temporal Evolution of Injection-Induced Earthquakes in the Weiyuan Area Determined by Machine-Learning Phase Picker and Waveform Cross-Correlation. Earth Planet. Phys. 2021, 5, 520–531. [Google Scholar] [CrossRef]
- Gilbert, A.Q.; Sovacool, B.K. US Liquefied Natural Gas (LNG) Exports: Boom or Bust for the Global Climate? Energy 2017, 141, 1671–1680. [Google Scholar] [CrossRef]
- Oil & Gas Investing News. Available online: https://investingnews.com/top-natural-gas-producers/ (accessed on 10 February 2023).
- S&P Global Commodity Insights. Available online: https://www.spglobal.com/commodityinsights/en (accessed on 10 February 2023).
- Qatargas. Available online: https://www.qatargas.com/english/operations/ (accessed on 11 February 2023).
- Abrahams, L.S.; Samaras, C.; Griffin, W.M.; Matthews, H.S. Life Cycle Greenhouse Gas Emissions from U.S. Liquefied Natural Gas Exports: Implications for End Uses. Environ. Sci. Technol. 2015, 49, 3237–3245. [Google Scholar] [CrossRef] [PubMed] [Green Version]
- Hayes, M. Algerian Gas to Europe: The Transmed Pipeline and Early Spanish Gas Import Projects; Geopolitics of Gas Working Paper Series; The Energy Forum at the James A. Baker III Institute for Public Policy: Houston, TX, USA, 2004. [Google Scholar]
- European Commission. Product Environmental Footprint Category Rules Guidance; European Commission: Brussels, Belgium, 2018; p. 238. [Google Scholar]
- Zampori, L.; Pant, R. Suggestions for Updating the Product Environmental Footprint (PEF) Method; Office of the European Union: Luxembourg City, Luxembourg, 2019; ISBN 9789276006541. [Google Scholar]
- European Commission. Commission Recommendation (EU) 2021/2279 on the Use of the Environmental Footprint Methods to Measure and Communicate the Life Cycle Environmental Performance of Products and Organisations. Off. J. Eur. Union 2021, 471, 396.
- European Commission Environmental Footprint. Available online: https://eplca.jrc.ec.europa.eu/EnvironmentalFootprint.html (accessed on 13 April 2023).
- Tagliaferri, C.; Clift, R.; Lettieri, P.; Chapman, C. Liquefied Natural Gas for the UK: A Life Cycle Assessment. Int. J. Life Cycle Assess. 2017, 22, 1944–1956. [Google Scholar] [CrossRef] [Green Version]
- Adriatic LNG Little Thin City. 2015. Available online: https://www.adriaticlng.it/wps/wcm/connect/69a7595d-3ea9-41dd-a004-30ca98c0bc10/Alng_LittleCity_xs.pdf?MOD=AJPERES&CONVERT_TO=url&CACHEID=ROOTWORKSPACE-69a7595d-3ea9-41dd-a004-30ca98c0bc10-lhY38O- (accessed on 1 February 2023).
- Hydrocarbons Technology Trans-Mediterranean Natural Gas Pipeline. Available online: https://www.hydrocarbons-technology.com/projects/trans-med-pipeline/ (accessed on 3 May 2023).
- Al-Douri, A.; Alsuhaibani, A.S.; Moore, M.; Nielsen, R.B.; El-Baz, A.A.; El-Halwagi, M.M. Greenhouse Gases Emissions in Liquified Natural Gas as a Marine Fuel: Life Cycle Analysis and Reduction Potential. Can. J. Chem. Eng. 2022, 100, 1178–1186. [Google Scholar] [CrossRef]
- Grasciari riuniti Grasciari Riuniti Project, Circular Economy in Agriculture. Available online: https://www.grasciaririuniti.it/ (accessed on 2 May 2023).
- Benítez, J.J.; Ramírez-Pozo, M.C.; Durán-Barrantes, M.M.; Heredia, A.; Tedeschi, G.; Ceseracciu, L.; Guzman-Puyol, S.; Marrero-López, D.; Becci, A.; Amato, A.; et al. Bio-Based Lacquers from Industrially Processed Tomato Pomace for Sustainable Metal Food Packaging. J. Clean. Prod. 2023, 386, 135836. [Google Scholar] [CrossRef]


| Organic Waste | Average Daily Capacity (tons/day) | Average Annual Capacity (tons/year) |
|---|---|---|
| Buffalo manure and straw | 100.00 | 36,500 |
| Buffalo liquid manure and washing water | 120.00 | 43,800 |
| Cornstalk | 5.37 | 1960 |
| Arundo donax | 36.71 | 13,400 |
| Tomato peels | 5.78 | 2110 |
| Pear pulp | 5.30 | 1935 |
| Legume scraps 1 | 3.64 | 1329 |
| Bean scraps | 4.03 | 1471 |
| Total | 280.83 | 102,505 |
| Energy/Mass Flow | Input | Output | |
|---|---|---|---|
| Scenario A | |||
| Anaerobic digestion | Mixed biomass (kg) | 30 | |
| FeCl3 (kg) | 1.2 × 10⁻³ | ||
| Electricity (kWh) | 0.21 | ||
| Thermal energy (kWh) | 1.6 | ||
| Diesel (L) | 3.0 × 10⁻³ | ||
| Composting | Pruning scraps, straw, leaves, and swarf (kg) | 1.2 | |
| Electricity (kWh) | 0.06 | ||
| Slow-release fertilizer (kg) | 2.3 | ||
| CHP plant | Electrical energy (kWh) | 0.81 | |
| Thermal energy (kWh) | 1.0 | ||
| Biogas purification | Make-up water (L) | 0.21 | |
| NaOH (kg) | 0.03 | ||
| Activated carbon (kg) | 3.0 × 10⁻³ | ||
| Electricity (kWh) | 8.2 × 10⁻³ | ||
| Wastewater (L) | 0.21 | ||
| Biogas upgrading (membranes) | Electricity (kWh) | 0.51 | |
| Compression and injection | Electricity (kWh) | 0.22 | |
| Biomethane (Nm3) | 1.0 | ||
| Liquefaction | Electricity (kWh) | 0.12 | |
| Beverage-grade CO2 (kg) | 1.4 | ||
| Photovoltaic plant | Electricity (kWh) | 0.37 | |
| Boiler | Natural gas (m3) | 0.04 | |
| Thermal energy (kWh) | 0.37 | ||
| Scenario B | |||
| Extraction and upstream operation | Methane (Nm3) | 1.0 | |
| Liquefaction | Electricity (kWh) | 0.83 | |
| Shipping | Diesel for compression on board | 1.0 × 10⁻⁴ | |
| Regassification | Electricity (from natural gas) (kWh) | 0.48 | |
| Scenario C | |||
| Extraction and upstream operation | Methane (Nm3) | 1.0 | |
| Pipeline | Electricity (kWh) | 2.4 × 10⁻² | |
| Impact on Climate Change (kg CO2 eq/Nm3 methane) | Reference |
|---|---|
| Scenario B (LNG) | |
| 1.1 | Present work |
| 1.0 | [71] |
| 0.9 | [68] |
| 1.3 | [62] |
| LCA Objective | Main Observations | Ref |
|---|---|---|
| Comparisons among biogas upgrading technologies (water scrubbing, membrane separation, pressure swing adsorption, and chemical absorption with amine solvent) |
| [28] |
| Comparison between biomethane and biohydrogen produced from organic waste streams |
| [30] |
| Comparison among LNG, liquefied biomethane, and diesel in heavy transports, including their production, distribution, and use |
| [32] |
| LCA of biomethane production and comparison with traditional natural gas |
| [33] |
| Comparison among biogas upgrading technologies (pressurized water scrubbing, chemical scrubbing, membrane separation, and pressure swing adsorption) |
| [41] |
| Analysis of the effect of the increase in United States liquefied natural gas exports on global greenhouse gas (GHG) emissions |
| [62] |
| Lifecycle assessment of LNG imported from Qatar to the United Kingdom, considering variable factors (energy for liquefaction and vaporization, fuel for propulsion, shipping distance, tanker volume, and raw gas composition) |
| [68] |
| Comparison between conventional shipping fuels and LNG |
| [71] |
Disclaimer/Publisher’s Note: The statements, opinions and data contained in all publications are solely those of the individual author(s) and contributor(s) and not of MDPI and/or the editor(s). MDPI and/or the editor(s) disclaim responsibility for any injury to people or property resulting from any ideas, methods, instructions or products referred to in the content. |
© 2023 by the authors. Licensee MDPI, Basel, Switzerland. This article is an open access article distributed under the terms and conditions of the Creative Commons Attribution (CC BY) license (https://creativecommons.org/licenses/by/4.0/).
Share and Cite
Amato, A.; Tsigkou, K.; Becci, A.; Beolchini, F.; Ippolito, N.M.; Ferella, F. Life Cycle Assessment of Biomethane vs. Fossil Methane Production and Supply. Energies 2023, 16, 4555. https://doi.org/10.3390/en16124555
Amato A, Tsigkou K, Becci A, Beolchini F, Ippolito NM, Ferella F. Life Cycle Assessment of Biomethane vs. Fossil Methane Production and Supply. Energies. 2023; 16(12):4555. https://doi.org/10.3390/en16124555
Chicago/Turabian StyleAmato, Alessia, Konstantina Tsigkou, Alessandro Becci, Francesca Beolchini, Nicolò M. Ippolito, and Francesco Ferella. 2023. "Life Cycle Assessment of Biomethane vs. Fossil Methane Production and Supply" Energies 16, no. 12: 4555. https://doi.org/10.3390/en16124555