Article

Simultaneous Hydrogen and Ethanol Production from Crude Glycerol by a Microbial Consortium Using Fed-Batch Fermentation

Biotechnological Processes for Energy & Industry Laboratory (PBE), Department of Energy Technologies and Renewables, ENEA—Italian Agency for New Technologies and Renewable Source, 00123 Rome, Italy
*
Author to whom correspondence should be addressed.
Current address: Department of Chemistry, Umeå University, 90187 Umeå, Sweden.
Energies 2023, 16(11), 4490; https://doi.org/10.3390/en16114490
Submission received: 22 April 2023 / Revised: 26 May 2023 / Accepted: 28 May 2023 / Published: 2 June 2023
(This article belongs to the Special Issue Biological Processes in the Green Hydrogen Value Chain)

Abstract

:
Simultaneous bioproduction of hydrogen and ethanol from cheaper waste feedstock has the potential for the development of a more cost-effective biofuel generation process. Crude glycerol (CG), a by-product of the biodiesel industry, is a renewable resource, abundant, sold at low prices and available worldwide. However, the main CG limitations in fermentation processes are mainly related to the presence of impurities and the lack of nitrogen sources, both acting on microbial activity. In this study, a fermentation process with CG was improved using a highly specific microbial consortium called GlyCeroL (GCL). The process was developed in fed-batch fermentation mode using not diluted substrate and carried out under non-sterile conditions and at increasing amounts of the substrate (from 20 to 80 gL−1 of glycerol). The results showed higher H2 (from 6 to 8 LL−1) and EtOH (from 13 to 20 gL−1) production by increasing glycerol concentration from 20 to 40 gL−1. On the other hand, a decrease in glycerol degradation efficiency (from 75 to 56%) was observed. Then, the nitrogen sparging strategy was applied. Using CG of 40 gL−1, process improvement was achieved, leading to the increased production of hydrogen (10 LL−1) but not that of ethanol (20 gL−1). A further increase to 60 gL−1 of glycerol produced a slight increment of EtOH (21 gL−1) and H2 (11 gL−1) but a sharp decrease in glycerol degradation efficiency (41%). Acetate, as the main impurity of CG, was an additional carbon source for GCL microorganisms contributing to EtOH production and increasing that of lactic acid to restore the redox balance. The Denaturing Gradient Gel Electrophoresis (DGGE) fingerprint at the end of all fed-batch fermentations supported the robustness of GCL functional units and their adaptability to fermentation conditions.

1. Introduction

The European Union aims to reduce greenhouse gas emissions by 80–95% in 2050 compared to 1990 levels [1]. Reaching net zero by 2050 means a huge decline in the use of fossil fuels. Renewable resources and biofuels, such as biohydrogen, bioethanol and biodiesel, seem to be the most promising alternatives for addressing this challenge, both for the energy generation and transportation sectors. Hydrogen is an excellent energy carrier and a competitive biofuel since it can be considered a clean gas with no carbon dioxide released during its combustion [2,3] but only water vapor. Bioethanol, the ethanol derived from biomass, represents the most widespread biofuel for transportation worldwide. When sustainably produced, bioethanol is also a promising feedstock for thermochemical systems for the production of ‘green’ hydrogen [4]. Simultaneous production of hydrogen and ethanol from waste materials has the potential for the development of a more cost-effective biofuel generation process. Their co-production is more beneficial in terms of cost and time savings compared to fermentation focusing on either hydrogen or ethanol production alone [4,5].
Crude glycerol (CG), the principal by-product of the biodiesel industry, represents a suitable substrate for joint biofuel production through the fermentation process. The world biodiesel market is estimated to reach 49,882 million liters in 2030, which means about 4 billion gallons of crude glycerol will be produced [6]. This makes CG one of the cheapest substrates for biofuel production, estimated as nearly 40% cheaper than sugar-based production, thanks to the highly reduced nature of its carbon atoms [7]. For example, the use of glycerol permits the co-production of ethanol and formic acid (or ethanol and hydrogen), whereas the fermentation of sugars such as glucose imposes that about half of their weight is lost as CO2 reducing the product yield. The additional reducing equivalents provide glycerol with the natural advantage of maximizing the production of reduced chemicals and fuels [8,9].
Indeed, previous investigations of our group showed the feasibility of a fermentative process joining ethanol and hydrogen production from CG, using a highly specific microbial consortium called GCL (GlyCeroL), directly selected on CG as a unique carbon source [10]. This process required no yeast extract, tryptone, or minerals/vitamins, which made it highly competitive with traditional carbohydrate fermentation. Thanks to the application of an experimental design, it was possible to optimize the simultaneous production of hydrogen and ethanol in 125 mL batch experiments at 15 gL−1 of glycerol concentration, obtaining very high productions of 3.9 LL−1 (0.96 mol mol−1) and 7.9 gL−1 for hydrogen and ethanol, respectively [11]. Moreover, in a batch fermentation process scaled up to 1 L (15 gL−1 CG), the GCL microbial community demonstrated the ability to effectively convert different CG types, also including pure glycerol, with average values of 97.42% ± 0.98 of degradation efficiency and joint production of 5.69 gL−1 ± 0.23 of ethanol and 3.60 LL−1 ± 0.19 (0.90 mol mol−1) of hydrogen [10], showing the possibility to work in non-sterile conditions (with the same efficiency of pure glycerol, in sterile conditions), which contribute to significantly reduce the operation costs. Microorganisms belonging to Klebsiella spp., Escherichia/Shigella spp., and a less representative group belonging to the Cupriavidus genera constituted the GCL functional consortium [10]. Both Klebsiella spp. and Escherichia/Shigella spp. showed high intra-species diversity (polymorphism), playing the roles of hydrogen and ethanol producers. Pure strains of both microbial species are frequently used in the literature for CG or pure glycerol fermentations aiming at the production of chemicals and/or biofuels [12,13,14]. Also, selected mixed cultures have been widely used in the fermentative process of CG [14,15,16,17], and it is undoubted that they present several advantages over pure strains, such as the lack of need for sterile conditions, lower sensitivity to contaminants, and thus lower operational costs for the overall process.
However, very little research has been conducted with the aim of optimizing the simultaneous production of hydrogen and ethanol from CG fermentation at the same time. Mostly, studies were conducted with pure culture [5,18,19] and engineered strains [20,21]. Recently, two studies reported the production of hydrogen and ethanol from CG by mixed culture fermentation [22,23]. Paesi and authors [22], working in batch (working volume of 0.3 L) at 37 °C and with 30 gL−1 of CG, obtained a hydrogen production of 2.7 and 1.9 LL−1 (0.96–1.12 mol mol−1), together with 1.6 and 2.6 gL−1 of ethanol using mixed culture from vegetable oil and wine industry sludges as inocula, respectively. Sittijunda and Reungsang [23] operated a CG fermentation in continuous mode in an up-flow anaerobic sludge blanket (UASB) reactor, inoculated with anaerobic granules, under thermophilic conditions (55 ± 4 °C). These authors investigated the effect of different organic loading rates (25, 37.5, 50, 62.5 and 75 gL−1 d−1) on the production of hydrogen, ethanol and 1,3-propanediol. Maximum productions of 12 LL−1 (2.05 mol mol−1) of hydrogen and 2.25 gL−1 of ethanol at an organic loading rate of 62.5 gL−1 d−1 were reported. However, both studies supplemented the culture medium with different nitrogen sources, able to effectively increase the rate of hydrogen and ethanol production [24]. Moreover, CG is characterized by a variable level of purity, and it can contain impurities (methanol and other organic fraction), which roles are rarely considered in the fermentative process.
The aim of this study is to increase the simultaneous production of hydrogen and ethanol by the GCL microbial consortium in non-sterile conditions. To reach this aim, fermentations were carried out in fed-batch mode (batch phase followed by feed addition of not diluted substrate), using increasing amounts (20, 40, 60 and 80 gL−1) of CG as unique carbon source and nitrogen (as inert gas) sparging strategy. The impact on hydrogen and ethanol production performances and metabolic pathways was evaluated. Particular attention was addressed to understanding the role of CG impurities (i.e., acetate) in the fermentation process. Moreover, the molecular fingerprint was characterized using Denaturing Gradient Gel Electrophoresis (DGGE) in order to control the stability of the GCL microbial consortium during fed-batch fermentations.

2. Materials and Methods

2.1. Media Composition and Substrate

A minimal medium was used. It contained per liter of distilled water: 3.4 g of K2HPO4·3H2O, 1.3 g of KH2PO4, 2 g (NH4)2SO4, 0.2 g MgSO4·7H2O, 20 mg of CaCl2·2H2O and 5 mg FeSO4·7H2O. Crude glycerol (CG) was supplied by ItalBiOil srl, a biodiesel factory from south Italy producing biodiesel from vegetable oils. This resulted in a highly viscous liquid, which contained up to 90.2% of glycerol, with some impurities mainly composed of acetate (6.7%ww−1), ashes (3.3%), methanol (0.7%), moisture (4.0%), MONG-non-glycerol organic matter (2.5%) and pH 7.0. Glycerol was completely soluble in water, as confirmed by HPLC analysis.

2.2. Inoculum Preparation and Growth Conditions

The GCL was stored at −20 °C and refreshed from time to time in two steps (pre-culture and activated inoculum). Cultivation was carried out in serum flasks (125 mL) containing 45 mL of minimal medium supplemented with 10 gL−1 of tryptone and 10% (vv−1) of GCL culture. The pH of the medium was adjusted to 8.0 with 6N KOH. The serum bottles were sealed with rubber stoppers and an aluminum crimp, and anaerobic conditions were ensured by nitrogen sparging for 10 min. The pre-culture was incubated for 44–48 h at 37 °C with continuous stirring at 120 rpm before re-inoculation into the fresh pre-warmed minimal medium. The second incubation step was continued for 22–24 h to obtain a fully activated GCL.

2.3. Fed-Batch Fermentations

All experiments were conducted under non-sterile conditions using a jacketed 3 L BioFlo/Celligen bioreactor (New Brunswick Scientific, Edison, NJ, USA) with 1 L working volume, 10% (vv−1) of activated GCL culture inoculated into minimal medium and at mesophilic temperature (37 °C). The initial pH was set to 8.0 using a 6 M KOH solution. Anaerobic conditions were obtained by initially sparging the medium with pure nitrogen (N2) at a flow rate of 1 Lmin−1 for 10 min. Fed-batch fermentations were performed at increasing concentrations of CG (20, 40, 60 and 80 gL−1 of glycerol) using stringent experimental conditions: supplementary substrate was added as the only carbon source once the fermentation reached a stationary phase of production without removing the microbial culture and/or adding salts into the medium. Experiments are cited in the main text with capital letters: A and B (20 gL−1), C and D (40 gL−1), E (60 gL−1) and F (80 gL−1). Each fermentation started with a batch phase followed by further substrate feedings (cycles). The feeding was performed to restore the initial CG concentration using the not-diluted stock of CG, and it was repeated until the bioreactor was still able to ferment. During fed-batches D, E and F, a sparging phase with N2 was applied, after CG addition and/or every 24 h, at a flow rate of 1 Lmin−1 for 10 min to remove all biogas from the bioreactor. The pH was measured by in situ probe, and it was not controlled during all fed-batch fermentations. Working substrate concentrations are hereafter indicated as gCG, and they refer to glycerol amounts (g). Analogously, substrate consumption is expressed by gCGc, and it refers to the amount of glycerol (g) consumed.

2.4. Microbial Growth

Microbial cell density (n°cell mL−1) was determined in duplicate by incubating 100 μL of sample aliquots with 4′,6-diamidino-2-phenylindole (DAPI; 1 μg ml−1) for 20 min in dark conditions and then filtered on membrane filters (black polycarbonate filters, pore size 0.2 μm, diameter 25 mm, Millipore, Burlington, MA, USA). For each fed-batch experiment, cell density determinations were performed from the start and every 24 h until the end. Direct cell count was performed using a fluorescent microscope (Axioskop 40, Zeiss, Jena, Germany) equipped with a mercury-vapor lamp (HBO 50 W/AC). The net specific growth rate (h−1) was calculated according to Formula (1);
μ = ln x 2 ln x 1 t 2 t 1
where x2 and x1 are the concentration of the biomass at times t2 and t1 (h) of the exponential growth phase.

2.5. Gas and Metabolite Analysis

The evolved biogas was collected by the water displacement equipment, and the volume of produced H2 was calculated by the mass balance equation as previously described [25]. The cumulative H2 production (H) data were fitted to a modified Gompertz equation [25]. Biogas H2 and CO2 composition (%) was analyzed by a gas chromatograph (Focus GC, by Thermo, Waltham, MA, USA) equipped with a thermal conductivity detector (TCD) and a 3 m Stainless Steel column packed with Hayesep Q (800/100 mesh). Nitrogen gas was used as a carrier at a flow rate of 35 mL/min. The temperature of the column and of the injector was 120 °C, while that of the thermal conductivity detector (TCD) was 200 °C. A gas chromatography calibration curve was performed, for each specie detected, by several pure gas mixtures with H2 and CO2. Considering the obtained fittings, an experimental imprecision of ±5% is present for the measurement of the volume percentages. The partial pressure of hydrogen (pH2) was determined by Dalton’s law. Liquid samples were analyzed for substrate consumption and soluble fermentation metabolites by high-performance liquid chromatography (Thermo Spectrasystem P4000, Thermo Fisher Scientific, San Jose, CA USA) The column (Rezex ROA Organic Acid H+ (8%), size 300 × 7.8 mm Phenomenex) was operated at 75 °C using a solution of 2.5 mM H2SO4 as mobile phase (flow rate 0.6 mL/min). Volatile Fatty Acids (VFAs) and lactic acid were measured using a UV detector (λ = 210 nm). Glycerol, ethanol, 1,3 propanediol and 2,3 butanediol were detected by a refraction index detector. Samples were centrifuged for 10 min at 12,000 rpm, diluted 1:20 with mobile phase solvent and again centrifuged for 10 min at 12,000 rpm before injection. The average values presented here are based on two replicates. A relative standard deviation < 5% was obtained for all data. The corresponding Undissociated Acetic Acid (UAA) was calculated according to Formula (2), as described in Yin et al. [26].
U A A   c o n c e n t r a t i o n = T A A   c o n c e n t r a t i o n × C H + K a + C H +
where TAA is the total acetic acid (gL−1), CH+ is the proton concentration at specific pH values and Ka is the dissociation constant of acetic acid. The calculated UAA concentrations are reported in mgL−1.

2.6. Analysis of Microbial Community Structure

2.6.1. Isolation and Characterization of Main Microbial Communities of GCL

The isolation was performed on the pre-activated GCL inoculum. Serial dilutions (10−4, 10−5, 10−6, etc.) of the initial inoculum were plated on agar Minimal Medium (15% p/v). Plates were incubated at 37 °C for 24 h in an anaerobic jar. Single colonies, showing different morphologies, were picked up from plates and re-streaked on fresh plates more than three times to ensure the purity of the isolates.

2.6.2. DNA Extraction and PCR Amplification

A fresh GCL culture was used as an inoculum, single colonies were isolated as described above, and the culture collected at the end of all fed-batch fermentations was used for DNA extraction, as previously described [10]. Genomic DNA was used for amplifying the hypervariable region V1–V3 (about 500 bp) of the 16S rRNA gene using the 2720 Thermal Cycler (Applied Biosystems, Foster City, CA, USA). Universal bacterial primers 27F-GC (AGAGTTTGATCCTGGCTCAG) and 518R (ATTACCGCGGCTGCTGG) were used for amplifying the V1–V3 region with 30 cycles of the following protocol: 95 °C for 30 s, 54 °C for 30 s, 72 °C for 30 s, and then the final extension at 72 °C for 10 min. After each PCR reaction, DNA samples were precipitated with 5M NaCl and 2.5 vol of EtOH.

2.6.3. Denaturing Gradient Gel Electrophoresis (DGGE)

PCR amplified fragments were analyzed by denaturing gradient gel electrophoresis (DGGE) in a DCode universal mutation detection system (Bio-Rad, Hercules, CA, USA). Samples were loaded onto 6% (w/v) polyacrylamide (37.5:1 acrylamide: bis-acrylamide) gel in a 1× TAE buffer (40 mM tris-acetate, 1 mM EDTA) with a denaturing gradient ranging from 40% to 65% (100% denaturant corresponding to 7 M urea and 40% (v/v) deionized formamide). After the run, the gel was stained in 1× TAE buffer containing SYBR green I 0.5× (Invitrogen, Carlsbad, CA, USA) for 1 h, destained in water and photographed.

3. Results and Discussion

3.1. Fed-Batch Experiments for Hydrogen and Ethanol Production

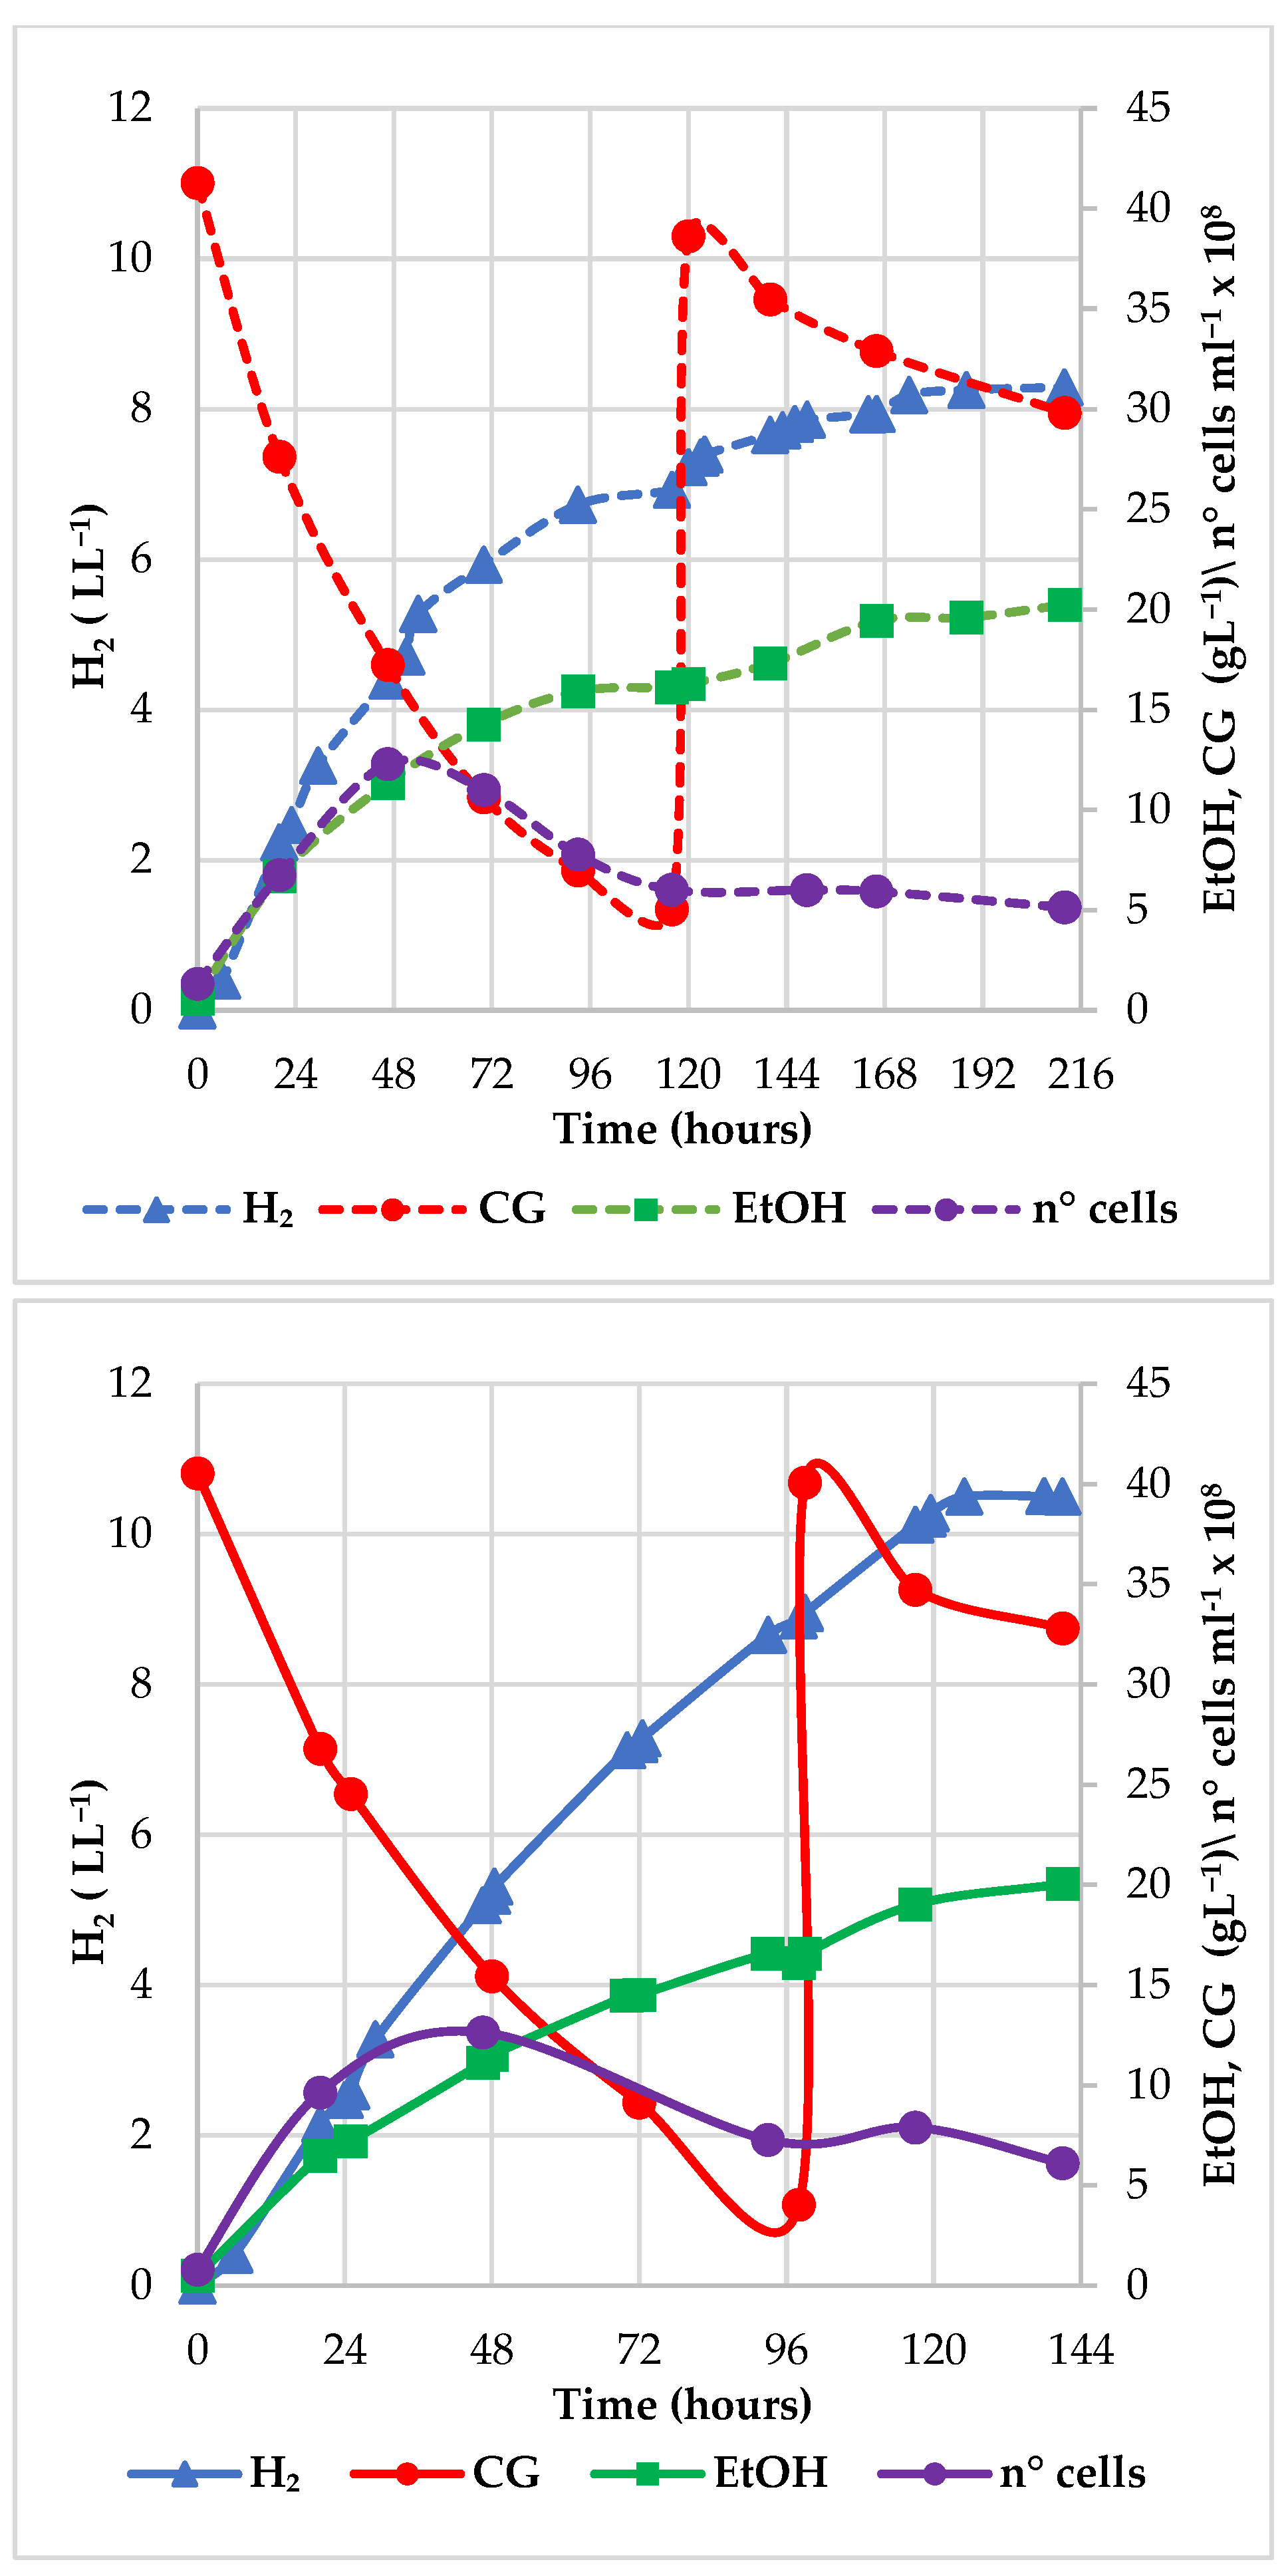
3.1.1. Increasing the CG Concentration: Performance of the Fed-Batch Processes

The experimental work included fed-batch experiments performed in non-sterile cultivation conditions with CG implemented at increasing amounts (20, 40, 60 and 80 gL1 of CG) with the aim of enhancing the substrate conversion efficiency and the end-product concentration. Table 1 summarizes the main parameters and performances of fed-batch experiments.
Fed-batch cycles: number of fed-batch cycles following the starting batch phase; Feed (gCGL1): starting glycerol concentration used for batch and restored at the fed-batch cycle; CGc (g): total glycerol consumed; CG degradation (%): efficiency of glycerol consumption as compared to the total amount added; Time (h): hours of fermentations; µ (h1): specific microbial growth rate; Parameters of modified Gompertz equation; Pmax (L): hydrogen production potential; Rmax (L h−1): maximum hydrogen production rate; λ (h): lag time.
All fed-batch fermentations were characterized by a batch followed by a unique feed cycle (CG addition phase), except for experiment F. The first two fed-batch fermentations (A and B), both performed with 20 gL1 of the substrate, did not show relevant differences in the main fermentation performances. On average, they consumed around 30 gL1 ± 1 of glycerol, corresponding to 75% ± 2 of the total CG added, producing 13 gL1 ± 1 of EtOH and 6 LL1 ± 0 of H2 (which corresponded to a yield of 0.69 molH2 mol1CGc ± 0.08). H2 content in the biogas was equal to 52 ± 2%. As the main difference, fed-batch A lasted more (213 h) than fed-batch B (182 h), and the additional time was due to a more lengthened batch phase (68 h and 46 h for A and B, respectively. At the same time, substrate consumption during the batch phase of both fermentations was the same (18.2 gL1 ± 0.4), and the slower efficiency of GCL microorganisms growth during fed-batch A (µ = 0.055 h1) compared to fed-batch B (µ = 0.071 h1) suggested that microorganisms took more time to adapt to bioreactor conditions. Although we observed this delay of microbial growth, the overall efficiencies of fermentations A and B at the end of fed-batch fermentation were comparable, showing that the two processes were reproducible in terms of CG consumption and hydrogen and ethanol production. In fed-batch C, the feed concentration was doubled (40 gL1), and this led to an increase in both the EtOH and H2 production. During a fermentation time similar to the one observed for fed-batch A, higher consumption of substrate was observed, although the efficiency in CG degradation decreased to 56%, suggesting the effects of inhibition on the metabolism of GCL microorganisms. Indeed, H2 content in the biogas tended to increase during the course of the fermentation, reaching the highest values of 52.9% ± 0.4 (n = 5, 4698 h) during the batch phase as well as of 57.0% ± 1.3 (n = 7, 120149 h) after the feed addition phase. Accordingly, H2 partial pressure reached values of 5.3 × 10⁴ Pa ± 0.1 and 5.6 × 10⁴ Pa ± 0.2, respectively. H2 partial pressure is known to be an inhibitory factor affecting the efficiency of fermentation [27,28]. With the aim of decreasing the H2 partial pressure, intermittent N2 sparging (every 24 h) was therefore applied to the next fermentation experiments (D, E and F). In fed-batch D, all the experimental parameters were maintained as in fed-batch C, with the exception of the sparging. Figure 1 shows the comparison between fed-batch fermentations C and D.
Fed-batch D was positively affected by N2-sparging, shown by the fact that H2 production increased up to 10 LL−1 and occurred over a shorter time (141 h). As expected, the maximum hydrogen concentration was kept lower (52%) due to dilution with nitrogen. This resulted in an increase in the H2 production yield reaching the value of 0.87 molmol−1 CGc. The maximum growth rate of GCL microorganisms also increased from experiments C to D (0.074 and 0.125 h−1, respectively). However, compared to fed-batch C, no increment of EtOH production was detected. A slight increment of CG consumed (50 gL−1), which corresponded to slight increases in both H2 (11 LL−1) and EtOH (21 gL−1) production, was observed in fed-batch E with 60 gL−1 of CG, but the efficiency of degradation was lower (41%), leading to the lower yield of 0.78 molmol−1 CGc. Further increase of CG concentrations (80 gL−1) did not improve the fermentation. Indeed, experiment F did not proceed beyond the batch phase, and finally, 16 gL−1 of EtOH and 17 LL−1 of H2 were obtained with 43 gL−1 of CG consumed, corresponding to 54% of the initial concentration. It is likely that the greater input of CG in the bioreactor also added more impurities. In our study, acetate (revealed as acetic acid by HPLC analysis) represented the main impurity of CG, and its inhibitory effects on GCL microbial growth cannot be excluded. Indeed, the growth rate decreased both in E and F (0.090 and 0.060 h−1, respectively) as compared to experiment D. The modified Gompertz model was able to describe the evolution of hydrogen production satisfactorily as confirmed by the values of R2 > 0.988 (Table 1). Intermittent N2 sparging increased both the hydrogen production potential (Pmax, L) and the maximum hydrogen production rate (Rmax, L h−1) as shown by comparison of not-N2 sparged A-C with sparged D-F fed-batch experiments. The lag phase had a shorter timespan, Lower timespan of lag phase (λ, h) characterized the not-sparged fermentations and particularly B and C fed-batch processes, both showing a lag phase of zero. This behavior suggested the activation state of GCL microorganisms prior to the inoculation was optimal. Conversely, λ increased from 3 to 9.84 h with the increase of CG concentration among the N2-sparged experiments, suggesting the need for prolonged adaptation to higher concentrations of the substrate by GCL microorganisms. Compared to our previous study [10], this work showed a substantial improvement in the process due to the use of the fed-batch mode coupled with N2 sparging. Firstly, Pmax H2 increased from 3.6 L H2 ± 0.19, concerning the conversion of different glycerol types, also including pure glycerol, to 11.3 L. The hydrogen yield (0.87 mol mol−1 CGC) was slightly lower as compared to 0.90 mol mol−1 CGC ± 0.01 of the previous study, but it was obtained using a much higher CG concentration (i.e., 40 gL−1 compared to 15 gL−1). Moreover, compared to that study, also the EtOH production and yield increased from 5.69 gL−1 ± 0.23 and 0.73 mol mol−1 CGC ± 0.03 to 20 gL−1 and 0.92 molmol−1 CGC, respectively. Table 2 shows a more extensive comparison with other literature data reporting the simultaneous production of EtOH and H2 from the fermentation of glycerol.
Using pure strains in batch experiments, the decrease of both EtOH and H2 yields was observed at increasing concentrations of crude glycerol [29]. Other authors reported that substrate inhibitions simultaneously affected the EtOH and H2 production but not the respective yields [18]. On the other hand, the insertion of pH controls under basic and acidic conditions during batch fermentation with wild-type and engineered pure strains resulted in the simultaneous improvement of both EtOH and H2 yields and amounts [21]. A different type of fermentation than the batch mode was developed by Cofrè and authors [19], optimizing an exponential fed-batch sterile fermentation by E. coli MG1655, with pH control and with continuous Argon sparging, obtaining 6.3 gL−1 and 2.2 LL−1 of EtOH and H2, respectively. Among the mentioned pure strains (all facultative anaerobic microorganisms), the higher concentration results of 12.2 gL−1 and 6.9 LL−1 of EtOH and H2, respectively, were obtained by the isolated Klebsiella HE1 [18], without N2 sources addition into the medium culture but by use of pure glycerol. The use of a co-culture of E. coli CETC432 and Enterobacter spH1 enabled to performance of a very efficient process with crude glycerol, reaching 10.0 gL−1 and 7 LL−1 of EtOH and H2, respectively. These authors observed yields higher than the maximum theoretical (1 molmol−1) due to the metabolism of additional carbon sources present in crude glycerol [24]. Magrini et al. [31] observed that the use of different co-culture compositions facilitated an increase in EtOH but not H2 production (or vice versa). This suggests that simultaneous optimization of the production of both metabolites can only occur when syntrophic relationships can be established between co-cultured organisms, such that the oxidative pathway of glycerol metabolism will be favored. The use of mixed cultures [22,23,32] was revealed to be more efficient for H2 production but not for EtOH (both in the continuous and batch fermentation modes). This was probably due to the presence of obligate anaerobic microorganisms, as has also been observed in co-culture [31]. Compared to the data in Table 2, the fed-batch process conducted in the present study by the mixed consortium GCL, composed of Klebsiella spp. and Escherichia spp. functional units showed the best results in terms of simultaneous EtOH and H2 production. However, research efforts for the identification of microbial inhibition mechanisms on the fed-batch process for further optimization are required.

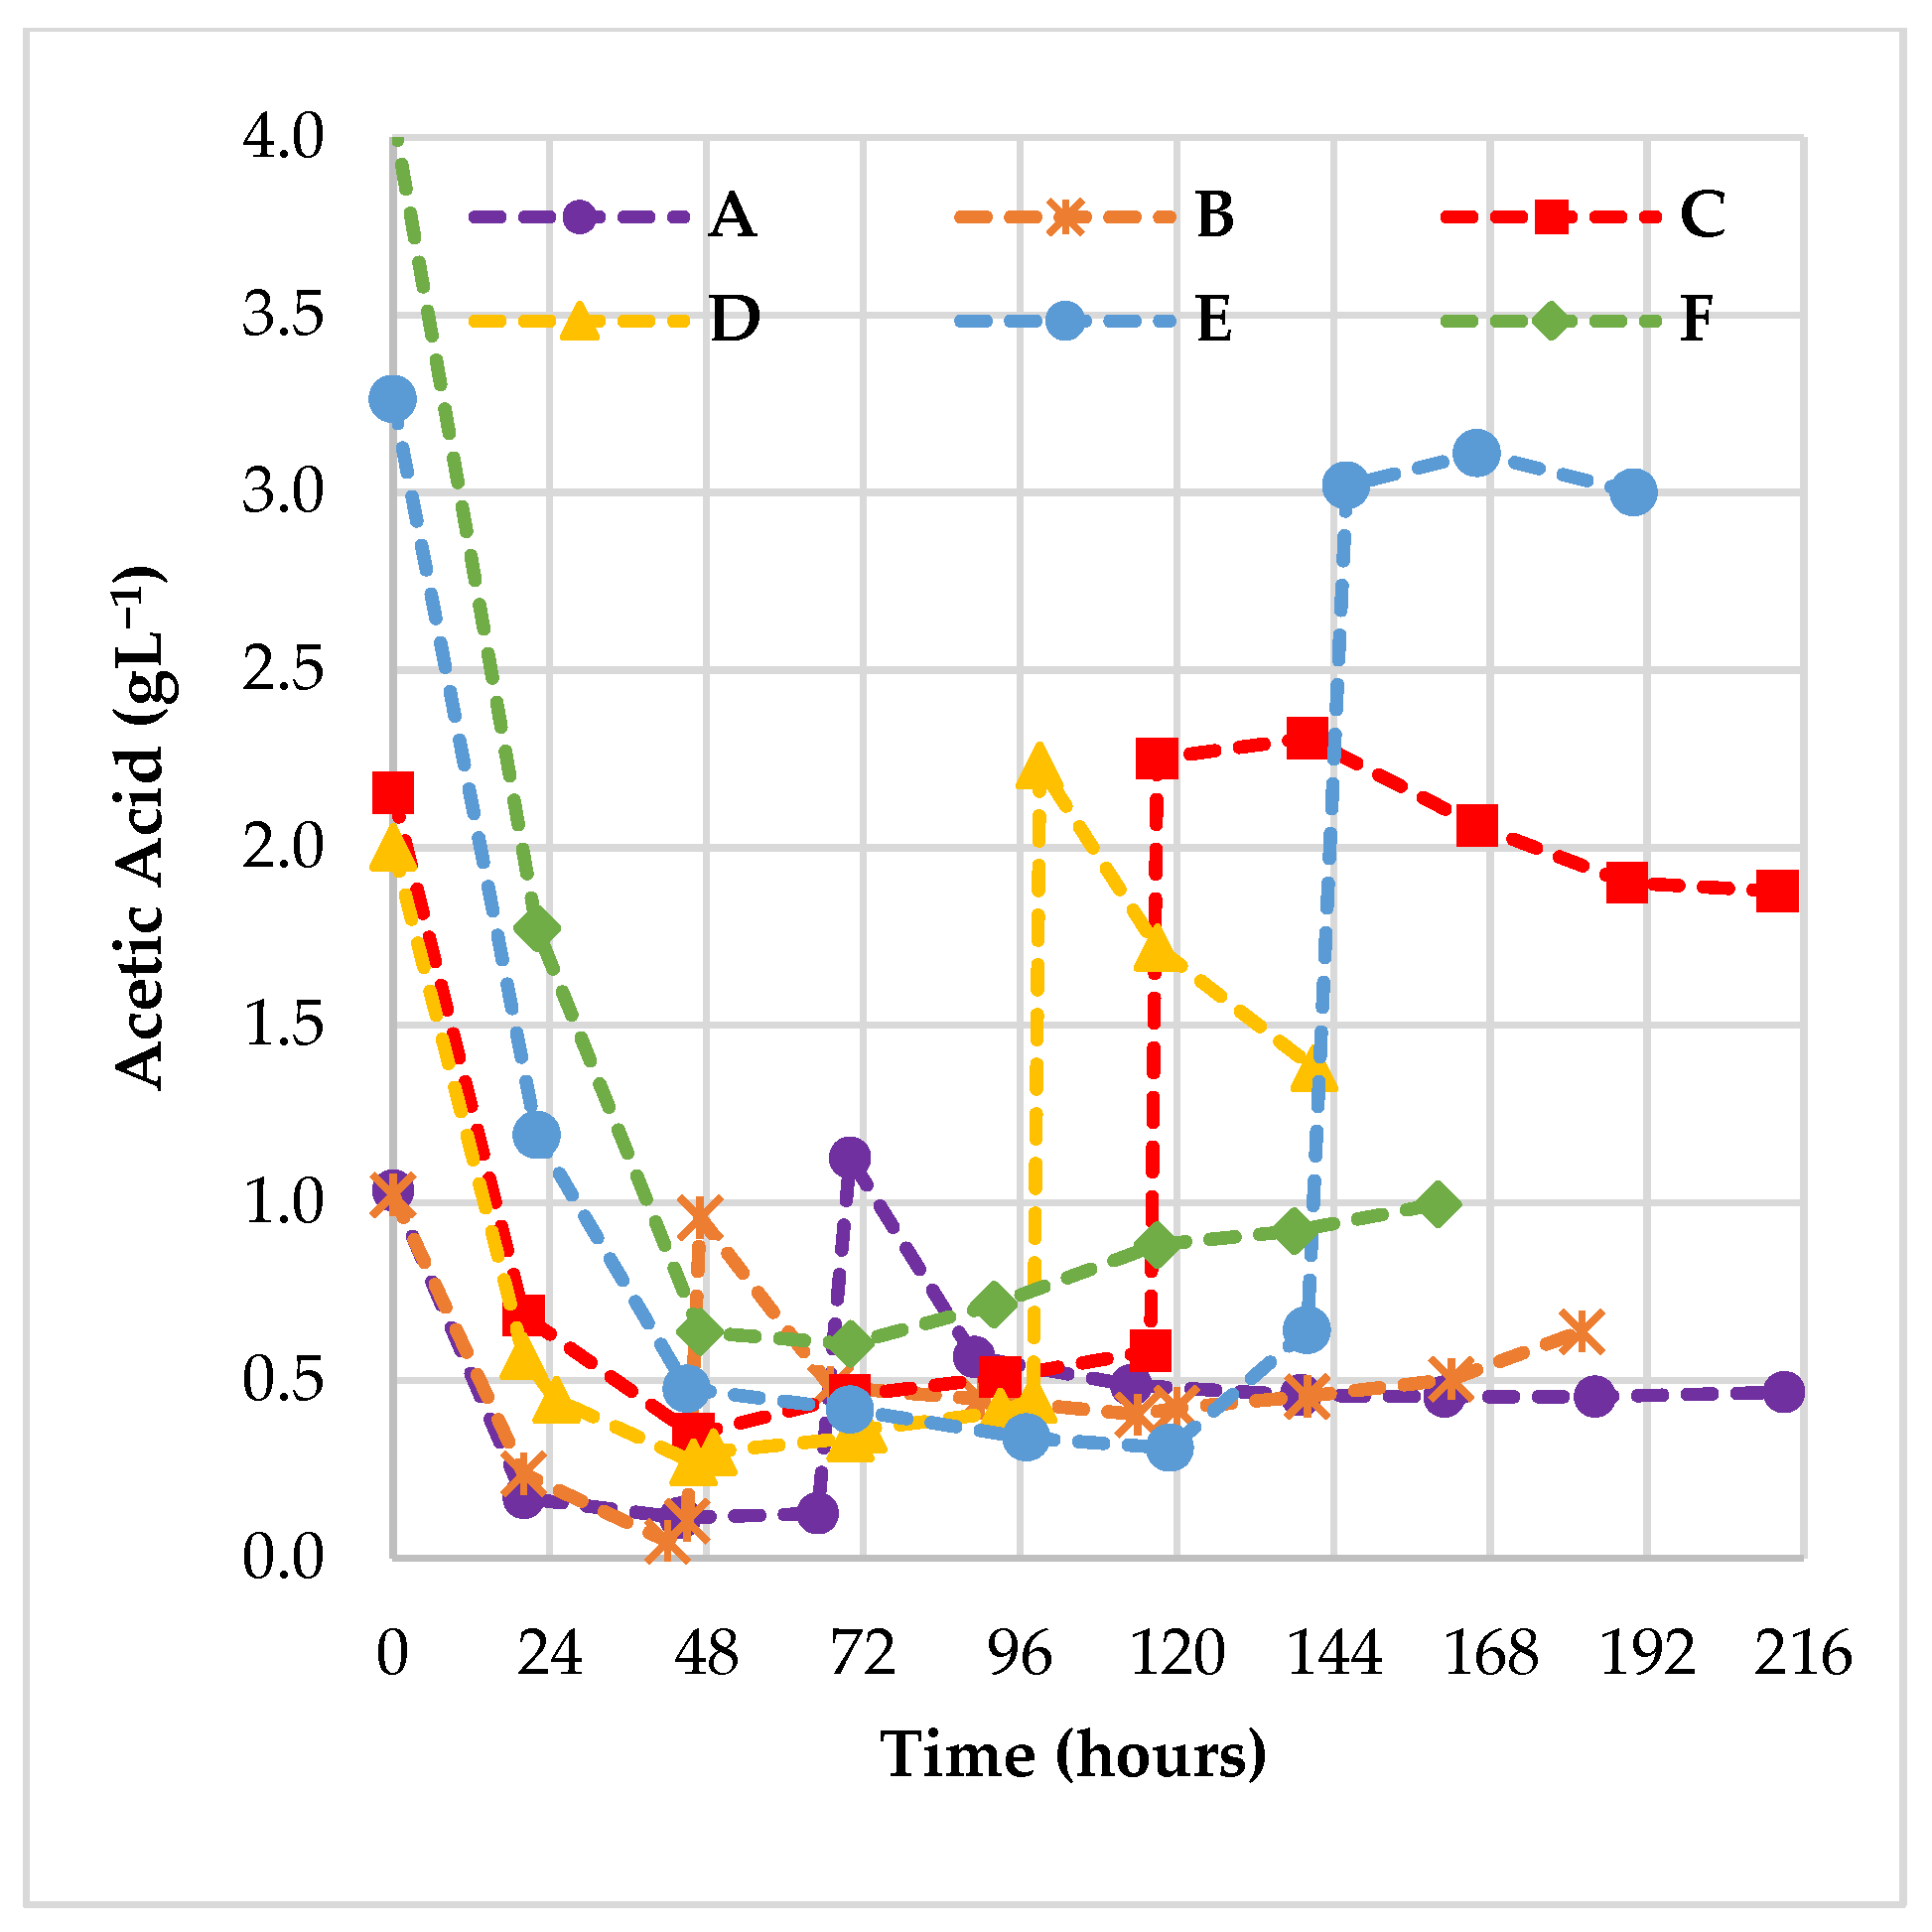
3.1.2. Role of Acetic Acid as the Main Impurities of CG during the Fed-Batch Fermentations

Figure 2 shows the trend of acetic acid (AA) added to the bioreactor with the CG substrate during the whole fermentation.
AA (or acetate) concentration showed an irregular trend during the experiments. Initially, in the batch phase, acetate concentration showed a quick decrease, meaning that it was used as a substrate by the GCL microorganisms. This trend indicated that AA was an additional carbon source for GCL microorganisms in all A–F experiments. Thereafter, it increased, meaning that microorganisms were producing acetate faster than it was consumed. After the feeding, which brought the AA concentration to the initial level, a second fast decrease was observed. This trend clearly showed that the AA course corresponded to a balance between consumption and/or production. Effects of AA addition on fermentation processes can be stimulatory or inhibitory, depending on different conditions as well as the microorganisms involved. According to Trchounian and co-workers [12], E. coli BW25113 was able to grow, producing hydrogen, in the presence of AA at concentrations ranging from 1 to 5 gL−1 when pH was weakly acidic (6.5), while microbial growth and hydrogen production inhibition were observed at the higher acetic acid concentration (5 gL−1) and at a more acidic pH (5.5). Similarly, Boecker and co-workers [33] pointed out that E. coli wild type was able to grow anaerobically on pure glycerol (4 gL−1) only in the presence of AA (1 gL−1), and E. faecalis strain QU11 was unable to utilize glycerol or AA as the sole carbon sources under anaerobic conditions, but it co-fermented pure glycerol (20 gL−1) and acetic acid (5 gL−1) producing EtOH and lactic acid [34]. Sawasdee and co-authors [35] showed that E. aerogenes strain TITR1468 was able to produce ethanol at the highest amount of 12.6 gL−1 ± 0.1 with a yield of 1.08 ± 0.20 molmol−1 glyc using a co-substrate of partially purified waste glycerol and AA at a ratio of 100:1. At a ratio of 1:1, the authors observed the significant inhibition of glycerol consumption and EtOH production, both related to the undissociated form of AA in culture medium. According to Yin et al. [26], the undissociated AA (UAA) concentration was the critical factor in AA inhibition. Indeed, during a fermentative process with glucose inoculated with anaerobic sludge, decreases in H2 production by 50% and 90% were observed when the UAA concentrations were 76.3 mgL−1 and 686.7 mgL−1, respectively. UAA concentrations were calculated during our fed-batch fermentations according to formula (2) at the start of the batch and feed addition phases, and results are shown in Table 3.
At the start of all fermentations, the pH was set at 7.9–8.0, and the TAA concentrations were proportional to the CG feed concentrations (1.0–4.1 gL−1), while the corresponding UAA were included within the range of 0.7–2.2 mgL−1. UAA increased in correspondence with the feed addition phase in all fed-batches since the pH was lower than in the batch phase, while TAA concentrations remained almost the same (Figure 2 and Table 3). After the feed addition, TAA concentrations were almost the same of the batch phase (Figure 2), but the lower values of pH caused the increase of UAA in all fed-batches, with concentrations included within the range of 20.4–159.0 mgL−1 (Table 3). Notably, the lower UAA concentration (90.2 mgL−1) observed in fed-batch D, compared to C (121.0 mgL−1), was related to the effect of N2 sparging on pH (see next paragraph). The highest UAA concentration (159 mgL−1) of fed-batch E suggested the decisive role of UAA in substrate degradation inhibition [26].

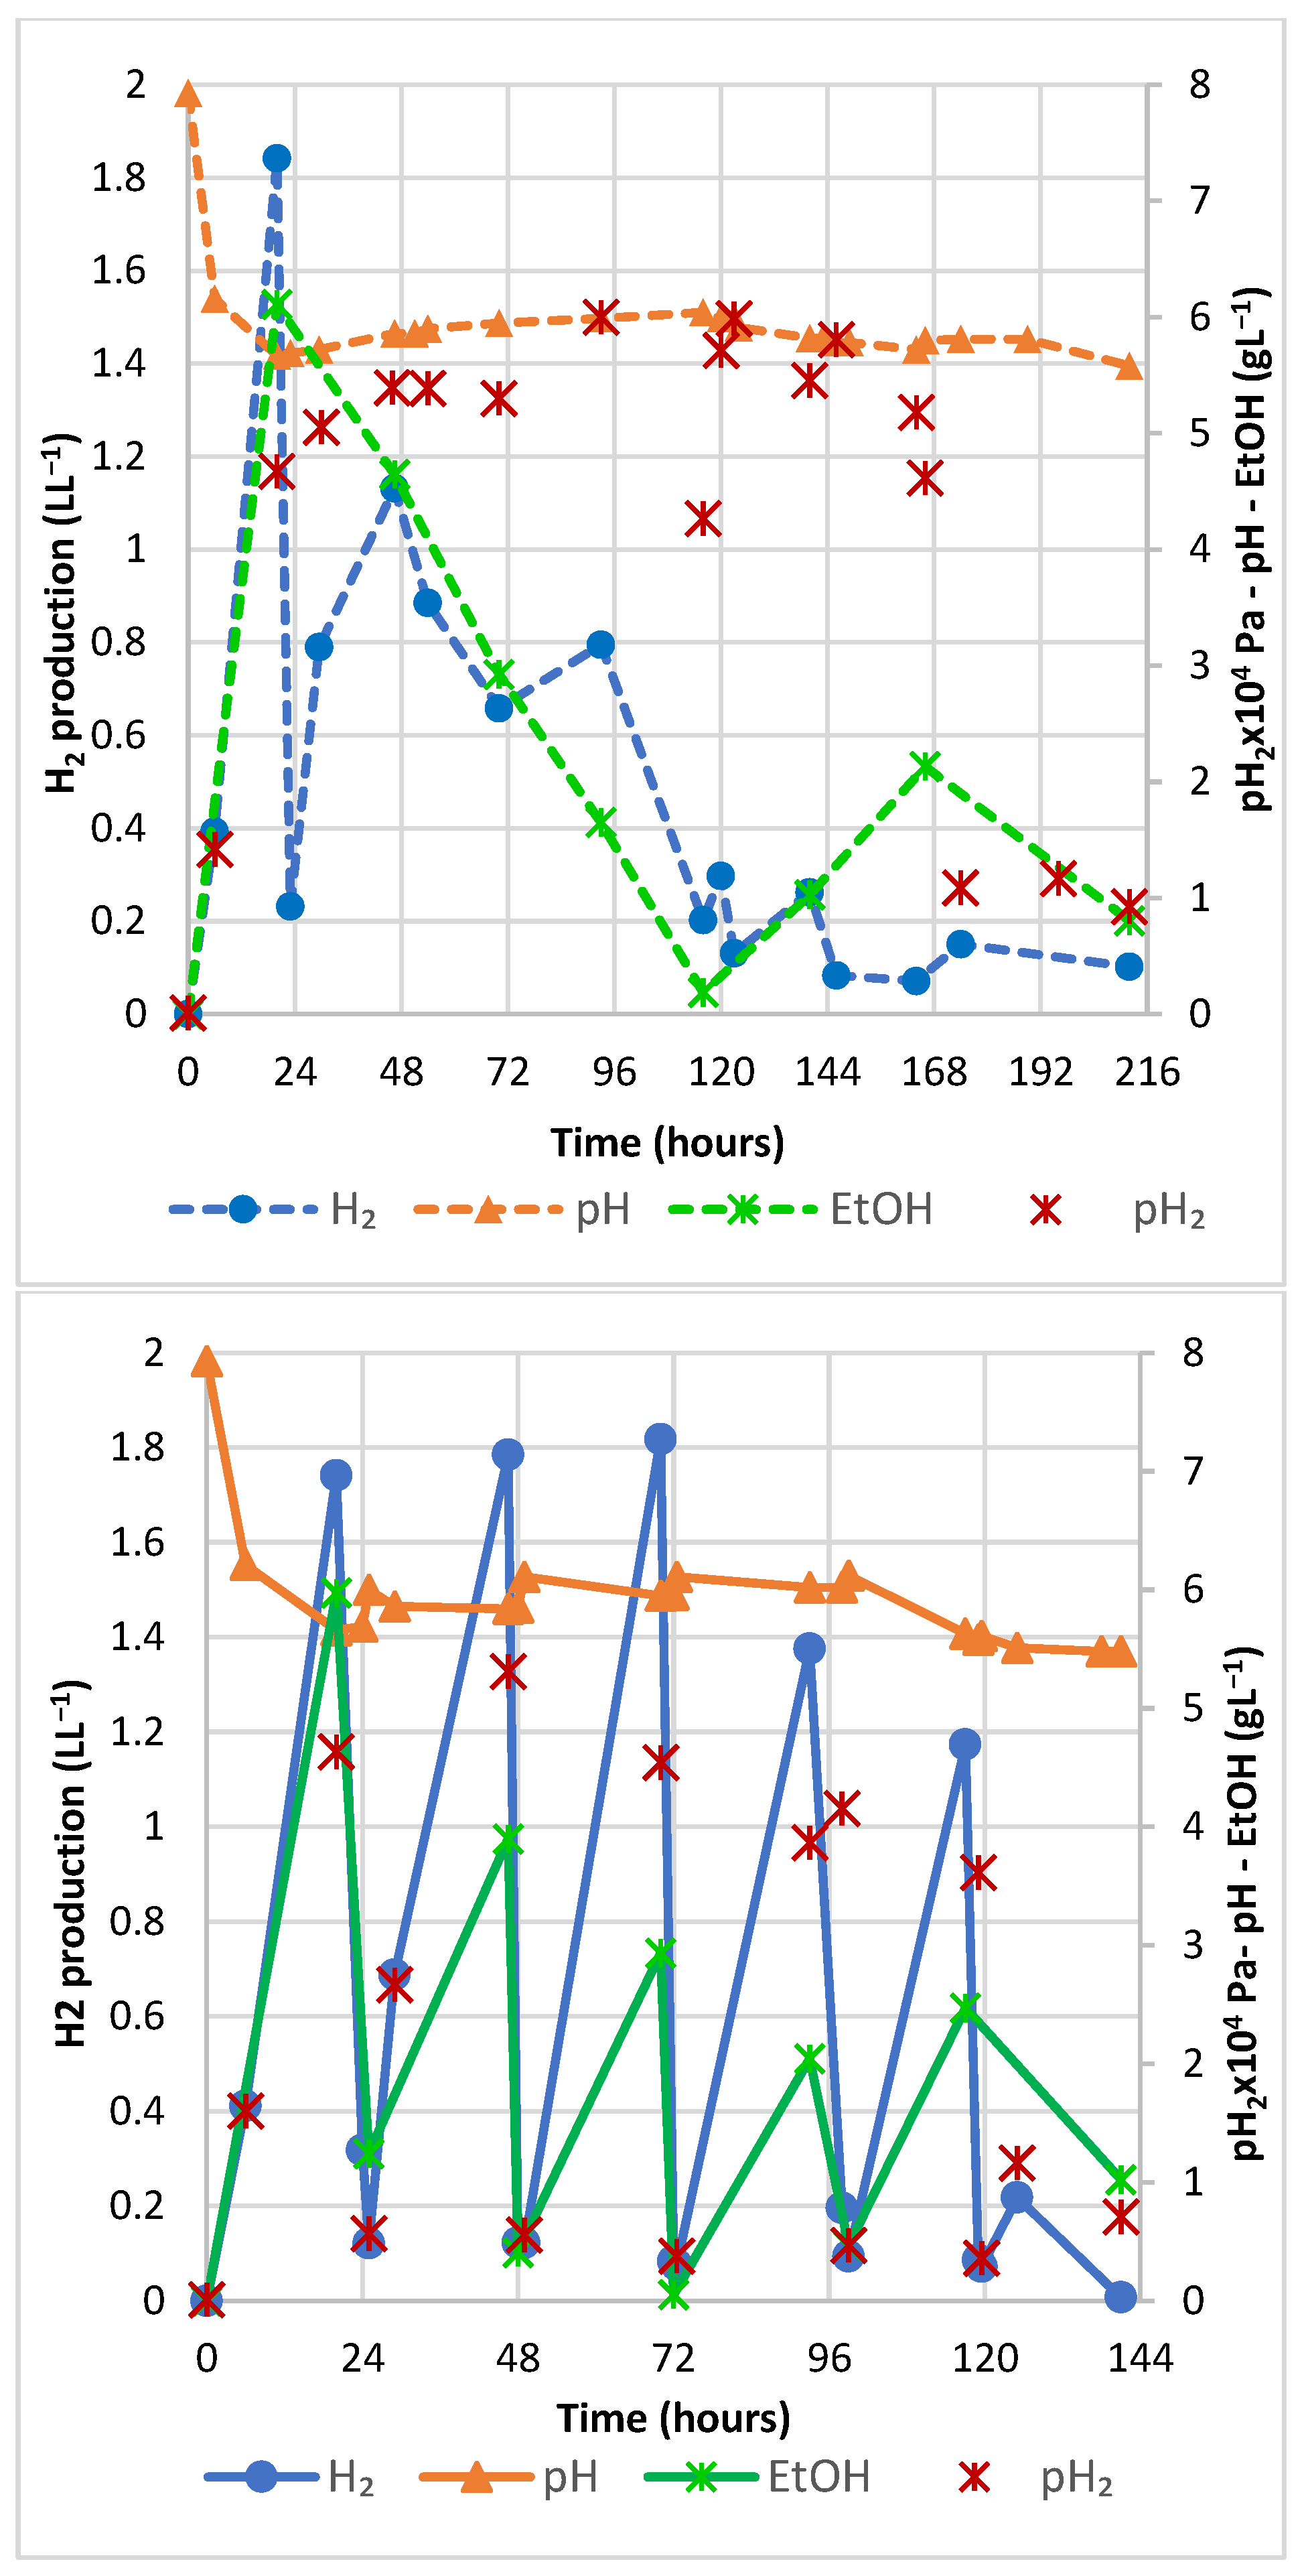
3.1.3. Effects of N2 Sparging on Instantaneous H2 and EtOH Production over Time

Instantaneous production (not-cumulative) profiles of H2 and EtOH, together with the trends of pH and of H2 partial pressure (pH2) in fed-batch C and in the N2 sparging fed-batch D, during the course of the experiments, are shown in Figure 3.
During fed-batch C, the highest volume of H2 production (1.84 LL−1) was recorded within the starting phase (0–20 h), and the H2 production subsequently decreased until the end, including the feed addition phase (117 h). At the same time, EtOH instantaneous production gradually declined from 6.1 gL−1 (20 h) to 0.4 gL−1 (116 h). After the CG addition (117 h), EtOH production increased again until 2.2 gL−1 (166 h) before lowering at the end of fermentation. pH2 was always above 1 × 10⁴ Pa in fed-batch C, reaching values between 4 and 6 × 10⁴ Pa. On the other hand, cyclical patterns of both H2 and EtOH production characterized fed-batch D: at each cycle, included between two sparging, including between two successive sparging cycles, namely at 24, 48, 72, 98 and 118 h, the instantaneous production of H2 and EtOH reached a peak before declining until the next sparging. For H2, the highest production peaks were observed during the starting phase (0–20 h) and until 70 h, showing a mean value of 1.78 LL−1± 0.04. Thereafter, lower efficiencies of production corresponding to 1.37 LL−1 (93 h) and 1.17 LL−1 (117 h) were observed. H2 production fell down (0.220 LL−1) in the last phase of the process (125 h) before stopping. Analogously, the peaks of ethanol production tended to decrease from the higher amount of 6.0 gL−1 (20 h) to the lower of 2.0 gL−1 (93 h) and improved again to 2.5 gL−1 after the CG addition (99 h), as observed for fed-batch C. The pH2 also showed a cyclic trend ranging from the lower limit of < 1 × 10⁴ Pa (at the end of N2-sparging) to the highest values (4 × 10⁴–5 × 10⁵ Pa) in correspondence with the peaks of hydrogen production. Notably, when pH2 is below 1 × 10⁴ Pa, ethanol conversion to acetic acid can occur [10] according to Equation (2) [36]:
a c e t a t e + H + + 2 H 2 e t h a n o l + H 2 O Δ G = 9.6   Kj / reaction
We can hypothesize that during fed-batch D, a decrease in the EtOH concentration occurred every time that pH2 was less than 1 × 10⁴ Pa as a consequence of its conversion to acetic acid. On the other hand, when pH2 reached values upper than 1 × 10⁴ Pa, EtOH production from acetate occurred as a thermodynamically-favored reaction. Therefore, if ethanol production from acetate occurred during all fed-batch fermentations, the insertion of N2 sparging was not advantageous for the simultaneous improvement of ethanol production. The efficiency of ethanol and hydrogen production might be similar only if they were produced from pyruvate, according to the ‘standard’ pathway of glycerol fermentation. Since reaction (3) bypassed the pyruvate cycle, the pathways of ethanol and hydrogen production were not directly related to each other. Moreover, the insertion of N2 sparging also affected the trend of pH acting through the bicarbonate-carbon dioxide buffer system by the removal of CO2 dissolved into the fermentation medium. In the not-sparged fed-batch C, pH was always detected at values lower than 6.0. In fed-batch D, after each sparging, pH tended firstly to increase: a mean pH value of 6.10 ± 0.05 was detected until the feeding addition phase (99 h). As the fermentation moved on, pH subsequently decreased toward more slightly acidic values. After the addition of CG, the pH decrease was more relevant, and even the N2-sparging around 119 h was not able to revert this trend, and a pH value of 5.5 was detected at the end of the fermentation. A less-acidic pH could explain the lower UAA concentrations in fed-batch D (Table 3), meaning that more acetic acid was available for the microorganisms’ metabolism. Indeed, acetic acid consumption of 2.6 g (fed-batch D) was higher than 2.2 g consumed during the not-sparged fed-batch C. Our data confirmed that insertion of N2 sparging was an effective method to improve hydrogen production, although it caused biogas dilution. Several authors reported the positive effects of nitrogen sparging on different fermentative processes. Kyazze et al. [37] observed a 33% of yield increment during a continuous process at increasing amounts of sucrose as well as stability of the process at higher substrate concentrations. They also suggested that the sparging fluidized the microbial cells improving microbial interaction with the substrate. Ngo et al. [38] reported a 122% hydrogen yield increase from biodiesel waste during a hyperthermophilic fermentation by a pure strain of T. neapolitana when pH control was inserted in addition to three cycles of N2 sparging, using pre-treated crude glycerol for removal of contaminants (methanol and/or ethanol).

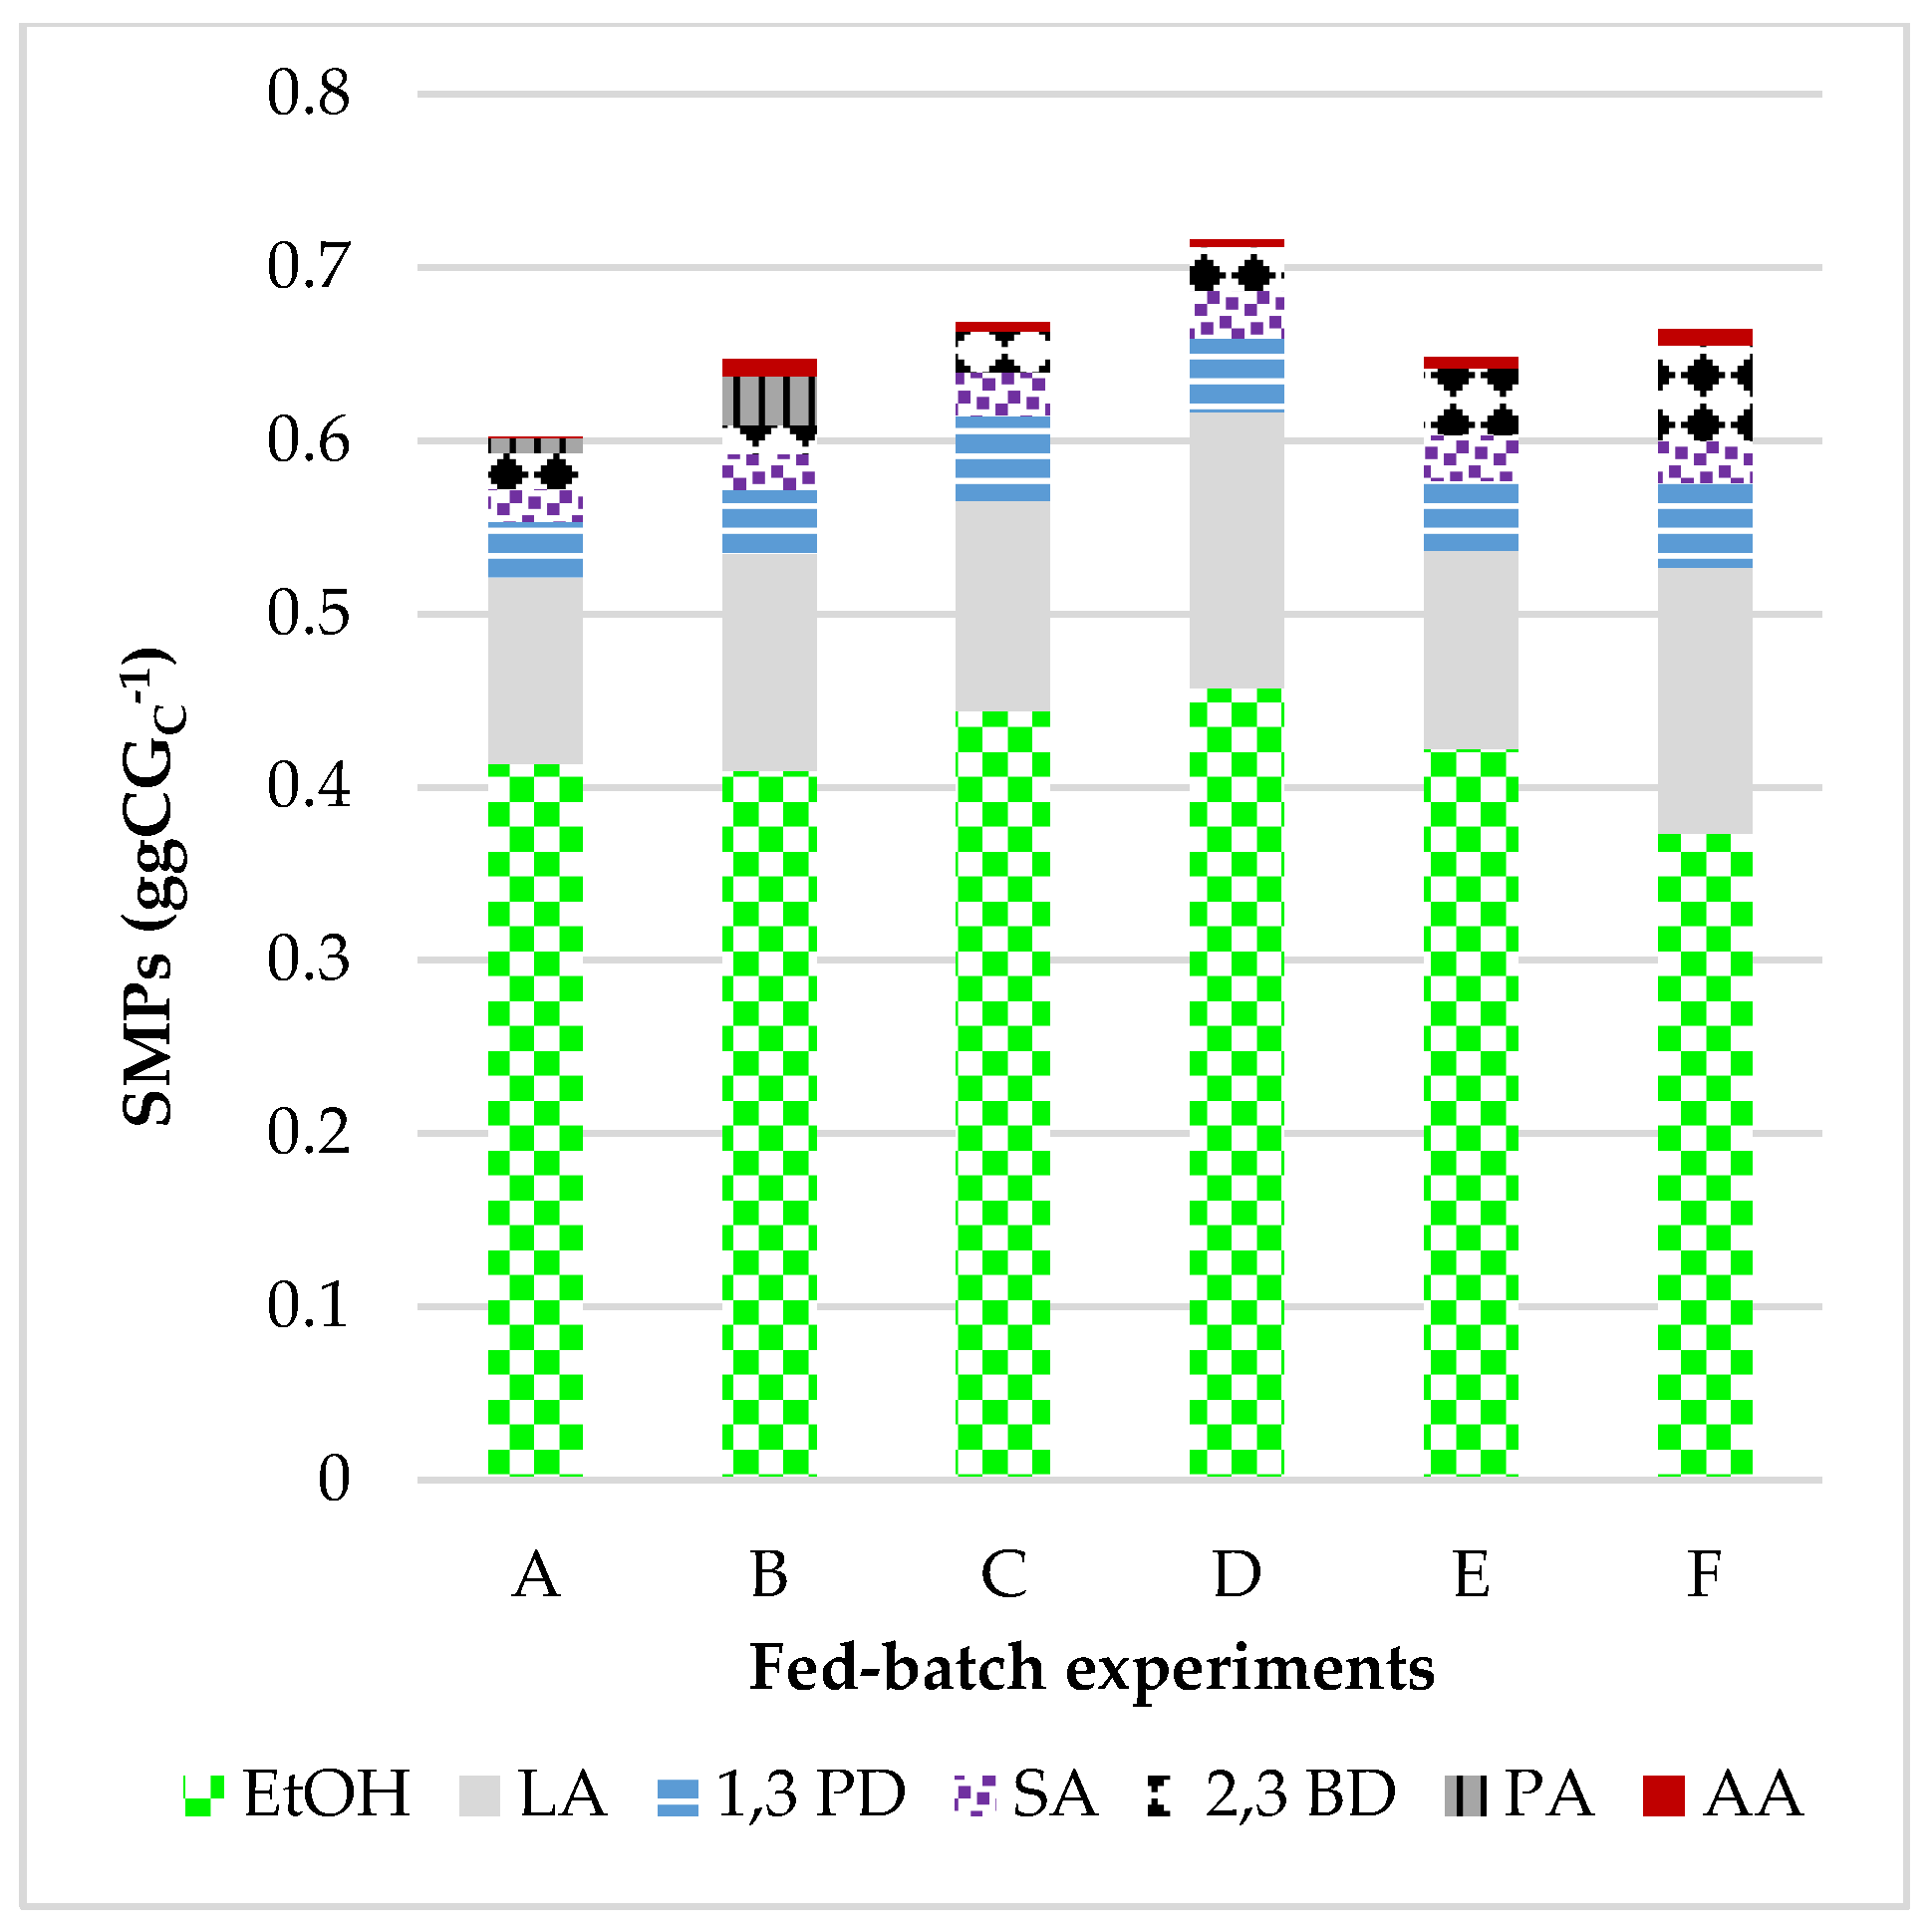
3.1.4. Increasing the CG Concentration: Metabolic Pathways and Products

Yields as gg−1 CGC of Soluble Metabolic Products (SMPs) detected at the end of fed-batch fermentations A–F are summarized in Figure 3. From the trend of acetic acid shown in Figure 2, net amounts of acetic acid produced by GCL microorganisms were calculated and reported in Figure 4.
Yields of EtOH production of 0.411 gg−1 CGC ± 0.003 and 0.42 gg−1 CGC were observed for fed-batch A-B and E, respectively, increasing to 0.45 gg−1CGC ± 0.01 for fed-batch C and D. The lowest yield of 0.37 gg−1CGC was observed for fed-batch F. In addition, 1,3 propanediol (1,3 PD), lactic acid (LA), succinic acid (SA), 2,3 butanediol (2,3 BD), acetic acid (AA) were produced during all fermentations, whereas propionic acid (PA) only in A and B. Comparable yields of SMPs products were observed among all fed-batch. After EtOH, LA was the metabolite produced with higher yields during all fed-batch fermentations: 0.12 gg−1 CGc was observed for fermentations A, B, C and E, and higher yields of 0.16 and 0.15 gg−1 CGc for fermentations D and F. In the previous paragraph, we suggested that ethanol production also occurred through acetic acid metabolism. The driving force of this pathway is to restore the redox balance (NADH/NAD+) of the fermentative process. Acetate acts as a redox sink [33], able to oxidize the excess of NADH formed in CG metabolism by conversion to EtOH. In this way, 1 mol of acetic acid and 2 mol of NADH produce 1 mol of EtOH and 2 mol of NAD+ [34]. The additional mol of NAD+ can be used for LA production, as proposed for E. faecalis strain Q11, which was able to enhance lactic acid production from co-fermentation of pure glycerol (30 gL−1) and acetic acid (10 gL−1), via acetic acid metabolism [34]. This suggests that the same metabolic pathway can be active in our process. Fed-batch D consumed the highest amount of acetic acid (see previous paragraph), producing, at the same time, the highest concentration of LA (7.0 gL−1) as compared to fed-batch C (5.5 gL−1). Interestingly, also Yin et al. [26] found that when UAA concentrations were in the range of 16–55 mgL−1, the activation of L-lactate dehydrogenase, the enzyme responsible for LA production, was observed. 1,3 PD production, a metabolite of glycerol degradation [39], occurs through the reductive pathway as a means of ensuring redox-balanced conditions by recycling the NADH generated during the growth of microorganisms [40]. In this way, the final yield of hydrogen is decreased since it is directly consumed for the simultaneous production of 1,3-PD. Therefore, the removal of hydrogen from fermentation broth by N2-sparging may result in improved hydrogen production by making it unavailable for subsequent 1,3-PD production. Indeed, fed-batch C produced 1,3 PD with a higher yield (0.049 gg−1 CGc) than that of the N2-sparged fed-batch D (0.043 gg−1 CGc). SA production from CG occurs through a redox-balanced reaction which can evolve in the presence of CO2 under slightly acidic pH conditions (6.3). The yields of SA production during our fed-batch fermentations were included within a short interval, ranging from the lowest of 0.020 gg−1 CG ± 0.003 (mean values of fed-batch A and B) to the highest of 0.028 gg−1 CGc for fed-batch D. SA production is not needed for the evolution of CG fermentative process but it is considered to be a competitive co-product to H2 and EtOH [8]. Yields of 2,3-BD production increased gradually from A to F fed-batch with the increase of initial CG feed, and they corresponded to 0.019, 0.023, 0.025, 0.038 and 0.055 gg−1 CGc, respectively. 2,3-BD production from glycerol is peculiar in microorganisms belonging to the Klebsiella genus, and it is favored in acidic conditions [41] and under glycerol excess [42]. This trend agrees with the profile observed in our experimentation. FA was not reported in Figure 4 since it was undetectable at the end of all fermentations. After production in the early batch phase and immediately after the feed addition phase, it was oxidized for hydrogen and carbon dioxide production by the formate hydrogen lyase system (FHL), the enzymatic complex typical of Klebsiella spp. and Escherichia spp. communities [43], functional units of the GCL inoculum.

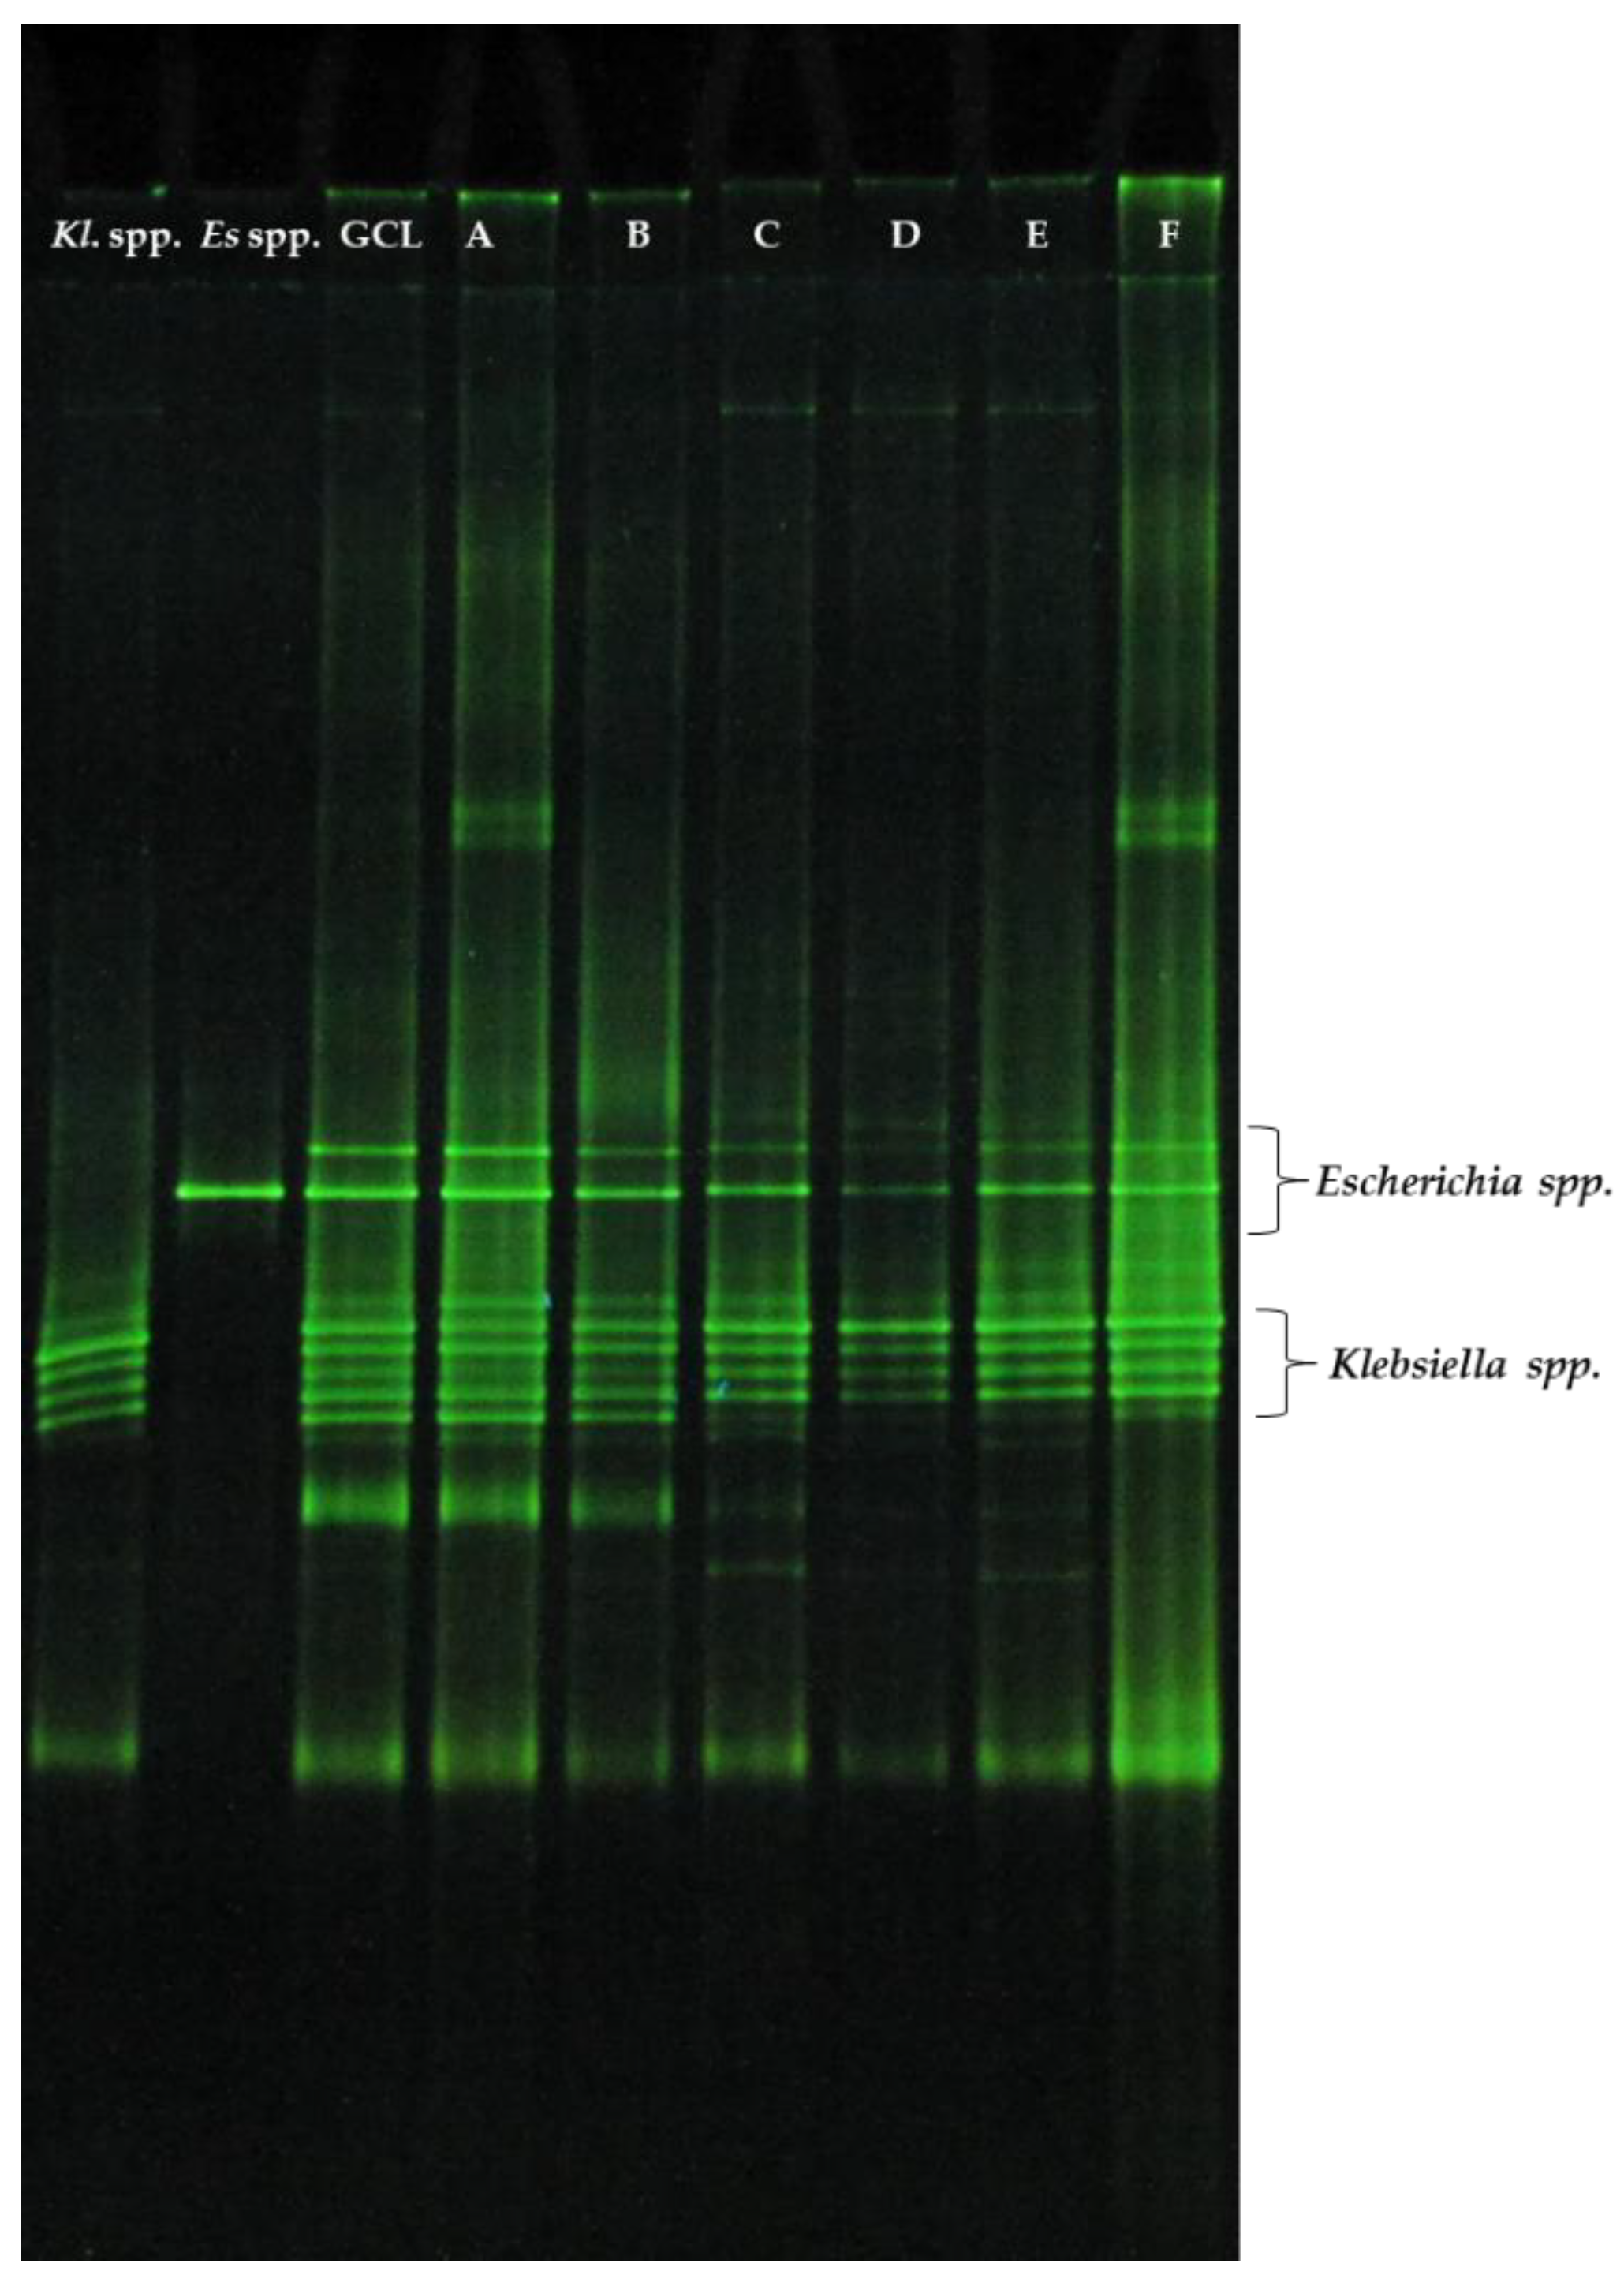
3.2. DGGE Profile of GCL Microbial Community at the End of Fed-Batch Fermentations

The GCL functional consortium was characterized through the 16S rDNA cloning library technique, which revealed a dominance of the genera Klebsiella (58%), Escherichia/Shigella (32%) and Cupriavidus (10%). Extended polymorphisms at the inter- and intra-species levels characterized both the Klebsiella and Escherichia communities [10]. At the end of each fed-batch fermentation, a DGGE analysis of the GCL functional communities was performed in order to verify whether the stability of the fermentation (maintenance of the target functions) corresponded to stability in the community structure. The molecular fingerprint of these samples was compared to the profile of GCL at the end of activation and to that of each functional unit of GCL. Isolation by agar plating allowed us to distinguish two morphotypes, namely Klebsiella spp. (Kl. spp) and Escherichia spp./Shigella (Es. spp./Shig.), but not that of the C. metallidurans group. It is probable that the small representativeness of this microorganism in the GCL consortium and/or the plating conditions did not allow C. metallidurans to grow in the absence of the other GCL communities. By agar plating, only separation at the genera level was achieved, probably due to the strict microbial metabolic relationships among the components which characterize the polymorphic interactions [44]. The fingerprints of the V1-V3 fragments of the 16S rRNA gene are shown in Figure 5.
The polymorphism of the Klebsiella spp. community was identified by five bands, including one faint top band and four distinct bottom bands (lane Kl. spp.), while that of Escherichia spp. was characterized by a unique band (lane Es. spp.). GCL profile at the end of activation corresponded to an “additive” fingerprint of each individual profile. Moreover, an upper band in Es. spp., and one additional band in a lower position in Kl. spp. were detected. These different profiles are related to the growth conditions that in agar plates were performed with tryptone and without CG addition. The DGGE fingerprint of the A–F samples at the end of the fermentations fully corresponded to the profile of GCL, with some exceptions for the presence of four/five bands characterizing the Kl. spp. profile. The detection by DGGE of additional bands suggested that probably, new polymorphisms were developed in the microbial community. During the fed-batch process, microbial growth conditions changed since nitrogen and mineral sources were depleted by the exponential growth of microorganisms; carbon sources (glycerol and acetate) decreased (batch) and increased again (feed phase) while metabolic products accumulated in the medium culture. Therefore, the polymorphic relationships among microorganisms were modified as adaptive strategies to these changes. Indeed, polymorphisms are more stable in a constant environment [44] Moreover, different background signals detected by DGGE can be related to PCR artifacts. At the top, the presence of bands was due to the formation of heteroduplexes [45], and residual products of PCR reactions and/or incomplete amplified PCR products were detected at the bottom side as ‘unresolved’ bands. Therefore, no changes in GCL microbial profile were observed at the end of fed-batch processes (in non-sterile conditions) since the high polymorphism characterizing Klebsiella spp. and Escherichia spp. communities was maintained, as well as their role in hydrogen and ethanol production.

4. Conclusions

In this study, the improvement of fermentation processes with CG using a highly specific microbial consortium was obtained for the simultaneous production of hydrogen and ethanol. The process was developed in non-sterile fed-batch fermentation mode (batch phase followed by feed addition of not diluted substrate) carried out at increasing amounts of substrate. An increase in the initial substrate from 20 to 40 gL−1 led to higher hydrogen (from 6 to 8 LL−1) and ethanol (from 13 to 20 gL−1) production, showing, at the same time, a decrease in glycerol degradation efficiency (from 75 to 56%). Then, the nitrogen sparging strategy was applied. At CG of 40 gL−1, process improvement was achieved, leading to increase production of hydrogen up to 10 LL−1 (yield of 0.87 molmol−1 CGc) but not that of ethanol (20 gL−1), although higher yield (0.92 molmol−1 CGc) was reached. The role of acetic acid (acetate), the main impurity of CG, was discussed as an additional carbon source for ethanol production but also as a redox sink driving the GCL microorganisms to lactic acid production through a pathway competitive with that of hydrogen and ethanol. The positive effects of N2-sparging on hydrogen production were confirmed by decreasing pH2. However, the uncoupling of the simultaneous production of hydrogen and ethanol in sparging conditions needs further research efforts aimed at regulating acetic acid metabolism by combining pH control with N2-sparging. Molecular fingerprinting using DGGE showed that the GCL functional units were well adapted to fed-batch conditions by modifying the polymorphism characterizing both Klebsiella spp. and Escherichia spp. communities.

Author Contributions

Conceptualization S.R., A.S. and S.M.; methodology, S.M. and S.R.; investigation, S.M. and S.R.; data curation, S.M., A.S. and S.R.; writing—original draft preparation, S.R.; writing—review and editing, S.R., A.S. and A.M.; visualization, S.R. and A.S.; supervision, S.R., A.S. and A.M.; All authors have read and agreed to the published version of the manuscript.

Funding

This research has received funding from European Commission under FP7 Grant Agreement no 613667 (acronym: GRAIL). The research was supported by the GRAIL project financed by European Commission under FP7—KBBE Grant Agreement no 613667.

Data Availability Statement

Data are available from the corresponding author upon reasonable request.

Acknowledgments

This work is dedicated to the memory of our dear colleague Floriana Fiocchetti.

Conflicts of Interest

The authors declare no conflict of interest.

References

  1. European Commission. Fit for 55: Delivering the EU’s 2030 Climate Target on the Way to Climate Neutrality; COM(2021) 550 Final; European Commission: Brussels, Belgium, 2021. [Google Scholar]
  2. Hosseini, S.E.; Wahid, M.A. Hydrogen production from renewable and sustainable energy resources: Promising green energy carrier for clean development. Renew. Sustain. Energy Rev. 2016, 57, 850–866. [Google Scholar] [CrossRef]
  3. Lepage, T.; Kammoun, M.; Schmetz, Q.; Richel, A. Biomass-to-hydrogen: A review of main routes production, processes evaluation and techno-economical assessment. Biomass Bioenergy 2021, 144, 105920. [Google Scholar] [CrossRef]
  4. Ma, Y.; Wang, X.R.; Li, T.; Zhang, J.; Gao, J.; Sun, Z.Y. Hydrogen and ethanol: Production, storage, and transportation. Int. J. Hydrog. Energy 2021, 46, 27330–27348. [Google Scholar] [CrossRef]
  5. Soo, C.S.; Yap, W.S.; Hon, W.M.; Phang, L.Y. Mini review: Hydrogen and ethanol co-production from waste materials via microbial fermentation. World J. Microbiol. Biotechnol. 2015, 31, 1475–1488. [Google Scholar] [CrossRef] [PubMed]
  6. Liu, Y.; Zhong, B.; Lawal, A. Recovery and utilization of crude glycerol, a biodiesel byproduct. RSC Adv. 2022, 12, 27997–28008. [Google Scholar] [CrossRef] [PubMed]
  7. Yazdani, S.S.; Gonzalez, R. Anaerobic fermentation of glycerol: A path to economic viability for the biofuels industry. Curr. Opin. Biotechnol. 2007, 18, 213–219. [Google Scholar] [CrossRef] [PubMed]
  8. Murarka, A.; Dharmadi, Y.; Yazdani, S.S.; Gonzalez, R. Fermentative utilization of glycerol by Escherichia coli and its implications for the production of fuels and chemicals. Appl. Environ. Microbiol. 2008, 74, 1124–1135. [Google Scholar] [CrossRef] [Green Version]
  9. Clomburg, J.M.; Gonzalez, R. Anaerobic fermentation of glycerol: A platform for renewable fuels and chemicals. Trends Biotechnol. 2013, 31, 20–28. [Google Scholar] [CrossRef] [Green Version]
  10. Varrone, C.; Rosa, S.; Fiocchetti, F.; Giussani, B.; Izzo, G.; Massini, G.; Marone, A.; Signorini, A.; Wang, A. Enrichment of activated sludge for enhanced hydrogen production from crude glycerol. Int. J. Hydrog. Energy 2013, 38, 1319–1331. [Google Scholar] [CrossRef]
  11. Varrone, C.; Giussani, B.; Izzo, G.; Massini, G.; Marone, A.; Signorini, A.; Wang, A. Statistical optimization of biohydrogen and ethanol production from crude glycerol by microbial mixed culture. Int. J. Hydrog. Energy 2012, 37, 16479–16488. [Google Scholar] [CrossRef]
  12. Trchounian, K.; Trchounian, A. Hydrogen production from glycerol by Escherichia coli and other bacteria: An overview and perspectives. Appl. Energy 2015, 156, 174–184. [Google Scholar] [CrossRef]
  13. Kumar, V.; Park, S. Potential and limitations of Klebsiella pneumoniae as a microbial cell factory utilizing glycerol as the carbon source. Biotechnol. Adv. 2018, 36, 150–167. [Google Scholar] [CrossRef] [PubMed]
  14. Parate, R.; Mane, R.; Dharne, M.; Rode, C. Mixed bacterial culture mediated direct conversion of bio-glycerol to diols. Bioresour. Technol. 2018, 250, 86–93. [Google Scholar] [CrossRef] [PubMed]
  15. Mangayil, R.; Karp, M.; Santala, V. Bioconversion of crude glycerol from biodiesel production to hydrogen. Int. J. Hydrog. Energy 2012, 37, 12198–12204. [Google Scholar] [CrossRef]
  16. de Oliveira Faber, M.; Ferreira-Leitão, V.S. Optimization of biohydrogen yield produced by bacterial consortia using residual glycerin from biodiesel production. Bioresour. Technol. 2016, 219, 365–370. [Google Scholar] [CrossRef] [PubMed]
  17. Rodrigues, C.V.; Nespeca, M.G.; Sakamoto, I.K.; de Oliveira, J.E.; Amâncio Varesche, M.B.; Maintinguer, S.I. Bioconversion of crude glycerol from waste cooking oils into hydrogen by sub-tropical mixed and pure cultures. Int. J. Hydrog. Energy 2019, 44, 144–154. [Google Scholar] [CrossRef] [Green Version]
  18. Wu, K.J.; Lin, Y.H.; Lo, Y.C.; Chen, C.Y.; Chen, W.M.; Chang, J.S. Converting glycerol into hydrogen, ethanol, and diols with a Klebsiella sp. HE1 strain via anaerobic fermentation. J. Taiwan Inst. Chem. Eng. 2011, 42, 20–25. [Google Scholar] [CrossRef]
  19. Cofré, O.; Ramírez, M.; Gómez, J.M.; Cantero, D. Pilot scale fed-batch fermentation in a closed loop mixed reactor for the biotransformation of crude glycerol into ethanol and hydrogen by Escherichia coli MG1655. Biomass Bioenergy 2016, 91, 37–47. [Google Scholar] [CrossRef]
  20. Shams Yazdani, S.; Gonzalez, R. Engineering Escherichia coli for the efficient conversion of glycerol to ethanol and co-products. Metab. Eng. 2008, 10, 340–351. [Google Scholar] [CrossRef]
  21. Soo, C.S.; Yap, W.S.; Hon, W.M.; Ramli, N.; Md Shah, U.K.; Phang, L.Y. Improvement of hydrogen yield of ethanol-producing Escherichia coli recombinants in acidic conditions. Electron. J. Biotechnol. 2017, 26, 27–32. [Google Scholar] [CrossRef]
  22. Paesi, S.; Schiavenin, A.; Almeida, L.G.; Andreis, D.; Magrini, F.E.; Marconatto, L.; dos Anjos Borges, L.G.; Giongo, A. Comparison of two different kinds of seed sludge and characterization of microorganisms producing hydrogen and soluble metabolites from raw glycerol. Braz. J. Chem. Eng. 2022, 39, 387–402. [Google Scholar] [CrossRef]
  23. Sittijunda, S.; Reungsang, A. Valorization of crude glycerol into hydrogen, 1,3-propanediol, and ethanol in an up-flow anaerobic sludge blanket (UASB) reactor under thermophilic conditions. Renew. Energy 2020, 161, 361–372. [Google Scholar] [CrossRef]
  24. Maru, B.T.; López, F.; Kengen, S.W.M.; Constantí, M.; Medina, F. Dark fermentative hydrogen and ethanol production from biodiesel waste glycerol using a co-culture of Escherichia coli and Enterobacter sp. Fuel 2016, 186, 375–384. [Google Scholar] [CrossRef]
  25. Marone, A.; Izzo, G.; Mentuccia, L.; Massini, G.; Paganin, P.; Rosa, S.; Varrone, C.; Signorini, A. Vegetable waste as substrate and source of suitable microflora for bio-hydrogen production. Renew. Energy 2014, 68, 6–13. [Google Scholar] [CrossRef]
  26. Yin, Y.; Song, W.; Wang, J. Inhibitory effect of acetic acid on dark-fermentative hydrogen production. Bioresour. Technol. 2022, 364, 128074. [Google Scholar] [CrossRef] [PubMed]
  27. Nath, K.; Das, D. Improvement of fermentative hydrogen production: Various approaches. Appl. Microbiol. Biotechnol. 2004, 65, 520–529. [Google Scholar] [CrossRef] [PubMed]
  28. Nunes Ferraz Júnior, A.D.; Pages, C.; Latrille, E.; Bernet, N.; Zaiat, M.; Trably, E. Biogas sequestration from the headspace of a fermentative system enhances hydrogen production rate and yield. Int. J. Hydrog. Energy 2020, 45, 11011–11023. [Google Scholar] [CrossRef]
  29. Ito, T.; Nakashimada, Y.; Senba, K.; Matsui, T.; Nishio, N. Hydrogen and ethanol production from glycerol-containing wastes discharged after biodiesel manufacturing process. J. Biosci. Bioeng. 2005, 100, 260–265. [Google Scholar] [CrossRef] [PubMed]
  30. Reungsang, A.; Sittijunda, S.; Angelidaki, I. Simultaneous production of hydrogen and ethanol from waste glycerol by Enterobacter aerogenes KKU-S1. Int. J. Hydrog. Energy 2013, 38, 1813–1825. [Google Scholar] [CrossRef]
  31. Magrini, F.E.; Castilhos, A.; Lora, L.B.; Paesi, S. Strategies of co-cultures and bioaugmentation by Bacillus amyloliquefaciens, Clostridium bifermentans, Enterobacter muelleri, and E. tabaci for increasing the production of hydrogen from raw glycerol. Biomass Bioenergy 2023, 168, 106672. [Google Scholar] [CrossRef]
  32. Rodrigues, C.V.; Rios Alcaraz, F.A.; Nespeca, M.G.; Rodrigues, A.V.; Motteran, F.; Tallarico Adorno, M.A.; Varesche, M.B.A.; Maintinguer, S.I. Biohydrogen production in an integrated biosystem using crude glycerol from waste cooking oils. Renew. Energy 2020, 162, 701–711. [Google Scholar] [CrossRef]
  33. Boecker, S.; Espinel-Ríos, S.; Bettenbrock, K.; Klamt, S. Enabling anaerobic growth of Escherichia coli on glycerol in defined minimal medium using acetate as redox sink. Metab. Eng. 2022, 73, 50–57. [Google Scholar] [CrossRef] [PubMed]
  34. Murakami, N.; Oba, M.; Iwamoto, M.; Tashiro, Y.; Noguchi, T.; Bonkohara, K.; Abdel-Rahman, M.A.; Zendo, T.; Shimoda, M.; Sakai, K.; et al. L-Lactic acid production from glycerol coupled with acetic acid metabolism by Enterococcus faecalis without carbon loss. J. Biosci. Bioeng. 2016, 121, 89–95. [Google Scholar] [CrossRef] [PubMed]
  35. Sawasdee, V.; Vikromvarasiri, N.; Pisutpaisal, N. Optimization of ethanol production from co-substrate of waste glycerol and acetic acid by Enterobacter aerogenes. Biomass Convers. Biorefinery 2021, 1–8. [Google Scholar] [CrossRef]
  36. Thauer, R.K.; Jungermann, K.; Decker, K. Energy conservation in chemotrophic anaerobic bacteria. Bacteriol. Rev. 1977, 41, 100–180. [Google Scholar] [CrossRef]
  37. Kyazze, G.; Martinez-Perez, N.; Dinsdale, R.; Premier, G.C.; Hawkes, F.R.; Guwy, A.J.; Hawkes, D.L. Influence of substrate concentration on the stability and yield of continuous biohydrogen production. Biotechnol. Bioeng. 2006, 93, 971–979. [Google Scholar] [CrossRef] [PubMed]
  38. Ngo, T.A.; Kim, M.S.; Sim, S.J. High-yield biohydrogen production from biodiesel manufacturing waste by Thermotoga neapolitana. Int. J. Hydrog. Energy 2011, 36, 5836–5842. [Google Scholar] [CrossRef]
  39. Marone, A.; Varrone, C.; Fiocchetti, F.; Giussani, B.; Izzo, G.; Mentuccia, L.; Rosa, S.; Signorini, A. Optimization of substrate composition for biohydrogen production from buffalo slurry co-fermented with cheese whey and crude glycerol, using microbial mixed culture. Int. J. Hydrog. Energy 2015, 40, 209–218. [Google Scholar] [CrossRef]
  40. Zeng, A.P.; Biebl, H.; Schlieker, H.; Deckwer, W.D. Pathway analysis of glycerol fermentation by Klebsiella pneumoniae: Regulation of reducing equivalent balance and product formation. Enzym. Microb. Technol. 1993, 15, 770–779. [Google Scholar] [CrossRef]
  41. Kongjan, P.; Jariyaboon, R.; Reungsang, A.; Sittijunda, S. Co-fermentation of 1,3-propanediol and 2,3-butanediol from crude glycerol derived from the biodiesel production process by newly isolated Enterobacter sp.: Optimization factors affecting. Bioresour. Technol. Rep. 2021, 13, 100616. [Google Scholar] [CrossRef]
  42. Biebl, H.; Zeng, A.P.; Menzel, K.; Deckwer, W.D. Fermentation of glycerol to 1,3-propanediol and 2,3-butanediol by Klebsiella pneumoniae. Appl. Microbiol. Biotechnol. 1998, 50, 24–29. [Google Scholar] [CrossRef] [PubMed]
  43. Sinha, P.; Roy, S.; Das, D. Role of formate hydrogen lyase complex in hydrogen production in facultative anaerobes. Int. J. Hydrog. Energy 2015, 40, 8806–8815. [Google Scholar] [CrossRef]
  44. Rosenzweig, R.F.; Sharp, R.R.; Treves, D.S.; Adams, J. Microbial evolution in a simple unstructured environment: Genetic differentiation in Escherichia coli. Genetics 1994, 137, 903–917. [Google Scholar] [CrossRef] [PubMed]
  45. Neilson, J.W.; Jordan, F.L.; Maier, R.M. Analysis of artifacts suggests DGGE should not be used for quantitative diversity analysis. J. Microbiol. Methods 2013, 92, 256–263. [Google Scholar] [CrossRef] [Green Version]
Figure 1. Time course profiling of CG consumption (gL1), cumulative H2 (LL1) and EtOH (gL1) production, GCL cells density (n° cells mL1 × 108) characterizing not- sparged fed-batch C (dotted line on the left side) and N2 sparged fed-batch D (continuous line on the right side). Relative standard deviation < 5% was obtained for HPLC and GC data. A relative standard deviation ≤ 10% was obtained for cell density counts.
Energies 16 04490 g001
Figure 2. Time course profiling of Acetic Acid (gL−1) during A–F fed-batch fermentations. A relative standard deviation < 5% was obtained for all data.
Energies 16 04490 g002
Figure 3. Instantaneous production of H2 and EtOH and time course profiles of pH and hydrogen partial pressure (pH2) during not-sparged fed-batch C (dotted lines, on the top left) and N2 sparged fed-batch D (continuous lines, on the bottom).
Energies 16 04490 g003
Figure 4. Yields, as gg−1 CGC (C: Consumed), of Soluble Metabolic Products (SMPs) at the end of fed-batch fermentations. Ethanol (EtOH), Lactic Acid (LA), 1,3 Propanediol (1,3 PD), Succinic Acid (SA), 2,3 Butanediol (2,3 BD), Propionic Acid (PA) and Acetic Acid (AA). AA concentrations were calculated according to the trends shown in Figure 2. A relative standard deviation < 5% was obtained for all data.
Energies 16 04490 g004
Figure 5. DGGE profiles of the V1–V3 fragments of samples at the end of fed-batch fermentations (A–F), compared to the isolated functional units of GCL (Kl. spp. and Es. spp.) and to the GCL culture at the end of activation.
Energies 16 04490 g005
Table 1. Main parameters and performances of fed-batch experiments.
Process Parameters and Strategies for OptimizationFed-Batch Experiments
ABCDEF
Fed-batch cycles111110
Feed (gCGL−1)202040406080
N2 sparging---+++
CGc (g)312945445043
CG degradation (%)777356544154
Time (h)213182212141190160
µ (h−1)0.0550.0710.0740.1250.0900.060
EtOH (gL−1):141220202116
-yield (molEtOHmol−1CGC)0.840.820.870.920.830.78
Total biogas (H2 + CO2, LL−1)131318172017
H2 (LL−1):66810118
-yield (molH2mol−1CGC)0.630.740.670.870.780.75
-Pmax (L)5.2805.7847.98311.29310.9138.770
-Rmax (Lh−1)0.0540.0960.0960.1120.1000.113
-λ (h)2.340.000.003.005.679.84
-R20.9920.9880.9940.9980.9981.000
Fed-batch cycles: number of fed-batch cycles following the starting batch phase; Feed (gCGL−1): starting glycerol concentration used for batch and restored at the fed-batch cycle; CGc (g): total glycerol consumed; CG degradation (%): efficiency of glycerol consumption as compared to the total amount added; Time (h): hours of fermentations; µ (h−1): specific microbial growth rate; Parameters of modified Gompertz equation; Pmax (L): hydrogen production potential; Rmax (L h−1): maximum hydrogen production rate; λ (h): lag time.
Table 2. Fermentation processes for EtOH and H2 production from glycerol.
InoculumFermentationGlycerolEtOHH2Ref.
Mode
(st/ns)
N2
Source
T
°C
pH
Start/Co
Time
h
C/P
gL−1
Degradation
(%)
molmol−1/
gL−1
molmol−1/
LL−1
1E. aerogenes
HU-101
Batch
(st)
Ye/
tryp
376.8
(Co)
4C 1.71000.96/nc1.12/nc[29]
43.30.83/nc0.90/nc
12100.67/nc0.71/nc
<4825<1000.56/nc0.71/nc
2Klebsiella
HE1
Batch
(-)
no356.035P 1099.90.80/4.00.04/0.71[18]
500.49/12.20.35/6.9
3E. aerogenes
KKU-S1
Batch
(ns)
Ye378.13nrC 31nr0.85/5.50.12/nc[30]
4E. coli
MG1655
Exponential Fed-b/Continuous Ar sparging (st)Pep376.30–6.35
(Co)
88C 37.777 ± 7.60.66/6.30.56/2.2 *[19]
5E. coli
SS1 wt
BatchYe/Pep377.5
5.8
72P10nr
56
0.57/2.8
0.70/4.8
0.57/1.7
0.46/1.0
[21]
6E. coli
SS1 hydA
7.5
5.8
nr
49
0.76/3.3
0.68/2.4
0.28/0.8
0.58/1.0
7E. coli CECT432+ Enterobacter SPH1Batch
(st)
Ye/
Me
376.772C 26.7 *63 *1.21/10.0 *1.53/7.0 *[24]
8BA + CB + ETBatchYe/
Pep
37nr72C 30590.14/1.3 *0.95/3.1 *[31]
ET + CB50 *0.44 */3.30.5 */2.1
9Thermophilic mixed
culture
Continuous
(UASB) (ns)
Urea555.5
(Co)
-C 62.5330.22/2.25 *2.05/12.3 *[23]
10Mixed culture
(vegetable oil industry)
Batch
(ns)
Ye/
Tryp
376.072C 3060.90.29 */1.61.12/2.7 *[22]
11Mixed culture
(wine industry)
63.50.27 */2.50.96/1.9 *
12Thermophilic mixed
Clostridiales
BatchYe/Me/
Pep
375.585C 2.5845.71.57 */0.86 *1.75/0.57[32]
13Enriched consortium
(anaerobic sludge)
Fed-b/
Intermittent N2 sparging (ns)
no377.9141C 40
(batch + feed)
540.92/20.00.87/10.0This study
Inoculum Lanes 15: pure strains; lane 6: genetically modified; lanes 78: co-culture. BA: Bacillus amyloliquefaciens, CB: Clostridium bifermentans; EB: Enterobacter tabaci; lanes 914: Mixed cultures; Fermentation sterile (st); non-sterile (ns); Fed-batch mode (Fed-b)Addition of N2 source: Yeast extract (Ye)/Peptone (Pe)/Tryptone (Tryp) Meat extract (Me); pH (start/Co) Starting pH and Control (Co) during the process; Glycerol: Crude glycerol (C); Pure glycerol (P); EtOH, H2: mol products/ mol of glycerol consumed; *: calculated data; nr: not reported data; nc: not calculable data.
Table 3. Total Acetic Acid (TAA, gL−1) and calculated Undissociated Acetic Acid (UAA, mgL−1) concentrations at the start of the batch and feed addition phases. The pH values at the start and end of each phase are reported.
Fed-Batch ExperimentsCyclespH (Start/End)TAA
gL−1
UAA
mgL−1
Abatch7.9/6.41.00.7
B 7.9/5.91.00.7
C 7.9/6.02.11.4
D 7.9/6.02.01.3
E 8.0/6.03.31.8
F 8.0/6.04.12.2
Afeed6.5/6.11.120.4
B 5.9/5.81.061.3
C 5.9/5.62.2121.0
D 6.1/5.52.290.2
E 6.0/5.83.0159.0
F ---
Disclaimer/Publisher’s Note: The statements, opinions and data contained in all publications are solely those of the individual author(s) and contributor(s) and not of MDPI and/or the editor(s). MDPI and/or the editor(s) disclaim responsibility for any injury to people or property resulting from any ideas, methods, instructions or products referred to in the content.

