Article

In Situ Biogas Upgrading in a Randomly Packed Gas-Stirred Tank Reactor (GSTR)

Biotechnological Processes for Energy & Industry Laboratory (PBE), Department of Energy Technologies and Renewables, ENEA, Casaccia R.C., 00123 Rome, Italy
*
Author to whom correspondence should be addressed.
Current address: Department of Earth and Environmental Sciences, University of Milano-Bicocca, 20126 Milan, Italy.
Energies 2023, 16(7), 3296; https://doi.org/10.3390/en16073296
Submission received: 3 February 2023 / Revised: 28 February 2023 / Accepted: 3 April 2023 / Published: 6 April 2023
(This article belongs to the Special Issue Biological Processes in the Green Hydrogen Value Chain)

Abstract

:
This study evaluated different strategies to increase gas–liquid mass transfer in a randomly packed gas stirred tank reactor (GSTR) continuously fed with second cheese whey (SCW), at thermophilic condition (55 °C), for the purpose of carrying out in situ biogas upgrading. Two different H2 addition rates (1.18 and 1.47 LH2 LR−1 d−1) and three different biogas recirculation rates (118, 176 and 235 L LR−1 d−1) were applied. The higher recirculation rate showed the best upgrading performance; H2 utilization efficiency averaged 88%, and the CH4 concentration in biogas increased from 49.3% during conventional anaerobic digestion to 75%, with a methane evolution rate of 0.37 LCH4 LR−1 d−1. The microbial community samples were collected at the end of each experimental phase, as well as one of the thermophilic sludge used as inoculum; metanogenomic analysis was performed using Illumina-based 16S sequencing. The whole microbial community composition was kept quite stable throughout the conventional anaerobic digestion (AD) and during the H2 addition experimental phases (UP1, UP2, UP3, UP4). On the contrary, the methanogens community was deeply modified by the addition of H2 to the GSTR. Methanogens of the Methanoculleus genus progressively increased in UP1 (47%) and UP2 (51%) until they became dominant in UP3 (94%) and UP4 (77%). At the same time, members of Methanotermobacter genus decreased to 19%, 23%, 3% and 10% in UP1, UP2, UP3 and UP4, respectively. In addition, members of the Methanosarcina genus decreased during the hydrogen addition phases.

1. Introduction

A transition to renewable green energy is mandatory to lessen climate change and carbon dioxide emissions worldwide [1,2]. Bioenergy generation via anaerobic digestion (AD) of available biowastes can reduce greenhouse gas emissions by 3.29 to 4.36 billion tons of CO2 equivalent [3]. The AD is a biochemical process carried out by different Bacteria and Archaea guilds, which in absence of oxygen convert organic material into a biogas made up primarily of CH4 (40–75%) and CO2 (15–60%). The AD process is widely used as sustainable technology for biogas production. The biogas is commonly used to produce electricity and heat using a co-generation engine (CHP units). Alternatively, by removing the CO2 from methane, biogas can be upgraded to biomethane and used as vehicle fuel or injected into the existing natural gas grid [4,5,6,7].
Nowadays, several physical/chemical biogas upgrading technologies, including water, chemical and organic scrubbing, membrane separation, pressure swing adsorption and cryogenic separation, are available at commercial scale. All these technologies consist of downstream processes performed outside the anaerobic reactor; therefore, they require investments in external units, with high costs, especially for small and medium-size plants [8,9]. An alternative to the removal of the CO2 from methane is linked to the possible use of hydrogen for the reduction of CO2 to CH4 (methanation). Beside other methods, biological methanation performed by anaerobic microorganisms represents an attractive and ecofriendly method that is potentially exploitable on small and medium-sized plants.
The direct bioconversion of CO2 to CH4 using H2 is operated by hydrogenotrophic methanogens, a specific group of methanogenic archaea, through the so-called Wolfe cycle, and in accordance with Equation (1) [10]:
CO 2   +   4 H 2     CH 4     +   2 H 2 O     Δ G °   =   130.7   KJ / mol
Currently, two main approaches are used for the biological methanation: in situ methanation (the injection of H2 into the anaerobic digester), and ex situ methanation (which is accomplished in a separate reactor containing enriched cultures of hydrogenotrophic methanogens, into which H2 and CO2 or H2 and biogas are injected). The in situ biogas upgrading option requires less additional investment costs and it could be integrated into already existing biogas plants [11,12] with a continuously stirring tank reactor (CSTR), the most popular configuration used for the treatment of industrial, household and municipal waste [13].
Several studies suggest that the H2 diffusion in the liquid phase is the limiting factor of biological methanation.
The diffusion of H2 can be described by Equation (2):
RH2 = (KLa)H2 (CH2,G − CH2,L)
where RH2 is the H2 mass transfer rate (mol L−1 h−1) and (KLa)H2 is the volumetric mass transfer coefficient (L h−1). CH2,G − CH2,L (mol L−1) are the fractions of H2 in the gas and liquid phases, respectively.
(KLa)H2 is primarily influenced by the reactor’s design, mixing rate, gas recirculation, and the type of gas diffusion mechanism utilized [14], while CH2,G and CH2,L are dependent on the system pressure, hydrogen solubility (Henry’s constant), temperature and partial pressure. All these parameters contribute to determining the final amount of hydrogen that enters into the solution [15,16] and is bioavailable for microorganisms.
In order to overcome this limit, different in situ strategies for CSTR reactor configuration have been proposed, mainly introducing different H2 diffusion devices. In small-scale CSTR reactors (working volume ≤ 3.5 L), the H2 is introduced by column or ceramic diffusers [9,17], hollow fiber membranes (HFM) [18] and headspace injection [19], using different stirring speeds. These studies observed an increase in the methane evolution rate (MER) due to the conversion of the H2 added; it increased from 0.08 to 0.39 L LR−1 d−1, with a concentration of CH4 included in the range 53–96%. The best results were obtained with the use of HFM [20]. However, limits to full scale application of this technology are linked to the pressure requirements of gases injected because of the small pores of membranes, as well as to biofilm formation which can damage the permeability and the lifespan of the membrane itself [15,21]. Alfaro et al. (2019) proposed biogas recirculation in a 20 L CSTR, implemented with an HFM membrane area/reactor volume ratio twenty-four times lower than that used in a previous study. The results showed the positive effect of biogas recirculation and the absence of pressure drop due to biofilm formation, but a decrease in MER from 0.38 to 0.16 LCH4 LR−1 d−1, and of the CH4 content in the biogas from 96 to 73.1% was observed [9,12].
Several studies on ex situ biomethanation have shown that the contact area between liquid and gas flow is markedly increased when the reactor is filled with packing material [7,22,23]. Recently, Kougias et al. [24] investigated both the effect of packing material and the biogas recirculation rate on CO2 fixation in up-flow reactors fed with a mixture of H2, CO2 and CH4. The results showed that in a reactor filled with Raschig rings, both CO2 and H2’s utilization efficiency was increased when a higher biogas recirculation rate was applied. Moreover, the microbial diversity composition of the effluent showed a 1.5 fold-higher relative abundance of the Methanothermobacter species.
In agreement with the cited study are the results of a previous work of our group, which was focused on the microbial community’s response to the addition of H2 to a gas-stirred tank reactor (GSTR) partially immobilized with high-density polyethylene (HDPE) supports. Although that study did not aim to optimize the biomethanation process, the results showed an increase of 16% in MER during H2 addition at a biogas recirculation rate of 5 L LR−1 h−1. In addition, this study showed an increase in both bacteria and archaea abundance inside the packing area during the AD process and in the archaea community in both the effluent and interstitial matrix during the upgrading phases [25]. However, the methane content in the biogas was 56%. This low percentage of CH4 was probably due to the low bioavailability of H2 for the hydrogenotrophic community. Nevertheless, increases in both consumption and partial pressure of H2 can have several disadvantages for the AD process. The increase in pH to a value higher than 8.5 due to CO2 reduction by H2 can cause inhibition of methanogenesis [11]. On the other hand, an increase in H2’s partial pressure can affect the metabolic pathways of the endergonic acetogenesis phase by inhibiting the syntrophic oxidation of volatile fatty acids and alcohols, particularly propionate (Equation (3)).
CH 3 CH 2 COOH   +     H 2 O     CH 3 COOH   +   3 H 2   +     2 CO 2   Δ G °   =   + 76.2   KJ / mol
The buildup of these soluble metabolites can slow down and even inhibit the AD process. In addition, the in situ biogas upgrading process can occur via a different metabolic pathway that involves homoacetogenic bacteria and acetoclastic methanogens, in accordance with Equations (4) and (5), respectively:
4 H 2   +   2 CO 2     CH 3 COOH   +   2 H 2 O   Δ G °   =   105.5   KJ / mol
CH 3 COOH     CH 4   +     CO 2   Δ G °   =   31.0   KJ / mol
Thus, homoacetogenes can outcompete hydrogenotrophic methanogens for H2 utilization. This pathway is more favorable under high H2 partial pressure and alkaline pH, and if it does not interact syntrophically with acetoclastic methanogens, can potentially inhibit the AD process [26].
Therefore, optimization of the in situ biomethanation process requires combining high process efficiency with maintaining the strictly syntrophic relationships existing inside the whole microbial community involved in AD.
In order to improve the hydrogen consumption rate and MER efficiency, this study evaluated different strategies to increase gas–liquid mass transfer in the GSTR reactor. The novelty of this reactor configuration lies in the combined use of immerged packed material and biogas recirculation in a modified CSTR reactor with the aim of increasing the phase boundary interface for mass transfer and the solubility of H2. Moreover, biogas recirculation also allows for adequate homogenization of nutrients inside the reactor. The GSTR was continuously fed with second cheese whey (SCW) in thermophilic conditions (55 °C). To these end, two different H2 addition rates (1.18 and 1.47 LH2 LR−1 d−1) and three different biogas recirculation rates (118, 176 and 235 L LR−1 d−1) were applied. The effect of different experimental set-up on the microbial community composition was investigated.

2. Materials and Methods

2.1. Inoculum and Substrate

Digested sludge collected from a thermophilic digestion plant (55 °C) treating diary wastewater was used as the inoculum. SCW used as substrate was periodically collected from a small dairy factory located in Rome, Italy. SCW was stored at −20 °C and defrosted prior the use. SCW is a byproduct derived from ricotta cheese production, obtained after heat (85–90 °C) and/or acid protein coagulation of whey protein residue in the cheese whey. Table 1 shows the range of physico-chemical indicators of SCW. The variability observed is due to the ricotta cheese production process that generates a slightly different wastewater for each production stock.

2.2. Reactor Set Up and Operation

The experimental plant was made of a partial packed GSTR with a total working volume of 49 L and a submerged central packing area of about 30 L. The packing material had a specific surface area of 800 m2/m3 (Scubla MBBR 800 HDPE, Udine, Italy) and was sealed in a net bag to prevent washing in the outflow.
The decision to immobilize the reactor in this ratio was due to technical reasons linked to the position the digestate outlet. The net bag containing the packing material was located just below the outlet hole to prevent blockage.
The experiment was performed at thermophilic temperature (55 ± 1 °C) and atmospheric pressure; the hydraulic retention time (HRT) was 30 days.
The choice to operate under thermophilic conditions is due to several reasons: (i) several authors report that at these higher temperatures, compared to reactors operating under mesophilic conditions (37 °C), the degradation rates are enhanced, with higher biomethane production rates [27]; (ii) hydrogenotrophic methanogenic communities are at an advantage under thermophilic conditions [28]; and (iii) the inoculum used to start the GSTR comes from an industrial AD plant that operates under thermophilic conditions; thus, maintaining thermophily was important for better and faster acclimation of the microbial community during this experiment. The reactor was fed in a continuous mode with SCW. Due to the slight fluctuations of SCW, the organic loading rate (OLR) was in the range of 1.16 ± 0.05 gVS L−1 d−1 and 1.28 ± 0.08 gVS L−1 d−1.
The reactor configuration and the overall equipment design was described in a previous study [25].
The starting biogas recirculating flow rate was 118 L LR−1 d−1, and no H2 injection was performed. This period was considered as the control, and it is indicated as the AD phase.
After a steady state had been reached, pure H2 (≥99%) from an electrolyzer (DBS, model PG-H2 100) was blown into the GSTR from the lowest part, through the biogas recirculation line. The value of the starting H2 corresponding flow rate was 1.18 LH2 LR−1 d−1 to achieve a 4:1 ratio to the average gaseous CO2 produced during the AD phase, according with Equation (1). The biogas recirculating flow was maintained at 118 L LR−1 d−1. This experimental phase is referred as Upgrading 1 (UP1).
In the next experimental phase, called Upgrading 2 (UP2), H2 flow rate was increased to 1.47 LH2 LR−1 d−1, and the same gas recirculation flow was applied.
The H2 flow rate was subsequently kept stable at 1.47 LH2 LR−1 d−1, and the biogas recirculation flow was increased to 176 L LR−1 d−1, during the experimental phase denoted as Upgrading 3 (UP3). Finally, the gas recirculation flow was increased up to 235 L LR−1 d−1. This experimental phase is called Upgrading 4 (UP4). Table 2 reports a detailed scheme of the different experimental phases.

2.3. Analytical Methods

The percentage fractions of H2, CH4, CO2, N2, and O2 in the biogas and volatile fatty acids (VFAs), lactic acid, alcohols, and sugars in the effluent were analyzed according to Lembo et al. 2021 [25].
The biogas flow rate and composition were measured on line every 10 min and averaged over 24 h. A gas chromatography calibration curve was performed for each species detected, using several pure gas mixtures with H2, CH4 and CO2. Considering the obtained fittings, an experimental imprecision of ±5% is present for the measurement of the volume percentages.
The effluent for the analysis of the soluble metabolites was sampled daily and analyzed by HPLC. For calibration, mixed standards were prepared from pure substances (p.a. grade) at concentration levels of 10, 50, 200 and 500 ppm. The analyses were performed in triplicate. A relative standard deviation ≤ 5% was obtained.
TS and VS were analyzed according ALPHA standard method [29].

2.4. Calculation

There are several parameters through which it is possible to evaluate the efficiency of biomethanation. One of these is the methane evolution rate (MER), i.e., the rate of CH4 that is produced from the added H2. It is calculated as the difference in CH4 produced between the upgrading phase and the AD phase without H2 addition (LCH4 LR−1d−1).
It is calculated as follows in Equation (6):
M E R = C H 4 U P s C H 4 A D
where UPs are the upgrading periods (with H2 addition) and AD is the control period (without H2).
The other parameters to be carefully evaluated are the H2 gas–liquid mass transfer rate, namely rt (LH2 LR−1 d−1) and the H2 conversion efficiency, namely ηH2 (%).
These two parameters were calculated according to Equations (7) and (8), respectively:
r t = H 2   i n   f l o w   r a t e H 2   i n   o u t p u t   g a s
η H 2   ( % ) = ( H 2 in   flow   rate H 2   in   output   gas ) / ( H 2   in   flow   rate ) × 100
where H2 in the flow rate and H2 in the output gas are the volumetric H2 flows, respectively, injected and left in the reactor. It was assumed that all the H2 was metabolized by microbial community without any loss from [12,30].

2.5. Illumina Sequencing

Effluent samples from the GSTR were collected at the end of each different phase (AD, UP1, UP2, UP3, UP4) and stored at −20 °C. Genomic DNA was extracted according to the method described by Lembo et al. [25]. A specific portion (460 bp amplicon) of the 16S rRNA gene corresponding to the V3–V4 hypervariable region was amplified using universal primers (S-D-Bact-0341F and S-D-Bact-0785R) for both bacterial and archaeal domains. The sequencing process was carried out using the Illumina MiSeq platform at the Department of Agricultural Sciences, University of Naples Federico II (Portici, Italy). The obtained sequence reads were processed using the QIIME pipeline [27] to demultiplex, filter, trim, merge and cluster them into operational taxonomic units (OTUs). Taxonomic classification was performed using the Greengenes database at a 97% similarity threshold. Alpha-diversity was estimated by Simpson (1-D) and Shannon (H) diversity and evenness indices using the relative abundances of Illumina sequencing.

3. Results and Discussion

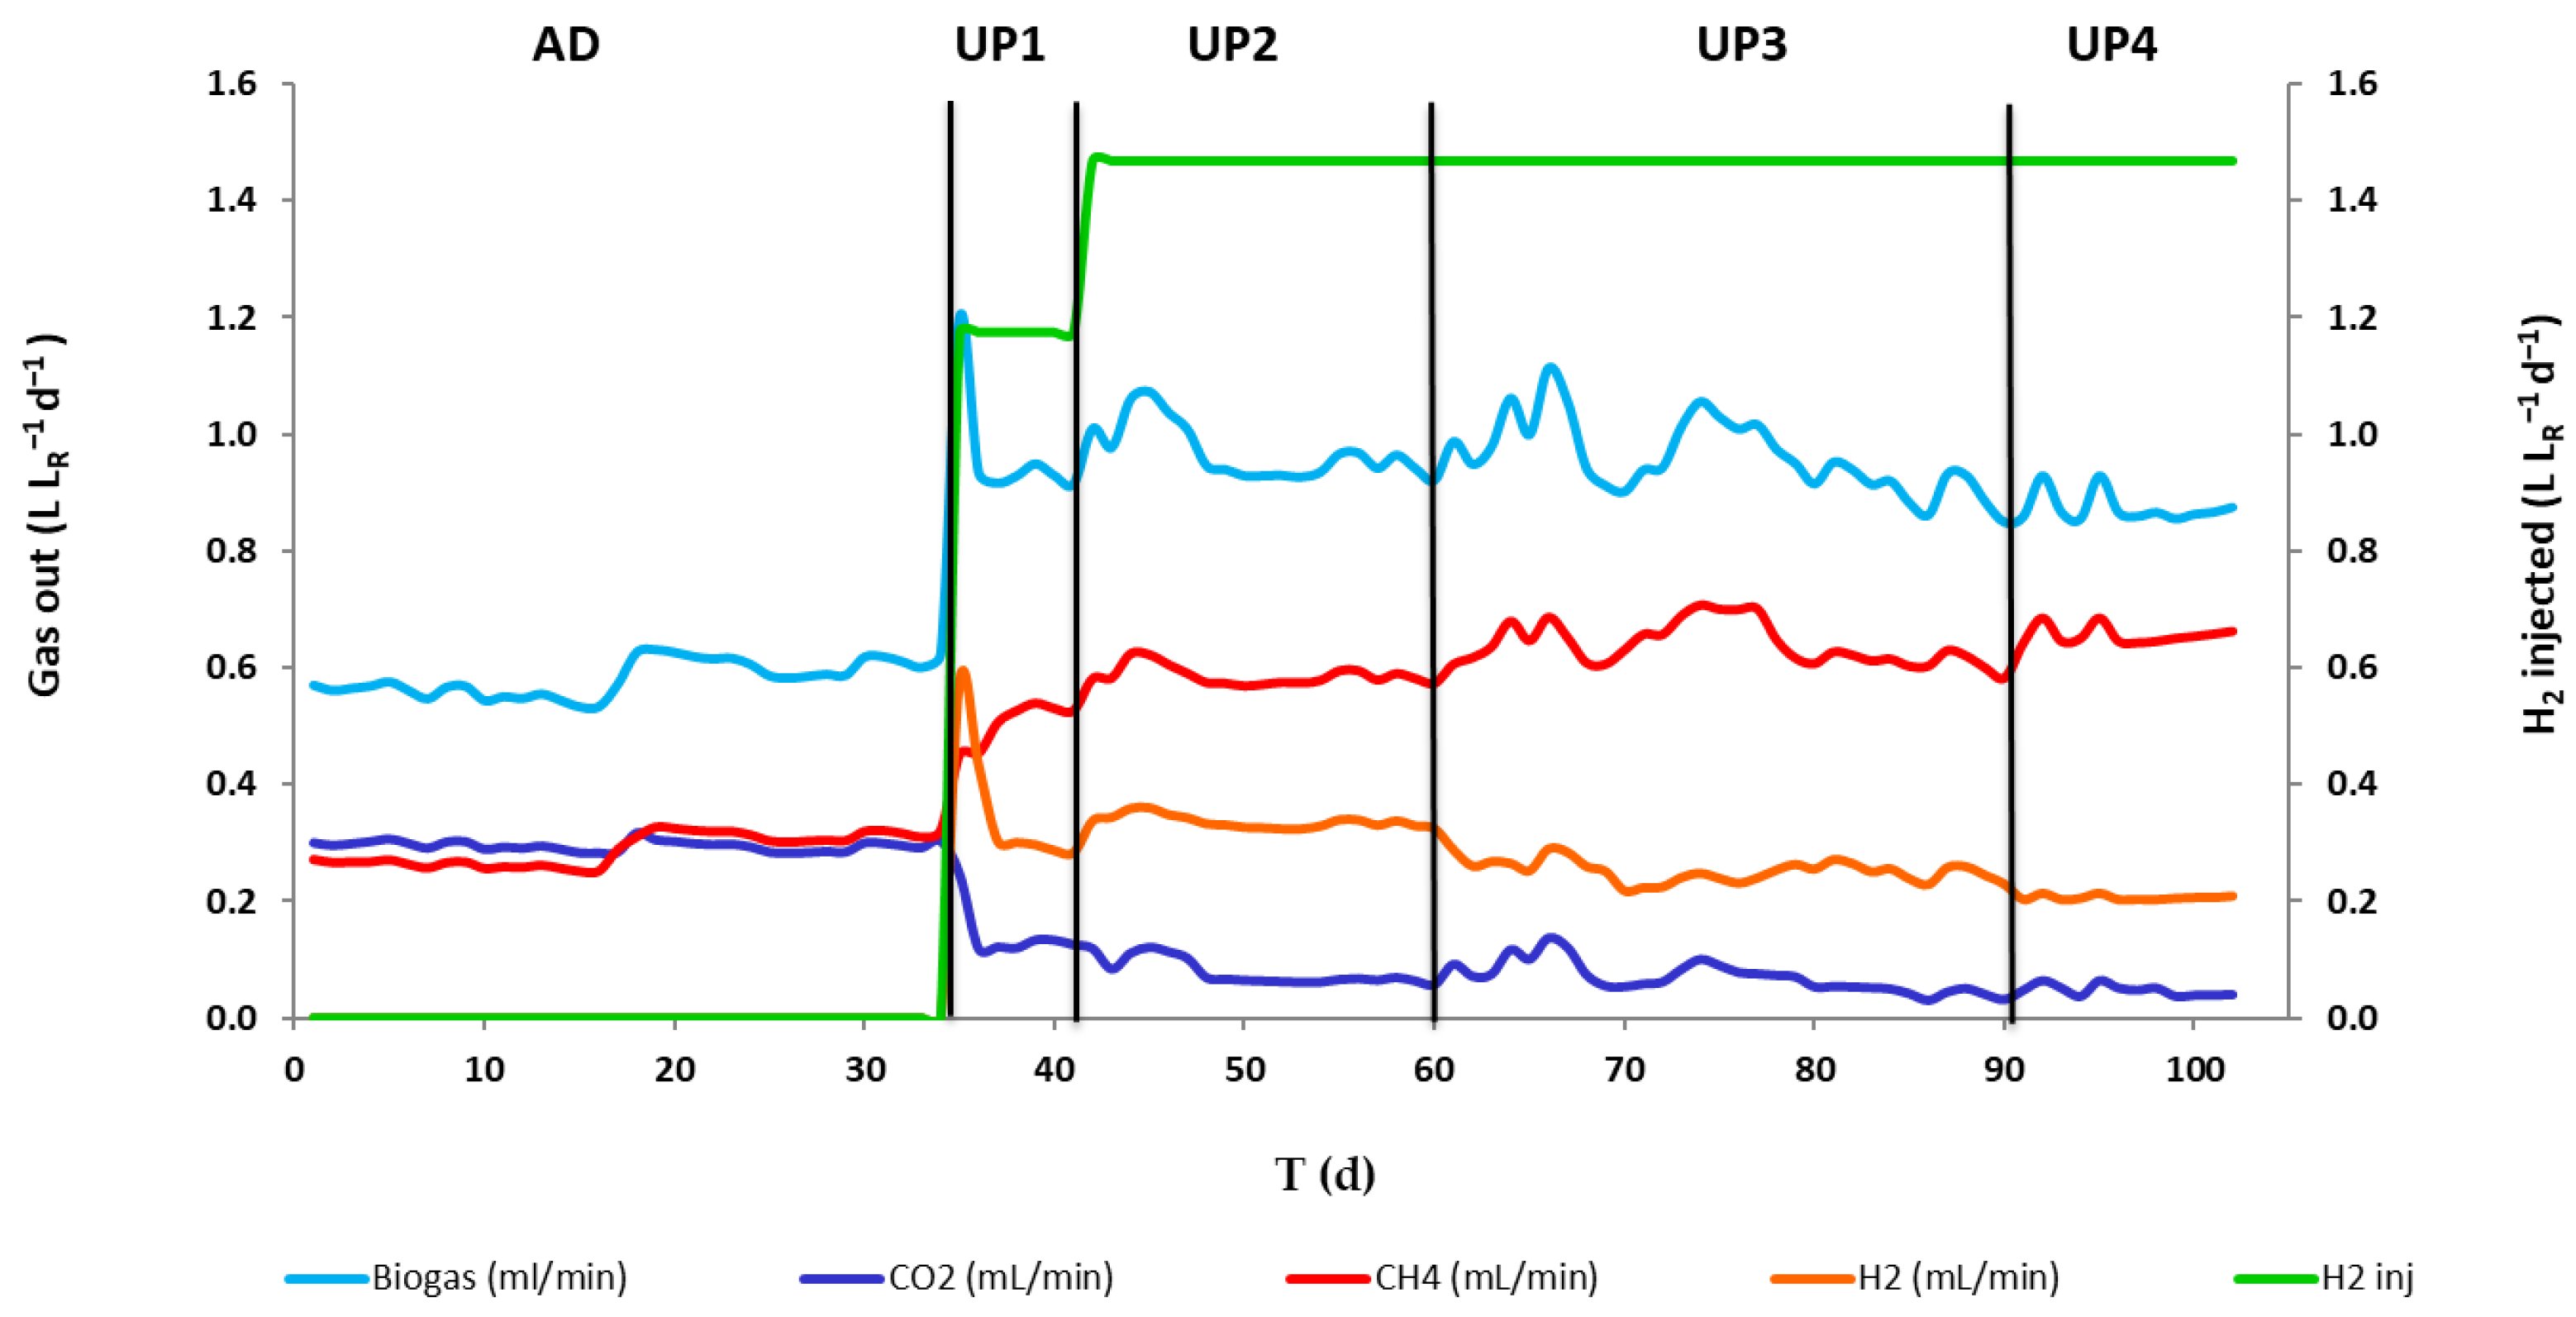
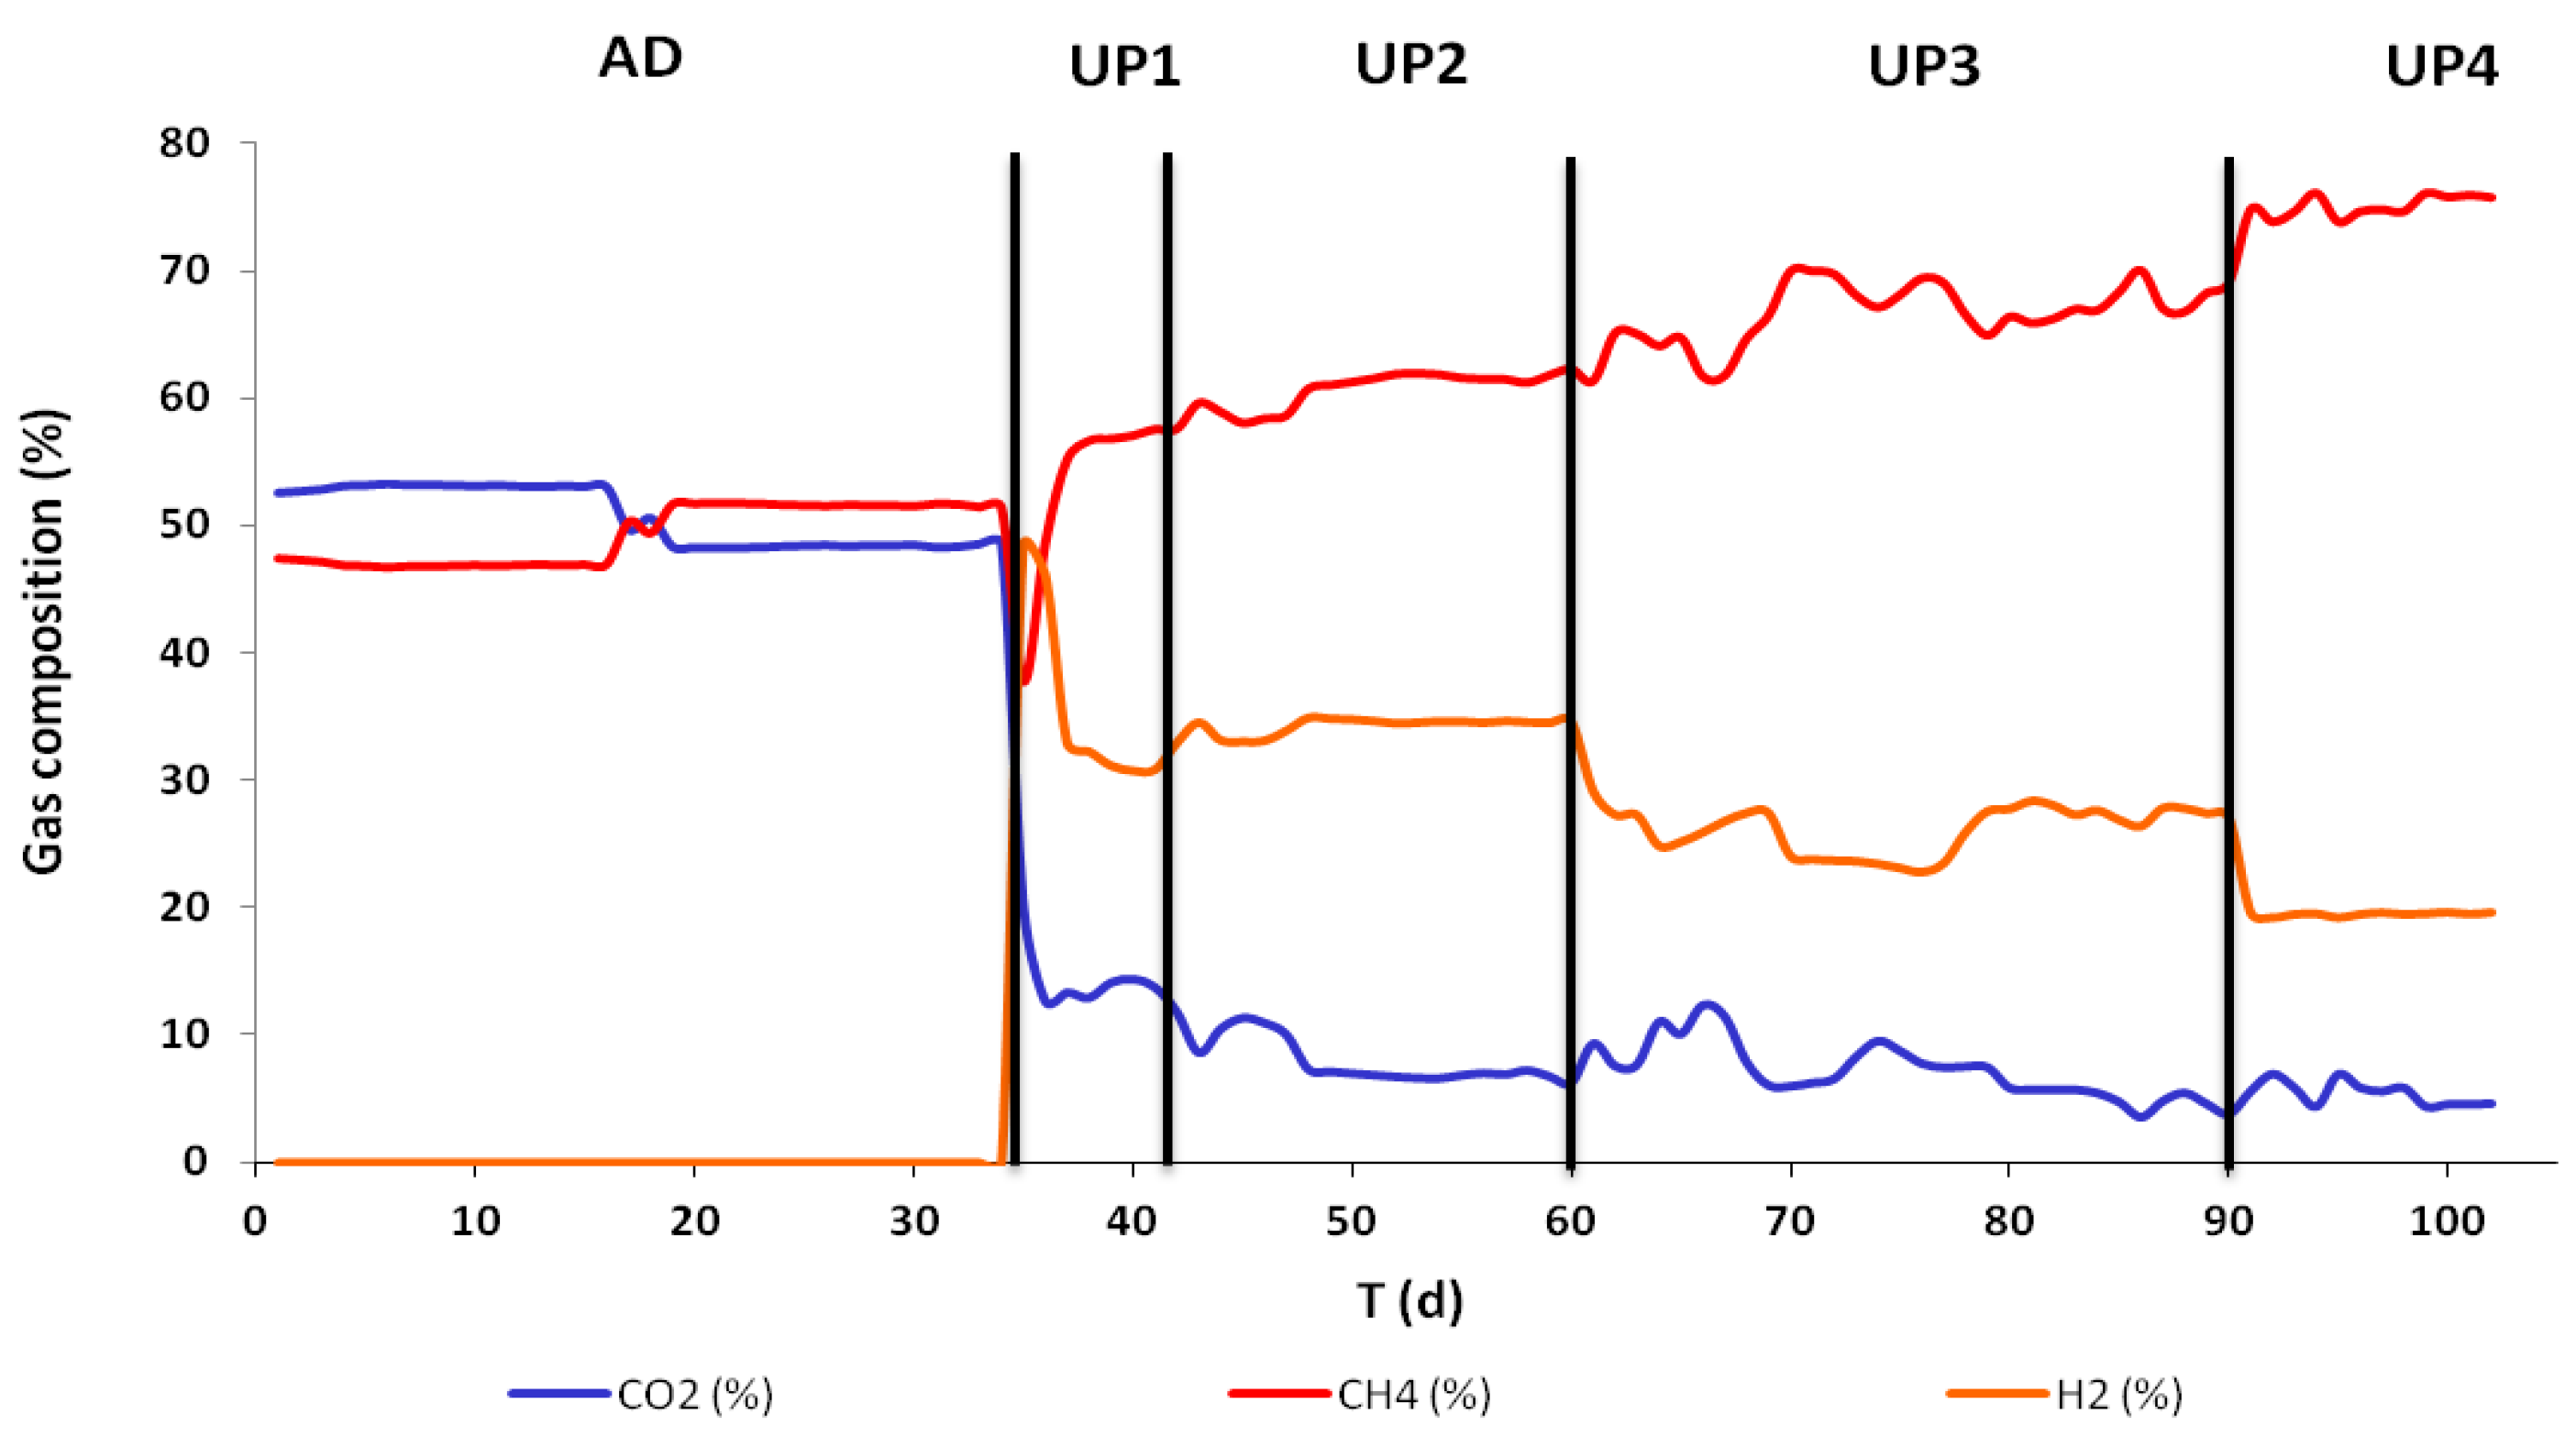
3.1. Reactor Performance

Process performance data at the steady state are summarized in Table 3. Figure 1 and Figure 2 shows daily time-courses profiles of biogas, H2, CH4, CO2 flow rates and composition (% of H2, CH4, CO2), respectively, of all experimental phases.
After 17 days of the AD period, a consistent rate of methane production was achieved, with an average of 0.29 ± 0.03 LCH4 LR−1 d−1, Figure 1. The pH of the reactor remained stable at around 7.10 ± 0.14, indicating that the system had a strong buffering capacity, even without any pH control being applied. The biogas produced had an average methane content of 49.3 ± 2.3%, as summarized in Table 1.
The substrate was almost completely consumed; indeed, in the reactor effluent, lactose was detected at low concentration (224 ± 13 g L−1) indicating an efficient performance of the AD phase. Acetic acid was the unique VFA detected in the effluent during the AD process, with a concentration of 33 ± 1.8 mg L−1. After the AD phase, UP1 started at day 35 by adding H2 at an injection rate of 1.18 LH2 LR−1 d−1 into the reactor. The biogas recirculation rate was maintained at 118 LR−1 d−1, as in the previous phase.
During the relatively steady state of UP1 (35 to 41 days), the rate of methane production increased by 83% compared to the AD phase, with an average production rate of 0.53 ± 0.01 LCH4 LR−1 d−1. However, the biogas produced during this phase had a higher methane concentration, averaging at 56.6 ± 0.89%. The MER value was 0.24 LCH4 LR−1 d−1 and the efficiency of H2 utilization (ηH2) was 75%. Considering the stoichiometric injection of H2, a relatively high concentration of H2 (36.10 ± 0.96%) was detected in the output gas. This was probably due to the limitation of GSTR configuration to obtain a complete H2 gas–liquid mass transfer.
With the aim of both increasing the CH4 concentration and decreasing the H2 concentration in the output biogas, a higher H2 injection rate was applied (1.47 LH2 LR−1 d−1) in the UP2 phase (42 to 60 days) by keeping the biogas recirculation rate (118 L LR−1 d−1) constant.
In the UP2 steady state, the rate of methane flow was recorded at 0.59 ± 0.02 LCH4 LR−1 d−1. The consumption rate of H2 (rt) increased from the previous UP1 phase, rising from 0.89 to 1.13 LH2 LR−1 d−1, resulting in an increase in the methane content of the biogas of up to 60.6 ± 1.52%. The MER during this phase was 0.30 LCH4 LR−1 d−1, and the CO2 flow rate in the output gas was 25% lower than that recorded in UP1. The beginning of the UP3 phase, which lasted from day 61 to day 90, was marked by an increase in the gas recirculation rate to 176 L LR−1 d−1
A further improvement in the H2 mass transfer in the UP3 period was observed (rt = 1.22 LH2 LR−1 d−1), which corresponded to an 83% increase in the efficiency of H2 utilization. At the same time, the CH4 concentration in the biogas reached the value of 66.6 ± 2.43%. An increase in the MER value was also observed (0.35 LCH4 LR−1 d−1) compared to the previous UP2 phase (0.30 LCH4 LR−1 d−1). On day 91 (UP4 phase), the gas recirculation rate was raised to 235 L LR−1 d−1 with the aim of increasing ηH2. At this stage, the average H2 increase was 88%, the CH4 concentration increased to 75.0 ± 0.83%, corresponding to a 52% increase as compared to AD, and MER increased to 0.37 LCH4 LR−1 d−1. The H2 content dropped from 26.2 ± 1.86% observed in UP3 to 19.5% ± 0.14. As a major result, the CO2 concentration was equal to 5.44% ± 0.93, which represented an 89% decrease as compared to the concentration observed in the AD phase (50.7 ± 2.3%).
Unfortunately, the UP4 phase was abruptly interrupted after only 12 days of experimentation due to technical problems with the GSTR. Despite the limited time, relatively stable performances were obtained. During this phase, the best results were achieved compared to the previous experimental phases.
We observed a positive effect of the increase of biogas recirculation rate on biogas upgrading, according to results previously reported by other authors [12,24]. The process performances obtained in our study were comparable to those obtained with a reactor of 20 L of working volume, used for in situ biomethanation and implemented by comparable biogas recirculation rates and by a hollow fiber membrane module as a gas diffusion device [12]. At the end of the experimentation, the authors obtained a biogas with CH4, H2 and CO2 contents of 73 ± 3.4%, 7.2 ± 2.4% and 19.7 ± 3%, respectively, by applying a biogas recirculation rate of 202 L LR−1 d−1. Moreover, a MER value of 0.16 LCH4 LR−1 d−1 with 94% H2 utilization efficiency was obtained. Comparatively, in the present study, a higher MER value (0.37 LCH4 LR−1 d−1) was reached, but the H2 utilization efficiency was lower (88%). In the current study, the CH4 concentration in the biogas reached a slightly higher value (75% ± 0.83), while a higher concentration of hydrogen (19.5 ± 0.14%) with a much lower CO2 concentration (5.44 ± 0.93%) in the biogas was observed. Similar low values of 6.6% and 5.1% of CO2 contents were, respectively, obtained by Luo and Angelidaki [9] and Voelklein et al. [14]. In both studies, incomplete biogas upgrading was observed: 75% and 60.3% of the CH4 content and 18.4% and 34.6% of the H2 content in the biogas were reported, respectively. These studies utilized a ceramic gas diffuser on the bottom of the reactor, and the insertion both of a stirring speed of 150 rpm [9] and of a biogas recirculation rate of 4 L min−1 [14].
In the present study, we adopted the use of biofilm media carriers in GSTR configuration. Then, we assume that the packed area in GSTR may play a significant role in extending gas–liquid contact, acting as a H2 diffusion device. Additional investigation is required to clarify the exact function of the packing material in the gas–liquid mass transfer.

3.2. pH, VFAs Evolution and Organic Matter Removal

During the experimental phases, a major increase in pH from the AD (7.10 ± 0.14) to the UP1 phase (7.81 ± 0.20), and then a gradual increase to 8.24 ± 0.10 in UP4, was observed. These results were not surprising, as one of the primary difficulties encountered in biogas upgrading technology is the challenge of raising the pH to levels above 8.5; this is attributed to the removal of bicarbonate, which can lead to inhibition of methanogenesis [21].
Acetate was the unique VFA detected in all UP phases, with an increasing concentration from UP2 to UP4. This was particularly relevant in the last two experimental phases, since the acetate concentration raised from the 41 mg/L observed in UP2 to the 159 mg/L in the UP3, reaching up to 358 mg/L in the UP4 phase. Concomitantly, a progressive decrease in the CO2 concentration in the biogas was observed (Table 1). In accordance with our results, acetate accumulation was reported in previous studies [9,19,25,30]. Agneessens et al. (2017) showed that acetate concentration increased more at CO2 levels <7%, which were related to the increase in pH from ±7.92 to ±8.33; therefore, they were close to the borderline value for an efficient biogas production [31]. These conditions may favor the activity of homoacetogenes. Indeed, the addition of H2 may result in its conversion to methane through hydrogenotrophic methanogenesis, but it is also a potential substrate for homoacetogenesis, which can lead to the production of acetate.
Acetate can be readily converted to CH4 by acetoclastic methanogens. However, some authors reported that the acetate consumption by acetoclastic methanogens (within Methanosarcina genus) was observed to be inhibited in a reversible manner when exposed to high levels of H2 [32]. Therefore, the increase in acetate observed during the experiments was probably the result of an increase in the homoacetogenesis pathway and a decrease in the acetoclastic methanogens’ activity.
An established fact is that an increase in the H2 partial pressure within the anaerobic reactor can impact the metabolic pathways of the acetogenesis phase, causing a buildup of VFAs and leading to acidification and reactor failure. Since no other organic acids were detected in the effluent, the acetogenic phase of our AD process was not impaired.
Finally, according to the results shown in Table 1, the H2 addition and the biogas recirculation did not influence the VS concentration in the effluent; therefore, the overall efficiency of degradation was kept constant.

3.3. Microbial Communities

Illumina-based 16S sequencing was used to characterize the microbial communities of effluent samples collected at the end of each experimental phase (AD, UP1, UP2, UP3 and UP4) as well as of the thermophilic sludge used as the inoculum. Taxonomic assignment of sequences showed a stepwise decrease from the phylum (99%) level towards the family (97%), the genus (46%) and the species (25%) levels. Although the short length of the PCR amplified DNA fragmentation, we can hypothesize that the limited taxonomic assignment at the genus and species levels suggested the existence of new or uncharacterized taxa in the GSTR microbiome. The microbial community characterization at phylum and family level is shown, and it is focused on the most abundant members, with a relative abundance of ≥1.0%. The bacterial population accounted for 99–96% of the whole microbial community, and Archaea made up the remaining 1–4%.

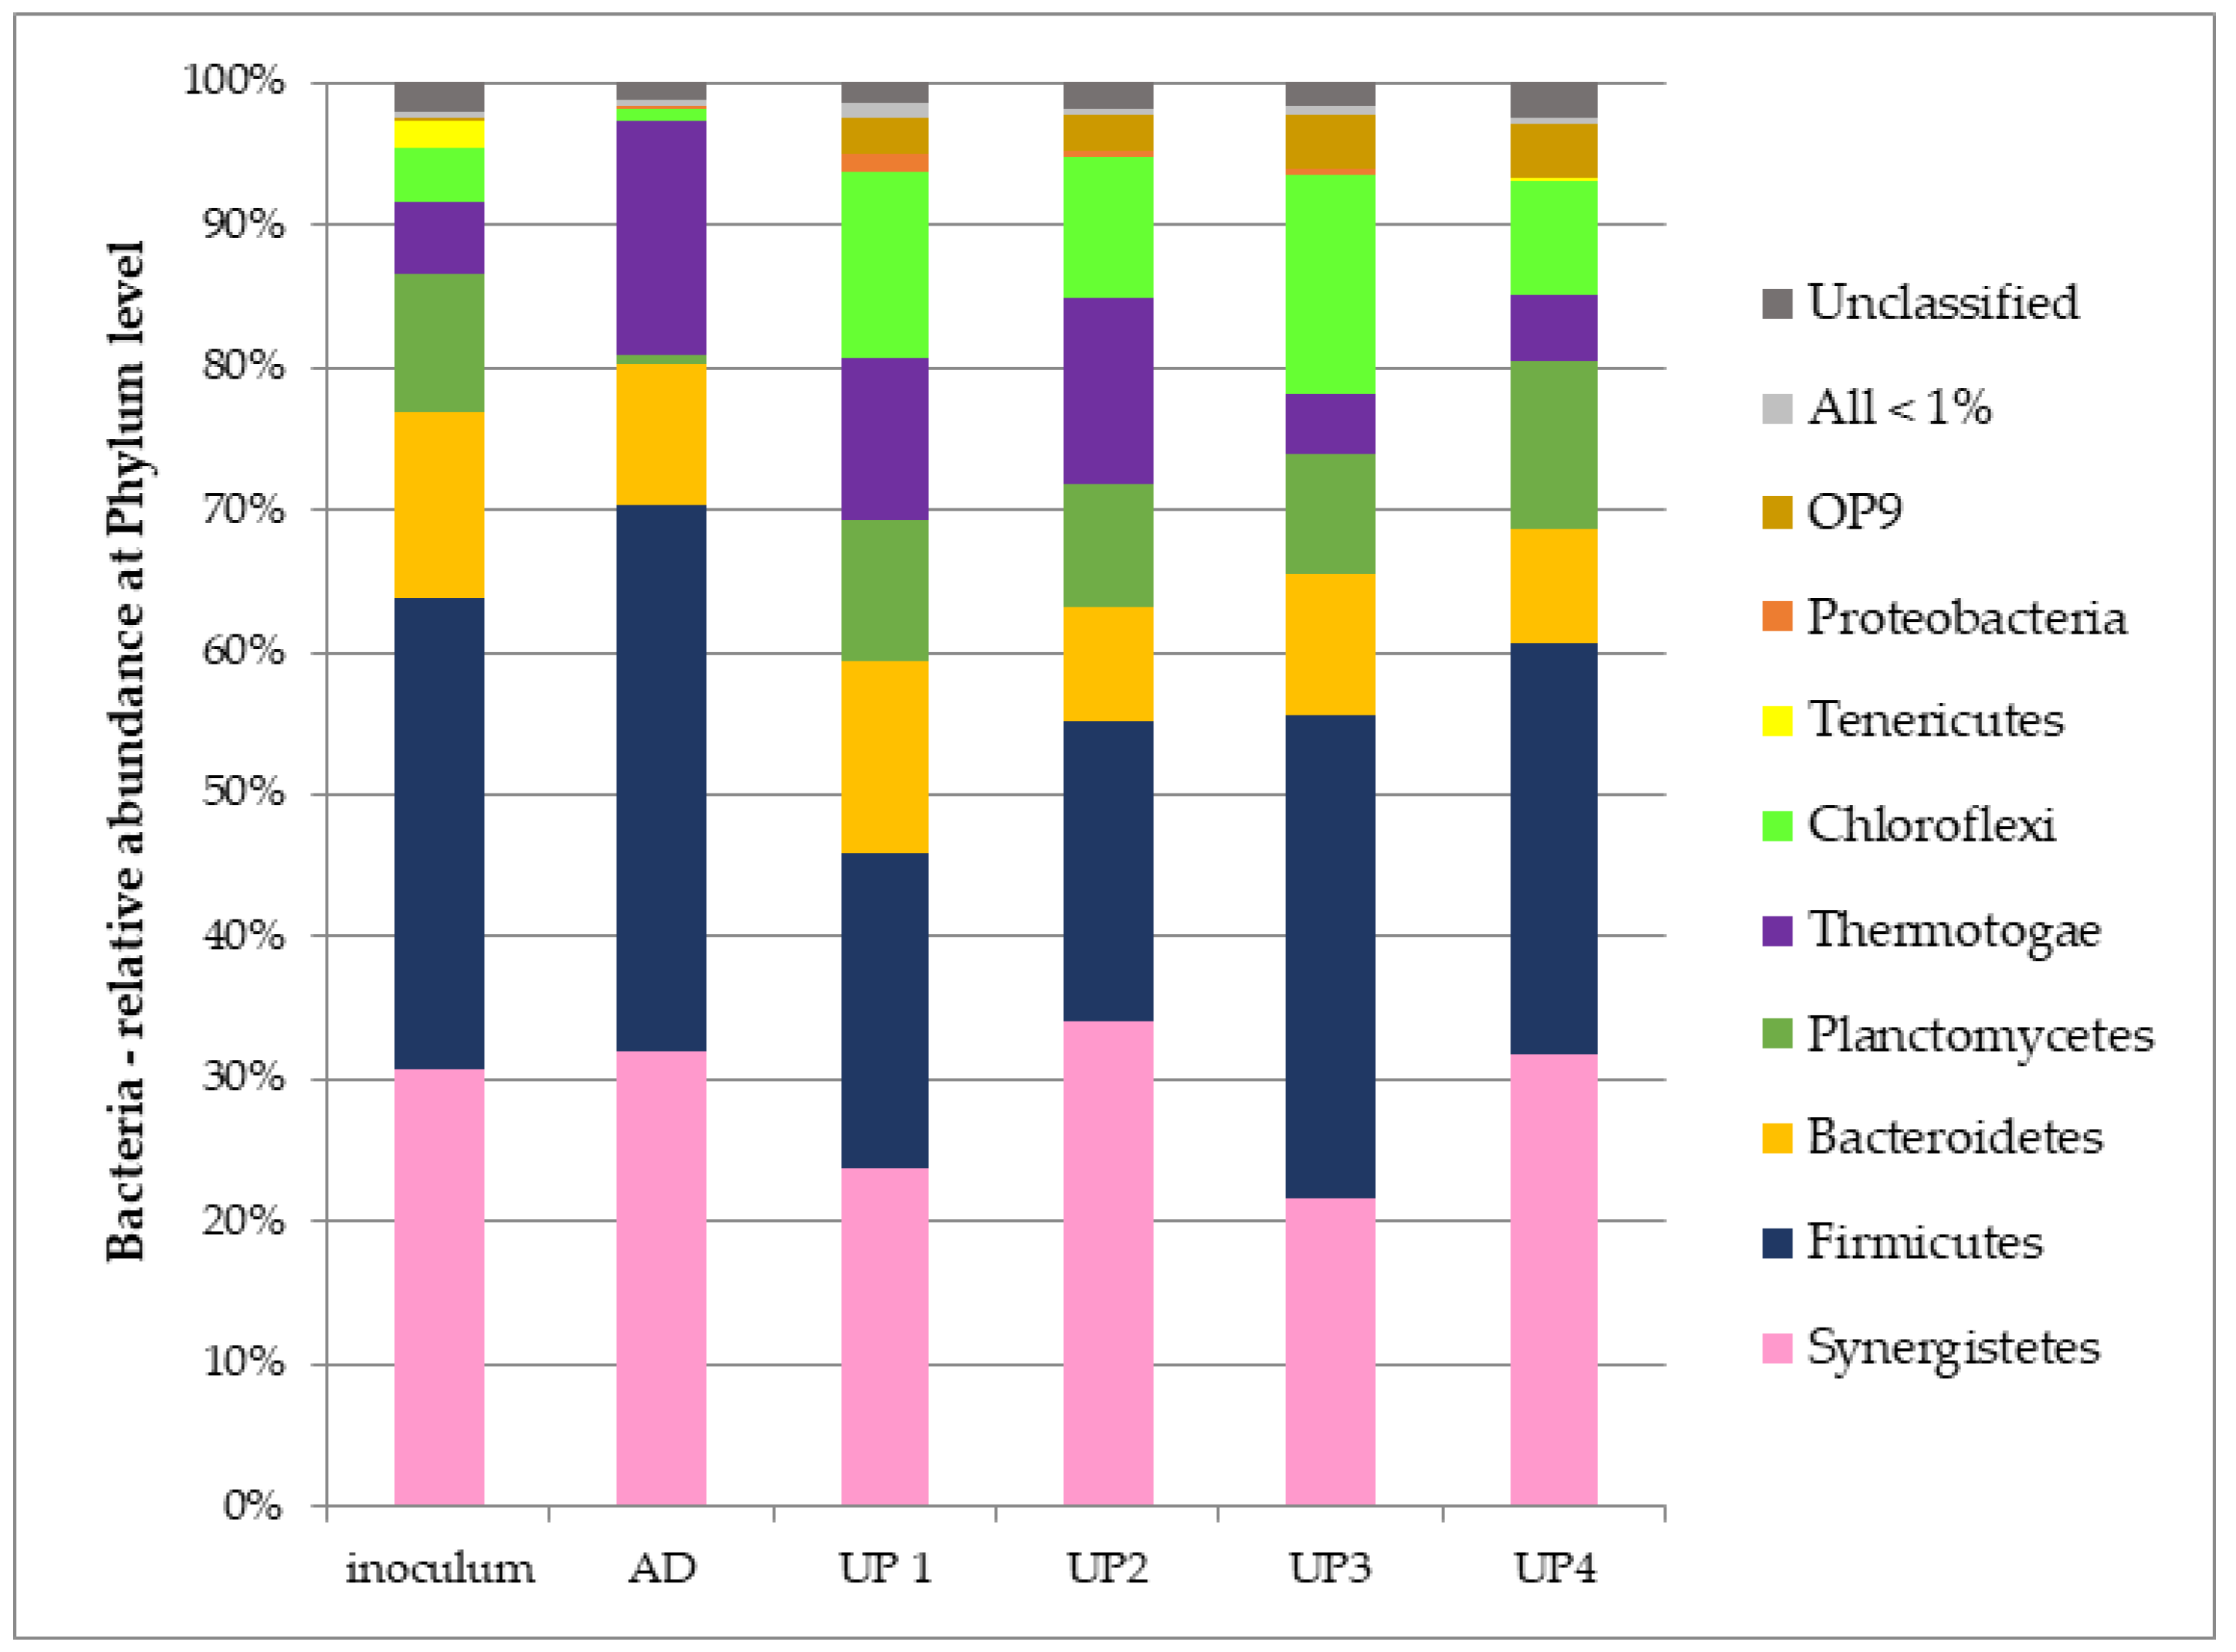
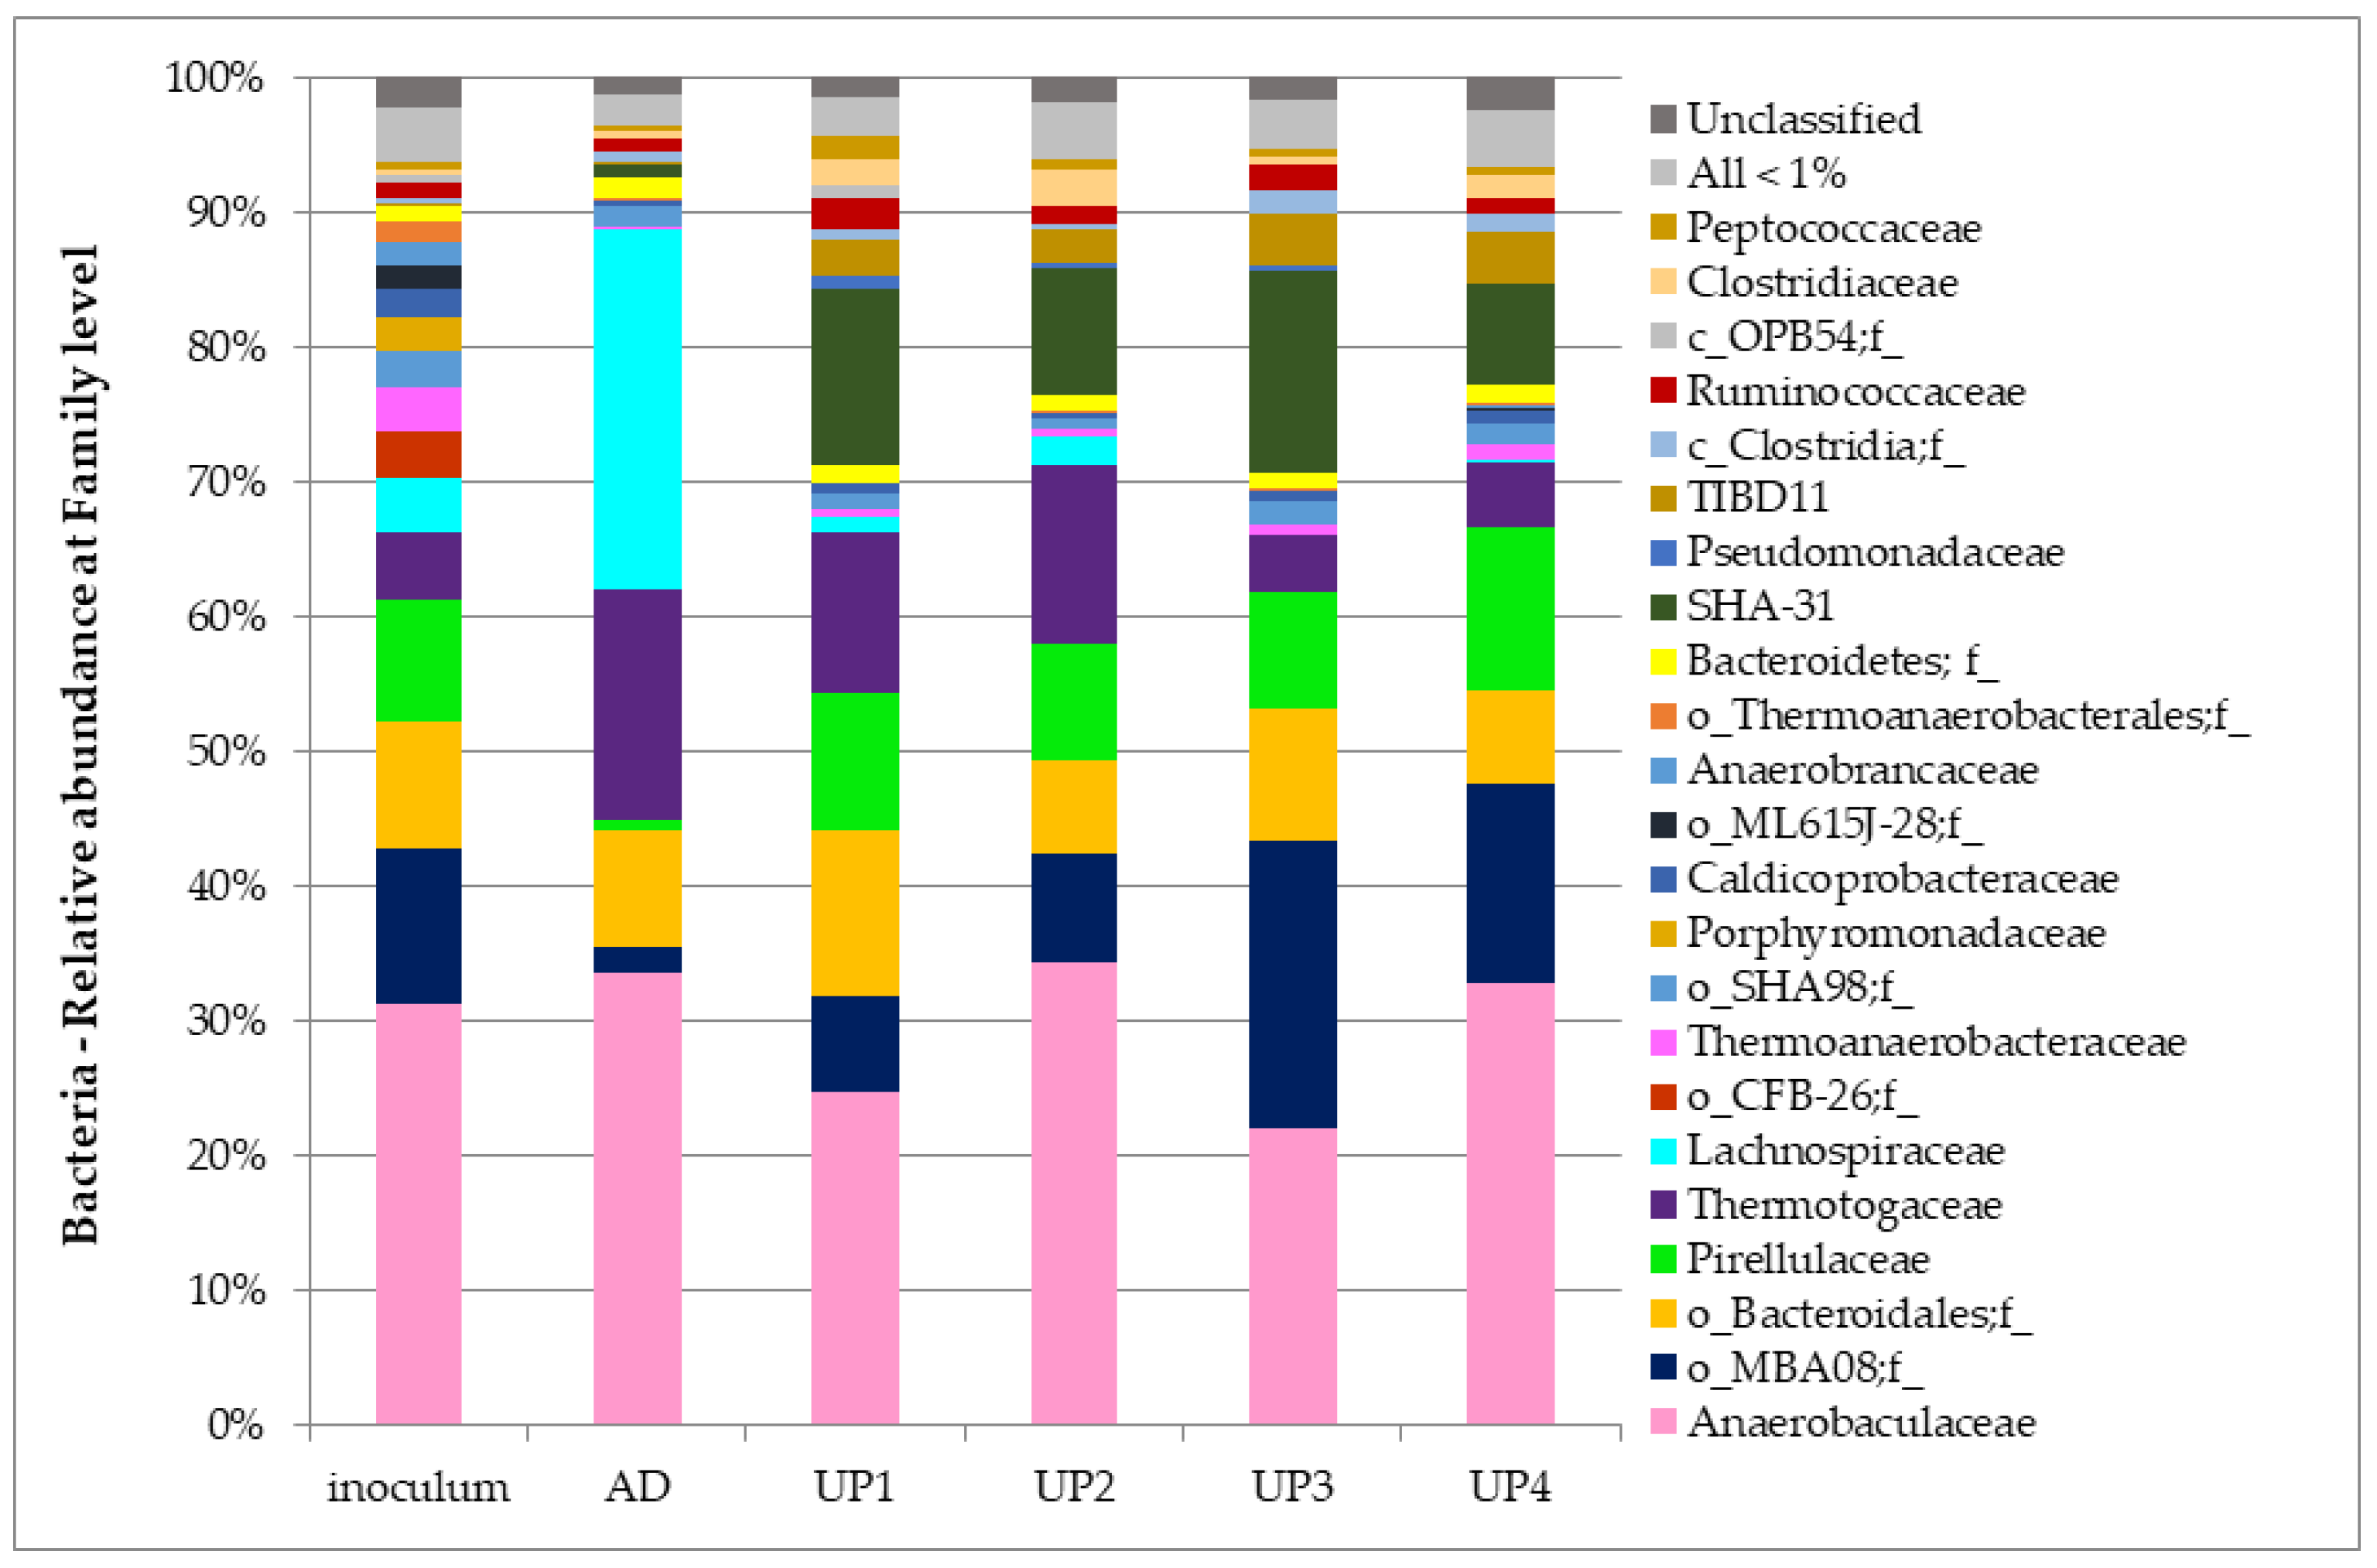
3.4. Bacteria Communities

Figure 3 shows the relative abundance of bacterial communities at the phylum level.
In the thermophilic sludge used as the inoculum, Firmicutes and Synergistetes phyla, with relative abundances of 33% and 31%, respectively, accounted for more than half of the whole microbial communities. Representatives of Bacteroidetes and Planctomycetes phyla were also abundant, representing 13% and 10%, respectively. Minor representative phyla were identified in Thermotogae (5%) and Chloroflexi (4%), and in Tenericutes (2%) to a small extent. The microbial composition identified in the inoculum remained quite stable in the sample collected at the end of the AD phase. The most relevant difference with the inoculum community was identified in the presence of Thermotogae (16%) Planctomycetes (1%) and Chloroflexi (1%) phyla. Moreover, Firmicutes (38%), Sinergistetes (32%) and Bacteroidetes (10%) phyla still represented the largest fraction of the whole microbial community, while members of Tenericutes completely disappeared (<0.01%).
Similarly, the relative abundances of microbial communities at the end of the UP1, UP2, UP3 and UP4 experimental phases remained stable for members of Firmicutes (22%, 21%, 32% and 28%, respectively), Sinergistetes (23%, 34%, 21% and 31%, respectively), Bacteroidetes (13%, 8%, 9% and 8%, respectively) and Planctomycetes (10%, 9%, 8% and 12%, respectively). On the contrary, a significant increase in members belonging to the Chloroflexi phylum was observed in UP1 (13%), UP2 (10%), UP3 (15%) and UP4 (8%). Members of the OP9 phylum slightly increased in UP1 (3%), UP2 (2%), UP3 (4%) and UP (4%).
The characterization at phylum level highlighted as the whole that the microbial community of the sludge used as the inoculum was already acclimatized to the thermophilic (55 °C) AD process treating SCW at the same operational conditions as HRT (30 days). In addition, the bacteria community’s composition was kept quite stable throughout the AD and the UPs experimental phases. This behavior can explain the stable performance of the AD process during the GSTR upgrading phases.
A more detailed characterization of the inside of the microbial structure is obtained by the classification at family level (Figure 4).
Anaerobaculaceae was the only Synergistetes family detected in all samples. It showed a variable trend in the respective relative abundances, being higher in the inoculum (31%), AD (32%), UP2 (34%) and UP4 (31%) samples, and showing a decrease in UP1 (23%) and UP3 (21%). Anyway, it was the dominant group inside the bacterial community during all experimental phases. This family was identified as Anaerobaculum at genus level, but it was not affiliated at species level. The Anaerobaculum genus was already detected in our GSTR during a previous experimental period [26], characterized by a 15 days of HRT, and it was identified to belong to the A. hydrogeniformans species, a NaCl-requiring fermentative bacterium adapted to the saline environment and milk-derived substrates. Sequences belonging to the similar species were identified by Treu at al. [33] in studies carried out on anaerobic digestion plants fed with cheese whey at thermophilic temperatures, as well as by Fontana et al. [32], in a thermophilic single-stage CSTR treating cheese wastes and working at 15 days of HRT.
The highest diversity at family level was identified among the Clostridia class, inside the Firmicutes phylum, while only four bacteria groups were identified at order level. An unidentified family belonging to the recently discovered MBA08 order was identified in the inoculum (11%). It after decreased to 2% during the AD phase, while it progressively increased during UP1 (7%), UP2 (8%), UP3 (20%) and UP4 (14%). The presence of bacteria belonging to the order MBA08 is frequently reported in studies on biogas biological upgrading systems, and according to Kougias et al. [34], the presence of these microorganisms is strictly related to bioreactors operating under a dominant hydrogenotrophic pathway.
Members of the Lachnospiraceae family, within the order Clostridiales, were present in the inoculum (4%); they increased significantly during the AD phase (25%) and they decreased during phases of hydrogen addition to UP1 and UP2 (1% and 2%, respectively), almost dsiappearing in UP3 (0.1%) and UP4 (0.01%). This family was characterized at specie level as Defluviitalea saccarophila, a thermophilic fermenting bacteria producing acetate, formate, n-butyrate and butyrate as the main products [35].
Moreover, representatives of the Clostridiaceae, Peptococcaceae, Ruminococcaceae, and Caldicoprobacteraceae families all belonging to the Clostridiales order, were identified as minority members of the microbial community in every experimental condition. The cumulative abundance of sequences belonging to this group of families was <10% of the total diversity in the inoculum (4%), in AD (3%) and in UP1 (7%), UP2 (5%), UP3 (5%) and UP4 (5%) phases. They represent a group of microorganisms involved in various functions of the AD process, from the hydrolysis of substrates to syntrophic acetate oxidation (SAO) activity.
Among members of the Bacteroidetes phylum, microorganisms belonging to unidentified as well as to Porphyromonadaceae families were identified, both within the Bacteriodales order. The not identified microorganisms were found in inoculum (9%), and during AD (8%), and UP1 (12%), UP2 (7%), UP3 (9%) and UP4 (7%) samples, while bacteria of the Porphyromonadaceae family were only detected in inoculum sample (3%), disappearing during AD and UPs phases. Bacteroidetes are recognized as hydrolytic bacteria often abundant in anaerobic digestion reactors (about 10%) [36]. Interestingly, microorganisms belonging to this phylum represented only a small fraction of the microbial community identified during the AD phase in both the effluent and the interstitial matrix of GSTR during our previous experimentation [25], and they completely disappeared during the hydrogen injection phases. In the current experimentation, microorganisms of the Bacteroidetes phylum remained stable into the GSTR, and they were identified in all samples favoured by the HRT of 30 days, which corresponds to double that previously used [25].
The Thermotogaceae family, belonging to Thermotogales order, was the unique member within the Thermotogae phylum, and it was characterized as genus S1 in the inoculum (5%), during the AD phase (16%) and during the hydrogen injection phases in the UP1 (11%), UP2 (13%), UP3 (4%) and UP4 (5%) samples. These microorganisms play a role in the SAO activity, acting in mutualistic cooperation with hydrogenotrophic methanogens [37].
Pirellulaceae (order Pirellulales) was the unique family within the Planctomyces phylum; it was detected in the inoculum (9%), decreased in AD (1%), and was quite stable during upgrading phases UP1, UP2, and UP3, with similar relative abundances (10%, 9%, 8% and 12%, respectively). These microorganisms are scarcely described in the literature, and they are always represented as a minor group of mesophilic reactors [38,39]. Moreover, the large size of the genome of the Planctomyces species revealed by methagenomics characterization was correlated with adaptability of these microorganisms to degrade a wide range of biopolymers [40].
The SHA-31 family, a member of the class of Anaerolineae (Chloroflexi phylum), was found to have <1% relative abundance in the inoculum and the AD phase. Members of this family increased with the addition of hydrogen flow in the UP1, UP2, UP3 and UP4 phases, reaching a relative abundance of 12%, 9%, 14% and 7%, respectively. Since these microorganisms have a role in carbohydrate degradation as well as in the interspecies electron transfer mechanism in mutualistic cooperation with methanogens, the increase in their representativeness during UPs phases suggested that new syntrophic relationships have been created in the bacterial and methanogenic communities of GSTR. The alpha-diversity of the bacterial community was calculated for all samples (Table 4). The AD sample was characterized by the lowest values of diversity (0.77 and 1.67, respectively) and evenness (0.21 and 0.55, respectively) of both Simpson and Shannon indices. The decrease in both indices from the inoculum to the AD phase clearly suggested a specialization of the bacterial community to the AD process in the GSTR configuration. The opposite trend was observed after the hydrogen addition into bioreactor. Indeed, Simpson and Shannon indices both agreed (0.87 and 2.13, respectively) on identifying the UP1 sample as that with the highest diversity of representatives. At the same time, UP1 also showed a more uniform familial distribution (Simpson: 0.43, Shannon: 0.74). Therefore, hydrogen addition shaped a more diverse bacterial community, which was also characterized by a more uniform distribution that may represent the adaptive response of microorganisms to the addition of a new substrate. During the UP2, UP3 and UP4 phases, an irregular trend of Simpson and Shannon diversity was observed, but the values of both indices never reached the highest values observed for UP1. Particularly, the UP4 sample was characterized by the lowest values of Simpson and Shannon evenness indices (0.26 and 0.64., respectively), allowing us to hypothesize the presence of a peculiar community with low abundance.

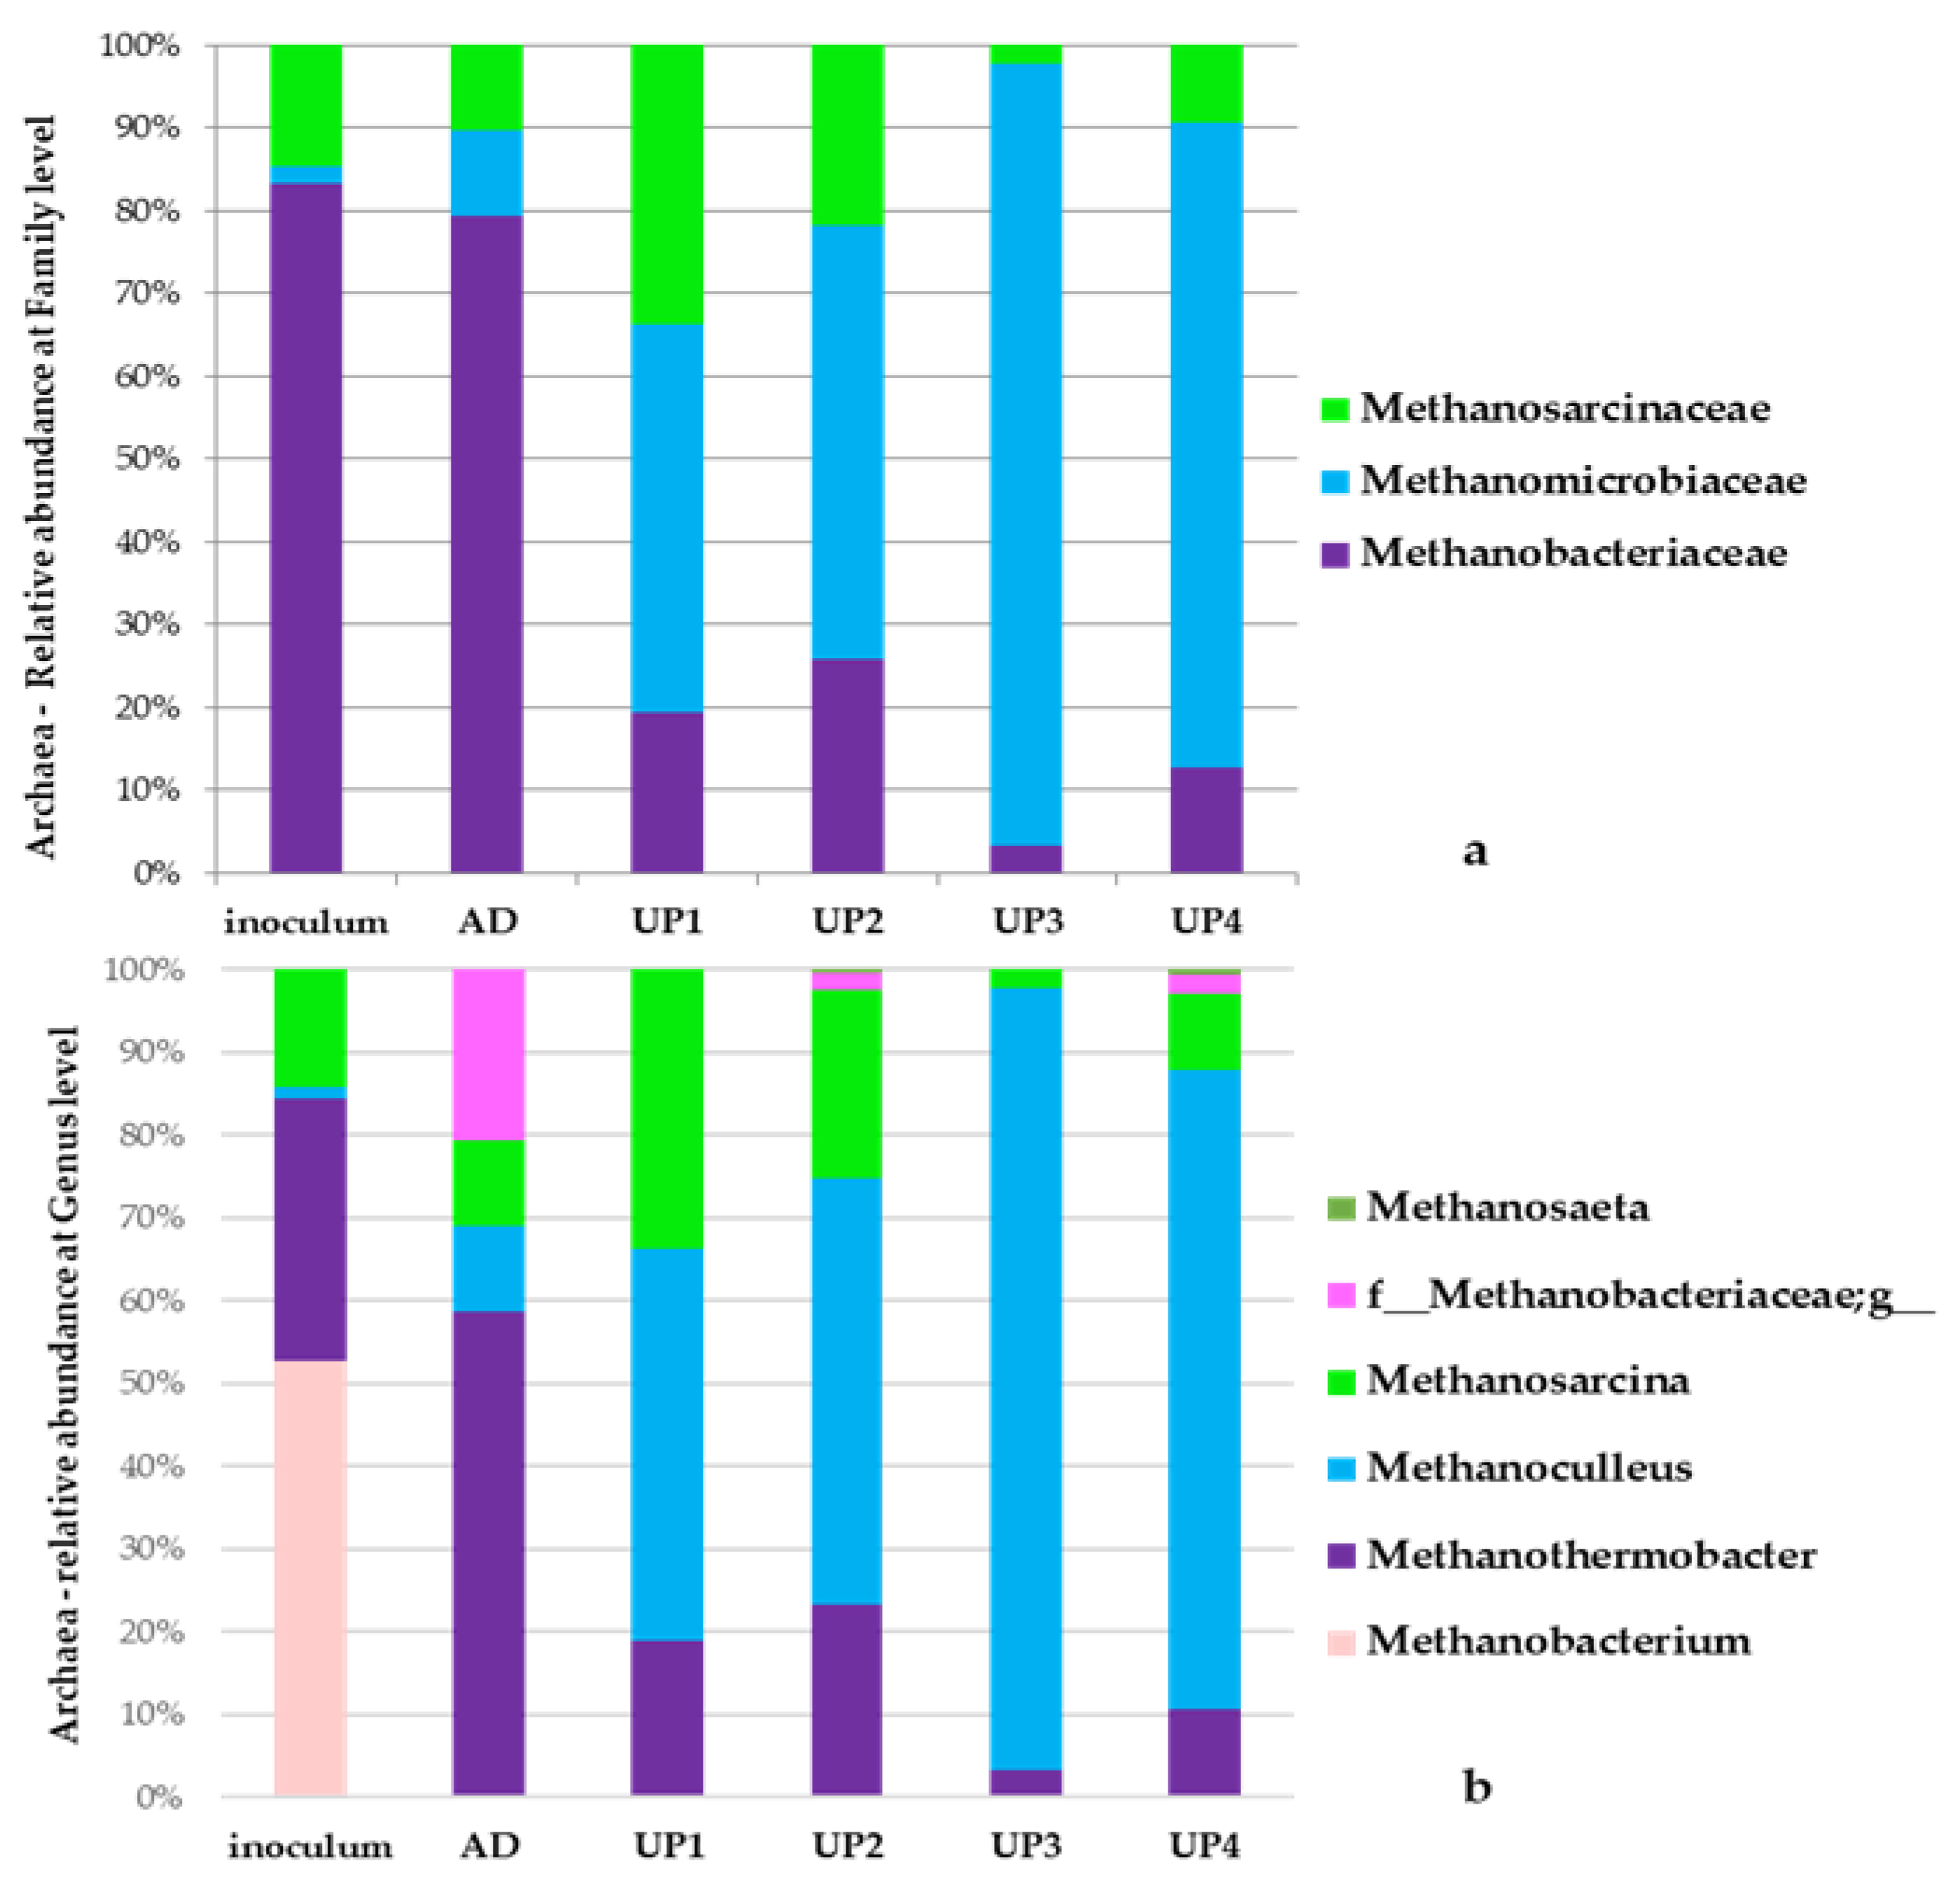
3.5. Archaea Communities

Euryarchaeota were found as the unique phylum belonging to the Archaea domain. Figure 5 shows the relative abundances at family (a) and genus (b) levels.
Members of the Methanobacteriaceae family (83%) dominated in the sludge used as inoculum, and they included the Methanotermobacter (32%) and Methanobacterium (53%) genera, with the former identified as M. thermautotrophicus at species level. The inoculum was also characterized by a small community of methanogens belonging to the Methanomicrobiaceae family (2%) and entirely identified as the Methanoculleus genus (Figure 5b). Therefore, a dominant hydrogenotrophic ‘core’ was active for methane production in the inoculum sample. According to Treu, this pathway is driven by the saline characteristic of cheese whey [33]. In addition, members of the Methanosarcinaceae family were identified at low abundance (15%), and they all belonged to the Methanosarcina genus. Methanosarcina microorganisms are considered stabilizers of the AD process due to their ability to switch their metabolic pathway from acetoclastic to hydrogenotrophic methanogenesis, for example, when H2 partial pressure increases [41].
In the AD phase, the Methanobacteriaceae family showed a little decrease to 75%; however, more interestingly, the archaea microorganisms showed a significantly different distribution at genus level (Figure 5b). Indeed, within the Methanobacteriaceae family, the archaea of Methanobacterium genus disappeared, while M. thermautotrophicus (Methanotermobacter genus) increased up to 56%, and a new group of methanogens not identified at genus level but always belonging to the same family were identified (20%). At the same time, the less represented community of the Methanoculleus genus, inside the Methanomicrobiaceae family, increased up to 10%, and methanogens of the Methanosarcinaceae family (genus Methanosarcinaceae) decreased to 10%. The main changes observed in the community of methanogens during the AD phase highlighted that the Methanobacterium community was entirely replaced by a new hydrogenotrophic community, represented both by Methanoculleus and a new community not identified at genus level. The methanogens’ community was further modified by the introduction of hydrogen to the GSTR during the UP1–UP4 phases. Methanogens of the Methanoculleus genus progressively increased in UP1 (47%) and UP2 (52%) until they became dominant in UP3 (94%) and UP4 (77%). At the same time, members of Methanotermobacter decreased to 19%, 23%, 3% and 10% in UP1, UP2, UP3 and UP4, respectively, and members of the unidentified genus belonging to the Methanobacteriaceae family disappeared, showing a low representativeness of 2% in both the UP2 and UP4 phases. Methanogens of the Methanosarcina genus increased up to 33% and 22% in the UP1 and UP2 phases, and they decreased to 2% and 9% in UP3 and UP4, respectively. The main structural and functional shifts in the archaea during the introduction of hydrogen to the GSTR identified two defined profiles of communities, one characterizing UP1–UP2 and the other characterizing the UP3–UP4 phases. In the UP1–UP2 profile, the community was mainly represented by Methanothermobacter and Methanoculleus, both hydrogenotrophic archaea, coexisting with the acetoclastic Methanosarcina methanogens, and all archaea synergically produced a stable process. Indeed, low amounts of acetic acid (32 ± 1.5 mgL−1 and 41 ± 7 mgL−1) were detected in both phases as compared to AD (33 ± 1.8 mgL−1) (Table 3). The increment of inlet hydrogen flow rate and pH from 1.18 ± 0.01 L LR−1 d−1 and 7.81 ± 0.20 L LR−1 d−1 (UP1) to 1.47 ± 0.01 L LR−1 d−1 and 8.12 ± 0.18 L LR−1 d−1 (UP2), respectively, did not significantly affect the methanogenic metabolic pathways occurring during the UP1 and UP2 phases. The archaea profile of UP3–UP4 was dominated by the hydrogenotrophic Methanoculleus genus that took advantage over the acetoclastic methanogens of Methanosarcina. The dominance of the hydrogenotrophic Methanoculleus genus is in agreement with other studies on biomethanation that revealed its presence in the effluent of digesters [31,33], but also in the methanogenic biofilm grown on the carrier material inside digesters [39]. Methanoculleus’ dominance in our experimental system was favored by the efficiency increase in hydrogen utilization (ηH2, Table 3) occurring at a higher biogas recirculation rate (Table 3). Moreover, during the UP3 and UP4 phases, the acetoclastic community of Methanosarcina significantly decreased, and acetic acid accumulated in the GSTR (159 ± 15 mgL−1 and 358 ± 10 mgL−1, respectively).

4. Conclusions

The current research showed the potential of the GSTR configuration to perform in situ biomethanation by increasing gas recirculation rates. The higher MER value of 0.37 LCH4 LR−1 d−1 was obtained at agas recirculation rate of 235 L LR−1 d−1. The organic matter removal was not compromised by H2 supply, but an increase in acetic acid concentration was observed.
The composition of the gas outflow showed CH4, H2 and CO2 contents of 75%, 19.5% and 5.44%, respectively. A lower MER value (0.16 LCH4 LR−1 d−1) and a comparable CH4 content (73%) were obtained by a CSTR configuration implemented with a hollow fibre-membrane module submerged in the reactor, and by gas recirculation. Then, the immobilization strategy used in this study played a significant role in extending the gas–liquid contact area.
The bacteria community characterizing the sludge used as inoculum was able to easily adapt to the GSTR. During the hydrogen addition phases, the bacterial community represented by microorganisms of SHA-31 and Pirellulaceae families had advantages over bacteria of the Lachnospiraceae family, which was detected with high abundance in the AD phase. This structural shift suggested that new syntrophic relationships were created within the GSTR between the bacteria and archaea communities. Indeed, relevant changes characterized the methanogenic community. The hydrogenotrophic community of the sludge used as inoculum was replaced by a new hydrogenotrophic community that developed during the AD phase and that was dominated by methanogens of Methanothermobacter. During the biomethanation process occurring in the UP1 and UP2 phases, a mixed community of both acetoclastic (Methanosarcina) and new hydrogenotrophic methanogens (Methanoculleus) evolved. A subsequent metabolic shift toward the dominance of the hydrogenotrophic methanogens Methanoculleus occurred in the next UP3 and UP4 phases.
Further research is needed to elucidate the exact role of the packing area in the gas–liquid mass transfer. Moreover, a deeper insight into both the role and the function of the microbial community inside the packing area will help us to understand the syntrophic relationships regulating in situ biomethanation.

Author Contributions

Conceptualization, A.S., S.R. and G.L.; methodology, G.L. and A.S.; investigation, G.L. and A.S.; data curation, G.L., S.R. and A.S.; writing—original draft preparation, G.L.; writing—review and editing, S.R., A.S. and A.M.; visualization, S.R. and A.S.; supervision, A.S., S.R. and A.M. All authors have read and agreed to the published version of the manuscript.

Funding

This research received national funding from AdP ENEA-MISE Project “Ricerca di sistema elettrico” (2019–2021).

Data Availability Statement

Data are contained within the article.

Conflicts of Interest

The authors declare no conflict of interest.

Abbreviations

ADAnaerobic digestion
CHPCombined heat and power units
CSTRContinuously stirred tank reactor
GSTRGas-stirred tank reactor
HDPEHigh-density polietylene
HFMHollow fiber membrane
HPLCHigh-pressure liquid chromatography
HRTHydraulic retention time
MERMethane evolution rate
NaClSodium chloride
OLROrganic loading rate
SAOSyntrophic acetate oxidation
SCWSecond cheese whey
UPUpgrading phase
VFAVolatile fatty acid
VSVolatile solids
Symbols
η H2H2 conversion efficiency
rtH2 gas-liquid mass transfer rate
LRReactor Working volume (L)
KHHenry’s constant
LH2Volume of H2
LCH4Volume of CH4
RH2Volumetric hydrogen mass transfer rate
(KLa)H2Volumetric hydrogen mass coefficient
CH2,GGaseous hydrogen concentration
CH2,LDissolved hydrogen concentration

References

  1. Osman, A.I.; Chen, L.; Yang, M.; Msigwa, G.; Farghali, M.; Fawzy, S.; Rooney, D.W.; Yap, P.S. Cost, environmental impact, and resilience of renewable energy under a changing climate: A review. Environ. Chem. Lett. 2022, 21, 741–764. [Google Scholar] [CrossRef]
  2. Chen, L.; Msigwa, G.; Yang, M.; Osman, A.I.; Fawzy, S.; Rooney, D.W.; Yap, P.S. Strategies to achieve a carbon neutral society: A review. Environ. Chem. Lett. 2022, 20, 2277–2310. [Google Scholar] [CrossRef] [PubMed]
  3. Farghali, M.; Osman, A.I.; Umetsu, K.; Rooney, D.W. Integration of biogas systems into a carbon zero and hydrogen economy: A review. Environ. Chem. Lett. 2022, 20, 2853–2927. [Google Scholar] [CrossRef]
  4. Kougias, P.G.; Angelidaki, I. Biogas and its opportunities—A review. Front. Environ. Sci. Eng. 2018, 12, 14. [Google Scholar] [CrossRef]
  5. Ghaib, K.; Ben-Fares, F.Z. Power-to-Methane: A state-of-the-art review. Renew. Sustain. Energy Rev. 2018, 81, 433–446. [Google Scholar] [CrossRef]
  6. Kapoor, R.; Ghosh, P.; Kumar, M.; Vijay, V.K. Evaluation of biogas upgrading technologies and future perspectives: A review. Environ. Sci. Pollut. Res. 2019, 26, 11631–11661. [Google Scholar] [CrossRef]
  7. Bassani, I.; Kougias, P.G.; Treu, L.; Porté, H.; Campanaro, S.; Angelidaki, I. Optimization of hydrogen dispersion in thermophilic up-flow reactors for ex situ biogas upgrading. Bioresour. Technol. 2017, 234, 310–319. [Google Scholar] [CrossRef]
  8. Vo, T.T.Q.; Wall, D.M.; Ring, D.; Rajendran, K.; Murphy, J.D. Techno-economic analysis of biogas upgrading via amine scrubber, carbon capture and ex-situ methanation. Appl. Energy 2018, 212, 1191–1202. [Google Scholar] [CrossRef]
  9. Luo, G.; Angelidaki, I. Co-digestion of manure and whey for in situ biogas upgrading by the addition of H2: Process performance and microbial insights. Appl. Microbiol. Biotechnol. 2013, 97, 1373–1381. [Google Scholar] [CrossRef]
  10. Thauer, R.K.; Jungermann, K.; Decker, K. Energy conservation in chemotrophic anaerobic bacteria. Bacteriol. Rev. 1977, 41, 100–180. [Google Scholar] [CrossRef]
  11. Zabranska, J.; Pokorna, D. Bioconversion of carbon dioxide to methane using hydrogen and hydrogenotrophic methanogens. Biotechnol. Adv. 2018, 36, 707–720. [Google Scholar] [CrossRef]
  12. Alfaro, N.; Fdz-Polanco, M.; Fdz-Polanco, F.; Díaz, I. H2 addition through a submerged membrane for in-situ biogas upgrading in the anaerobic digestion of sewage sludge. Bioresour. Technol. 2019, 280, 1–8. [Google Scholar] [CrossRef]
  13. Narayanan, C.M.; Narayan, V. Biological wastewater treatment and bioreactor design: A review. Sustain. Environ. Res. 2019, 1, 33. [Google Scholar] [CrossRef] [Green Version]
  14. Voelklein, M.A.; Rusmanis, D.; Murphy, J.D. Biological methanation: Strategies for in-situ and ex-situ upgrading in anaerobic digestion. Appl. Energy 2019, 235, 1061–1071. [Google Scholar] [CrossRef]
  15. Angelidaki, I.; Treu, L.; Tsapekos, P.; Luo, G.; Campanaro, S.; Wenzel, H.; Kougias, P.G. Biogas upgrading and utilization: Current status and perspectives. Biotechnol. Adv. 2018, 36, 452–466. [Google Scholar] [CrossRef] [Green Version]
  16. Ullrich, T.; Lindner, J.; Bär, K.; Mörs, F.; Graf, F.; Lemmer, A. Influence of operating pressure on the biological hydrogen methanation in trickle-bed reactors. Bioresour. Technol. 2018, 247, 7–13. [Google Scholar] [CrossRef]
  17. Luo, G.; Johansson, S.; Boe, K.; Xie, L.; Zhou, Q.; Angelidaki, I. Simultaneous hydrogen utilization and in situ biogas upgrading in an anaerobic reactor. Biotechnol. Bioeng. 2012, 109, 1088–1094. [Google Scholar] [CrossRef]
  18. Luo, G.; Angelidaki, I. Hollow fiber membrane based H2 diffusion for efficient in situ biogas upgrading in an anaerobic reactor. Appl. Microbiol. Biotechnol. 2013, 97, 3739–3744. [Google Scholar] [CrossRef]
  19. Agneessens, L.M.; Ottosen, L.D.M.; Voigt, N.V.; Nielsen, J.L.; de Jonge, N.; Fischer, C.H.; Kofoed, M.V.W. In-situ biogas upgrading with pulse H2 additions: The relevance of methanogen adaption and inorganic carbon level. Bioresour. Technol. 2017, 233, 256–263. [Google Scholar] [CrossRef]
  20. Zhao, J.; Li, Y.; Dong, R. Recent progress towards in-situ biogas upgrading technologies. Sci. Total Environ. 2021, 800, 149667. [Google Scholar] [CrossRef]
  21. Lecker, B.; Illi, L.; Lemmer, A.; Oechsner, H. Biological hydrogen methanation—A review. Bioresour. Technol. 2017, 245, 1220–1228. [Google Scholar] [CrossRef]
  22. Burkhardt, M.; Busch, G. Methanation of hydrogen and carbon dioxide. Appl. Energy 2013, 111, 74–79. [Google Scholar] [CrossRef]
  23. Rachbauer, L.; Voitl, G.; Bochmann, G.; Fuchs, W. Biological biogas upgrading capacity of a hydrogenotrophic community in a trickle-bed reactor. Appl. Energy 2016, 180, 483–490. [Google Scholar] [CrossRef]
  24. Kougias, P.G.; Tsapekos, P.; Treu, L.; Kostoula, M.; Campanaro, S.; Lyberatos, G.; Angelidaki, I. Biological CO2 fixation in up-flow reactors via exogenous H2 addition. J. Biotechnol. 2020, 319, 1–7. [Google Scholar] [CrossRef] [PubMed]
  25. Lembo, G.; Rosa, S.; Miritana, V.M.; Marone, A.; Massini, G.; Fenice, M.; Signorini, A. Thermophilic anaerobic digestion of second cheese whey: Microbial community response to H2 addition in a partially immobilized anaerobic hybrid reactor. Processes 2021, 9, 43. [Google Scholar] [CrossRef]
  26. Schink, B. Energetics of syntrophic cooperation in methanogenic degradation. Microbiol. Mol. Biol. Rev. 1997, 61, 262–280. [Google Scholar]
  27. Labatut, R.A.; Angenent, L.T.; Scott, N.R. Conventional mesophilic vs. thermophilic anaerobic digestion: Atrade-off between performance and stability? Water Res. 2014, 53, 249–258. [Google Scholar] [CrossRef]
  28. Zhu, X.; Chen, L.; Chen, Y.; Cao, Q.; Liu, X.; Li, D. Differences of methanogenesis between mesophilic and thermophilic in situ biogas-upgrading systems by hydrogen addition. J. Ind. Macrobiol. Biotecnol. 2019, 46, 1569–1581. [Google Scholar] [CrossRef]
  29. Baird, B.; Eaton, D.A.; Rice, E.W. Standard Methods for the Examination of Water and Wastewater; APHA: Washington, DC, USA, 2017; Volume 23. [Google Scholar]
  30. Díaz, I.; Pérez, C.; Alfaro, N.; Fdz-Polanco, F. A feasibility study on the bioconversion of CO2 and H2 to biomethane by gas sparging through polymeric membranes. Bioresour. Technol. 2015, 185, 246–253. [Google Scholar] [CrossRef]
  31. Agneessens, L.M.; Ottosen, L.D.M.; Andersen, M.; Berg Olesen, C.; Feilberg, A.; Kofoed, M.V.W. Parameters affecting acetate concentrations during in-situ biological hydrogen methanation. Bioresour. Technol. 2018, 258, 33–40. [Google Scholar] [CrossRef]
  32. Mulat, D.G.; Mosbæk, F.; Ward, A.J.; Polag, D.; Greule, M.; Keppler, F.; Nielsen, J.L.; Feilberg, A. Exogenous addition of H2 for an in situ biogas upgrading through biological reduction of carbon dioxide into methane. Waste Manag. 2017, 68, 146–156. [Google Scholar] [CrossRef]
  33. Treu, L.; Tsapekos, P.; Peprah, M.; Campanaro, S.; Giacomini, A.; Corich, V.; Kougias, P.G.; Angelidaki, I. Microbial profiling during anaerobic digestion of cheese whey in reactors operated at different conditions. Bioresour. Technol. 2019, 275, 375–385. [Google Scholar] [CrossRef]
  34. Kougias, P.G.; Treu, L.; Benavente, D.P.; Boe, K.; Campanaro, S.; Angelidaki, I. Ex-situ biogas upgrading and enhancement in different reactor systems. Bioresour. Technol. 2017, 225, 429–437. [Google Scholar] [CrossRef]
  35. Jabari, L.; Gannoun, H.; Cayol, J.L.; Hamdi, M.; Fauque, G.; Ollivier, B.; Fardeau, M.L. Characterization of Defluviitalea saccharophila gen. nov., sp. nov., a thermophilic bacterium isolated from an upflow anaerobic filter treating abattoir wastewaters, and proposal of defluviitaleaceae fam. nov. Int. J. Syst. Evol. Microbiol. 2012, 62, 550–555. [Google Scholar] [CrossRef]
  36. Fontana, A.; Campanaro, S.; Treu, L.; Kougias, P.G.; Cappa, F.; Morelli, L.; Angelidaki, I. Performance and genome-centric metagenomics of thermophilic single and two-stage anaerobic digesters treating cheese wastes. Water Res. 2018, 134, 181–191. [Google Scholar] [CrossRef]
  37. Li, D.; Ran, Y.; Chen, L.; Cao, Q.; Li, Z.; Liu, X. Instability diagnosis and syntrophic acetate oxidation during thermophilic digestion of vegetable waste. Water Res. 2018, 139, 263–271. [Google Scholar] [CrossRef]
  38. Rivière, D.; Desvignes, V.; Pelletier, E.; Chaussonnerie, S.; Guermazi, S.; Weissenbach, J.; Li, T.; Camacho, P.; Sghir, A. Towards the definition of a core of microorganisms involved in anaerobic digestion of sludge. ISME J. 2009, 3, 700–714. [Google Scholar] [CrossRef] [Green Version]
  39. Nelson, M.C.; Morrison, M.; Yu, Z. A meta-analysis of the microbial diversity observed in anaerobic digesters. Bioresour. Technol. 2011, 102, 3730–3739. [Google Scholar] [CrossRef]
  40. Treu, L.; Campanaro, S.; Kougias, P.G.; Sartori, C.; Bassani, I.; Angelidaki, I. Hydrogen-fueled microbial pathways in biogas upgrading systems revealed by genome-centric metagenomics. Front. Microbiol. 2018, 9, 1079. [Google Scholar] [CrossRef] [Green Version]
  41. Braga Nan, L.; Trably, E.; Santa-Catalina, G.; Bernet, N.; Delgenès, J.P.; Escudié, R. Biomethanation processes: New insights on the effect of a high H2partial pressure on microbial communities. Biotechnol. Biofuels 2020, 13, 141. [Google Scholar] [CrossRef]
Figure 1. Daily time courses of biogas H2, CH4, CO2 flow rates of all experimental phases.
Energies 16 03296 g001
Figure 2. Biogas composition: H2, CH4, CO2 (%), during all experimental phases.
Energies 16 03296 g002
Figure 3. Relative abundances of the bacteria community at phylum level in the sludge used as inoculum, at the end of AD and UP1 and UP4 phases. Communities with a relative abundance ≥ 1% in at least one sample are reported.
Energies 16 03296 g003
Figure 4. Relative abundances of bacteria community at family level in the sludge used as inoculum, at the end of AD and UP1, UP2, UP3, UP4 phases. Communities with a relative abundance ≥1% (in at least one sample) are reported.
Energies 16 03296 g004
Figure 5. Relative abundance of the archaea community at the family (a) and genus (b) levels, both in the sludge used as inoculum and at the end of the AD and UP1, UP2, UP3, UP4 phases. Communities with a relative abundance >1% in at least one sample are reported.
Energies 16 03296 g005
Table 1. Main characteristics of second cheese whey (SCW) used in this study.
IndicatorsRange
pH5.9–6.2
Lactose (gL−1)40–60
Total Solids (TS) (gL−1)47–64
Volatile Solids (VS) (gL−1)40–54
COD (gL−1)45–70
Proteins (gL−1)0.45–0.90
NH4+ (gL−1)0.10–0.12
Total Volatile fatty acids (TVFAs) (gL−1)1.5–2.5
Table 2. Scheme of the different experimental phases.
ParametersADUP1UP2UP3UP4
OLR (g VS LR−1 d−1)1.20 ± 0.021.16 ± 0.081.16 ± 0.051.26 ± 0.091.28 ± 0.08
H2In Flow rate (LH2 LR−1 d−1)/1.18 ± 0.011.47 ± 0.011.47 ± 0.011.47 ± 0.01
Biogas recirculation rate (L LR−1 d−1)118 ± 5118 ± 5118 ± 5176 ± 5235 ± 5
Table 3. Reactor performances at the end of upgrading (UP1, UP2, UP3, UP4) and AD phases.
ParametersADUP1UP2UP3UP4
Biogasout production rate (L LR−1 d−1)0.58 ± 0.030.93 ± 0.010.97 ± 0.050.96 ± 0.060.87 ± 0.03
H2out%/31.64 ± 0.9634.3 ± 0.6726.2 ± 1.8619.5 ± 0.14
CH4out%49.3 ± 2.356.6 ± 0.8960.6 ±1.5266.6 ± 2.4375.0 ± 0.83
CO2out%50.7 ± 2.313.7 ± 0.598.04 ± 1.877.17 ± 2.235.44 ± 0.93
H2out Flow rate (L LR−1 d−1)/0.29 ± 0.010.33 ± 0.010.25 ± 0.020.17 ± 0.001
CH4out Flow rate (L LR−1 d−1)0.29 ± 0.010.53 ± 0.010.59 ± 0.020.64 ± 0.020.66 ± 0.02
CO2out Flow rate (L LR−1 d−1)0.3 ± 0.030.13 ± 0.010.08 ± 0.020.07 ± 0.030.05 ± 0.01
rt (L LR−1 d−1)/0.881.141.221.30
η H2 (%)/75778388
MER (LCH4 LR−1 d−1) /0.240.300.350.37
Lactose (mg/L)224 ± 13168 ± 12148 ± 13159 ± 6.85172 ± 10
Acetic Acid (mg/L)33 ± 1.832 ± 1.541 ± 7159 ± 15358 ± 10
pH7.1 ± 0.147.81 ± 0.208.12 ± 0.188.2 ± 0.158.24 ± 0.10
VS Effluent (g/L)4.78 ± 0.154.76 ± 0.124.81 ± 0.144.96 ± 2.14.85 ± 0.45
Table 4. Alpha diversity and evenness indices (Simpson and Shannon) of the bacteria community, calculated for all samples.
SamplesDiversityEvenness
SimpsonShannonSimpsonShannon
(1-D)(H)(1/DS)(H/ln(S))
Inoculum0.852.230.310.72
AD0.771.670.210.55
UP10.872.130.430.74
UP20.821.970.310.68
UP30.852.000.380.69
UP40.831.980.260.64
Disclaimer/Publisher’s Note: The statements, opinions and data contained in all publications are solely those of the individual author(s) and contributor(s) and not of MDPI and/or the editor(s). MDPI and/or the editor(s) disclaim responsibility for any injury to people or property resulting from any ideas, methods, instructions or products referred to in the content.

