Article

Microgrid Energy Management for Smart City Planning on Saint Martin’s Island in Bangladesh †

1
Department of Textile Machinery Design and Maintenance, Bangladesh University of Textiles, Dhaka 1208, Bangladesh
2
Department of Energy, Environment and Climate Change, Asian Institute of Technology, Pathum Thani 12120, Thailand
3
School of Electrical and Data Engineering, University of Technology Sydney, Sydney, NSW 2007, Australia
*
Author to whom correspondence should be addressed.
This paper is an extended version of our paper published in 2022 IEEE International Conference and Utility Exhibition, Pattaya, Thailand, 26–28 October 2022; pp. 1–16.
Energies 2023, 16(10), 4088; https://doi.org/10.3390/en16104088
Submission received: 24 March 2023 / Revised: 1 May 2023 / Accepted: 11 May 2023 / Published: 14 May 2023
(This article belongs to the Section A: Sustainable Energy)

Abstract

:
An enormous number of domestic and international tourists visit Saint Martin’s Island in Bangladesh annually. Unfortunately, the lack of proper planning as well as severe electricity shortages are hampering its development towards a smart city. This study proposes a smart city model for the remote area with a grid-independent microgrid to meet the rising load demand. It demonstrates that implementation of the Internet of things can effectively utilize the resources of Saint Martin following the smart city criteria. The distributed energy resources have been optimized to identify the best microgrid configuration that complies with Sustainable Development Goal 7. Finally, nonlinear simulations are carried out to compare the stability of the proposed systems. The study outlines the benefits of employing eco wave power and second-life batteries, as well as the advantages of using a supercapacitor as a speedy responder to disturbances. The research ultimately gives the multidisciplinary knowledge to policymakers that they require to transform a small island like Saint Martin into a tourist-intensive smart city.

1. Introduction

Saint Martin is one of the most popular tourist spots for its natural beauty and as the only coral island in Bangladesh. It is also called Narikel Jinjira which translates to “Coconut Islands” in English. The island comprises the country’s southernmost corner and is located about 18 km south of the Cox’s Bazar-Teknaf peninsula. There are 1220 families and about 8000 residents. Around 3000 visitors arrive there each day from both domestic and international destinations [1]. Hotels and bungalows are widely accessible for the comfort of tourists looking for lodging.
With no grid connection, the electrical power crisis is a major problem in St. Martin. Only a portion of the electricity demand is met by the current diesel generator and solar PV system. Many homeowners have installed solar home systems, a popular scheme that can only run low-power lights, fans, and televisions. The typhoon of 1991 entirely destroyed a 120 kVA diesel generator that the Bangladesh Electricity Development Board had commissioned in 1985 [2]. There appears to be low possibility of grid connection from the mainland in the coming years. Submarine cables can transmit power from the national grid but it is extremely expensive. Without gas supply, the locals primarily rely on kerosene, coconut palm leaves, and biomass for cooking, which threatens the island’s biodiversity [3]. Inhabitants’ heavy dependency on wood and charcoals has unavoidably caused deforestation. Privately owned PV and generator electricity is extremely expensive, with costs exceeding 0.59 USD/kWh [4]. Occasionally, it goes up to 6.00 USD per day to use a single light and fan for only 4 h, which is a significant financial burden. The low economic standing of the localities, the periodic increase in diesel prices, and the CO2 emissions from generators indicate that these arrangements should not be completely relied on in the future. Figure 1 displays a map of Saint Martin’s Island in Bangladesh [5].
However, in earlier studies, a smart city concept with sustainable and reliable microgrid configurations has not been explored on Saint Martin’s Island. However, it offers many advantages. Firstly, the framework of a smart city will improve the standard of living for islanders and boost tourism. Secondly, the sustainable microgrid delivers affordable, environmentally friendly, and clean energy. Thirdly, the reliability of a grid-independent microgrid ensures the power quality for varied operating modes due to disturbances.

2. Literature Review

Several studies have been carried out to electrify Saint Martin’s Island in Bangladesh. To meet load demand, they have proposed a range of energy alternatives. A searaser’s theoretical performance was evaluated, and it was determined that by utilizing the available wave-power, it can produce about 35 m of water-head [6]. The intended plant’s capacity was calculated using a tourism planning model to be roughly 144 kW. Searasers are affordable and capable of lowering greenhouse gas emissions. The lowest energy cost was 0.253 USD/kWh, according to the researchers, who studied a PV/DEG/Battery hybrid microgrid for 18 hotels [7]. A hybrid microgrid with a PV/FC/DEG system that could satisfy a primary load of 80 kWh/day and a peak demand of 14 kW was studied [8]. With a renewable contribution of 94%, the optimized system can produce energy at 0.317 USD/kWh. The study identified the ideal combinations of solar PV, wind turbines, diesel engines, and batteries to meet the needs of 100 families and ten enterprises [9]. This design, which has a 31% renewable portion, has the lowest cost per kWh at USD 0.345 and a net present cost of BDT 10,620,388. This method can prevent about 14 tons of CO2 from being released annually when compared to a diesel generator. The performance of the four microgrid topologies has been evaluated in the context of smart cities [10], but supercapacitors are not included in the configurations. At the same time, it fails to address the correct method of communication with the stakeholders in the context of smart cities. The recommended PV/Biogas/Diesel hybrid system can provide islanders with affordable, dependable, and environmentally friendly electricity [11]. The greatest cost-effective solar, wind, biogas, and diesel microgrid offered in the literature has a capacity of 1.3 MW and an energy cost of 0.193 USD/kWh [12]. Thus, Saint Martin has not been the focus of any research on smart cities with a microgrid, but has simply provided energy models for conventional towns. As the quality of life for individuals gets better, the idea of smart cities continues to grow in popularity and is being recognized by many leaders around the world. However, there are several obstacles to implementing the idea in practice, such as a lack of investment, visionary leadership, good governance, support from the public, general awareness, and a model for the available resources [13,14,15]. For applications in smart cities, the levelized cost of electricity has been calculated for sustainable microgrids [16]. A study showed that a sustainable microgrid system has the advantage of supplying electricity to Tunda Island continuously [17]. The modern consumption and generation configurations demonstrated the employment of a microgrid in the context of Spain’s Smart City [18].
However, the infrastructure of information and communication technology is the main driving force behind the rapid growth of smart cities. Figure 2 shows the use of the Internet of things in a smart city context [19]. It receives data and, after evaluating, performs operations intelligently, providing feedback to increase the efficiency of things without any need for human engagement. The common architectures in the IoT include four levels, called the sensing, transmission, data management, and application layers. Moreover, security options are included in each layer [20]. All physical objects are connected to sensor layers for data collection. The transmission layers enable data transmission through Wi-Fi, Zig-Bee, and 5G networks. A cloud computing system stores and processes the data. Finally, the application layer oversees smart applications such as smart homes, smart farming, and traffic management. Numerous challenges exist in the implementation of the Internet of things, such as private information leakage, unauthorized interference, object identification and management, energy optimization, and so on [21]. New technology for city management emerges every day.
On the other hand, the energy network is essential in the design of smart cities because it keeps everything alive and connected. One of a smart city’s most crucial components is the harmony between energy supply and demand through power lines. Many pathways for energy transmission between sources and sinks are created by the network. Figure 3 depicts how an energy system is designed [22]. Models use information like prices, geography, energy regulatory restrictions, and the availability of resources. The energy flow diagram focuses specific emphasis on renewable resources, such as solar, wind, geothermal, hydropower, ocean, and biofuels, for their low carbon footprint and environmental advantages [23].
In order to provide citizens with improved services, the energy network’s multi-objective functions are also optimized. The most widely used software tools for optimizing the energy system include Energy PLAN, HOMER, Energy Hub, and TRNSYS. Grid-independent microgrid optimization has been successfully optimized using the HOMER tool. Numerous dispatch strategies are implemented by the HOMER tools, such as the load-following method, the cyclic charging mechanism, and the combination of both [24]. Only the load-following dispatch strategy will be used in this work.
The UN General Assembly announced 17 Sustainable Development Goals in 2015. Sustainable Development Goal 7 aims to ensure that everyone has access to affordable, reliable, clean, and renewable energy [25]. Energy access is a critical element of people’s health along with economic development and the eradication of poverty. The goal will increase energy effectiveness while boosting the share of renewable energy in the global energy market by 2030. Hence, more study into technological development and infrastructure improvement are needed to offer energy flexibility. In this case, a hybrid energy system called a microgrid might be employed to provide a remote or rural population with clean electricity [26]. Bangladesh is concentrating on implementing their particular initiatives into practice in support of SDG 7.
Moreover, a microgrid evaluation remains incomplete if it does not consider both technical and financial factors. The time domain performance of the microgrid can be assessed using PSCAD/EMTDC software for parametric variation. It is an excellent tool for simulating transients in a power system. It has been used by engineers for microgrid-related research and development for the past 40 years [27]. This software was used to analyze the effects of various integration options for fluctuating generators in the Lençóis Island community’s microgrid [28]. Many built-in components are included in the comprehensive library, making calculations simple [29,30].
From the author’s best knowledge, no research has been conducted about microgrid energy management for smart city planning on Saint Martin’s Island in Bangladesh. Therefore, it is very crucial to propose an IoT-oriented smart city model for this isolated and tourist-intensive area. The microgrid system has to be affordable, sustainable and reliable. The key contributions of the present study are outlined below:
An IoT-driven smart city model is proposed on Saint Martin’s Island for improving the quality of life, economic competitiveness, and environmental sustainability.
The optimal configuration of a microgrid is selected to meet the growing load demand, focusing on the Sustainable Development Goal 7.
The transient performance of selected microgrid designs is compared and analyzed for various operating modes using PSCAD/EMTDC software.

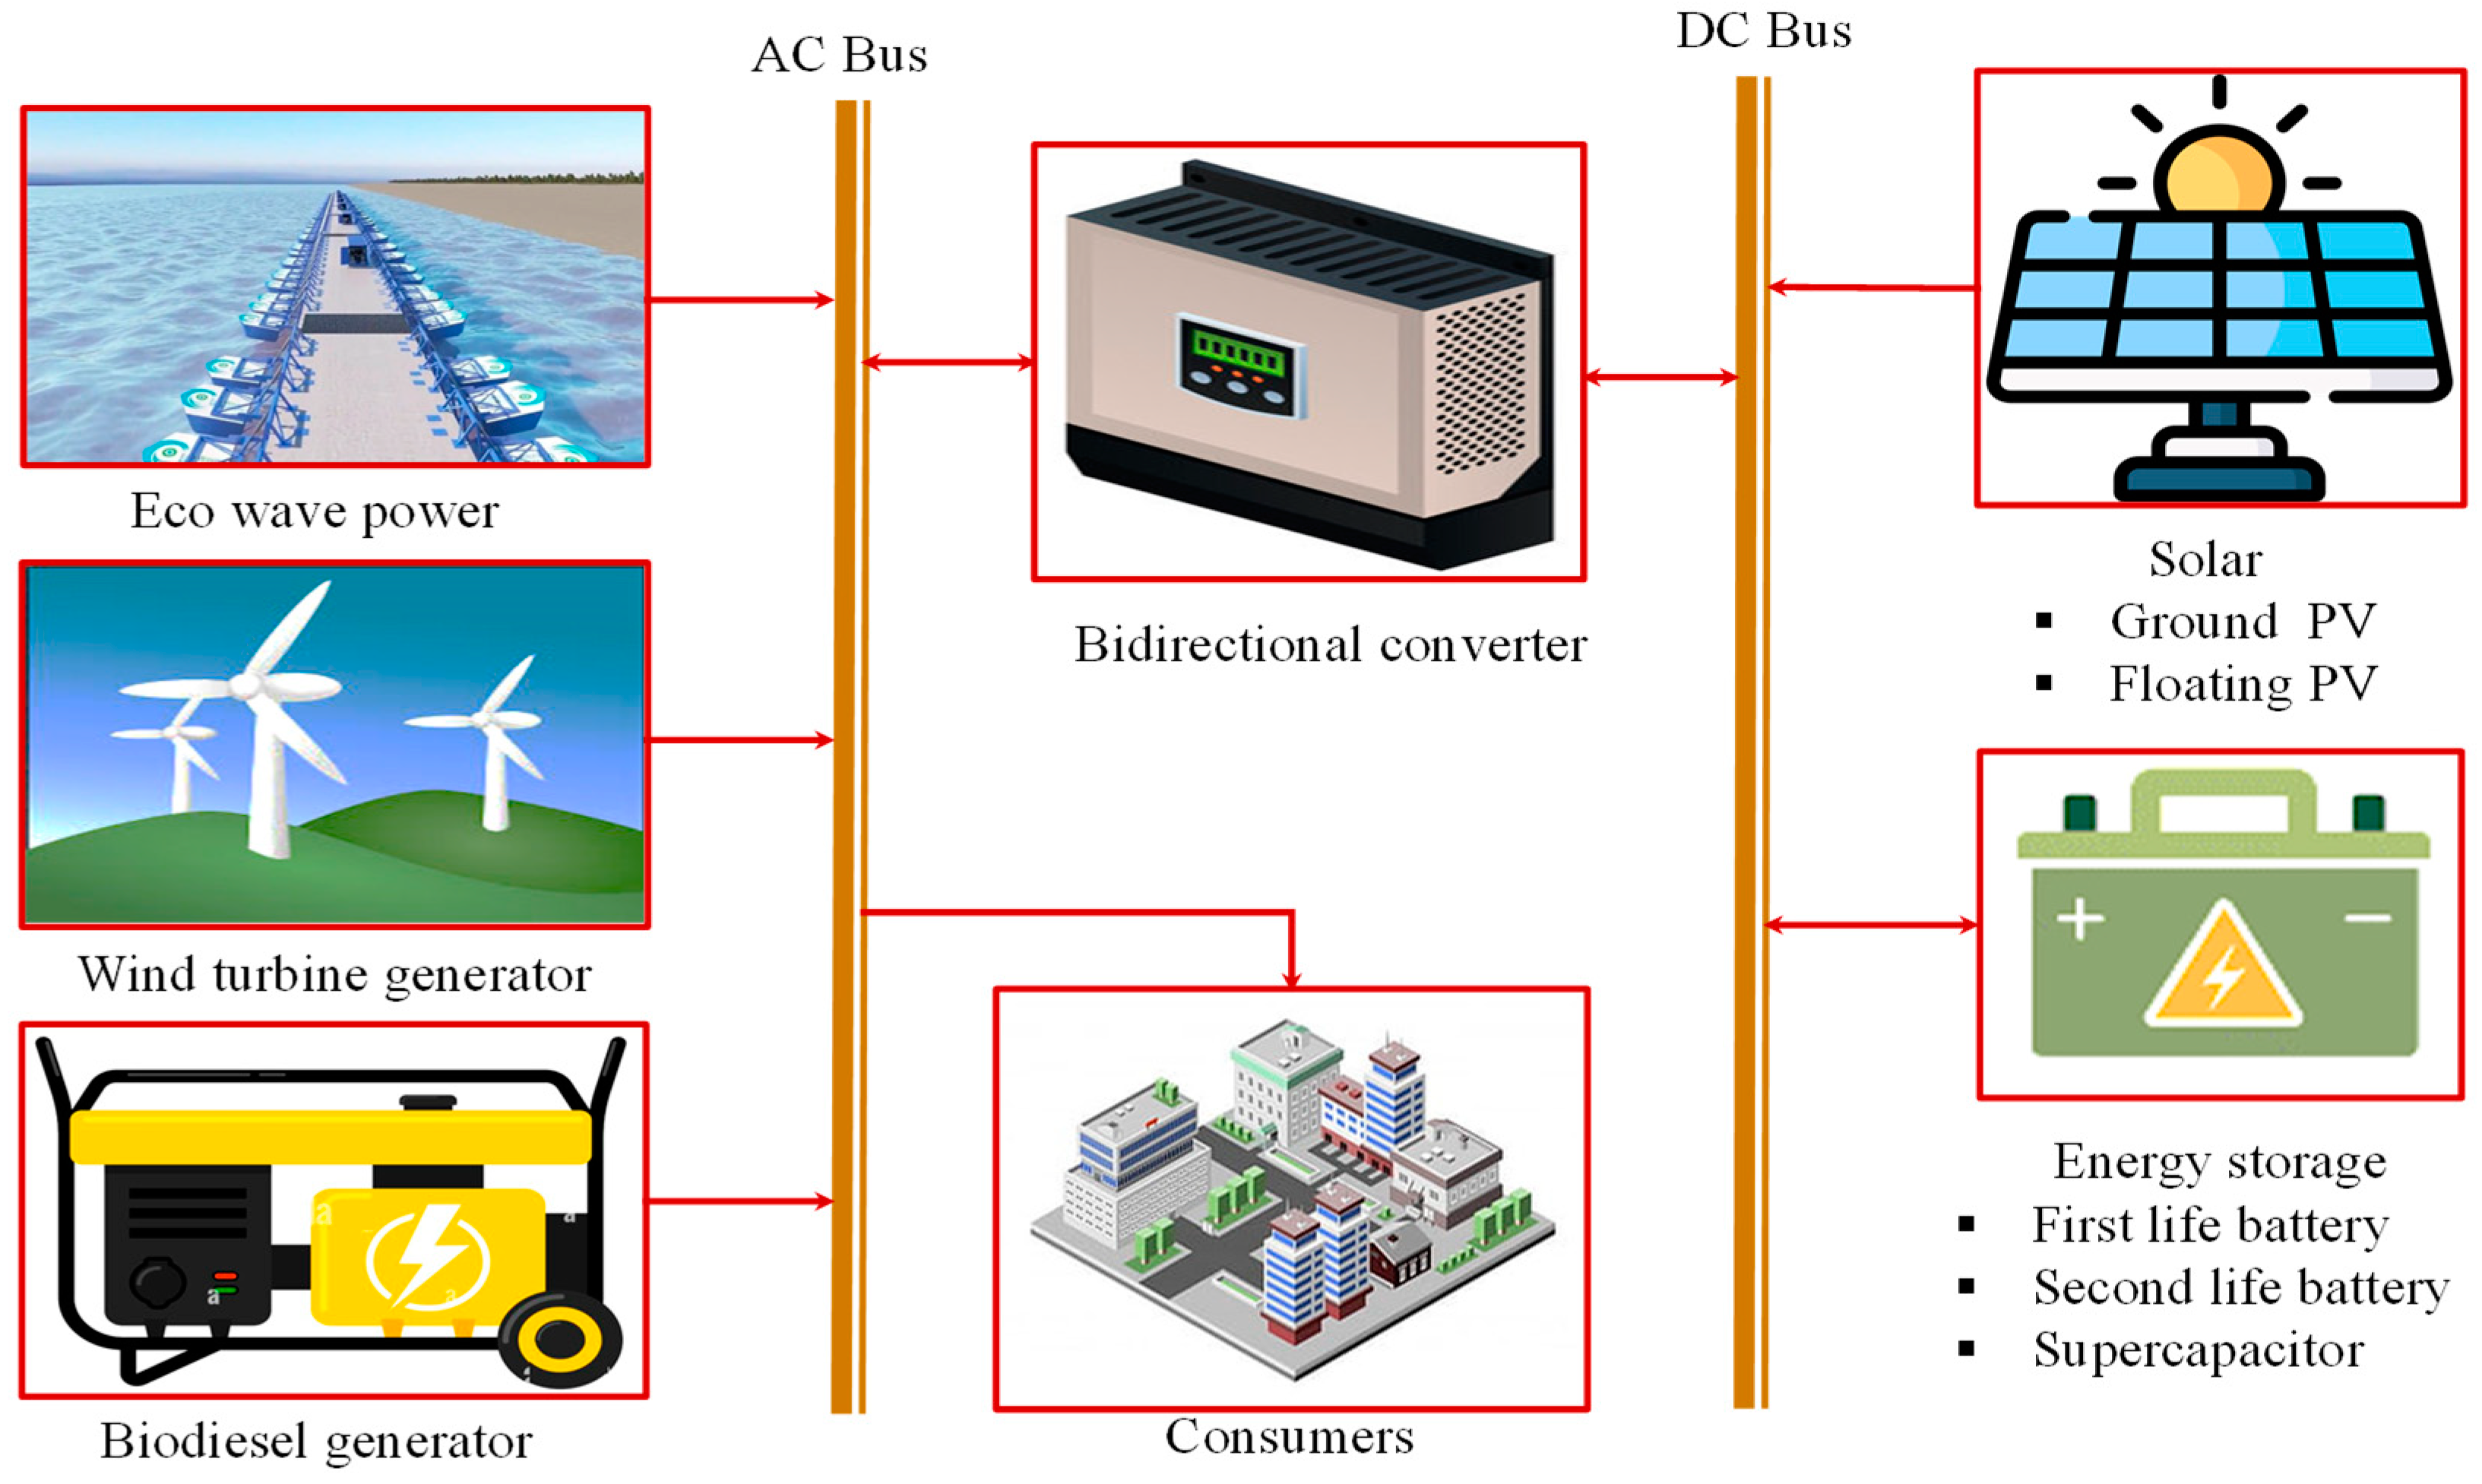
3. Studied Microgrid Architecture

The main components of the studied microgrid consists of ground PV, floating PV, wind turbine generators, eco wave power, bio-diesel generators, bi-directional AC/DC converters, a first-lifefirst-life battery, a second-life battery, supercapacitors and consumers. Each microgrid component is described in Figure 4. The GPV, FPV, and battery are connected to the DC bus, while the WTG, EWP, and BDG are tied to the AC bus. A converter links the AC and DC buses to the battery, which stores energy, to enable bidirectional power transfer. The next sections will provide an overview of the HOMER modeling used for microgrid optimization and the PSCAD/EMTDC modeling utilized for time domain simulation.

4. Microgrid HOMER Modeling

The HOMER modeling equation for microgrid optimization will be explained in this section. The same equations are applied for both ground-based and floating PV, but the parameter values vary. FPV operates at a comparable lower temperature while maintaining an enhanced degree of efficiency because of the cooling effects of water. The amount of solar energy absorbed during the day, the temperature coefficient, and other variables affect the PV output. Equation (1) is used to calculate the hourly output power of solar panels [24,31]:
P P V ( t ) = Y P V f P V × G P V ( t ) G r e f [ 1 + α P ( T P V ( t ) T r e f ) ]
where YPV (kW) = rated capacity of PV array, fPV (%) = derating factor, GPV (kW/m2) = solar irradiation incident on the PV array, Gref (kW/m2) = solar irradiation incident at standard test conditions, αP = coefficient of temperature, TPV (°C) = temperature of PV cell, and Tref (°C) = temperature of PV cell under standard test conditions at 25 °C.
The HOMER adjusts and calculates the wind speed at any hub height (H) using the power law [32]:
v ( t ) = v r e f ( t ) × ( H H r e f ) γ
where, vref = wind velocity measured at reference hub height (Href), and γ = exponents in the power law. Wind conditions are frequently described using the two-parameter Weibull distribution [33]:
f ( v ) = k c ( v c ) k 1 × e x p [ ( v c ) k ]
where v = the speed of wind, k = the Weibull shape factor, and c = the Weibull scale parameter. The turbine output power (PWT) varies dramatically depending on wind speed [24].
P W T ( t ) = { 0   v ( t ) v c u t i n P r × ( v 3 ( t ) v c u t i n 3 v r 3 v c u t i n 3 )   v c u t i n < v ( t ) < v r P r   v r < v ( t ) v c u t o u t 0 v ( t ) v c u t o u t
v(t) = wind velocity, vr = rated wind velocity, vcut-in = cut-in wind velocity, vcut-out = cut-out wind velocity, Pr = rated turbine power.
The Saint Martin Island is surrounded by the ocean known as the Bay of Bengal. The energy can be harvested from ocean wave power. Figure 5 depicts the cutting-edge technology invented by eco wave power to produce electricity from ocean waves. A hydraulic motor, generator, accumulator, piston, floater, and fluid tank make up the major technological components [34,35]. The EWP starts generating electricity when the waves reach a height of 0.5 m. The hydrokinetics model in HOMER is used to simulate eco wave power. For modeling, the water speed is replaced with the wave height.
The generator is powered by biofuel. The fuel curve slope can be used to indicate the marginal fuel consumption. At any time step, Equation (5) can be used to calculate the rate of consumption [37].
F = F 0 .   Y g e n + F 1 . P g e n
F = bio-diesel consumption rate [L/h], F0 = intercept coefficient of bio-diesel curve [L/h/kW rated], F1 = slope of bio-diesel curve [L/h/kW output], Ygen = rated capacity of bio-diesel generator [kW], Pgen = bio-diesel generator output power [kW].
Lithium ions are used for the first and second-life batteries. Supercapacitors, which require one-minute time increments during simulation, are modeled using Maxwell ultracapacitors. The maximum charge and discharge power of an energy storage system are calculated using Equations (6) and (7), respectively [31].
P b ( t ) = k Q s ( t ) e k + Q ( t ) k c ( 1 e k Δ t ) 1 e k Δ t + c ( k Δ t e k Δ t )  
P b ( t ) = k c Q m a x + k Q s ( t ) e k Δ t + Q ( t ) k c ( 1 e k Δ t ) 1 e k Δ t + c ( k Δ t 1 + e k Δ t )  
Qs(t) = energy available at the beginning, Q(t) = starting total energy, Qmax = maximum capacity of storage, c = capacity ratio of storage, Δt = rate constant of storage, t = length of time step.
Equations (8) and (9), respectively, give the energy absorbed and released during the charging and discharging times [24].
E b ( t ) = E b ( t 1 ) × ( 1 σ ) + [ E G ( t ) E L ( t ) η i n v ] × η b
E b ( t ) = E b ( t 1 ) × ( 1 σ ) [   E L ( t ) η i n v E G ( t ) ]
Eb(t) = energy at time (t), Eb(t − 1) = energy at time (t − 1), σ = self-discharge rate, ηinv = inverter efficiency, ηb = batter efficiency. The state of charge of battery is represented as follows:
B S O C ( t ) = E b ( t ) E b ,   m a x  
The bidirectional converter regulates the energy flow between the AC and DC buses. The HOMER calculates the converter size based on the power transfer across the buses applying Equation (11) [31]:
P o ( t ) = η i n v × P i ( t )
where, Po(t) = converter output power, and Pi(t) = converter input power.
The HOMER evaluates the optimum microgrid size based on the lowest energy cost. (CoE) [37].
C o E = C A C C + C A R C + C A O M C A E S
CACC = Annual capital cost, CARC = Cost of replacement, CAOM = Annual operation and maintenance cost, EAES = Annual electricity served.
Net present cost (NPC), capital recovery factor (CRF), and nominal discount rate (i) are calculated using Equations (13)–(15), respectively [37].
N P C = C A C C + C A R C + C A O M C R F ( i , n )  
C R F   ( i , n ) = i   (   1 + i   ) n (   1 + i   ) n 1
i = i f i + f  
n = number of years, i = annual real interest, i′ = nominal interest, f = annual inflation.
In order to simulate the microgrid system, the investment, replacement, operation and maintenance expenses, lifetime, and resource data have to be specified. The monthly average value of wind speed and solar irradiation data are provided in Table A1. The HOMER uses solar data from the National Aeronautics and Space Administration satellite. Then, the clearness index is calculated. The average yearly radiation is 4.84 kWh/m2/day, with a clearness index of 0.525 [7]. The Bangladesh Council for Scientific and Industrial Research (BCSIR) recorded wind velocity at 30 m during 1999 to 2001 [3]. The sea states data has been mentioned in [38]. The power matrix can be estimated using this reference as shown in Table A2. The hydro-kinetics of eco wave power is represented by an average wave period of 5 s. The cost of floating PV is higher than the ground because of adding floater [32,39]. The GPV and FPV have a derating factor of 80% and 90%, respectively. Each eco-cycle wind turbine has a 10 kW rating and maintenance cost is higher than the PV. The highest frequency of wind speed would be 3–7 m/s with an average velocity of 4.85 m/s. The wind turbine hub height, cut-in velocity, cut-out speed, and rated wind speed are 25 m, 2.5 m/s, 20 m/s, and 7.5 m/s, respectively. The prices of all components are listed in Table A3. The eco wave power cost is estimated based on technology available in Bangladesh [10]. The cost of biodiesel is 1.30 USD/liter and minimum load ratio 25% of BDG rating. Both inverter and rectifier efficiency are 95% for the bidirectional converter. The efficiency of the inverter and rectifier in a bidirectional converter was 95%. The REVOV company provided the price of first-life battery (C8 51.2 V 220 Ah 11.2 kWh) and second-life battery (R9 51.2 V 200 Ah 10.2 kWh). The Maxwell ultracapacitor (3000 F, 3.0 V, 3.75 Wh) had a lifecycle of 100,000 [40].

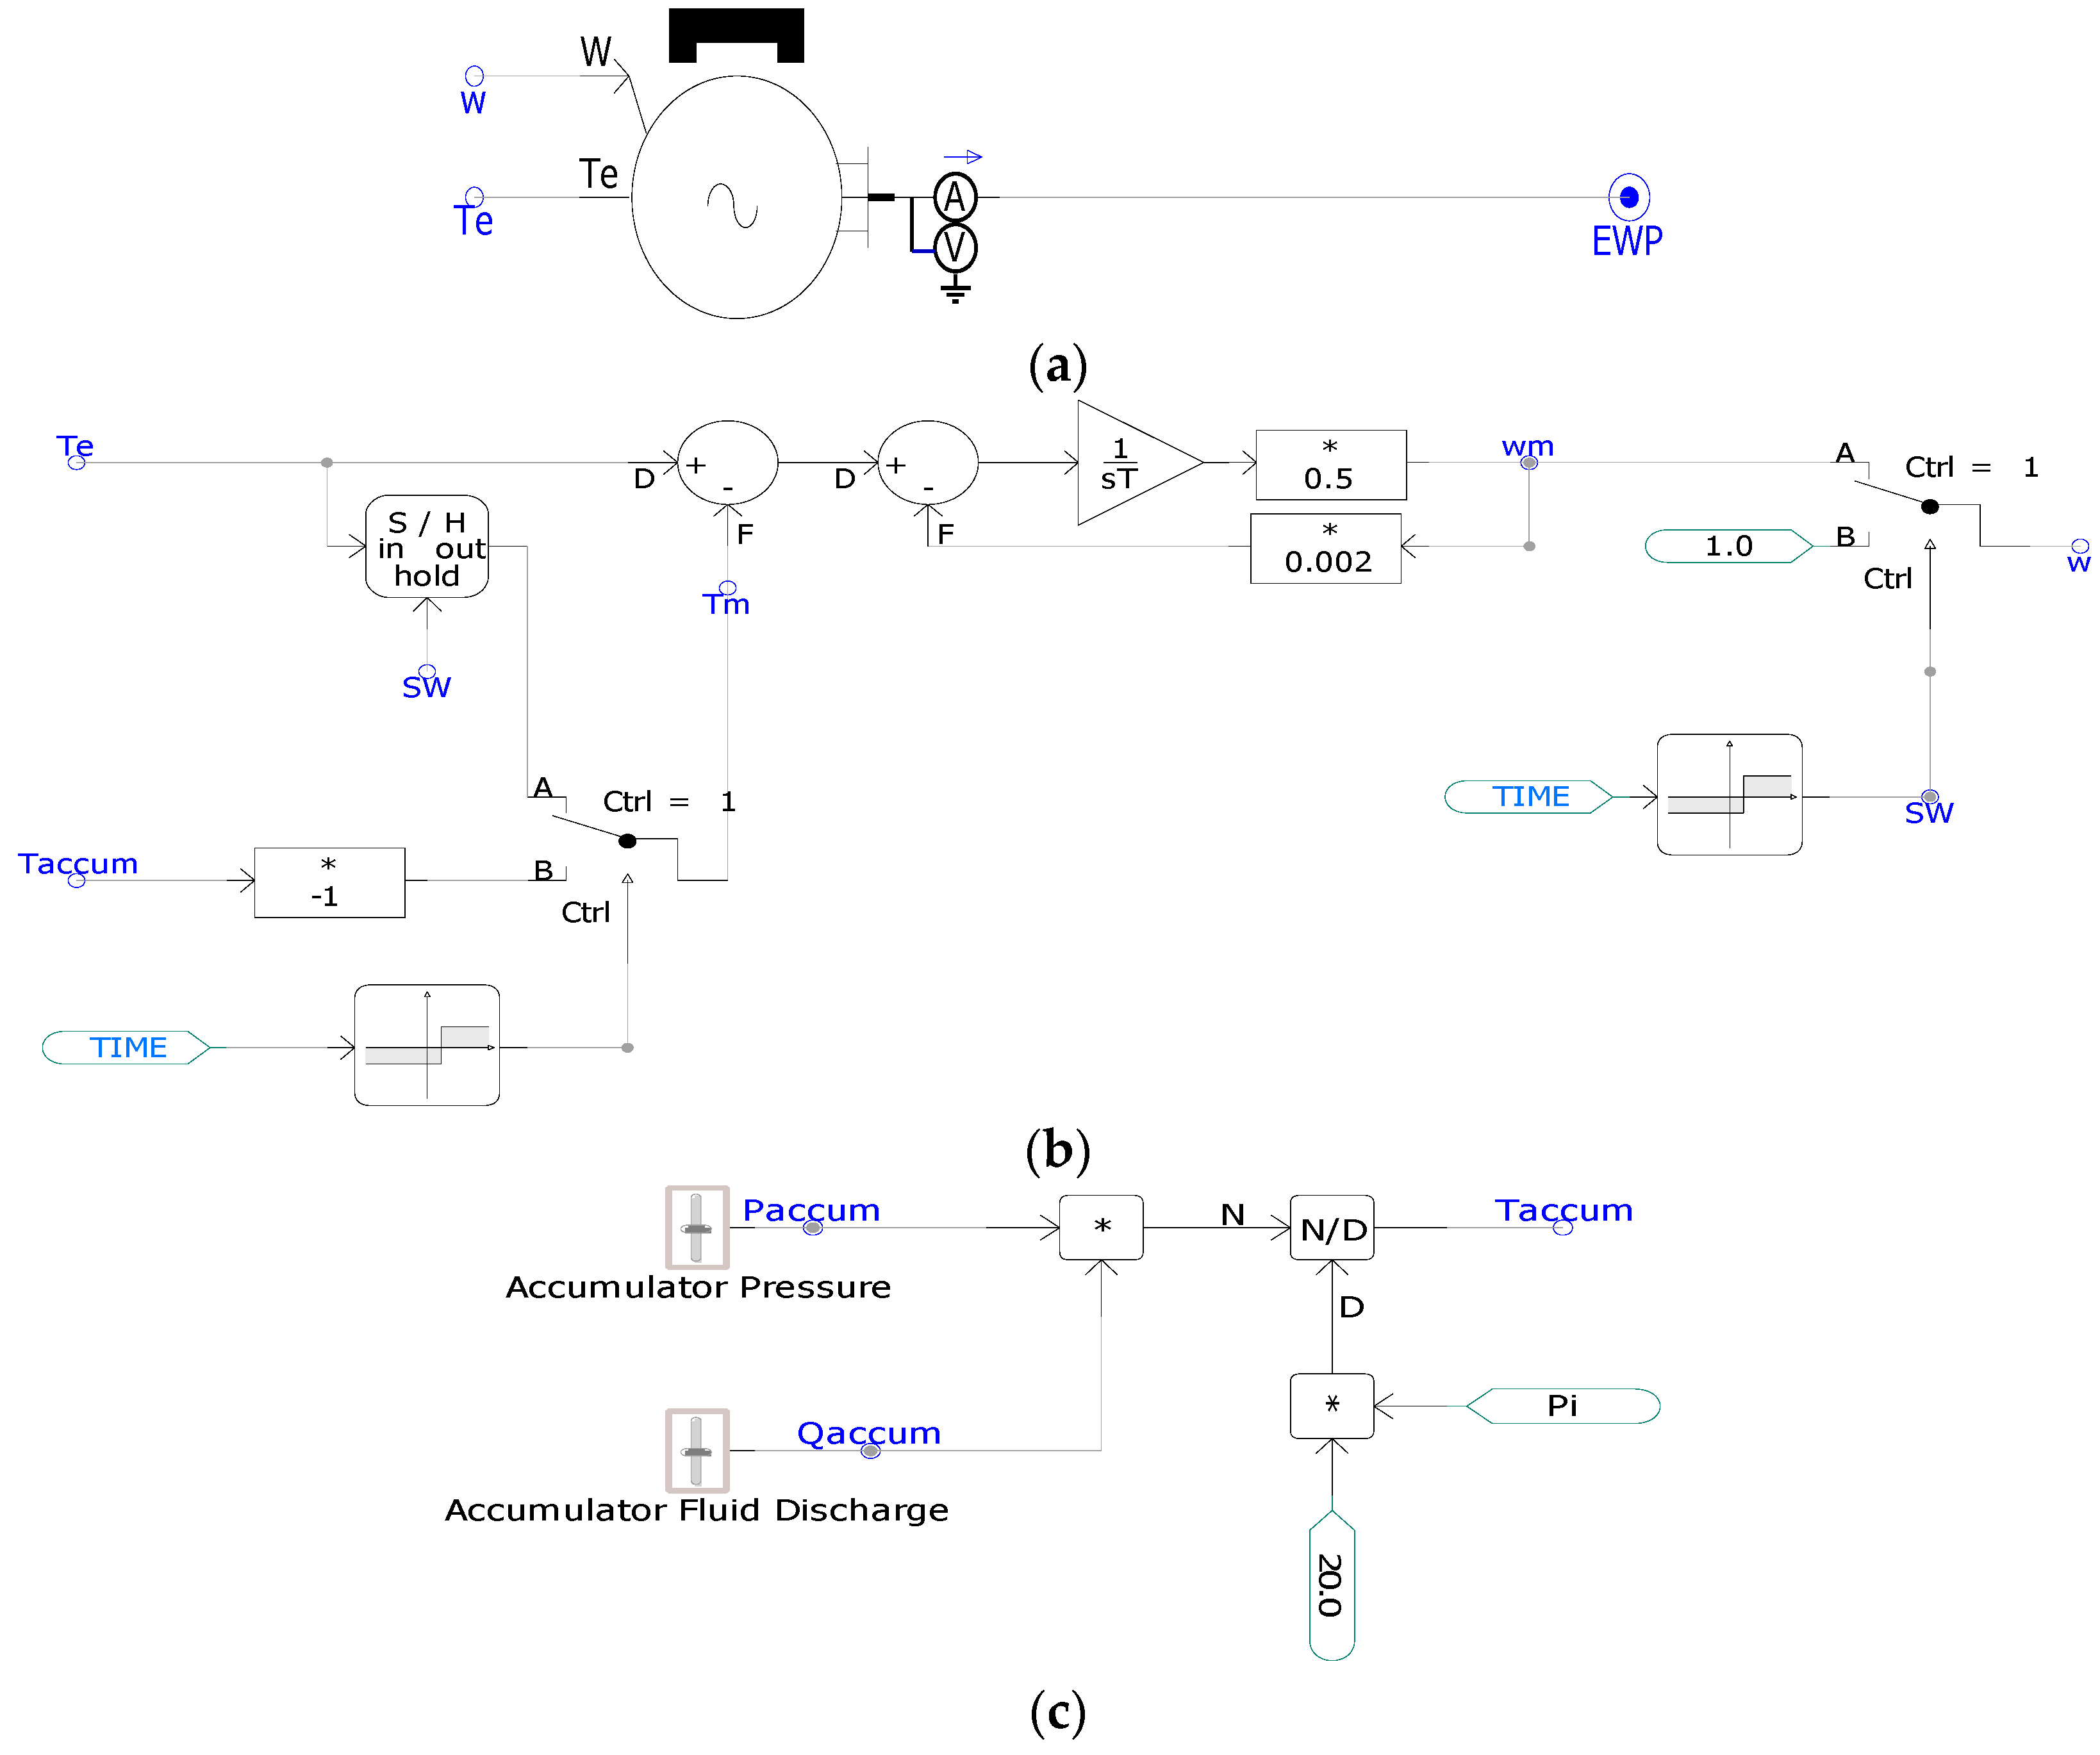
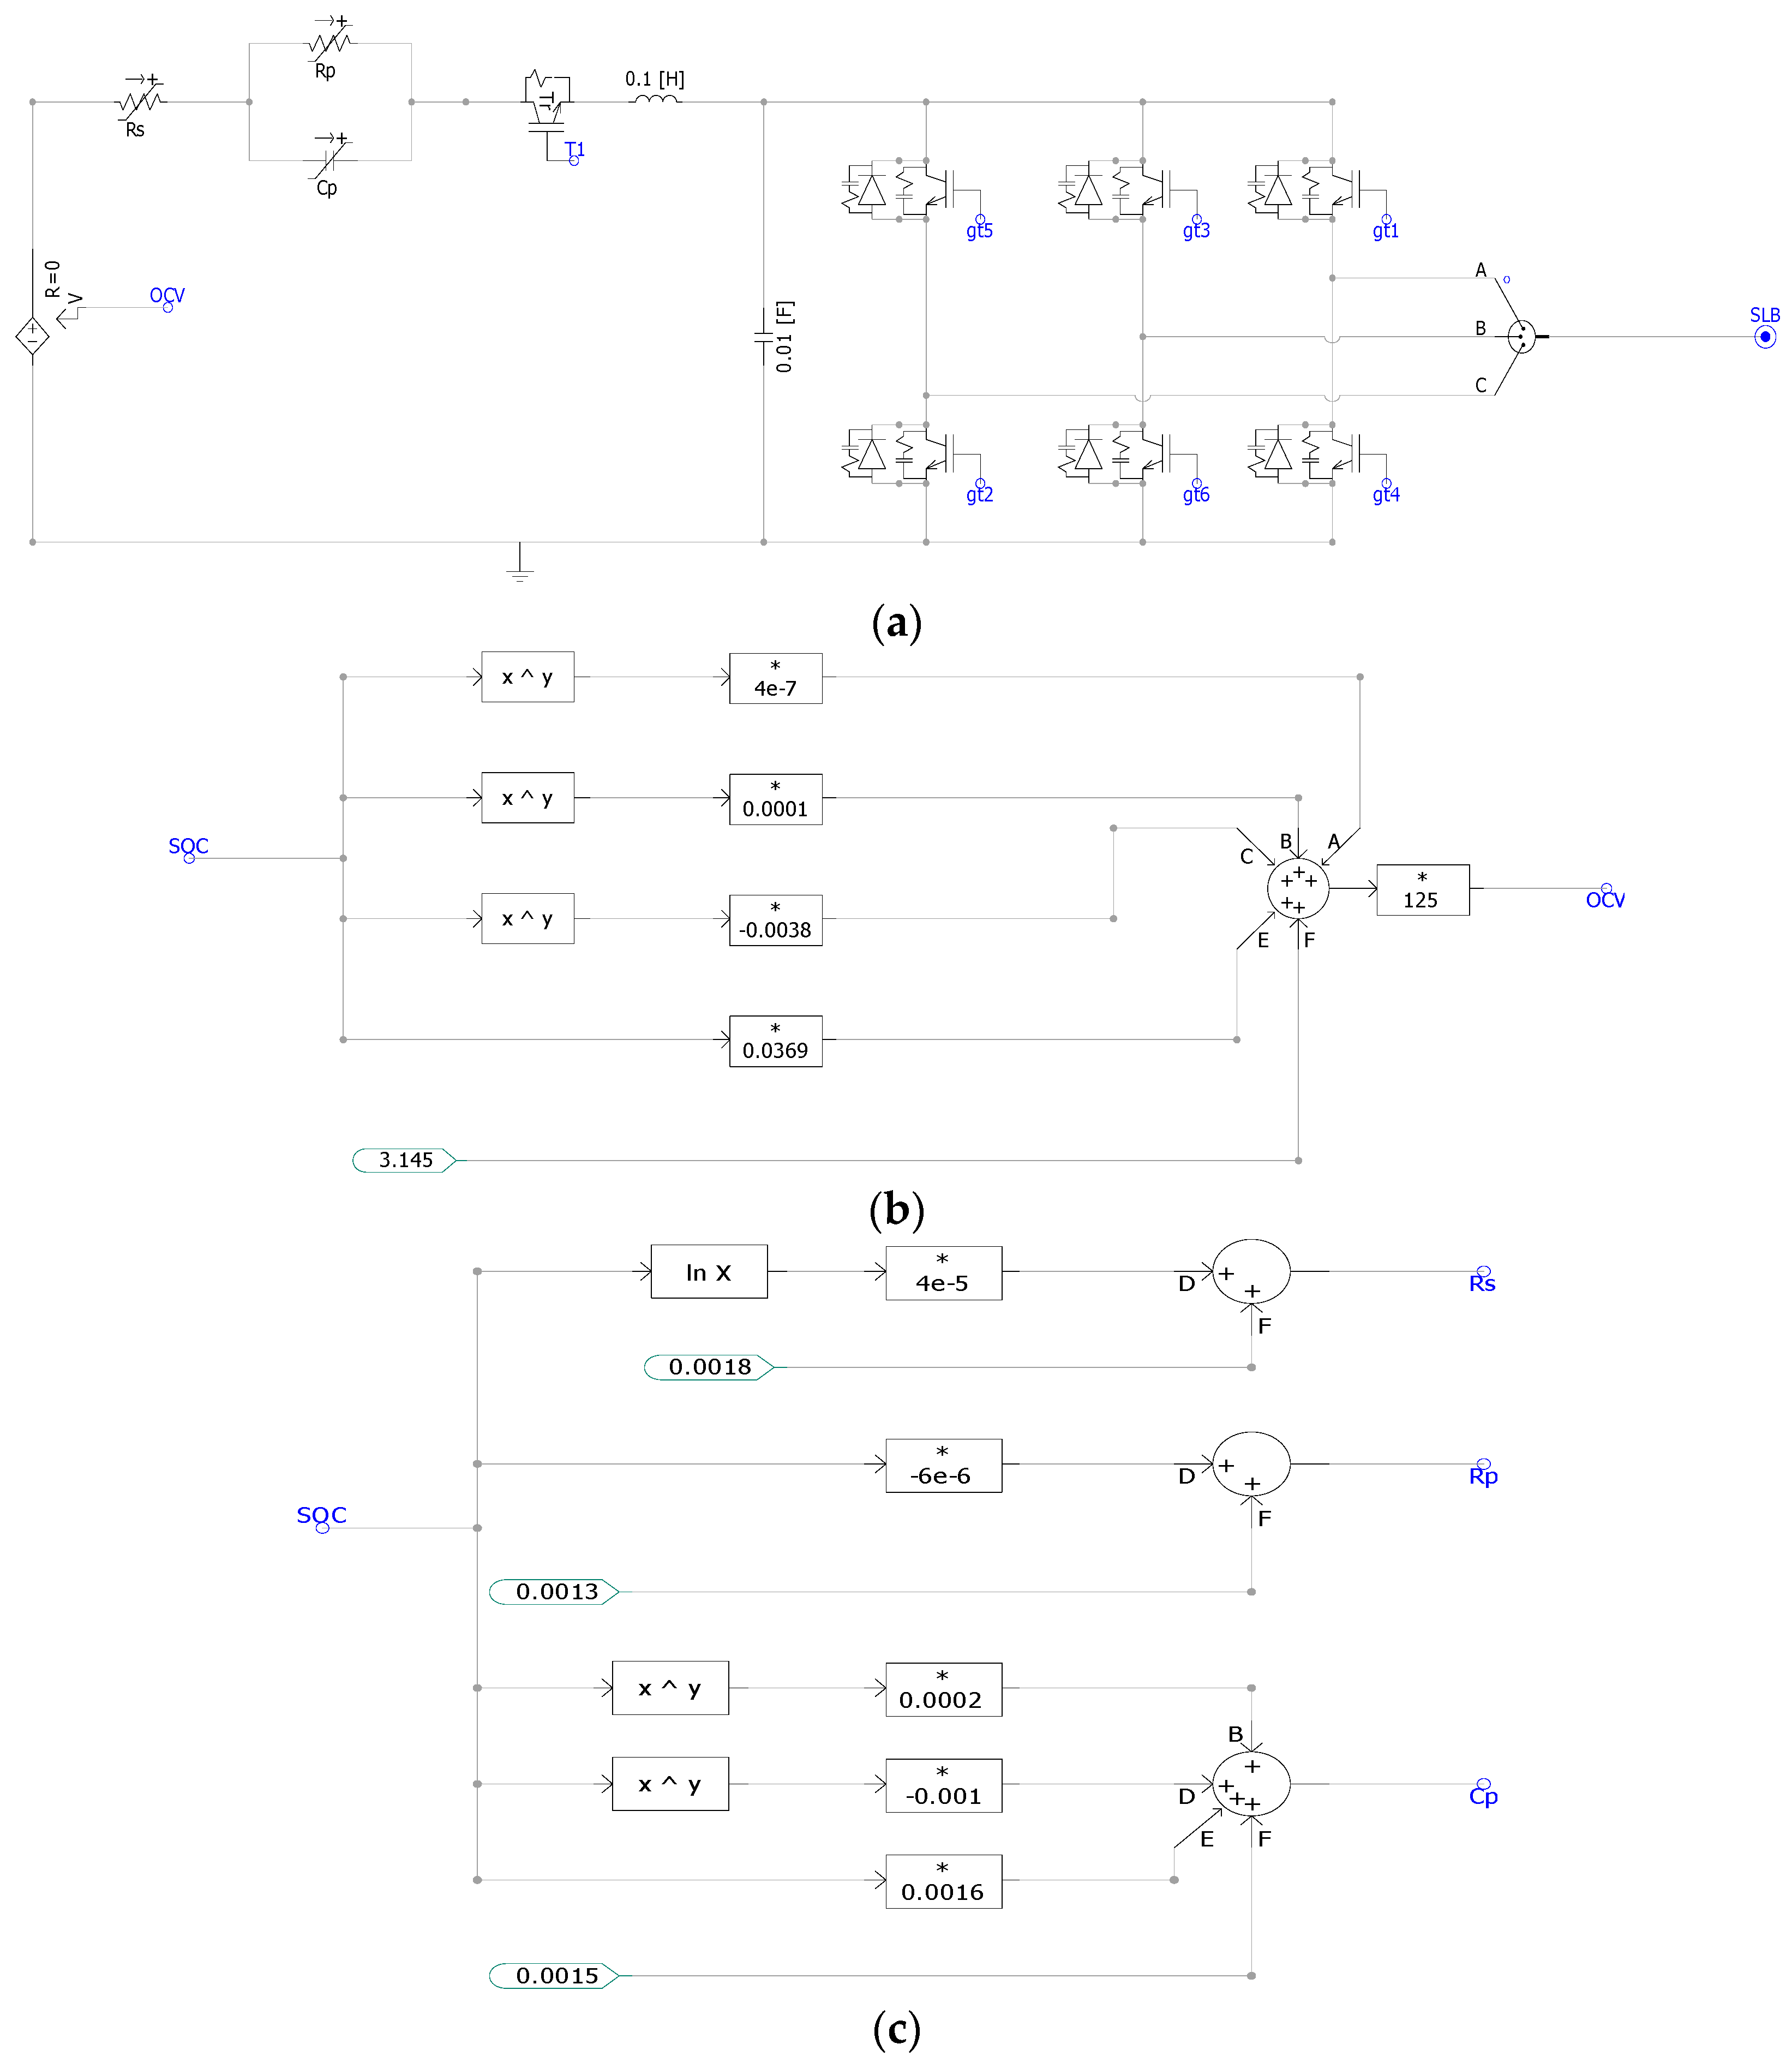
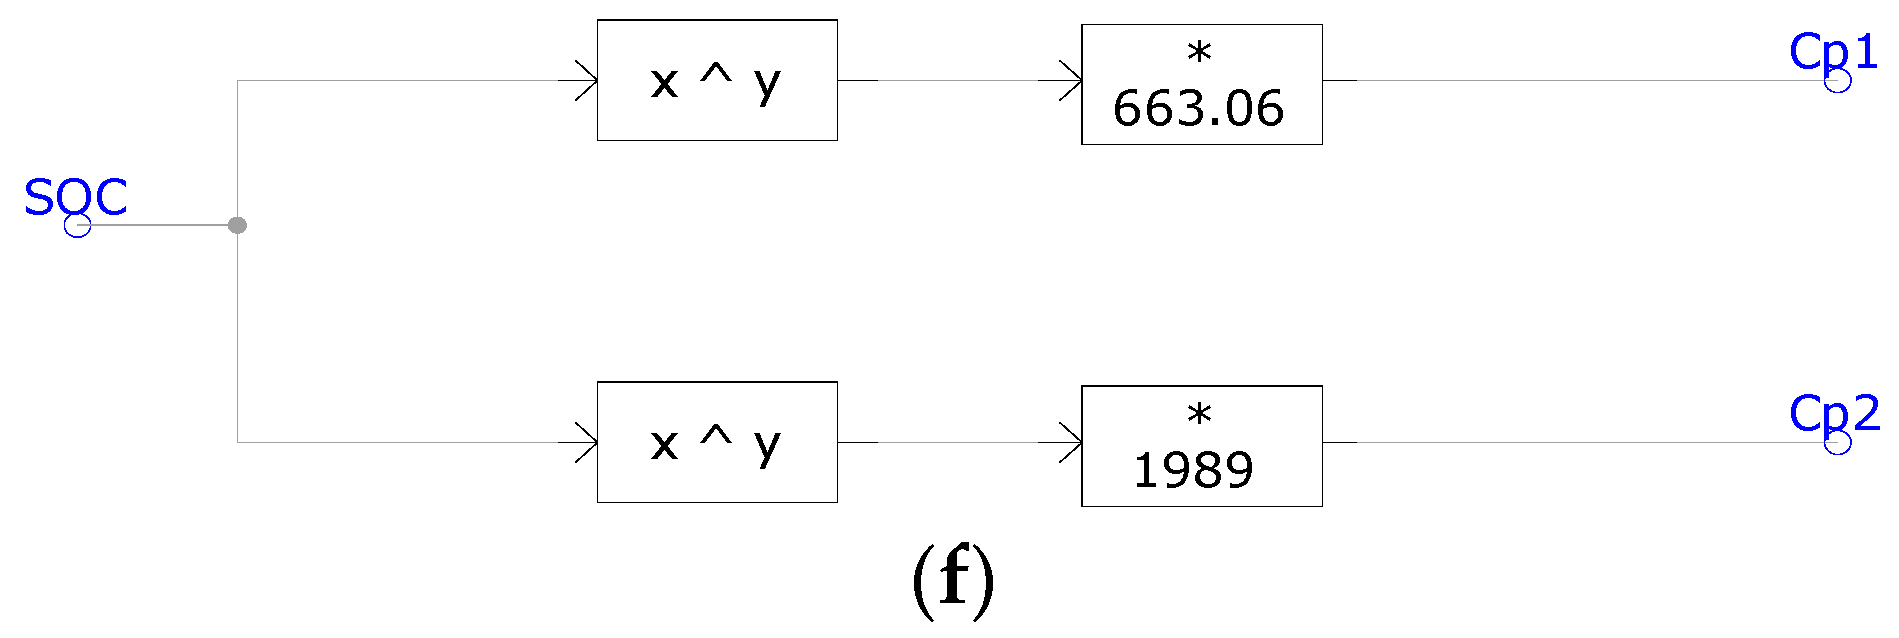
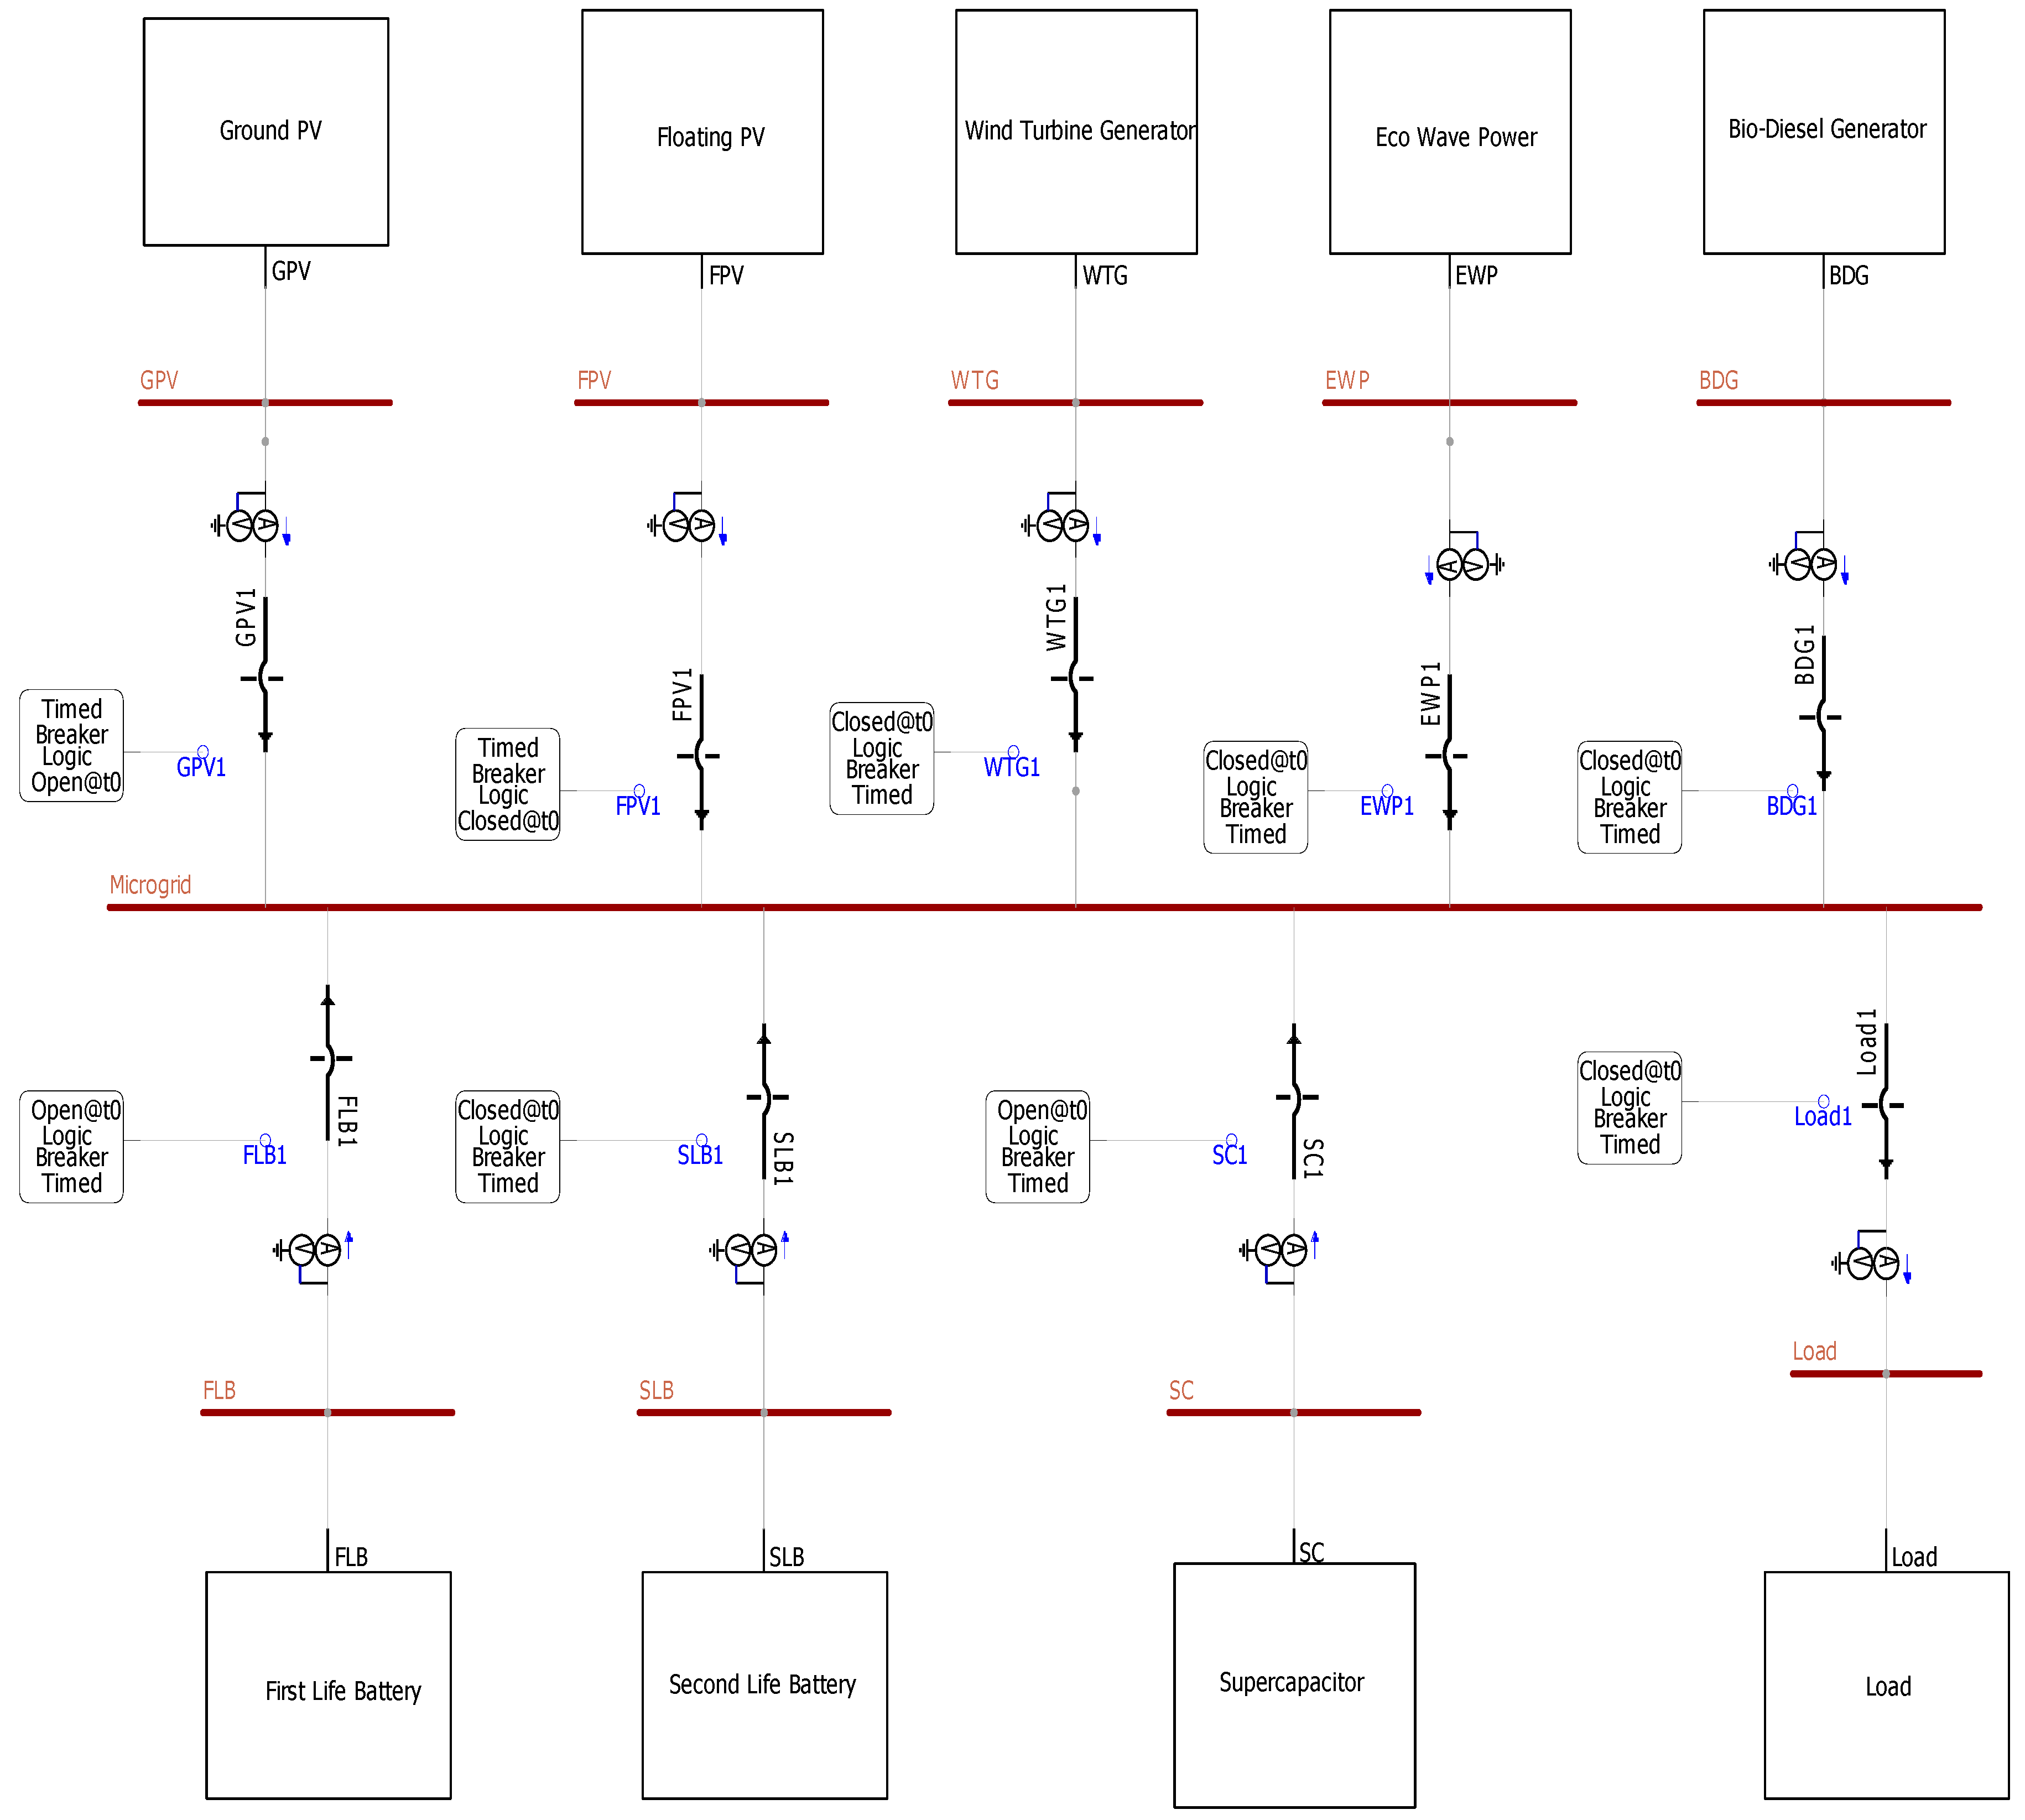
5. Microgrid PSCAD/EMTDC Modeling

The PSCAD/EMTDC modeling for the performance evaluation of the microgrid is demonstrated in this section. Some blocks are developed for simulation purposes.
Photovoltaic: The photovoltaic system in PSCAD consists of series and parallel connections of both cells and modules. Figure 6a presents the cell model in this software [27]. Solar irradiation and temperature are the main factors that influence output power. The ground-mounted PV and floating PV are presented in the same design, but the temperatures remain different. Low-voltage DC is the output of the solar panel. Figure 6b–d shows how the MPPT tracker can adjust solar panel output and how the inverter converts DC to AC for the microgrid connection.
Wind Turbine: The wind turbine system is modelled in PSCAD as shown in Figure 7. A three-phase slip-ring induction motor is being used for power generation. The torque becomes negative when the motoring action is switched to a generator. The wind governor system controls the turbine. The pitch angle can also be adjusted.
Eco Wave Power: For eco wave power, the floater and storage tank cannot respond to electrical disturbances. The piston pushes biodegradable fluid through the cylinder to the accumulator. It can develop 50 BAR to 160 BAR of pressure to fluid depending on wave height. Although the system produces electricity from 0.5 m, it is optimized for a 1.5 m to 3.5 m wave height. Then, the pressurized fluid is released to the hydraulic motor that runs the permanent magnet synchronous generator (PMSG). The negative torque is considered to work the motor as the generator. There is a variable speed and constant frequency control of the hydraulic wind turbine with the energy storage system. The torque developed by the hydraulic motor due to fluid pressure from the accumulator is as follows:
T t o r q u e = P P r e s s u r e × Q f l o w 20 π
where Ttorque = Torque developed by the hydraulic motor (Nm), Ppressure = Pressure from the accumulator (Bar or N/m2), Qflow = Bio-degradable fluid flow rate (liters/min).
The detail modeling of the EWP is shown in Figure 8. The permanent magnet synchronous generator, control circuit and accumulator are included in the design.
Bio-Diesel Generator: A diesel engine is used in the bio-diesel generator simulation. Excitation and mass addition systems are included in the 100 kVA synchronous generator as shown in Figure 9. The torque is controlled by the Woodward Leonard governor, which injects fuel in a controlled manner while using speed as a reference. The L2N and S2M send signals to the synchronous machine to provide mechanical dynamics [41].
First-life Battery: All the parameters used in the first-life battery depends on the SOC. The relationship of open circuit voltage (OCV), internal series resistance (Rs), first and second order polarization resistance (Rp1 and Rp2), first and second order polarization capacitance (Cp1 and Cp2) has been shown in terms of SOC. Figure 10 depicts block diagram of parameters [42].
OCV (SOC) = 0.6367 × SOC0.2441 + 3.433 × 10⁻⁸ × SOC4 − 0.8689 × 10⁻⁶ × SOC3 + 7.976 × 10⁻⁴ × SOC2 − 0.0036 × SOC + 2.256
Rs (SOC) = 1.1289 × 10³ × e−0.2754SOC + 0.023256 × e−0.01251SOC
Rp1 (SOC) = 4048 × e−0.3166SOC + 0.02186 × e−0.02246SOC
Rp2 (SOC) = 191.9 × e−0.237SOC + 0.01518 × e−0.02378SOC
Cp1 (SOC) = −1.887 × 10⁻⁸ × SOC−2.375 + 3.7887 × 10⁻⁴
Cp2 (SOC) = 2.936 × 10⁴ × SOC − 9.396 × 10⁵
Second-life battery: All the parameters used in the second-life battery depend on SOC. The relationship between open circuit voltage (OCV), internal series resistance (Rs), first order polarization resistance (Rp), and first order polarization capacitance (Cp) has been shown in terms of SOC. Figure 11 depicts the variation of these parameters [43].
OCV (SOC) = 4 × 10⁻⁷ SOC4 + 0.0001 × SOC3 − 0.0038 × SOC2 + 0.0369 × SOC + 3.145
Rs (SOC) = 4 × 10⁻⁵ × ln(SOC) + 0.0018
Rp (SOC) = −6 × 10⁻⁶ × SOC + 0.0013
Cp (SOC) = 0.0002 × SOC3 − 0.001 × SOC2 + 0.0016 × SOC + 0.0015
Super-capacitor: The fourth-order polynomial functions used to show the OCV-SOC relationship of the super-capacitor [44,45,46]. The internal series resistance (Rs), first order polarization resistance (Rp1), first order polarization capacitance (Cp1), second order polarization resistance (Rp2) and second order polarization capacitance (Cp2) are presented by the following equations for the Maxwell ultracapacitor, and also Figure 12 depicts block diagram modeling in PSCAD.
OCV (SOC) = −0.18 × SOC4 + 0.59 × SOC3 − 1.2 × SOC2 + 3.5 × SOC − 1.9 × 10⁻⁴
Rs (SOC) = 0.0007 × SOC2 − 3×10⁻⁵ × SOC + 0.0003
Rp1 (SOC) = −0.0042 × SOC3 + 0.0076 × SOC2 − 0.0032 × SOC + 0.0006
Rp2 (SOC) = 3 × 10⁻⁵ × ln(SOC) + 0.0001
Cp1 = 663.06 × SOC−1.765
Cp2 = 1989 × SOC−1.53
P-Q Controller of Microgrid: The output of the inverter in the distributed generation is regulated by the PI-dependent P-Q controller which minimizes the errors of the input. Figure 13 shows the control of phase angle and voltage magnitude by active power (P) and reactive power (Q), respectively. These two controlled parameters feed back to the gate pulse generator circuit as shown in Figure 14.

6. Microgrid Load Estimation under Smart City Condition

The microgrid load estimation is considered as an essential part for the simulation process. The load demand under smart city conditions will be higher compared to the current scenario of Saint Martin. The load profile has been calculated for this study based on previous case studies and reports for different countries [10,47,48,49,50,51,52,53]. Only AC loads are included in the hourly load profile, and the probabilistic random variation ranges from 0.00 to 1.00.
The usual load characteristics for the summer season (March to October) and the winter season (November to February) are shown in Figure 15. In both seasons, the peak period occurs between 12.00 and 21.00. The proposed hybrid microgrid can provide electricity to 16,000 people, including 8000 residents and 8000 tourists. However, a lot of factors influence load consumption, which vary over time. The significant possible consumption has been identified based on studies and the consumption habits of both tourists and inhabitants of St. Martin Island. The HOMER program meets the following load requirements, accounting for a 2% annual load growth rate as well as other smart city standards: Peak demand = 3393 kW, Load factor = 0.37, Average load consumption = 1268 kW and Average energy consumption = 30,441 kWh/day.

7. Methodology

A wide range of parameters need to be specified in order attain the objectives of this research. Figure 16 illustrates the methodological framework for achieving the three objectives.
The first objective is to propose a framework for a smart city on Saint Martin’s Island. The goals and criteria of smart cities have been harmonized into the local energy resources, physical infrastructure, and communication technology under this conceptual framework. The smart city has smart goals. Reducing carbon emissions, enhancing quality of life, and creating a competitive economy are the three primary goals of a smart city. The quality of life ensures a safe and secure environment, easy access to government services, affordable healthcare, and opportunities for citizens to participate in government initiatives. The smart city boosts economic competitiveness significantly. Economic growth can be accelerated by utilizing contemporary technologies to optimize all resources. Smart cities increase the efficiency of public transport, encourage the adoption of electric vehicles, and reduce energy use in residential and commercial buildings. Ride-sharing and bike-sharing are popular services that reduce energy consumption and emissions from motorized transportation. Consumers intend to use renewable energy sources. Smart meters are used in energy-efficient and environmentally sustainable buildings. The public can change their lifestyles to protect themselves from hazards by monitoring air quality. The islanders must be aware of global warming; otherwise, Saint Martin will be engulfed by the surrounding Bay of Bengal.
The second objective is the selection of an optimum microgrid configuration that will meet the requirements of Sustainable Development Goal 7. The HOMER program combines data from the load and resource to optimize six microgrid topologies. This objective ensures that people have access to affordable, reliable, clean, and renewable electricity.
The final objective assesses the performance of selected microgrid structures in the time domain using the PSCAD/EMTDC program. Models are built for eco wave power, solar PV, wind turbine generators, and biofuel generators. The simulation compares the performances of first-life batteries, second-life batteries and supercapacitors.

8. Results and Discussion

This section presents the smart city model for Saint Martin’s Island. Firstly, the microgrid scenario was optimized using HOMER software, and the best configuration was selected based on SDG 7. Finally, PSCAD/EMTDC software analyzed the time domain performance of microgrids.

8.1. Smart City Model for Saint Martin

The smart city model increases the operational efficiency of an island area. Policymakers can take a comprehensive strategy for transforming St. Martin into a small smart city by leveraging all available local resources and technology. The following sub-sections discuss the required criteria and communication technology to recognize Saint Martin as a smart city.

8.1.1. Criteria for Smart City Model in Saint Martin’s Island

The geography of an island determines the criteria needed to be a smart city. The prerequisite criteria will assist in achieving the three goals in St. Martin known as the quality of life, economic competitiveness, and environmental sustainability. The seven criteria are shown in Figure 17, and related elements are discussed here.
Smart Energy: Energy needs are expected to be met only by sustainable energy sources. An off-grid hybrid system can be built using solar, wind, and wave energy. In order to store surplus power, the battery as a storage system is also connected to clean resources. A microgrid offers a place to charge electric cars, electric fishing boats, and electricity for a facility that produces ice as well as other equipment. All components share energy-related information via the advanced metering infrastructure (AMI). By using biodiesel in a generator instead of diesel, the CO2 emissions are minimized.
Smart Mobility: Flexible movement is possible within the city owing to smart transportation systems. Information about parking, traffic, position monitoring, etc., could be made available to the visitors. The effective monitoring of traffic flow, ride-sharing, and pedestrian walkways all help to alleviate congestion on the roads. Helicopter services are available in emergency situations, and older diesel-powered cars are being replaced with electric ones. On St. Martin, however, there would not be enough land for train or airport services. To guarantee that passengers and visitors receive the best service available, it is important to regularly monitor the launch and trawler used to transport passengers onto the island. The majority of the locals work in the fishing industry. To keep fish fresh for a long time, an ice plant should be constructed. The use of electric fishing boats instead of the present diesel engines reduces harmful emissions.
Smart Community: Residents of smart cities are well-adjusted, and interested in sustainable solutions. They all own smart devices that give them access to services on numerous platforms. As a result of the lifelong learning process, citizens are continuously informed and have the chance to get involved in social activities. Everyone resides in a smart apartment that is linked for internet access. There will be a strong ICT infrastructure, and doctors’ services must be available every day of the week, 24 h a day.
Smart Governance: Smart governance is one of the most crucial prerequisites for administering a smart city. The e-governance system unifies all services, provides community members with up-to-date information, and provides quick service via an online platform. Government actions need to be transparent, and proactive participation by the public reflects the views of the residents. A visionary leader and a center of excellence will improve the island area.
Smart Environment: To achieve a green environment, only emission-free activities should be allowed. An annual tree-planting program, and a carbon capture and storage system would work to lessen the negative effects of CO2. Urban parks, water desalination, waste management, and disaster management are all incorporated. The marine system should be adequately monitored in accordance with the law of nature preservation to safeguard aquatic animals like sharks and whales.
Smart Tourism: Tourists are the second-largest source of income for the islands. It will be of utmost importance to ensure the physical security and safety of tourists, as well as to analyze visitor behavior utilizing big data processed by artificial intelligence and gathered through the Internet of things (IoT). To enhance the number of tourists visiting the island each year, additional tourism amenities like high quality hotel and cottage accommodations, free Wi-Fi, weather forecasting, and rain alerts need to be provided. International tourists will find the global electronic currency a flexible payment method.
Smart Economy: The smart economic structure will in fact improve the living conditions of residents. The island’s area can be expanded with careful planning. A balance of global embeddedness, entrepreneurial tendencies, return on investment, partnership creation, revenue stream income, competitiveness, macro and microbusiness policy, and social benefit can also be incorporated in smart-city growth projects.

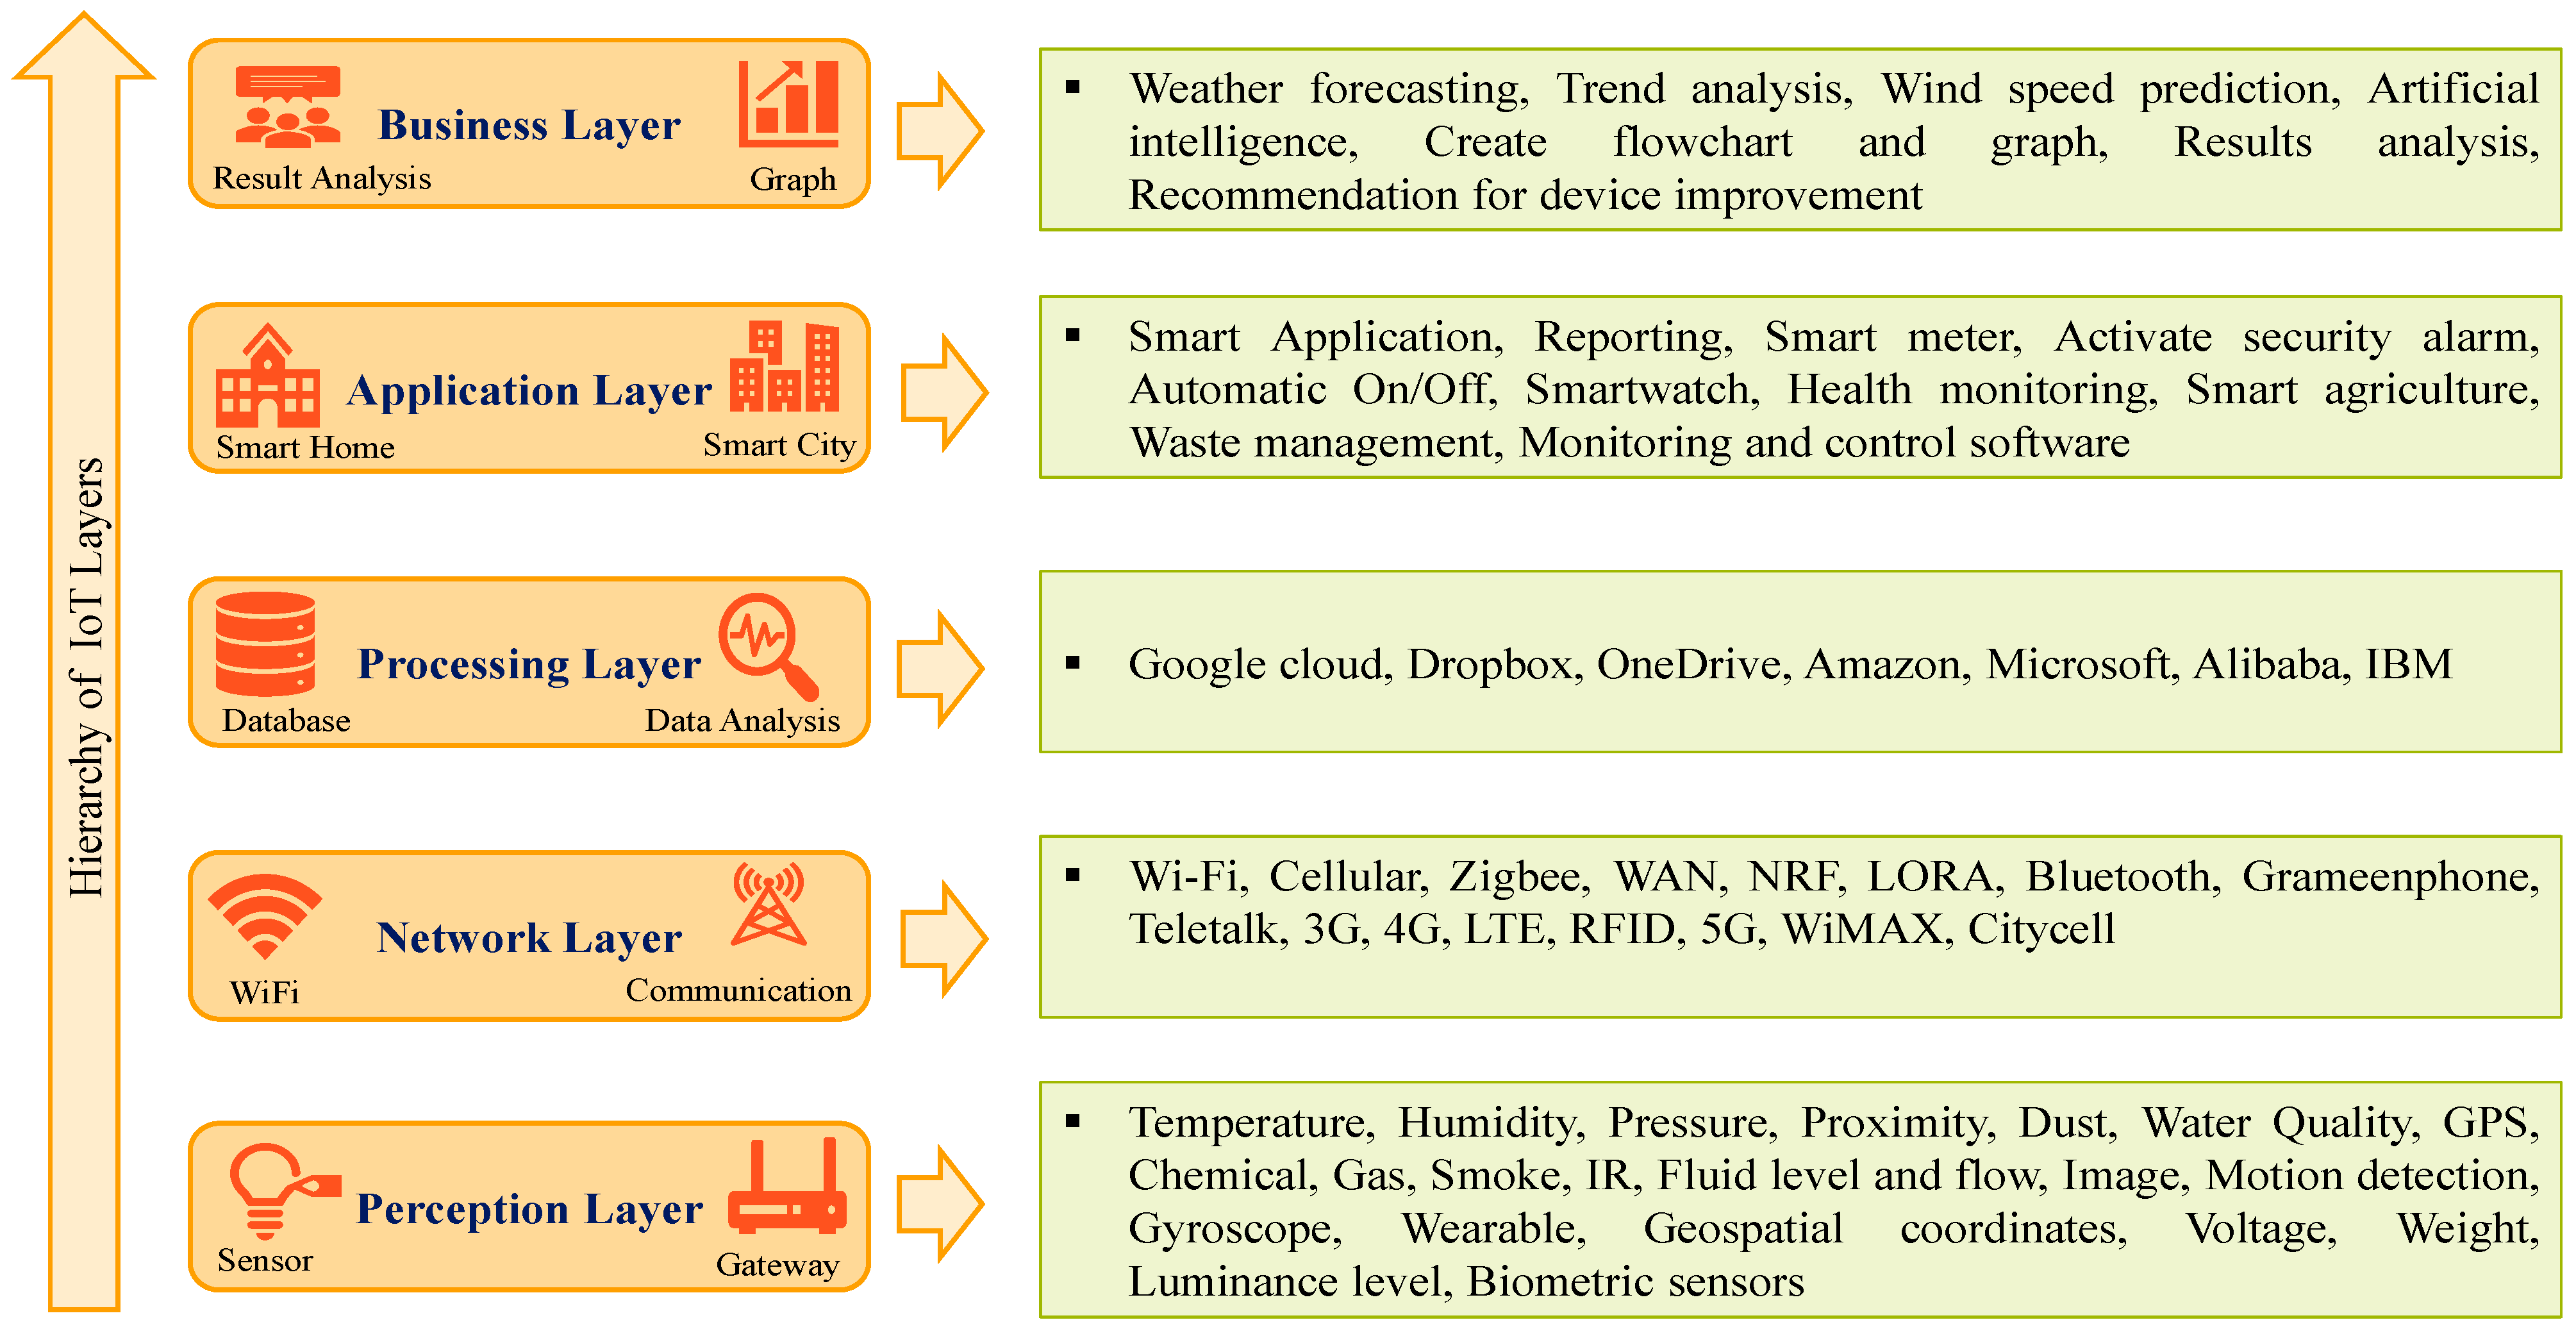
8.1.2. IoT Oriented-Smart City

The IoT infrastructure connects the physical systems of Saint Martin under smart city criteria to provide excellent municipal services. The bi-directional communication network collects the required data from the devices and transmits signals for further action as shown in Figure 18. Actuators, sensors, smart industry, and other smart technologies are connected to data centers in order to communicate and exchange information. The signals generated by surrounding objects are received and recorded in a large data format. Artificial intelligence processes and analyzes the data that has been stored. The Internet of things (IoT) assists in interacting and improving different parts of a smart city. Tourists, fishermen, and locals are given access to weather forecasting data by the government authorities in order to be warned of impending storms. Tax payment, tendering, and utility billing are examples of e-governance systems that can be managed in a straightforward and cost-effective manner. In addition, every individual also receives a smart identification card in Bangladesh that has computerized credentials, and provides quicker access to government services.
Receiving real-time data of vehicles on multiple roads can be used to control the time adjustments of traffic signals. It aims to relieve traffic congestion. Smart drivers are connected via mobile apps and look for nearby parking and charging spots of electric vehicles. The waste management system schedules for efficient garbage pick-up. Big data analysis aids in health improvement. The security camera notices the treat before anything worse happens in the beach of St. Martin’s Island. Advanced metering infrastructure enables demand response for smart energy consumption. Ocean waves, wind speed, and solar irradiation can all be predicted to produce electricity. Overall, the IoT allows all resources to be used in a collaborative way. Figure 19 highlights the five-layer design and accompanying technology used.
Perception layer: The perception layer is the initial layer, and it is constituted of sensors that collect data from the environment and physical things. The sensors that are used are determined by the application. Temperature, humidity, dust sensors, and pollution particles, for example, have all been utilized to collect atmospheric data. Motion detection, cameras, images, and biometric sensors are useful for surveillance. The monitoring of fluid flow and water quality is used in industrial processes. The wearable sensor transmits health-monitoring data.
Network layer: This layer receives data from the perception layer and securely sends it to the application layer. For data transmission, Wi-Fi, Bluetooth, ZigBee, 3G, 4G, and 5G technologies are widely implemented. It is possible to communicate using both wired and wireless methods. The Banglalink, Grameenphone, Teletalk, and Citycell are well-known mobile networking companies in Bangladesh.
Processing layer: The data are stored in this layer based on device addresses and provide multiple services for lower levels. Data storage, cloud computing, and big data processing modules are provided by Google Cloud, Amazon, Microsoft, and Alibaba, etc.
Application layer: This layer provides specific application. Smart home managing, plant automation, traffic congestion control, and health monitoring are just a few of the applications for the Internet of things. Reporting data, setting an alarm, turning on or off a device, smartwatches, smart agriculture, and so on are also part of it.
Business layer: This is considered as the advanced layer of the IoT. After data processing using artificial intelligence, useful data are sent to consumers. It includes generating flowcharts, infographics, weather forecasting, analyzing outcomes, and determining how the device may be upgraded, along with many other things.

8.2. Microgrid Configuration Selection Based on SDG 7

The HOMER Pro Tools optimizes six different microgrid architectures. The software displays the size of each component as well as some parameters of SDG7 metrics. The most suitable microgrid configuration is then chosen to address SDG 7.
Figure 20 depicts six microgrid architectures consisting of the ground PV, floating PV, wind turbine generator, eco wave power, biodiesel generator, bidirectional converter, first-life battery, second-life battery and supercapacitor. Biodiesel generators are used in Cases I, II, and III, but only renewable resources have been utilized in Cases IV, V, and VI. GPV, FPV, WTG, EWP, and BDC are the five common components used in each configuration. The first-life battery is used in Case I and Case IV. The second-life battery is employed in Case II and Case V, whereas the supercapacitor is utilized in Cases III and IV.
Exiting 250 kWp ground PV, a 100 kVA bio-diesel generator, various sizes of floating PV modules, wind turbines, eco wave power, bio-diesel generator, bidirectional AC/DC converter, first-life battery, second-life battery, and supercapacitor have all been taken into account in the HOMER simulation. Ground PV and biodiesel generators are the only two components that have a fixed size. The sea state, wind speed and solar irradiation would all fluctuate over time. HOMER calculates the lowest net present cost for six different configurations of ocean-wave-powered microgrid systems. Microgrid component sizes and their parameters according to Sustainable Development Goal 7 are listed in Table 1 and Table 2, respectively. Battery back-up time is the battery autonomy that can supply continuously with no generators. The excess electricity is required for the future growth of load demand. Six cases are illustrated in the following paragraphs.
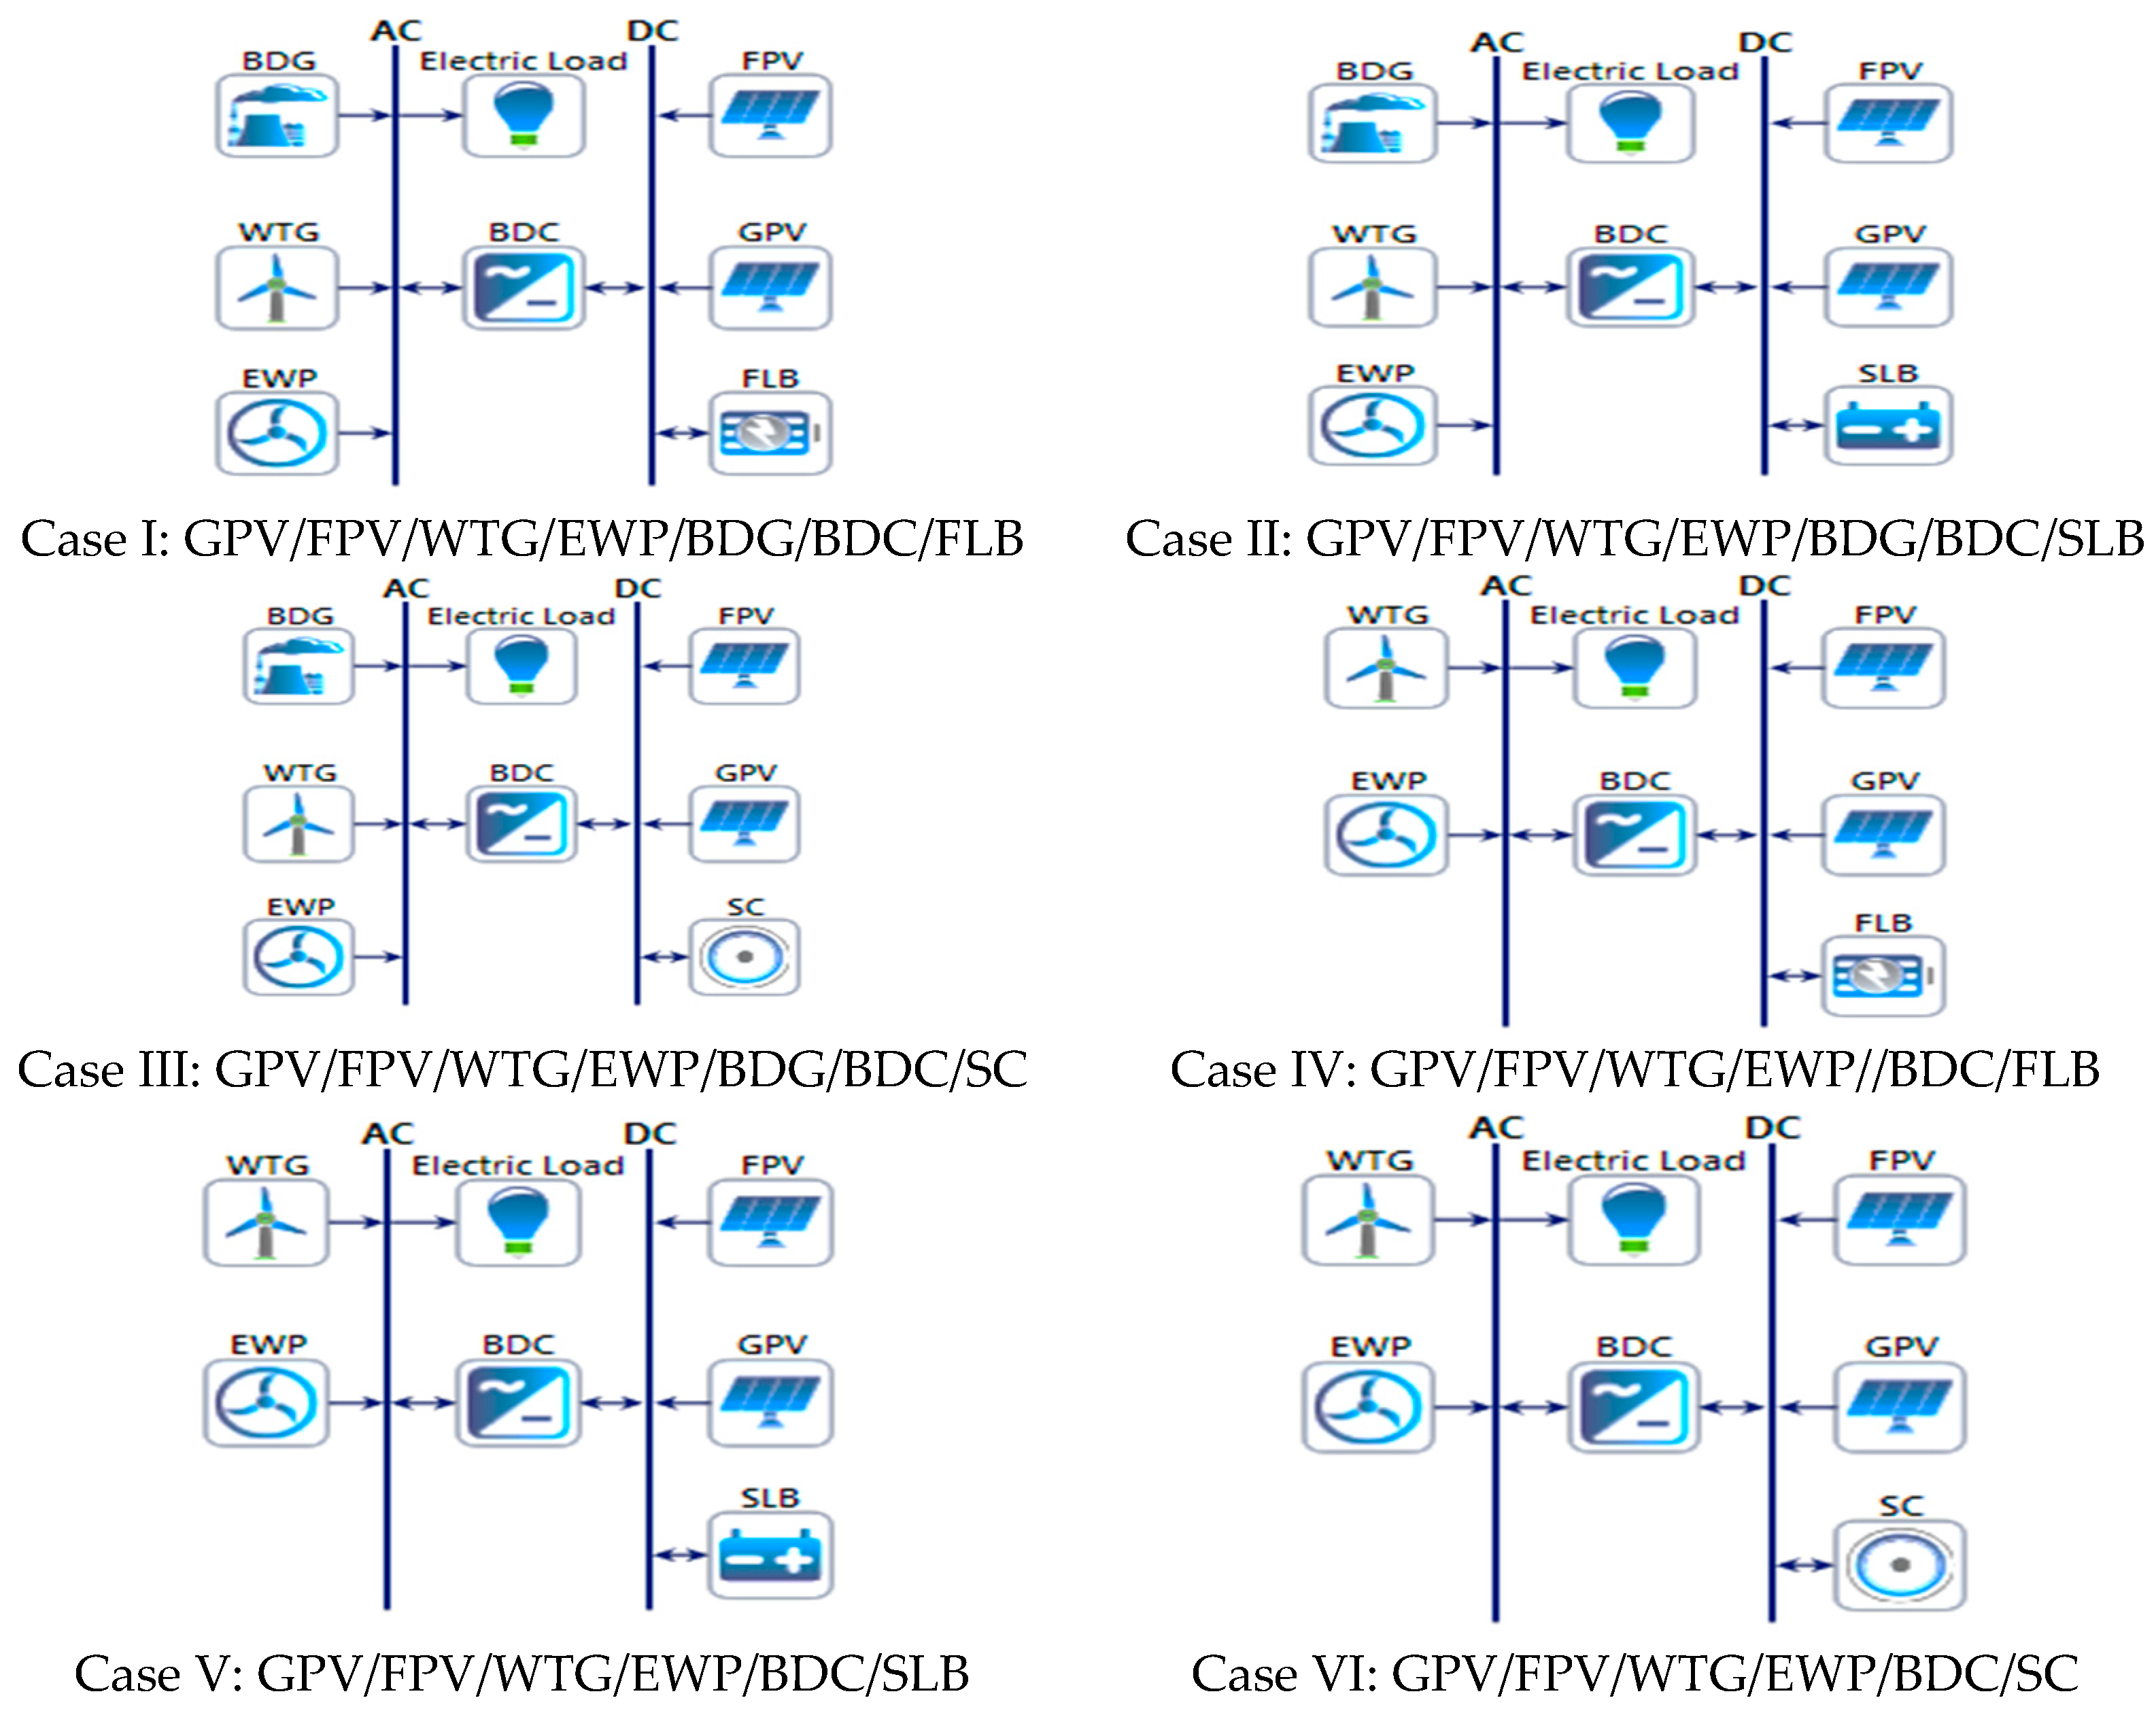
  • Case I: GPV/FPV/WTG/EWP/BDG/BDC/FLB: A 250 kWp ground PV system, 879 kWp floating PV system, 1500 kW eco wave power system, 100 kVA biodiesel generator, 964 kW bidirectional converter, and 8741 kWh capacity of first-life battery are used in this scenario. The wind turbine possesses the biggest capacity of all generators at 1890 kW. It also necessitates a large battery size. The energy cost is 0.2049 USD per kilowatt hour, and that is the second lowest. Each year, there are 562,618 kWh of capacity shortages and 4,766,681 kWh of excess electricity.
  • Case II: GPV/FPV/WTG/EWP/BDG/BDC/SLB: The only real difference between this case and Case I is that it uses a second-hand battery with a marginally higher capacity of 8745 kWh. However, the energy cost is 0.2020 USD/kWh, which is the lowest of all the configurations studied. Because of the recycled battery, the operating and maintenance costs are higher than in Case I, reflecting a sustainable criterion. Battery power can last 5.52 h without any power generation, and 98.9% of the electricity is generated from renewable sources.
  • Case III: GPV/FPV/WTG/EWP/BDG/BDC/SC: The optimal configuration in this case includes a 250 kWp ground PV, 155 kWp floating PV, 780 kW wind turbine, 3000 kW eco wave power, 100 kW biodiesel generator, 430 kW bi-directional converter, and 13.6 kWh supercapacitor. The storage capacity is lowered due to the use of supercapacitors, therefore eco wave power with a large capacity is preferred. Energy cost, capacity shortage and CO2 emissions are increased to 0.2347 USD/kWh, 566,340 kWh/yr and 1178 kg/yr, respectively, which again is relatively high compared to Case I and Case II. Additionally, it provides power for very little duration (approximately 0.00968 h) when no generators are producing any power.
  • Case IV: GPV/FPV/WTG/EWP/BDC/FLB: In this setup, a first-life battery is combined with solely renewable energy sources. The converter size was also raised for increasing the capacity of the floating PV. Power generation from the bio-diesel generator is not permitted. As a result, 100% of the energy comes from renewable sources with zero emissions. It ranks fourth among six configurations in terms of electricity costs. The installed wind capacity reaches a fairly high-level of 2080 kW, whereas 5.32 h are required for battery autonomy.
  • Case V: GPV/FPV/WTG/EWP/BDC/SLB: In this instance, a large-size, second-hand battery with an 8970-kWh capacity is used. The storage autonomy rises to 5.66 h as a result. The annual capacity shortage fraction falls to 562,338 kWh. With no emissions, it can deliver electricity for the third-lowest price of 0.2069 USD per kWh.
  • Case VI: GPV/FPV/WTG/EWP/BDC/SC: In this circumstance, a 15.5 kWh supercapacitor with 3000 kW eco wave power is utilized. In addition, the size of the bidirectional converter and floating PV has been lowered. The electricity cost is 0.2483 USD/kWh, which is the highest of any options. In addition, there is a significant amount of extra electricity and a high capital cost. It cannot be implemented as a cost-effective microgrid due to its high energy costs. The battery’s autonomy is very limited in terms of hours. The supercapacitor is actually largely used for quick energy exchange during power outages.
The best microgrid configuration is one that satisfies the requirements listed in Sustainable Development Goal 7. The GPV/FPV/WTG/EWP/BDG/BDC/SLB microgrid structure can be implemented to focus on SDG 7 while taking into account the criteria listed in Table 2. It offers the lowest electricity cost, net present cost, initial investment, less capacity shortage, also high renewable fraction as well as low emissions. In terms of battery recycling, this configuration also provides environmental sustainability.
Table 1. Microgrid Component Sizes.
CaseMicrogrid ConfigurationsComponent Size
GPV
(kWp)
FPV
(kWp)
WTG
(kW)
EWP
(kW)
BDG
(kVA)
BDC
(kW)
FLB
(kWh)
SLB
(kWh)
SC
(kWh)
Case IGPV/FPV/WTG/EWP/BDG/BDC/FLB250879189015001009648741
Case IIGPV/FPV/WTG/EWP/BDG/BDC/SLB250879189015001009648745
Case IIIGPV/FPV/WTG/EWP/BDG/BDC/SC250155780300010043013.6
Case IVGPV/FPV/WTG/EWP/BDC/FLB25011162080150011278437
Case VGPV/FPV/WTG/EWP/BDC/SLB25013161780150010838970
Case VIGPV/FPV/WTG/EWP/BDC/SC2503201580300044015.5
Table 2. Achieving SDG 7 * from the Microgrid Configurations.
SDG 7 CriteriaMGTargetCase ICase IICase IIICase IVCase VCase VI
AffordableCOE (USD/kWh)Low0.20490.20200.23470.21000.20690.2483
NPC (USD)Low27,272,07026,879,27031,223,57027,941,70027,540,48033,037,880
Initial investment (USD)Low19,399,93519,098,53519,875,72820,457,68620,041,20722,290,388
O & M costLow5,917,7305,976,528691,2146,040,6126,154,67710,762,192
ReliableContinuous power supply (h)High5.515.520.009685.325.660.0110
Excess electricity (kWh/y)High4,766,6814,766,4734,914,5515,847,9544,929,4108,347,673
Capacity shortage (kWh/y)Low562,618562,474566,340564,564562,338565,070
SustainableCO2 emissions (kg/yr)Low7607591178000
Renewable fraction (%)High98.998.998.3100100100
MGsYesYesYesYesYesYesYes
Battery recyclesYesNoYesNoNoYesNo
ModernHybrid resourcesHighHighHighHighMediumMediumMedium
Community MGs
SDG 7 * = Sustainable Development Goal 7, √ = When a microgrid meets the following criteria.

8.3. Microgrid PSCAD/EMTDC Simulation

The performance of various microgrid scenarios during transient conditions is discussed in this part. All of the components have been modeled in detail. A circuit breaker and measuring system are used to connect the power generator, storage, and loads with the microgrid, as shown in Figure 21. The timer logic connects or disconnects the breaker. This breaker is used to create different microgrid topologies. The multimeter measures phase and line voltages in both instantaneous and RMS modes, as well as active power sharing. A random variable block serves to generate a continuously varying load. Solar irradiation, wind speed, and wave energy are primary resources that can be changed as input parameters. The three-phase voltages typically range from 380 V to 420 V. In Bangladesh, single-phase and three-phase standard voltages are 220 V and 400 V, respectively. The generator outage and short circuit are applied in simulation process. The first-life battery, second-life battery, and supercapacitor are also compared for their ability to respond to quickly changing loads, generator faults, or outages. There has also been study on the single line to ground fault and the three-phase fault. The voltage and power are measured in volts (V) and kilowatts (kW), respectively.

8.3.1. Microgrid Simulation with First-Life Battery

In this scenario, the ground PV, floating PV, wind turbine generator, eco wave power, and bio-diesel generator are operated with the first-life battery. The different scenarios are created and described below.
  • Scenario 1: Three Phase to Ground Fault in the Eco Wave Power at t =25 s.
A three-phase-to-ground fault (L-L-L-G) is applied at the terminal of eco wave power at t = 25 s for 0.1 s. The terminal voltage of eco wave power and output power fluctuation is shown in Figure 22. A voltage drops and power fluctuates at the moment of fault. The first-life battery responds quickly to stabilize the microgrid.
  • Scenario 2: Outage of Wind Turbine Generator at t = 25 s.
At time t = 25 s, wind turbine outages but reconnects within 0.05 s. As a result, the voltage drops and power fluctuates as shown in Figure 23. The first-life battery responds rapidly when compared to other distributed generators. As a result, the microgrid system stabilizes within 0.20 s.

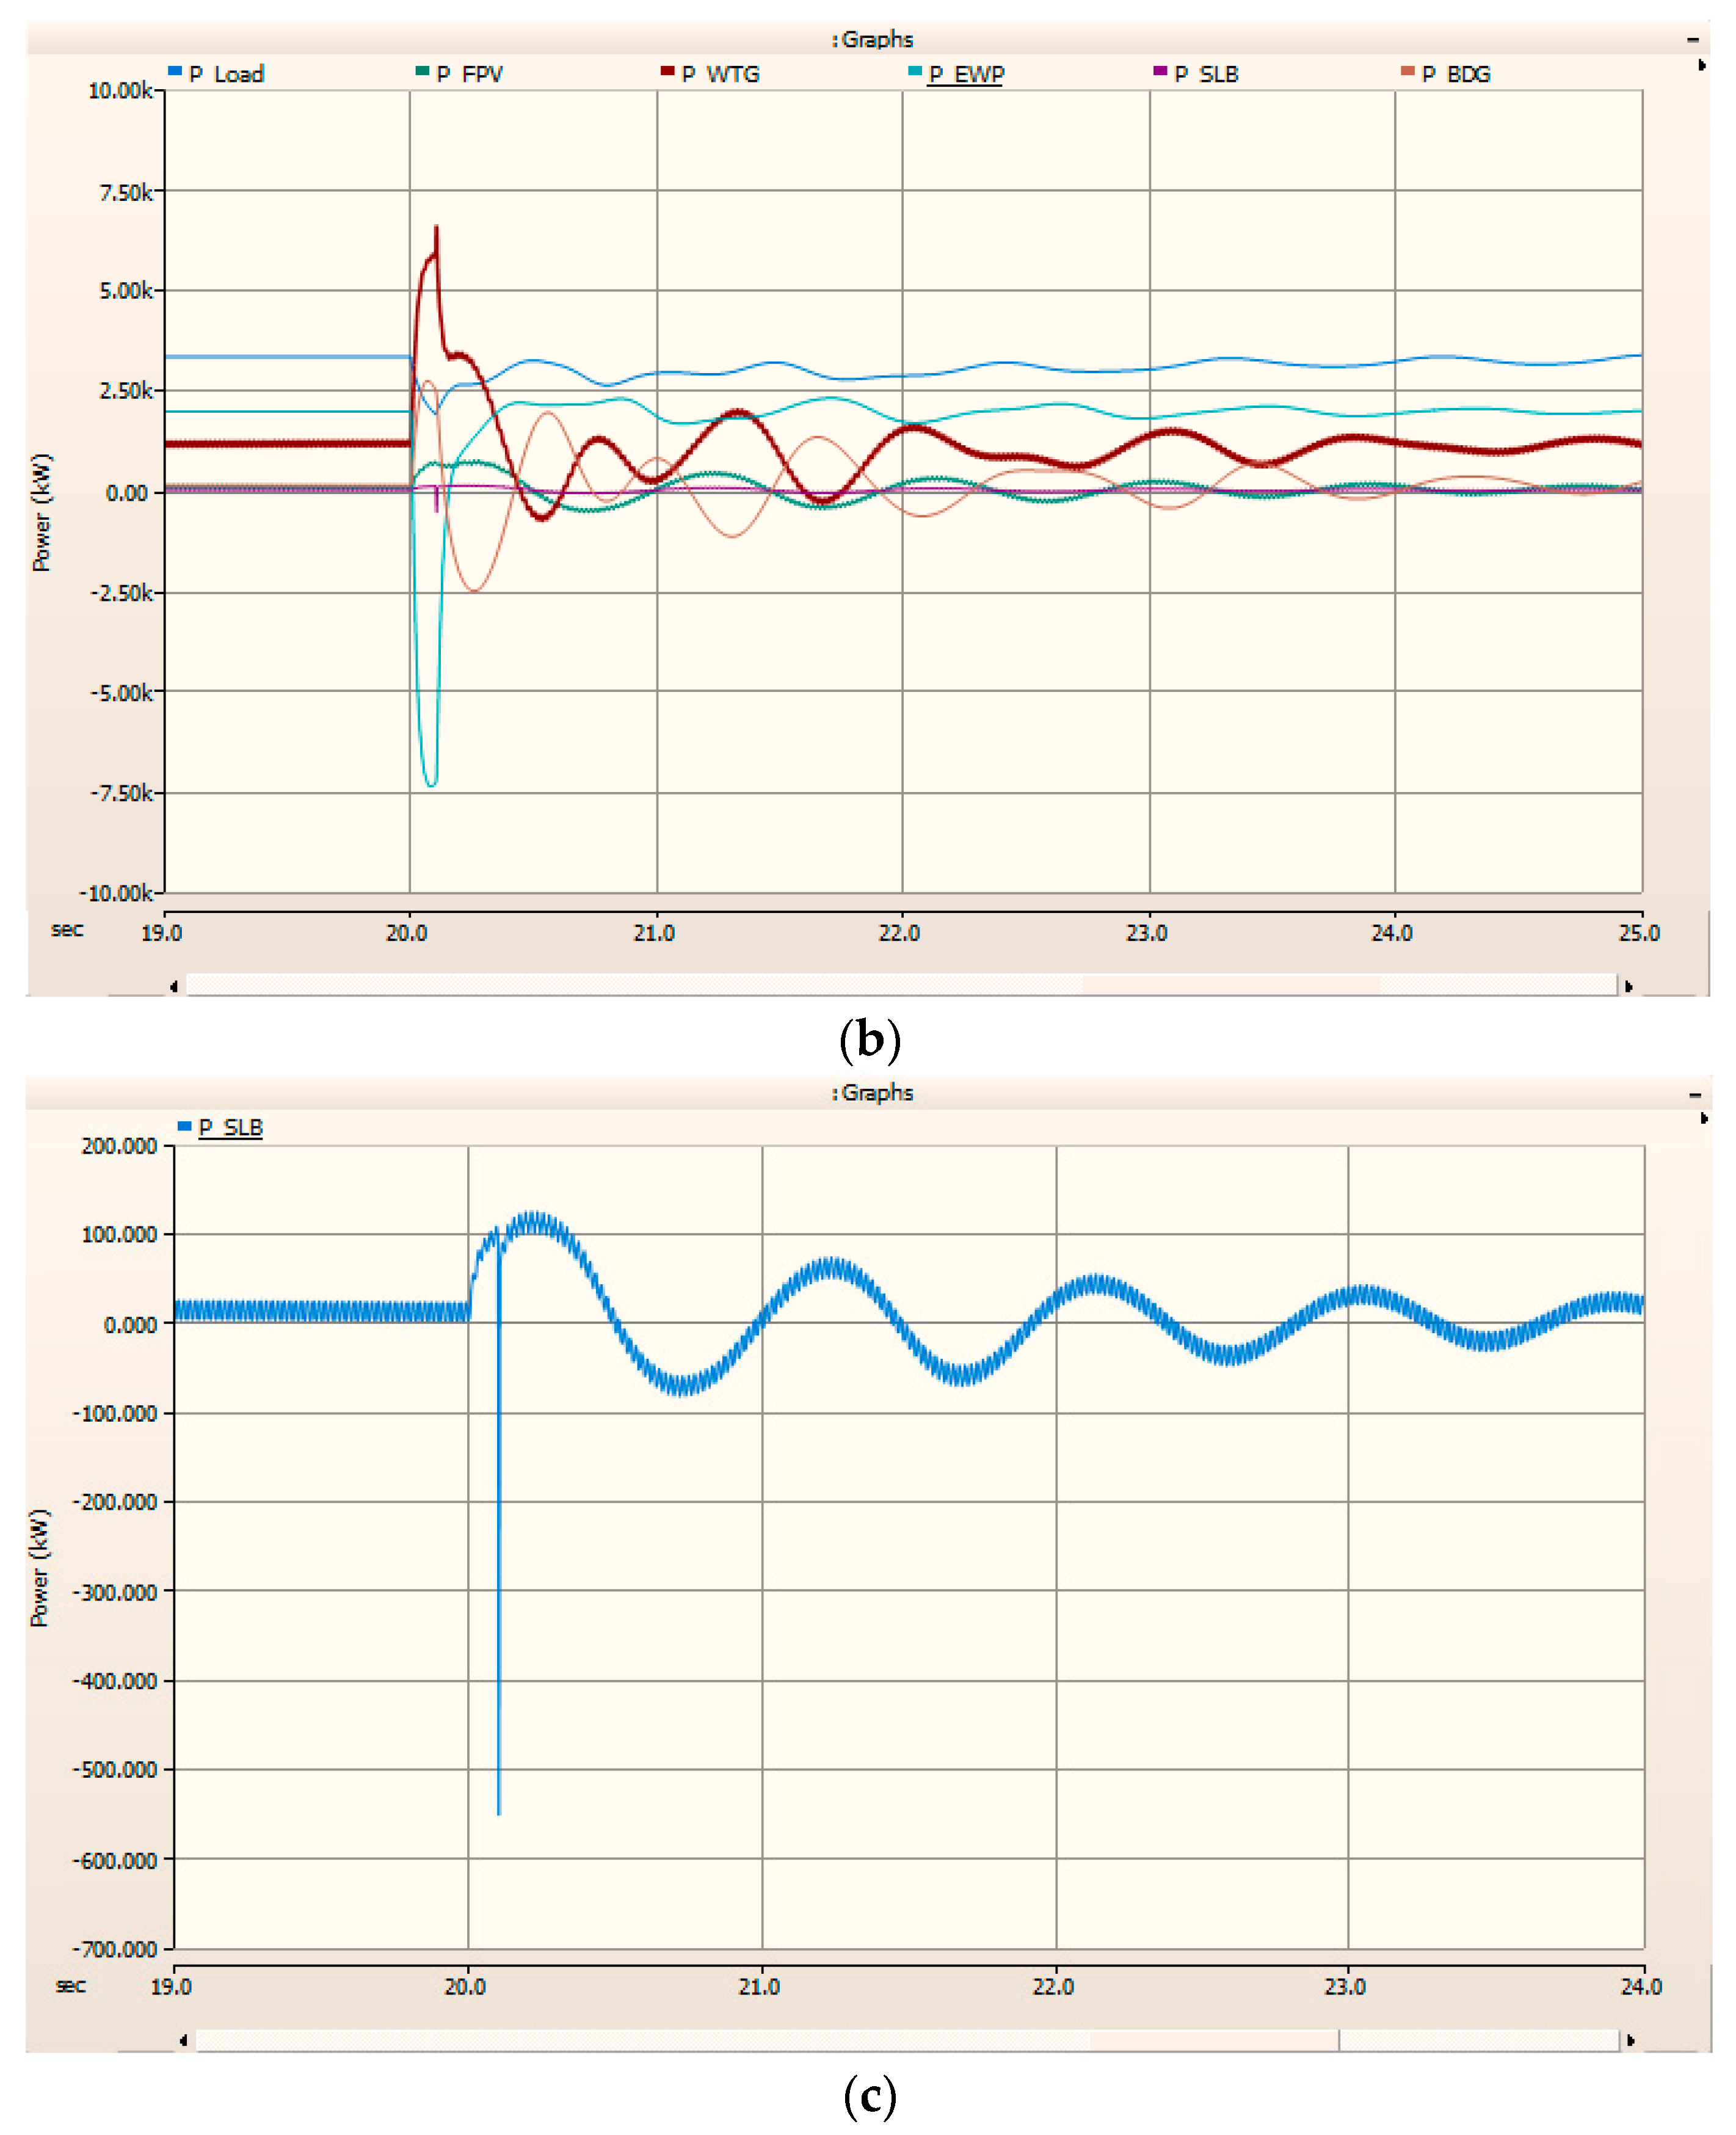
8.3.2. Microgrid Simulation with Second-Life Battery

In this scenario, the ground PV, floating PV, wind turbine generator, eco wave power, and bio-diesel generator are operated with the second-life battery. The various scenarios are built and described in the following sections.
  • Scenario 1: Short Circuit in the Eco Wave Power at t = 20 s.
At stable condition the active power share by the floating PV, wind turbine generator, eco wave power, bio-diesel generator and second-life battery are 72 kW, 1150 kW, 1956 kW, 122 kW and 21 kW, respectively. A three-phase faults occurs within the terminal of the eco wave power. The voltage and power deviations are shown in Figure 24. The performance of the second-life battery is satisfactory and acceptable. However, it does not respond as rapidly as a first-life battery. As a result, power and voltage fluctuate over an extended period of time.
  • Scenario 2: Sudden Drop of Load from 3000 kW to 2800 kW at t = 20 s.
The power is now shared by the FPV, WTG, EWP, BDG, and SLB. At t = 20 s, the load drops from 3000 kW to 2800 kW. The voltage and power deviate from the stable situation shown in Figure 25. The eco wave power responds swiftly in comparison to the second-life battery because the SLB has a higher resistance than the FLB and SC systems. After the generators have reached a stable condition, the power share is allocated proportionally among them.

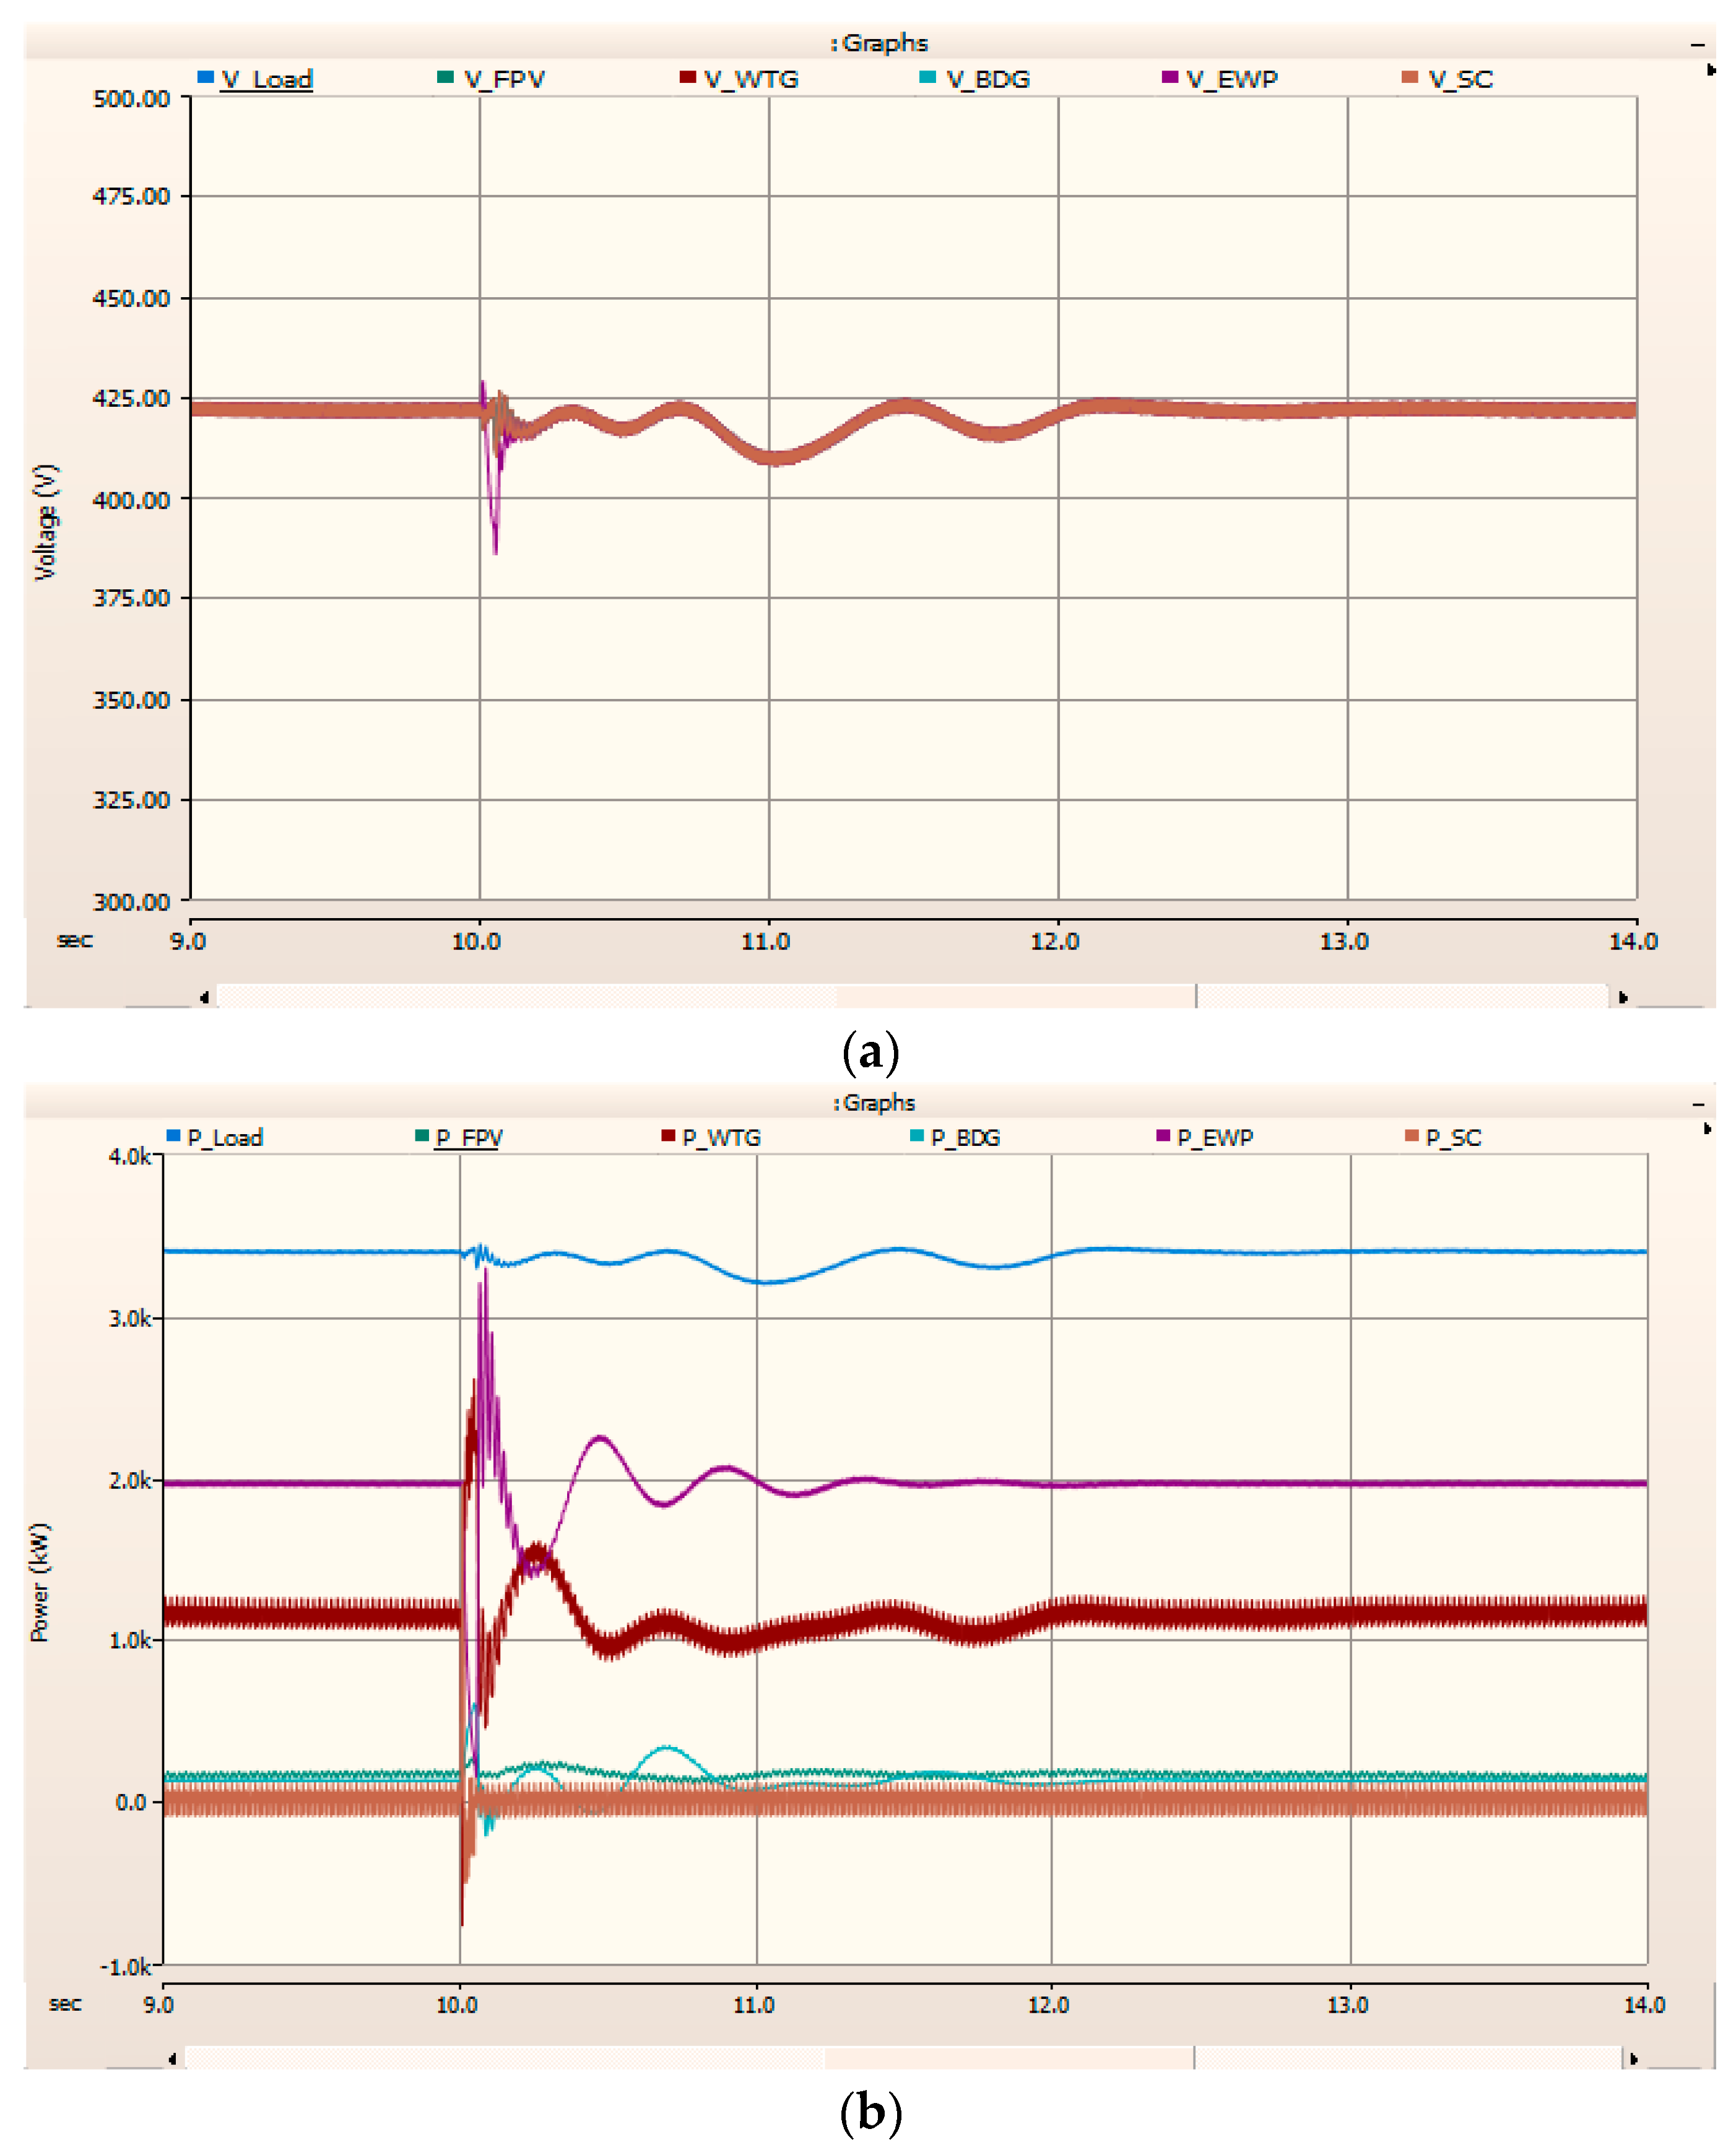
8.3.3. Microgrid Simulation with Supercapacitor

In this case, the floating PV, wind turbine generator, eco wave power, bio-diesel generator and supercapacitor are connected to the microgrid. The numerous scenarios are created and discussed below.
  • Scenario 1: Three-Phase-to-Ground Fault in Eco Wave Power at t = 10 s.
The average load is 3388 kW and random load variations of 100 kW are allowed. Before 10 s, in a stable condition, the power supplied by the FPV, WTG, EWP, BDG and SC are 175 kW, 1122 kW, 1955 kW, 9 kW and 9 kW, respectively, as shown in Figure 26. At t = 10 s, a three-phase-to-ground (3L-G) fault is applied to the eco wave power terminal for 0.2 s. As a result, the bus voltage drops and stabilizes at 421 V in a fraction of a second. In comparison to a first-life battery, the super capacitor releases and absorbs energy relatively quickly.
  • Scenario 2: Outages of Eco Wave Power (without SC and Solar) at t = 10 s.
For both the rainy season and for foggy weather, the solar PV system cannot generate electricity. We anticipated the battery would also not deliver any energy. The load is fulfilled by wind turbines, eco-wave power, and bio-diesel generators, which are the major power sources. The power and voltage in such circumstances are shown in Figure 27. The eco wave power is cut out at t = 10 s and then reconnects to the microgrid in 0.05 s. As a result, eco wave power voltage varies from stable conditions, with maximum decreases of 386 V. Within 0.25 s, though, the microgrid becomes stable. During such outages, the bio-diesel generator and wind turbine quickly share electricity.
  • Scenario 3: Outage of Eco Wave Power (with SC and Solar) at t = 10 s.
Now the solar and supercapacitor are added for the summer season in Scenario 2. Figure 28 shows the power share and voltage fluctuation in this case for the outage of eco wave power at t = 10 s. The supercapacitor response is quick; as a result, the system stabilizes quickly and there is less fluctuation.
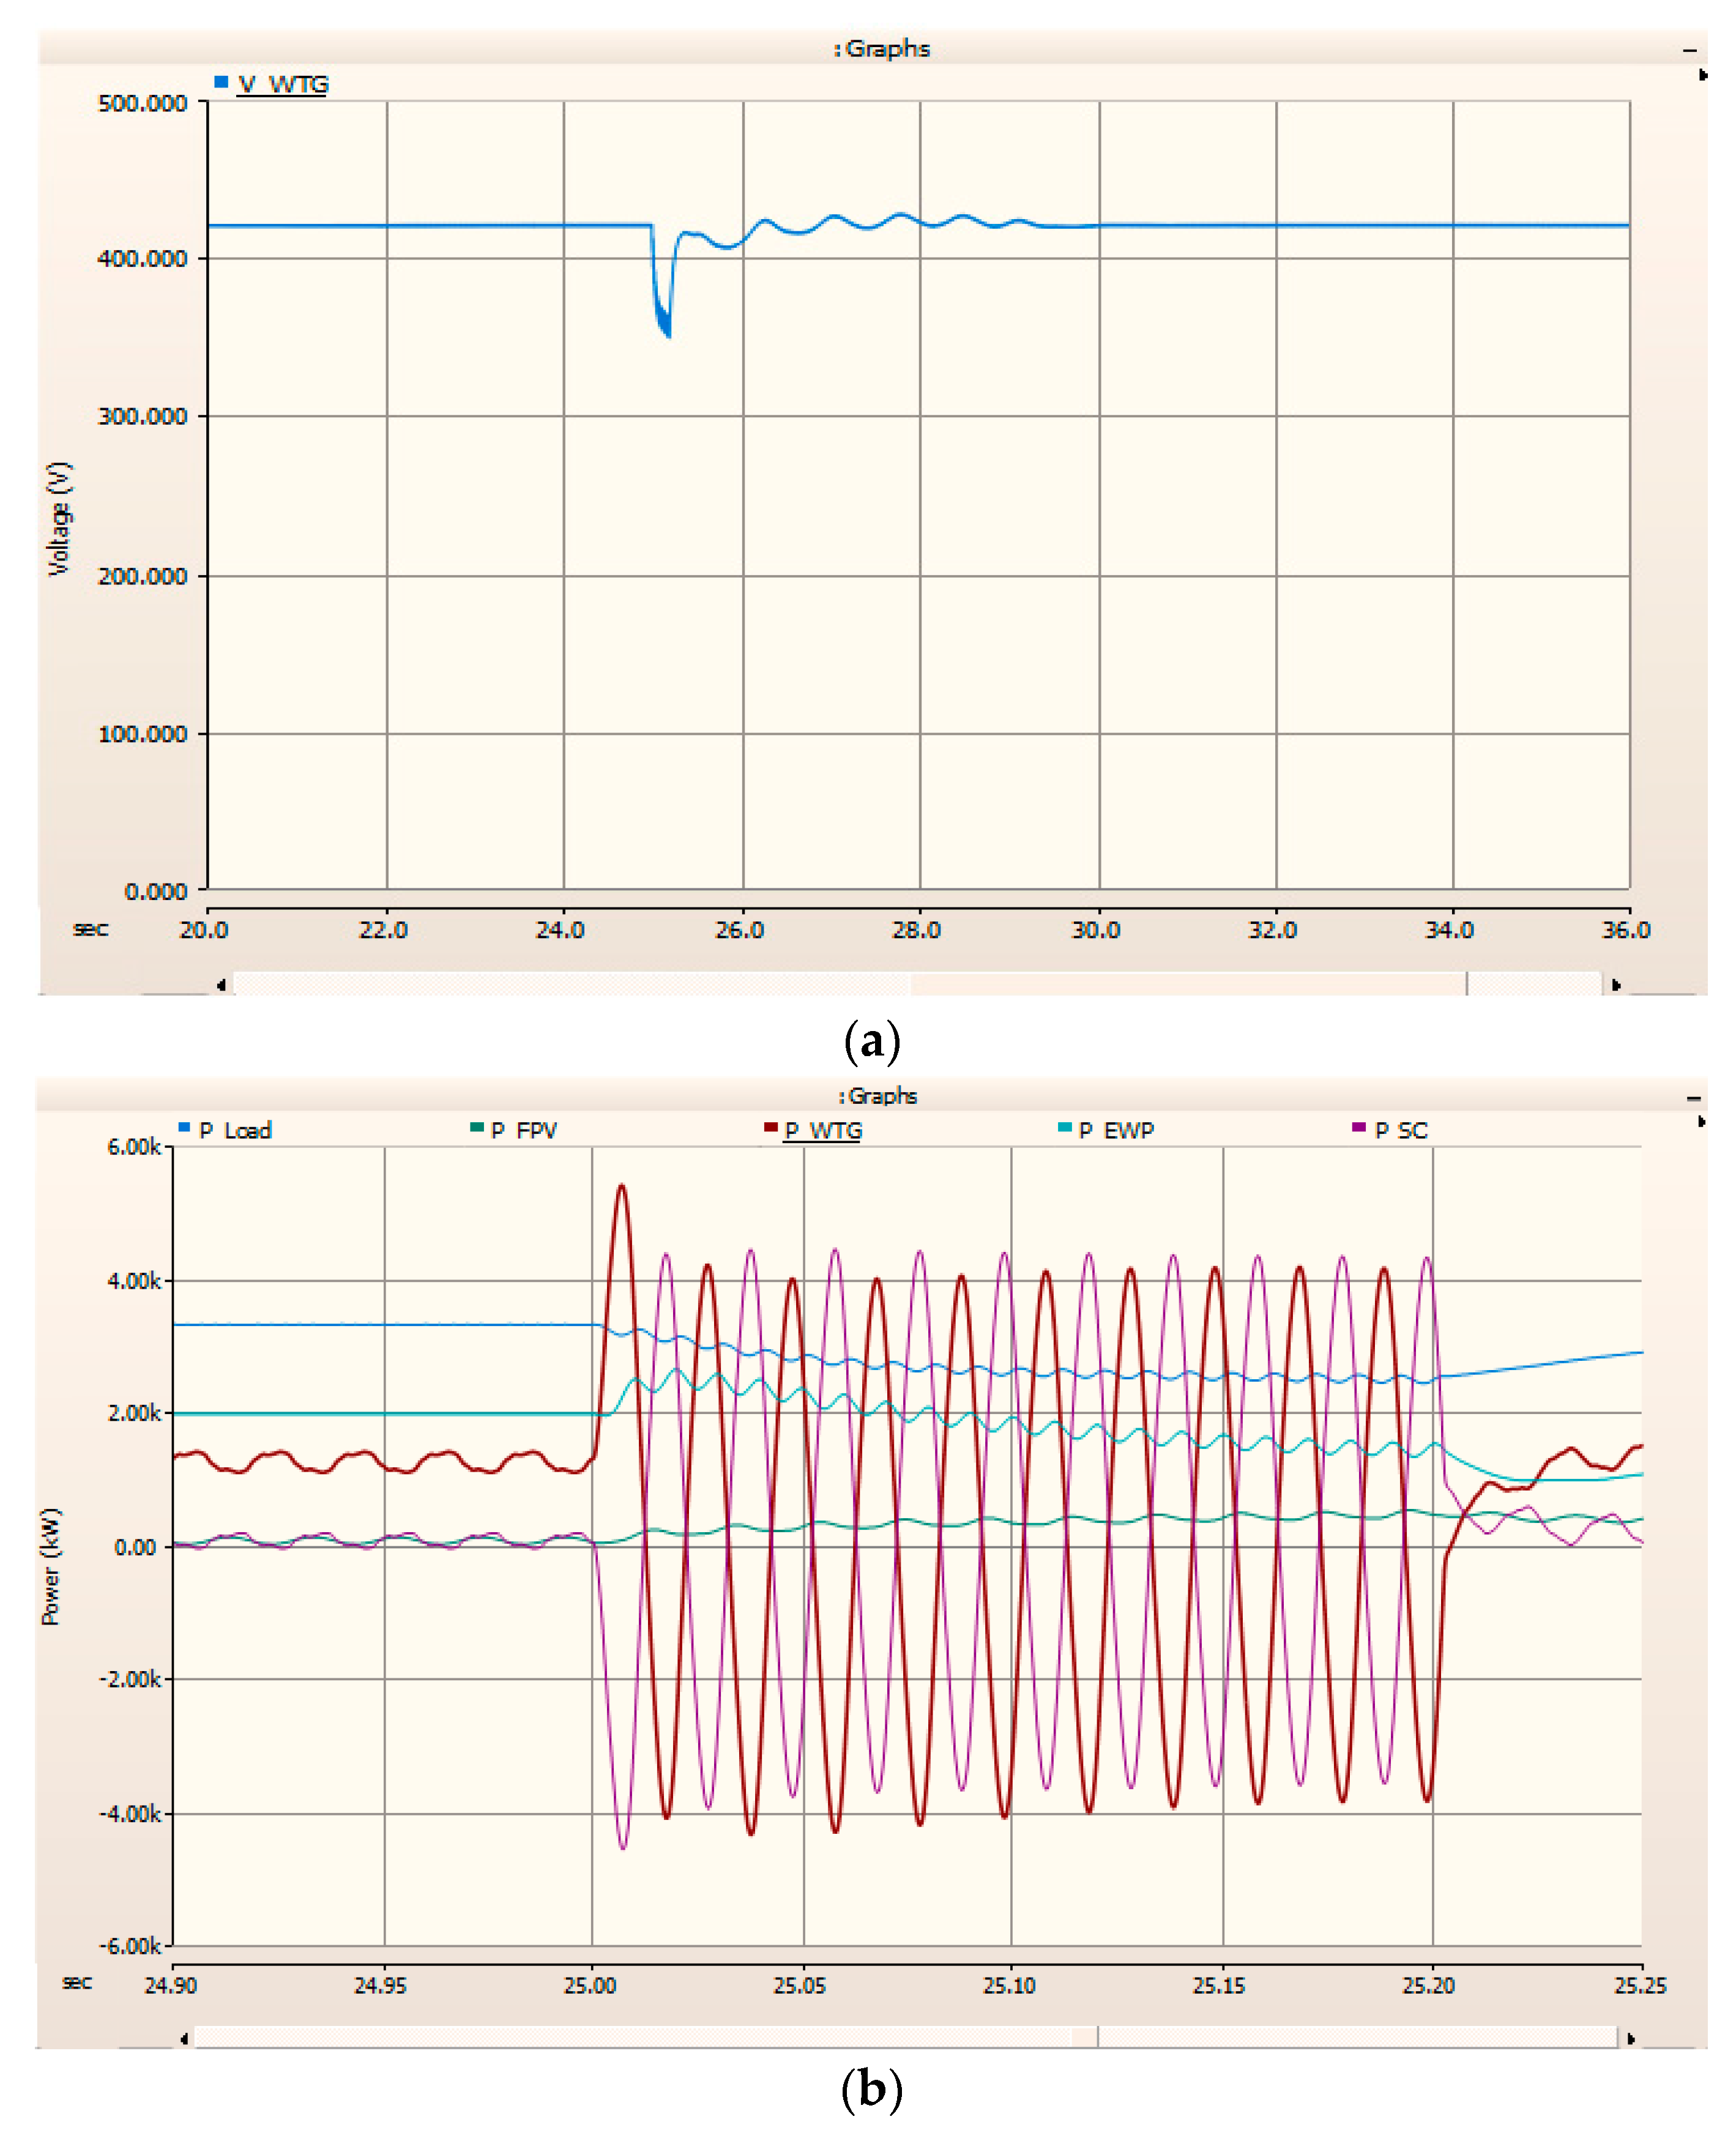
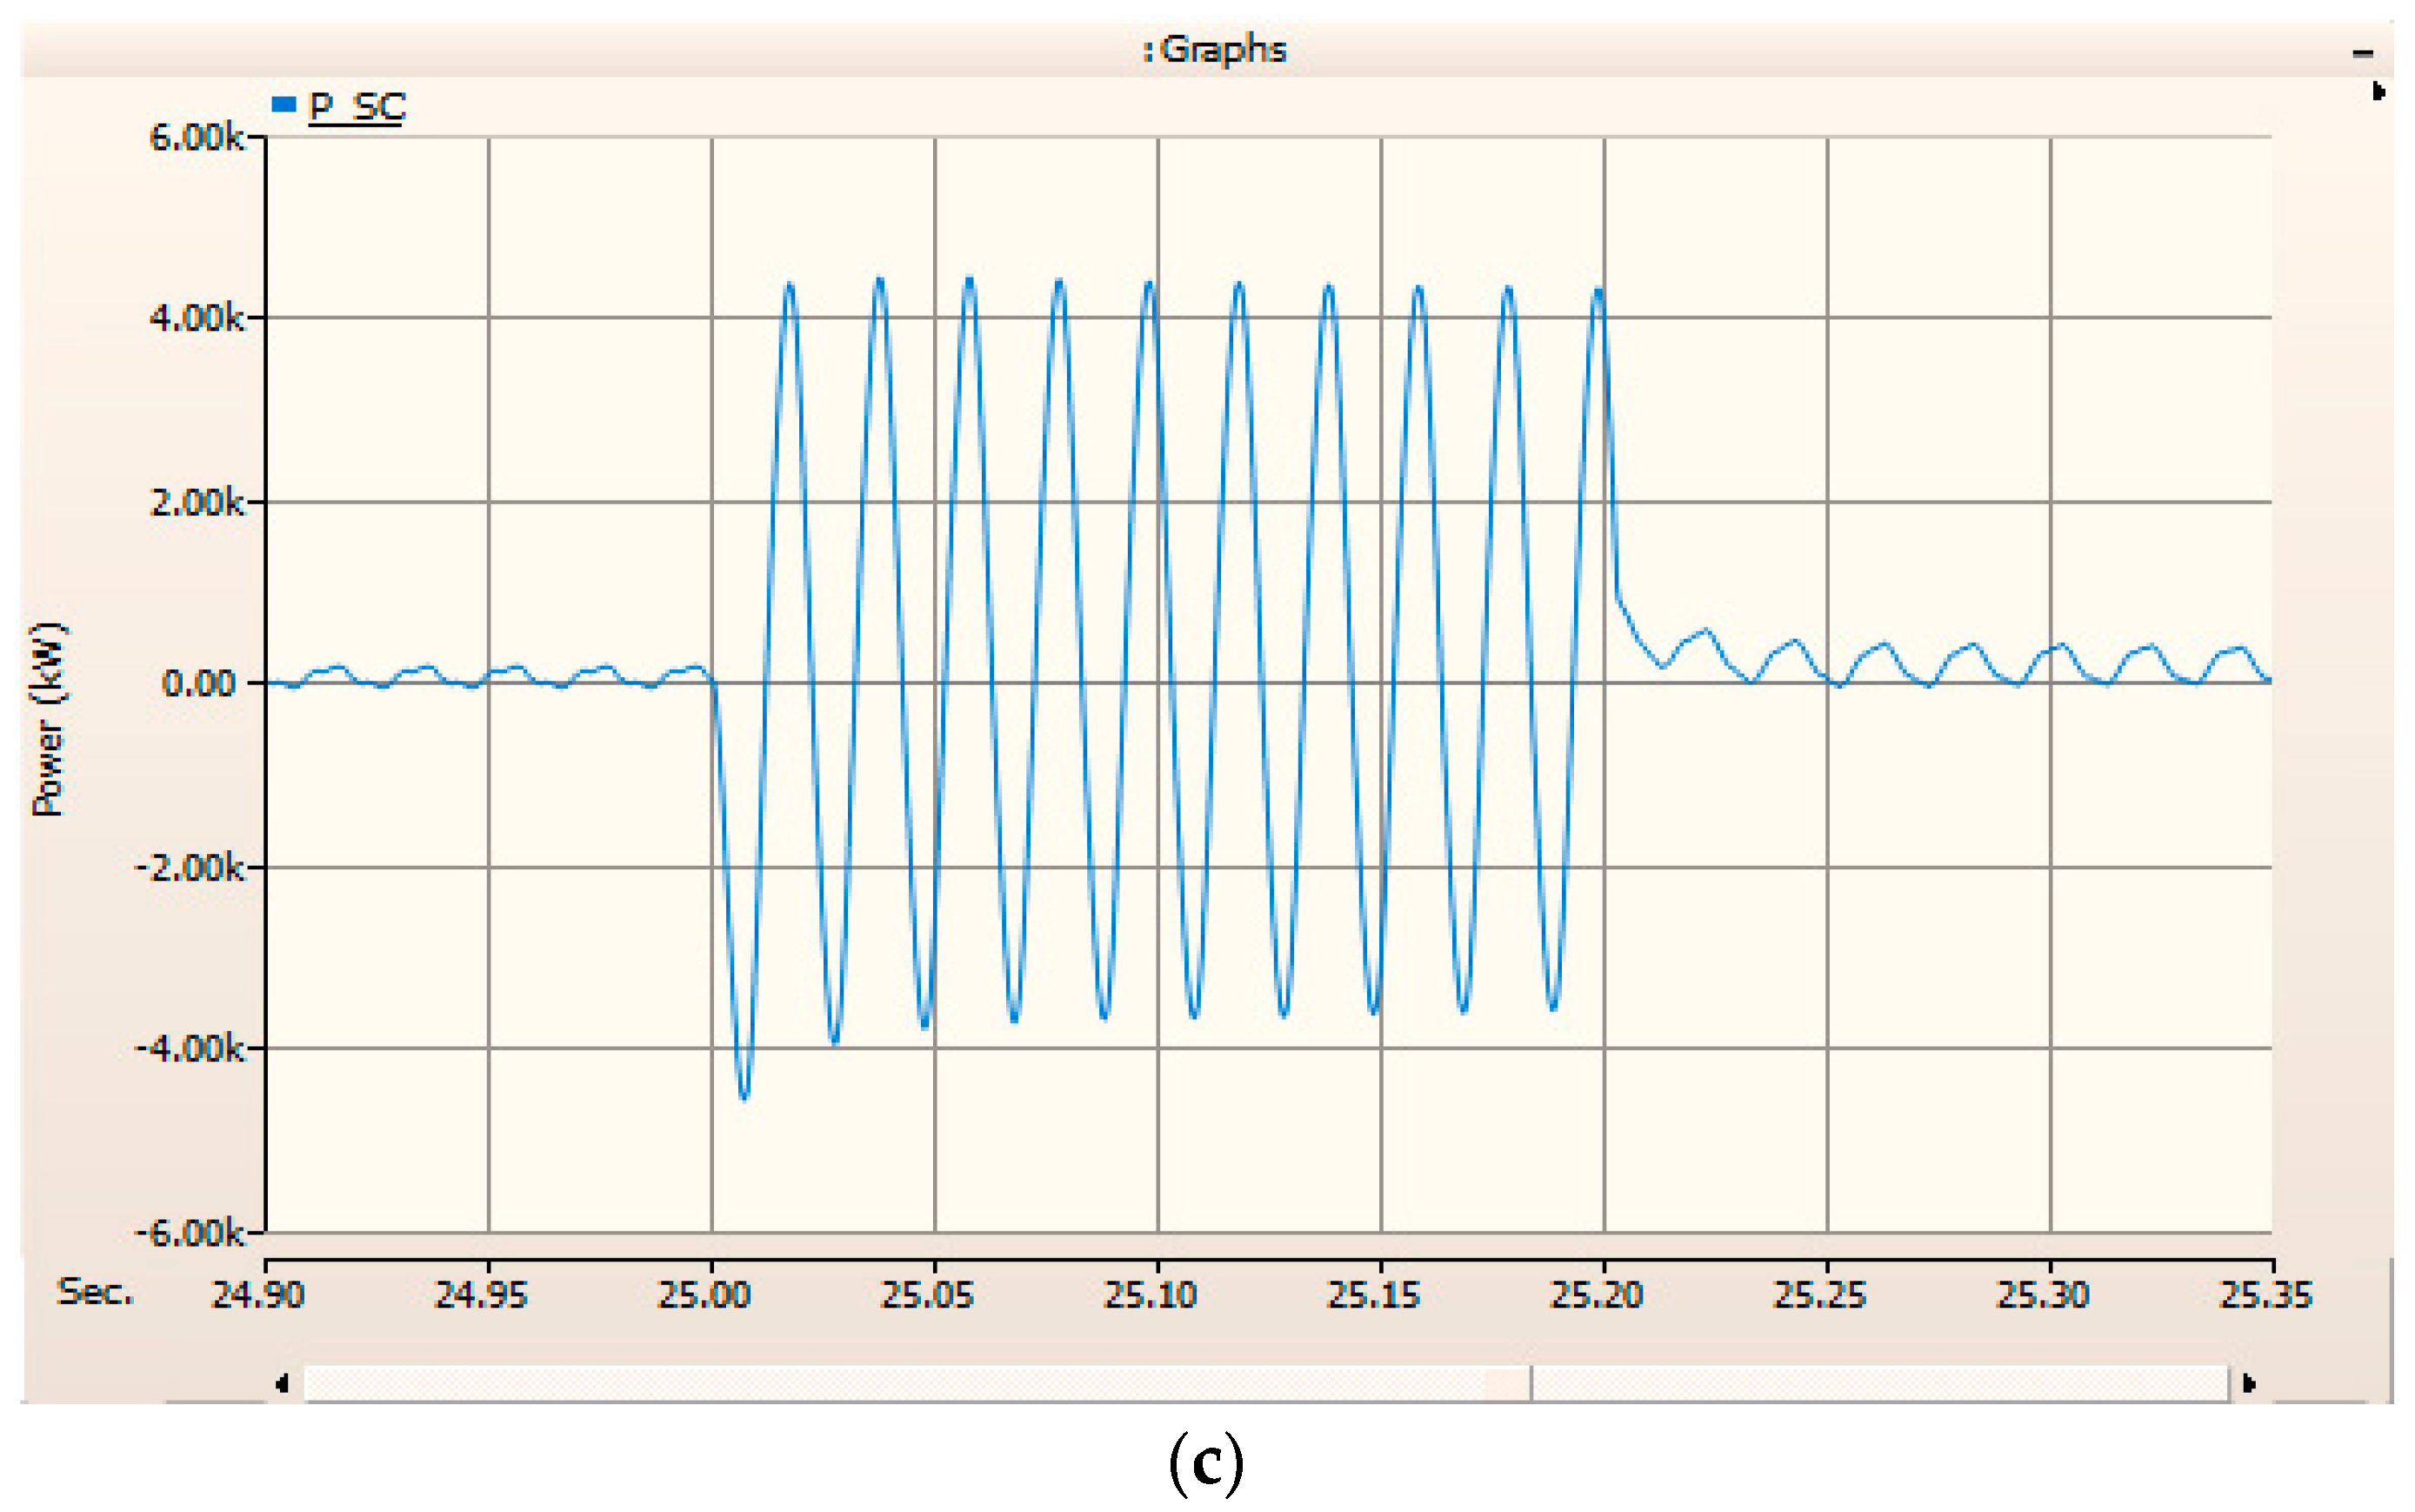
  • Scenario 4: Single-Line-to-Ground (L-G) Fault in Wind Turbine at t = 25 s.
In this case, the floating PV, wind turbine generator, eco wave power, bio-diesel generator and supercapacitor are connected to the microgrid. The average load is 3000 kW and random load variations of 100 kW are allowed. At t = 25 s, in a stable condition, the power supplied by the FPV, WTG, EWP, BDG and SC are 53 kW, 1246 kW, 121 kW, 1955 kW and 3 kW, respectively, as shown in Figure 29. At 25 s the single-line-to-ground (L-G) fault is applied for the duration of 0.2 s at the terminal of wind turbine generator. Consequently, the bus voltage drops and becomes steady-state at voltage 421 V.
  • Scenario 5: Outages of Wind Turbine Generator at t = 25 s.
The case is created by connecting the floating PV wind turbine generator with the supercapacitor. At time t = 25 s, the wind turbine outages and reconnects within 25.05 s. As a result, the voltage drops and power fluctuates as shown in Figure 30. The supercapacitor response is quick compared to other generators. Consequently, the system stabilises within 0.2 s.

9. Conclusions

This study has proposed microgrid energy management for smart city planning on Saint Martin’s Island of Bangladesh. It suggests a comprehensive smart city framework that includes smart city goals and criteria, as well as way of communication technology. Furthermore, a total of six microgrid scenarios composed of the ground PV, floating PV, wind turbine generator, eco wave power, bio-diesel generator, bidirectional AC/DC converter, first-life battery, second-life battery and supercapacitor was optimized by HOMER software. The first and second-life batteries were REVOV lithium-ion, while the supercapacitor was a Maxwell ultracapacitor. A microgrid that can achieve Sustainable Development Goal 7 was selected for Saint Martin’s Island. Finally, the PSCAD/EMTDC package analyzed the performance of the microgrid that demonstrated the different operating modes. The following are the major findings of this study about Saint Martin’s Island.
  • The seven essential criteria for being a smart city include smart energy, smart economy, smart tourism, smart environment, smart community, smart governance, and smart mobility. An island region needs to improve and rebuild its physical and communication infrastructure, including the Internet of things.
  • Three renewable energy sources—solar, wind, and wave—can supply the electricity needed for the island to operate as a smart city. The bio-diesel generator can only be used as a backup power source when the storage system releases all of its energy.
  • The best configuration to meet the requirements of Sustainable Development Goal 7 is a microgrid that consists of GPV, FPV, WTG, EWP, BDG, and SLB. The price of electricity is USD0.202 per kWh, which is reasonable, and electricity emits less carbon dioxide. Recycling second-hand batteries will lead to less pollution and ultimately less waste.
  • The supercapacitor-incorporated microgrid causes high energy costs, which is a burden for the islanders. However, it requires less storage space.
  • The performance of a supercapacitor is superior compared to first- and second-life batteries for stabilizing the microgrid. It responds quickly to mitigate microgrid disturbances. However, the frequency and voltage deviation characteristics of second-life batteries are still within acceptable limits and can satisfy the requirements of SDG 7 for reliable storage.
This work has some limitations. Further research on studied microgrid cases will aid in improving, overcoming, and unlocking more possibilities in Saint Martin.

Author Contributions

Conceptualization, M.A.-Z. and W.O.; methodology, M.A.-Z.; software, M.A.-Z.; validation, M.A.-Z., W.O. and M.J.H.; formal analysis, M.A.-Z. and W.O.; investigation, M.A.-Z.; resources, M.A.-Z.; data curation, M.A.-Z. and W.O.; writing—original draft preparation, M.A.-Z.; writing—review and editing, M.A.-Z., W.O. and M.J.H.; visualization, M.A.-Z., W.O. and M.J.H.; supervision, M.A.-Z. and W.O.; project administration, M.A.-Z., W.O. and M.J.H. All authors have read and agreed to the published version of the manuscript.

Funding

This research received no external funding.

Data Availability Statement

Not applicable.

Conflicts of Interest

The authors declare no conflict of interest.

Abbreviations

The following abbreviations are used in this manuscript:
GPVGround Photovoltaic
FPVFloating Photovoltaic
WTGWind Turbine Generator
BDGBio-Diesel Generator
EWPEco Wave Power
BDCBidirectional Converter
FLBFirst-life Battery
SLBSecond-life Battery
SCSupercapacitor
SDG 7Sustainable Development Goal 7
PSCADPower Systems Computer Aided Design
EMTDCElectromagnetic Transient including Direct Current
IoTInternet of Things

Appendix A

Table A1. Monthly Averaged Wind Speed and Solar Data and Sea states.
SIMonthSolar DataWind Speed (m/s)Sea States at Depth 13.3 m and Distance from Island 5 km
Average Isolation
(kWh/m2/Day)
Clearness IndexWave Height (m)Wave Period (s)
1.January5.040.6113.830.5902.796
2.February5.560.6163.970.7663.343
3.March6.160.6054.170.9333.769
4.April6.410.5524.291.4294.448
5.May5.480.5284.551.5844.967
6.June5.470.3907.331.8015.398
7.July3.540.3627.431.8615.293
8.August3.600.4036.601.6945.276
9.September4.270.4174.741.5355.225
10.October4.730.5743.821.3074.771
11.November4.570.5963.791.2114.225
12.December4.740.6483.630.9073.318
Average4.840.5254.851.3024.402
Table A2. Assumed Power Matrix of Eco Wave Power for 100 kW Generator at Saint Martin’s Island.
Wave Period, Te (s)
1234567
Wave height
Hs (m)
0.50005102015
100012203025
1.5001530405040
2002050557050
2.5003065708070
30060709010090
3.50107090100100100
401580100100100100
Table A3. Microgrid Component Prices.
SIComponent NameCapital CostReplacement CostOperation and Maintenance CostLifetime
ValueUnitValueUnitValueUnitValueUnit
1.Ground photovoltaic2000$/kW1340$/kW26$/kW/year25years
2.Floating photovoltaic2500$/kW1675$/kW32.5$/kW/year25years
3.Wind turbine generator2500$/kW1750$/kW75$/kW/year20years
4.Eco wave power5480$/kW4384$/kW274$/kW/year20years
5.Bio-diesel generator370$/kW296$/kW0.05$/hours1500hours
6.Bidirectional converter800$/kW750$/kW5$/kW15years
7.First-life battery3800$/Qty3040$/Qty5$/kW/year10years
8.Second-life battery3100$/Qty2480S/Qty10$/kW/year10years
9.Supercapacitor60$/Qty45$/Qty0$/Qty/year30years

References

  1. Mazumder, P.; Jamil, M.H.; Das, C.K.; Matin, M.A. Hybrid energy optimization: An ultimate solution to the power crisis of St. Martin Island, Bangladesh. In Proceedings of the 9th International Forum on Strategic Technology, Cox’s Bazar, Bangladesh, 21–23 October 2014; pp. 363–368. [Google Scholar] [CrossRef]
  2. Mousumi, S.U.; Asaduzzaman, M.; Abu Zardar, M.; Ziaul, I.K. Techno-Economic Evaluation of Hybrid Supply System for Sustainable Powering the Saint Martin Island in Bangladesh. J. Energy Technol. 2021, 1, 9–23. [Google Scholar] [CrossRef]
  3. Amin, M.R.; Roy, R.B.; Hasan, M.M. Modeling and Optimization of Decentralized Microgrid System for St. Martin’s Island in Bangladesh. Int. J. Energy Inf. Commun. 2014, 5, 1–12. [Google Scholar] [CrossRef]
  4. Masrur, H.; Howlader, H.O.R.; Lotfy, M.E.; Khan, K.R.; Guerrero, J.M.; Senjyu, T. Analysis of techno-economic-environmental suitability of an isolated microgrid system located in a remote island of Bangladesh. Sustainability 2020, 12, 2880. [Google Scholar] [CrossRef]
  5. Siddiqui, M.S.I.; Ahasan, A.; Islam, N.; Kundu, P.; Munshi, M.N.; Chowdhury, E.H. Peste des Petits Ruminants (PPR) virus antibodies in goats and cattle of the Saint Martin’s Island in Bangladesh. Bangladesh Vet. 2014, 31, 55–59. [Google Scholar] [CrossRef]
  6. Shahriar, T.; Habib, M.A.; Hasanuzzaman, M.; Shahrear-Bin-Zaman, M. Modelling and optimization of Searaser wave energy converter based hydroelectric power generation for Saint Martin’s Island in Bangladesh. Ocean. Eng. 2019, 192, 106289. [Google Scholar] [CrossRef]
  7. Roy, S.; Rhaman, M.M. Hybrid Solar Power Plant in Saint Martin’s Island can Enlarge Tourist Attraction in Bangladesh. Int. J. Eng. Manuf. 2016, 3, 12–22. [Google Scholar] [CrossRef]
  8. Jaman, S. Techno-Economic Analysis of a Solar PV-Fuel cell based hybrid energy system for St. Martin Island Using HOMER. SEU J. Sci. Eng. 2018, 12, 30–38. [Google Scholar]
  9. Islam, A.K.M.S.; Rahmana, M.M.; Mondal, M.A.H.; Alam, F. Hybrid energy system for St. Martin Island, Bangladesh: An optimized model, International Energy Congress. Procedia Eng. 2012, 49, 179–188. [Google Scholar] [CrossRef]
  10. Zaman, M.A.; Ongsakul, W. Hybrid Microgrid Optimization for Smart City Planning on Saint Martin’s Island in Bangladesh. In Proceedings of the International Conference and Utility Exhibition, Pattaya, Thailand, 26–28 October 2022; pp. 1–16. [Google Scholar] [CrossRef]
  11. Hossain, A.A. Design and Economic Analysis of PV-Biogas-Diesel Generator Hybrid System for St. Martin’s Island. Master’s Thesis, BUET, Dhaka, Bangladesh, 2015. Available online: http://lib.buet.ac.bd:8080/xmlui/handle/123456789/4429 (accessed on 10 January 2023).
  12. Karim, M.M.; Noman, A.T.; Imran, M.Z.A.; Zaman, M.A.U.; Rashid, H.; Al Mamun, K.A. Feasibility Analysis and A Proposal For 1.3 MW Hybrid Renewable Power Plant for Saint-Martins Island Using HOMER. In Proceedings of the International Conference on Electrical, Computer and Communication Engineering, West Bengal, India, 18–19 January 2019. [Google Scholar] [CrossRef]
  13. Kumar, N.M.; Goel, S.; Mallick, P.K. Smart cities in India: Features, policies, current status, and challenges. In Proceedings of the 2018 IEEE Technologies for Smart-City Energy Security and Power, Bhubaneswar, India, 28–30 March 2018; pp. 1–4. [Google Scholar] [CrossRef]
  14. Anand, P.B.; Navío-Marco, J. Governance and economics of smart cities: Opportunities and challenges. Telecomm. Policy 2018, 42, 795–799. Available online: https://bradscholars.brad.ac.uk/handle/10454/16654 (accessed on 13 January 2023). [CrossRef]
  15. Calvillo, C.F.; Sánchez-Miralles, A.; Villar, J. Energy management and planning in smart cities. Renew. Sustain. Energy Rev. 2016, 55, 273–287. [Google Scholar] [CrossRef]
  16. Bracco, S.; Delfino, F.; Laiolo, P.; Pagnini, L.; Piazza, G. Evaluating LCOE in sustainable microgrids for smart city applications. In Proceedings of the E3S Web of Conferences 113, Savona, Italy, 4–6 September 2019; Volume 19, pp. 1–6. [Google Scholar] [CrossRef]
  17. Suhasfan, P.; Setiawan, E.A. The optimum simulation analysis of sustainable microgrid electricity system based on hybrid power plant on Tunda island, Banten province. J. Res. Soc. Sci. Econ. Manag. 2022, 1, 931–937. [Google Scholar] [CrossRef]
  18. Callejo, L.H.; Monge, O.I.; Obregón, L.J. Electric Microgrid in Smart Cities: CEDER-CIEMAT a Case Study. Smart Cities, Communications in Computer and Information. Science 2019, 1152, 176–184. [Google Scholar]
  19. Silva, B.N.; Khan, M.; Jung, C.; Seo, J.; Yoon, Y.; Kim, J. Planning of smart cities: Performance improvement using big data analytics approach. In Proceedings of the Fourth International Conference on Advances in Computing, Electronics and Communication Institute of Research Engineers and Doctors, Rome, Italy, 15–16 December 2016; pp. 51–55. Available online: https://www.seekdl.org/conferences/get/paper/8432.html (accessed on 18 January 2023).
  20. Silva, B.N.; Khan, M.; Han, K. Futuristic Sustainable Energy Management in Smart Environments: A Review of Peak Load Shaving and Demand Response Strategies, Challenges, and Opportunities. Sustainability 2020, 12, 5561. [Google Scholar] [CrossRef]
  21. Szum, K. IoT-based smart cities: A bibliometric analysis and literature review. Eng. Manag. Prod. Serv. 2021, 13, 115–136. [Google Scholar] [CrossRef]
  22. Hoang, A.T.; Pham, V.V.; Nguyen, X.P. Integrating renewable sources into energy system for smart city as a sagacious strategy towards clean and sustainable process. J. Clean. Prod. 2021, 305, 127161. [Google Scholar] [CrossRef]
  23. Thellufsen, J.Z.; Lund, H.; Sorknæs, P.; Østergaard, P.A.; Chang, M.; Drysdale, D.; Nielsen, S.; Djørup, S.R.; Sperling, K. Smart energy cities in a 100% renewable energy context. Renew. Sustain. Energy Rev. 2020, 129, 109922. [Google Scholar] [CrossRef]
  24. Das, B.K.; Hassan, R.; Tushar, M.S.H.K.; Zaman, F.; Hasan, M.; Das, P. Techno-economic and environmental assessment of a hybrid renewable energy system using multi-objective genetic algorithm: A case study for remote Island in Bangladesh. Energy Convers. Manag. 2021, 230, 113823. [Google Scholar] [CrossRef]
  25. Available online: www.sdgs.un.org (accessed on 12 January 2023).
  26. Hubble, A.H.; Ustun, T.S. Composition, placement, and economics of rural microgrids for ensuring sustainable development. Sustain. Energy Grids Netw. 2018, 13, 1–18. [Google Scholar] [CrossRef]
  27. Available online: www.pscad.com (accessed on 9 January 2023).
  28. Barcelos, S.L.; de Matos, J.G.; de Souza Ribeiro, L.A. Modelling and Analysis of the Isolated Microgrid Installed at the Lençóis Island using PSCAD/EMTDC. In Proceedings of the 15th Brazilian Power Electronics Conference and 5th IEEE Southern Power Electronics Conference, Santos, Brazil, 1–4 December 2019. [Google Scholar] [CrossRef]
  29. Kyle, H. PSCAD Modeling and Stability Analysis of a Microgrid. Master’s Thesis, California Polytechnic State University, San Luis Obispo, CA, USA, 2017. Available online: https://digitalcommons.calpoly.edu/theses/1928/ (accessed on 21 January 2023).
  30. Nguyen, T.A.; Qiu, X.; Gamage, T.T.; Crow, M.L.; Mcmillin, B.M.; Elmore, A.C. Microgrid Application with Computer Models and Power Management Integrated Using PSCAD/EMTDC. In Proceedings of the North American Power Symposium, Boston, MA, USA, 4–6 August 2011. [Google Scholar] [CrossRef]
  31. Mandal, S.; Das, B.K.; Hoque, N. Optimum sizing of a stand-alone hybrid energy system for rural electrification in Bangladesh. J. Clean. Prod. 2018, 200, 12–27. [Google Scholar] [CrossRef]
  32. Nurunnabi, M.; Roy, N.K.; Hossain, E.; Pota, H.R. Size optimization and sensitivity analysis of hybrid wind/PV micro-grids—A case study for Bangladesh. IEEE Access 2019, 7, 150120–150140. [Google Scholar] [CrossRef]
  33. Available online: https://www.homerenergy.com/ (accessed on 14 January 2023).
  34. Curto, D.; Franzitta, V.; Guercio, A. Sea wave energy. A review of the current technologies and perspectives. Energies 2021, 14, 6604. [Google Scholar] [CrossRef]
  35. Cascajo, R.; García, E.; Quiles, E.; Morant, F.; Correcher, A. Wave energy assessment at valencia gulf and comparison of energy production of most suitable wave energy converters. Int. J. Environ. Res. Public Health 2020, 17, 8473. [Google Scholar] [CrossRef] [PubMed]
  36. Available online: www.ecowavepower.com (accessed on 17 January 2023).
  37. Chowdhury, T.; Chowdhury, H.; Hasan, S.; Rahman, M.S.; Bhuiya, M.M.K.; Chowdhury, P. Design of a stand-alone energy hybrid system for a makeshift health care center: A case study. J. Build. Eng. 2021, 40, 102346. [Google Scholar] [CrossRef]
  38. Das, M.; Islam, M.R.; Shazeeb, T.I. Analysis of Wave Energy Resources Around the Saint Martin Island in Bangladesh. J. Mar. Sci. Appl. 2021, 20, 248–267. [Google Scholar] [CrossRef]
  39. Gorjian, S.; Sharon, H.; Ebadi, H.; Kant, K.; Scavo, F.B.; Tina, G.M. Recent technical advancements, economics and environmental impacts of floating photovoltaic solar energy conversion systems. Elsevier Ltd. J. Clean. Prod. 2021, 278, 124285. [Google Scholar] [CrossRef]
  40. Arevalo, P.; Cano, A.; Benavides, J.; Jurado, F. Feasibility study of a renewable system (PV/HKT/GB) for hybrid tramway based on fuel cell and super capacitor. IET Renew. Power Gener. 2021, 15, 491–503. [Google Scholar] [CrossRef]
  41. Simões, M.G.; Palle, B.; Chakraborty, S.; Uriarte, C. Electrical Model Development and Validation for Distributed Resources. 2007. Available online: http://www.osti.gov/bridge (accessed on 13 January 2023).
  42. Yao, L.W.; Aziz, J.A. High capacity LiFePo 4 battery model with consideration of nonlinear capacity effects. In Proceedings of the 2012 IEEE 7th International Power Electronics and Motion Control Conference—ECCE Asia, Harbin, China, 2–5 June 2012; Volume 1, pp. 182–187. [Google Scholar] [CrossRef]
  43. Tong, S.J.; Same, A.; Kootstra, M.A.; Park, J.W. Off-grid photovoltaic vehicle charge using second life lithium batteries: An experimental and numerical investigation. Appl. Energy 2013, 104, 740–750. [Google Scholar] [CrossRef]
  44. Parvini, Y.; Siegel, J.B.; Stefanopoulou, A.G.; Vahidi, A. Supercapacitor Electrical and Thermal Modeling, Identification, and Validation for a Wide Range of Temperature and Power Applications. IEEE Trans. Ind. Electron. 2016, 63, 1574–1585. [Google Scholar] [CrossRef]
  45. Zhang, L. Modelling and State-of-Charge Estimation for Ultracapacitors in Electric Vehicles. Ph.D. Thesis, UTS, Singapore, 2016. Available online: https://opus.lib.uts.edu.au (accessed on 20 March 2023).
  46. Prasanthi, A.; Shareef, H.; Asna, M.; Asrul Ibrahim, A.; Errouissi, R. Optimization of hybrid energy systems and adaptive energy management for hybrid electric vehicles. Energy Convers. Manag. 2021, 243, 114357. [Google Scholar] [CrossRef]
  47. Shoeb, M.A.; Shaflluah, G.M. Renewable energy integrated islanded microgrid for sustainable irrigation: A Bangladesh perspective. Energies 2018, 11, 1283. [Google Scholar] [CrossRef]
  48. Rahman, M.M.; Hettiwatte, S.; Shafiullah, G.M.; Arefi, A. An analysis of the time of use electricity price in the residential sector of Bangladesh. Energy Strategy Rev. 2017, 18, 183–198. [Google Scholar] [CrossRef]
  49. Nandi, S.K.; Ghosh, H.R. A wind PV-battery hybrid power system at Sitakunda in Bangladesh. Energy Policy 2009, 37, 3659–3664. [Google Scholar] [CrossRef]
  50. Chowdhury, S.A.; Aziz, S.; Groh, S.; Kirchhoff, H.; Filho, W.L. Off-grid rural area electrification through solar-diesel hybrid minigrids in Bangladesh: Resource effcient design principles in practice. J. Cleaner Prod. 2015, 95, 194–202. [Google Scholar] [CrossRef]
  51. ESMAP. Mini-Grids in Bangladesh: A Case Study of An Incipient Market; World Bank: Washington, DC, USA, 2017; Available online: https://documents.worldbank.org/en/publication/documents-reports/documentdetail/669331512390210193/mini-grids-in-bangladesh-a-case-study-of-an-incipient-market (accessed on 24 January 2023).
  52. Collen, Z. A study into the techno-economic feasibility of photovoltaic and wind generated electricity for enhancement of sustainable livelihoods on Likoma Island in Malawi. Ph.D. Thesis, Loughborough University, Loughborough, UK, 2015. Available online: https://dspace.lboro.ac.uk/2134/16630 (accessed on 20 March 2023).
  53. Esfandyari, A.; Norton, B.; Conlon, M.; McCormack, S.J. Performance of a campus photovoltaic electric vehicle charging station in a temperate climate. Sol. Energy 2019, 177, 762–771. [Google Scholar] [CrossRef]
Figure 1. Saint Martin’s Island Map.
Energies 16 04088 g001
Figure 2. Application of the Internet of Things in Smart City Development.
Energies 16 04088 g002
Figure 3. Design Model for a Smart Energy System.
Energies 16 04088 g003
Figure 4. Studied Microgrid System.
Energies 16 04088 g004
Figure 5. Eco Wave Power [36].
Energies 16 04088 g005
Figure 6. Solar System in PSCAD (a) Solar Cell Model (b) Grid connection of solar panel (c) MPPT tracker (d) MPPT tracker ON/OFF.
Energies 16 04088 g006aEnergies 16 04088 g006b
Figure 7. Wind Turbine Design: (a) generator model, (b) turbine-governor model.
Energies 16 04088 g007
Figure 8. Design of Eco Wave Power Plant: (a) permanent magnet synchronous generator, (b) control circuit (c) accumulator.
Energies 16 04088 g008
Figure 9. Bio-Diesel Generator Model: (a) Bio-diesel engine generator, (b) Woodward governor model.
Energies 16 04088 g009
Figure 10. Modeling of First-life Battery: (a) circuit diagram, (b) open circuit voltage, (c) series resistance (Rs), first order polarization resistance (Rp1), second order polarization resistance (Rp2), first order polarization capacitance (Cp1), and second order polarization capacitance (Cp2).
Energies 16 04088 g010
Figure 11. Modeling of second-life battery: (a) circuit diagram, (b) open circuit voltage, (c) series resistance (Rs), polarization resistance (Rp), polarization capacitance (Cp).
Energies 16 04088 g011
Figure 12. Modeling of Supercapacitor: (a) circuit diagram, (b) open circuit voltage, (c) series resistance, (d) first order polarization resistance, (d) second order polarization resistance, (e) first order polarization capacitance, (f) second order polarization capacitance.
Energies 16 04088 g012aEnergies 16 04088 g012b
Figure 13. P-Q Controller.
Energies 16 04088 g013
Figure 14. Gate Firing Pulse Generator.
Energies 16 04088 g014
Figure 15. Seasonal Load Profiles.
Energies 16 04088 g015
Figure 16. Overview of Research Methodology.
Energies 16 04088 g016
Figure 17. Smart City Criteria for Achieving Smart City Goals in St. Martin.
Energies 16 04088 g017
Figure 18. IoT-Driven Smart City Model.
Energies 16 04088 g018
Figure 19. Five-Layer Architecture of the IoT.
Energies 16 04088 g019
Figure 20. Six Microgrid Architectures.
Energies 16 04088 g020
Figure 21. Microgrid Architecture in PSCAD/EMTDC.
Energies 16 04088 g021
Figure 22. Three-phase-to-ground-fault applied in eco wave power when connected with first life battery: (a) terminal voltage at EWP, (b) output power fluctuation of distributed generators, and (c) power share by FLB (highlighted).
Energies 16 04088 g022
Figure 23. Outage of wind turbine when connected with first life battery: (a) wind turbine terminal voltage, (b) power share and fluctuation of distributed generators, and (c) power share by FLB (highlighted).
Energies 16 04088 g023aEnergies 16 04088 g023b
Figure 24. Three phase to ground fault in eco wave power when connected with SLB: (a) voltage at the terminal of EWP, (b) power share and fluctuation of distributed generators, and (c) power share by SLB (highlighted).
Energies 16 04088 g024aEnergies 16 04088 g024b
Figure 25. Sudden drop of load: (a) voltage at the load terminal, (b) power share by DG.
Energies 16 04088 g025
Figure 26. Three-phase-to-ground fault applied in eco wave power when connected with supercapacitor: (a) voltage at the terminal of eco wave power, (b) power share and fluctuation of distributed generators, and (c) highlighted part of supercapacitor.
Energies 16 04088 g026
Figure 27. Outage of eco wave power (without SC and Solar): (a) voltage at microgrid terminal, (b) power share by distributed generators.
Energies 16 04088 g027
Figure 28. Outage of Eco Wave Power (with SC and Solar): (a) voltage at microgrid terminals (b) power share by distributed resources.
Energies 16 04088 g028
Figure 29. Single-line-to-ground fault in wind turbine with supercapacitor: (a) voltage at the terminal at microgrid (b) power share and fluctuation of generators, and (c) highlighted part of load variation.
Energies 16 04088 g029
Figure 30. Outage of wind turbine generator when connected with supercapacitor: (a) voltage at the terminal of wind turbine (b) power share, and (c) highlighted power share of supercapacitor.
Energies 16 04088 g030aEnergies 16 04088 g030b
Disclaimer/Publisher’s Note: The statements, opinions and data contained in all publications are solely those of the individual author(s) and contributor(s) and not of MDPI and/or the editor(s). MDPI and/or the editor(s) disclaim responsibility for any injury to people or property resulting from any ideas, methods, instructions or products referred to in the content.

