Article

Characteristics of Electricity Consumption on the Example of Poultry Farming in Poland

by
Honorata Sierocka
1,*,
Maciej Zajkowski
2,
Grzegorz Hołdyński
2 and
Zbigniew Sołjan
2
1
Faculty of Engineering Management, Bialystok University of Technology, Ojca Tarasiuka 2 Street, 16-001 Kleosin, Poland
2
Faculty of Electrical Engineering, Bialystok University of Technology, Wiejska 45D Street, 15-351 Białystok, Poland
*
Author to whom correspondence should be addressed.
Energies 2023, 16(1), 547; https://doi.org/10.3390/en16010547
Submission received: 8 December 2022 / Revised: 30 December 2022 / Accepted: 31 December 2022 / Published: 3 January 2023

Abstract

:
The article presents the results of the analysis of parameters describing electricity consumption in individual phases of the production cycle on a poultry farm. One full broiler rearing cycle on the farm was analyzed. Electrical parameters were tested during the broiler rearing process using a power quality analyzer with a measurement interval of 1 min. During the tests, the analyzer recorded the active and reactive power, phase and line voltage, power factor, and frequency. On the basis of collected data, original indicators describing electricity consumption per chicken wkA, wkQ, and per unit area wiA, wiQ were determined. The regression curves of active and reactive power consumption in particular stages of the cycle were also determined, and the minimum and maximum values of active and reactive power consumption were determined. The accomplished research can be used in planning electricity demand in energy-self-sufficient areas. The presented original indicators can be used to determine power demand on broiler farms, depending on the planned production volume or size of farm buildings.

1. Introduction

Among the many groups of electricity consumers in Poland, one of the largest groups of consumers is farmers. The group of agricultural consumers includes both farms that raise animals and those that grow plants. Among agricultural producers engaged in animal husbandry, three main types of livestock can be distinguished: pigs, cattle, and poultry. Among poultry producers, chickens account for 90% of the world’s poultry meat production. Annually, 133 million tons of chicken meat are produced, which accounts for almost 40% of the world’s total meat production [1,2,3,4,5,6,7,8]. Each farm, depending on its business profile, has a different energy demand and energy load profile for both thermal and electrical energy. Knowledge of the energy profile of the consumer is needed, for example, in the process of selecting an appropriate renewable energy source that would allow the generation of electricity exactly when the consumer needs it or to determine the necessary connection power of the farm [9,10,11,12,13]. Article [1] indicates data on the volume of global poultry production and the connections between using the latest technologies and thorough livestock farming. A detailed analysis of Poles’ consumption of zoonotic products was conducted by Mazur-Włodarczyk and Gruszecka-Kosowska [2]. In paper [7], consumers’ preferences for choosing a poultry supplier in view of animals’ welfare were studied. An important fact in the choice of poultry meat is the use of antibiotics for their rearing. Article [8] presents the impact of antibiotic use on the welfare of chickens. The methodology for prioritizing and energy efficiency measures in the dairy industry were described by Marchi, Bettoni, and Zanoni [3]. In article [4], the authors pinpointed the necessary power of on-farm renewable electricity generation systems. The authors [5] presented the effects of cooling the system of the heat pump on growth performance, harmful gas emissions, and electricity consumption in a piggery. Studies on electricity consumption on a dairy farm are presented in [6,14], while the potential for using photovoltaic systems on dairy farms is presented in [13]. Similar studies on energy consumption in chicken broiler production for a modern or traditional farm were performed in Iran [9], and the results of an energy audit on a broiler farm were presented by Baxevanou, Fidaros, Bartzanas, and Kittas [10]. Work [11] determined the energy consumption per 1000 birds in broiler production. Works [12,15] present the ways and methodology of using measurements in research that helps interpret the usefulness of the collected data.
The research aimed to assess the periodic demand for active and reactive electricity in the broiler production process, in the context of including the farm in the input and the balance of active and reactive energy for use. Firstly, the type of farm in Poland with a meat-poultry production profile was selected to achieve energy balancing and compensation. Secondly, the demand for daily power and the periods of individual production parts on a poultry farm were measured. Thirdly, the daily and periodic profile of active and reactive energy in the examined farm was indicated and calculated based on the farm and the chicken.
The material is divided into several parts. Section 2 characterizes the basic requirements for poultry rearing in different stages of growth and the characteristic requirements of rearing conditions, which affect the energy consumption of the production. Section 3 presents the research methodology and proposes an original assessment of active and reactive energy consumption indicators. Section 4 details the characteristics of the examined poultry farm. Based on Section 5, measurement results were obtained from individual loads of power consumption in various stages of the breeding cycle, and the author’s indicators were calculated. Section 6 is dedicated to the analysis and evaluation of test results, and Section 7 provides the conclusions.

2. State of the Art

Many entries in the literature refer to the assessment of electricity requirements in animal husbandry, pigs, cattle, poultry, and eggs. Electrical equipment, which constitutes the operational systems in agricultural production, mainly includes lighting systems, ventilation systems, and livestock support systems, e.g., drinkers, milking machines, feeders, or room cleaning systems. As shown in [7,8,9,10,11], it is important to assess the size and nature of electricity consumption in broiler chicken production, taking into account its qualitative and quantitative parameters. The literature [12,15,16,17,18] provides a variety of parameters describing load changes, and the choice of appropriate coefficients describing these measurements depends on the needs and purpose of their use [14,17,18,19,20,21,22,23,24,25,26,27]. Paper [17] presents an econometric relationship between different modes of energy consumption using a mandarin farm as an example, and article [21] presents energy inputs in cherry production. Article [18] presents various methods of analyzing power quality, while [19] describes the requirements for measuring electricity according to European standards. Articles [22,24,25,27] present the standardization of measurement methods for determining electricity indicators and the proper selection of parameters. The development of quantitative indicators of on-farm energy consumption is presented in [20,23]. The estimation of electricity costs in a chicken broiler farm is presented in [26].

Characteristics of Chicken Broiler Breeding

The breeding of any animal is characterized by a different rearing technique and duration. For chicken broiler farms, one-day-old chicks are delivered to buildings without runs. In the buildings, bedding is changed before each new delivery of chicks—this prevents the transmission of diseases between batches. Animal husbandry is not only about proper housing and food, as it is significant to ensure appropriate environmental conditions [28,29,30,31,32,33,34,35,36]. Broiler rearing requires maintaining the right temperature in the building, providing an efficient ventilation system, and a suitable daily light program [1,37,38]. For the proper development of broilers, it is necessary to provide the required microclimate, tailored nutrition, and constant access to water [39,40]. When the chicks are introduced into the rearing room, the room temperature should be 24–25 °C. Under an additional heating source, it should be 34 °C to 35 °C, after which it must decrease gradually to reach a level of 30 °C on the seventh day of the chicks’ life. The broiler rearing cycle lasts an average of 35 to 42 days, depending on the method of producing meat chickens [15,41,42]. The rearing methods and their duration are shown in Table 1. On subsequent days, the minimum temperature, which does not affect the flock’s productivity, is 20 °C, and the maximum is 25 °C (Table 2).
The difference in temperature provision in the different stages of the rearing cycle (from 1SC to 3SC) is mainly due to the natural growth of the chickens; as in the initial stage of 1SC, under normal conditions, small chickens need a higher and stable temperature and constant light. In the remaining 2SC and 3SC stages, temperature fluctuations may be higher. In addition to providing adequate conditions for housing, it is necessary to stimulate chickens with light. The light cycle has a significant impact on broiler production. The length of the daylight determines the amount of feed consumed and the resting time of the animals, which significantly affects the weight gain of the birds. According to the requirements, the horizontal illuminance at the level of the bird’s eye should be at least 20 lx [43]. The color of the light used to illuminate the broiler room is also essential. Too bright light can cause cannibalism in birds, so the adaptation of yellow or red lighting should be avoided, and it is much more favorable to use cool white–blue lighting with a significant proportion of green. Depending on the day of broiler rearing, the required length of the light cycle varies. In the first week of rearing, 24 h lighting is used, then the daylight is gradually shortened to 16–18 h, and in the period from 36 to 49 days, a 23 h light cycle is used (Table 2). The light programs must comply with the current regulations [43]. In Poland, these regulations include The Law on Animal Protection and the Regulation of the Ministry of Agriculture and Rural Development of 15 February 2010. “Temporary reductions in lighting levels may be used as a result of a recommendation of the veterinarian and during the first week of settling into the broiler house and up to 3 days before the anticipated slaughter of chickens. Lighting should be adjusted to a 24 h rhythm with blackout periods lasting a total of >6 h, with at least one period of uninterrupted blackout for >4 h excluding blackout periods” [43]. Each rearing farm applies its own light program that meets the minimum conditions under current regulations.

3. Methodology

Measurement of the selected parameters of power quality and the amount of electricity consumed was carried out using the Sonel PQM 701 network analyzer. The measured values were obtained over a duration of 41 days, which can be called one cycle of broiler rearing. One 41-day poultry-rearing cycle can be divided into three stages of the production cycle. Each of the three production cycles, following the measurement results obtained, is characterized by a different profile of active and reactive power consumption, which is a direct result of the load on the internal electrical network, equipment consuming active power, and consuming and generating reactive power. A commercial facility for poultry rearing was analyzed. The floor area of the building was 2200 m2. When the measurements were obtained, the stocking density of chicks was 32,000. The article presents the research results of the analysis of selected parameters describing the consumption of electricity (active and reactive) at different stages of the production cycle (1SC, 2SC, 3SC).
One complete cycle of rearing chicken broilers on the farm, lasting 41 days, was analyzed, as well as the duration of periodic activities (e.g., feeding, watering, air exchange) performed between successive batches of poultry. Measurement studies of selected electrical parameters during the broiler rearing process were carried out using a Sonel PQM 701 power quality analyzer. The analyzer was connected to the main switchboard of the building and recorded the values of selected parameters with an interval of 1 min. Performing the tests, the analyzer recorded active and reactive power, phase and line voltage, power factor, and frequency. The discussed values were recorded following EN 50160: 2010. Active power, P, according to the implemented formulas in the Sonel PQM 701 analyzer, is described by the relation [44,45]:
P = n = 0 N U n I n cos ( φ U n φ I n ) .
Almost identically, the recorded reactive power has been described [44,45]:
Q = n = 0 N U n I n sin ( φ U n φ I n ) .
According to the obtained information, presented above, measurements were averaged every 1 min. In addition, in order to be able to more easily and accurately observe the variation in the nature of the active power and reactive power load, 10 min and 120 min averaging was performed, which can be written using the relationship:
  • averaged active power, P avr :
P avr = E A T = 1 T 0 T P ( t ) d t ,
where E A —value of active electricity, and T—averaging period is equal to 15 or 120 min.
Active electricity is the integral of active power over the period under study, namely:
E A = 0 T P ( t ) d t ;
  • averaged reactive power, Q avr :
Q avr = E Q T = 1 T 0 T Q ( t ) d t ,
where E Q —value of reactive electricity.
Reactive electricity also has its representation in the form of an integral, i.e.,
E Q = 0 T Q ( t ) d t .
Such averaging was aimed at eliminating aberrations caused by random increases or decreases in consumed active and reactive power resulting from resulting voltage increases (e.g., switching surges, withdrawal of a consumer with a relatively high unit power) or voltage decreases (e.g., short circuits, switching on the consumer(s)).
Based on the collected data, the authors’ original indices describing the consumption of active electricity per chicken were determined, wkA:
w kA = E A k ,
where k—quantity of poultry in pieces.
Reactive electricity, wkQ, also on a per-chicken basis:
w kQ = E Q k .
The author’s original indicators of active and reactive electricity consumption are wiA, wiQ:
  • active electricity consumption indicators per unit area, w iA :
w iA = E A p ,
where p—area in square meters;
  • reactive electricity consumption indicators per unit area, w iQ :
w iQ = E Q p .
In addition, the minimum and maximum values of consumed active and reactive power, resulting from the recorded measurement values, were determined.

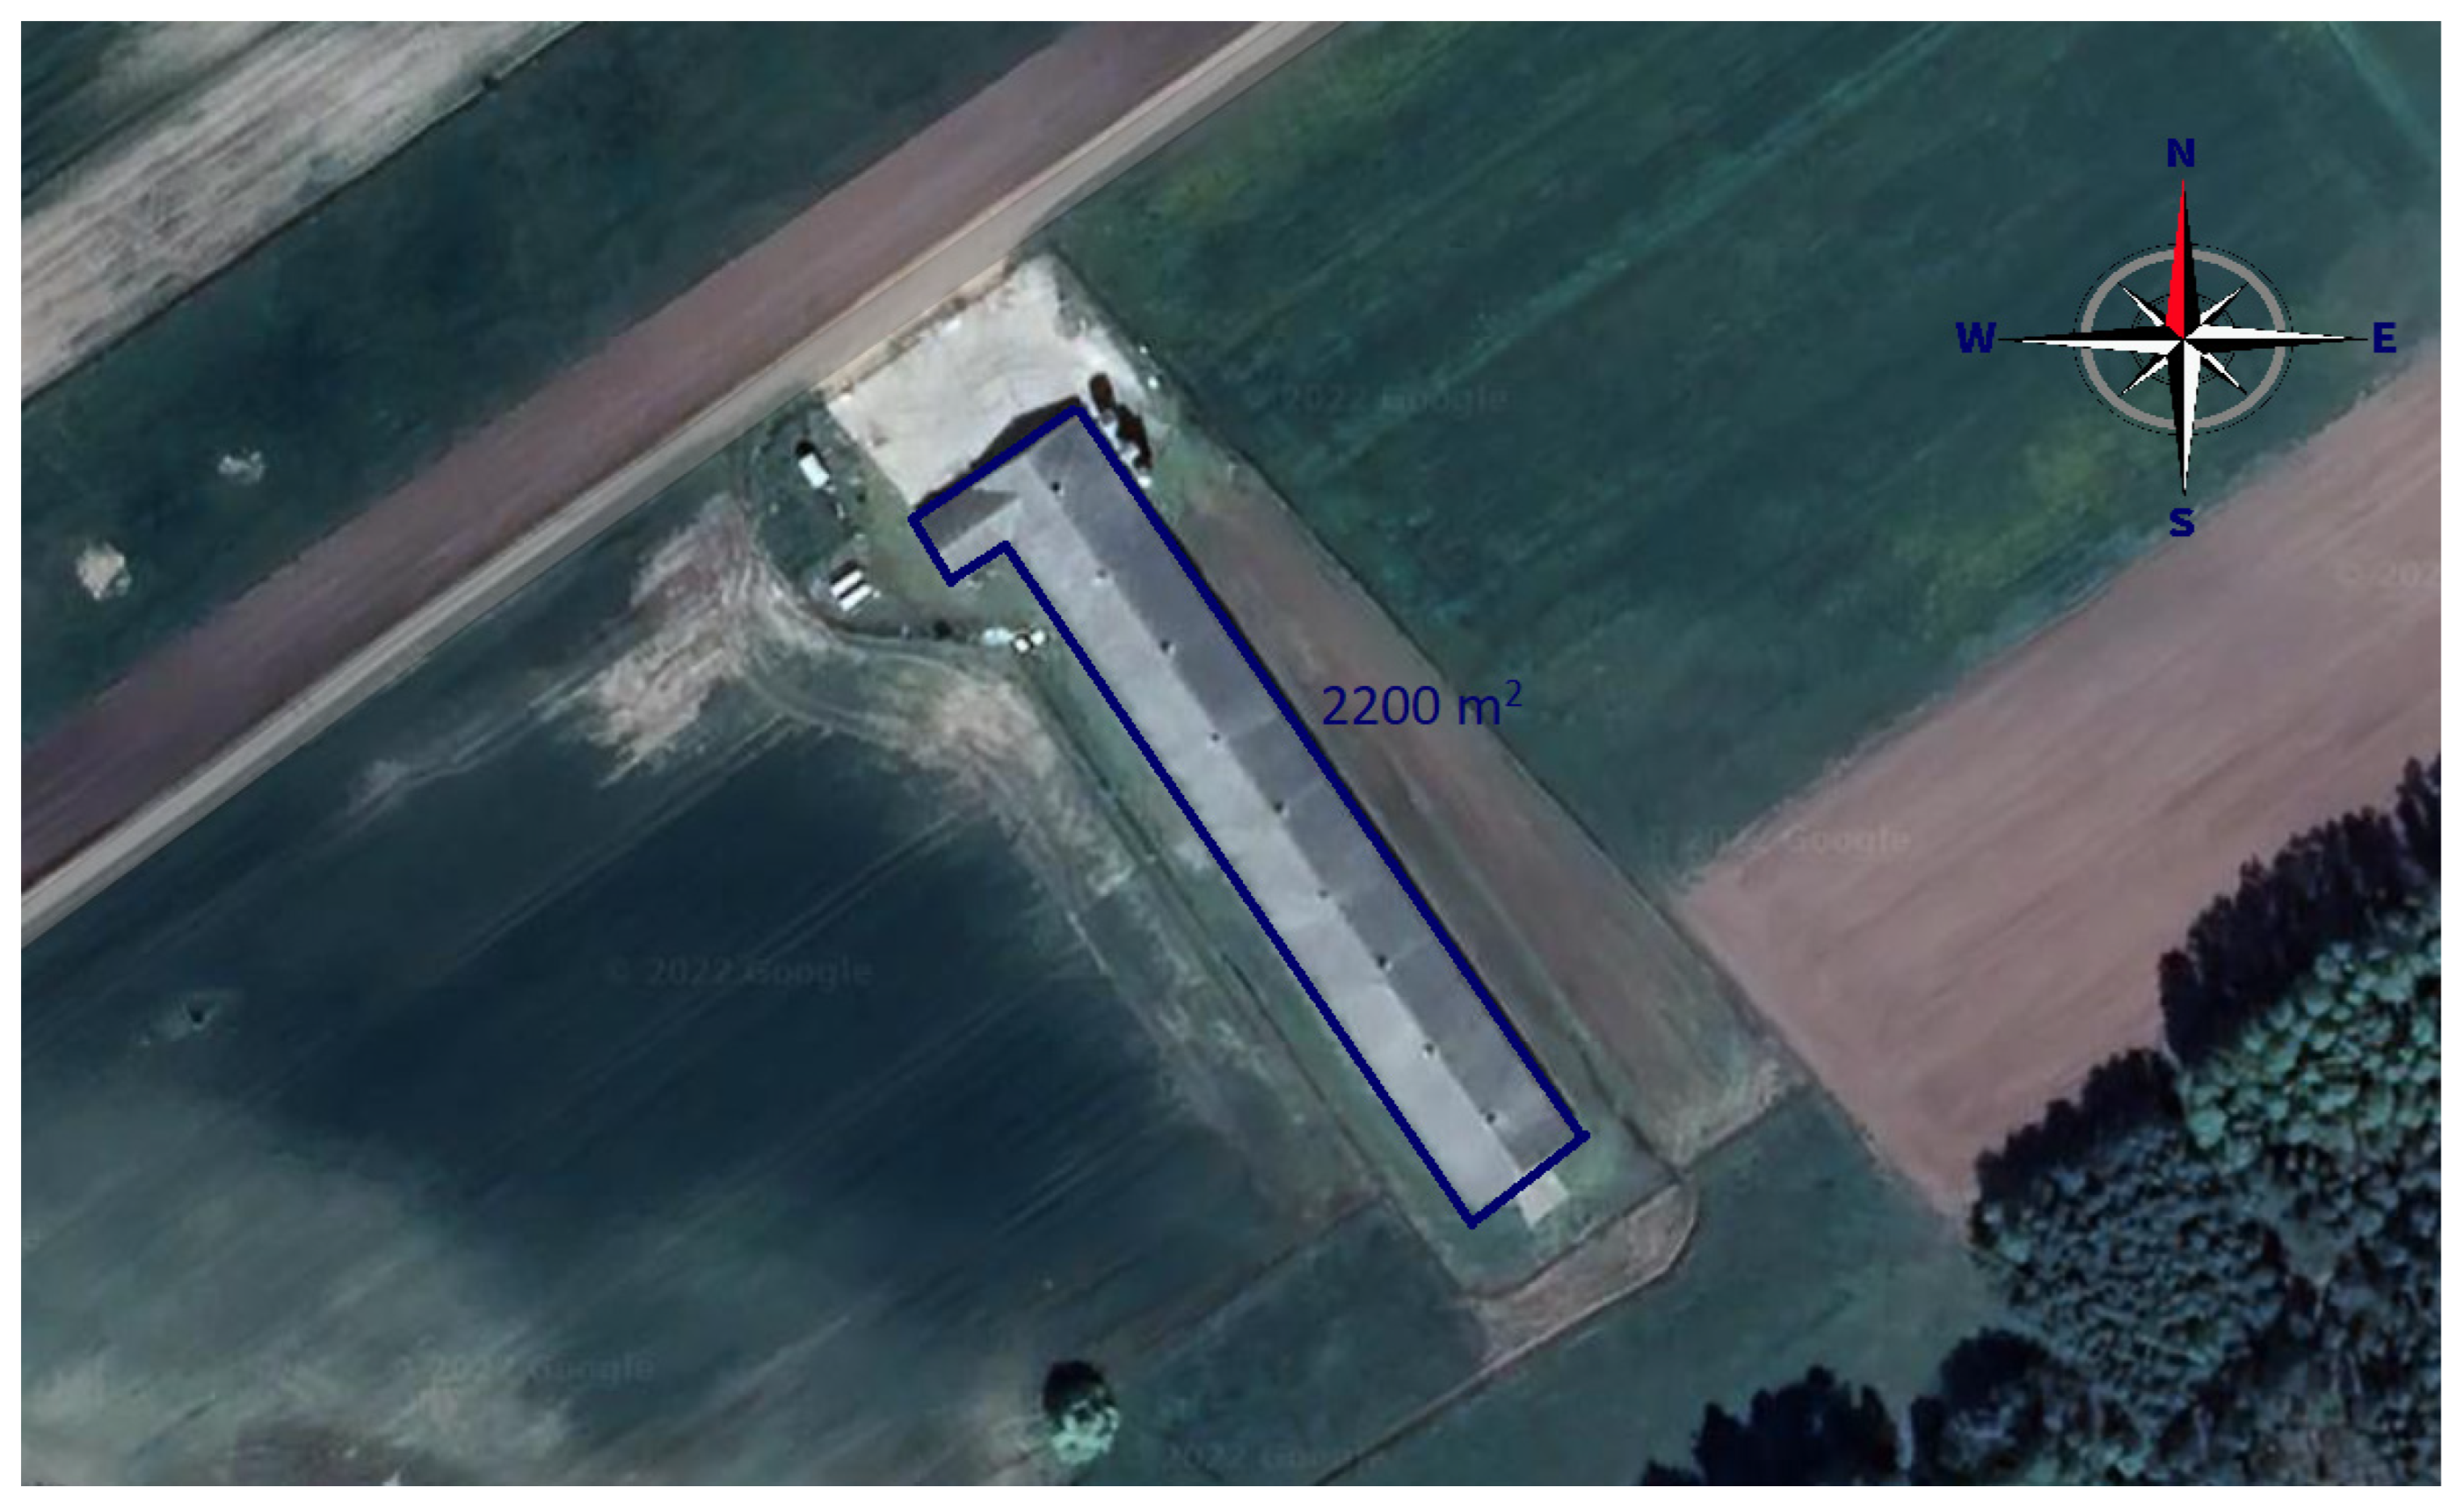
4. Characteristic of Chicken Broiler Breeding

The farm under study is located in the northeastern part of Poland, in Podlaskie Voivodeship. The average annual temperature in the study area is 7 °C, with the lowest temperature reaching −20 °C and the highest temperature over 30 °C. The poultry house has an area of 2200 square meters and is rectangular in shape, and beside it, there are utility rooms. The front wall of the building faces northwest. One side of the gabled roof faces southwest. The view of the building is shown in Figure 1. The farm, during one cycle, has a stocking rate of 32,000 chicks. Next to the building are feed silos connected to an automated feed dosing system. Owing to the automated feeding and watering system, the farm is almost maintenance free. The farm is equipped with a remote monitoring system, allowing constant control of the flock. In addition, the facility is also equipped with heaters and an automatic ventilation system to ensure proper conditions for keeping broilers. Ensuring proper temperature and ventilation has an essential impact on the right growth of broilers. Thanks to the automatic control system, programmed appropriately for the following days of the cycle, there is no need to set the climate parameters in the poultry house manually. The control system also makes it possible to check the amount of water and feed used per day. In addition to the basic power system, the farm has a generator and an automatic reserve switching system that allows for quick power switching in case of a power outage from the grid. Even a temporary power outage can cause high mortality of broilers, especially in the early days of rearing and, thus, cause huge losses for the farm. The main electricity loads situated on the farm, their number, unit, and total power are shown in Table 3.

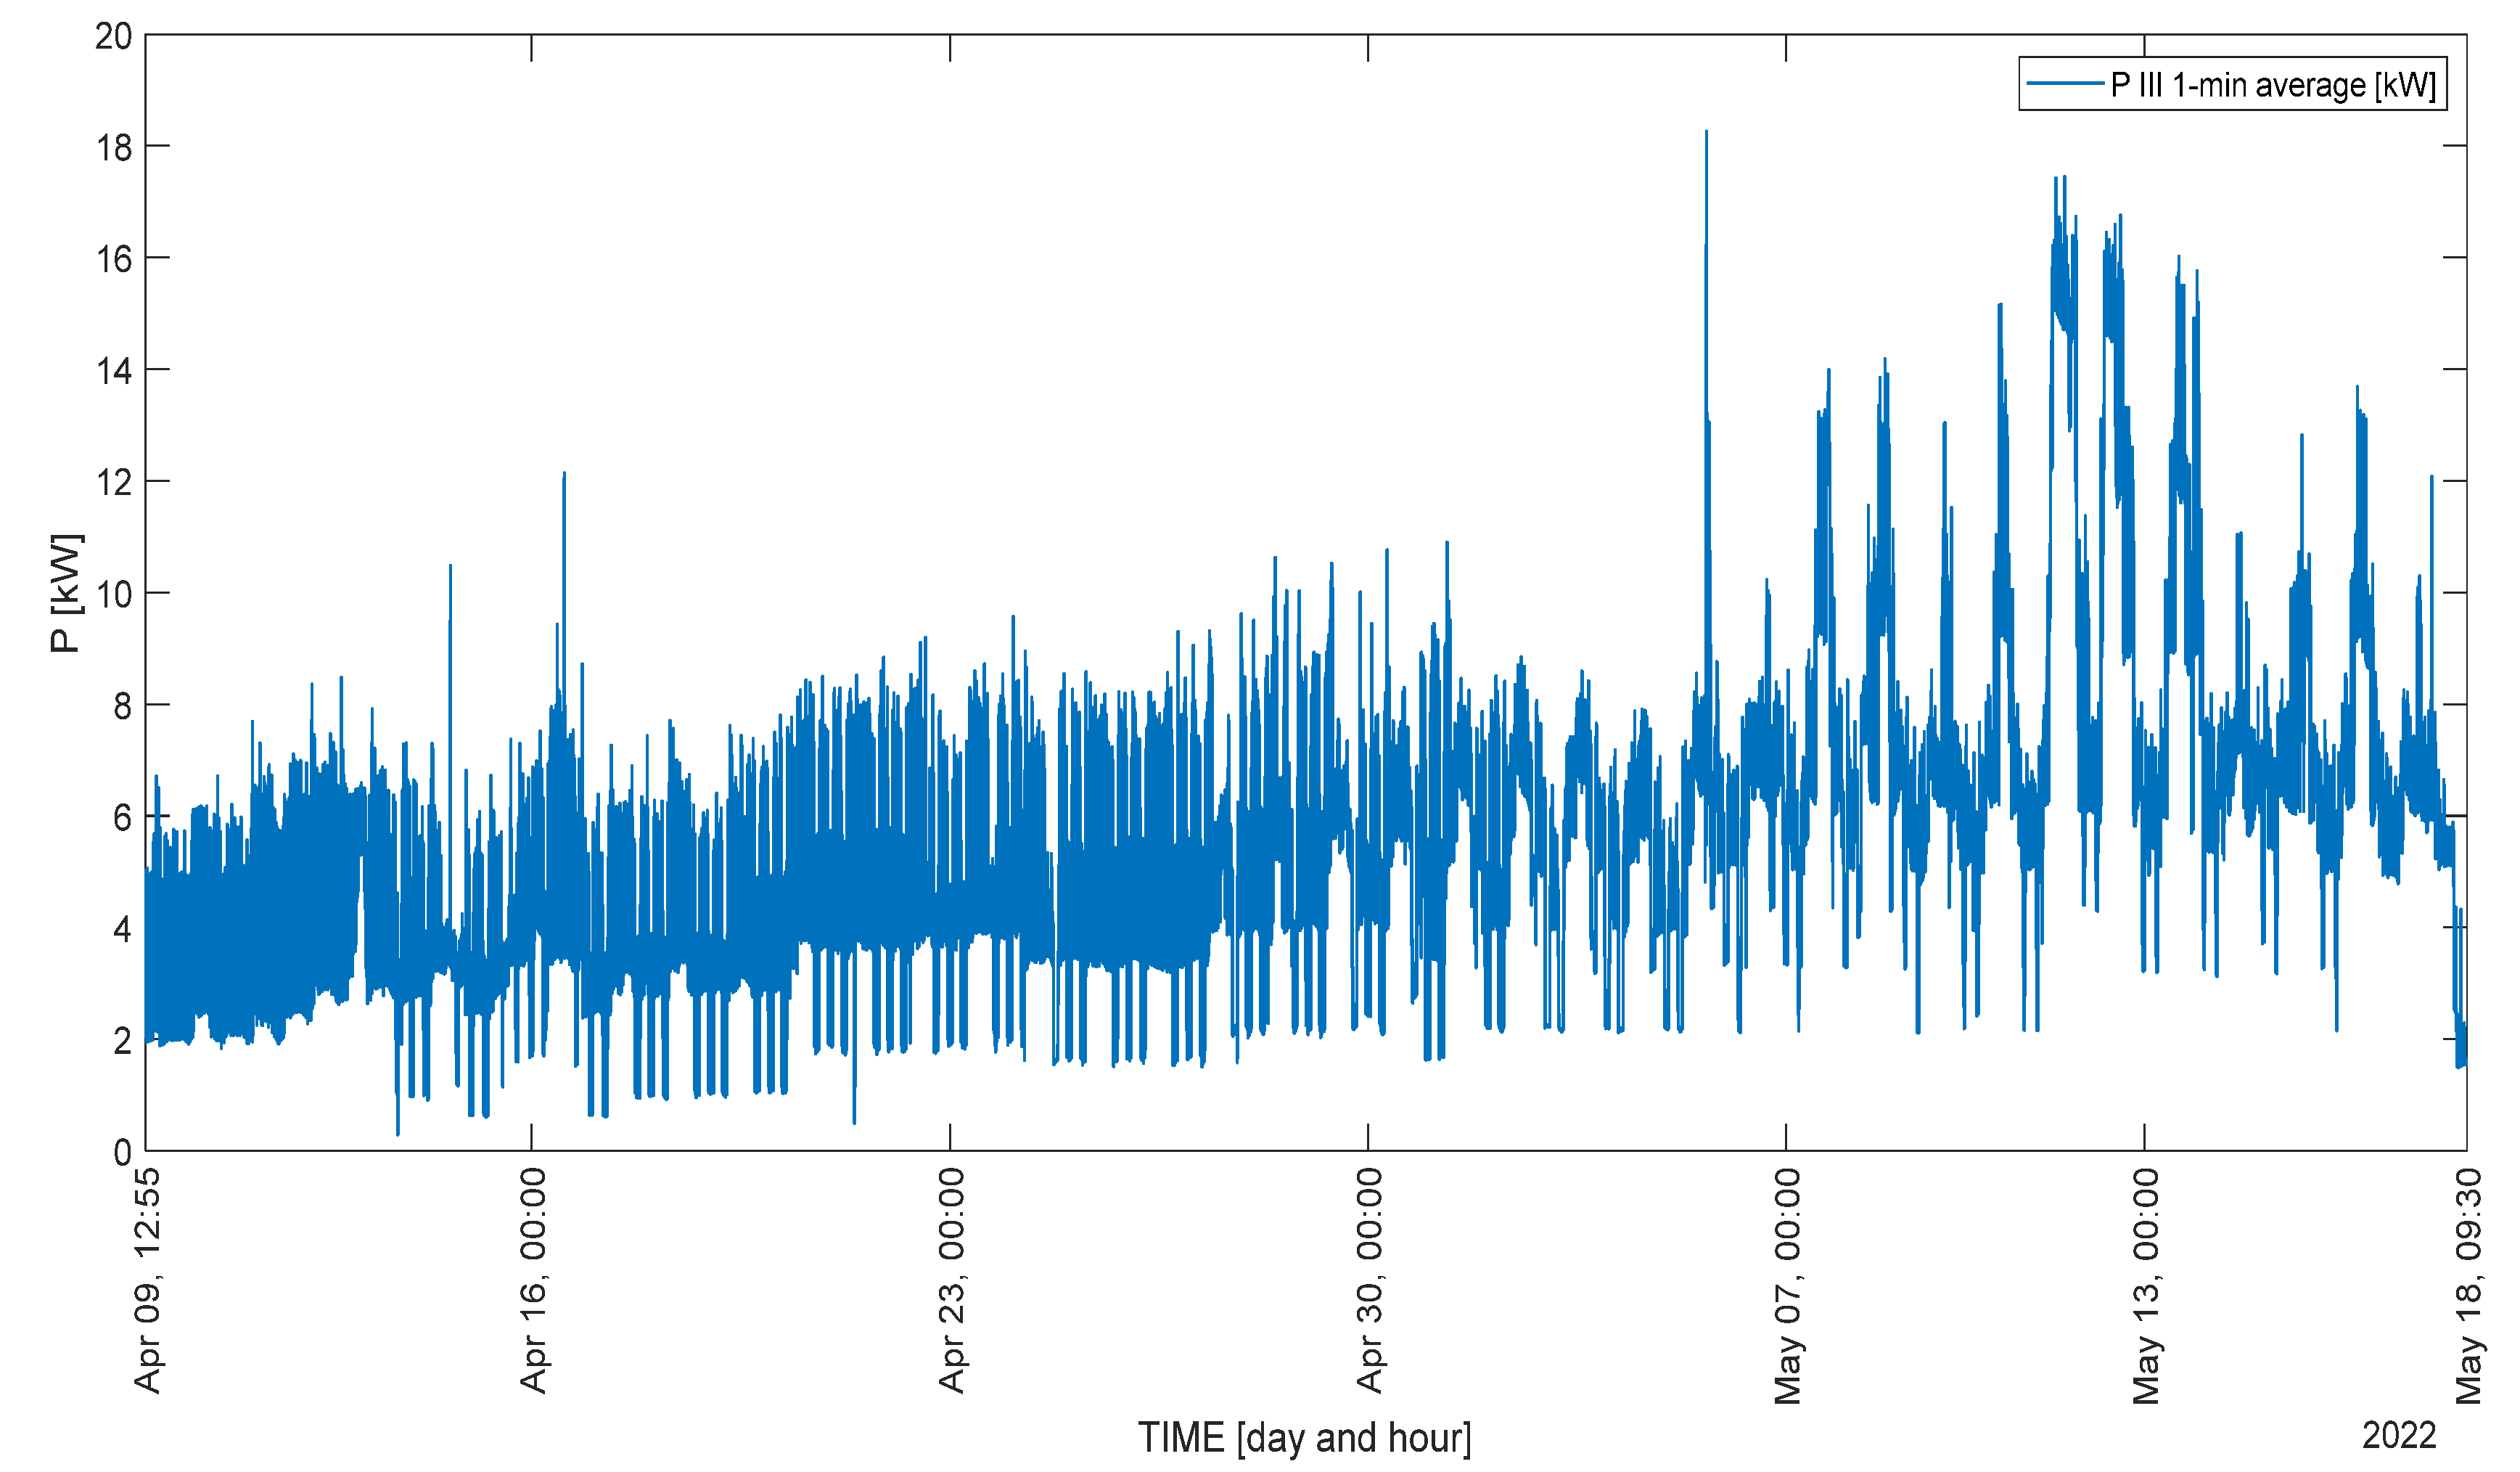
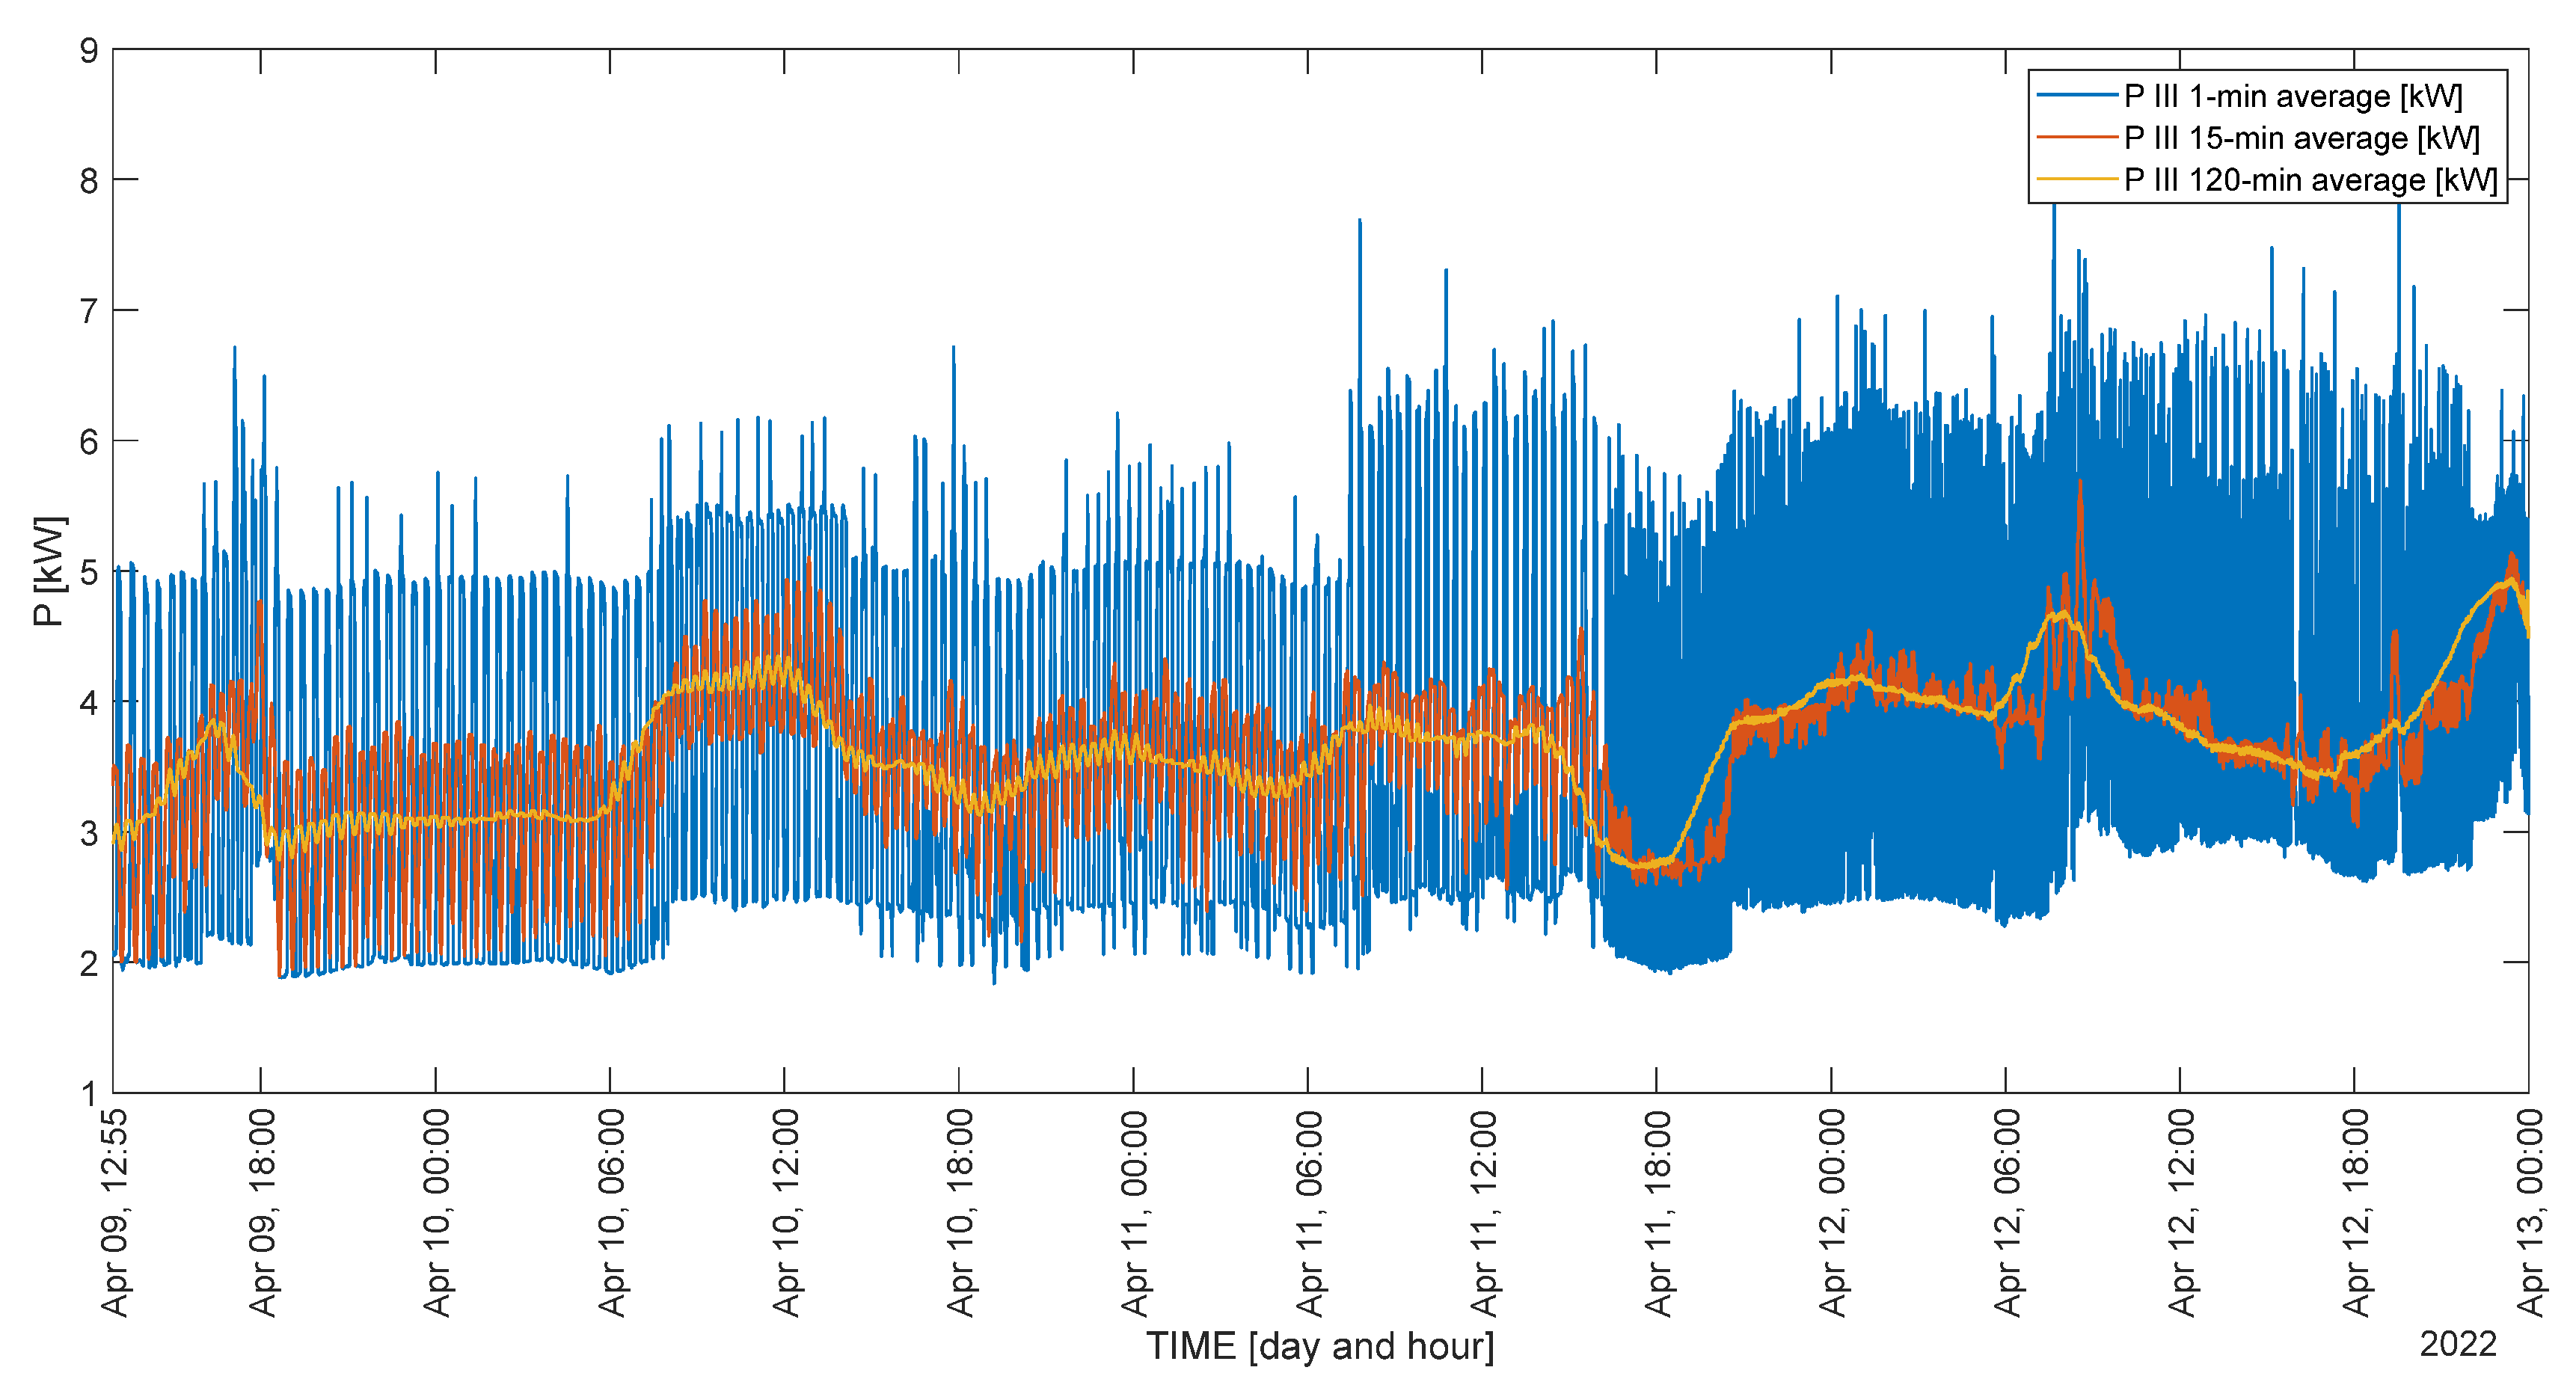
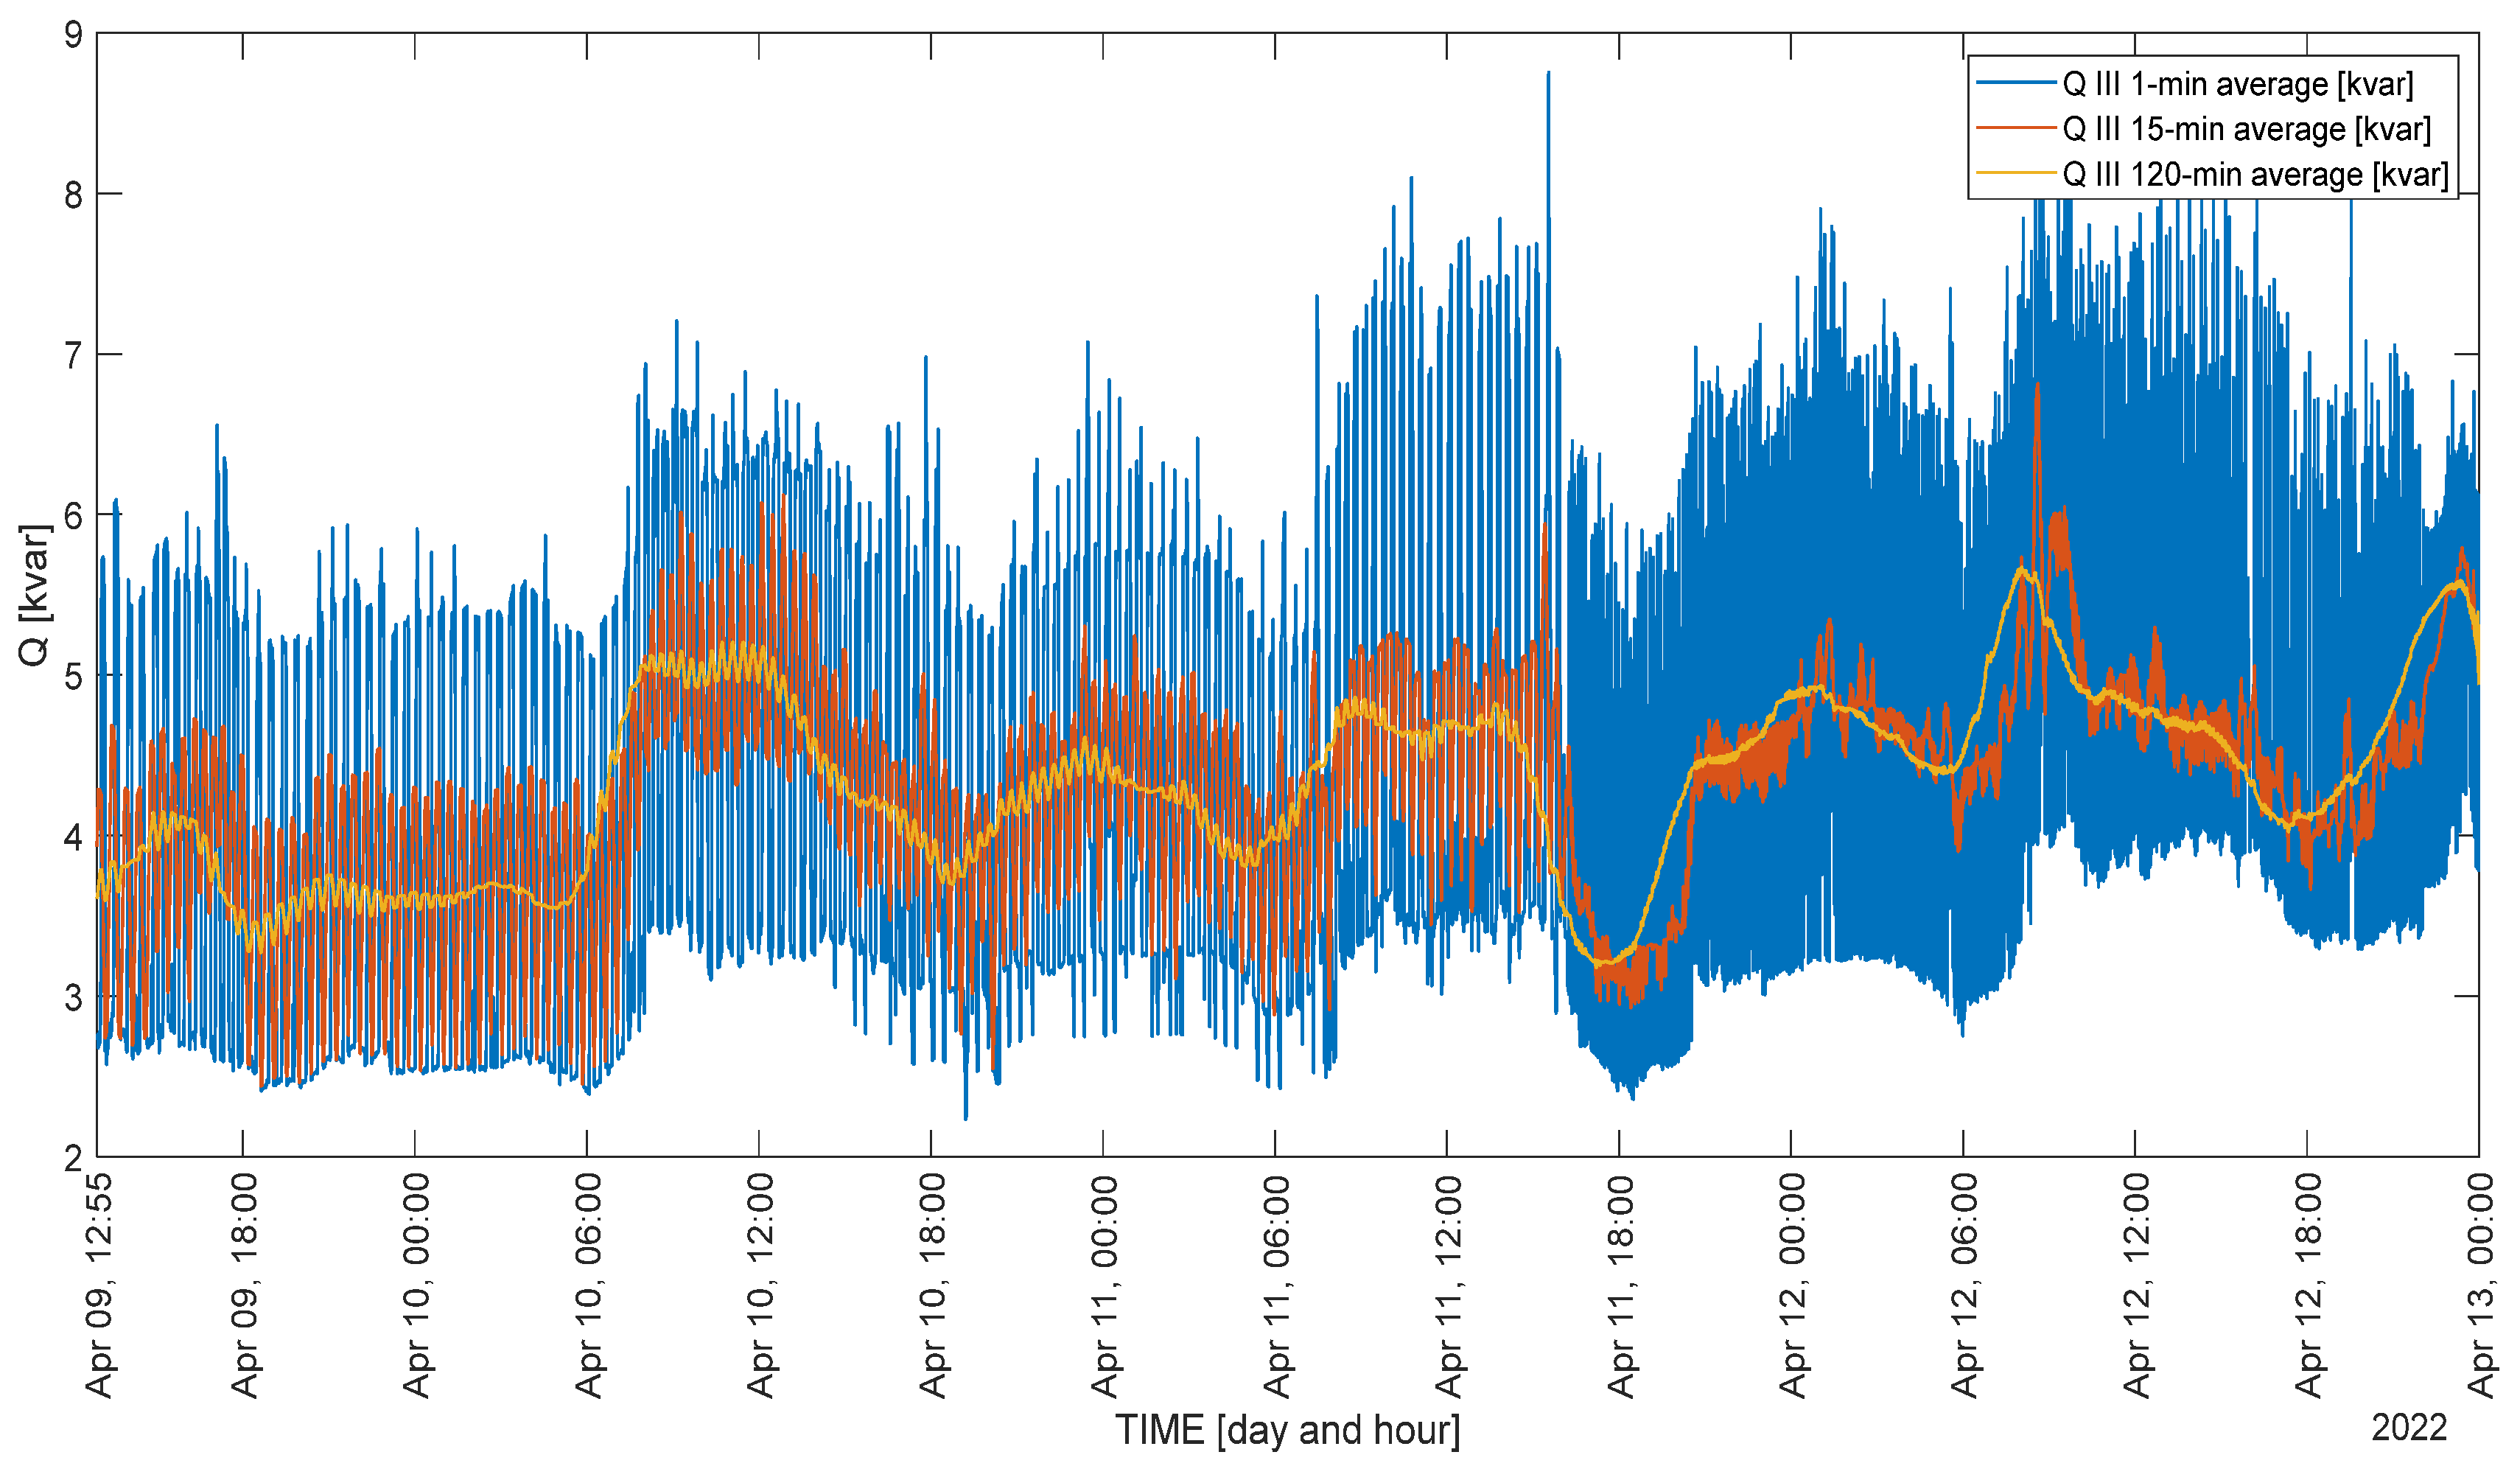
5. Results of the Performed Research

Figure 2 shows the chart of the three-phase active power of the load (sum of power in each phase) during the broiler rearing cycle. Noticeable are the three stages of the cycle duration. The initial stage (1CS) lasted 6 days, the second stage (2CS) lasted 25 days, and the third stage (3CS) lasted 10 days. In the 1CS, the load chart does not have significant drops, which may be due to the continuity of lighting and the constant heating of the building. In the next stage (2CS), a significant decrease in power is noticeable, which may be a consequence of the shortening of the light cycle. In the last stage (3CS), an increase in power is noticeable, which may be caused by an increase in chick weight and the necessity for increased ventilation. Feed and water consumption also increases, making the feeding and watering system work more frequently. The increase in weight is also associated with an increase in the gases produced, which must be removed from the room, and clean air must be available. The arithmetic average of active power during the entire cycle was 5047 watts, the smallest value of power consumed was 131.26 watts, and the highest was 18,264 watts. The analysis shows that the median—the middle value of the measurements—was 4878 W. The value of the mean deviation for the entire cycle was 2000 W.
To assess the uniformity of the facility’s load, each stage of the cycle must be analyzed in detail. Detailed charts of three-phase active and three-phase reactive power are shown for cycle stage 1 (Figure 3 and Figure 4), cycle stage 2 (Figure 5 and Figure 6), and cycle stage 3 (Figure 7 and Figure 8), respectively. The graphs also show charts averaged over 15 and 120 min intervals.
One representative day in each cycle’s stage was selected for detailed analysis. The graphs (Figure 3, Figure 4, Figure 5, Figure 6, Figure 7 and Figure 8) show the changes caused by the total switching off of lighting to regulate the daily light cycle. Figure 9 shows the value of three-phase active power on a representative day of cycle stage 1 (11 April), Figure 10 shows the value of three-phase active power on a representative day of cycle stage 2 (18 April), Figure 11 shows the value of three-phase active power on a representative day of cycle stage 3 (15 May). Accordingly, Figure 12, Figure 13 and Figure 14 show the values of three-phase reactive power on the represented days. Table 4 summarizes the most important parameters describing the electrical parameters of the representative days of each stage of the cycle.

6. Analysis and Discussion about Results

From the study, it can be seen that each cycle stage differs significantly in profile and total active energy consumed. The first stage of the cycle consumed 300 kWh, the second stage consumed 2609 kWh, and the third stage consumed 1869 kWh. A significant difference in the reactive energy consumption profile is also noticeable. The lowest consumption occurred in 1SC and the highest in 2SC (Table 4). The difference in the amount of reactive energy consumed is due to the variable lengths of the cycle phases and, most importantly, the different light programs during each cycle.
Analyzing the graphs shown in Figure 3 and Figure 4, it can be seen that, during 1SC, the highest active power consumption was 8.48 kW, the lowest was 1836 kW, the maximum reactive power consumption was 8817 kvar, and the minimum was 2230 kvar. The average values of active and reactive power in 1SC were 3614 kW and 4312 kvar, respectively. Figure 5 and Figure 6 show a graph of active and reactive power values in 2SC. The graphs show that the maximum active power consumed was 4348 kW, and the peak value of reactive power was 13,569 kvar. The minimum active power consumption was 0.284 kW, and reactive power was −0.050 kvar. During the 2SC, the average active power load was 4348 kW, and reactive power was 4125 kvar. However, it is crucial to remember here the different natures of reactive power: inductive or capacitive. The course of active and reactive power during the 3SC is shown in Figure 7 and Figure 8. During this stage, the maximum active power consumed was 17,452 kW, and the peak value of reactive power was 13,084 kvar, while the minimum consumption was 1492 kW and 0.708 kvar, respectively. On average, active power consumption was 4348 kW and 5659 kvar (Table 5). During the entire rearing of broilers (1SC, 2SC, 3SC), the average active power consumption was 4103 kW.
Based on the measured values and using the relationships presented in Section 3, ratios describing the consumption of active electricity, wiA, and reactive electricity, wiQ, per unit area were calculated. In addition, indicators for the consumption of active electricity, wkA, and reactive electricity, wkQ, per chicken broiler were also calculated. The results of calculating the individual indicators are shown in Table 6. In the first stage of the cycle, the active electricity consumption per unit area was wiA = 0.137 kWh/m2. The consumption of the same energy per unit was wkA = 0.009 kWh/k. In the second stage of the cycle, the highest consumption of active electricity can be observed throughout the cycle, making the unit consumption per unit area and per chicken the highest at wiA = 1.186 kWh/m2 and wkA = 0.082 kWh/k, respectively. In the third stage of the cycle, active electricity consumption was wiA = 0.850 kWh/m2 and wkA = 0.058 kWh/k. In analyzing the electricity consumption, this time reactive power, it is necessary to look at power factors (Table 4). Both the power factor tg φ , used by electric utilities, and the power factor cos φ , used in science and measurement, indicate that each cycle stage is loaded with a significant value of reactive power. It should also be noted that, in the first stage of the cycle, 1SC (the values in Table 4, Table 5, Table 6, Table 7 and Table 8) presents a higher value of energy, power, or consumption rates related to the reactive side. The reason for this is the need to use equipment that does not operate at its rated power. The lack of operation within the rated power contributes to a decrease in the value of the power factor, cos φ , which, when converted, increases the value of the power factor, tg φ . If the value of the power factor tg φ exceeds the value of 0.4, for inductive reactive power, then, according to the Energy Law in Poland [46] and in most European Union countries [47], reactive power compensation must be performed. It should also be mentioned that individual customers and customers whose connection power is less than 40 kW do not, for the time being, have the need to reduce the power factor tg φ to a value below 0.4. These days, most European countries are facing an energy crisis, so from the point of view of power utilities, the ideal solution would be to charge all customers for excessive consumption of inductive reactive energy. A great solution to reduce the amount of inductive reactive energy could be a photovoltaic installation. Knowing the values of active power and reactive power in the various stages of the broiler rearing cycle, it is possible to control the photovoltaic installation to level the amount of inductive reactive energy by introducing capacitive reactive energy into the internal network. This can be achieved by lowering the power factor cos φ on the inverter controlling the PV plant. The downside of such a solution is the limitation in the generation of active energy since the PV plant does not operate with a unit power factor.
The authors calculated the active wiA and reactive wiQ consumption rates per unit area and active wkA and reactive wkQ consumption rates per 1 unit, which allow a quick estimate of the necessary power ordered from the electricity supplier. However, it should be borne in mind that, due to the rapidly developing technology (electronic and power electronic devices) increasingly resulting in a reduction in the nominal power of individual consumers, there may be a situation in which the indicators calculated in the publication will be overestimated. Therefore, the load profile of a given facility should be measured over the years, especially when the equipment is replaced with a newer one. This will make it possible to estimate the indicators over the years; based on which, it will be possible to observe jumps in the technology used in poultry houses and contribute to energy efficiency.
According to publication [9], the total energy demand for broiler production in modern farms is 52.44 kWh per broiler per year, taking into account the entire production process. Publication [26] refers to the demand for electricity only, obtaining a range of consumption from 0.131 to 0.189 kWh per broiler. The indicators calculated based on our research confirm the demand for electricity in the production cycle at the level of 0.149 kWh/broiler and 0.132 kvarh/broiler. Publication [10] presents electricity consumption in farms located in the lowlands and the mountains per unit of weight in kg of poultry and per unit of area m2. According to the presented results, electricity consumption in all surveyed households amounted to 0.1 kWh/kg and 19.54 kWh/m2.

7. Conclusions

The research showed that, depending on the ongoing stage of the broiler rearing cycle, the demand for active and, unfortunately, also reactive electricity changes. The field studies conducted and calculations made it possible to identify daily load curves on representative days of the cycle. Knowledge of the variability of load over time and the number and type of devices used can provide a basis for designing electrical installations, installing renewable energy sources, or selecting the appropriate tariff with the electricity supplier. The obtained measurements and performed calculations can be applied in planning electricity demand in energy-self-sufficient areas. The indicators presented by the authors can be applied in determining the power demand on broiler farms depending on the planned production volume, the size of farm buildings, or the technology used. This prevents oversizing of the power demand, which can reduce connection power charges.
Based on the conducted preliminary studies of an example poultry farm in Poland, which is planned as one of the partners in the energy community, it appears that for a comprehensive assessment of the possibility of modeling such an energy structure, it will be necessary to develop mathematical models of the work of individual farms. In the future, it will be indispensable to deepen the analysis of energy profiles of other poultry farms, try to systematize the demand for active and reactive energy, and assess the possibility of reactive power compensation, especially with the use of RES as an element of energy cooperatives. Therefore, further research will focus on modeling and managing the energy balance in such communities, as required by national and EU regulations.

Author Contributions

The paper was written by H.S. Conceptualization, H.S. and M.Z.; methodology, H.S.; software, Z.S. and G.H.; validation, H.S. and M.Z.; formal analysis, H.S., M.Z. and Z.S; investigation, H.S. and G.H.; resources, H.S.; data curation, H.S.; writing—original draft preparation, H.S.; writing—review and editing, Z.S. and M.Z.; visualization, Z.S.; supervision, M.Z.; project administration, H.S.; funding acquisition, H.S., M.Z. and G.H. All authors have read and agreed to the published version of the manuscript.

Funding

This work was supported by the Ministry of Science and Higher Education in Warsaw, Poland, at the Białystok University of Technology in Białystok, Poland, under research subsidies No. WZ/WE-IA/2/2020, No. WZ/WE-IA/3/2020, and No. WZ/WIZ-INZ/3/2022.

Institutional Review Board Statement

Not applicable.

Informed Consent Statement

Not applicable.

Data Availability Statement

Not applicable.

Conflicts of Interest

The authors declare no conflict of interest.

References

  1. Olejnik, K.; Popiela, E.; Opaliński, S. Emerging Precision Management Methods in Poultry Sector. Agriculture 2022, 12, 718. [Google Scholar] [CrossRef]
  2. Mazur-Włodarczyk, K.; Gruszecka-Kosowska, A. Sustainable or Not? Insights on the Consumption of Animal Products in Poland. Int. J. Environ. Res. Public Health 2022, 19, 13072. [Google Scholar] [CrossRef] [PubMed]
  3. Marchi, B.; Bettoni, L.; Zanoni, S. Assessment of Energy Efficiency Measures in Food Cold Supply Chains: A Dairy Industry Case Study. Energies 2022, 15, 6901. [Google Scholar] [CrossRef]
  4. Fuchs, C.; Meyer, D.; Poehls, A. Production and Economic Assessment of Synthetic Fuels in Agriculture—A Case Study from Northern Germany. Energies 2022, 15, 1156. [Google Scholar] [CrossRef]
  5. Rathnayake, D.; Mun, H.-S.; Dilawar, M.A.; Chung, I.-B.; Park, K.-W.; Lee, S.-R.; Yang, C.-J. Effect of Air Heat Pump Cooling System as a Greener Energy Source on the Air Quality, Housing Environment and Growth Performance in Pig House. Atmosphere 2021, 12, 1474. [Google Scholar] [CrossRef]
  6. Todde, G.; Murgia, L.; Caria, M.; Pazzona, A. A Comprehensive Energy Analysis and Related Carbon Footprint of Dairy Farms, Part 1: Direct Energy Requirements. Energies 2018, 11, 451. [Google Scholar] [CrossRef] [Green Version]
  7. Escobedo del Bosque, C.I.; Spiller, A.; Risius, A. Who Wants Chicken? Uncovering Consumer Preferences for Produce of Alternative Chicken Product Methods. Sustainability 2021, 13, 2440. [Google Scholar] [CrossRef]
  8. Iannetti, L.; Romagnoli, S.; Cotturone, G.; Podaliri Vulpiani, M. Animal Welfare Assessment in Antibiotic-Free and Conventional Broiler Chicken. Animals 2021, 11, 2822. [Google Scholar] [CrossRef]
  9. Amini, S.; Kazemi, N.; Marzban, A. Evaluation of Energy Consumption and Economic Analysis for Traditional and Modern Farms of Broiler Production. Biol. Forum Int. J. 2015, 7, 905–911. [Google Scholar]
  10. Baxevanou, C.; Fidaros, D.; Bartzanas, T.; Kittas, C. Energy Consumption and Energy Saving Measures in Poultry. Energy Environ. Eng. 2017, 5, 29–36. [Google Scholar] [CrossRef]
  11. Heidari, M.D.; Omid, M.; Akram, A. Energy Efficiency and Econometric Analysis of Broiler Production Farms. Energy 2011, 36, 6536–6541. [Google Scholar] [CrossRef]
  12. Monteiro, F.P.; Monteiro, S.A.; Tostes, M.E.; Bezerra, U.H. Using True RMS Current Measurements to Estimate Harmonic Impacts of Multiple Nonlinear Loads in Electric Distribution Grids. Energies 2019, 12, 4132. [Google Scholar] [CrossRef]
  13. Steidle Neto, A.J.; Lopes, D.d.C.; Nascimento, S.T. Potential of Grid-Connected Photovoltaic Systems in Brazilian Dairy Farms. AgriEngineering 2022, 4, 122–133. [Google Scholar] [CrossRef]
  14. PN-EN 61000-4-7:2004 (U); Kompatybilność Elektromagnetyczna (EMC)—Część 4–7: Metody Badań i Pomiarów—Ogólny Przewodnik Dotyczący Pomiarów Harmonicznych i Interharmonicznych Oraz Stosowanych Do Tego Celu Przyrządów Pomiarowych Dla Sieci Zasilających i Przyłączonych Do Nich Urządzeń. Polski Komitet Normalizacyjny: Warsaw, Poland, 2004.
  15. Rajaniemi, M.; Jokiniemi, T.; Alakukku, L.; Ahokas, J. Electric Energy Consumption of Milking Process on Some Finnish Dairy Farms. Agric. Food Sci. 2017, 26, 160–172. [Google Scholar] [CrossRef] [Green Version]
  16. Mohammadshirazi, A.; Akram, A.; Rafiee, S.; Mousavi Avval, S.H.; Kalhor, E. An Analysis of Energy Use and Relation between Energy Inputs and Yield in Tangerine Production. Renew. Sustain. Energy Rev. 2012, 16, 4515–4521. [Google Scholar] [CrossRef]
  17. Górecki, K.; Szmajda, M.; Zygarlicki, J.; Zygarlicka, M.; Mroczka, J. Zaawansowane metody analiz w pomiarach jakości energii elektrycznej. Pomiary Autom. Kontrola 2011, 57, 284–286. [Google Scholar]
  18. Bernieri, A.; Betta, G.; Ferrigno, L.; Laracca, M. Electrical Energy Metering in Compliance with Recent European Standards. In Proceedings of the 2012 IEEE International Instrumentation and Measurement Technology Conference Proceedings, Graz, Austria, 13–16 May 2012; pp. 1541–1545. [Google Scholar]
  19. Dyer, J.A.; Desjardins, R.L. An Integrated Index of Electrical Energy Use in Canadian Agriculture with Implications for Greenhouse Gas Emissions. Biosyst. Eng. 2006, 95, 449–460. [Google Scholar] [CrossRef]
  20. Kizilaslan, H. Input–Output Energy Analysis of Cherries Production in Tokat Province of Turkey. Appl. Energy 2009, 86, 1354–1358. [Google Scholar] [CrossRef]
  21. Pierzgalski, W. Standaryzacja metod pomiarowych grupy przyrządów przeznaczonych do wyznaczania wskaźników jakości energii elektrycznej. Pr. Inst. Elektrotech. 2007, Z. 232, 143–166. [Google Scholar]
  22. Shine, P.; Upton, J.; Sefeedpari, P.; Murphy, M.D. Energy Consumption on Dairy Farms: A Review of Monitoring, Prediction Modelling, and Analyses. Energies 2020, 13, 1288. [Google Scholar] [CrossRef] [Green Version]
  23. Zygarlicki, J.; Zygarlicka, M.; Mroczka, J.; Latawiec, K.J. A Reduced Prony’s Method in Power-Quality Analysis—Parameters Selection. IEEE Trans. Power Deliv. 2010, 25, 979–986. [Google Scholar] [CrossRef]
  24. IEC 61000-4-30:2015; Electromagnetic Compatibility (EMC)—Part 4–30: Testing and Measurement Techniques—Power Quality Measurement Methods. International Electrotechnical Commission: Geneva, Switzerland, 2015. Available online: https://webstore.iec.ch/publication/68642 (accessed on 23 October 2022).
  25. Ferreira, L.F.S.A.; Turco, J.E.P. Evaluation of consumption and costa of the electric power in broiler chicken poultry house, during two breeding cycles [Avaliacao do consumo e custo de energia eletrica em galpao para criacao de frangos de corte, em dois ciclos de criacao]. In Proceedings of the 3. Encontro de Energia no Meio Rural, Campinas, Brazil, 12–15 September 2000. [Google Scholar]
  26. Miller, J.; Foxon, T.J.; Sorrell, S. Exergy Accounting: A Quantitative Comparison of Methods and Implications for Energy-Economy Analysis. Energies 2016, 9, 947. [Google Scholar] [CrossRef] [Green Version]
  27. Çavuşoğlu, E.; Petek, M.; Abdourhamane, İ.M.; Akkoc, A.; Topal, E. Effects of Different Floor Housing Systems on the Welfare of Fast-Growing Broilers with an Extended Fattening Period. Arch. Anim. Breed. 2018, 61, 9–16. [Google Scholar] [CrossRef]
  28. Chen, Q.; Saatkamp, H.W.; Cortenbach, J.; Jin, W. Comparison of Chinese Broiler Production Systems in Economic Performance and Animal Welfare. Animals 2020, 10, 491. [Google Scholar] [CrossRef] [Green Version]
  29. Costantino, A.; Fabrizio, E.; Ghiggini, A.; Bariani, M. Climate Control in Broiler Houses: A Thermal Model for the Calculation of the Energy Use and Indoor Environmental Conditions. Energy Build. 2018, 169, 110–126. [Google Scholar] [CrossRef]
  30. Humphrey, T. Are Happy Chickens Safer Chickens? Poultry Welfare and Disease Susceptibility. Br. Poult. Sci. 2006, 47, 379–391. [Google Scholar] [CrossRef]
  31. Leone, E.H.; Estevez, I. Use of Space in the Domestic Fowl: Separating the Effects of Enclosure Size, Group Size and Density. Anim. Behav. 2008, 76, 1673–1682. [Google Scholar] [CrossRef]
  32. Jaciow, M.; Rudawska, E.; Sagan, A.; Tkaczyk, J.; Wolny, R. The Influence of Environmental Awareness on Responsible Energy Consumption—The Case of Households in Poland. Energies 2022, 15, 5339. [Google Scholar] [CrossRef]
  33. Shields, S.; Greger, M. Animal Welfare and Food Safety Aspects of Confining Broiler Chickens to Cages. Animals 2013, 3, 386–400. [Google Scholar] [CrossRef] [Green Version]
  34. Ben Sassi, N.; Averós, X.; Estevez, I. Technology and Poultry Welfare. Animals 2016, 6, 62. [Google Scholar] [CrossRef] [Green Version]
  35. Rowe, E.; Mullan, S. Advancing a “Good Life” for Farm Animals: Development of Resource Tier Frameworks for On-Farm Assessment of Positive Welfare for Beef Cattle, Broiler Chicken and Pigs. Animals 2022, 12, 565. [Google Scholar] [CrossRef] [PubMed]
  36. Du, X.; Qin, P.; Liu, Y.; Amevor, F.K.; Shu, G.; Li, D.; Zhao, X. Effects of Key Farm Management Practices on Pullets Welfare—A Review. Animals 2022, 12, 729. [Google Scholar] [CrossRef] [PubMed]
  37. Du, X.; Carpentier, L.; Teng, G.; Liu, M.; Wang, C.; Norton, T. Assessment of Laying Hens’ Thermal Comfort Using Sound Technology. Sensors 2020, 20, 473. [Google Scholar] [CrossRef] [PubMed]
  38. He, S.; Lin, J.; Jin, Q.; Ma, X.; Liu, Z.; Chen, H.; Ma, J.; Zhang, H.; Descovich, K.; Phillips, C.J.C.; et al. The Relationship between Animal Welfare and Farm Profitability in Cage and Free-Range Housing Systems for Laying Hens in China. Animals 2022, 12, 2090. [Google Scholar] [CrossRef] [PubMed]
  39. May, F.; Stracke, J.; Heitmann, S.; Adler, C.; Krasny, A.; Kemper, N.; Spindler, B. Structuring Broiler Barns: How a Perforated Flooring System Affects Animal Behavior. Animals 2022, 12, 735. [Google Scholar] [CrossRef] [PubMed]
  40. Parlament Europejski i Rada Unii Europejskiej. Rozporządzenie Parlamentu Europejskiego i Rady (UE) 2017/625. w sprawie kontroli urzędowych i innych czynności urzędowych przeprowadzanych w celu zapewnienia stosowania prawa żywnościowego i paszowego oraz zasad dotyczących zdrowia i dobrostanu zwierząt, zdrowia roślin i środków ochrony roślin. Dziennik Urzędowy Unii Europejskiej, 15 March 2017; 142.
  41. Ustawa z Dnia 21 Sierpnia 1997 r. o Ochronie Zwierząt. Available online: https://isap.sejm.gov.pl/isap.nsf/DocDetails.xsp?id=WDU19971110724&SessionID=249671AF45B58E113503D4428473EF1EE2614860 (accessed on 23 October 2022).
  42. Rozporządzenie Ministra Rolnictwa i Rozwoju Wsi z Dnia 17 Grudnia 2009 r. w Sprawie Sposobu Ustalania Poziomu Obsady Kurcząt Brojlerów w Kurniku, w Którym Są One Utrzymywane. Available online: https://isap.sejm.gov.pl/isap.nsf/DocDetails.xsp?id=WDU20092231784 (accessed on 23 October 2022).
  43. Rozporządzenie Ministra Rolnictwa i Rozwoju Wsi z Dnia 15 Lutego 2010 r. w Sprawie Wymagań i Sposobu Postępowania Przy Utrzymywaniu Gatunków Zwierząt Gospodarskich, Dla Których Normy Ochrony Zostały Określone w Przepisach Unii Europejskiej. Available online: https://isap.sejm.gov.pl/isap.nsf/DocDetails.xsp?id=wdu20100560344 (accessed on 23 October 2022).
  44. Hanzelka, Z. Jakość Dostaw Energii Elektrycznej; Wydawnictwo AGH: Kraków, Poland, 2013. [Google Scholar]
  45. Czarnecki, L. Moce w Obwodach Elektrycznych z Niesinusoidalnymi Przebiegami Prądów i Napięć; Oficyna Wydawnicza Politechniki Białostockiej: Warsaw, Poland, 2005. [Google Scholar]
  46. Ustawa z Dnia 10 Kwietnia 1997r. Prawo Energetyczne. Available online: https://isap.sejm.gov.pl/isap.nsf/DocDetails.xsp?id=wdu19970540348 (accessed on 31 December 2022).
  47. EN 50160:2010; Parametry Napięcia Zasilającego w Publicznych Sieciach Elektroenergetycznych. Polski Komitet Normalizacyjny: Warsaw, Poland, 2014.
Figure 1. View of the surveyed poultry house.
Energies 16 00547 g001
Figure 2. Three-phase active power consumed during the cycle.
Energies 16 00547 g002
Figure 3. Three-phase active power value as a function of time in the 1st stage of the cycle.
Energies 16 00547 g003
Figure 4. Three-phase reactive power as a function of time in the 1st stage of the cycle.
Energies 16 00547 g004
Figure 5. Three-phase active power as a function of time in the 2nd stage of the cycle.
Energies 16 00547 g005
Figure 6. Three-phase reactive power as a function of time in the 2nd stage of the cycle.
Energies 16 00547 g006
Figure 7. Three-phase active power as a function of time in the 3rd stage of the cycle.
Energies 16 00547 g007
Figure 8. Three-phase reactive power as a function of time in the 3rd stage of the cycle.
Energies 16 00547 g008
Figure 9. Three-phase active power as a function of time on a representative day of the 1st stage.
Energies 16 00547 g009
Figure 10. Three-phase active power as a function of time on a representative day of the 2nd stage.
Energies 16 00547 g010
Figure 11. Three-phase active power as a function of time on a representative day of the 3rd stage.
Energies 16 00547 g011
Figure 12. Three-phase reactive power as a function of time on a representative day of the 1st stage.
Energies 16 00547 g012
Figure 13. Three-phase reactive power as a function of time on a representative day of the 2nd stage.
Energies 16 00547 g013
Figure 14. Three-phase reactive power as a function of time on a representative day of the 3rd stage.
Energies 16 00547 g014
Table 1. Methods of producing meat chickens.
Production MethodObjective
12
Short rearingUp to 32 days of age, rearing broiler chickens of both sexes with a body weight of about 1500 g.
Medium–long rearingUp to 40–44 days, rearing chickens with a body weight of 2100–2300 g.
Split rearingAt 32–42 days of rearing, 20–30% of chickens are destined for slaughter, the rest are kept until 45 days of age.
Reared to a certain weightUp to 36–39 days, with a weight of 1850 g.
Table 2. Summary of basic parameters required for each stage of the cycle.
Cycle StageTemperatureLight CycleIllumination Intensity
[°C][h][lx]
1CS24−252420
2CS20–2516–18
3CS20–2523
Table 3. Main receivers in the surveyed household.
Type of LoadNumberUnit PowerTotal Power
kWkW
Fan91.19.90
Heater40.451.80
Fluorescent lamp560.0362.02
Feeding and watering system11.11.10
Water pump133.00
Total 17.82
Table 4. Electricity consumption in successive stages of the cycle.
Energy Consumption
Energy E A E Q tgφcosφ
[kWh][kvarh][−][−]
1CS300.34358.411.1930.642
2CS2609.102475.330.9490.725
3CS1869.481410.530.7550.798
Table 5. Average, minimum, and maximum loads of active and reactive power in each stage of the cycle.
Load
PQ
PavrPminPmaxQavrQminQmax
[kW][kW][kW][kvar][kvar][kvar]
1CS3.6141.8368.4804.3122.2308.817
2CS4.3480.28418.2644.125−0.05013.569
3CS4.3481.49217.4525.6590.70813.084
Table 6. Electricity consumption in each stage of the cycle per unit area and per chicken.
Unit Consumption per Unit AreaUnit Consumption per Chicken
w i A w i Q w k A w k Q
[kWh/m²][kvarh/m²][kWh/k][kvarh/k]
1CS0.1370.1631FC0.0090.011
2CS1.1861.1252FC0.0820.077
3CS0.8500.6413FC0.0580.044
Table 7. Average, minimum, and maximum load of active and reactive power per unit area.
Unit Load per Unit Area
PQ
Pavr/pPmin/pPmax/pQavr/pQmin/pQmax/p
[W/m²][W/m²][W/m²][var/m²][var/m²][var/m²]
1CS1.6430.8353.8551.9601.0144.008
2CS1.9760.1298.3021.875−0.0236.168
3CS1.9760.6787.9332.5720.3225.947
Table 8. Average, minimum, and maximum load of active and reactive power per chicken.
Unit Load per Chicken
PQ
Pavr/kPmin/kPmax/kQavr/kQmin/kQmax/k
[W/m²][W/m²][W/m²][var/m²][var/m²][var/m²]
1CS0.1130.0570.2650.1350.0700.276
2CS0.1360.0090.5710.129−0.0020.424
3CS0.1360.0470.5450.1770.0220.409
Disclaimer/Publisher’s Note: The statements, opinions and data contained in all publications are solely those of the individual author(s) and contributor(s) and not of MDPI and/or the editor(s). MDPI and/or the editor(s) disclaim responsibility for any injury to people or property resulting from any ideas, methods, instructions or products referred to in the content.

