Article

Insuring a Small Retail Electric Provider’s Procurement Cost Risk in Texas

1
Department of Asian and Policy Studies, Education University of Hong Kong, Hong Kong, China
2
Department of Economics, University of Texas at Austin, Austin, TX 78712, USA
3
Coller School of Management, Tel Aviv University, Tel Aviv 69978, Israel
4
Department of Economics, Hong Kong Baptist University, Kowloon Tong, Hong Kong, China
*
Author to whom correspondence should be addressed.
Energies 2023, 16(1), 393; https://doi.org/10.3390/en16010393
Submission received: 28 November 2022 / Revised: 16 December 2022 / Accepted: 22 December 2022 / Published: 29 December 2022
(This article belongs to the Special Issue Power System Analysis, Operation and Control)

Abstract

:
Motivated by the relatively infrequent but very large price spikes in the day-ahead and real-time energy markets operated by the Electric Reliability Council of Texas, this paper proposes an insurance that a small and risk-averse retailer in Texas (i.e., a retail electric provider (REP)) may buy to prevent financial insolvency caused by inadequate risk management. It also demonstrates the insurance’s practical design, pricing, and implementation. As participation in the REP’s procurement auction is voluntary, the insurance is mutually beneficial for the REP and the insurance seller. Hence, the proposed insurance is a newly developed wholesale market product that deserves consideration by REPs in Texas and competitive retailers elsewhere.

1. Introduction

The Electric Reliability Council of Texas (ERCOT) uses locational marginal pricing [1] to set the spot electricity prices in its day-ahead market (DAM) and real-time market (RTM) [
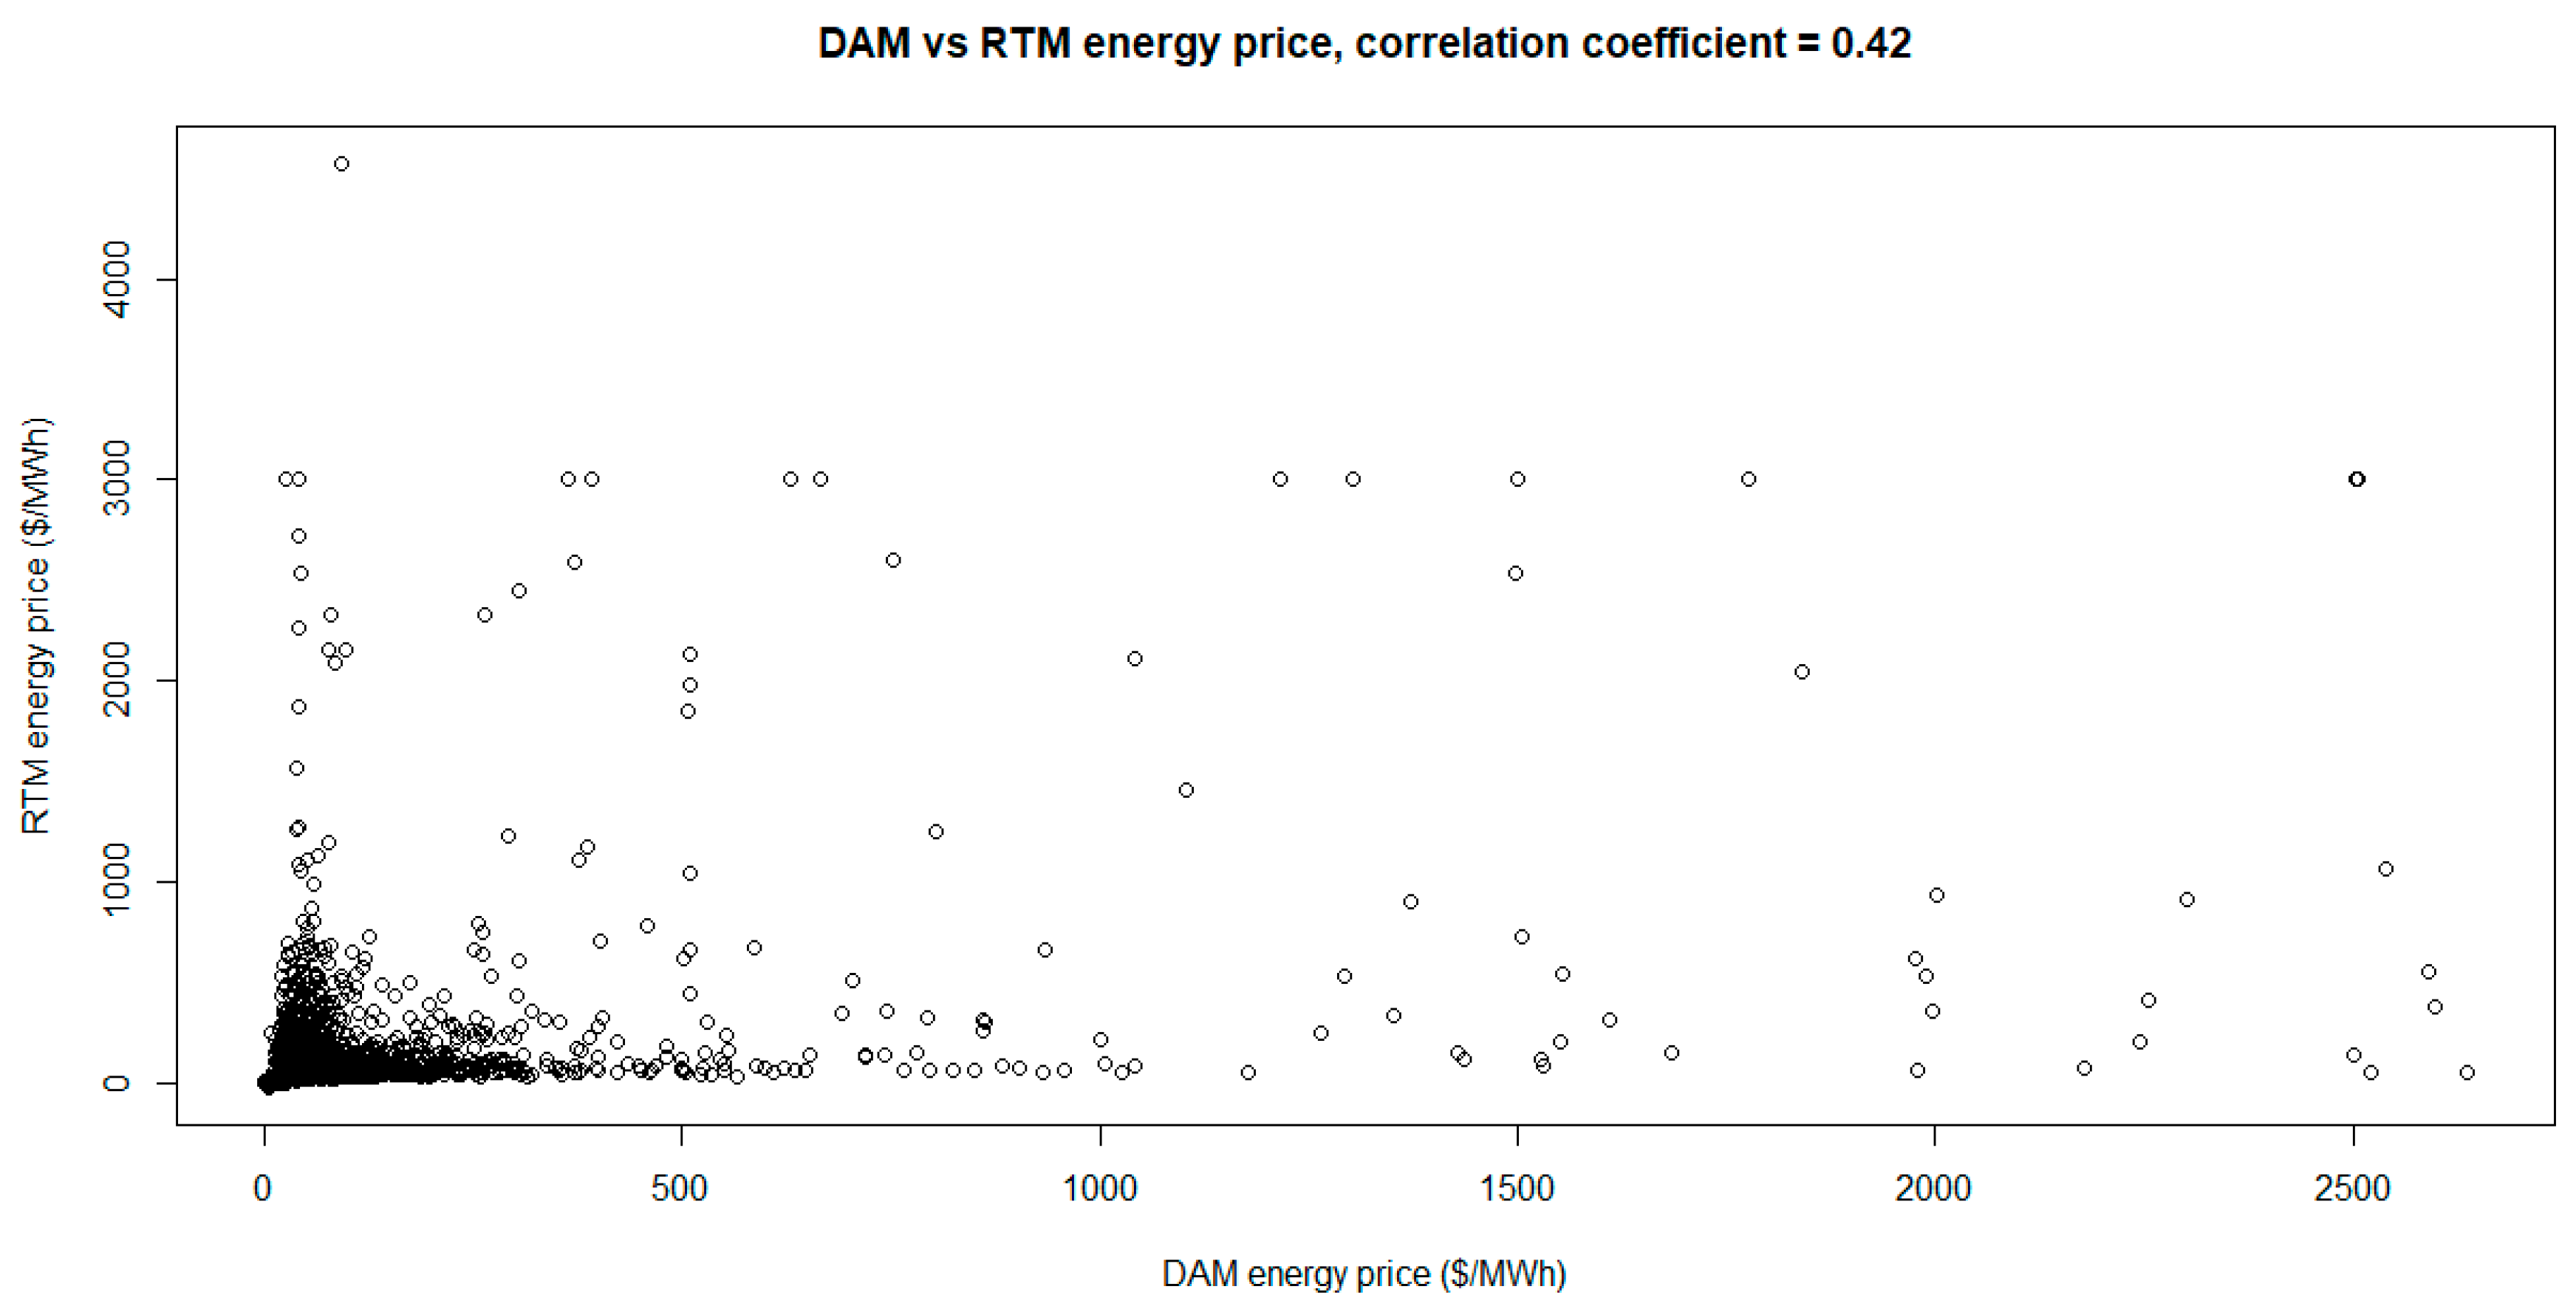
2]. Varying with the day-ahead forecasts of fundamental drivers of natural gas price, system load, ancillary services requirements, nuclear generation, and wind generation, the volatile DAM prices move the even more volatile RTM prices shown in Figure 1, which is a reproduction from [3].
When ERCOT’s retail market first opened in 2002, a qualified scheduling entity (QSE) must show that its projected aggregate supply had been procured through bilateral contracts and other means to meet its projected aggregate demand. A balancing energy market was created to resolve the mismatch between the QSE’s projected and actual schedules of aggregate demand and supply. The QSE is responsible for commercial transactions involving multiple retail electric providers (REPs). Hence, the energy shortfall of one REP could be offset by the surplus energy of another REP within the QSE’s portfolio of REPs (www.ercot.com/files/docs/2005/11/07/360prr_relaxed_balanced_schedules.doc; accessed on 27 May 2022).
The balanced schedule requirement was gradually relaxed, as ERCOT established a DAM in December 2010 that transformed the balancing energy market into today’s RTM (Zarnikau et al., 2014). Hence, a REP in Texas can now decide whether and how to manage its procurement cost risk caused by spot price volatility and sales fluctuation, as exemplified by two case studies of a load serving entity in Florida [4,5].
A REP’s procurement cost for serving the unhedged portion of the total load can explode during market conditions of scarcity, exacerbated by the various “adders” that apply to RTM prices (e.g., reliability deployment price adder) and operating reserve demand curve (ORDC) adder [6]). The reliability deployment price adder is designed to prevent prices from being depressed when ERCOT takes an out-of-market action, such as ordering a power plant to operate to maintain the reliability of the system or orders the deployment of a demand response program. See ERCOT Protocols, Section 6.5.7.3.1 at https://www.ercot.com/mktrules/nprotocols/current, (accessed on 27 May 2022). In addition, real-time ORDC price adders occur when ERCOT’s physical operating reserve dips below a pre-set threshold. This phenomenon raises a substantive research question: can a small and risk-averse REP insure its procurement cost risk due to large spot price spikes in ERCOT’s energy markets? This question accentuates our paper’s primary focus of designing an insurance scheme to reduce the REP’s procurement cost risk exposure to the price spikes during ERCOT’s critical hours of low physical capacity reserve due to high system demand and/or generation plant outages.
The preceding question’s real-world relevance is best exemplified by Winter Storm Uri that caused the Texas deep freeze in February 2021, whose timeline and devastating effects of price spikes and blackouts are available from a report released in July 2022 by the University of Texas (Austin) (https://energy.utexas.edu/sites/default/files/UTAustin%20%282021%29%20EventsFebruary2021TexasBlackout%2020210714.pdf; accessed on 27 May 2022). The large spot price spikes in that fateful month bankrupted several REPs, which had signed fixed price contracts with retail customers without adequately hedging their procurement cost risks (https://www.power-technology.com/news/industry-news/texas-snow-storm-bankrupt-fallout-energy-prices-ercot/; accessed on 27 May 2022). This kind of bankruptcy is not new, as underscored by the financial insolvency of two large electric utilities in California caused by the spot price spikes during the state’s energy crisis in 2001 [7,8].
The same question is similarly important and relevant for other regions with volatile wholesale market prices that a competitive retailer inevitably faces. A partial list of these regions includes (a) the states served by the regional transmission organizations of PJM Interconnection, ISO New England, and New York ISO in the US; (b) the provinces of Alberta and Ontario in Canada; (c) Asia-Pacific countries such as Australia, New Zealand, and Singapore; (d) countries in the European Union (https://www.europarl.europa.eu/factsheets/en/sheet/45/internal-energy-market; accessed on 27 May 2022); and (e) South American countries such as Brazil and Chile [9,10].
To answer the question in Texas’s context, we propose an insurance that a small and risk-averse REP may buy to manage its procurement cost risk. Our proposed insurance comes from the first author’s research funded by several electric utilities in North America. As such, it aims for practicality, rather than highly technical details often related to the pricing of electricity derivatives (e.g., [11,12]) and recently proposed insurance schemes (e.g., [13,14,15,16]). While aiding the REP to avoid financial insolvency, our proposed insurance is profitable for insurance sellers voluntarily participating in the REP’s internet-based procurement auction described in Section 4.2. Hence, it is a newly developed wholesale market product that deserves consideration by REPs in Texas and competitive retailers elsewhere.
Complementing extant studies on electricity risk management (e.g., [5,11,12,17,18,19,20]), our proposed insurance is, to the best of our knowledge, a newly developed wholesale market product for use by a competitive retailer like those in Texas. Its practical pricing, design and implementation explained in Section 4 show that it differs from (a) the currently available electricity products described in Section 3 and (b) the insurance proposals for managing the risks related to system reliability [13], distributed generation [14], real-time pricing of energy consumption [15], power plant performance (https://www.munichre.com/hsb/en/products.html; accessed on 27 May 2022), and transmission and distribution [16].
The rest of this paper proceeds as follows. Section 2 states a REP’s risk management problem. This section purposedly omits a literature review of the voluminous studies on electricity risk management because (a) such a review is an unnecessary distraction from our narrowly focused paper; and (b) general overviews of electricity risk management are already available (e.g., [12,17]). Section 3 describes electricity products currently available for the REP’s risk management. Section 4 explains our proposed insurance’s design, pricing, and implementation. Section 5 is an indicative calculation of the insurance per MWh premium, whose empirics are reported in Section 6. Section 7 concludes.

2. Risk Management Problem of a Small REP in Texas

To provide a contextual background of our proposed insurance, consider the risk management problem in connection to a small REP’s fixed price plan [21]. The plan’s fixed price is $G/MWh for generation, which inevitably differs from the wholesale spot price $P/MWh after contract signing. For simplicity, we assume that G is mainly driven by P because the cost of ancillary services and the cost associated with other charges imposed by ERCOT are relatively small and fully passed through to the REP’s customers. The REP earns ex post profit of $(GP) for each MWh procured from the spot market for resale. Unfortunately, Figure 1 shows that P may surge above G, resulting in ex post loss of $(PG)/MWh. Thus, retail fixed pricing can cause the REP to face large financial risk exposure if it decides not to hedge adequately. Parenthetically, this outcome also applies to time-of-use and pre-pay plans with prices that do not closely track the fast-changing spot market prices in their delivery periods.
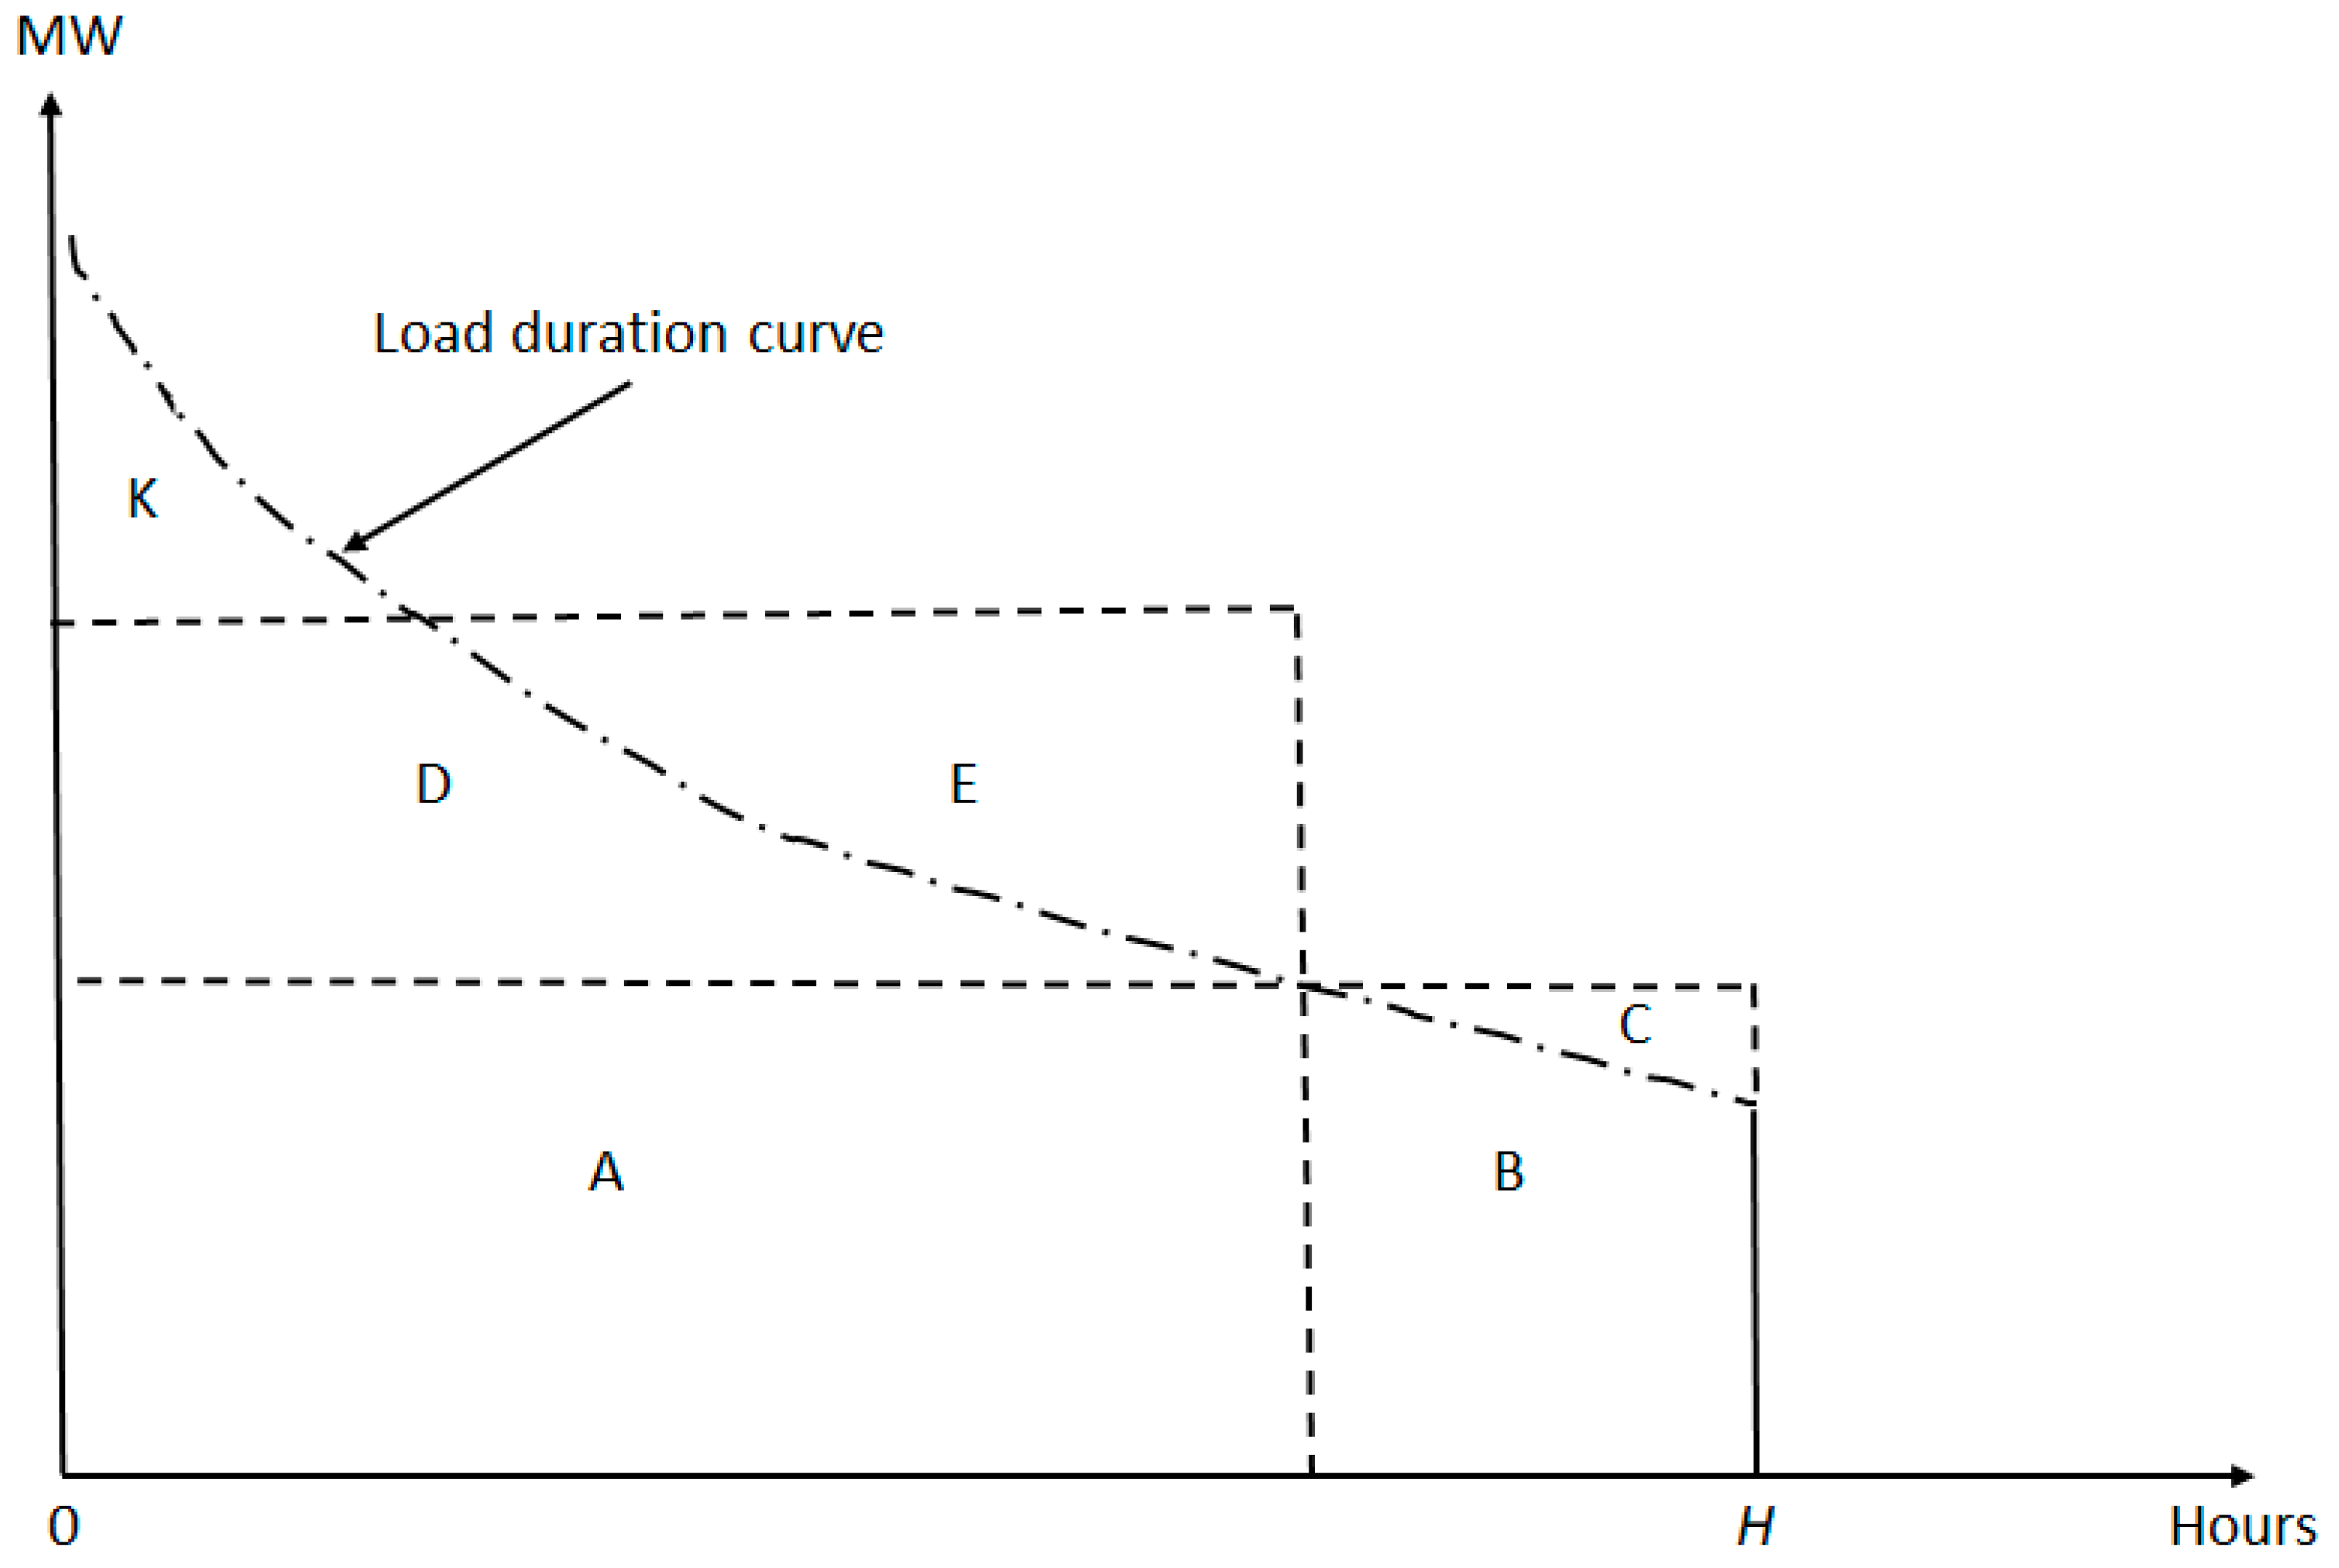
Figure 2 is an illustrative example of the REP’s risk management problem under the assumption that the load duration curve (LDC) can be accurately forecasted [4,5]. The LDC forecast can be made using time series modeling of the REP’s aggregate hourly load data. Alternatively, it can be based on a bottom-up approach that uses the data for (1) the average load profiles of customer segments differentiated by consumption size and residence type (e.g., apartment, town house, and single detached home) and (2) each segment’s forecasted number of customers.
Figure 2 assumes that the REP buys a forward contract at fixed price $F/MWh for a baseload power block given by Areas A, B, and C. Area C is the contract’s excess MWh sold by the REP in the spot market at $P/MWh. As F exceeds E(P) = expected value of P [22,23,24,25] due to the profitable forward premium required by generators and power marketers/traders, the contract’s purchase causes a per MWh expected loss of [FE(P)] attributable to the REP’s sale of excess MWh. The same line of reasoning applies to the REP’s purchase of a forward contract for the shoulder power block given by Areas D and E to meet the load obligation given by Area D.
When the REP buys ERCOT’s spot energy to meet the peak load obligation given by Area K, it has residual risk exposure. If the REP decides to reduce its procurement of forward contracts, it becomes increasingly vulnerable to large spot price spikes. When lasting multiple days, as in the case of the Texas deep freeze, such spikes can bankrupt the REP.

3. Demand for the Proposed Insurance

3.1. Electricity Products

To illustrate the market potential of the insurance proposed in Section 4, this section discusses the existing electricity products that a small REP may employ to manage its procurement cost risk. If these products can adequately meet the REP’s risk management need, they obviate our proposed insurance’s usefulness.

3.1.1. Wholesale Electricity Products

ERCOT operates a DAM for ancillary services and energy and a RTM for energy [3]. The main market participants are independent power producers (IPPs), power traders and marketers (PTMs), and REPs. While the DAM offers day-ahead forwards for hedging against the RTM’s price risk [24], it cannot protect a small REP in a multiday financially ruinous event such as the Texas deep freeze. This is because DAM prices set on day d-1 and RTM prices set on day d move on an almost dollar-for-dollar basis [3]. As DAM prices have forward premiums but are less volatile than RTM prices, buying energy from the DAM instead of the RTM does not reduce the REP’s procurement cost expectation, notwithstanding that it can decrease the REP’s procurement cost volatility.
Electricity derivatives aid a small REP’s risk management [12,17]. A good example is the monthly 5-MW peak futures available from the Chicago Mercantile Exchange (CME) (https://www.cmegroup.com/markets/energy/electricity/ercot-houston-zone-mcpe-5-mw-peak-swap-futures.contractSpecs.html; accessed on 27 May 2022). However, these futures are thinly traded and have a delivery point (Houston 345 kV Hub) that does not geographically correspond to where the REP’s customers reside. Moreover, their delivery hours (07:00 to 22:00, working weekdays) poorly match ERCOT’s high price hours or the REP’s peak load hours (e.g., hot summer afternoon hours of 12:00 to 16:00). Hence, the REP cannot easily use electricity futures to manage the procurement cost risk of the residually unhedged load shown in Figure 2.
Besides electricity futures, the REP’s risk management may consider the bilaterally traded products listed below:
A full requirement contract with fixed price FR offered by an IPP or PTM eliminates the REP’s price and quantity risks. Analogous to the contract for difference, it stipulates that if FR is above spot market price P, the REP pays (FRP) Q for its total retail sales of Q MWh to the contract seller; otherwise, the REP receives (PFR) Q from the contract seller. However, it may not be financially attractive to the REP because FR likely contains a large premium to compensate the contract seller for absorbing the wholesale market’s spot price risk and the REP’s quantity risk [4,5,7,23,25].
An electricity forward is a take-or-pay fixed price contract for daily delivery of a MW block to the REP by the seller in the contract period [7]. As illustrated in Figure 2, the REP purchases electricity forwards mainly for managing the price risk of its non-peak sales given by Areas A, B, and D [18].
A tolling agreement has a monthly capacity charge that gives the REP the right but not the obligation to dispatch the seller’s natural-gas-fired generation unit (e.g., a combined cycle gas turbine) at per MWh fuel cost C = contracted heat rate (e.g., 7 MMBtu per MWh) × daily wholesale natural gas price [26]. Under least-cost dispatch, the REP’s per MWh variable cost of energy is C* = min (P, C). During ERCOT’s high price hours, C* = C and the REP is immune to spot energy price spikes. Like an electricity forward, the agreement is typically used to manage the price risk related to the REP’s non-peak sales.
A 1-MW capacity call option has a monthly premium that gives the REP the right but not the obligation to request MWh delivery from the seller at the option’s strike price for a maximum duration (e.g., 6 h per call) and a maximum frequency (e.g., four calls per month) during the option’s contract months (e.g., July and August) [27]. While the option can mitigate the REP’s financial risk exposure in connection to the REP’s peak sales during ERCOT’s heat storm with extremely high spot prices, the REP needs to make the “right” calls in each month to maximize the option’s monthly total payoff = monthly sum of max (spot price−strike price, 0) × hours per call. As will be seen in Section 4, our proposed insurance does not require the REP to know when to optimally exercise the option. Importantly, it can better protect the REP against spot price spikes because its contract specification does not have the option’s duration and frequency restrictions.

3.1.2. Retail Electricity Products

There are retail electricity products that the REP may use to reduce its exposure to spot price risk. For example, the REP may employ real-time pricing (RTP) that shifts the spot price risk from the REP to its customers [28]. If the REP can apply RTP to all MWh sales under its LDC, it does not need to hedge to fully protect itself from the spot price risk’s adverse financial impact. However, RTP is relatively unattractive to the REP’s customers because of its complexity and bill instability, making fixed price plans the most popular in Texas [29]. Further, Texas has banned residential RTP (https://abc13.com/texas-legislature-ban-residential-wholesale-electricity-plans-house-bill-16-gov-greg-abbott/10633908/; accessed on 27 May 2022), a legislative response to the huge electricity bills for residential RTP customers in the aftermath of the February 2021 freeze (https://www.nytimes.com/2021/02/20/us/texas-storm-electric-bills.html; accessed on 27 May 2022).
The REP may employ demand response (DR) programs to reduce its procurement cost risk [28,30]. Roughly one million customers served by REPs in the ERCOT market are served on dynamic pricing plans or participate in load control programs, as shown by slide 18 of the 2020 Analysis of REP and NOIE Demand Response presentation by C.L. Raish to the ERCOT Demand Side Working Group, January 22, 2021 (https://www.ercot.com/files/docs/2021/02/04/15._RMS_2020_4CP__Retail_DR_Analysis_Raish.v3.pptx; accessed on 27 May 2022). However, many electricity consumers are not good candidates for such plans for reasons such as risk aversion, lack of understanding, and inability to respond to real-time price changes or comply with the REP’s load reduction requests [28].

3.2. Possible Buyers

This section explains that the possible buyers of our proposed insurance are small REPs that do not own generation assets and are not subsidiaries of large holding companies. By buying the insurance, a small REP can transfer its procurement cost risk related to the residually unhedged load to an insurance seller that is less risk-averse than the REP.
Large REPs are unlikely buyers because they own generation assets or are subsidiaries of large holding companies [31]. Generation ownership implies that a large REP can self-generate to meet its retail sales when wholesale market prices surge. If this REP has excess generation capacity, it profits from its wholesale market sales during high price hours. If it is a subsidiary of a publicly traded holding company, sharing of its procurement risk among many shareholders implies risk neutrality that obviates its buying interest in the proposed insurance. Finally, the holding company has generation assets and retail customers dispersed across multiple states, resulting in geographic diversification that further reduces a large REP’s buying interest in the proposed insurance.

4. Insurance’s Design, Pricing, and Implementation

4.1. Design and Pricing

Our proposed insurance’s focus is the REP’s residual risk exposure related to the peak load obligation in Figure 2. This focus assumes that the REP uses an optimal portfolio of forward contacts and tolling agreements to meet its non-peak load obligations [4,5,18]. Removing this assumption implies that the REP mainly relies on the spot market purchases to meet its total load obligation measured by the entire area under the LDC, making the REP even more financially vulnerable to spot price spikes.
For easy reference and clarity, here are the key variables that characterize our proposed insurance scheme: (1) V = MWh volume that the REP wishes to insure; (2) S = per MWh insurance premium; (3) Y = per MWh payoff of buying insurance; (4) SV = total insurance premium; and (5) YV = total payoff.
To illustrate our proposed insurance’s design, let V denote the MWh volume that the REP wishes to insure based on the REP’s forecast of aggregate MWh sales. Beyond our paper’s narrow scope, the complicated calculation of V is based on the forecast of Area K in Figure 2, the forecast’s standard error, the spot price’s expected level and volatility, the correlation between sales and spot prices, and the REP’s risk preference [4,5]. Nevertheless, the REP can be almost fully insured if its chosen V is the forecast’s MWh level + 1.65 × the forecast’s standard error, which almost surely exceeds the REP’s actual sales under normal circumstances with a 95% probability. Despite the presence of quantity risk, Section 5 shows that our indicative calculation of the per MWh insurance premium does not depend on the size of V. Further, Section 6 shows how the REP may determine V based on the impact of buying insurance on its retail price offer designed to attract and retain retail customers.
The insurance seller charges $SV for the insured MWh, where S = per MWh insurance premium. The payoff is $YV, where Y = positive difference between the actual spot price and the threshold level T stipulated in the insurance contract. As a result, our proposed insurance looks like a capacity call option. However, there is an important difference. Our proposed insurance is simpler and more flexible than a multi-month capacity call option because it does not need to specify the maximum number of calls per month and maximum number of hours per call. Since T is unknown a priori, it presents an empirical challenge that our indicative calculation of S must overcome. Owing to the spot price spikes caused by Winter Storm Uri, this calculation assumes that T is the spot price level when ERCOT’s physical reserve capability is above 5000 MW, as further detailed in Section 5 below.
Suppose we have data on μ = E(Y) = expected value of Y and σ2 = Var(Y) = variance of Y. We can use the forward contract pricing formula in Woo et al. (2001) to calculate S:
S = μ + z σ,
where z = standard normal variate. At z = 1.65, S is almost surely profitable for an insurance seller under normal circumstances with a 0.95 probability. However, the resulting S is likely cost-unreasonable for the REP, as demonstrated in Section 6 below. If fierce competition exists in a REP’s procurement auction described in the next section, we expect z → 0 and Sμ. To achieve profitability with a probability above 0.5, however, insurance sellers participating in the auction can submit S quotes that correspond to z > 0.

4.2. Implementation

Our proposed insurance differs from the insurances for uncorrelated events such as car accidents, illness, and fire, whose profitability is based on the law of large numbers. Rather, it resembles earthquake and flood insurances that provide buyer protection against rare but financially ruinous events. This is because extreme price spikes in ERCOT’s RTM tend to occur in relatively few hours per year but can adversely affect small REPs, as evidenced by the bankruptcies in the aftermath of the Texas deep freeze.
As our proposed insurance is not a standardized wholesale product like the electricity futures traded on the CME, its implementation may occur via the REP’s Anglo-Dutch internet-based procurement auction executed in two stages [27,32,33,34]. In Stage 1, all eligible participants submit open price offers that are continuously announced in a pre-set time window (e.g., one hour). A participant can then lower its offer after seeing the offers made by other participants within the window. After Stage 1’s completion, the top three participants with low open offers are invited to participate in Stage 2 that entails a single submission of best and final closed offers. The winning participant is the one with the lowest closed offer.
Informed by the list of bidders underlying the auction results documented by [27,32], the likely insurance sellers are PTMs that are less risk-averse than the REP. Voluntary participation in the REP’s procurement auction implies profitability of the insurance quotes submitted by the likely sellers.
Finally, IPPs and holding companies are unlikely participants in the small REP’s insurance procurement auction, as their main business focus is profitable sales of the wholesale electricity products such as spot energy traded in ERCOT’s DAM and RTM, forward contracts, and tolling agreements.

5. Indicative Calculation of the Insurance’s per MWh Premium

While the values of μ and σ2 may come from ERCOT’s least-cost generation dispatch [3], they are difficult to forecast for determining a forward-looking value for S. As an illustrative alternative, we calculate μ and σ2 based on the per MWh price adder set by ERCOT’s ORDC [6].
Our indicative calculation presumes that the ORDC price adder is a reasonable approximation of Y, thus bypassing the need to know the threshold level T stipulated in the insurance contract. However, it does not mean that Y is caused by the ORDC adder. We use the ORDC adder solely for circumventing the data unavailability problem in our calculation of S. If more accurate values of μ and σ2 are available from non-ORDC sources, they should replace those presented below.
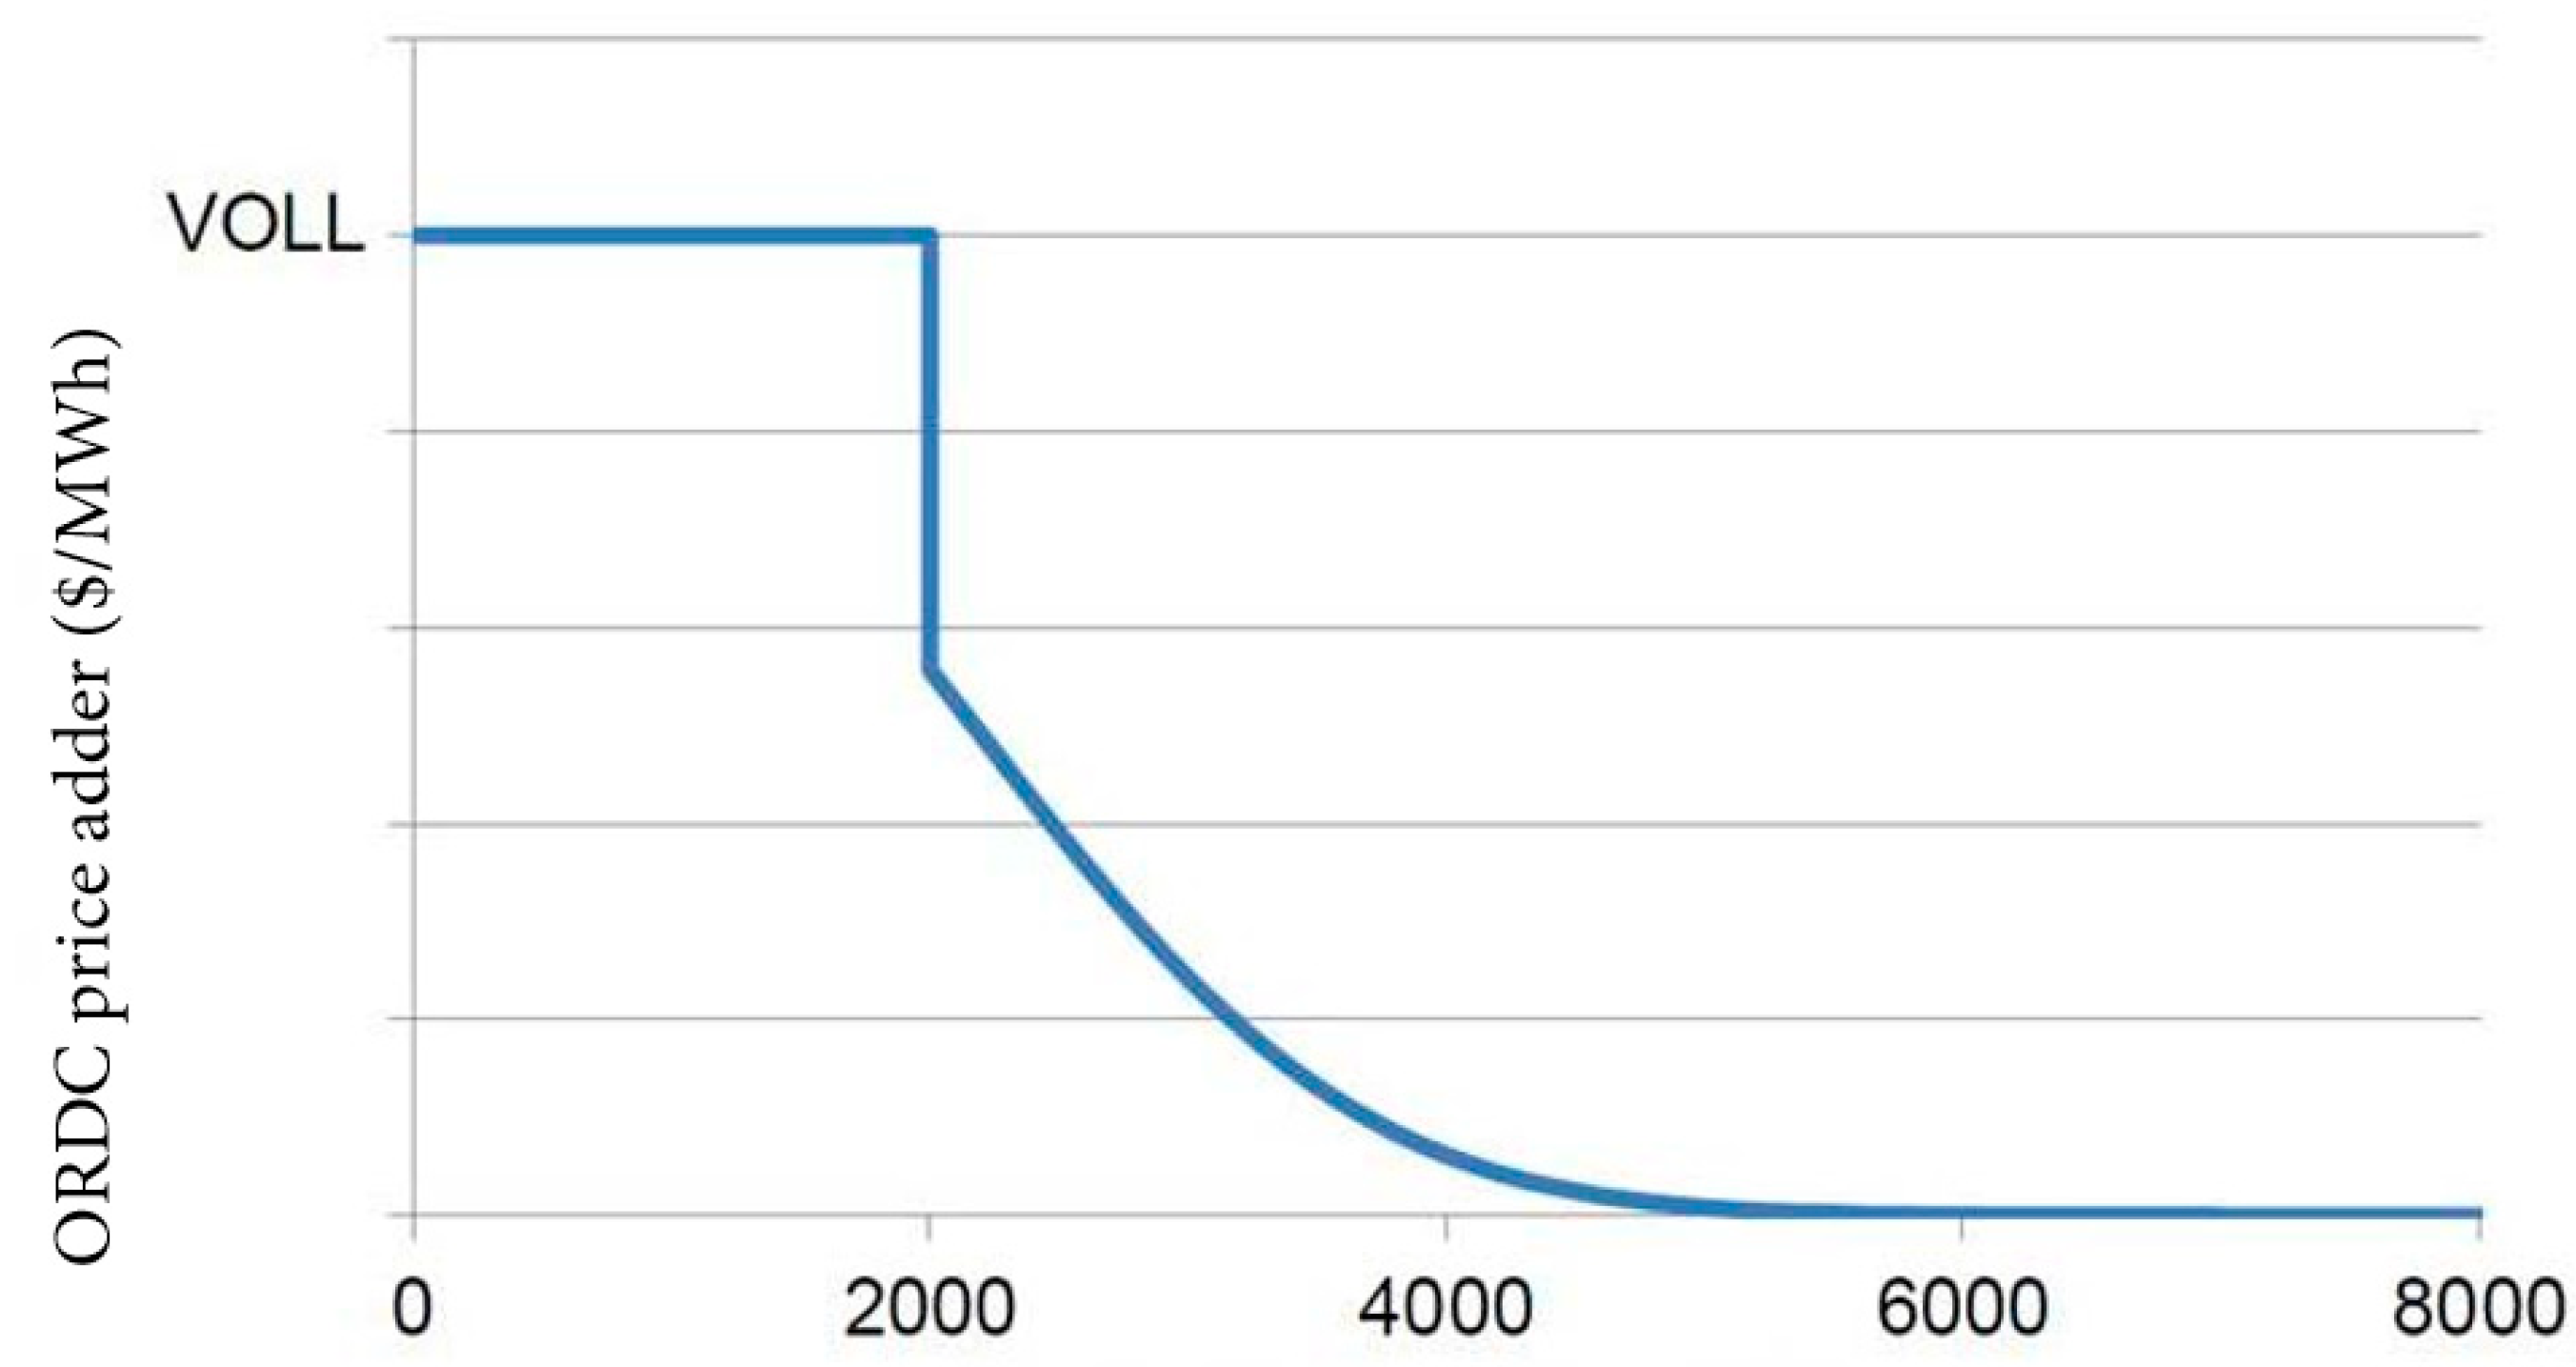
Figure 3 portrays the ORDC adder during ERCOT’s hours of low physical reserve capability [6]. Hence, these hours correspond to those containing the price spikes on the long right tail of ERCOT’s skewed spot price distribution implied by Figure 1.
When ERCOT’s physical reserve capability is at or below 2000 MW, the ORDC adder is VOLL = $9000/MWh, which is ERCOT’s value of lost load assumption prior to Winter Storm Uri. Technically, the ORDC adder is always below VOLL. If the system lambda is $X/MWh, the ORDC adder is $(VOLL–X)/MWh to bring the market price up to the systemwide offer cap of VOLL. As will be seen below, this technical adjustment shrinks the size of α used in our calculation of S. In contrast, the ORDC adder is $0/MWh when ERCOT’s physical reserve capability exceeds 5000 MW. As the ORDC adder is used to measure the insurance’s per MWh payoff Y, the insurance’s threshold T is the spot price when ERCOT has over 5000 MW of physical reserve capability.
Replacing the VOLL number with the lower price caps adopted after the deep freeze does not change our calculation process. The price cap was $2000/MWh from March to December 2021 and had been increased to $5000/MWh in January 2022. Importantly, our methodology to estimate μ and σ2 is applicable to any price cap in effect at the time of the per MWh premium’s calculation.
Using Figure 3, we characterize Y as follows:
Case 1: Y = 0 if ERCOT’s physical reserve capability is RRU, where RU = R’s upper threshold at which the ORDC price adder is $0/MWh.
Case 2: Y = α + β R if RU > R > RL, where RL = R’s lower threshold at which the ORDC price adder is strictly positive. The coefficient α > 0 is the VOLL that can be replaced by a lower price cap. The coefficient β = −(α/RU) < 0 is the marginal effect of R on Y.
Case 3: Y = α if RLR.
Our linear characterization of Y is necessary to enable our per MWh premium’s calculation based on the information readily available to the REP. Given the convex nature of the ORDC, linearization tends to overstate the ORDC price adder in Case 2. Hence, a nonlinear characterization of the ORDC can improve our premium calculation’s accuracy by reducing the size of the per MWh premium. That said, it is a complication that does not materially enrich the qualitative understanding of our proposed insurance scheme, as further detailed in Section 6.2 below.
Based on Y’s linear characterization, we can now calculate the conditional expectation and variance of Y for each case:
Case 1: As Y = 0, E(Y|Case 1) = θ1 = 0 and Var(Y|Case 1) = 0.
Case 2: As Y > 0, E(Y|Case 2) = θ2 = α + β μR, where μR = E(R|Case 2). Let σR2 = Var(R|Case 2) for RL < R < RU so that Var(Y|Case 2) = β2 σR2.
Case 3: As Y = α, E(Y|Case 3) = θ3 = α and Var(Y|Case 3) = 0.
The determination of θ2 and β2 σR2 requires μR and σR2 in Case 2. Hence, we find μR and σR2 as follows. Let R = normally distributed reserve with mean η and variance λ2, ρL = (RLμ)/μ and ρU = (RUη)/λ. As a result,
μR = ηλM,
where M = [ϕ(ρU) − ϕ(ρL)]/[ϕ(ρU) − ϕ(ρL)], ϕ(z) = normal density function, ϕ(z) = normal probability distribution function, and z = standard normal variate [35]. Further,
σR2 = λ2 (1 − M2N),
where N = [ρU ϕ(ρU) − ρL ϕ(ρL)]/[ϕ(ρU) − ϕ(ρL)].
Let π1 = Prob(RRU), π2 = Prob(RU > R > RL) and π3 = Prob(RLR) = 1 − π1π2. As indicated in Section 6, these probabilities can be estimated by an electric grid’s generation reliability criterion and ERCOT’s history of emergency hours.
The unconditional expectation of Y is:
μ = π2θ2+ π3θ3.
Finally, the unconditional variance of Y is:
σ2 = π2 (θ22 + β2σR2) + π3 α2 − (π2 θ2 + π3 θ3)2.

6. Empirics

6.1. Results

This section reports the empirics from our calculation of S based on Figure 3 that shows α = $9000/MWh, RL = 2000 MW, RU = 5000 MW, and β = −9000 ÷ 5000 = −1.8. Without invoking Equation (2), we use the midpoint between RL and RU as a simple estimate for μR = 3500 in Case 2, which enables a REP’s quick determination of the value of a competitively priced insurance premium. While this estimate for μR is less than the appropriately found estimate of 4475 MW based on Equation (2), our sensitivity check indicates that our calculated S is insensitive to the size of μR.
Assuming η = 6000 and λ = 1000 based on ERCOT’s 2020 reserve data with mean = 5070 and standard deviation = 1163, we use Equation (3) to find σR = 444.60. This calculation of σR enables an insurer’s determination of the per MWh insurance premium’s probability of profitability.
To complete S’s calculation, we assume π3 = 2.4 h/8760 h = 0.000274 based on the loss-of-load-expectation criterion of 1 day in 10 years, which is commonly used to determine an electric grid’s target of generation reserve margin. We further assume π2 = 12 h/8760 h = 0.00137, which is five times π3 and based on ERCOT’s history of emergency hours of 10 to 20 h per year, excluding Winter Storm Uri’s year of 2021.
We use Equations (4) and (5) to find μ = 6.16 and σ =181.71. Hence, the lower bound for S is SL$6.16/MWh at z ≈ 0 when there is fierce competition in a REP’s procurement auction. Thanks to Equation (4) that shows μ = π2 (α + β μR) + π3a; a REP can quickly determine SL based on the simple estimate of μR = 0.5 × (RL + RU), the price cap value of a, b = − (a/RU), and the readily available data for π2 and π3. The upper bound for S is SU = $305.98/MWh at z = 1.65, reflecting SU’s profitability for an insurance seller with almost certainty.
Based on Equation (1), an insurance seller’s per MWh profit with a 0.95 probability is SUSL = $299.82. However, making this large profit with almost certainty is unrealistic because a REP can use SL = $6.16/MWh as the benchmark for selecting the winner of its procurement auction.
Finally, our sensitivity check shows that SL and SU are not materially affected by doubling or halving the values for η and λ. However, reducing α from 9000 to 5000, which is in effect as of 1 January 2022, leads to SL = $3.42/MWh and SU = $170.0/MWh.

6.2. Discussion

Suppose a small REP considers buying insurance based on the insurance’s impact on its fixed price offer. If this impact is deemed excessively large, buying the insurance can harm the REP’s ability to attract customers, despite the insurance’s benefit of pre-empting financial insolvency. This highlights the REP’s trade-off between retail marketing and risk exposure. While offering a low fixed price plan made possible by not buying the insurance can increase customer sign-ups, it enlarges the REP’s risk exposure to spot price spikes that apply to the REP’s residually unhedged load. Underscoring this point are the REP bankruptcies observed in the wake of Texas’s deep freeze in February 2021.
To assess the insurance’s financial impact on the REP’s fixed price offer, we use the average G value of ~$60/MWh found by [21]. Table 1 reports our impact assessment results, which are the percentage changes in G by per MWh insurance premium and insured amount equal to γ percent of the REP’s forecast of total fixed price sales.
An example of the REP’s hourly forecast for a given period (e.g., next month or quarter) is (a) the forecasted number of fixed price customers times (b) the estimated hourly kWh sales per customer. Using its marketing and customer data, the REP may find (a) based on n = number of existing customers + number of new customers − number of departed customers. The REP may also find (b) based on the hourly metered kWh sales per customer. The REP’s total forecast can then be found as the sum of hourly forecasts. While there are alternative forecasting approaches (e.g., aggregate time series modeling and disaggregate panel data analysis), their elaboration is beyond our paper’s intent and scope.
Table 1’s calculation details are as follows. We first assume that the insured amount is γ = 20% of the REP’s total fixed price sales. The price increase based on an insurer’s highly competitive per MWh premium of SL is ∆GL = [0.8 × 60 + 0.2 × (60 + 6.16)] − 60 = $1.23/MWh = 2.05% of the average G value. The price increase based on an insurer’s highly profitable per MWh premium of SU is ∆GU = [0.8 × 60 + 0.2 × (60 + 305.98)] − 60 = $61.20/MWh = 102.0% of the average G value. To complete Table 1, we alternatively assume γ = 10% (30%). The estimates for ∆GL and ∆GU are 1.03% and 51.00% (3.08% and 153.0%) of the average G value.
The ΔG estimates shown in Table 1 suggest that if Area K of the LDC in Figure 2 is ~30% of the REP’s total fixed price sales, the amount of MWh insured may approach 100% of Area K when the per MWh insurance is highly competitive at SL.
Informed by the range of ∆GL and ∆GU estimates in Table 1, the REP may consider buying the insurance when its procurement auction’s winning S quote is close to SL. However, it should reject S quotes that resemble SU. Hence, our ∆GL and ∆GU estimates guide the REP’s decision on insurance purchase, notwithstanding that such a decision is ultimately made by the REP’s risk-averse management.

7. Conclusions

We conclude by recapping our key findings. First, large spot price spikes occasionally occur in ERCOT’s DAM and RTM for energy. Second, inadequate risk management of these price spikes can financially ruin a REP that mainly offers fixed price plans. Third, even if the REP employs an optimal portfolio of electricity forward contracts, it faces residual risk exposure that may be eliminated by buying an insurance when other means are infeasible (e.g., RTP and DR) or financially unattractive (e.g., full requirement contract and peak forward contract). Fifth, a competitively priced per MWh insurance premium found by a REP’s procurement auction does not substantially increase a REP’s fixed price offer. Finally, the voluntary transaction between a REP and an insurance seller is mutually beneficial. In summary, our proposed insurance helps remove the risk exposure that can bankrupt a small REP. Hence, it deserves consideration by REPs in Texas and competitive retailers elsewhere.

Author Contributions

Conceptualization, C.-K.W. and J.Z.; methodology, C.-K.W., A.T. and K.H.C.; software, K.H.C.; data curation, J.Z.; writing—original draft preparation, C.-K.W. and A.T.; writing—review and editing, C.-K.W., J.Z., A.T. and K.H.C. All authors have read and agreed to the published version of the manuscript.

Funding

This paper extends C.K. Woo’s research funded by Grant R3698 from the Education University of Hong Kong and Grant 04564 from the same university’s Faculty of Liberal Arts & Social Sciences. Without implications, all errors are ours.

Informed Consent Statement

Not applicable.

Data Availability Statement

The data used in this paper are publicly available from the sources cited in text.

Conflicts of Interest

The authors declare no conflict of interest.

References

  1. Stoft, S. Power System Economics: Designing Markets for Electricity; Wiley: New York, NY, USA, 2002. [Google Scholar]
  2. Zarnikau, J.; Woo, C.K.; Baldick, R. Did the introduction of a nodal market structure impact wholesale electricity prices in the Texas (ERCOT) market? J. Regul. Econ. 2014, 45, 194–208. [Google Scholar] [CrossRef]
  3. Zarnikau, J.; Woo, C.K.; Zhu, S.; Tsai, C.H. Market price behavior of wholesale electricity products: Texas. Energy Policy 2019, 125, 418–428. [Google Scholar] [CrossRef]
  4. Woo, C.K.; Horowitz, I.; Horii, B.; Karimov, R. The efficient frontier for spot and forward purchases: An application to electricity. J. Oper. Res. Soc. 2004, 55, 1130–1136. [Google Scholar] [CrossRef]
  5. Woo, C.K.; Karimov, R.; Horowitz, I. Managing electricity procurement cost and risk by a local distribution company. Energy Policy 2004, 32, 635–645. [Google Scholar] [CrossRef]
  6. Zarnikau, J.; Zhu, S.; Woo, C.K.; Tsai, C.H. Texas’s operating reserve demand curve’s generation investment incentive. Energy Policy 2020, 137, 111143. [Google Scholar] [CrossRef]
  7. Woo, C.K. What went wrong in California’s electricity market? Energy 2001, 26, 747–758. [Google Scholar] [CrossRef]
  8. Woo, C.K.; Lloyd, D.; Tishler, A. Electricity market reform failures: UK, Norway, Alberta and California. Energy Policy 2003, 31, 1103–1115. [Google Scholar] [CrossRef]
  9. Joskow, P.L. Lessons learned from electricity market liberalization. Energy J. 2008, 29, 9–42. [Google Scholar] [CrossRef]
  10. Sioshansi, F.P. Evolution of Global Electricity Markets: New Paradigms, New Challenges, New Approaches; Elsevier: San Diego, CA, USA, 2013. [Google Scholar]
  11. Deng, S.J.; Johnson, B.; Sogomonian, A. Exotic electricity options and valuation of electricity generation and transmission. Decis. Support Syst. 2001, 30, 383–392. [Google Scholar] [CrossRef] [Green Version]
  12. Eydeland, A.; Wolyniec, K. Energy and Power Risk Management: New Development in Modeling, Pricing and Hedging; John Wiley & Sons: Hoboken, NJ, USA, 2003. [Google Scholar]
  13. Billimori, F.; Poudineh, R. Market design for resource adequacy: A reliability insurance overlay on energy-only electricity markets. Util. Policy 2019, 60, 100935. [Google Scholar] [CrossRef]
  14. Fuentes, R.; Sengupta, A. Using insurance to manage reliability in the distributed electricity sector: Insights from an agent-based model. Energy Policy 2020, 139, 111251. [Google Scholar] [CrossRef] [Green Version]
  15. Niromandfam, A.; Choboghloo, S.P.; Yazdankhah, A.S.; Kazemzadeh, R. Electricity customers’ financial and reliability risk protection utilizing insurance mechanism. Sustain. Energy Grids Netw. 2020, 24, 100399. [Google Scholar] [CrossRef]
  16. Lai, S.; Qiu, J.; Tao, Y.; Liu, Y. Risk hedging strategies for electricity retailers using insurance and strangle weather derivatives. Int. J. Electr. Power Energy Syst. 2022, 134, 107372. [Google Scholar] [CrossRef]
  17. Deng, S.J.; Oren, S.S. Electricity derivatives and risk management. Energy 2006, 31, 940–953. [Google Scholar] [CrossRef]
  18. Woo, C.K.; Horowitz, I.; Olson, A.; Horii, B.; Baskette, C. Efficient frontiers for electricity procurement by an LDC with multiple purchase options. OMEGA 2006, 34, 70–80. [Google Scholar] [CrossRef] [Green Version]
  19. Kleindorfer, P.R.; Li, L. Multi-period VaR-constrained portfolio optimization with applications to the electric power sector. Energy J. 2005, 26, 1–26. [Google Scholar] [CrossRef] [Green Version]
  20. Iria, J.; Soares, F. Real-time provision of multiple electricity market products by an aggregator of prosumers. Appl. Energy 2019, 255, 113792. [Google Scholar] [CrossRef]
  21. Brown, D.P.; Tsai, C.H.; Woo, C.K.; Zarnikau, J.; Zhu, S. Residential electricity pricing in Texas’s competitive retail market. Energy Econ. 2020, 92, 104953. [Google Scholar] [CrossRef]
  22. Woo, C.K.; Horowitz, I.; Hoang, K. Cross hedging and forward-contract pricing of electricity. Energy Econ. 2001, 23, 1–15. [Google Scholar] [CrossRef]
  23. DeBenedictis, A.; Miller, D.; Moore, J.; Olson, A.; Woo, C.K. How big is the risk premium in an electricity forward price? Evidence from the Pacific Northwest. Electr. J. 2011, 24, 72–76. [Google Scholar] [CrossRef]
  24. Zarnikau, J.; Woo, C.K.; Gillett, C.; Ho, T.; Zhu, S.; Leung, E. Day-ahead forward premium in the Texas electricity market. J. Energy Mark. 2015, 8, 1–20. [Google Scholar] [CrossRef]
  25. Woo, C.K.; Horowitz, I.; Olson ADeBenedictis, A.; Miller, D.; Moore, J. Cross-hedging and forward-contract pricing of electricity in the Pacific Northwest. Manag. Decis. Econ. 2011, 32, 265–279. [Google Scholar] [CrossRef]
  26. Woo, C.K.; Horowitz, I.; Zarnikau, J.; Moore, J.; Schneiderman, B.; Ho, T.; Leung, E. What moves the ex post variable profit of natural-gas-fired generation in California? Energy J. 2016, 37, 29–57. [Google Scholar]
  27. Lloyd, D.; Woo, C.K.; Borden, M.; Warrington, R.; Baskette, C. Competitive procurement and internet-based auction: Electricity capacity option. Electr. J. 2004, 17, 74–78. [Google Scholar] [CrossRef]
  28. Woo, C.K.; Sreedharan, P.; Hargreaves, J.; Kahrl, F.; Wang, J.; Horowitz, I. A review of electricity product differentiation. Appl. Energy 2014, 114, 262–272. [Google Scholar] [CrossRef]
  29. Brown, D.P.; Zarnikau, J.; Adib, P.; Tsai, C.H.; Woo, C.K. Rising market concentration in Texas’s retail electricity market. Electr. J. 2020, 33, 106848. [Google Scholar] [CrossRef]
  30. Moore, J.; Woo, C.K.; Horii, B.; Price, S.; Olson, A. Estimating the option value of a non-firm electricity tariff. Energy 2010, 35, 1609–1614. [Google Scholar] [CrossRef]
  31. Brown, D.B.; Tsai, C.H.; Zarnikau, J. Do gentailers charge higher residential electricity prices in the Texas retail electricity market? Electr. J. 2022, 35, 107109. [Google Scholar] [CrossRef]
  32. Woo, C.K.; Lloyd, D.; Borden, M.; Warrington, R.; Baskette, C. A robust internet-based auction to procure electricity forwards. Energy 2004, 29, 1–11. [Google Scholar] [CrossRef]
  33. Woo, C.K.; Borden, M.; Warrington, R.; Cheng, W. Avoiding overpriced risk management: Exploring the cyber auction alternative. Public Util. Fortn. 2003, 141, 30–37. [Google Scholar]
  34. Klemperer, P. What really matters in auction design. J. Econ. Perspect. 2002, 16, 169–189. [Google Scholar] [CrossRef]
  35. Johnson, N.L.; Kotz, S.; Balakrishnan, N. Continuous Univariate Distributions; Wiley: New York, NY, USA, 1994. [Google Scholar]
Figure 1. Scatter plot of hourly DAM energy price vs. hourly RTM energy price for the period of 01 January 2011 to 31 December 2017. The OLS regression based on the efficient market hypothesis is RTM price = a + b × DAM price + error, where a ≈ 0 and b ≈ 1 are the regression’s coefficient estimates. Updating the figure with more recent data does not change its key message: DAM and RTM prices move in tandem and are highly volatile with infrequent but large spikes.
Energies 16 00393 g001
Figure 2. A hypothetical REP’s load duration curve, procurement of electricity forward contracts, and residually unhedged peak loads.
Energies 16 00393 g002
Figure 3. ERCOT’s physical reserve capability vs. ORDC price adder [6].
Energies 16 00393 g003
Table 1. Percentage changes in G by per MWh insurance premium and insured amount γ.
Per MWh Insuranceγ = 10%γ = 20%γ = 30%
SL that results in ΔGL1.03%2.05%3.08%
SU that results ΔGU51.0%102.0%153.0%
Disclaimer/Publisher’s Note: The statements, opinions and data contained in all publications are solely those of the individual author(s) and contributor(s) and not of MDPI and/or the editor(s). MDPI and/or the editor(s) disclaim responsibility for any injury to people or property resulting from any ideas, methods, instructions or products referred to in the content.

