Article

Life Cycle Assessment of Hydrogen Production from Coal Gasification as an Alternative Transport Fuel

by
Dorota Burchart
1,
Magdalena Gazda-Grzywacz
2,*,
Przemysław Grzywacz
2,
Piotr Burmistrz
2 and
Katarzyna Zarębska
2
1
Faculty of Transport and Aviation Engineering, Silesian University of Technology, ul. Krasińskiego 8, 40-019 Katowice, Poland
2
Faculty of Energy and Fuels, AGH University of Science and Technology, al. Mickiewicza 30, 30-059 Krakow, Poland
*
Author to whom correspondence should be addressed.
Energies 2023, 16(1), 383; https://doi.org/10.3390/en16010383
Submission received: 18 October 2022 / Revised: 13 December 2022 / Accepted: 21 December 2022 / Published: 29 December 2022
(This article belongs to the Special Issue Recent Advances in Hydrogen Production and Storage)

Abstract

:
The gasification of Polish coal to produce hydrogen could help to make the country independent of oil and gas imports and assist in the rational energy transition from gray to green hydrogen. When taking strategic economic or legislative decisions, one should be guided not only by the level of CO2 emissions from the production process, but also by other environmental impact factors obtained from comprehensive environmental analyses. This paper presents an analysis of the life cycle of hydrogen by coal gasification and its application in a vehicle powered by FCEV cells. All the main stages of hydrogen fuel production by Shell technology, as well as hydrogen compression and transport to the distribution point, are included in the analyses. In total, two fuel production scenarios were considered: with and without sequestration of the carbon dioxide captured in the process. Life cycle analysis was performed according to the procedures and assumptions proposed in the FC-Hy Guide, Guidance Document for performing LCAs on Fuel Cells and H₂ Technologies by the CML baseline method. By applying the CO2 sequestration operation, the GHG emissions rate for the assumed functional unit can be reduced by approximately 44% from 34.8 kg CO2-eq to 19.5 kg CO2-eq, but this involves a concomitant increase in the acidification rate from 3.64·10−2 kg SO2-eq to 3.78·10−2 kg SO2-eq, in the eutrophication index from 5.18·10−2 kg PO3−4-eq to 5.57·10−2 kg PO3−4-eq and in the abiotic depletion index from 405 MJ to 414 MJ and from 1.54·10−5 kg Sbeq to 1.61·10−5 kg Sbeq.

1. Introduction

In 2019, in the EU, transport accounted for almost 30% of total GHG emissions, 72% of which came from road transport [1]. The European Commission has implemented several mechanisms to reduce global GHG emissions by 55% by 2030, with the aim of becoming climate neutral and achieving net zero GHG emissions by 2050 [2,3]. The EU has established a plan to transform European transport for a sustainable future, with the aim of reducing emissions from this sector by 90% by 2050. Directive 2014/94/EU, adopted in 2014 by the EU and the Council, aimed to support the use of alternative fuels in transport to reduce GHG emissions and to reduce the EU’s dependence on oil imports. In Poland, in 2018, the then Ministry of Energy, referring to Directive 2014/94/EU, published the document Law on Electromobility and Alternative Fuels [4]. Currently in Polish transport, as a substitute for conventional fuels, mainly Liquefied Petroleum Gas, natural gas in the form of CNG and LNG and electricity are present. However, according to [4], synthetic and paraffinic fuels, biofuels, and hydrogen are also considered as alternative fuels.
The interest in hydrogen as an energy carrier and the efforts to replace fossil fuels is due to its favorable characteristics: reacting with oxygen releases a large amount of energy (−143.1 MJ/kg), and the only reaction product is water [5]. Currently, hydrogen is mainly produced from fossil fuels [6,7], with about three-quarters of the world’s production coming from natural gas. The second most important raw material for hydrogen production is coal. Approximately 107 Mt of coal is used per year to produce hydrogen, which represents about 2% of its world’s consumption [8]. The most widely used technologies for producing hydrogen include: the conversion of natural gas and light hydrocarbons [9,10], water electrolysis [11], biomass gasification [12] and coal gasification [13] where coal gasification systems can be integrated to produce both electricity and chemical products, mainly liquid motor fuels, methanol or just hydrogen [14]. According to [15] and a comparative analysis, biomass hydrogen production provides approximately the same efficiency as water-based hydrogen production technologies, but has the advantages of lower operating costs and higher energy efficiency. Sustainable energy production using renewable feedstocks to produce hydrogen, as opposed to conventional fossil fuel-based feedstocks, will achieve the goal of a green hydrogen economy. When one looks at the coal utilization market, China is the biggest leader in this issue, as well as in the chemical feedstock processing technologies themselves. A high-efficiency industrial pulverized coal boiler is currently being investigated, with thermal efficiencies above 90% and emission levels close to the standard of a natural gas boiler [16]. Coal conversion technologies such as coal gasification, coal-to-liquid (CTL) and coal-to-oil transition (CTO) are being rapidly developed in China. Direct coal liquefaction (DCL) technology is being developed with the capacity to convert one million tons of coal into oil [17]. Carbon Capture Utilization and Sequestration (CCUS) technologies are in the start-up phase. Several years of industrial research has been conducted on aspects such as CO2 capture and use, oxygen-enriched combustion, geological sequestration of high-purity CO2, enhanced oil recovery (EOR), and enhanced coal bed methane extraction [18].
Hydrogen for transport is seen as the low-carbon fuel of the future. Hydrogen FCEVs will credibly minimize local air pollution since, similarly to BEVs, they have no exhaust emissions. BEVs are still recognized as zero-emission vehicles by European legislation, although their indirect emissions, that is, vehicle and battery production or disposal and recycling, can be significant [19]. An FCEV, similar to a BEV, is powered by an electric motor, but the difference lies in the way energy is stored and extracted [20,21]. In FCEVs, batteries are replaced by hydrogen tanks, which are converted to electricity and steam through a chemical reaction in the fuel cells. In theory, this is the ideal solution to power a car, but the potential of hydrogen technology is hampered by the high production costs of FCEVs [22] and the poor infrastructure [23]. There are currently around 34,400 FCEVs in circulation worldwide, mainly in Korea, the USA, and Japan [24]. In Europe, FCEVs can be found mainly in Germany and France [8]. The number of hydrogen refueling stations is small. At the beginning of 2020, hydrogen refueling stations, for road, public, and private transport, represented 432 points on a global scale [25], including 53 registered in Poland. Poland, on a European scale, produces significant amounts of hydrogen—1 million Mg per year of H2 (which is 10–15% of European production), but this is used only for chemical synthesis [26]. The number of electric FCEVs should and can grow steadily, but the demand for these vehicles depends on a number of factors, including the purchase subsidy scheme for FCEVs, the provision of charging infrastructure, and the production and availability of hydrogen fuel. Poland, Germany and the Czech Republic, in the so-called European coal triangle, consume the most coal in the whole EU. Currently, the activities of Polish institutions do not aim at resigning and abandoning coal, but rather at a more rational use of coal, taking into account the entire potential of perspective and alternative products contained in it. Between 2010 and 2015, a scientific and industrial consortium with a budget of 20 million EUR was active in the country, addressing the topic of developing coal gasification technology for highly efficient fuel and energy production [27]. In Poland, for many years, in accordance with global trends, advanced research on the production and storage of hydrogen has been and is being conducted.
During the design phase of technological processes such as gasification, in addition to technical and economic considerations, environmental aspects must also be taken into account [28,29]. LCA is a technique that illustrates the complex interactions that occur between a product or technology and the environment, where the main categories of environmental impact consider the effects on human health, the use of natural resources, and the impact on ecosystem quality [30,31]. LCA is recognized as one of the best environmental management tools for comparing the impacts of different alternative products or process systems [32,33].
The results of LCA studies on the environmental impacts of UCG show that groundwater is mainly contaminated by phenols and other aromatic compounds, heavy metals, ammonia and cyanides [34,35]. Similar results were obtained for UCG simulations in an ex situ reactor [36]. Hyder et al. [37] showed that GHG emissions from UCG are about 28% lower than those from conventional power plants. Burchart et al. [38] showed that, during energy production through UCG, direct CO2 emissions from gas combustion and indirect emissions from domestic electricity consumption have the greatest impact on the damage categories. Śliwińska et al. [39] evaluated the LCA of methanol and electricity production in the vicinity of a co-production system based on above-ground coal gasification technology. The analysis was for a polygeneration technology where two products are produced—methanol and electricity—so an allocation procedure was used. Cetinkaya [40] presented a comprehensive LCA assessment for coal gasification and four other hydrogen production methods, i.e., natural gas steam reforming, wind-based water electrolysis, solar electrolysis and thermochemical water splitting of the Cu-Cl cycle. Natural gas steam reforming, coal gasification and thermochemical water splitting of the Cu-Cl cycle were shown to be preferred over renewable methods in terms of hydrogen production efficiency. [41] analyzed the LCA for the power generation technology based on above-ground coal gasification in terms of greenhouse gas emissions, mainly CO2. A total of two approaches to LCA calculation were compared for the construction and operation of integrated gasification combined cycle power plants—IGCC operating with coal gasification. IGCC with 90% CO2 capture was shown to have lower life cycle GHG emissions than combined cycle natural gas, NGCC and photovoltaic systems. [42] analyzed energy consumption and GHG emissions between underground hydrogen-oriented coal gasification, UCG-H2 and conventional surface coal gasification (SCG) based on hydrogen production (SCG-H2). Energy consumption in the hydrogen industry has been shown to decrease by 38.8% when hydrogen production is replaced by UCG with CCS to fully meet the demand of 21 Mt in 2030. In [43], the authors simulated a coal-to-hydrogen conversion process based on gasification of the agglomerating fluidized bed (AFB). A life cycle, primary fossil energy consumption (PFEC) and GHG emissions analysis was conducted to provide theoretical guidance for the development of a coal-to-hydrogen conversion process. The results indicate that the PFEC of the scenario with CCS is 2.32% higher than the corresponding value of the scenario without CCS, while the GHG emissions of the scenario with CCS are 81.72% lower than the corresponding value of the scenario without CCS.
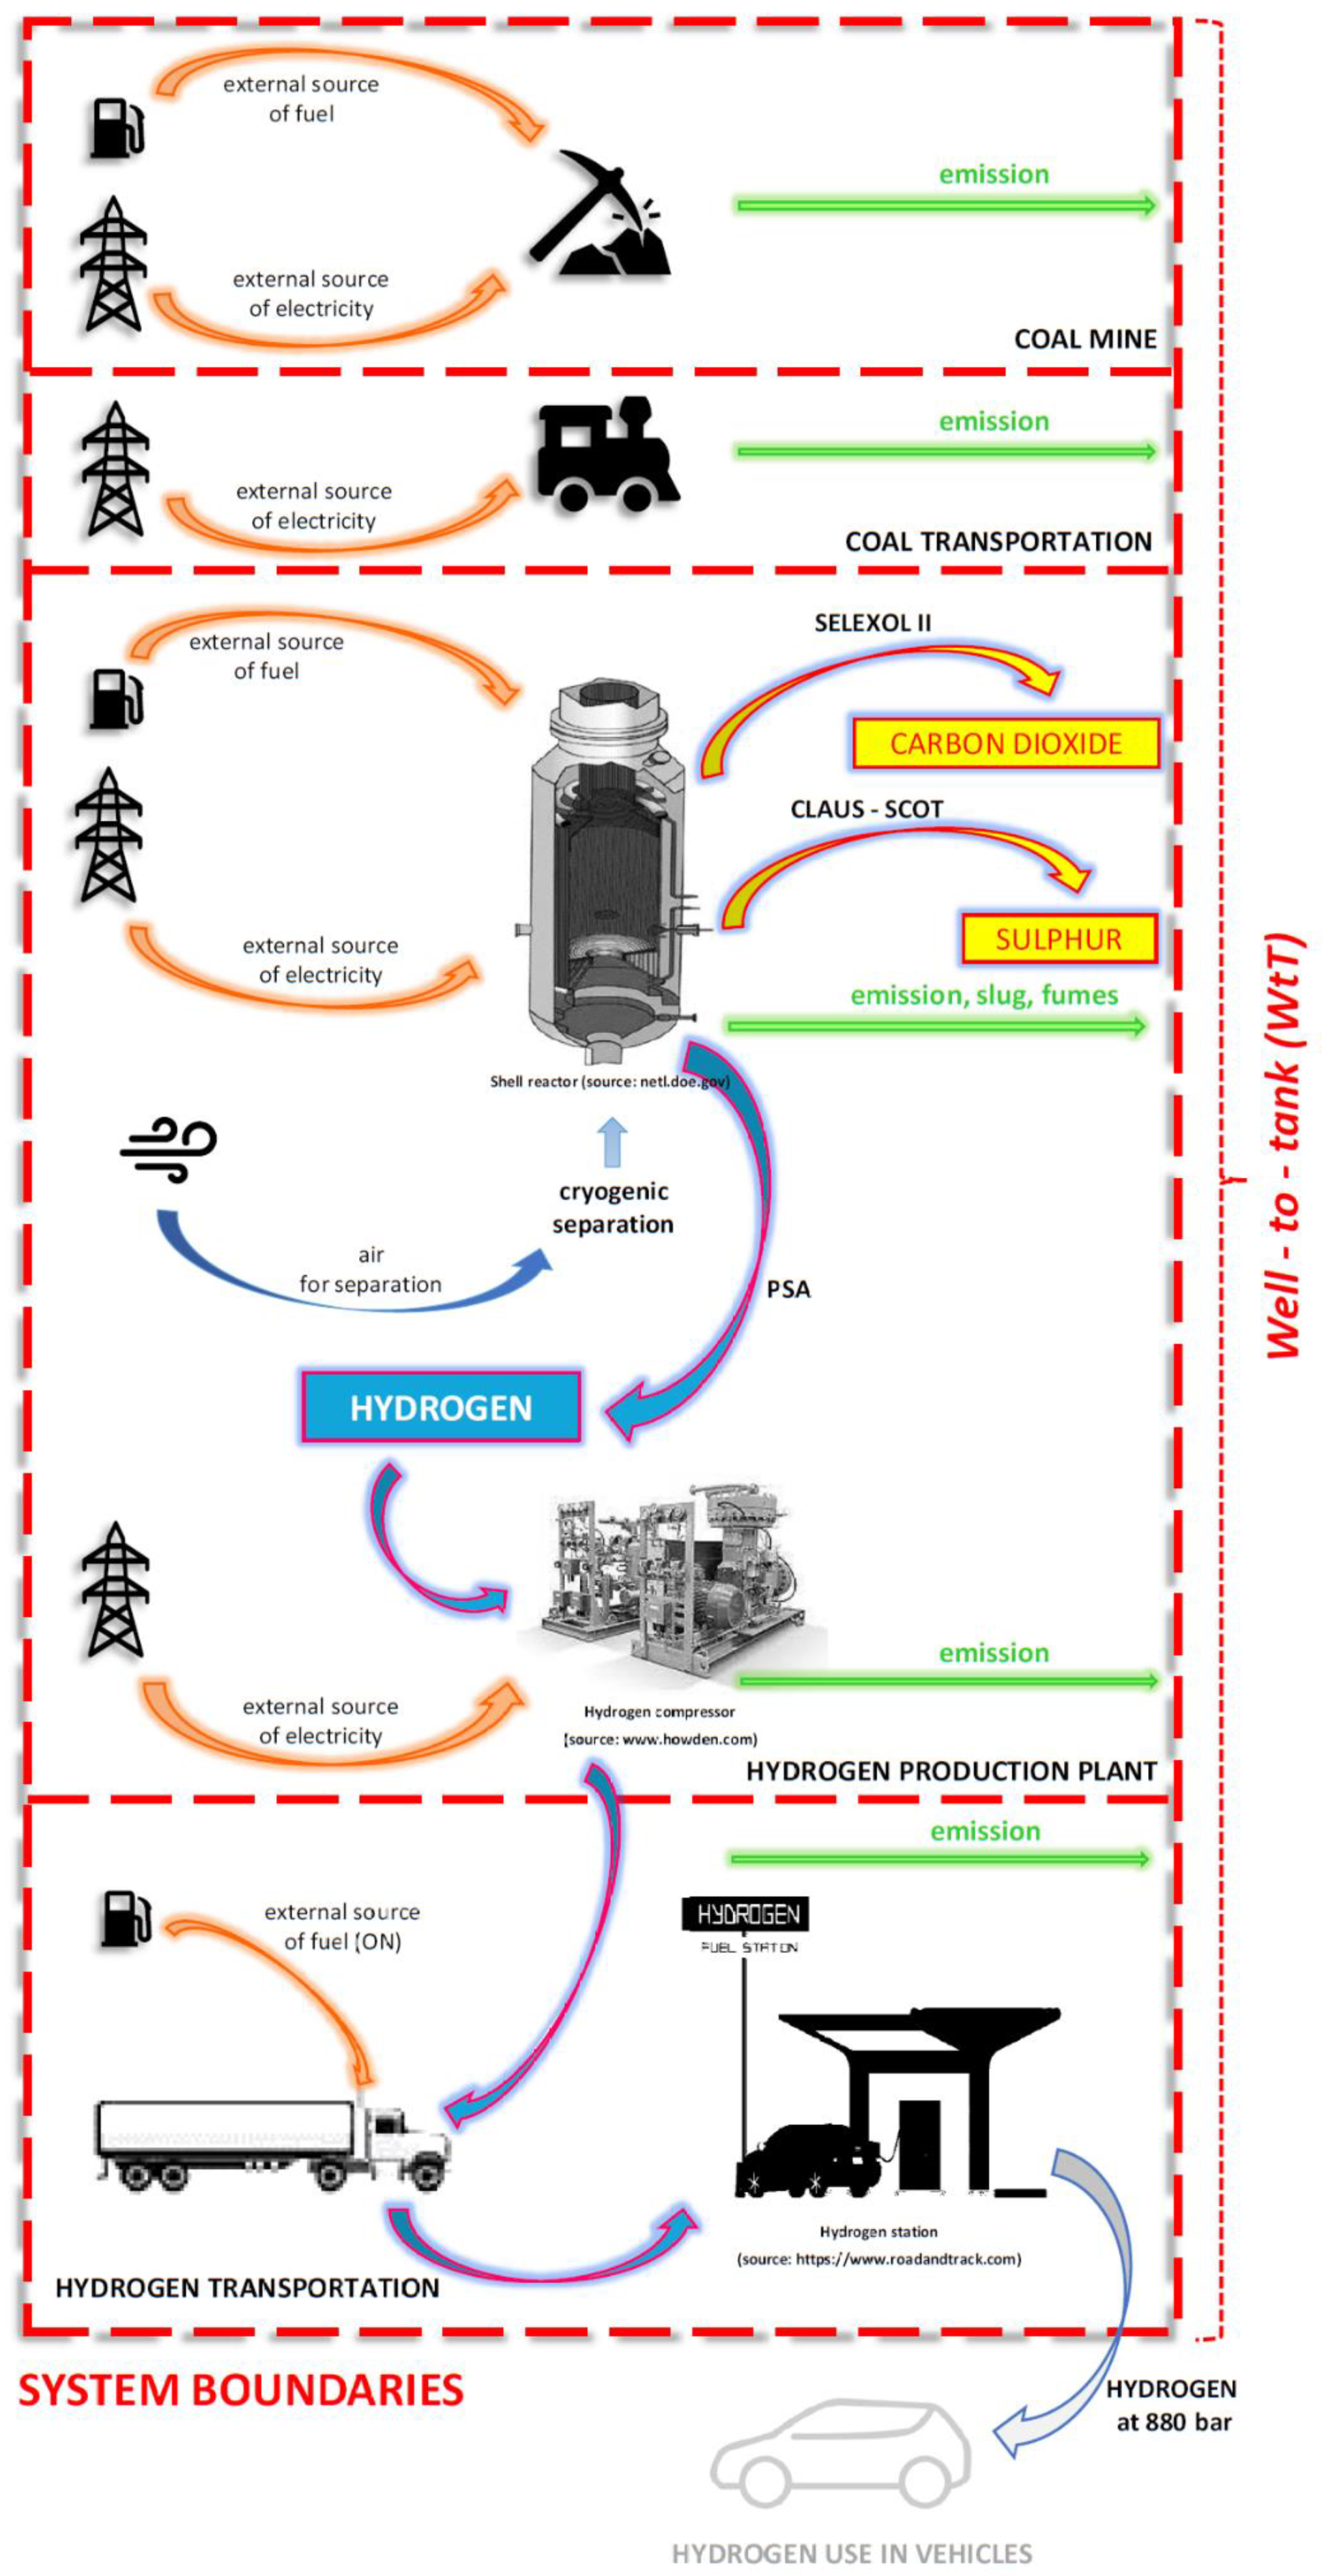
In the literature on LCAs of hydrogen production, little work is focused on coal gasification, in contrast to the numerous comprehensive analyses of other processes for producing this fuel. This article presents a life cycle analysis of hydrogen produced by coal gasification with Shell technology. The LCA was performed within the system boundaries under the weel-to-tank assumption, taking into account the comprehensiveness of the various categories of environmental impacts recommended by the Guidance Document for the performance of LCAs in fuel cells and H₂ Technologies and the CML baseline method. The originality of the work is mainly due to the use of process assumptions, real data and balance streams (energy and mass) derived from Shell’s own studies and process modelling for Shell’s hydrogen-focused technology in the LCA. This type of study has not been published to date. Currently, the scientific literature on the topic focuses mainly on databases. This thesis fills a gap in LCA studies of hydrogen production technology by coal gasification for fossil systems. The work presented here is a critical environmental LCA of the production of gray hydrogen as a fuel for FCEVs, which is extremely important, especially for the countries of the so-called European Carbon Triangle. Poland, the Czech Republic and Germany need gray hydrogen from coal for a fair and sustainable energy transition to green hydrogen in order to become independent of oil and gas imports. The results of the comprehensive LCA presented in this paper allow for a substantive discussion of the topic of the impact of coal gasification technology aimed at hydrogen production, which so far has mainly been considered through the prism of green-use gases. This paper presents the results for the following LCIA impact categories: global warming potential, GHG; acidification, AP; abiotic resource depletion, ADP in [MJ] and [kg]; eutrophication potential, EP; and optional indicators: stratospheric ozone depletion, ODP; human toxicity potential, HTP; inland water toxicity potential, FAETP; aquatic toxicity potential, MAETP; soil toxicity potential, TETP and photo-oxidant formation, POCP.
The purpose of this paper is a comprehensive LCA of hydrogen production as an alternative fuel by coal gasification. The analysis includes hydrogen production through Shell coal gasification technology and its compression and transportation to the distribution point. The analysis was performed for two variants of the hydrogen production—with and without the integration of the system with a CO2 capture and compression. The choice of the Shell technology as an object of the LCA study was guided by earlier results of the authors [44], who, in a study concerning the carbon footprint of lignite and hard coal gasification by Shell and Texaco technologies, found that Shell technology is the most beneficial in terms of GHG emissions and hydrogen yield. Furthermore, none of the results of the LCA cited in the literature, in contrast to this publication, used the guidelines contained in the FC-Hy Guide.

2. Data and Methods

2.1. Goal and Scope of the Study: System Boundaries and Functional Unit

In this work, the LCA of hydrogen production was carried out in accordance with the procedures and assumptions proposed in the FC-Hy Guide, the Guidance Document for performing LCA on Fuel Cells and H₂ Technologies [45] based on the guidelines of ISO: 14040 [46] for Life Cycle Assessment (principles and structure) and ISO 14044 [46] for Life Cycle Assessment (requirements and guidelines) with the use of SimaPro 9.2.0. software with the Ecoinvent v.3 database. Gasification and hydrogen production processes are carried out on a single production line, and production is oriented towards maximum hydrogen yield. For comparative purposes, two scenarios of hydrogen production are considered: (i) with sequestration and (ii) without sequestration of captured CO2. The main elements of the LCA were the identification and quantification of possible environmental burdens related to the consumption of raw materials, the energy consumed and the emissions released into the environment. The results of the study identify the impacts of the components of the hydrogen production technology through coal gasification in 11 different impact categories recommended in the FC-Hy Guide. CML is an impact assessment method that restricts quantitative modelling to the early stages of the causal chain in order to reduce uncertainty. Results are grouped into middle categories according to common mechanisms (e.g., climate change) or commonly accepted groupings (e.g., ecotoxicity). The CML was developed by the Institute of Environmental Sciences, Leiden University, the Netherlands. The standardization factors for the CML are calculated on the basis of the total emissions of the substances and the characterization factors for each substance individually and are therefore consistent with substance level updates. In general, according to [45], the following criteria have been defined for the selection of impact assessment methods: scientific soundness, which also takes into account the level of uncertainty; the development that has occurred over time; the applicability of the method in LCA practice; and the objectives of European environmental policy. In order to guarantee comparability between LCA studies on FC technologies, the CML midpoint method (the most recent development) was chosen to be used for the following pragmatic reasons, free of any superiority: it adequately meets the criteria described above; it is implemented in most (if not all) available LCA programs; and it has been widely used for the last 20 years. According to the FC-Hy Guide, the functional unit should be the MJ of energy contained in hydrogen. However, as shown by technological and settlement solutions at hydrogen refueling stations [47,48] this fuel is sold in mass units. Therefore, for the present analysis, the FU is 1 kg of hydrogen at 88 MPa, which is the pressure at the filling station. When comparing that value with data from the manufacturers of Toyota Mirai [49] and Hyundai Nexo [50], it can be seen that the assumed FU corresponds approximately to a range of 100 km for the FCEVs quoted. The specifications of these car models are presented in Table 1.
In Figure 1, the boundaries of the LCA system are presented, including the main steps, processes and streams considered in this analysis. The boundary takes into account the environmental loads resulting from the well-to-tank analysis [51,52].

2.2. Description of the System Examined: Life Cycle Inventory

The life cycle system boundary covers the processes occurring during hard coal extraction, coal transport to the gasification installation, the main technological processes of gasification, together with auxiliary unit processes, as well as sequestration operations, separated during the process of carbon dioxide and hydrogen compression and transport operations. The characteristics of the raw material subjected to gasification are presented in Table 2. It was assumed that the gasification plant is located 100 km from the mine and that the coal is transported to it by rail. Hydrogen is assumed to be transported by truck in cylinders at a pressure of 200 bar over a distance of 300 km to a refueling station and back to the production plant. On the way to the destination, the truck is fully loaded, while it returns with an empty tank. The vehicle considered is a 40 t truck that meets the EURO 6 emissions standard [53].
The following were not considered in the analysis: construction of gasification plants, and construction and operation of hydrogen fueling stations and infrastructure. In Figure 2, the mass balance of the main streams of H2 production processes in Shell technology is presented. The process diagram of the Shell coal gasification and hydrogen production system is shown in Figure 3.
For calculations, a configuration of the synthesis gas generation system was adopted based on technological solutions available on a commercial scale: oxygen production system, gasification, gas enrichment in hydrogen, desulfurization, CO2 separation system and H2 separation system (PSA). Calculations were performed using a ChemCAD v.6.0.2 simulator for the steady-state technological processes shown in Figure 4. The analysis also assumed the internal production of electricity from the residual gas with 40% efficiency. The hydrogen pressure at the PSA plant outlet is approximately 0.3 MPa and increases to approximately 20 MPa for transport and then to 88 MPa at the passenger car filling station. This corresponds to an energy consumption of 3.1 kWh/kg of H2, consisting of an energy consumption of 0.7 kWh/kg in the first compression stage and an energy consumption of 2.4 kWh/kg in the second compression stage [54]. Furthermore, the pre-cooling energy required to cool hydrogen from 30 °C to −20 °C when refueling at 70 MPa is 0.18 kWh/kg H2 [55,56,57].
For the basic gasification process, the amount of electricity that must be purchased from outside to cover the plant’s own needs was taken into account. Implementing the hydrogen production process integrated with coal gasification requires CO2 separation. This results in a stream of this gas with a mass concentration of more than 99% as a by-product, which may be a commercial product or subject to storage. There are two options discussed in the publication: (i) production of hydrogen non-seq. and (ii) seq., with CO2 removal, transport and storage. For sequestration, the sequestered CO2 must be compressed and then transported and injected into the target geological storage site. It was assumed that the gas is transported in the liquid phase and that the pressure at the pipeline inlet is 12 MPa, allowing transport of the medium over a distance of 120–150 km and injection into geological structures without additional compression.
The consumption of raw coal of 140 Mg/h was assumed for the calculations (Table 3, Figure 2). The assumed capacities (in fuel) of the gasification system correspond to the commercial units currently offered [58,59]. The gasification process was assumed to be carried out at a pressure of 4.2 MPa and a temperature of 1400 °C. The degree of conversion of coal is max. 98% [60]. The efficiency of sulfur and CO2 removal in the desulfurization and dioxide removal plant (SELEXOL II stage technology) is, respectively, 99.7 and 95% [60,61]. The hydrogen separation efficiency of PSA technology is 86% [62,63]. A summary of the balance streams regarding the configuration (Figure 3) of the hydrogen production system using Shell technology is presented in Table 3. In Figure 3, where a hydrogen technology process diagram is presented, two specific syngas enrichment methods, SELEXOL II and CLAUS-SCOT, can be distinguished. SelexolTM is a mixture of polyethylene glycol dimethyl ethers (DEPG) and is used for the selective removal of H2S/COS and the bulk removal of CO2 from syngas streams [64,65]. The designation Selexol II indicates a two-stage process. Selective removal of H2S with deep CO2 removal usually requires a two-step process with two absorption and regeneration columns. H2S is selectively removed in the first column by a lean solvent that has been thoroughly removed with steam, while CO2 is removed in the second absorption column [66]. The Standard Claus–SCOT process, allows the recovery of solid sulfur, which can be sold. Additionally, the process allows the production of steam through the oxidation of H2S to SO2. The SCOT process essentially follows three steps: heating and reduction of all sulfur compounds to H2S, cooling and quenching, and absorption, removal and recycling of H2S [67]. The technology is based on the catalytic conversion of sulfur compounds, other than hydrogen sulfide, contained in the Claus waste gas to hydrogen sulfide, which is then selectively absorbed in an alkanolamine solution with only partial absorption of carbon dioxide. The acid gas is removed from the amine solution and returned to the Claus unit.
In Table 4, a summary of the configuration data of the Shell gasification plant for hydrogen production for this study is presented. In Table 5, the values of the hydrogen yield indices and the chemical enthalpy conversion efficiency are summarized.
In Table 6, input and output data are presented per kg of hydrogen. In the input and output data of materials, energy and emissions of gasification technology, the following steps are included: coal mining; transportation of raw material to the gasification plant; coal preparation; synthesis gas production; gas cooling (scrubber); water WGS process [68]; SELEXOL process [69]; hydrogen separation by PSA [70]; Claus process [71]; and, optionally, a carbon dioxide sequestration operation. Data on coal mining, i.e., electricity and heat consumption and resulting emissions, were taken from the Ecoinvent database.

2.3. Life Cycle Impact Assessment (LCIA) Method

The CML method [72], recommended by the FC-Hy Guide, is one of the methods used in the impact assessment phase to identify the environmental links of all inputs and outputs included in the LCA model and to estimate the magnitude of environmental and human health impacts throughout the life cycle of the technology. It is a midpoint method, which provides, according to FC-Hy, scientific soundness and low uncertainty and is consistent with the goals of European environmental policy. This method is intended to ensure the comparability of LCA studies at the technology level. In the CML baseline method, the following recommended indicators were used: global warming (GHG) [73]; acidification potential (AP) [74]; abiotic depletion potential in MJ and kg Sb eq (ADP) [75]; eutrophication potential (EP) [76], as well as the following optional indicators: Ozone Layer Depletion (ODP) [77]; Human Toxicity Potential (HTP) [78]; Freshwater Aquatic EcoToxicity Potential (FAETP) [79]; Marine Aquatic EcoToxicity Potentia (MAETP) [80]; Terrestial EcoToxicity Potential (TETP) [81] and Photochemical Oxidation Potential (POCP) [82].

3. Results and Discussion

The results of the LCA of hydrogen production from coal gasification and its application to FCEVs in terms of FU are shown in Figure 4, Figure 5 and Figure 6 and Table 7. 
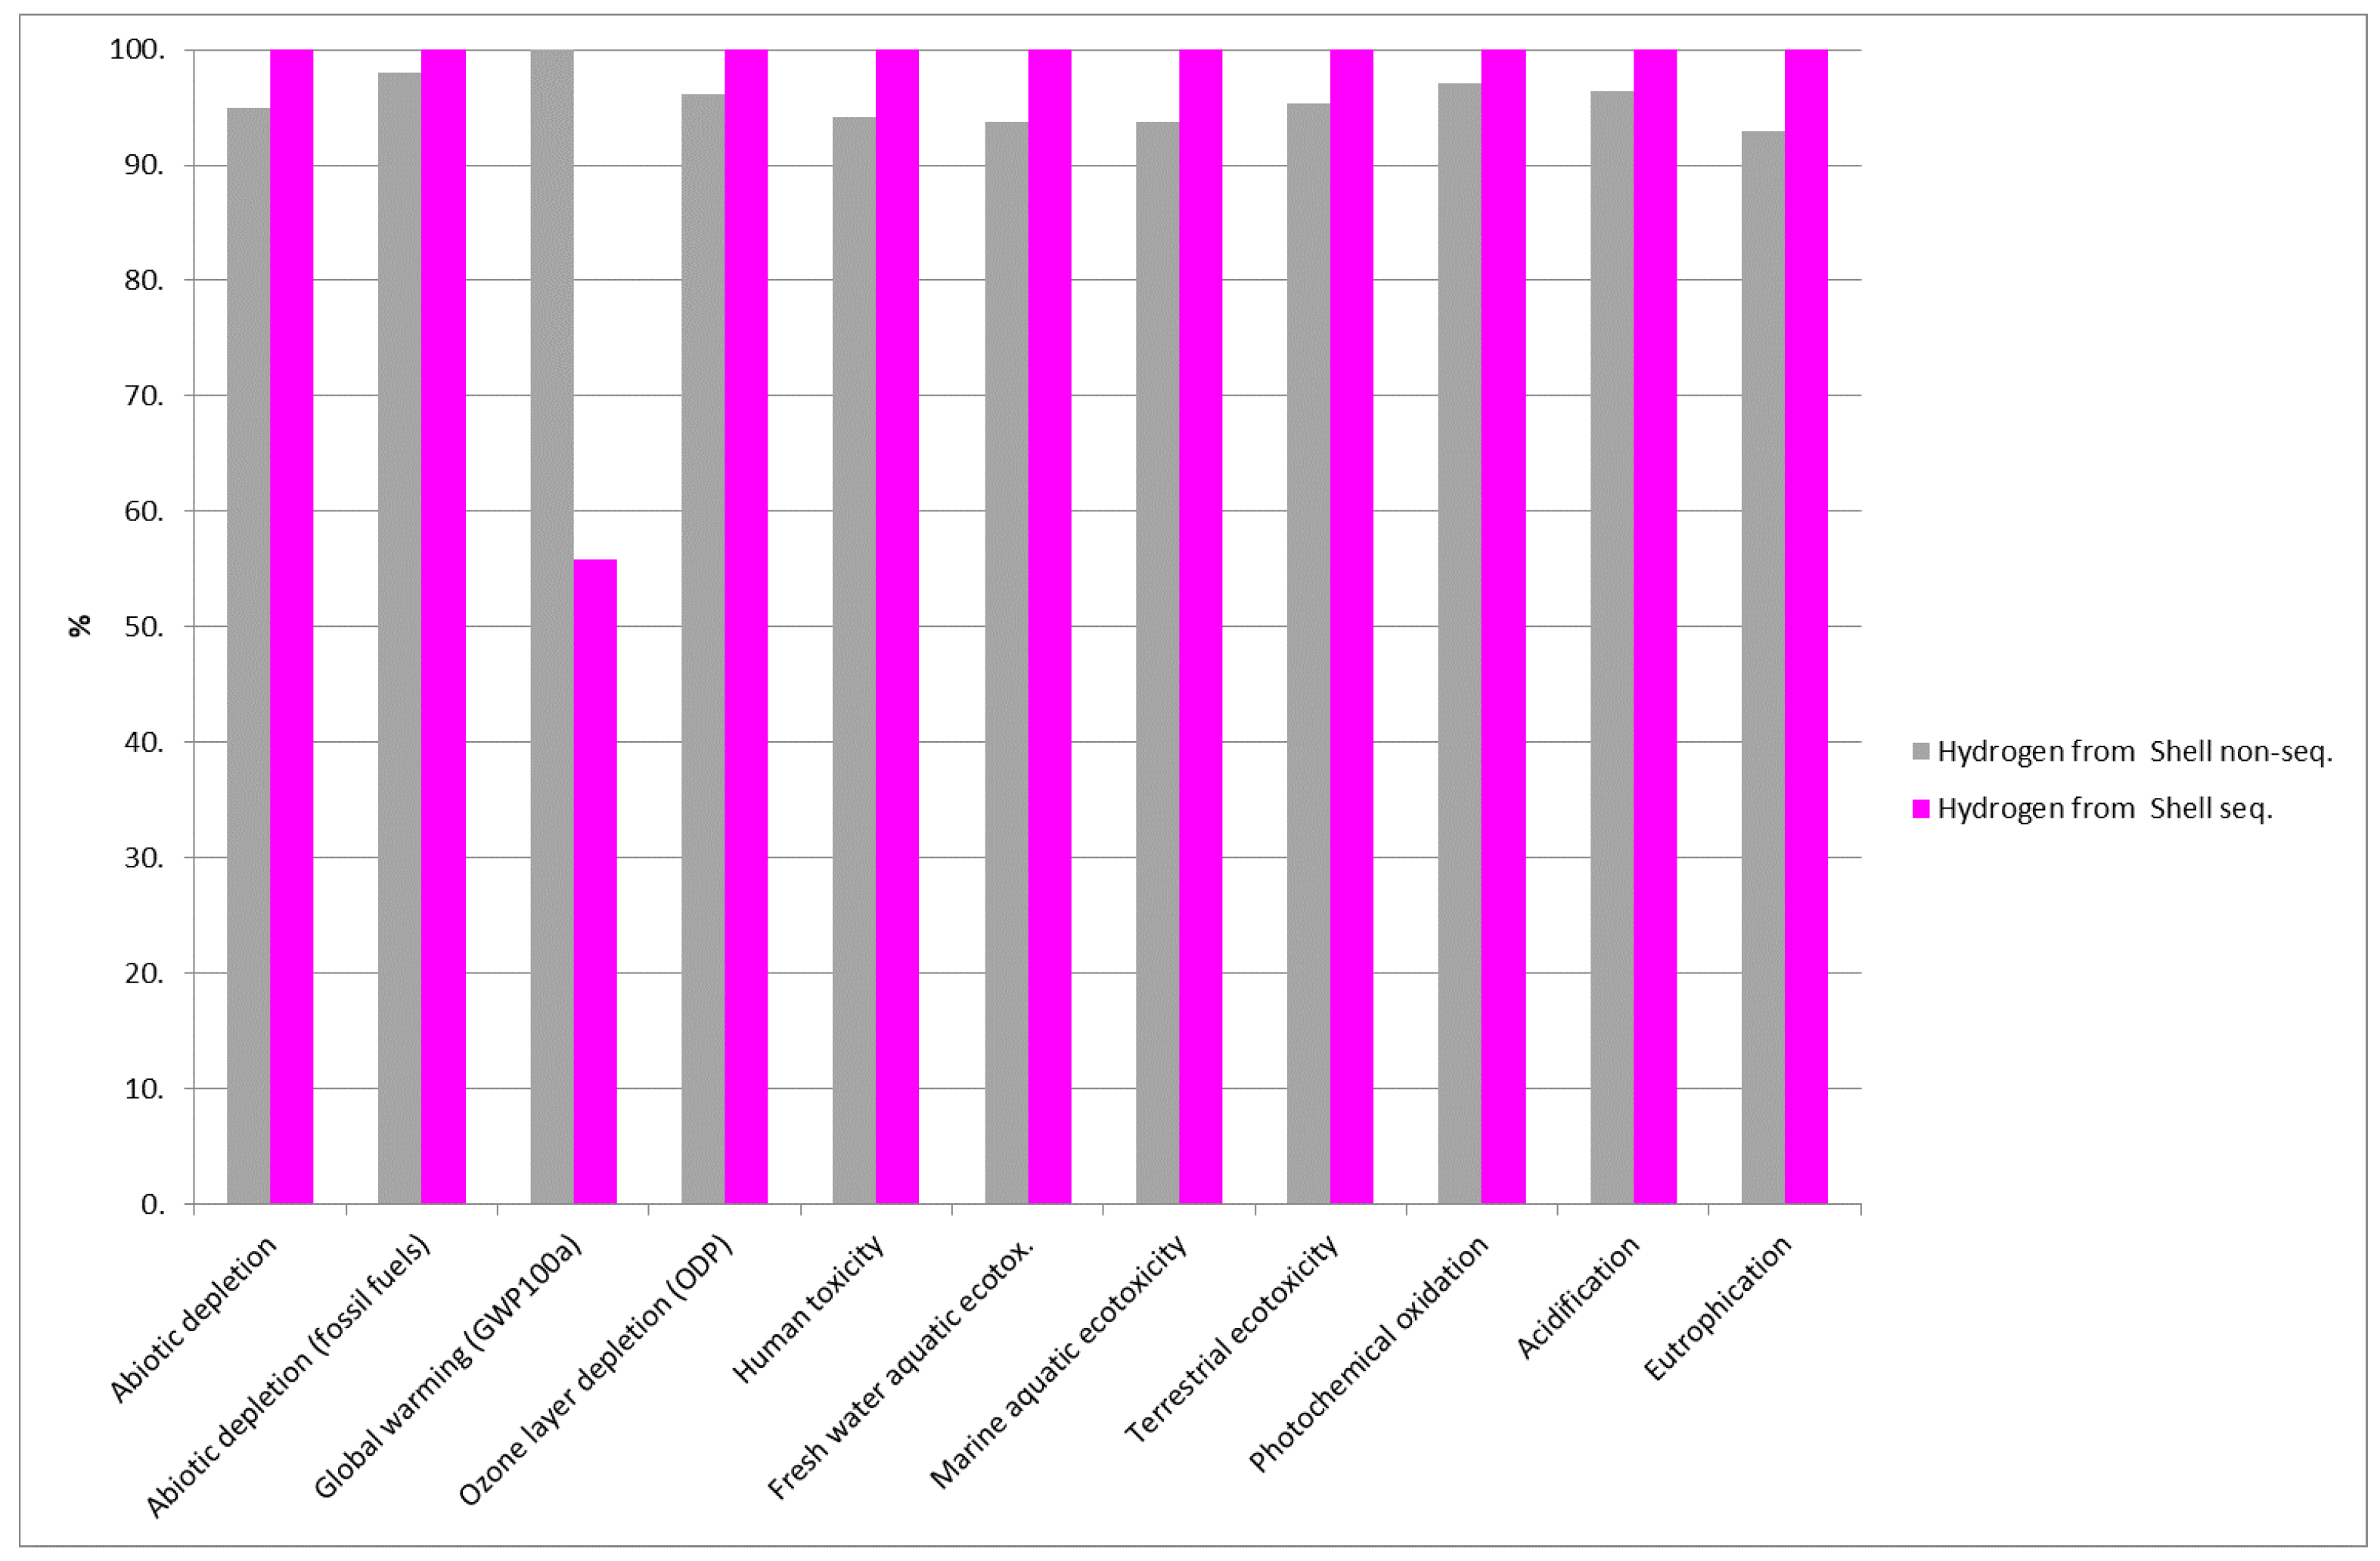
Figure 4 compares the effect of using H2 seq./non-seq. on the relative change in environmental indicators captured by the CML method. According to the FC-Hy Guide for Fuel Cells and H₂ Technologies LCA guide, it should be mandatory to use 4 of the 11 midpoint impact categories when conducting the LCA, viz., GHG, AP, ADP and EP. The additional impacts used in this study are optional. The absolute values of the indicators presented are collected in Table 7. GHG is a generally and globally accepted impact category to describe climate change. This category shows a significant advantage of H2 seq. production technology, which reduces GHG emissions by about 44% from 34.8 kgCO2(eq)/FU to only 19.5 kgCO2(eq)/FU. Figure 5 shows the structure of the GHG categories for H2 seq. technology, showing the four main dominant causes of emissions: direct emissions at the gasification installation (residual gases); indirect emissions resulting from the consumption of electric energy during extraction and enrichment operations and those at the gasification installation; and the cryogenic air separation operation necessary to obtain oxygen for gasifying the raw material. 
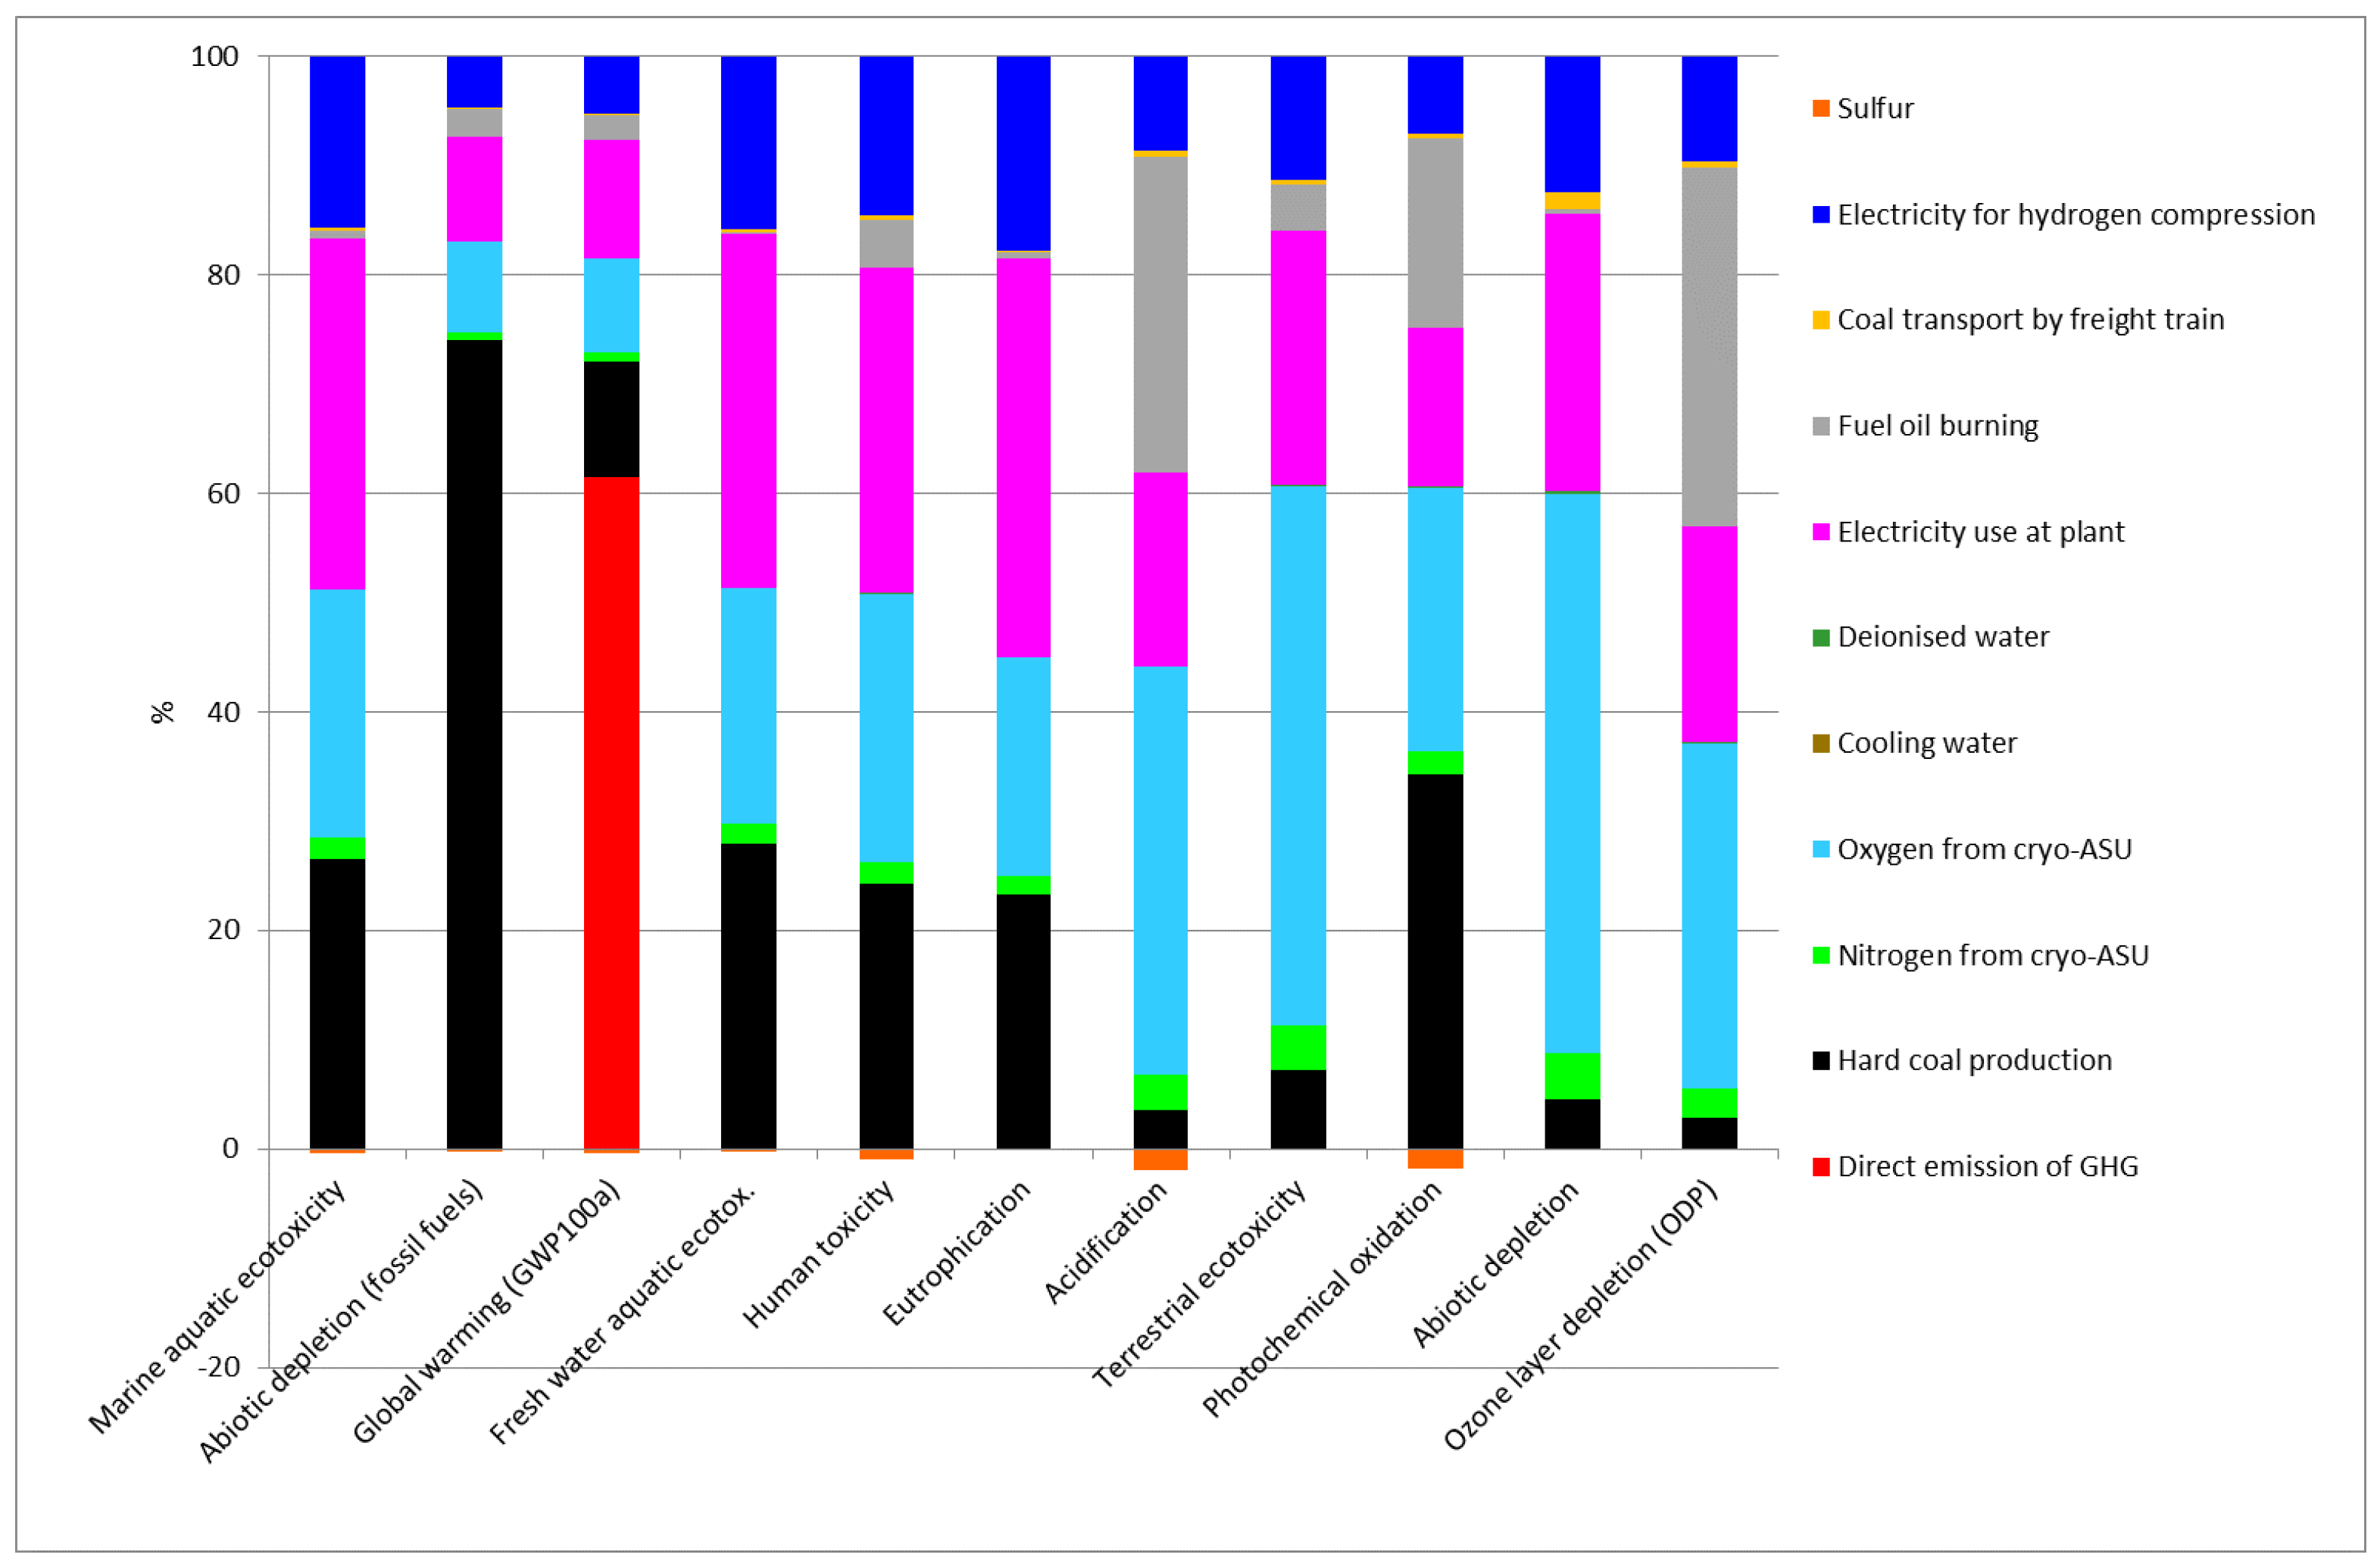
Figure 6 shows the same impact categories, but excluding sequestration operations (non-seq.). The dominant contribution, over 60%, to GHG here is direct CO2 emissions from residual gases that are not directed to the SELEXOL process. Equivalent CO2 emissions, direct and indirect, from coal mining or the use of electricity at the gasification plant contribute approximately 30% to the GHG structure.
When planning an LCA, a technology based on a non-renewable raw material, it is necessary to consider nature conservation and biodiversity in terms of acidification and eutrophication. In this context, the AP and EP impact categories are most relevant. The key pollutants in the AP impact category are SOX, NH3 and NOX, which are major sources of forest and soil damage. In the CML method used in this study, the characterization parameter for the effect of acidification is the potential calculated for air emissions according to the RAINS 10 model, which describes the accumulation of acidifying substances. AP is expressed in kg of SO2 equivalent emitted. In the AP category, H2 seq. technology shows a higher environmental impact. The AP values for H2 seq. and non-seq. technologies are 3.78∙10−2 and 3.64∙10−2 kg of SO2(eq) per FU, respectively (Table 7). Despite small absolute differences in the AP values of the two technologies, the structure for both technology variants (Figure 5 and Figure 6) indicates that the main unit operations that have an impact on this category are: oxygen production by cryogenic air separation, electric energy production and oil combustion for drying raw materials. The difference in AP structure between the considered seq./non-seq. options lies in the appearance of an additional component, resulting from energy consumption for sequestration operations.
EP is the characterization parameter for the eutrophication impact category, which is expressed in general units: kg PO43−eq. This impact represents the overfertilization of the marine environment and is particularly detrimental to the marine biota. Figure 4 shows the higher value in the EP category for the H2 seq technology. In absolute values, these parameters are 5.18∙10−2 and 5.57∙10−2 kg PO43− per FU for H2 non-seq and seq, respectively. Carbon dioxide sequestration does not affect the structure of the EP (Figure 5 and Figure 6). Its value consists mainly of coal mining, electricity production, oxygen generation operation and the energy required to compress hydrogen for transport and distribution.
The abiotic resource depletion index, ADP, is related to the protection of living standards, human health and ecosystem quality. The ADP is related to mineral and energy extraction and is determined for each type of mineral and solid fuel extraction in units of kg of Sb equivalent/kg of metal or MJ. Similar to the acidification and eutrophication indices, several percent higher ADP values are observed when seq. is applied. In terms of energy depletion, the ADP value increases from 405 to 414 MJ/FU, while, in terms of mineral depletion, from 1.54∙10−5 to 1.61∙10−5 kg of Sb(eq)/FU. The main contribution to the value of this indicator (about 80%) in terms of energy depletion is the use of hard coal, while in terms of the depletion of mineral resources, it is the production of oxygen and electricity.
The presented analysis shows that the use of carbon dioxide sequestration in hydrogen production results in a reduction in the global warming impact of this technology by almost half, but at the same time results in an increase in other environmental impact indicators, with increments of less than 10%. The GHG emission factors available in the literature for hydrogen production from coal gasification range from 0.1129 through 11.29 kg CO2-eq/kg H2 for SCG [40], to as high as 18.00 kg CO2-eq/kg H2 for UCG technologies with seq. and non-seq. [83]. The GHG emissions factors of the present study are higher than those from the literature review. The compared GHG emissions quantities differ in the system assumptions of the LCA and, first of all, in the different H2 production technologies. According to [46], the results obtained for both UCG and SCG technologies were comparable and accounted for 207.582 and 197.419 kg CO2-eq, respectively, for an assumed FU of 13.393 kg H2 using sequestration. GHG emissions for SCG and UCG had a similar structure, where the dominant component was emissions from the primary hydrogen production stage (installation), accounting for 92.6% and 99.7% of total emissions, respectively. The authors of the study demonstrated the relevance of CO2 sequestration. GHG emissions for SCG and UCG accounted for 416.362 and 547.717 kg CO2-eq, respectively, without sequestration operations. Comparing the results of the LCA presented by [42] with the results of this analysis, it is correct to make a comparison only for the SCG technology using sequestration. The LCA presented by [42] focuses only on the GHG impact category, and, relative to this category, the Shell technology (of the present analysis) incorporating CO2 sequestration is not very different. By omitting the sequestration operation during hydrogen production, Shell technology is about 50% more carbon-intensive compared to SCG analyzed by [42]. The analysis performed by [42] included: (i) coal extraction and cleaning; (ii) raw material transport; and (iii) hydrogen production. In the case of the present analysis, these boundaries were extended to include fuel compression, its transport to dispensers (trucks back and forth) and fuel cooling processes, which may have influenced the differences in GHG emissions of the compared analyses. Furthermore, GHG emissions are also influenced by coal composition (Shell-Europe; SCG-Asia), gasification technological assumptions, syngas composition for simulated H2 production from reactors and emission factors for national energy mixes.
LCAs presented by [84] indicate the environmental advantage in terms of GHG emissions from biomass gasification, as a source of hydrogen for FCEVs, over methane steam reforming and wind energy technologies. The GHG emissions for each technology were 0.46; 1.17 and 11.51 kg CO2-eq./kg H2, respectively. For the hydrogen produced by Shell technology, in this study, the values of this indicator were 19.5 kg CO2-eq./kg H2 for seq. and 34.8 kg CO2-eq./kg H2 for non-seq. The environmental impact of the AP of the analysis [84] is of the order of 2.03∙10−2; 1.61∙10−2 and 1.13∙10−2 kg SO2 eq for the methane steam reforming, biomass gasification and wind energy technologies, respectively, and they are comparable with results obtained in the presented analysis. Valente et al. [84] adopted wider LCA system boundaries than the present ones: hydrogen fuel production, vehicle production and vehicle operation (i.e., the use phase of both fuel and vehicle, including maintenance and servicing). The differences in AP and GHG for the compared methane steam reforming and Shell technologies may be due to both the width of the system boundaries, the difference in fossil fuel, the difference in hydrogen production technology and the input/output data used for the LCA. The work of [84] carried out analyses based on databases only, while, in the present LCA, we acted on real industrial data and our own data from balances and process streams modelled in ChemCad. An LCA study by [85], in Germany, assessed the costs and environmental impacts of battery electric vehicles and FCEVs, assuming that hydrogen is compressed to the 70.0 MPa pressure needed to reach a fuel temperature of −40 °C. Although the work focused on H2 of water electrolysis origin, such a comparison (with the Shell technology of this study) may also be valuable. The similarity in the analyses compared was solely due to the use of two identical categories of GHG and HTTP impact, modelled, however, using different methods: ReCiPe for [85] and CML baseline for the present analysis. The authors of the cited work assumed broad system boundaries compared to the present work, considering the manufacture and disposal of cells and vehicles. GHG emissions for the FCEVs at an FU of 1 km, being 0.168 kg CO2-eq. from [85], is not significantly different from the lowest GHG value in this study for sequestration at an FU recalculated to 1 km (0.185 kg CO2-eq.). When comparing the GHG factor presented by [85] with the GHG results of the present study, one sees emission differences of 1.7 kg CO2eq. to the disadvantage of the Shell technology. The HTTP impact category (in kg 1.4-DCB eq) for (Bekel and Pauliuk, 2019a) was 0.683 for an FU of 1 km, while, in the present analysis, it was at 6.1∙10−2 and 6.48∙10−2 for non-seq. and seq. for the same FU. The limitations and assumptions of the compared LCA methods should be kept in mind, but the impact of the HTTP category of the Shell technology seems to have more favorable environmental values.

4. Conclusions

The LCA of hydrogen fuel production by the hard coal gasification process in the Shell reactor showed that the implementation of carbon dioxide sequestration causes a significant reduction in GHG emissions and thus reduces the global carbon footprint of this energy carrier. However, carbon dioxide sequestration simultaneously increases the values of other environmental impact indicators. By applying sequestration, it is possible to reduce the GHG emissions index for the assumed FU by approximately 44%, from 34.8 kg CO2-eq to 19.5 kg CO2-eq, but this involves a concomitant increase in the acidification potential index, AP, by approximately 4% from 3.64∙10−2 to 3.78∙10−2 kg SO2-eq, the eutrophication potential index, EP, by 7.5% from 5.18∙10−2 kg to 5.57∙10−2 kg PO3−4-eq and the ADP depletion index by approximately 2% from 405 MJ to 414 MJ and by about 5% from 1.54∙10−5 to 1.61∙10−5 kg Sbeq. The increase in environmental impact category indicators is related to the increased consumption of electricity for the compression and injection of carbon dioxide, which in Poland is produced mainly based on fossil fuels. However, considering the high weight of the categories of greenhouse gases in relation to other categories of environmental impact and the high absolute reduction in greenhouse gas emissions, it can be concluded that the application of carbon dioxide sequestration technology in the production of hydrogen by Shell coal gasification may have measurable environmental effects, reducing the greenhouse gas emissions of this energy carrier by about 44%. A comparison of the obtained results with LCA studies of hydrogen production available in the literature is not possible because few authors have used the CML method recommended by the FC-Hy Guide. In addition, few works deal with the gasification of fossil fuels, which are so ecologically unpopular and crucial for the rational economic and energy transition of the European countries of the carbon triangle. The production of hydrogen discussed in this LCA, commonly categorized as gray because production is based on the use of fossil fuels, is considered an environmentally unfavorable method of obtaining the fuel. The ongoing scientific and political discussions about hydrogen colors are very interesting but can be equally confusing. In fact, strategic or legislative decisions should not be guided by hydrogen colors, but by the level of CO2 emissions from its production, as well as other environmental impact factors gleaned from comprehensive LCA, preferably on real data. In countries whose power industry is based on coal, as is the case in Poland, the production of hydrogen, as well as any other technology, will be burdened with high values of indirect GHG emissions, related primarily to the production of electricity and/or heat necessary for the process. Therefore, increasing emphasis should be placed on expanding environmental analyses to include impact categories other than GHG, as is the case in this LCA.

Author Contributions

D.B.: Conceptualization, Methodology, Software, Investigation, Writing—Review and Editing, Supervision. M.G.-G.: Conceptualization, Methodology, Data curation, Software, Investigation, Writing—Original draft preparation. P.G.: Investigation, Software, Validation, Writing—Original draft preparation. P.B.: Software, Data Curation, Resources, Writing—Reviewing and Editing, Supervision. K.Z.: Software, Data Curation, Writing—Reviewing and Editing, Supervision. All authors have read and agreed to the published version of the manuscript.

Funding

This research was funded by AGH University of Science and Technology, Krakow, Poland, for financial support (No 16.16.210.476) and Project Interreg V-A Czech Republic—Poland, Microprojects Fund 2014–2020 in the Euroregion Silesia, reg. no. CZ.11.4.120/0.0/0.0/16_013/0002137).

Institutional Review Board Statement

Not applicable.

Conflicts of Interest

The authors declare no conflict of interest.

Abbreviations

FCEVFuel Cell Electric Vehicle
LCALife cycle assessment
FUFunctional Unit
GHGgreenhouse gas
EUEuropean Union
LPGLiquefied Petroleum Gas
CNGCompressed Natural Gas
LNGLiquefied Natural Gas
BEVbattery electric vehicle
UCGunderground coal gasification
PSApressure swing adsorption
WGSwater gas shift
SCGSurface Coal Gasification

References

  1. Greenhouse Gas Emissions from Transport in Europe. Available online: https://www.eea.europa.eu/ims/greenhouse-gas-emissions-from-transport (accessed on 9 November 2022).
  2. A European Green Deal. Available online: https://ec.europa.eu/info/strategy/priorities-2019-2024/european-green-deal_en (accessed on 11 January 2022).
  3. Transport. 2019. Available online: https://european-union.europa.eu/priorities-and-actions/actions-topic/transport_en (accessed on 11 January 2022).
  4. Ustawa o Elektromobilności i Paliwach Alternatywnych. Available online: https://isap.sejm.gov.pl/isap.nsf/DocDetails.xsp?id=WDU20180000317 (accessed on 12 January 2022).
  5. Kapdan, I.K.; Kargi, F. Bio-Hydrogen Production from Waste Materials. Enzyme Microb. Technol. 2006, 38, 569–582. [Google Scholar] [CrossRef]
  6. IEA Energy Technology Essentials: Fuel Cells—Analysis. Available online: https://www.iea.org/reports/iea-energy-technology-essentials-fuel-cells (accessed on 12 January 2022).
  7. Okonkwo, E.C.; Al-Breiki, M.; Bicer, Y.; Al-Ansari, T. Sustainable Hydrogen Roadmap: A Holistic Review and Decision-Making Methodology for Production, Utilisation and Exportation Using Qatar as a Case Study. Int. J. Hydrogen Energy 2021, 46, 35525–35549. [Google Scholar] [CrossRef]
  8. The Future of Hydrogen—Analysis. Available online: https://www.iea.org/reports/the-future-of-hydrogen (accessed on 12 January 2022).
  9. Barba, D.; Giacobbe, F.; De Cesaris, A.; Farace, A.; Iaquaniello, G.; Pipino, A. Membrane Reforming in Converting Natural Gas to Hydrogen (Part One). Int. J. Hydrogen Energy 2008, 33, 3700–3709. [Google Scholar] [CrossRef]
  10. Wiltowski, T.; Mondal, K.; Campen, A.; Dasgupta, D.; Konieczny, A. Reaction Swing Approach for Hydrogen Production from Carbonaceous Fuels. Int. J. Hydrogen Energy 2008, 33, 293–302. [Google Scholar] [CrossRef]
  11. Avci, A.C.; Toklu, E. A New Analysis of Two Phase Flow on Hydrogen Production from Water Electrolysis. Int. J. Hydrogen Energy 2021, 47, 6986–6995. [Google Scholar] [CrossRef]
  12. Yong, Y.S.; Rasid, R.A. Process Simulation of Hydrogen Production through Biomass Gasification: Introduction of Torrefaction Pre-Treatment. Int. J. Hydrogen Energy 2021, 47, 42040–42050. [Google Scholar] [CrossRef]
  13. Midilli, A.; Kucuk, H.; Topal, M.E.; Akbulut, U.; Dincer, I. A Comprehensive Review on Hydrogen Production from Coal Gasification: Challenges and Opportunities. Int. J. Hydrogen Energy 2021, 46, 25385–25412. [Google Scholar] [CrossRef]
  14. Ba, Z.; Zhao, J.; Li, C.; Huang, J.; Fang, Y.; Zhang, L.; Kong, L.; Wang, Q. Developing Efficient Gasification Technology for High-Sulfur Petroleum Coke to Hydrogen-Rich Syngas Production. Fuel 2020, 267, 117170. [Google Scholar] [CrossRef]
  15. Amin, M.; Shah, H.H.; Fareed, A.G.; Khan, W.U.; Chung, E.; Zia, A.; Farooqi, Z.U.R.; Lee, C. Hydrogen Production through Renewable and Non-Renewable Energy Processes and Their Impact on Climate Change. Int. J. Hydrogen Energy 2022, 47, 33112–33134. [Google Scholar] [CrossRef]
  16. Zhao, Y.; Ma, S.; Yang, J.; Zhang, J.; Zheng, C. Status of Ultra-Low Emission Technology in Coal-Fired Power Plant. J. China Coal Soc. 2015, 40, 2629–2640. [Google Scholar]
  17. Sun, Q.; Wu, J.; Zhang, Z.; Pang, L. Indirect Coal Liquefaction Technology and Its Research Progress. Chem. Ind. Eng. Prog. 2013, 32, 1–12. [Google Scholar]
  18. Xie, H.; Xiong, L.; Xie, L.; Hou, Z. Prelimi-Nary Study of CO2 Geological Sequestration and En-Hancement of Geothermal Exploitation Integration in China. Chin. J. Rock Mech. Eng. 2014, 33, 3077–3086. [Google Scholar]
  19. Jochem, P.; Babrowski, S.; Fichtner, W. Assessing CO2 Emissions of Electric Vehicles in Germany in 2030. Transp. Res. Part Policy Pract. 2015, 78, 68–83. [Google Scholar] [CrossRef]
  20. Asif, U.; Schmidt, K. Fuel Cell Electric Vehicles (FCEV): Policy Advances to Enhance Commercial Success. Sustainability 2021, 13, 5149. [Google Scholar] [CrossRef]
  21. Pollet, B.G.; Kocha, S.S.; Staffell, I. Current Status of Automotive Fuel Cells for Sustainable Transport. Curr. Opin. Electrochem. 2019, 16, 90–95. [Google Scholar] [CrossRef]
  22. Apostolou, D.; Xydis, G. A Literature Review on Hydrogen Refuelling Stations and Infrastructure. Current Status and Future Prospects. Renew. Sustain. Energy Rev. 2019, 113, 109292. [Google Scholar] [CrossRef]
  23. Department of Energy. Hydrogen Pipelines. Available online: https://www.energy.gov/eere/fuelcells/hydrogen-pipelines (accessed on 13 January 2022).
  24. Fuel Cell Electric Vehicles Stock by Region and by Mode. Charts—Data & Statistics. 2020. Available online: https://www.iea.org/data-and-statistics/charts/fuel-cell-electric-vehicles-stock-by-region-and-by-mode-2020 (accessed on 13 January 2022).
  25. Global EV Outlook—Analysis. 2020. Available online: https://www.iea.org/reports/global-ev-outlook-2020 (accessed on 13 January 2022).
  26. Ministerstwo Klimatu i Środowiska—Portal Gov.pl. “Polska Strategia Wodorowa do Roku 2030 z Perspektywą do Roku 2040” Opublikowana w Monitorze Polskim. Available online: https://www.gov.pl/web/klimat/polska-strategia-wodorowa-do-roku-2030-z-perspektywa-do-roku-2040-opublikowana-w-monitorze-polskim (accessed on 13 January 2022).
  27. Zgazowanie Węgla. Available online: http://www.zgazowaniewegla.agh.edu.pl/index.php (accessed on 25 January 2022).
  28. Chanthakett, A.; Arif, M.T.; Khan, M.; Oo, A.M. Performance Assessment of Gasification Reactors for Sustainable Management of Municipal Solid Waste. J. Environ. Manag. 2021, 291, 112661. [Google Scholar] [CrossRef]
  29. Tsangas, M.; Gavriel, I.; Doula, M.; Xeni, F.; Zorpas, A.A. Life Cycle Analysis in the Framework of Agricultural Strategic Development Planning in the Balkan Region. Sustainability 2020, 12, 1813. [Google Scholar] [CrossRef] [Green Version]
  30. Gallego-Schmid, A.; Rivera, X.C.S.; Stamford, L. Introduction of Life Cycle Assessment and Sustainability Concepts in Chemical Engineering Curricula. Int. J. Sustain. High. Educ. 2018, 19, 442–458. [Google Scholar] [CrossRef] [Green Version]
  31. Mazzi, A. Introduction. Life Cycle Thinking. In Life Cycle Sustainability Assessment for Decision-Making; Elsevier: Amsterdam, The Netherlands, 2020; pp. 1–19. [Google Scholar]
  32. Ahamed, A.; Vallam, P.; Iyer, N.S.; Veksha, A.; Bobacka, J.; Lisak, G. Life Cycle Assessment of Plastic Grocery Bags and Their Alternatives in Cities with Confined Waste Management Structure: A Singapore Case Study. J. Clean. Prod. 2021, 278, 123956. [Google Scholar] [CrossRef]
  33. Banti, D.C.; Tsangas, M.; Samaras, P.; Zorpas, A. LCA of a Membrane Bioreactor Compared to Activated Sludge System for Municipal Wastewater Treatment. Membranes 2020, 10, 421. [Google Scholar] [CrossRef] [PubMed]
  34. Kapusta, K.; Stańczyk, K.; Wiatowski, M.; Chećko, J. Environmental Aspects of a Field-Scale Underground Coal Gasification Trial in a Shallow Coal Seam at the Experimental Mine Barbara in Poland. Fuel 2013, 113, 196–208. [Google Scholar] [CrossRef]
  35. Strugała-Wilczek, A.; Kapusta, K. Migration of Co, Cd, Cu, Pb to the Groundwater in the Area of Underground Coal Gasification Experiment in a Shallow Coal Seam in the Experimental Mine ‘Barbara’in Poland. Fuel 2021, 317, 122831. [Google Scholar] [CrossRef]
  36. Howaniec, N.; Smoliński, A. Steam Co-Gasification of Coal and Biomass–Synergy in Reactivity of Fuel Blends Chars. Int. J. Hydrogen Energy 2013, 38, 16152–16160. [Google Scholar] [CrossRef]
  37. Hyder, Z.; Ripepi, N.S.; Karmis, M.E. A Life Cycle Comparison of Greenhouse Emissions for Power Generation from Coal Mining and Underground Coal Gasification. Mitig. Adapt. Strateg. Glob. Chang. 2016, 21, 515–546. [Google Scholar] [CrossRef]
  38. Burchart-Korol, D.; Krawczyk, P.; Czaplicka-Kolarz, K.; Smoliński, A. Eco-Efficiency of Underground Coal Gasification (UCG) for Electricity Production. Fuel 2016, 173, 239–246. [Google Scholar] [CrossRef]
  39. Śliwińska, A.; Burchart-Korol, D.; Smoliński, A. Environmental Life Cycle Assessment of Methanol and Electricity Co-Production System Based on Coal Gasification Technology. Sci. Total Environ. 2017, 574, 1571–1579. [Google Scholar] [CrossRef]
  40. Cetinkaya, E.; Dincer, I.; Naterer, G. Life Cycle Assessment of Various Hydrogen Production Methods. Int. J. Hydrogen Energy 2012, 37, 2071–2080. [Google Scholar] [CrossRef]
  41. Ruether, J.A.; Ramezan, M.; Balash, P.C. Greenhouse Gas Emissions from Coal Gasification Power Generation Systems. J. Infrastruct. Syst. 2004, 10, 111–119. [Google Scholar] [CrossRef] [Green Version]
  42. Liu, H.; Liu, S. Life Cycle Energy Consumption and GHG Emissions of Hydrogen Production from Underground Coal Gasification in Comparison with Surface Coal Gasification. Int. J. Hydrogen Energy 2021, 46, 9630–9643. [Google Scholar] [CrossRef]
  43. Li, G.; Zhang, K.; Yang, B.; Liu, F.; Weng, Y.; Liu, Z.; Fang, Y. Life Cycle Analysis of a Coal to Hydrogen Process Based on Ash Agglomerating Fluidized Bed Gasification. Energy 2019, 174, 638–646. [Google Scholar] [CrossRef]
  44. Burmistrz, P.; Chmielniak, T.; Czepirski, L.; Gazda-Grzywacz, M. Carbon Footprint of the Hydrogen Production Process Utilizing Subbituminous Coal and Lignite Gasification. J. Clean. Prod. 2016, 139, 858–865. [Google Scholar] [CrossRef]
  45. FC-HyGuide 2011. Available online: https://www.h2euro.org/whats-h2appening/fc-hyguide-%e2%80%93-guidance-document-for-performing-lcas-on-hydrogen-and-fuel-cells-technologies/ (accessed on 12 January 2022).
  46. ISO 14040:2006; Environmental Management—Life Cycle Assessment—Principles and Framework. ISO: Geneva, Switzerland, 2006.
  47. LA Gas Station Gets Hydrogen Fuel Pump. Available online: https://www.nbcnews.com/id/wbna25413866 (accessed on 13 January 2022).
  48. SAE International—Mobility Engineering. Available online: https://www.sae.org/pressRoom?OBJECT_TYPE=PressReleases&PAGE=showRelease&RELEASE_ID=2620 (accessed on 13 January 2022).
  49. Toyota Mirai Fuel Cell Sedan Production Information. 2016. Available online: https://pressroom.toyota.com/2016-toyota-mirai-fuel-cell-product/ (accessed on 26 January 2022).
  50. All-New Hyundai NEXO—The Future Utility Vehicle Made by Hyundai. Available online: https://www.hyundai.news/eu/models/electrified/nexo/press-kit/all-new-hyundai-nexo-the-future-utility-vehicle-made-by-hyundai.html (accessed on 26 January 2022).
  51. Burchart-Korol, D. Zastosowanie Metod Oceny Środowiskowej Na Podstawie Analizy Cyklu Życia Dla Branży Motoryzacyjnej. Zesz. Nauk. Organ. Zarz. Politech. Śl. 2017, 100, 77–85. [Google Scholar]
  52. Jakub, S.; Adrian, L.; Mieczyslaw, B.; Ewelina, B.; Katarzyna, Z. Life Cycle Assessment Study on the Public Transport Bus Fleet Electrification in the Context of Sustainable Urban Development Strategy. Sci. Total Environ. 2022, 824, 153872. [Google Scholar] [CrossRef] [PubMed]
  53. Emission Standards: Europe: Cars and Light Trucks. Available online: https://dieselnet.com/standards/eu/ld.php (accessed on 30 January 2022).
  54. Rödl, A.; Wulf, C.; Kaltschmitt, M. Assessment of Selected Hydrogen Supply Chains—Factors Determining the Overall Ghg Emissions. In Hydrogen Supply Chains; Elsevier: Amsterdam, The Netherlands, 2018; pp. 81–109. [Google Scholar]
  55. Al-Zareer, M.; Dincer, I.; Rosen, M.A. Analysis and Assessment of a Hydrogen Production Plant Consisting of Coal Gasification, Thermochemical Water Decomposition and Hydrogen Compression Systems. Energy Convers. Manag. 2018, 157, 600–618. [Google Scholar] [CrossRef]
  56. DOE H2A Delivery Analysis: DOE Hydrogen Program. Available online: https://www.hydrogen.energy.gov/h2a_delivery.html (accessed on 28 January 2022).
  57. DOE Hydrogen Program. Available online: https://www.hydrogen.energy.gov/program_records.html (accessed on 28 January 2022).
  58. Song, W.; Tang, L.; Zhu, X.; Wu, Y.; Rong, Y.; Zhu, Z. Fusibility and Flow Properties of Shell Gasifier Slag. J. Chem. Ind. Eng. Soc. China 2009, 7, 297–304. [Google Scholar]
  59. Sun, B.; Liu, Y.; Chen, X.; Zhou, Q.; Su, M. Dynamic Modeling and Simulation of Shell Gasifier in IGCC. Fuel Process. Technol. 2011, 92, 1418–1425. [Google Scholar] [CrossRef]
  60. Chiesa, P.; Consonni, S.; Kreutz, T.; Williams, R. Co-Production of Hydrogen, Electricity and CO2 from Coal with Commercially Ready Technology. Part A: Performance and Emissions. Int. J. Hydrogen Energy 2005, 30, 747–767. [Google Scholar] [CrossRef]
  61. Woods, M.C.; Pamela, J.C.; Haslbeck, J.L.; Kuehn, N.J.; Matuszewski, M.; Pinkerton, L.L.; Rutkowski, M.D.; Schoff, R.L.; Vaysman, V. Cost and Performance Baseline for Fossil Energy Plants. Volume 1: Bituminous Coal and Natural Gas to Electricity. Final Report, Revision 1; Report no. DOE/NETL-2007/1281; US Department of Energy, National Energy: Washington, DC, USA, 2007. [Google Scholar]
  62. Adhikari, S.; Fernando, S. Hydrogen Membrane Separation Techniques. Ind. Eng. Chem. Res. 2006, 45, 875–881. [Google Scholar] [CrossRef]
  63. Sircar, S.; Golden, T.C. Pressure Swing Adsorption Technology for Hydrogen Production. Hydrog. Syngas Prod. Purif. Technol. 2009, 10, 414–450. [Google Scholar]
  64. Chen, W.-H.; Chen, S.-M.; Hung, C.-I. Carbon Dioxide Capture by Single Droplet Using Selexol, Rectisol and Water as Absorbents: A Theoretical Approach. Appl. Energy 2013, 111, 731–741. [Google Scholar] [CrossRef]
  65. Mohammed, I.Y.; Samah, M.; Mohamed, A.; Sabina, G. Comparison of SelexolTM and Rectisol® Technologies in an Integrated Gasification Combined Cycle (IGCC) Plant for Clean Energy Production. Int. J. Eng. Res. 2014, 3, 742–744. [Google Scholar] [CrossRef]
  66. Mokhatab, S.; Poe, W.A. Chapter 7—Natural Gas Sweetening. In Handbook of Natural Gas Transmission and Processing, 2nd ed.; Mokhatab, S., Poe, W.A., Eds.; Gulf Professional Publishing: Boston, MA, USA, 2012; pp. 253–290. ISBN 978-0-12-386914-2. [Google Scholar]
  67. Elkanzi, E.M. Simulation of the Process of Biological Removal of Hydrogen Sulfide from Gas. In Proceedings of the 1st Annual Gas Processing Symposium, Doha, Qatar, 10–12 January 2009; Advances in Gas Processing. Alfadala, H.E., Reklaitis, G.V.R., El-Halwagi, M.M., Eds.; Elsevier: Amsterdam, The Netherlands, 2009; Volume 1, pp. 266–275. [Google Scholar]
  68. Pal, D.; Chand, R.; Upadhyay, S.; Mishra, P. Performance of Water Gas Shift Reaction Catalysts: A Review. Renew. Sustain. Energy Rev. 2018, 93, 549–565. [Google Scholar] [CrossRef]
  69. Kapetaki, Z.; Brandani, P.; Brandani, S.; Ahn, H. Process Simulation of a Dual-Stage Selexol Process for 95% Carbon Capture Efficiency at an Integrated Gasification Combined Cycle Power Plant. Int. J. Greenh. Gas Control 2015, 39, 17–26. [Google Scholar] [CrossRef] [Green Version]
  70. Wiheeb, A.; Helwani, Z.; Kim, J.; Othman, M. Pressure Swing Adsorption Technologies for Carbon Dioxide Capture. Sep. Purif. Rev. 2016, 45, 108–121. [Google Scholar] [CrossRef]
  71. Elsner, M.P.; Menge, M.; Müller, C.; Agar, D.W. The Claus Process: Teaching an Old Dog New Tricks. Catal. Today 2003, 79, 487–494. [Google Scholar] [CrossRef]
  72. Cavalett, O.; Chagas, M.F.; Seabra, J.E.; Bonomi, A. Comparative LCA of Ethanol versus Gasoline in Brazil Using Different LCIA Methods. Int. J. Life Cycle Assess. 2013, 18, 647–658. [Google Scholar] [CrossRef]
  73. Ding, N.; Pan, J.; Zhang, Z.; Yang, J. Life Cycle Assessment of Car Sharing Models and the Effect on GWP of Urban Transportation: A Case Study of Beijing. Sci. Total Environ. 2019, 688, 1137–1144. [Google Scholar] [CrossRef]
  74. Valente, A.; Iribarren, D.; Dufour, J. Harmonising Methodological Choices in Life Cycle Assessment of Hydrogen: A Focus on Acidification and Renewable Hydrogen. Int. J. Hydrogen Energy 2019, 44, 19426–19433. [Google Scholar] [CrossRef]
  75. Drielsma, J.A.; Russell-Vaccari, A.J.; Drnek, T.; Brady, T.; Weihed, P.; Mistry, M.; Simbor, L.P. Mineral Resources in Life Cycle Impact Assessment—Defining the Path Forward. Int. J. Life Cycle Assess. 2016, 21, 85–105. [Google Scholar] [CrossRef] [Green Version]
  76. Khoo, H.H.; Halim, I.; Handoko, A.D. LCA of Electrochemical Reduction of CO2 to Ethylene. J. CO2 Util. 2020, 41, 101229. [Google Scholar] [CrossRef]
  77. Morales-Méndez, J.-D.; Silva-Rodríguez, R. Environmental Assessment of Ozone Layer Depletion Due to the Manufacture of Plastic Bags. Heliyon 2018, 4, e01020. [Google Scholar] [CrossRef] [PubMed]
  78. Harder, R.; Peters, G.M.; Svanström, M.; Khan, S.J.; Molander, S. Estimating Human Toxicity Potential of Land Application of Sewage Sludge: The Effect of Modelling Choices. Int. J. Life Cycle Assess. 2017, 22, 731–743. [Google Scholar] [CrossRef] [Green Version]
  79. Berthoud, A.; Maupu, P.; Huet, C.; Poupart, A. Assessing Freshwater Ecotoxicity of Agricultural Products in Life Cycle Assessment (LCA): A Case Study of Wheat Using French Agricultural Practices Databases and USEtox Model. Int. J. Life Cycle Assess. 2011, 16, 841–847. [Google Scholar] [CrossRef]
  80. Paulu, A.; Bartáček, J.; Šerešová, M.; Kočí, V. Combining Process Modelling and LCA to Assess the Environmental Impacts of Wastewater Treatment Innovations. Water 2021, 13, 1246. [Google Scholar] [CrossRef]
  81. Plouffe, G.; Bulle, C.; Deschênes, L. Characterization Factors for Zinc Terrestrial Ecotoxicity Including Speciation. Int. J. Life Cycle Assess. 2016, 21, 523–535. [Google Scholar] [CrossRef]
  82. Farinha, C.; de Brito, J.; Veiga, M.D. (Eds.) Chapter 8—Life Cycle Assessment. In Eco-Efficient Rendering Mortars; Publishing Series in Civil and Structural Engineering; Woodhead Publishing: Sawston, UK, 2021; pp. 205–234. ISBN 978-0-12-818494-3. [Google Scholar]
  83. Verma, A.; Kumar, A. Life Cycle Assessment of Hydrogen Production from Underground Coal Gasification. Appl. Energy 2015, 147, 556–568. [Google Scholar] [CrossRef]
  84. Valente, A.; Iribarren, D.; Candelaresi, D.; Spazzafumo, G.; Dufour, J. Using Harmonised Life-Cycle Indicators to Explore the Role of Hydrogen in the Environmental Performance of Fuel Cell Electric Vehicles. Int. J. Hydrogen Energy 2020, 45, 25758–25765. [Google Scholar] [CrossRef]
  85. Bekel, K.; Pauliuk, S. Prospective Cost and Environmental Impact Assessment of Battery and Fuel Cell Electric Vehicles in Germany. Int. J. Life Cycle Assess. 2019, 24, 2220–2237. [Google Scholar] [CrossRef]
Figure 1. Life cycle system boundary for hydrogen alternative fuel production. Source of hydrogen compressor graphics: www.howden.com; Shell reactor: netl.doe.gov; and hydrogen refueling station: www.roadandtrack.com.
Energies 16 00383 g001
Figure 2. Mass balance of the hard coal gasification process for Shell technology.
Energies 16 00383 g002
Figure 3. Process diagram of the Shell hydrogen production system [44].
Energies 16 00383 g003
Figure 4. Comparison of LCA for hydrogen produced by Shell gasification with seq./non-seq.
Energies 16 00383 g004
Figure 5. Structure of impact categories in the life cycle analysis of hydrogen from Shell gasification with sequestration (seq.).
Energies 16 00383 g005
Figure 6. Structure of impact categories in life cycle analysis of hydrogen from Shell gasification without sequestration (non-seq.).
Energies 16 00383 g006
Table 1. Toyota Mirai II and Hyundai Nexo specifications.
ToyotaHyundai
Engine power [kW]134120
Weight [kg]19001873
Fuel consumption in a combined cycle [kg H2/100 km]0.840.95
Acceleration (od 0 do 100 km/h) [s]9.09.2
Storage capacity [L H2]3 tanks (142.2 L)3 tanks (156.6 L)
Table 2. Characteristics of hard coal.
NameSymbolUnitOperating ConditionDryCoal for Reactor
CarbonC%47.859.156.1
HydrogenH%3.64.44.2
NitrogenN%0.81.01.0
Total sulfurSt%1.82.32.1
OxygenO%9.411.611.0
MoistureWt%19.10.05.0
AshA%17.521.720.6
Higher Heating ValueQikJ/kg18,85123,87922,560
Table 3. Parameters of the gasification process balance streams.
Stream Number12345678910
NameCoalOxygenRaw Synthesis GasGas WGSGas SELEXOLCO2Purified GasHydrogenResidual GasSulfur
Temperature [°C]-642683023939393939-
Pressure [bar]-51393832430281.5-
Stream [kg/h]140,00073,479314,532374,903287,405222,22453,85713,43040,4262534
Composition, mole fractions
H20.000.0018.2415.1455.320.0086.90100.049.880.00
N20.001.803.933.264.870.006.890.0026.370.00
O20.0095.010.000.000.010.000.000.000.000.00
H2O0.000.0042.9352.650.280.000.030.000.120.00
CO0.000.0032.7427.171.550.002.420.009.270.00
CO20.000.001.150.9636.83100.002.850.0010.890.00
H2S0.000.000.450.370.550.000.000.000.000.00
COS0.000.000.040.030.000.000.000.000.000.00
SO20.000.000.000.000.000.000.000.000.000.00
CH40.000.000.020.020.030.000.040.000.160.00
Ar0.003.190.480.400.540.000.870.003.320.00
NH30.000.000.000.000.010.000.000.000.000.00
Table 4. Summary data on the configuration of the hydrogen production system with Shell technology.
SpecificationUnitValue
Oxygen production
Technology-Cryogenic separation
Gasification
Reactor-Dispersive with dry fuel supply
Gasification pressureMPa4.2
Ratio O to Ckg O2/kg dry coal0.648
Carbon conversion rate%99.5
Calorific value of gaskJ/Nm310,173
Oxidant-Oxygen (95% vol.)
Fuel-Hard coal
Moisture content of the fuel fed to the reactor%5
Gas conversion and purification system
WGS--
Conversion CO-yes,
Desulfurization-Selexol I stage (99.7%)
Sulfur recovery-Claus/SCOT
Dedusting-Water quench/scrubber
Separation of CO2-Selexol II stage (95%)
Hydrogen separation
Technology-Pressure swing adsorption (PSA)
Efficiency of separation of H2%85
Table 5. Characteristics of the coals used and hydrogen yields.
Technological SystemShell
Hydrogen yield rate [kg H2/Mg as received]95.9
Hydrogen yield rate [kg H2/Mg dry]118.5
Hydrogen yield rate [kg H2/GJ]5.1
Chemical enthalpy transformation efficiency [%]60.9
Table 6. Input and output data of the LCI stage of hydrogen production per kg of H2.
INPUTOUTPUT
Factor/MaterialAmountUnitFactor/MaterialAmountUnit
Coal production10.42kgFumes3.39kg
Coal transport (rail)100kmSlag2.32kg
Oxygen5.55kgWastewater6.93kg
Nitrogen1.18kgResidual gas3.86kg
Water4.49kgSulfur0.188kg
Steam/water vapour4.24kgCarbon dioxide16.54kg
Electricity6.711kWhHydrogen (880 bar)1kg
Air(drying)1.715kg
Light fuel oil0.23kg
Hydrogen tranposrt300km
Energy to compress hydrogen3.1kWh
Table 7. Results of LCA of hydrogen production by Shell gasification with seq./ non-seq. per FU for 11 impact categories. CML method.
Impact CategoryUnitTotal (H2 Non-Seq.)Total (H2 Seq.)Relative Change
Seq. vs. Non-Seq.
Marine aquatic ecotoxicity (MAETP)kg 1.4-DB eq2.38∙1042.54∙1046.6%
Abiotic depletion (ADP fossil fuels)MJ4054142.1%
Greenhouse gases (GWP 100a)kg CO2 eq34.819.5−44.1%
Fresh water aquatic ecotox. (FAETP)kg 1.4-DB eq9.6810.36.6%
Human toxicity (HTTP)kg 1.4-DB eq6.426.826.2%
Eutrophication (EP)kg PO4 3− eq5.18∙10−25.57∙10−27.5%
Terrestrial ecotoxicity (TETP)kg 1.4-DB eq1.85∙10−21.95∙10−25.1%
Acidification (AP)kg SO2 eq3.64∙10−23.78∙10−23.8%
Photochemical oxidation (POCP)kg C2H4 eq2.32∙10−32.42∙10−34.5%
Abiotic depletion (antimony)kg Sb eq1.54∙10−51.61∙10−54.8%
Ozone layer depeltion (ODP)kg CFC-11 eq4.14∙10−74.31∙10−74.1%
Disclaimer/Publisher’s Note: The statements, opinions and data contained in all publications are solely those of the individual author(s) and contributor(s) and not of MDPI and/or the editor(s). MDPI and/or the editor(s) disclaim responsibility for any injury to people or property resulting from any ideas, methods, instructions or products referred to in the content.

