1. Introduction
The load profile of power systems is usually characterized by short periods when large amounts of energy are required. These time slots are known as “peak load times” [
1]. The peak load period can occur at different times of the day or different months of the year for residential, commercial or industrial consumers. As the design criterion for the electricity transmission and distribution networks considers the maximum demand, these systems must be designed to withstand the peak load periods, tending to be underutilized the rest of the time [
2]. For this reason, industrial and commercial consumers are charged not only for monthly energy consumption but also for additional tariffs related to their peak demand that impact the cost of the grid’s infrastructure.
Consumers from industry and commerce are interested in reducing the value of their electricity bills without implying a reduction in the necessary consumption. Energy storage systems (ESSs) then appear as an interesting alternative, enabling energy storage during off-peak periods and releasing it during peak consumption periods, thus smoothing the demand curve.
Applications such as peak load shaving require the ESS to be able to maintain a constant delivery of power for a certain period. In this context, battery energy storage systems are the most suitable alternative as they ensure the proper system operation for a mid-term time scale, i.e., some minutes to a few hours [
3,
4].
BESSs have experienced advances in terms of robustness and reliability, but the battery bank useful life and the costs of this technology are still decisive factors for the economic viability in the power system context [
5,
6]. For a particular peak load shaving application, the proper sizing of the BESS components plays a fundamental role in the system lifespan [
7,
8], but the effective management of battery charging and discharging processes play a decisive role in the performance of the energy storage system [
9,
10].
As the nominal voltage of a single battery is usually lower than required voltage for power applications, the BESS needs battery banks with series connected units [
11]. Most of the current research related to BESS performance focuses on the electrochemical technologies, management systems, safety circuits and cell-balancing strategies [
12]. Despite this, there are inherent limitations related to connections between the batteries that cannot be overcome by the design techniques or power flow schedules.
In conventional battery banks, when battery cells are series connected, they all must have the same electrical current passing through them at all times whether charging or discharging. No matter how rigorous the selection of batteries that will compose the bank, there will always be a difference between them as it is not possible to manufacture cells to be identical in every way. For this reason each fully charged battery in the bank will have its own maximal releasable charge capacity, which will be different from its rated capacity. Furthermore, as the cells are used throughout their service life, their parameters will deviate from the initial values and each cell in the bank will increasingly require different amounts of charge to reach the fully charged state [
9].
Notice that to fully charge a series connected battery bank, the entire string of cells must receive the charge required by the cell that needs the highest charge, implied in overcharging for the cells presenting lower capacities. The resulting consequences can be catastrophic depending on the electrochemical battery technology. Lead-acid cells are quite tolerant of being overcharged, but lithium-based cells are not so. Overcharging lithium batteries can significantly accelerate their degradation processes and, in more serious cases, fires or violent explosions can occur [
13].
Overloading the batteries that make up the bank can be avoided by interrupting the charging process when the smaller capacity battery is fully charged, which implies underutilization of the other units. According to the current discard criteria, a battery bank should be replaced when its capacity drops to 80 percent [
14]. By limiting the performance of BESS to its worst batteries, the battery bank ends up being discarded before all its capacity has been used. The problem tends to get worse when the number of batteries in the string grows.
Numerous charge balancing schemes and circuits have been proposed in the literature to control the power flow of the batteries of a BESS. The main strategies of charge balancing schemes and circuits are summarized in [
15,
16,
17]. Among these schemes, multiple-winding transformer-based solutions have the advantage of being effective and low cost, but require multiple windings in a single transformer and have disadvantages such as large size, high cost and additional copper losses [
18,
19]. Solutions based on multiple transformers [56T], [57T] are also restricted to the battery charging process and suffer from the same problems presented by topologies with multiple winding transformers. Solutions based on buck-boost converters [
20,
21] generate bidirectional topologies in power flow; present good equalization speed and acceptable voltage/current stresses on components, but use intelligent and complex control strategy; and require additional cell monitoring system, large size, high cost and intricate design. Solutions based on quasi-resonant converters [
22] are also bidirectional in power flow, allowing equalization in both charge and discharge processes, but the energy is transferred from high- to low-voltage cells between the adjacent cells only and balancing speed decreases with the increase in the length of the battery string.
In this research paper, a new approach is proposed to significantly extend the battery bank lifespan in BESS for peak load shaving applications. In the proposed scheme, the power flow for each battery in a BESS can be independently controlled with the aid of an active two-stage DC–DC power converter. The energy flow during the battery bank charging and discharging processes is set according to the individual State-of-Health (SoH) and State-of-Charge (SoC) of its units. The main goal is to use each battery within its particular limits, decoupling the dynamics of the units and fully utilizing the available energy before the bank is discarded. The individualized battery power flux control also makes it possible to overcome limitations found in conventional banks, enabling the combined use of second-life and brand new batteries of different technologies, capacities or ages. The results revealed an increase of more than 50% in the total amount of energy dispatched by the bank, significantly extending its lifespan.
The remainder of this paper is organized as follows: Firstly,
Section 2 recalls the principle of peak load shaving using BESS.
Section 3 presents materials and methods used, highlighting the PV Power Plant Description, the concepts for the battery degradation model and the scaled PV-BESS scheme for the simulated peak load shaving system. In
Section 4, the proposed technology for the BESS active control of the energy flow is presented, detailing the bidirectional DC–DC power converter and the validation of the bench prototype. Then, in
Section 5, the simulation results for the designed peak load shaving model when using conventional battery bank and the proposed solution are presented. The performance of the storage system is evaluated in
Section 6 from the perspective of using battery modules with active control of the power flow. Lastly,
Section 7 draws conclusions about this work and presents our future research directions.
2. Peak Load Shaving with Battery Energy Storage Systems
Peak load shaving is not a recent practice; in fact, this strategy has been used for years with the support of gas turbines or diesel generators installed at the site of the customer business. These solutions have been replaced in large industrial plants or commercial installations by photovoltaic (PV)-BESS systems able to store energy during periods of low demand, discharging at a constant rate for shorter periods when the peak loads are observed. The PV-BESS released energy aims to support the consumption requirements during the peak load times.
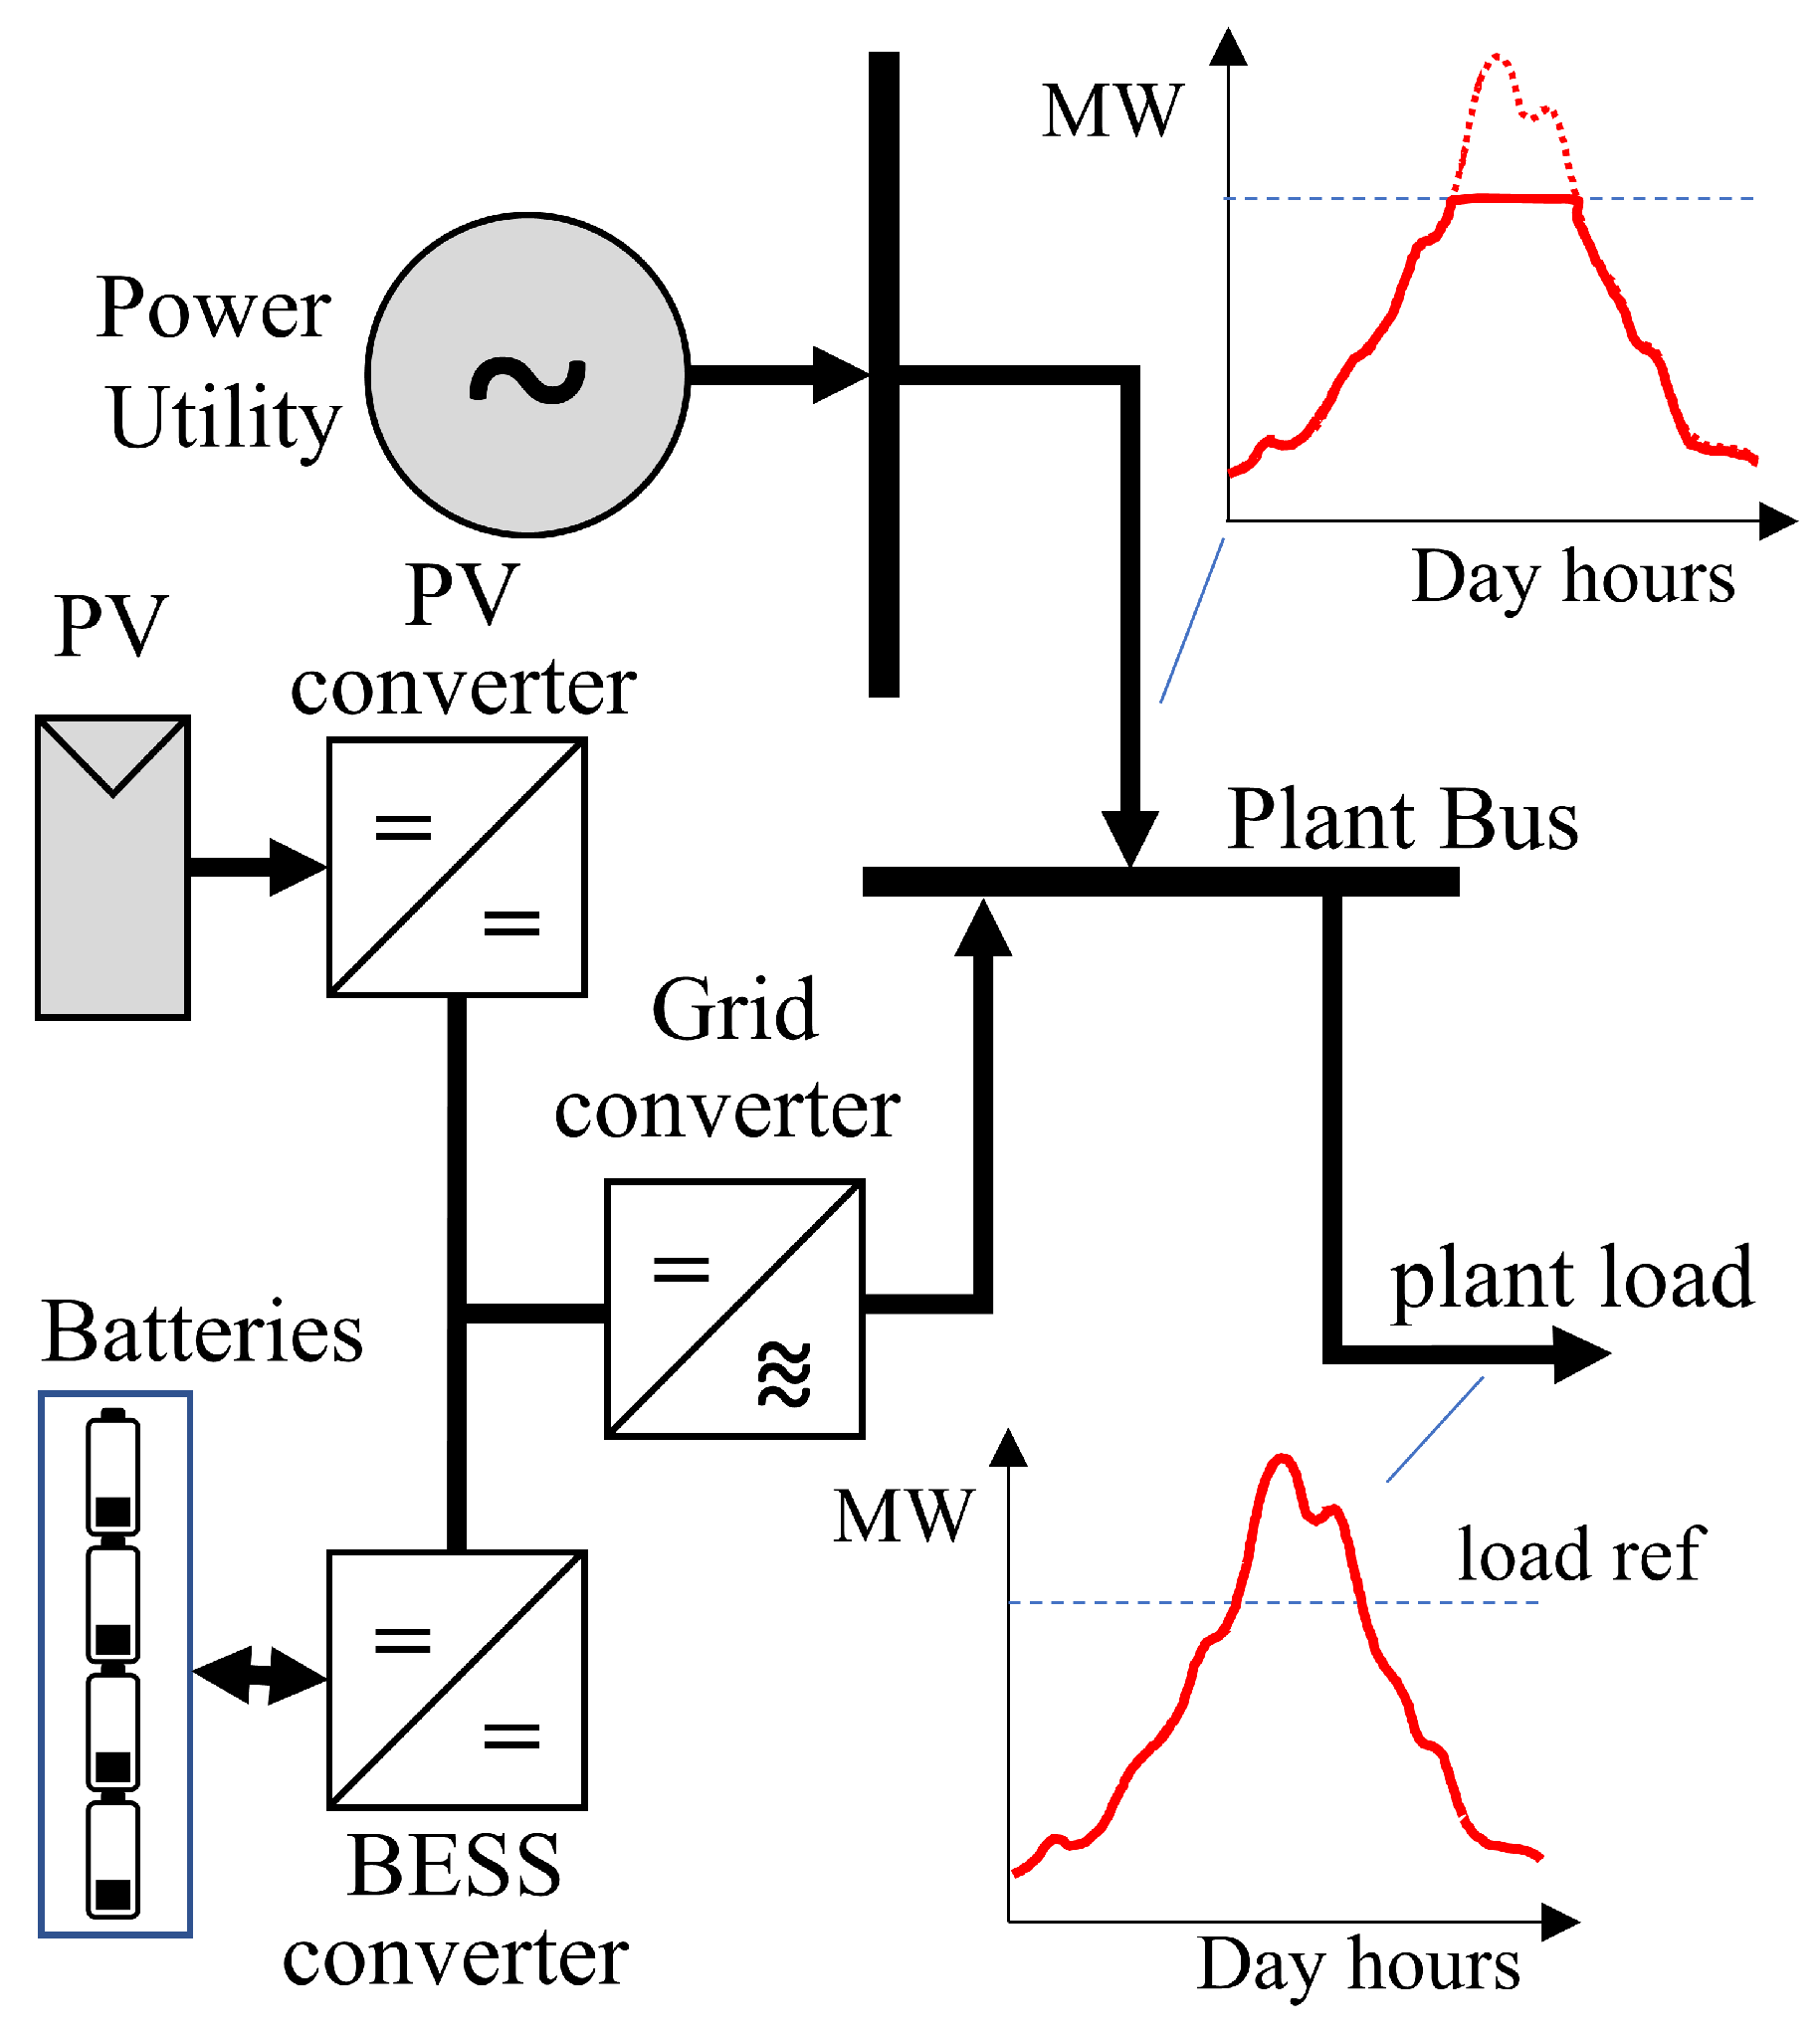
Figure 1 schematically illustrates a grid-connected PV-BESS peak load shaving system. It is assumed that the energy flow is properly controlled so that the BESS can act, shaving and shifting the energy consumption peak. The dashed line shown in the load profile illustrated in
Figure 1 represents the plant load reference. This is a constant value for each installation and must not be exceeded.
Whenever the power required by the installation exceeds the established reference, which usually occurs at specific time slots every day, the energy from the BESS must be dispatched to supply the excess demand. Considering that the energy storage system is properly sized for the plant context, the flattening of the load curve will be guaranteed, avoiding specific charges related to the peak hours consumption. It is worth highlighting at this point that the degradation rate of the batteries in a storage system heavily depends on the requirements of each application type. The nature of the considered application implies, therefore, the occurrence of a single daily battery bank discharge/recharge cycle.
3. Materials and Methods
This study was carried out at the Tesla Engenharia de Potência laboratory, Federal University of Minas Gerais (UFMG), Brazil, under financial support from the ANEEL (National Electric Energy Agency) and Petrobras (Petróleo Brasileiro S.A.). Experimental prototypes of control and power hardware were carefully developed and bench tested in order to validate the decoupled control of the power flow in connected electrochemical storage devices.
The performance of the BESS was verified through computer simulation on the Matlab® Simscape and Simulink tools. To build the simulation model, a scaled peak load shaving system based on BESS was designed. A degradation model was included in order to compute the battery capacity losses of throughout the recharge and discharge cycles. Solar radiance data were collected each five minutes over a year in a real photovoltaic plant. These data were used as input to the simulation model in order to evaluate the BESS useful life and total amount of dispatched energy.
In this section, a detailed description of the techniques, resources and procedures adopted in the research are presented.
3.1. PV Power Plant
Figure 2 shows the solar panel strings from the photovoltaic plant considered in this work. It is a 37 kWp PV-plant, composed of 154 solar panels arranged in three separated arrays. The main features of the installation are listed below:
Location: Federal University of Minas Gerais Engineering School (UFMG);
19°52’10.81″ S 43°57’42.01″ W. Altitude 808 m;
Total peak power: 37.2 kW;
Energy delivered to the grid: 54 MWh/year;
Total area is 439 m2 and area covered by PV modules = 257 m2;
Each PV module peak power: 245 W.
The sizing of the battery bank was performed as detailed in [
10]. The collected data from radiation profile were applied to System Advisory Model (SAM) software [
23].
3.2. PV-BESS Model Description
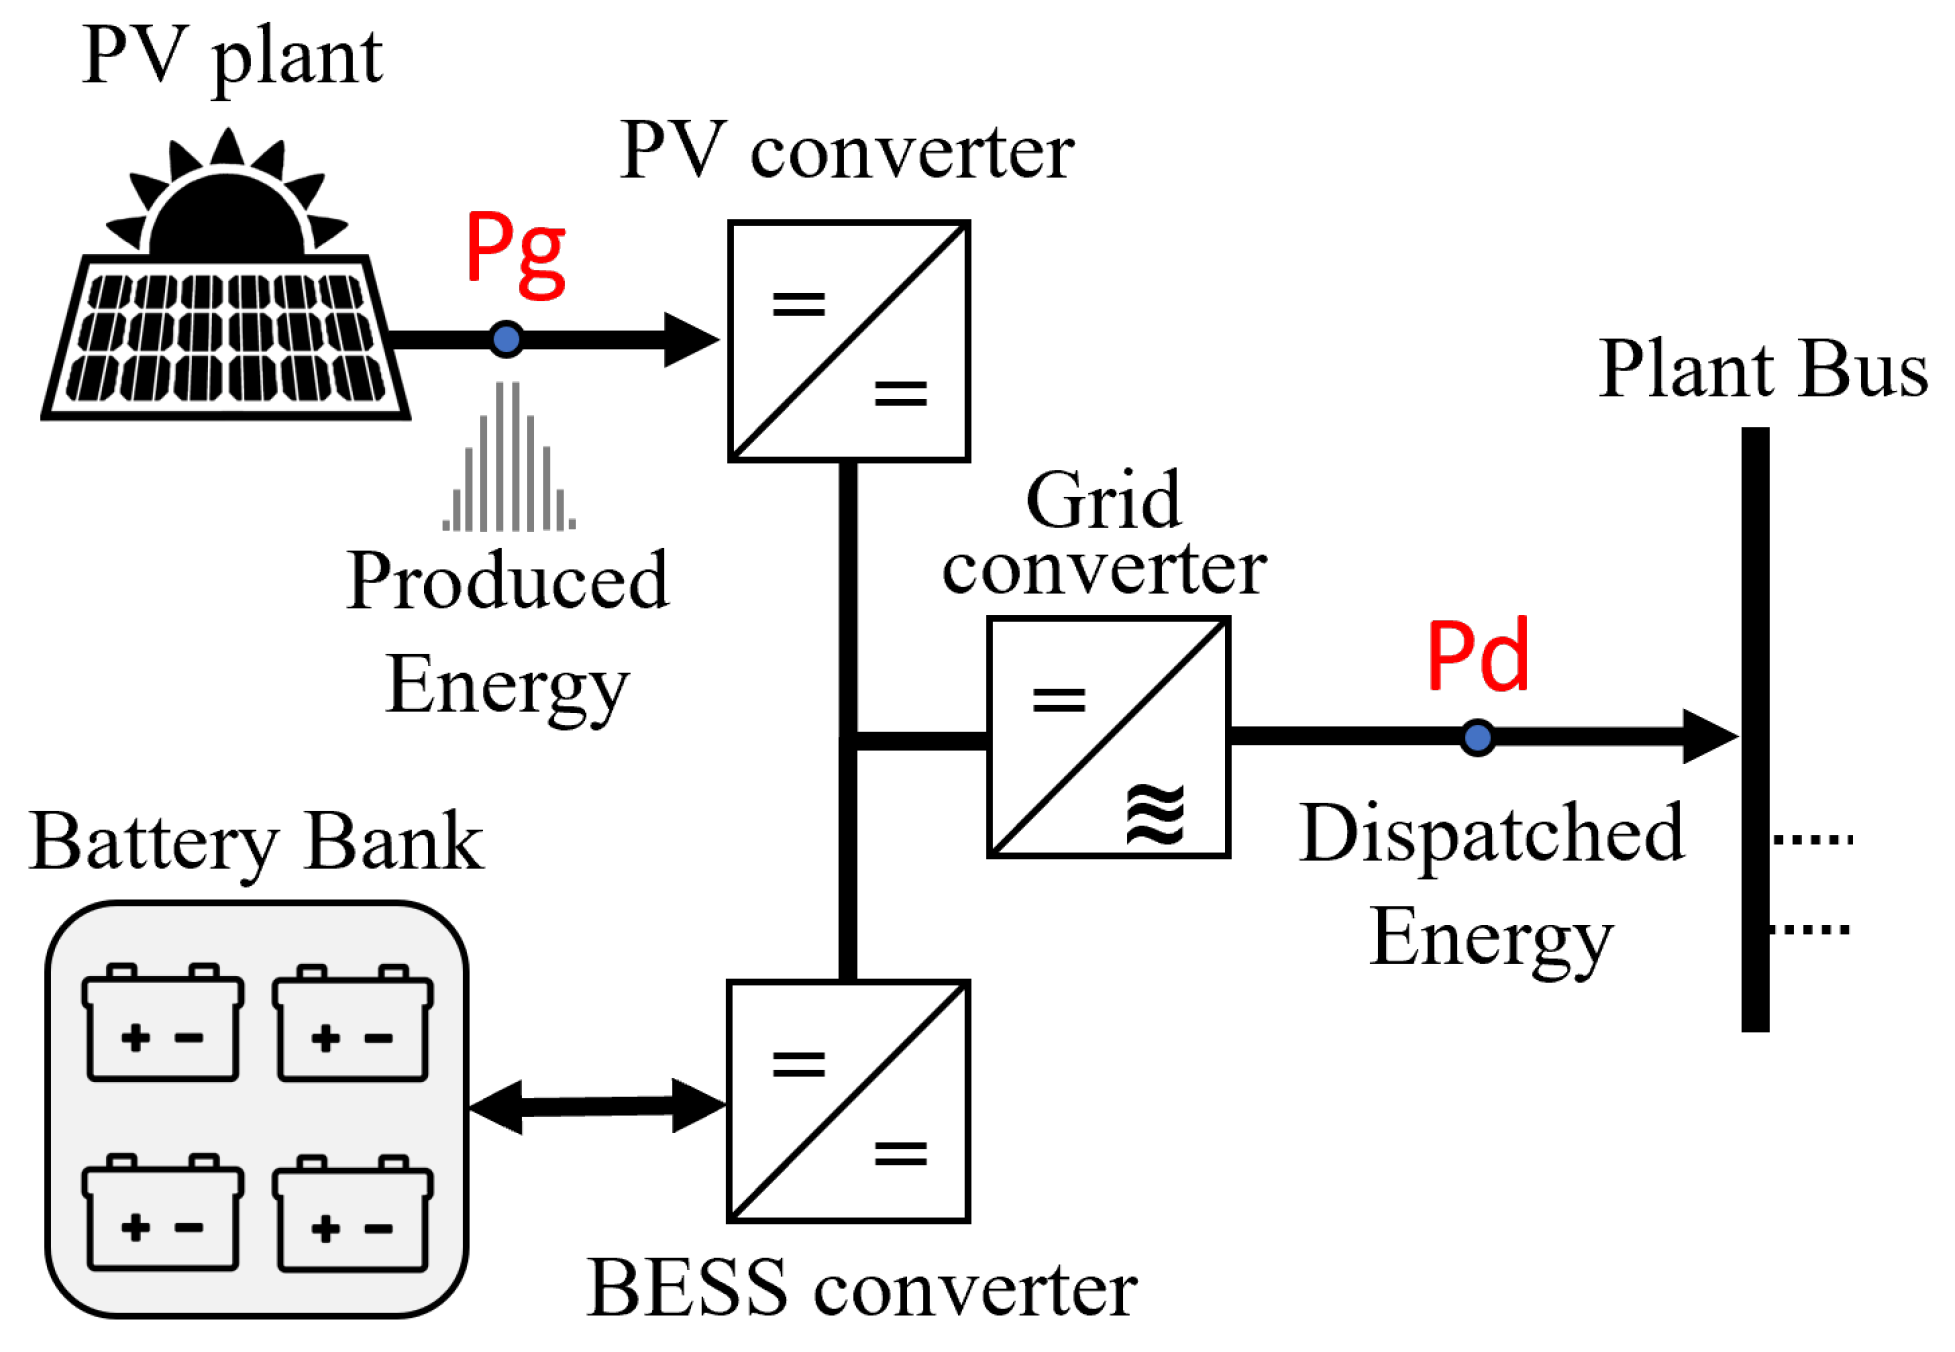
In order to reduce the computational cost of running the complex battery models and degradation algorithms, a scaled design for a typical peak load shaving system was considered. The designed system, shown in
Figure 3, is able to guarantee an average daily energy dispatch of 5 kWh, sufficient to meet a demand for additional consumption at peak load times. This amount of daily energy must be available at the Pd point highlighted in
Figure 3 along the system’s useful life.
The designed system presents a global efficiency of 88%, considering the typical losses in the power converters, batteries and installation, shown in
Table 1 [
24]. The installation efficiency is due to dust on the surface of solar array panels and parasitic losses on cables and connections. The energy provided by solar panels at the Pg point in
Figure 3 must be 5.8 kWh per day. With these data, standardized procedures and recommendations were adopted to determine the characteristics of the necessary solar panels [
25]. Among the available options, the panel model CS5C-100M, from the Canadian Solar manufacturer, was chosen. It took 20 panels arranged in five paralleled strings, each string with four series connected panels.
Aiming to meet the efficiency, economy and scalability requirements of the proposed system, the output voltage of the battery bank was fixed at 48 V, adjusting the DC voltage levels to the existing power converters. The battery models considered in this work are rated for 12 V; thus, four series connected batteries were necessary to reach the required voltage.
Considering a constant discharge current, the Ah capacity (
) for the battery bank was calculated using (
1), where
is the daily energy to be dispatched by the BESS, in Wh. Using the design values, a capacity
of 116 Ah was found.
The nominal capacity of the battery bank (
) was determined using (
2) as follows:
In (
2), DoD is the percentage depth-of-discharge of the batteries, defined as the fraction or percentage of the capacity which has been removed per cycle from the fully charged battery. As DoD has a significant impact on the battery lifespan, recommended DoD values are established by manufacturers’ and international standards for each battery chemistry [
26,
27,
28,
29]. While typical lead-acid battery packs are sized for 50% DoD, Li-ion batteries perform better with DoD between 80 and 90% [
26,
28,
29,
30]. Two different battery chemistries were assumed in this research: lead-acid and Li-ion. An 80% DoD was adopted for lithium-ion batteries. The main data for these batteries are summarized in
Table 2.
3.3. The Battery Ageing Model
A battery degradation model was needed to assess the useful life of the BESS in the peak load shaving application context. Factors such as DoD, charging or discharging rates (c-rate) and temperature influence the aging of the batteries and had to be managed during the life cycle simulation [
31,
32]. Battery degradation models found in the literature are generally based on electrochemical (or physics-based) models, equivalent circuit models, machine learning models and empirical/semi-empirical models.
Electrochemical models are quite accurate but rely on a detailed set of specifications and physical parameters from manufacturers. They require a lot of time for testing, experimentation and data collection, which only makes the results relevant to a specific battery [
32].
Models based on electrical circuits are simpler than electrochemical models and can represent a certain family of battery technology. Capacitors and resistors are used to reproduce the characteristics of the batteries, but the necessary parameters can only be obtained by carrying out elaborated laboratory tests [
33]. It is also important to mention that, for this type of model, continuous testing should be performed to catch the variation of electrical parameters as a function of battery ageing. Without updating parameters over time, the model will not be able to capture aging phenomena.
Machine learning models use supervised learning algorithms or neural networks to estimate the battery SoC and SoH. These models have the advantage of requiring easily obtained parameters such as voltage, current and temperature. High accuracies can be obtained with machine learning methods; however, large data sets are needed to properly train the learning algorithms [
34,
35].
Empirical and semi-empirical models are obtained by fitting data for various stressors associated with battery degradation, resulting in relatively simple analytical expressions. This simplicity allows the application of this category of models in a wide variety of studies, among them are optimization models and battery management systems. Due to its simplicity but still good accuracy, semi-empirical models have been used for on-line battery prognosis and SoH estimation [
36].
In this research work, the ampere-hour throughput-based semi-empirical model was chosen, aiming at consistency with the real data and information provided by the battery manufacturers. This kind of model considers that there is a finite amount of electrical charge that can be handled by a battery, regardless of the way the energy has been drawn, before it is declared unusable due to its capacity loss [
37,
38]. The Amp-hour-throughput models are usually based on the DoD and can be adjusted to the available data found in the battery datasheets [
33,
39].
Before detailing the adopted model, we need to briefly recall the definition of the state of health parameter. The state of health of a battery is defined as the ratio of its current capacity to the original rated capacity. International standards and scientific works consider that a battery reaches the end of its useful life when it has lost 20% of its initial capacity, that is, when the SoH reaches 80% [
40,
41,
42,
43]. The battery SoH can be determined as in [
40] using (
3):
where
and
are, respectively, the initial values of SoH and capacity of the battery,
N is the expected number of cycles to reach the battery end of life and
is the electrical current flowing through the battery, in amps. According to the previous definitions, SoH is equal to 100% when the battery can reach its rated capacity value and 0% if the battery only can reach 80% of its rated capacity value. As we can see in (
3), the battery capacity reduction rate depends on the expected number of operational cycles.
An interesting work presented in [
33], supported by results and models obtained in [
42,
44], shows how to use a modified Arrhenius equation to estimate the total number of cycles, based on DoD, for lead-acid and Li-Ion batteries. In these works, the hypothesis of a battery management system (BMS) being able to keep the operating temperatures of the batteries approximately constant was considered. In [
33], a physical model based on the Arrhenius equation is presented to estimate the battery percentage capacity loss
using (
4):
where
B is the pre-exponential factor,
is the activation energy in J/mol and
is the total energy throughput measured in Ah. The model contains two constants, which are the ideal gas constant (R) and the internal temperature of the battery cells (T). The parameters
and
B in (
4) were calibrated in [
33] from an experimental study for lead-acid batteries carried out in [
45]. The DoD values considered when calibrating the model were 30%, 50% and 100%.
The presented model in (
4) was used to determine the total energy-throughput that the battery experiences to lose 20% of its initial capacity. To do so
was made equal to 20% in (
5).
The total energy-throughput
is the total electrical charge passing through the battery during its useful life. Dividing this value by the rated capacity
of the battery results in the total expected number of cycles
N, as shown in (
6).
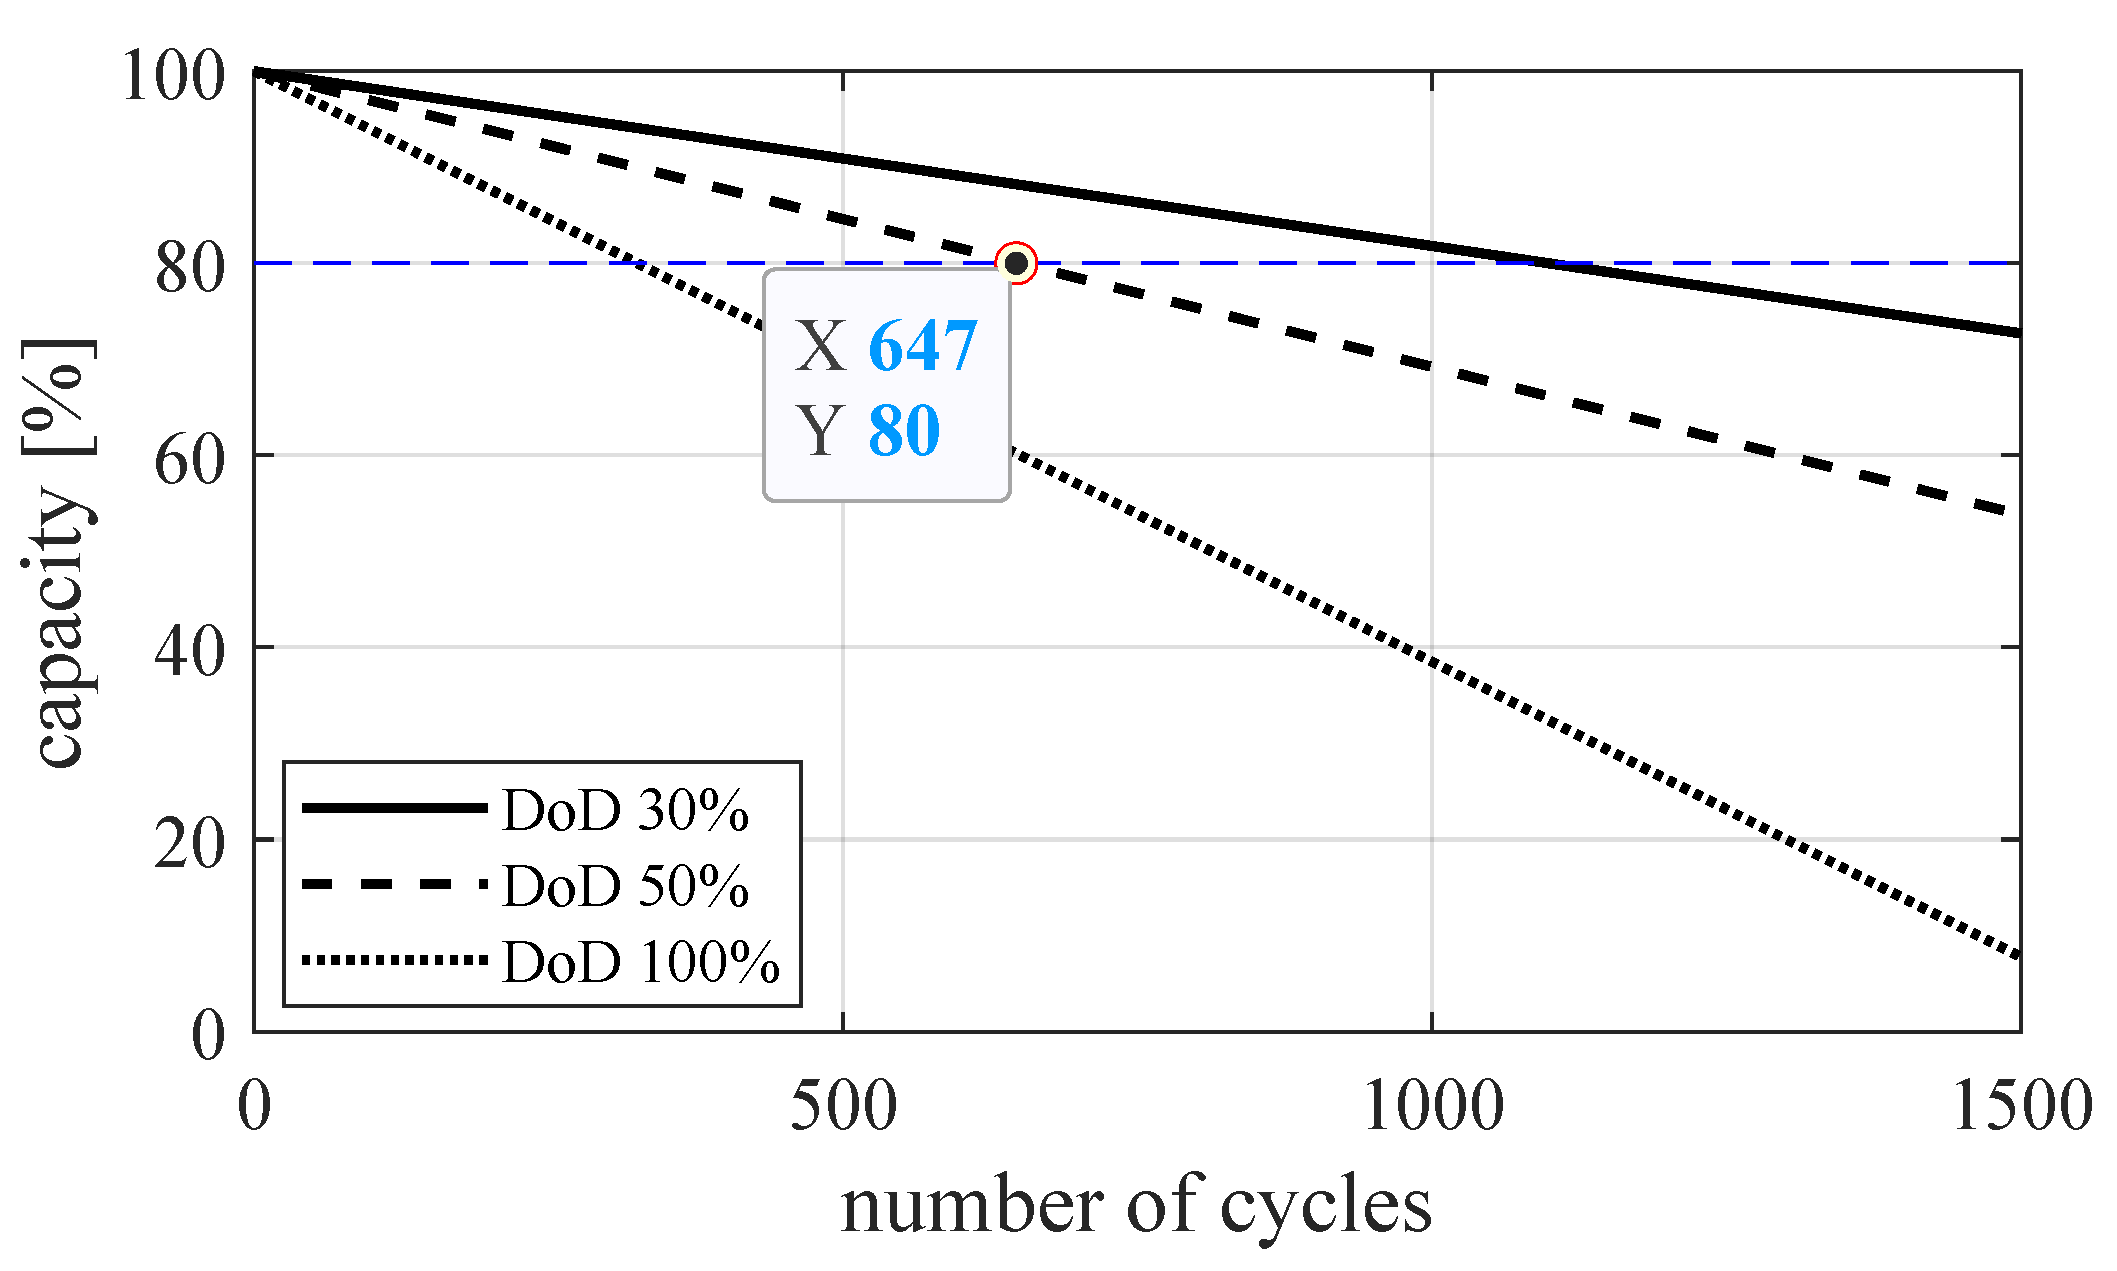
Figure 4 shows the capacity fade curves versus cycles for lead-acid batteries using this approach. As the graphs show, the battery capacity loss is essentially linear with the number of charge–recharge cycles for different DoD values. The highlighted point corresponds to the number of operating cycles required for a 20% capacity loss with 50% DoD.
Both lead-acid and lithium-ion batteries were considered in this research to assess the service life of the BESS in the peak load shaving system. The battery models were selected according to the sizing in the design stage as indicated in
Table 2.
The model HZY-SL12-230 corresponds to the 12 V–230 Ah lead-acid battery. A detailed data sheet containing additional information and recommendations for use is provided online by the manufacturer in [
46]. According to the manufacturer, for a 50% DoD, about 650 full cycles can be expected over the useful life. This information is consistent with the highlighted point in
Figure 4 for 50% DoD.
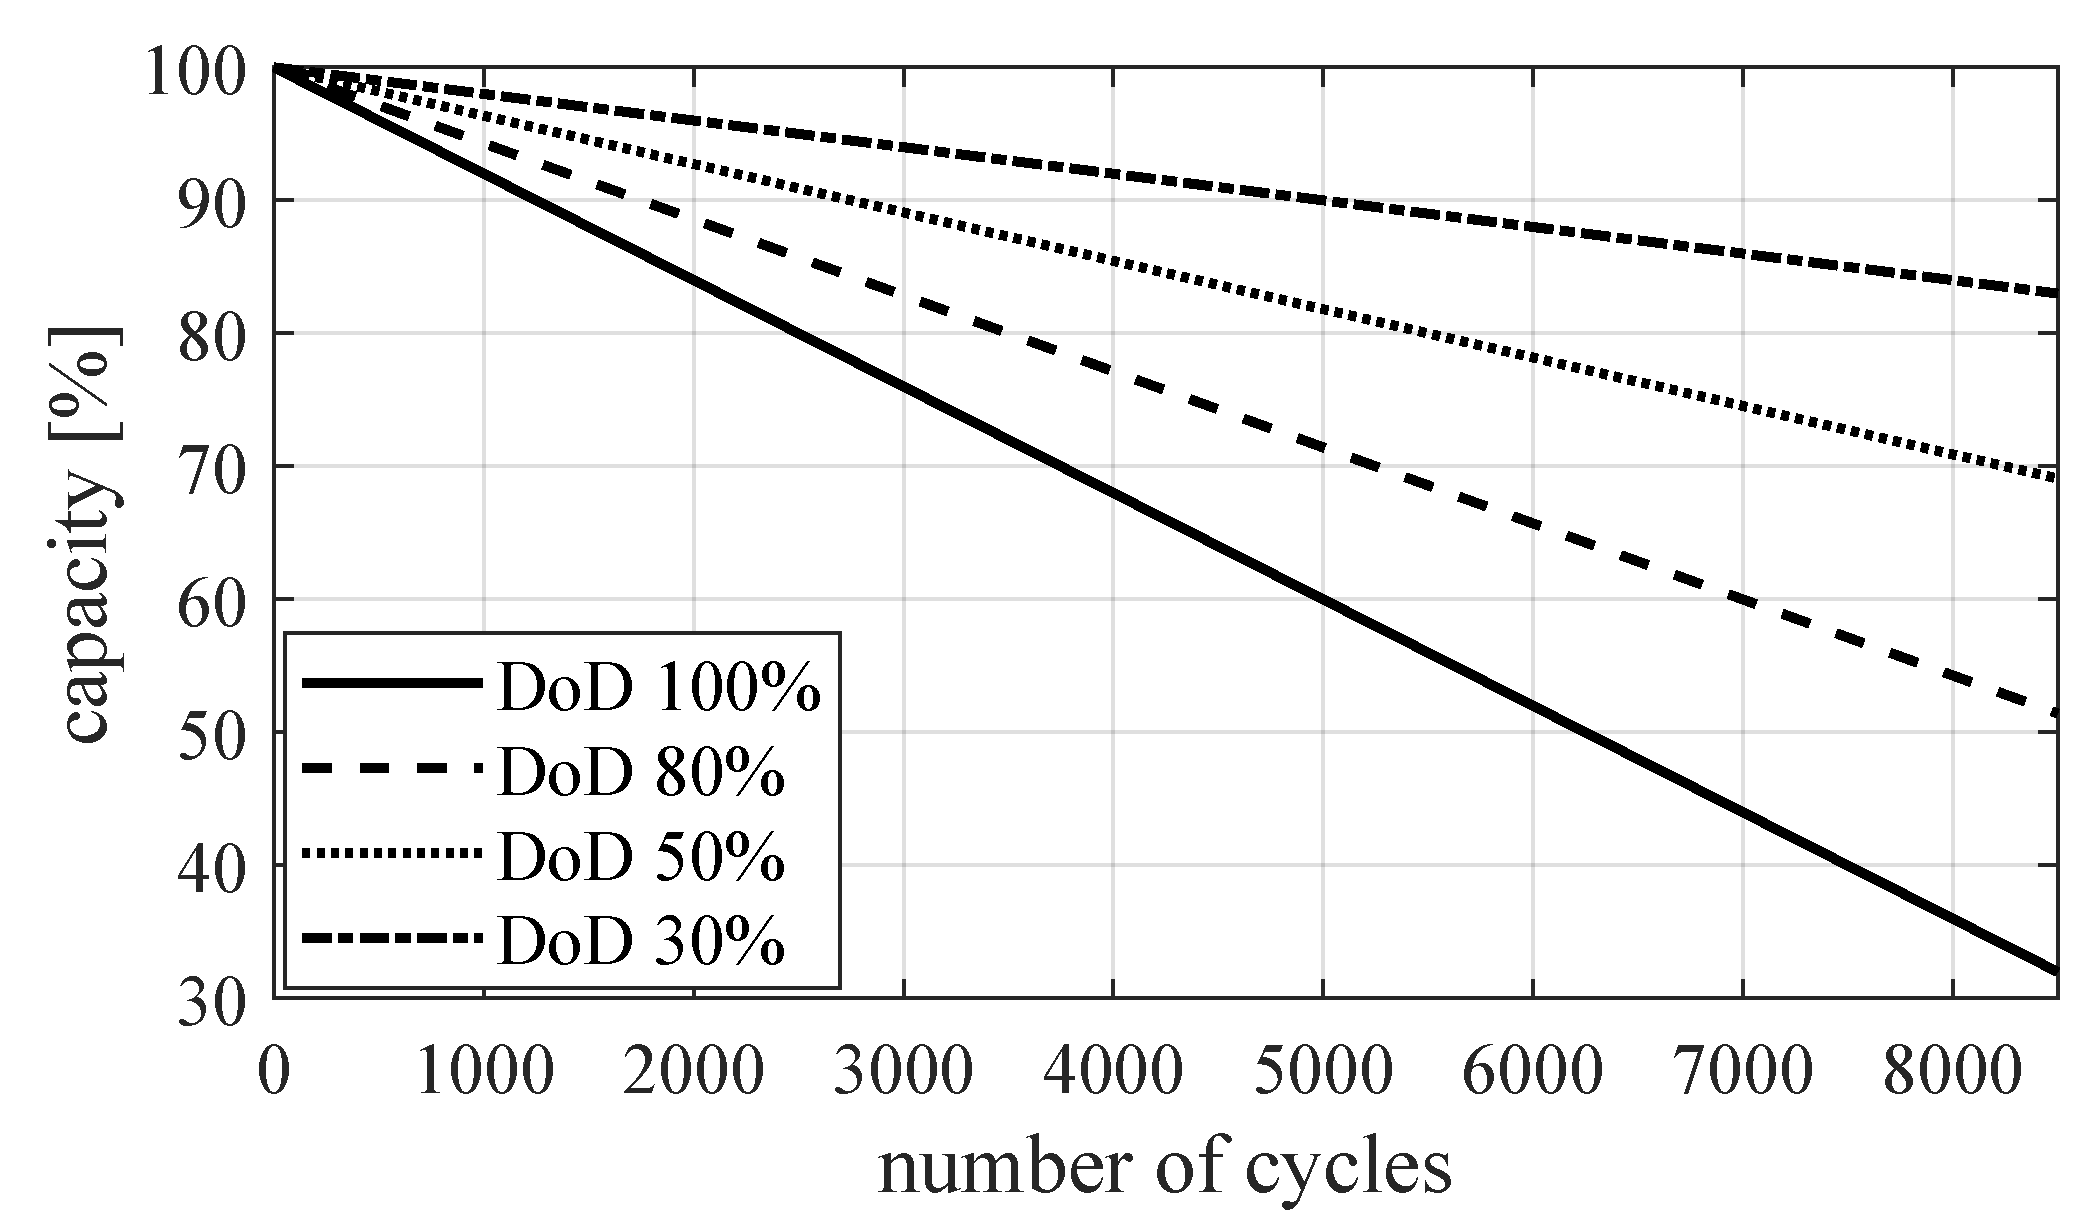
The model CLI150-12, from CANBAT Technologies Inc. refers to the 12 V–150 Ah Li-Ion battery. This manufacturer offers more complete and detailed information in the battery datasheet [
47]. A Family of remaining capacity curves related to the expected number of cycles for different DoD values is fully provided and reproduced in
Figure 5. These data were used to calibrate the degradation algorithm embedded into the built simulation model for the BESS.
3.4. The Simulation Protocol
The general simulation model was developed in Matlab/Simulink
® environment. The Simscape Battery Toolbox was used to implement the specific models for each battery technology. The main used parameters for the Simscape battery models are presented in
Table 3.
The Amp-hour-throughput degradation model, described in
Section 3.3, was developed and calibrated using manufacturer’s data interpolated for each battery model. These models were written in the form of discrete functions to be executed in each calculation step. A maximum dispersion of 8% in the initial capacities of the batteries related to the rated capacity was also considered.
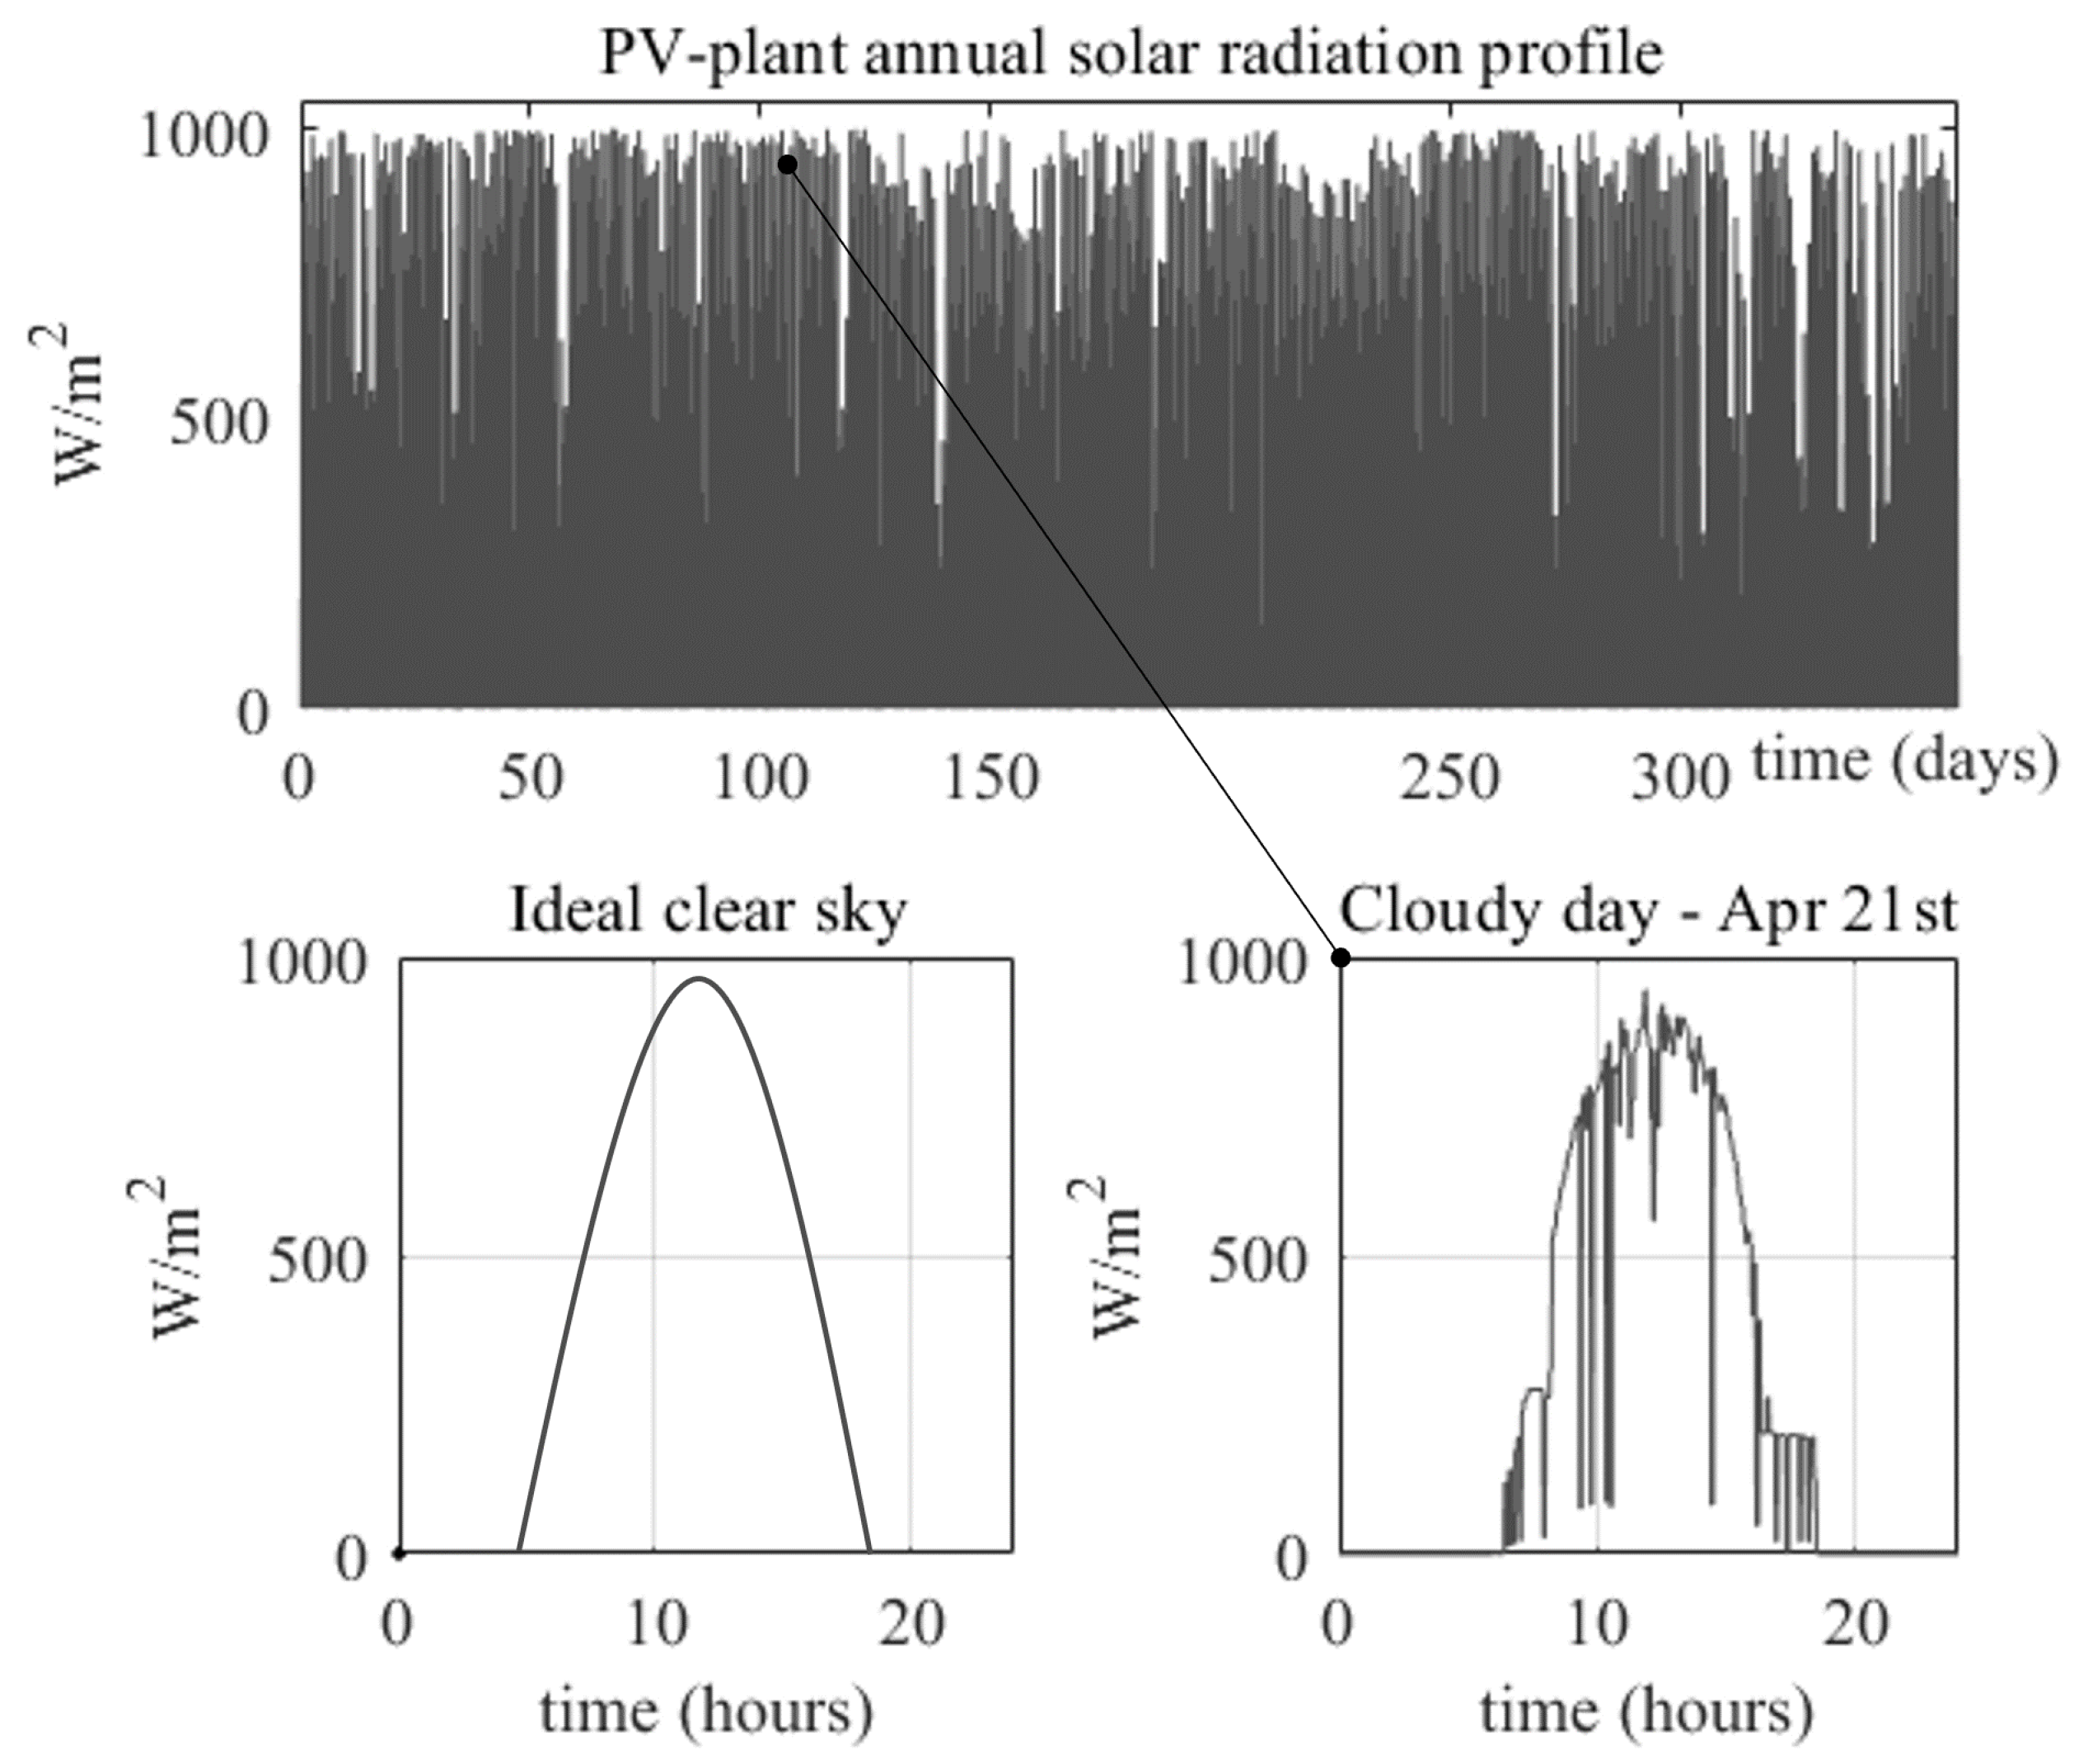
Following the simulation protocol, the modeled batteries are recharged during the day according to the annual solar radiation profile collected in the PV plant, shown in
Figure 6. After each daily recharge operation, the simulated storage system was discharged during a specific time slot with a constant electrical current, aiming to perform the typical peak load shaving function. The SoHs of the batteries were daily updated after each full cycle. Additional functions were also included to continuously compute the daily dispatched energies. The process described above was performed iteratively until the BESS battery bank reached insufficient performance.
4. Active Control of Energy Flow
Grouping batteries of identical capacities in the same bank is always a practical impossibility. This implies the underuse of batteries whose full SoC cannot be reached during the bank operation. For the same reason, replacing the worst battery in an aging bank is also a challenge, as the new battery tends to have a larger capacity than the others and cannot be fully utilized. Notice that the real capacity of a battery bank with series connected units is always restricted to its worst battery. These are some of the reasons why passively connected battery banks are generally discarded when at least one of their units presents bad performance due to degradation [
43]. In this section, the active control of the battery power flow is discussed from the perspective of making full use of the available energy.
4.1. Modular Chargers Using Active Battery Units
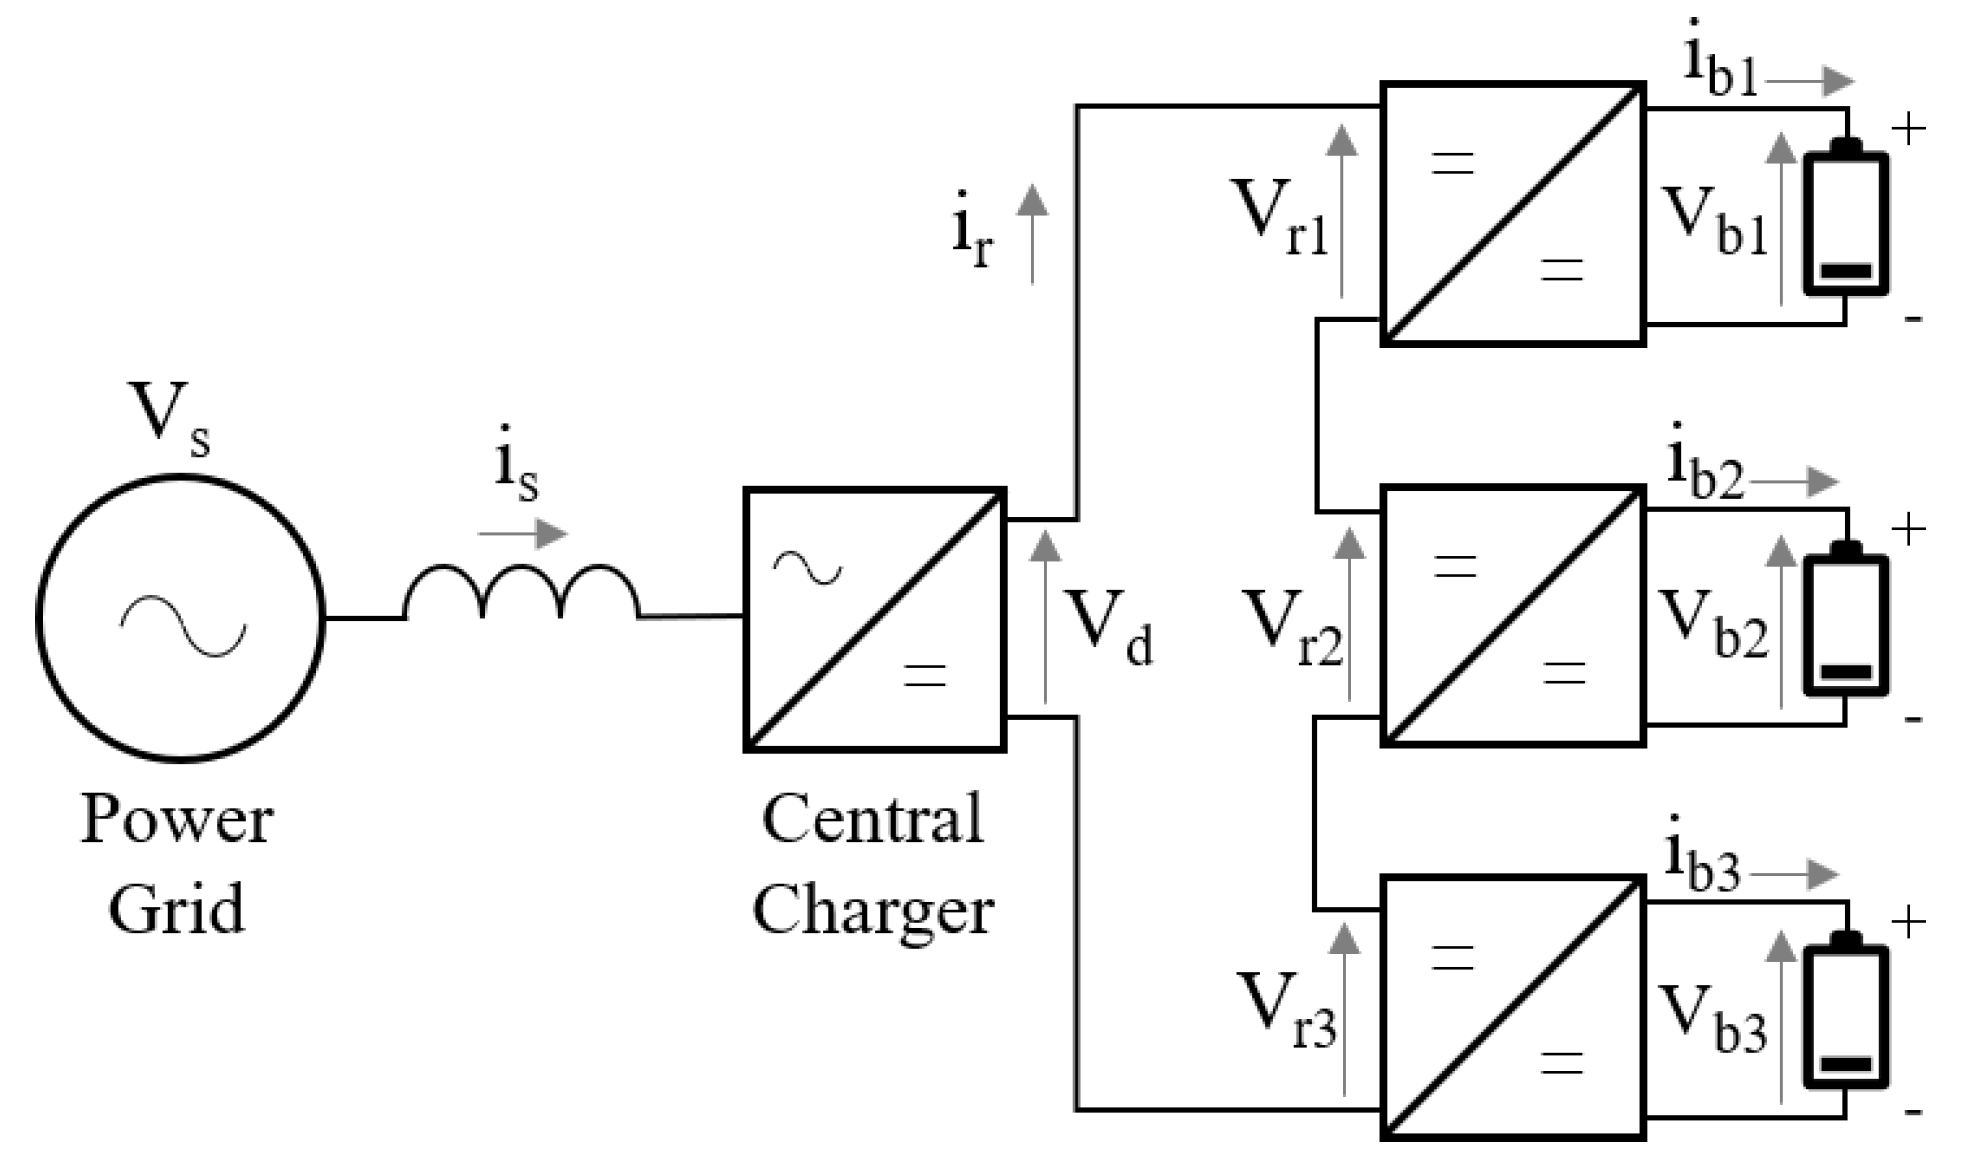
The battery bank chargers are usually classified into two sorts: central and modular [
48]. Due to the large number of battery cells in a bank, the central charger configuration is a common choice. The problem related to this approach is that the central charger sees the bank as a set of battery cells considering them as a large equivalent battery and then lacking the flexibility to handle each battery unit individually to apply different charge and discharge profiles. Modular chargers as shown in
Figure 7 consider the difference among the battery units and then coordinated control can be applied to sustain optimal charge control for every battery unit.
The concept of modular charger with actively controlled units focuses on the particular characteristics of the batteries [
49]. With this approach, each battery is associated with its own power flow controller, which essentially consists of a bidirectional DC–DC converter.
Joining a battery to its own DC–DC converter results in an electronified battery capable of being individually controlled, regardless of the existing connections in the whole string. This electronified battery can behave as a local active energy storage device, being independently controlled according to their respective states of charge and degradation.
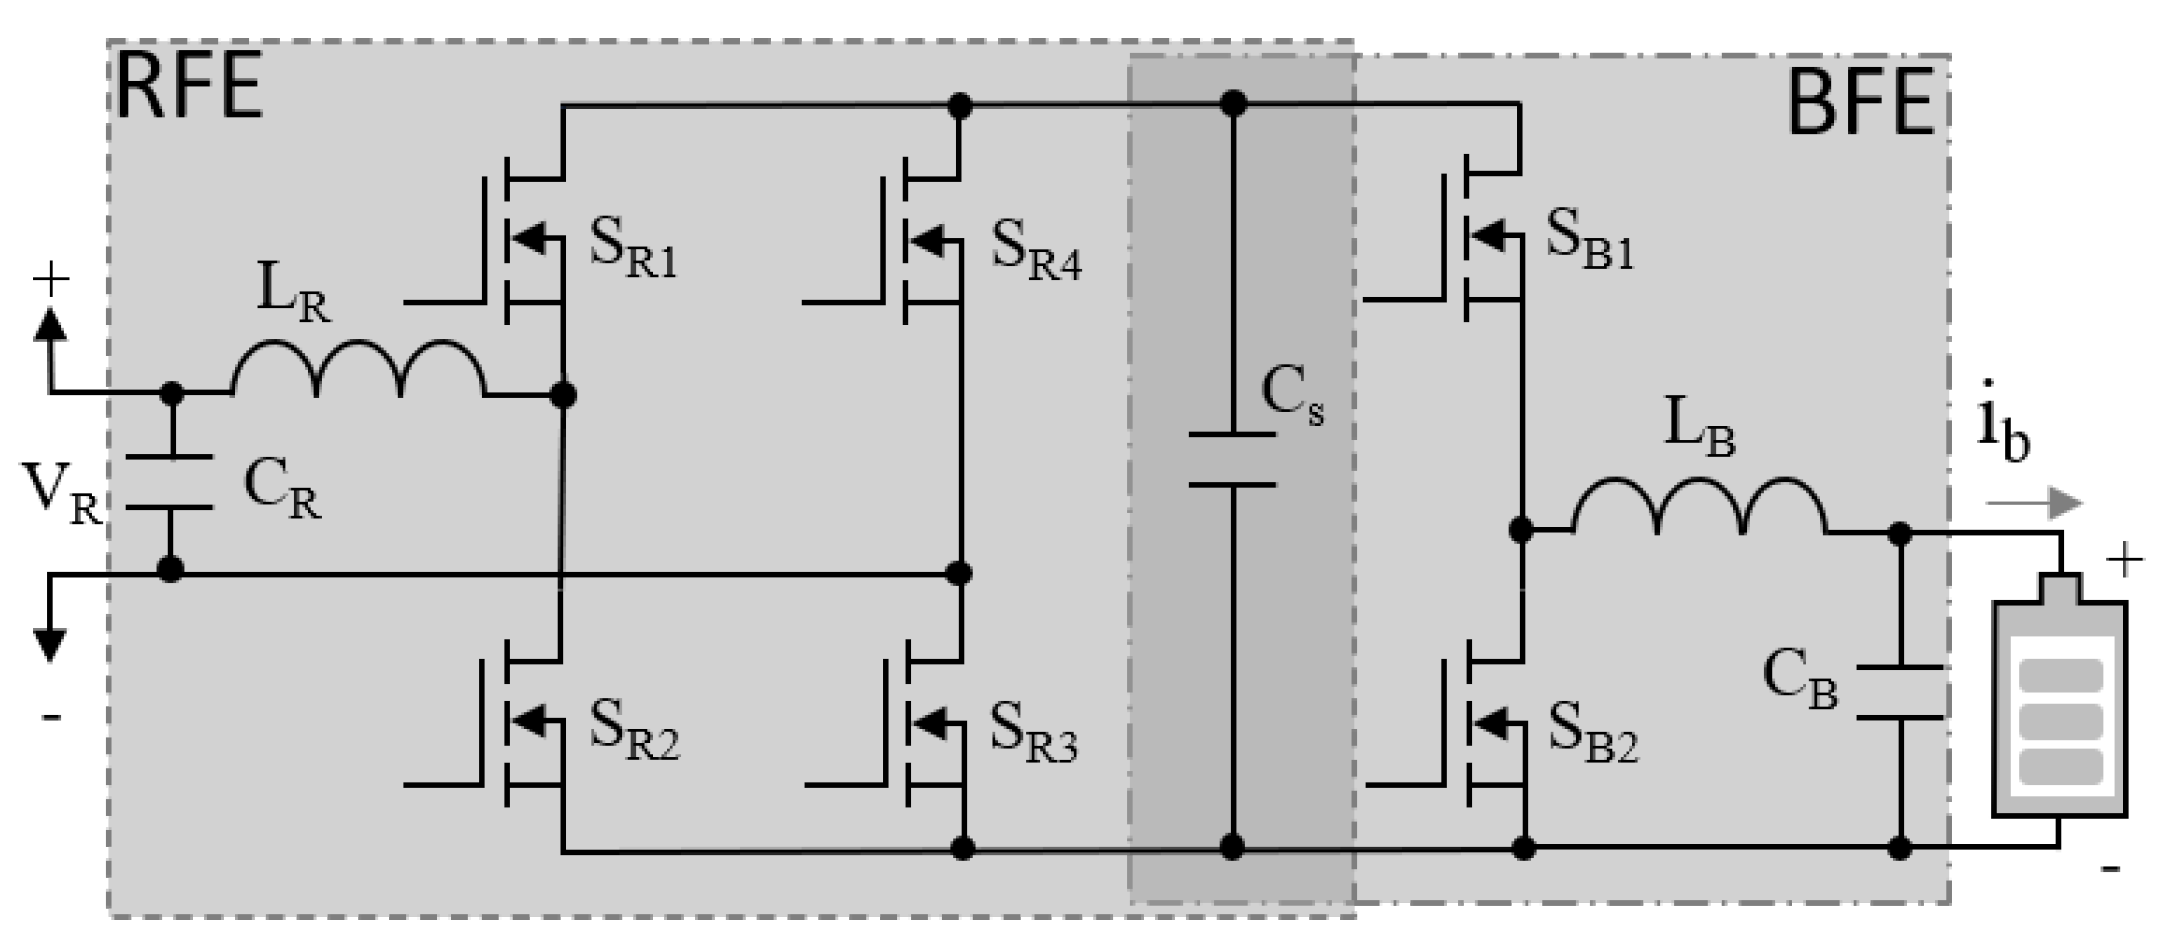
4.2. The Local Converter Power Hardware
Figure 8 shows the schematic diagram for the power hardware used in the local converter. The topology, implemented in the bench test prototype, is composed of two DC–DC converters, named Rectifier Front-End (RFE) and Battery Front-End (BFE). These power converters operate together, aiming at full utilization of each battery in the storage system. The voltage presented to the bank must be decoupled from the chemical battery current. This way, the storage element Cs interfaces the two rectifiers, allowing one of them to act on the terminal voltage (
) and the other to control the effective battery current (
). The power components of the assembled hardware are listed in
Table 4.
The BFE converter, highlighted in
Figure 8, uses the half-bridge Buck–Boost topology with bidirectional current capability. The Buck effect is exerted when the electric current flows from the DC bus to the battery, while the Boost effect corresponds to the current flowing from the battery to the DC bus. This configuration was adopted mainly thanks to its compact power hardware and well-known control techniques.
The RFE converter, in turn, uses the full bridge Buck–Boost converter, adding a two-transistor leg to provide the voltage reference point. This degree of freedom makes it possible to supply or receive electrical power regardless of the current flow direction in the battery bank. Thus, by adjusting , it is possible to define the value of the current.
4.3. The Actively Controlled Battery Bank Prototype
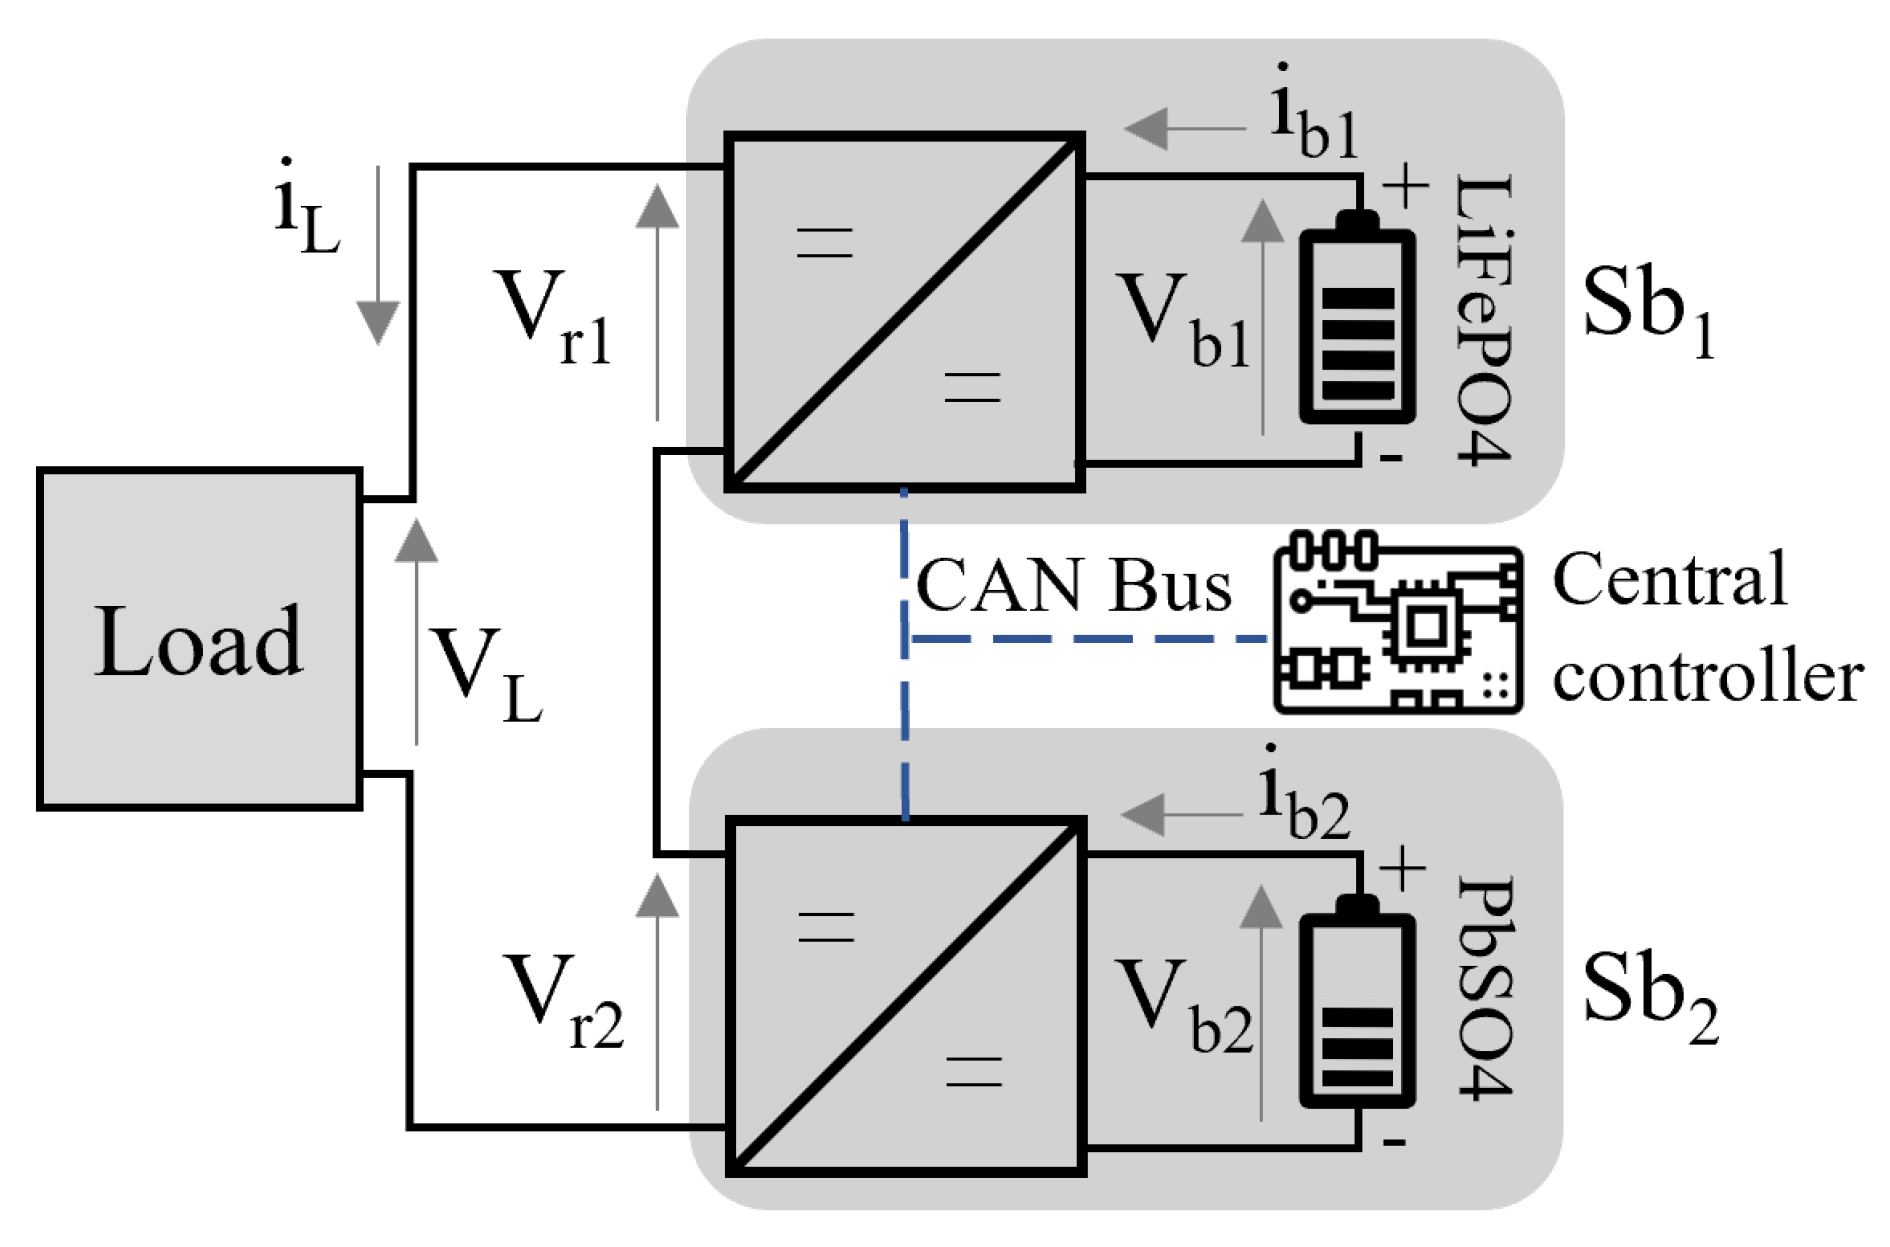
The proofs of concept for the proposed technology are demonstrated in this section using an experimental setup.
Figure 9 shows the test bench diagram where the modules
and
are formed by the eletrochemical batteries along with their power converters. These modules are connected to perform a series discharge operation. The RFE output voltages from each element,
and
, are the partial values of the
voltage applied to a dissipative load. In order to prove the effectiveness of the proposed strategy, batteries of different technologies, manufacturers and capacities were chosen, as described in
Table 5.
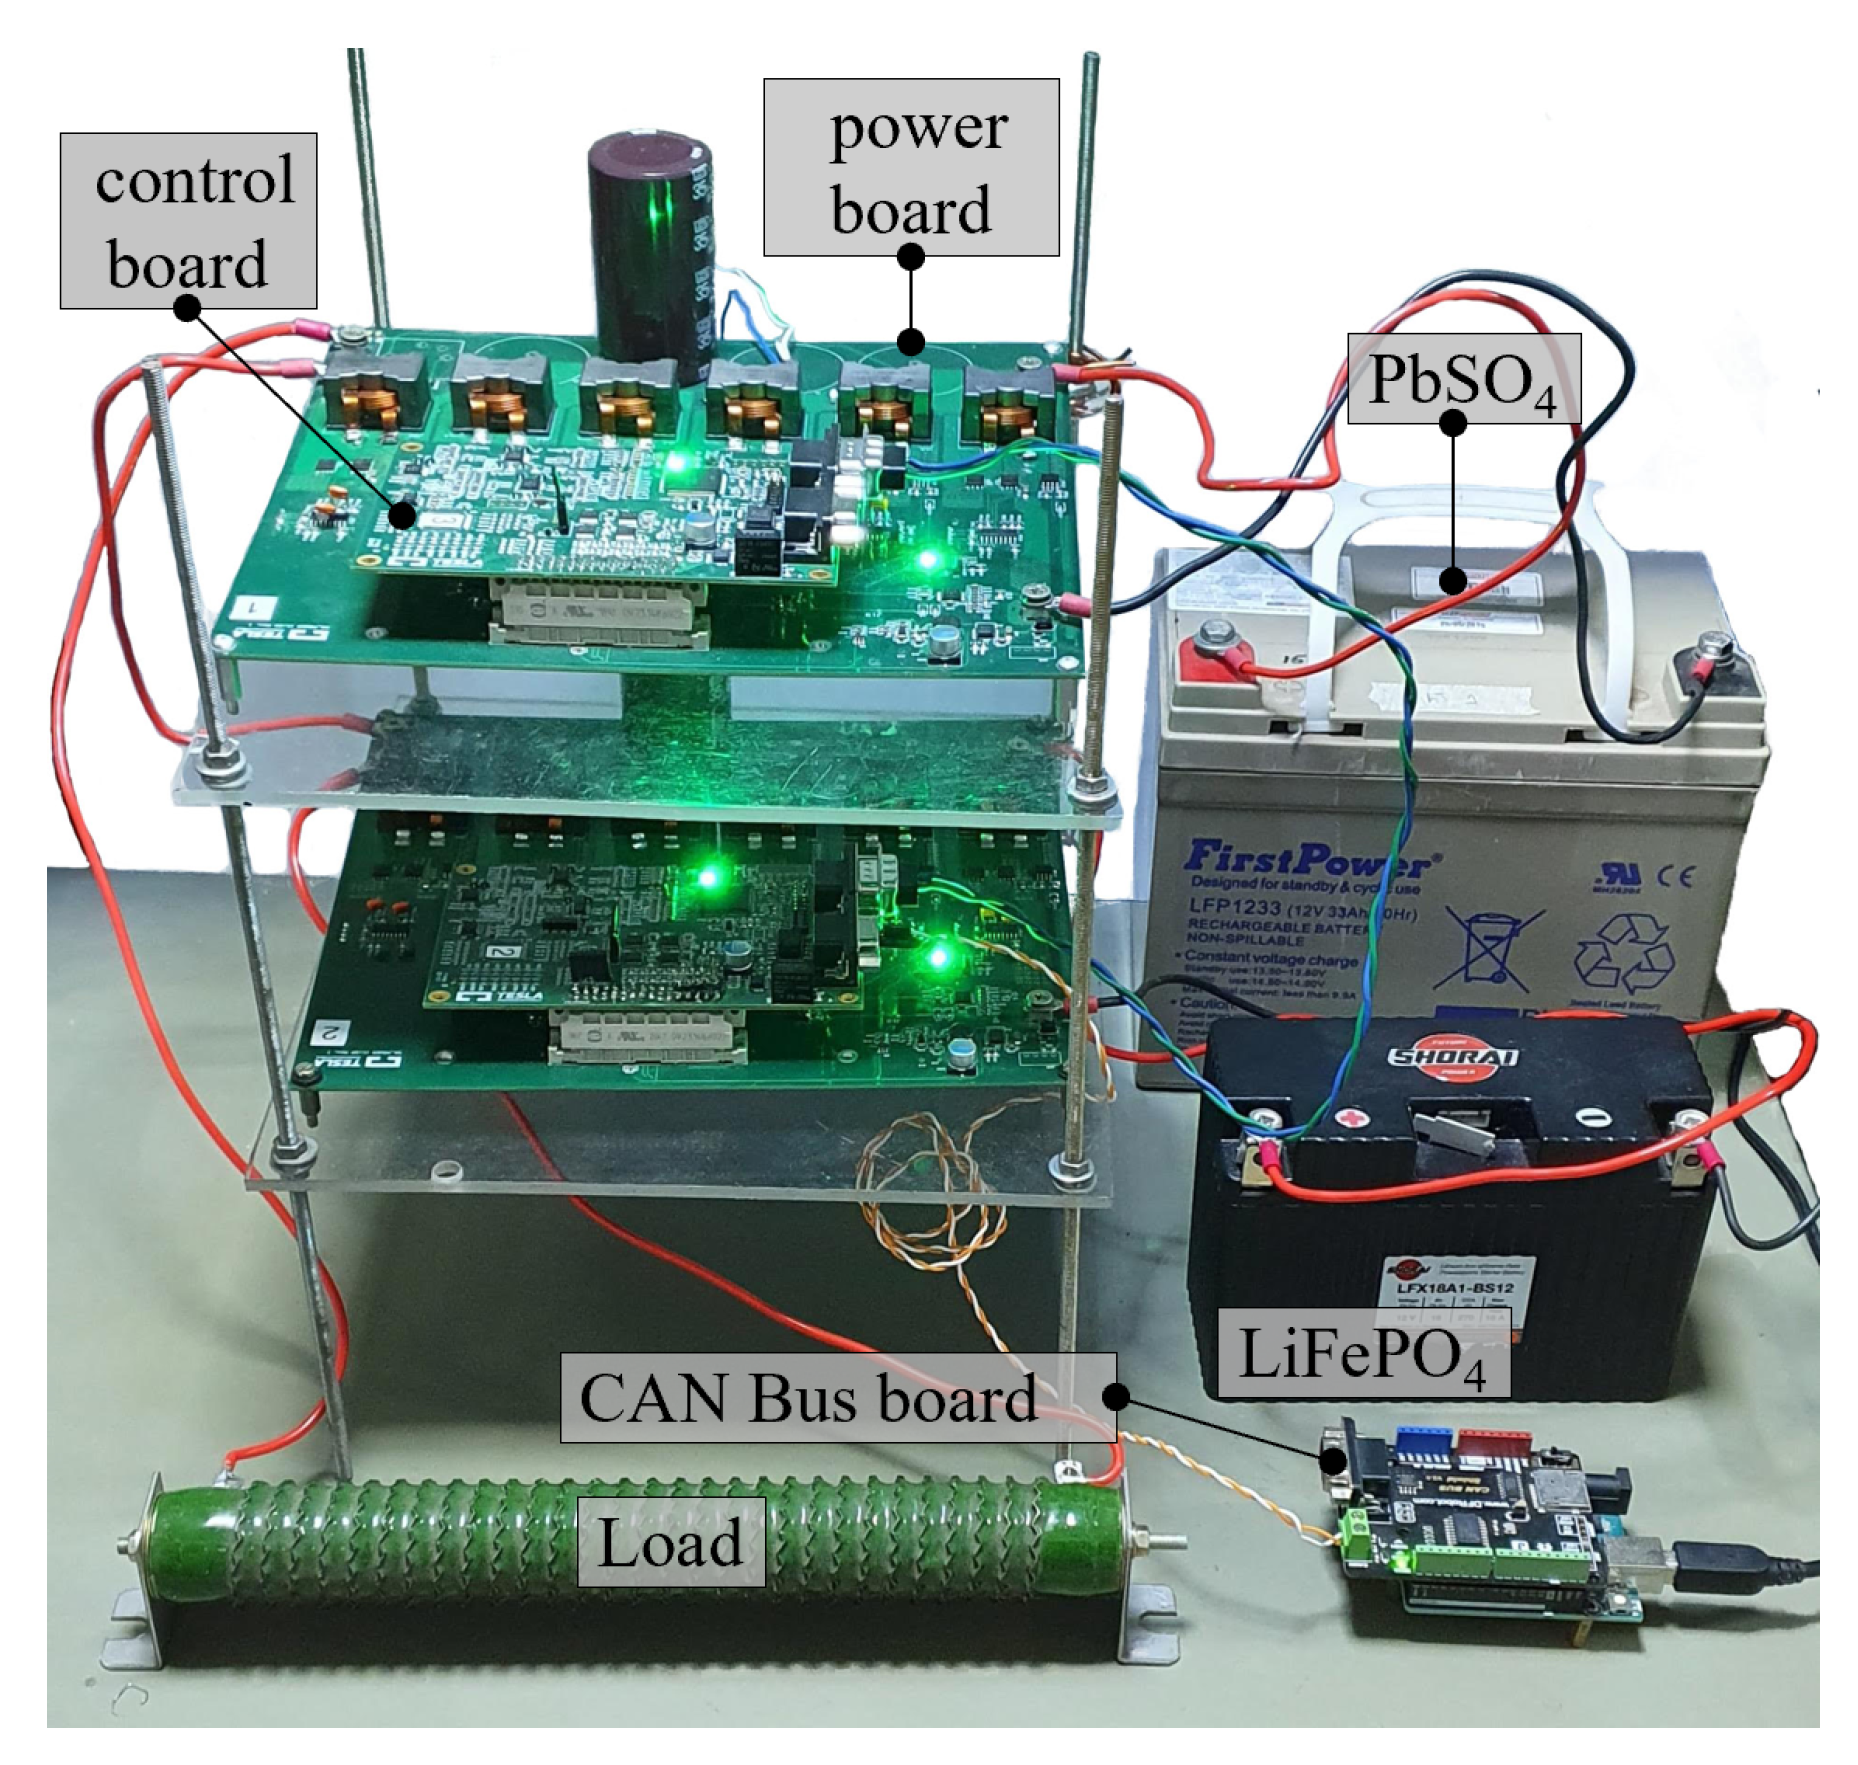
The assembled setup is shown in
Figure 10 highlighting the chemical batteries, control cards, power boards and dissipative load. Despite the convenient arrangement presented, most suitable for the bench testing, it is worth mentioning that the local control and power hardware were designed to be directly connected to the battery structure, giving rise to a single device with power flow control capability.
The system must cover the load requirements considering the mixed nature of this battery bank. The active battery modules exchange information with the central controller using the CAN bus as shown in
Figure 9. The voltage and current values from the batteries are sent to the controller, which returns values of RFE voltage setpoint depending on the individual battery SoC and SoH. The output power is maintained constant, with fixed
and
. Thus, as the RFE voltage increases in one module, the other must decrease.
As can be noticed from
Table 5, the lithium battery (LiFePO
4) has approximately half the rated capacity of the lead-acid battery (PbSO
4). The system needs to adjust each battery power flow according to its present capacity. This requires different electrical current values for each battery in the bank arrangement.
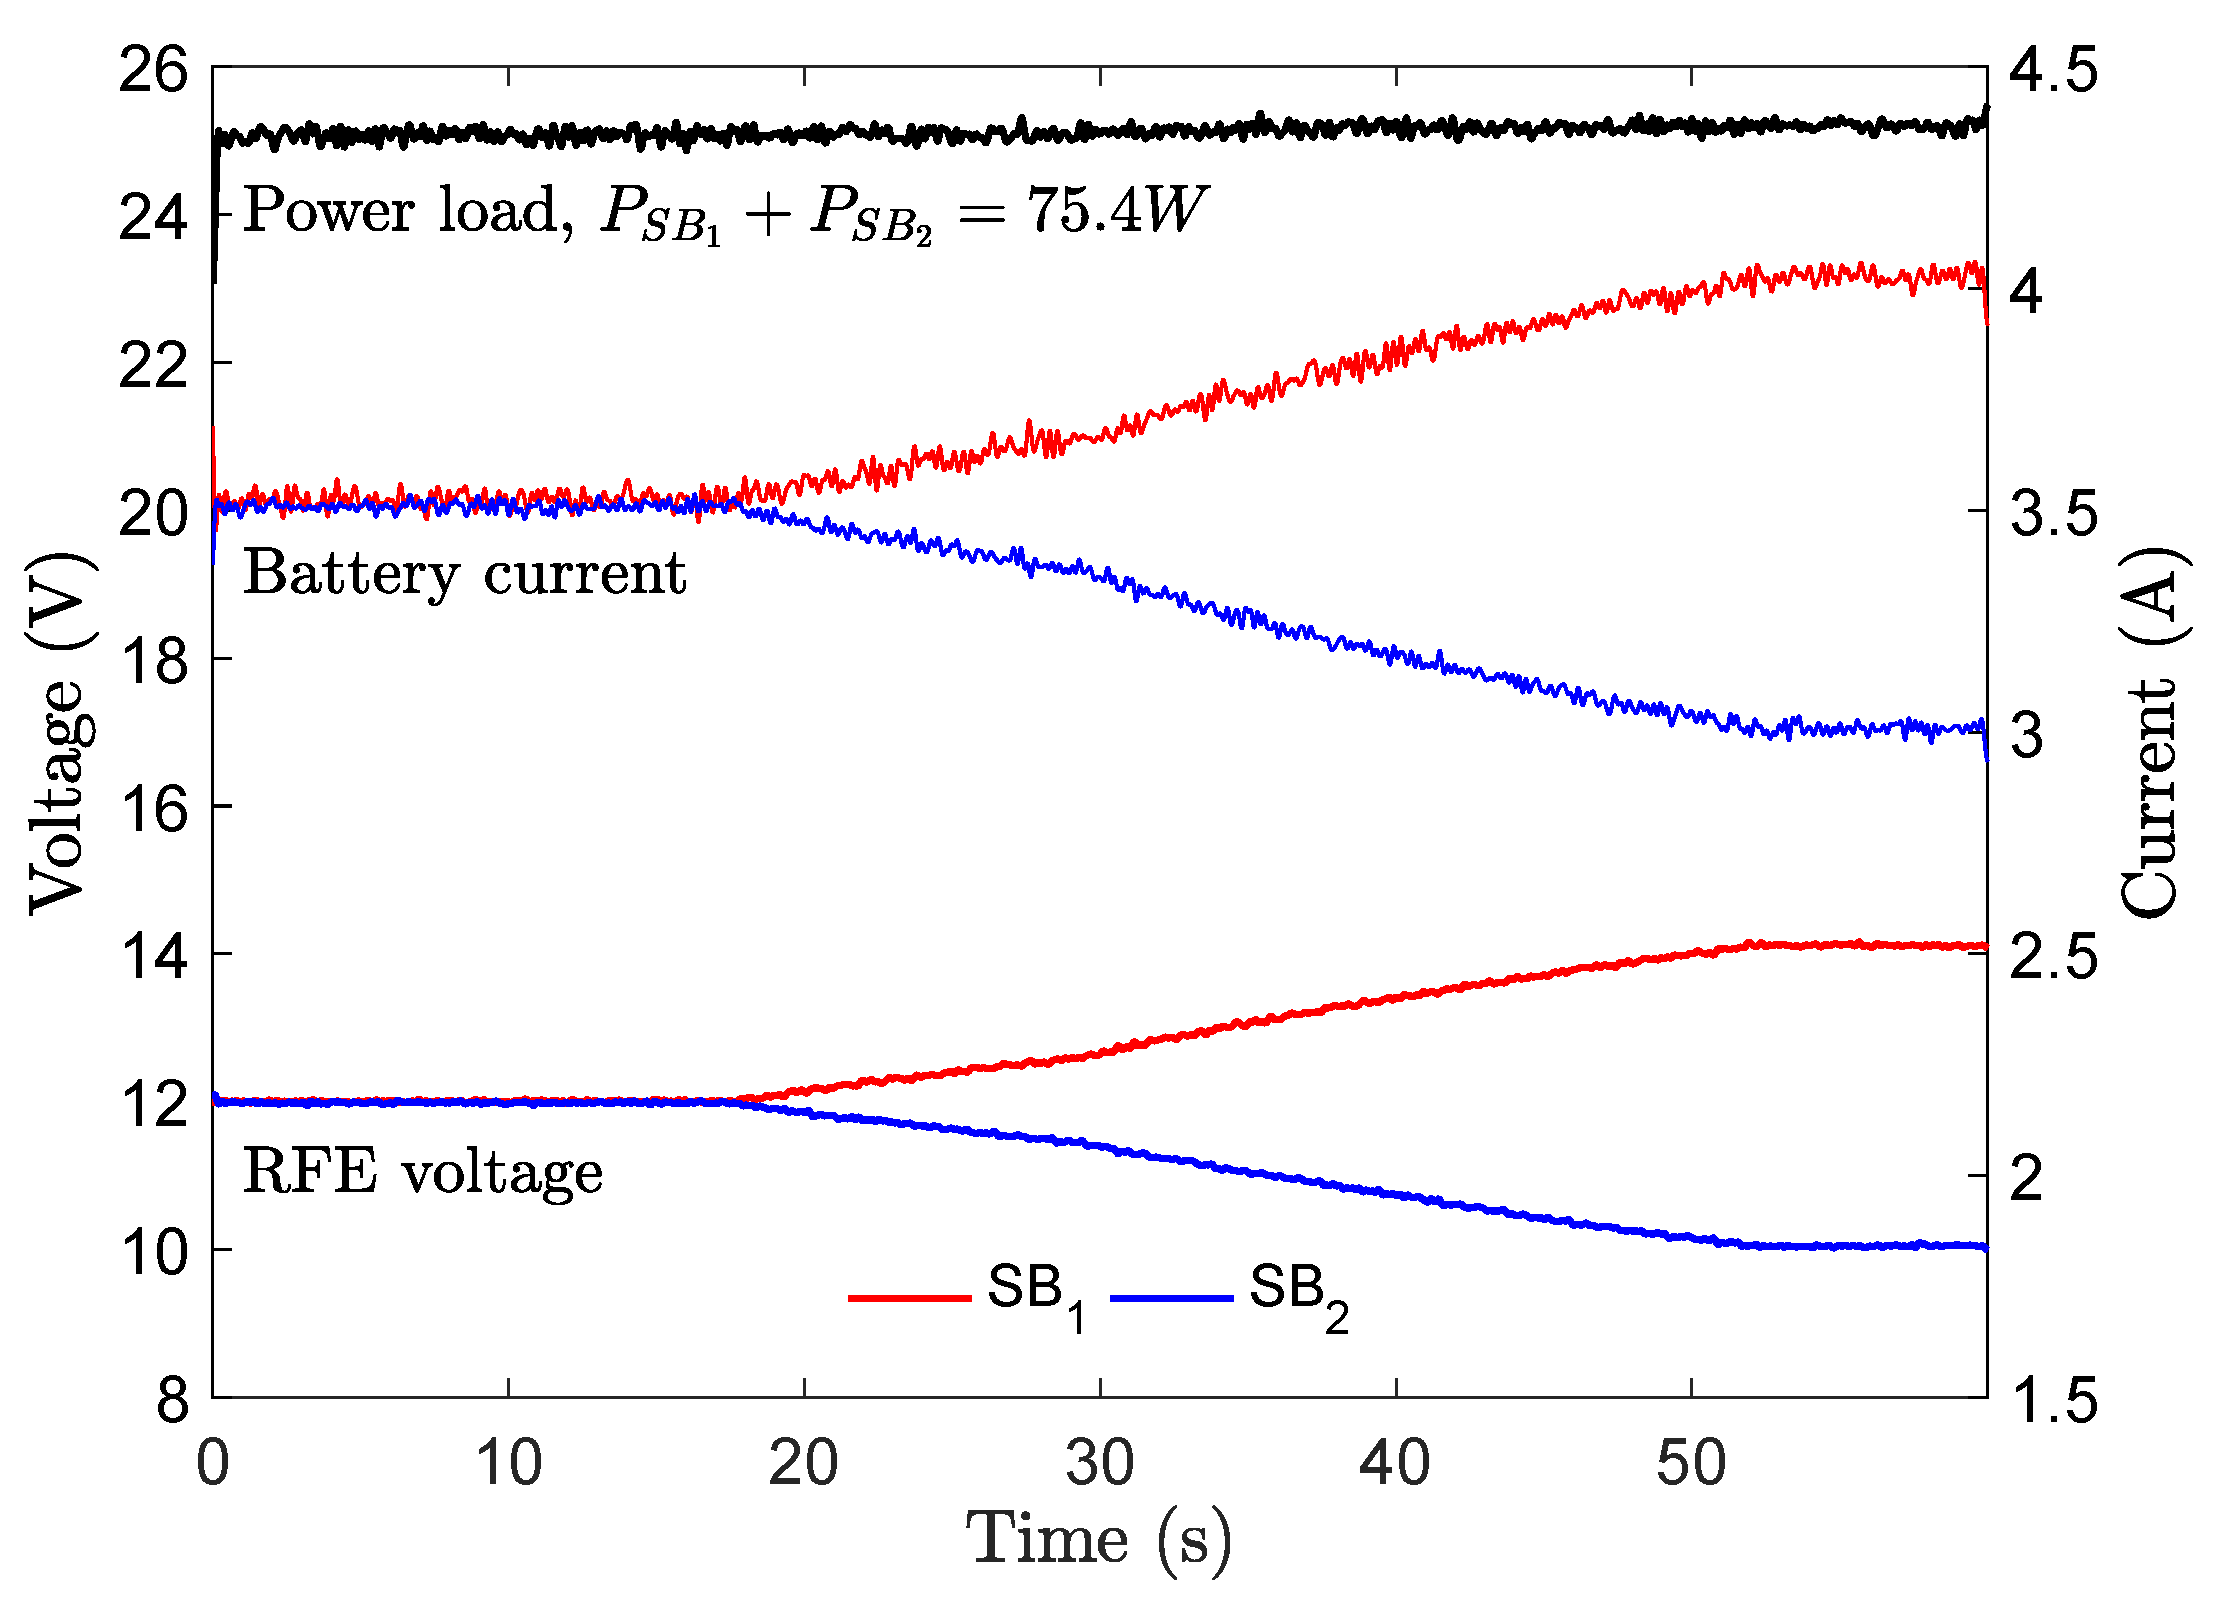
Figure 11 shows the experimental results of the proposed setup during the discharging process.
The system starts by drawing the same current from each battery ( = ). Possible differences in the state of charge of the batteries will certainly be reflected in the values of their terminal voltages ( and ). Despite this, the output voltages of the active modules ( and ) are kept constant at 12 V. From 18 s onwards, each battery starts supplying a proper value of electric current, causing new output voltage references for its RFE converter. As the power flowing to the load stays constant, the power share of each battery changes accordingly.
5. Computational Simulation Results
In this section, the computational simulation results are presented for the developed models corresponding to the application illustrated in
Figure 3. The system was modeled on the Matlab/Simulink
® simulation platform using specialized battery models from the Simscape
® toolboxes and embedded nested functions written by the authors. The Matlab Simscape
® battery models were customized considering each specific technology using the manufacturer’s data for the types listed in
Table 5. The initial capacities for the batteries are presented in
Table 6, considering a maximum dispersion of 8% from the rated capacity. According to reported studies in the literature, the dispersion in the battery capacities for newly installed banks can reach 10% of the rated capacity [
50].
Following the simulation protocol, the batteries are recharged during the day according to the annual solar radiation profile shown in
Figure 6. The whole recharge process can take between 6 and 9 h, depending on the seasonal conditions. When the recharge period is over, the system remains in standby waiting for the peak load time. Finally, the battery bank releases the stored energy, delivering a constant electrical current to the facility, thus smoothing the demand curve.
5.1. Storage System Based on Passively Connected Battery Bank
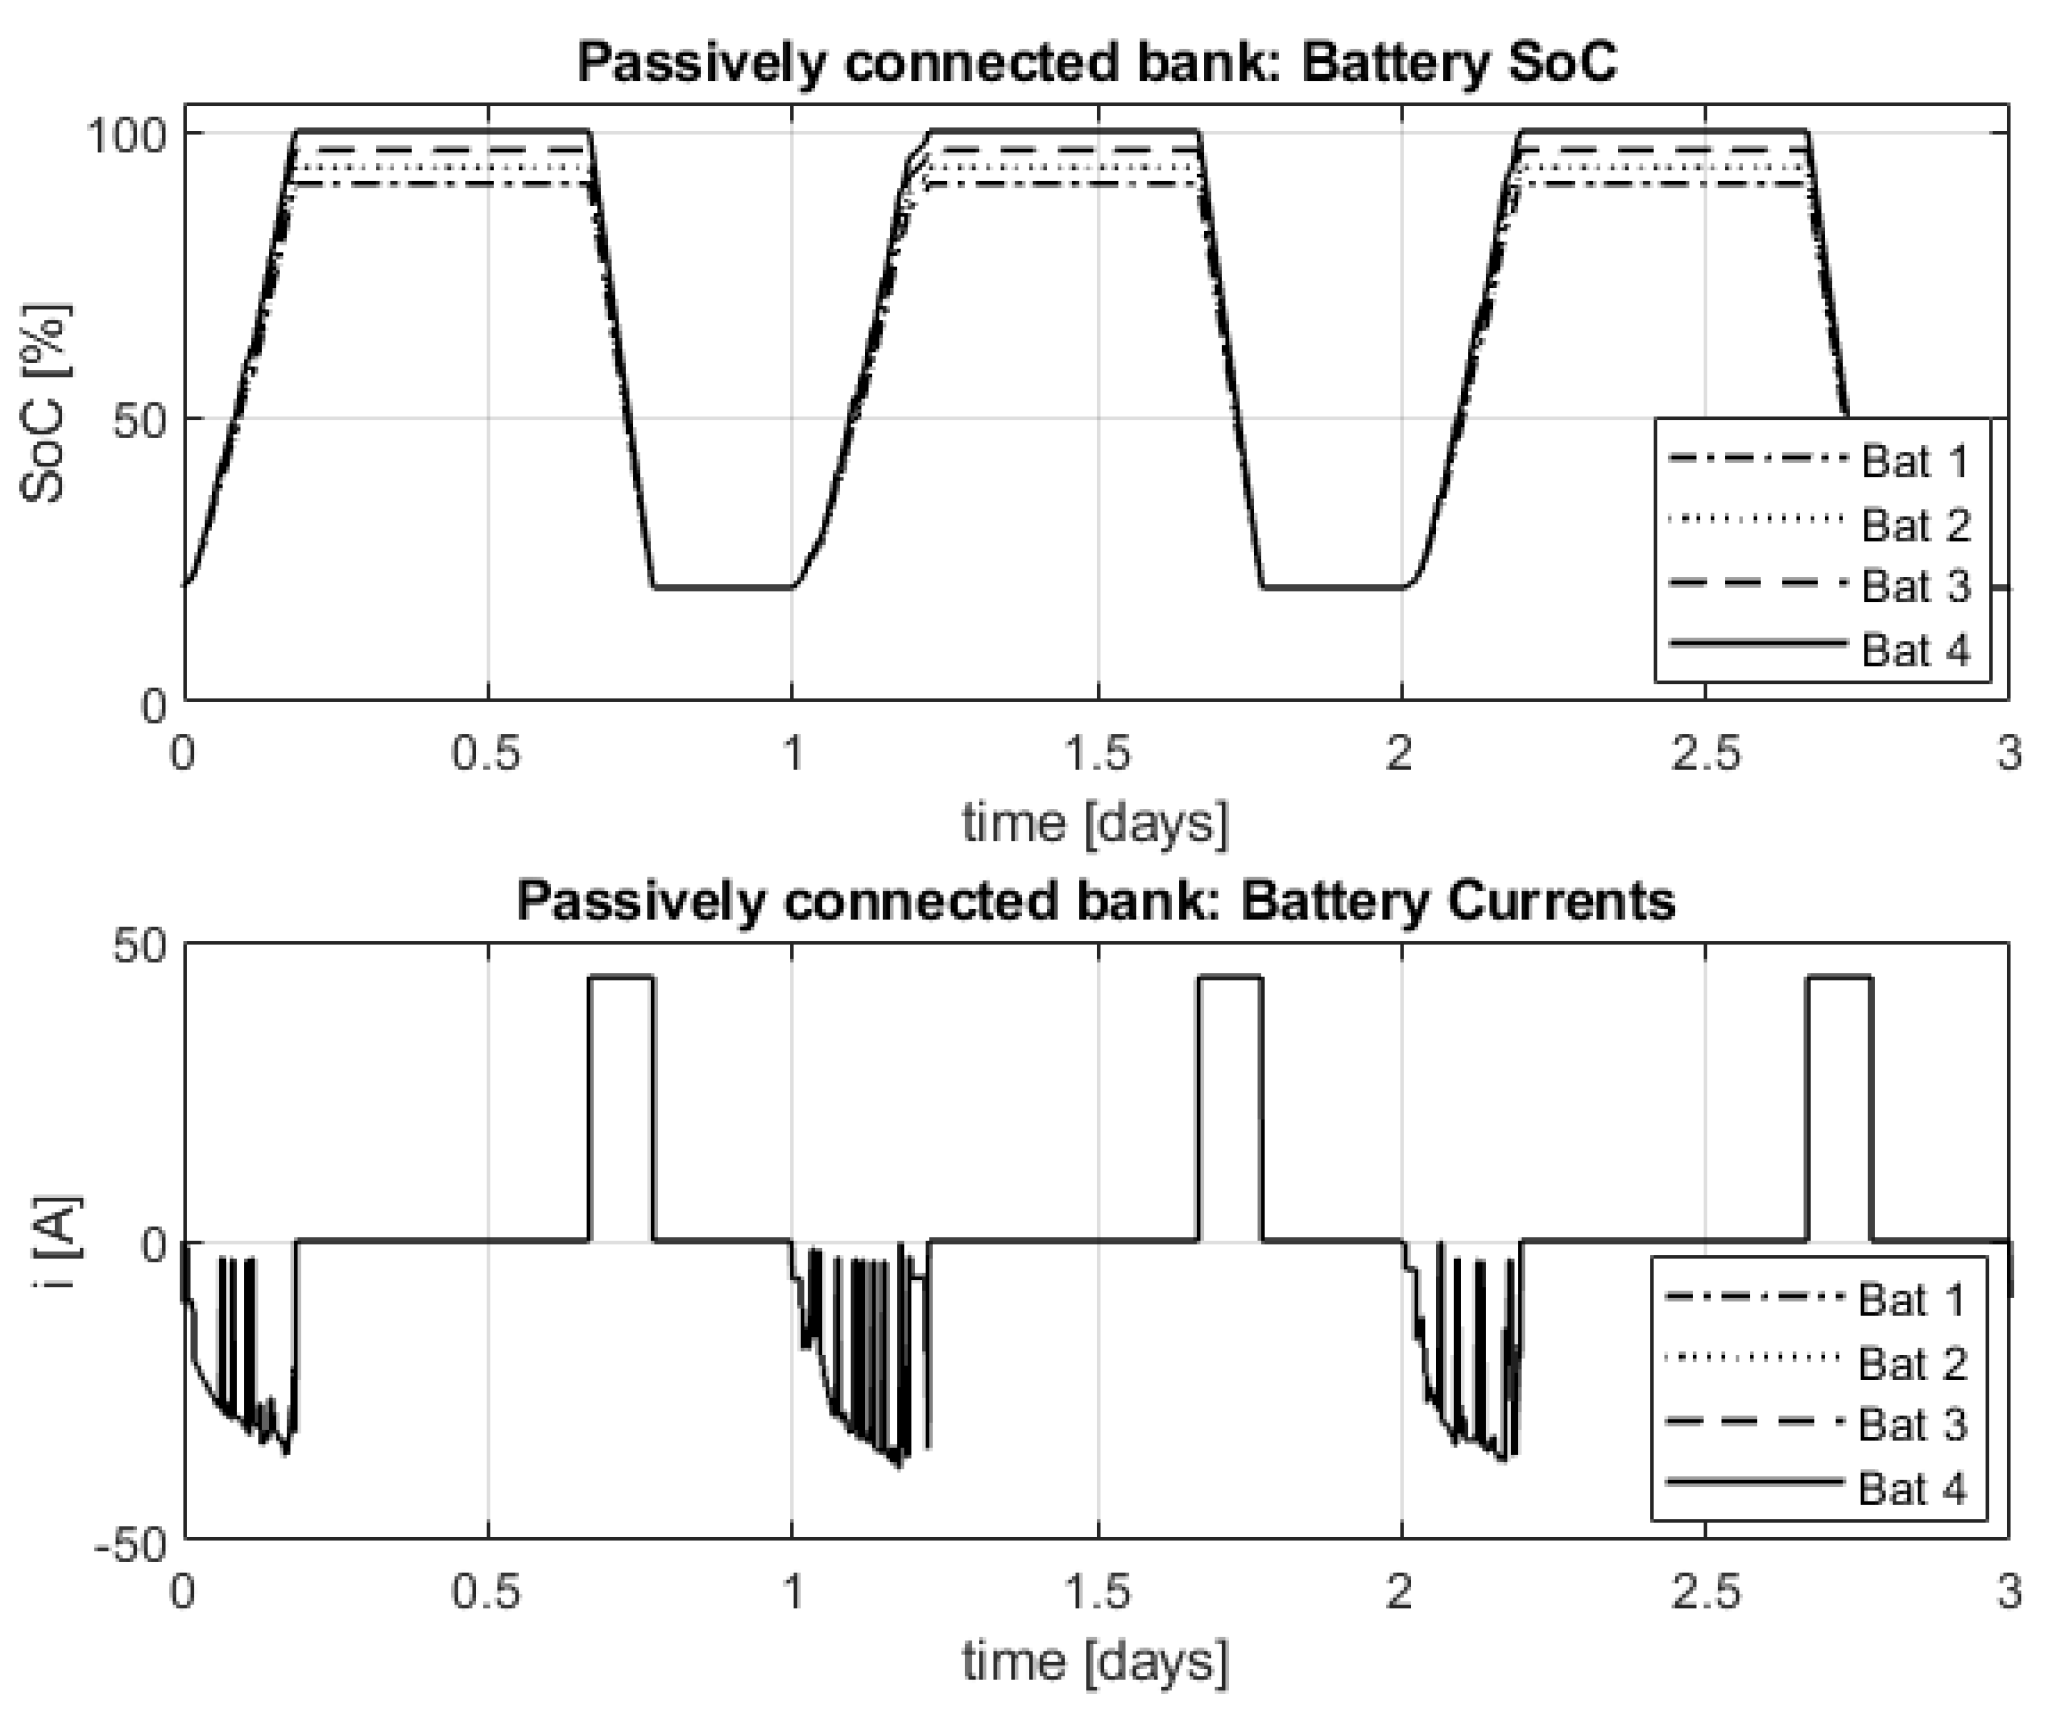
The first simulation results refer to the storage system formed by the battery model CLI150-12 passively connected, i.e., without the support of the bidirectional DC–DC power converter.
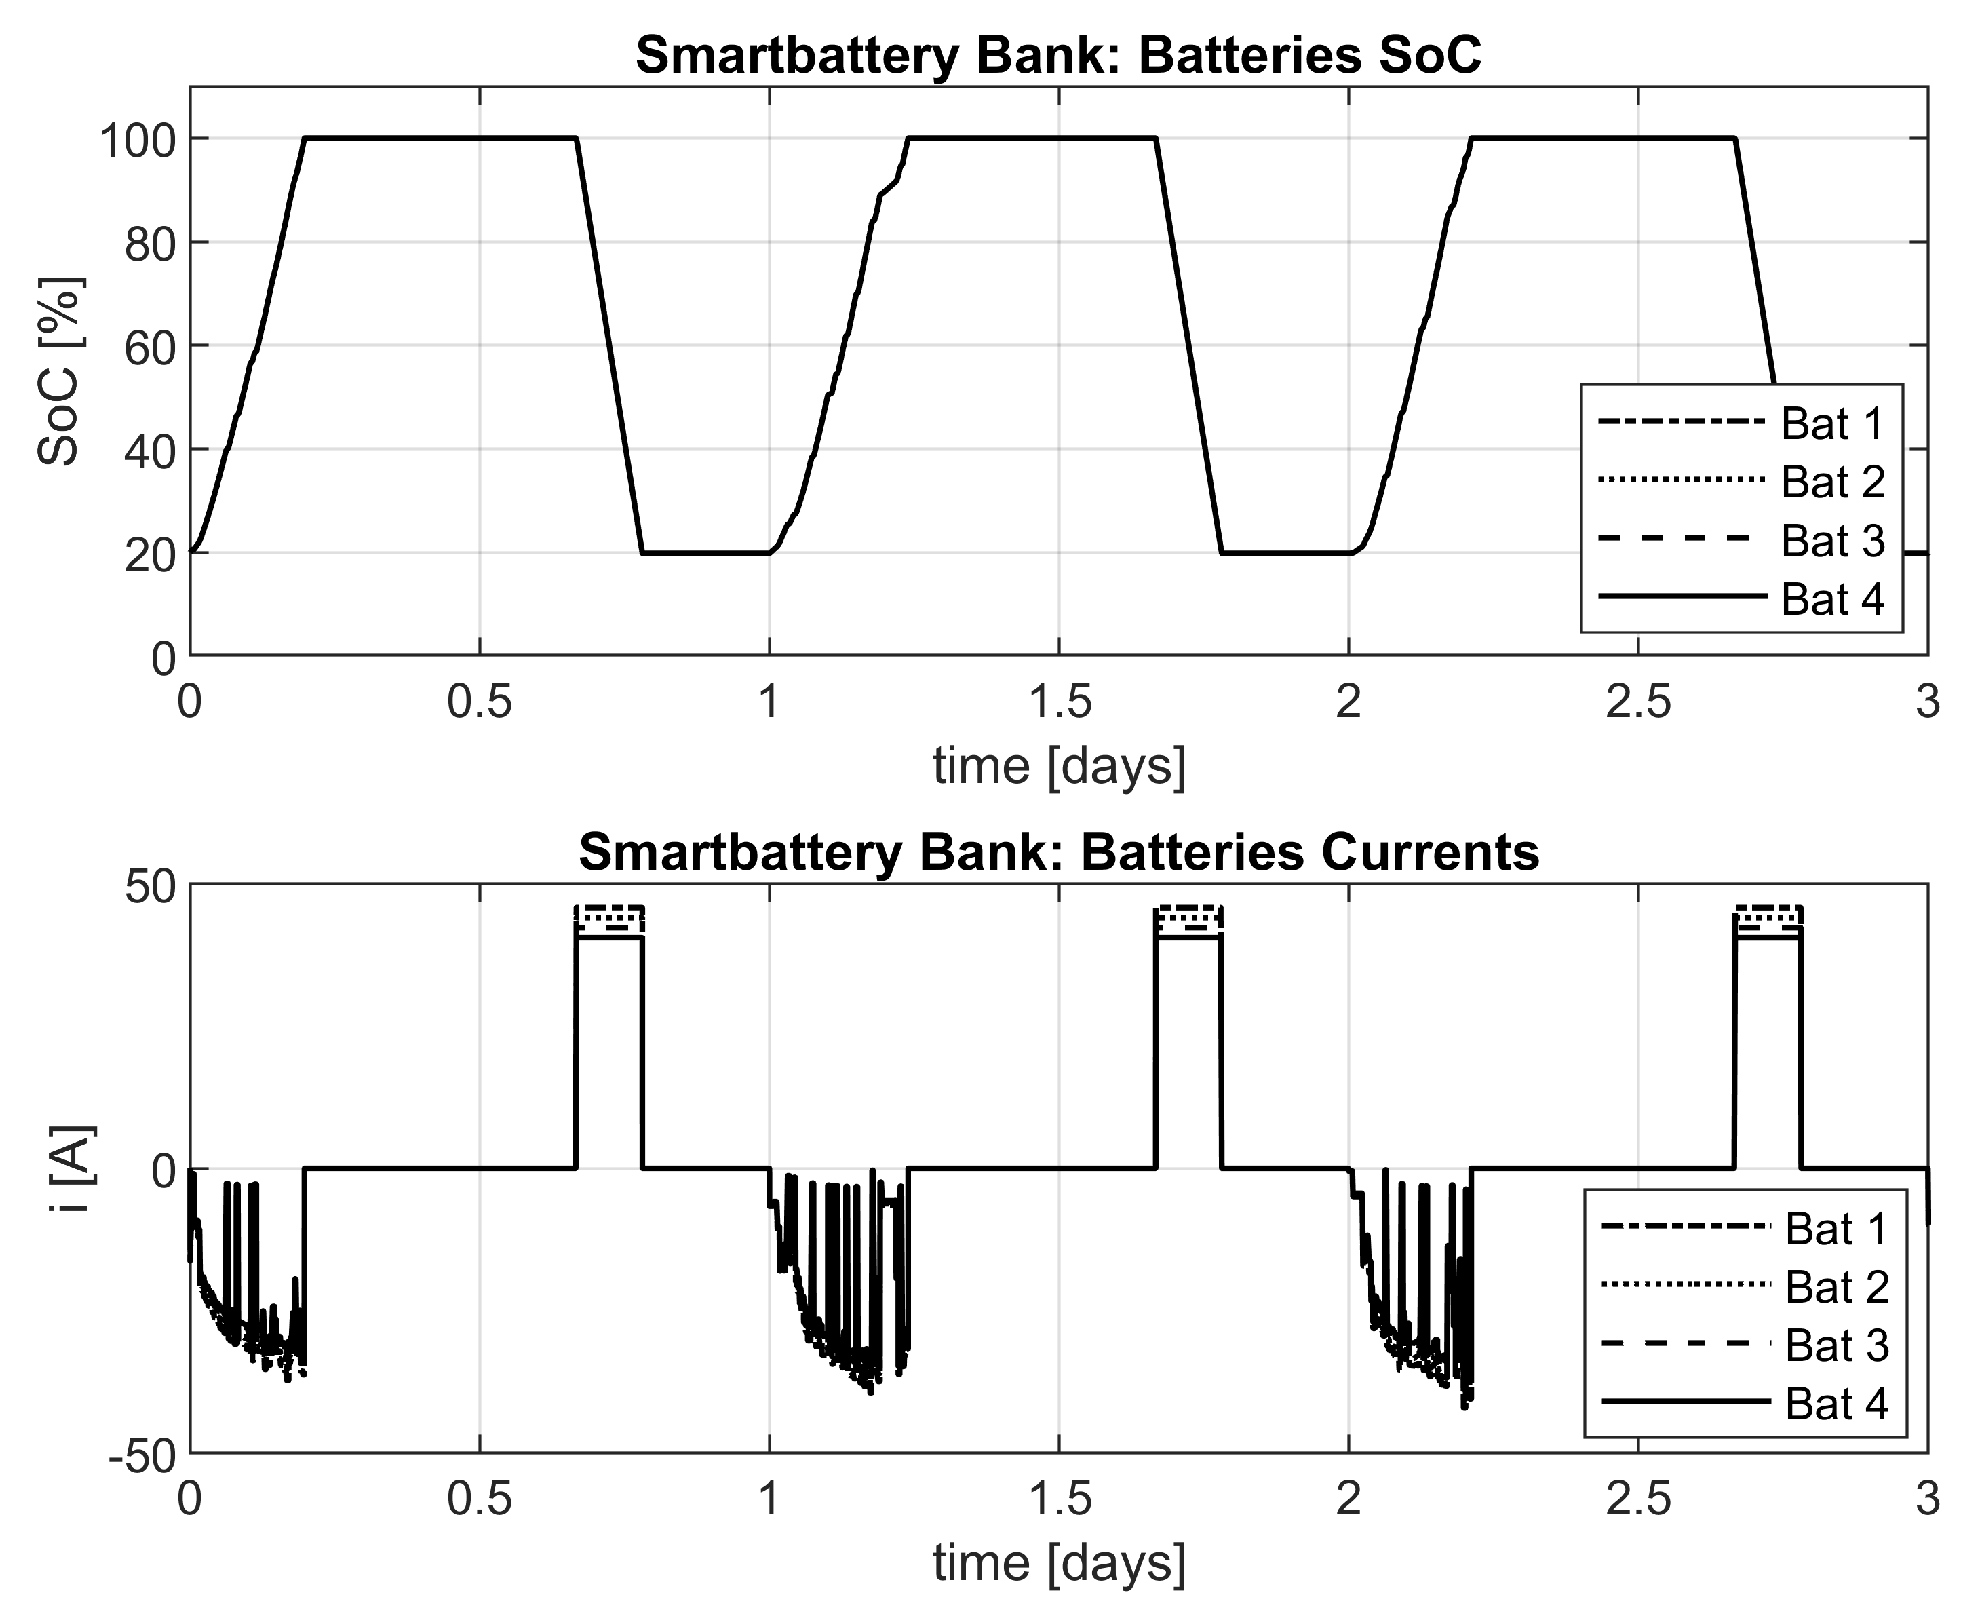
Figure 12 shows the currents and SoC profiles for the batteries during three complete daily cycles at 80% DoD. Once the current is the same for all the batteries, the recharging process must be interrupted when the lower capacity unit (Bat 4) reaches its full SoC. The underutilization of the system capacity can be noticed in the first work cycles. Similar results were obtained for the lead-acid battery model HZYSL12-230 at 50% DoD.
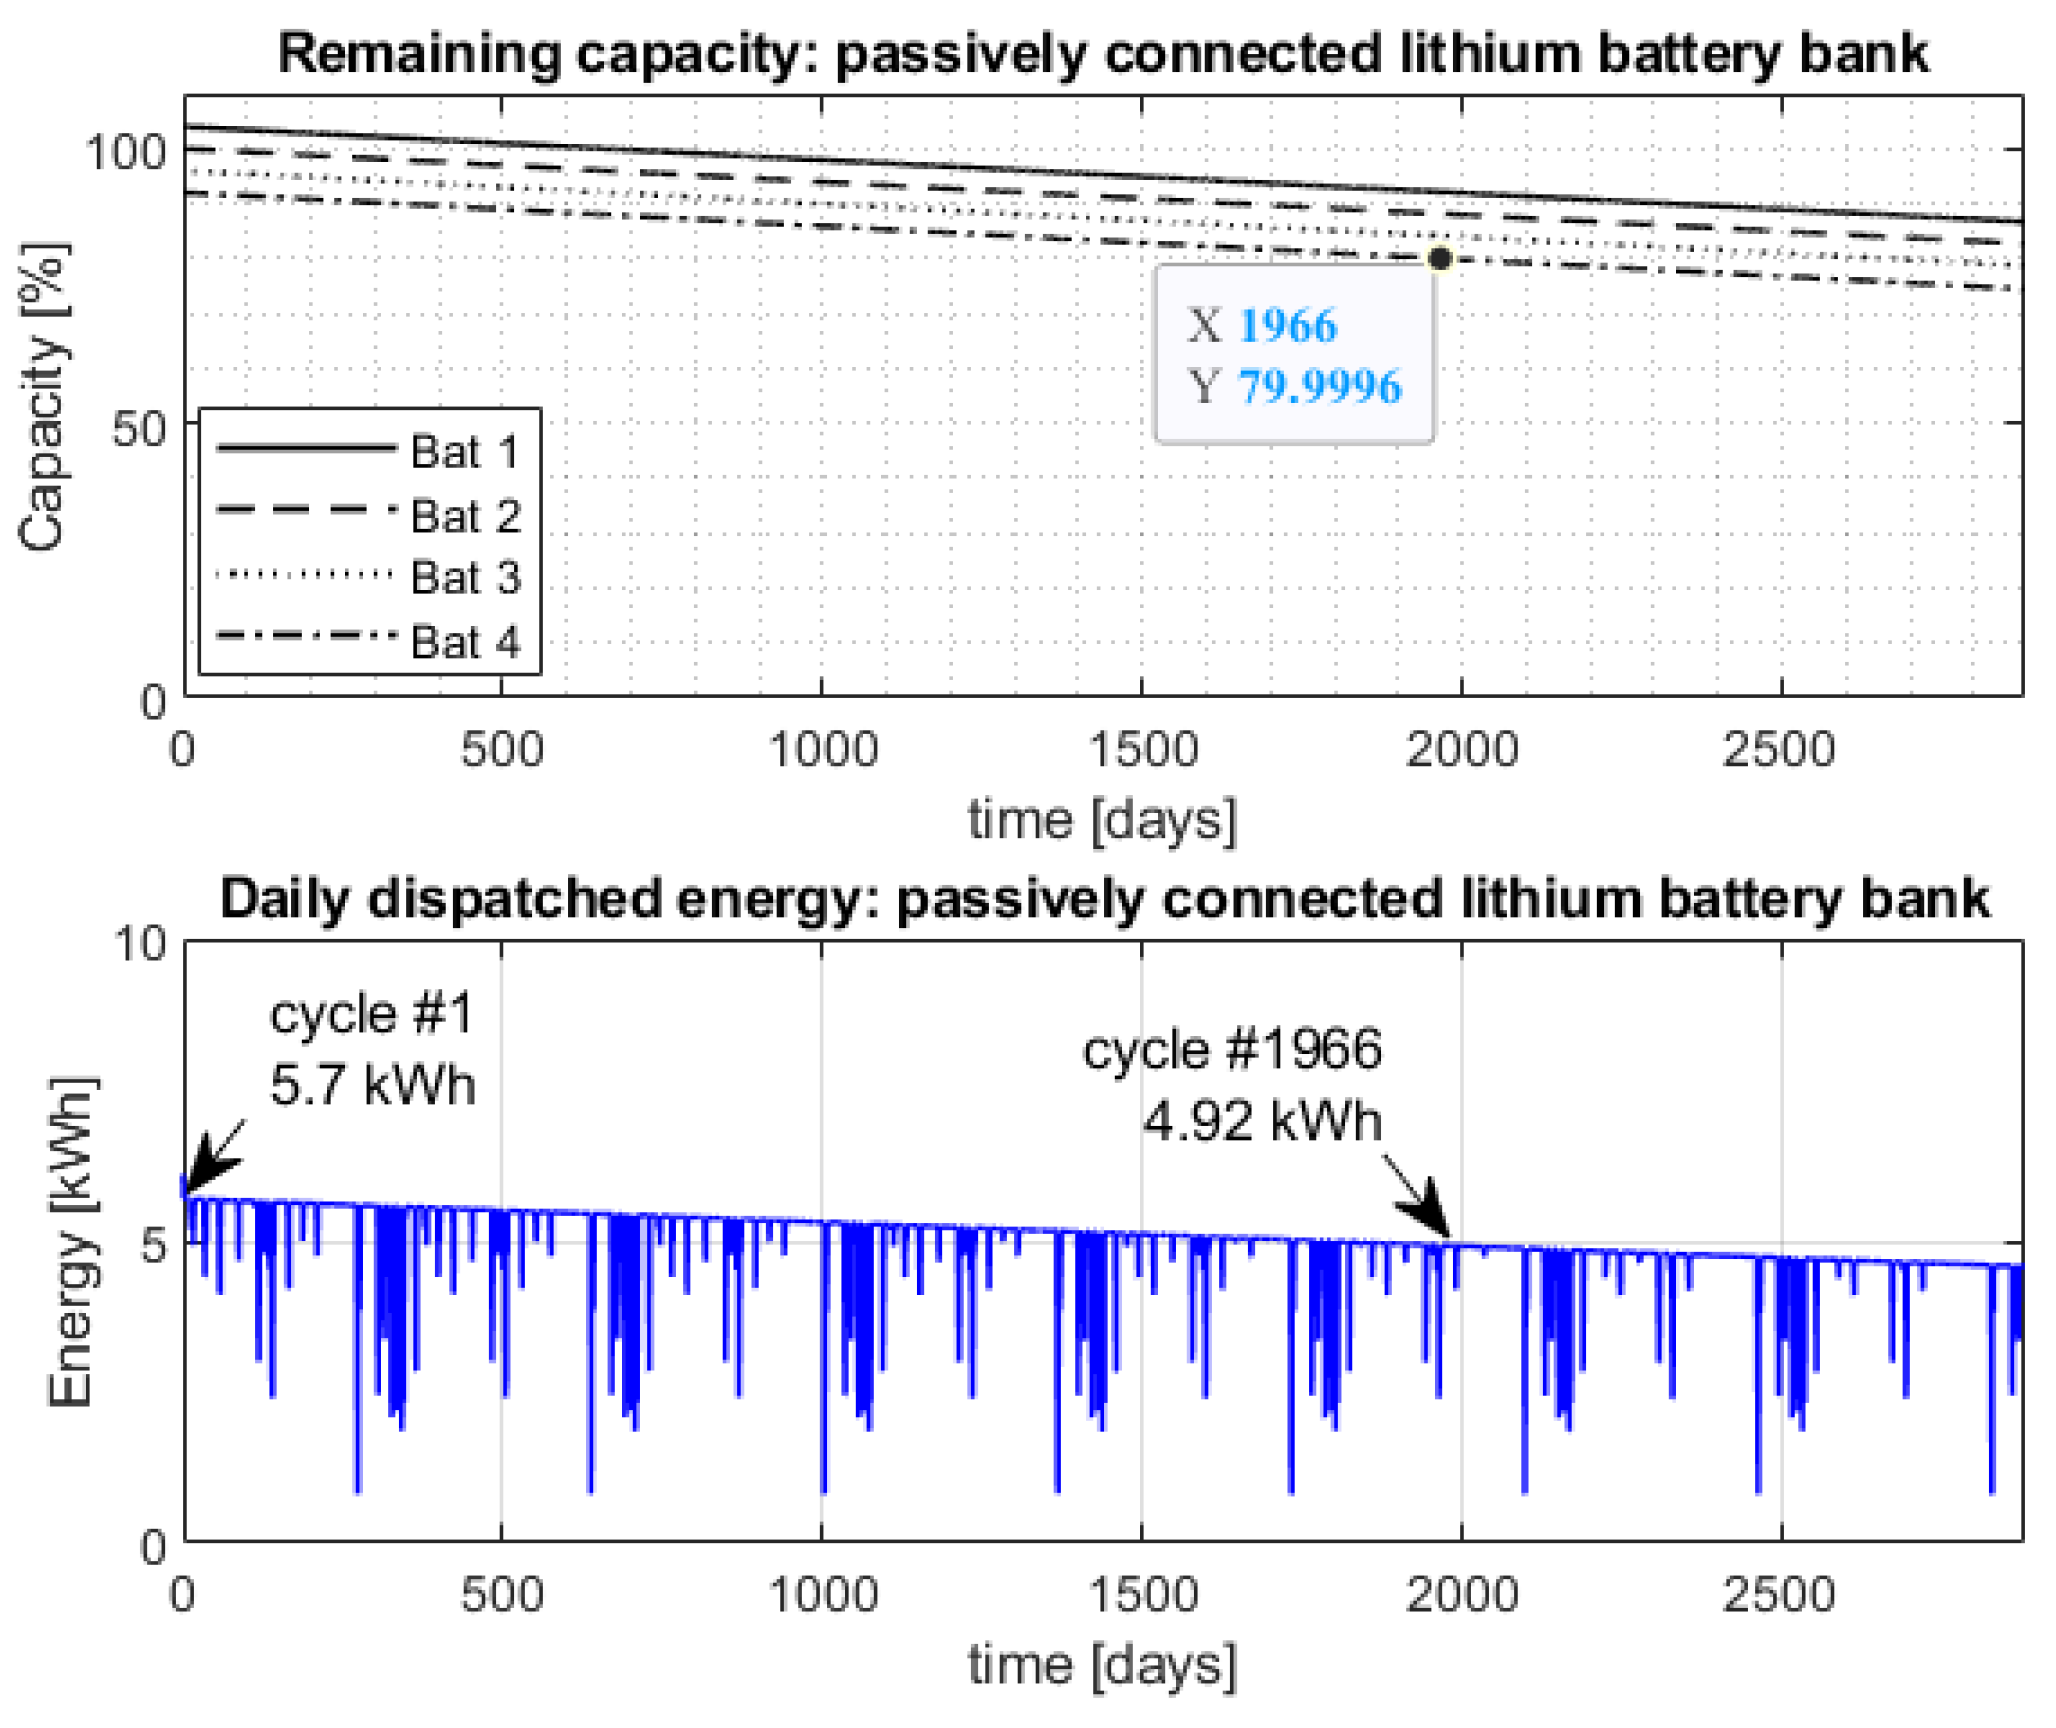
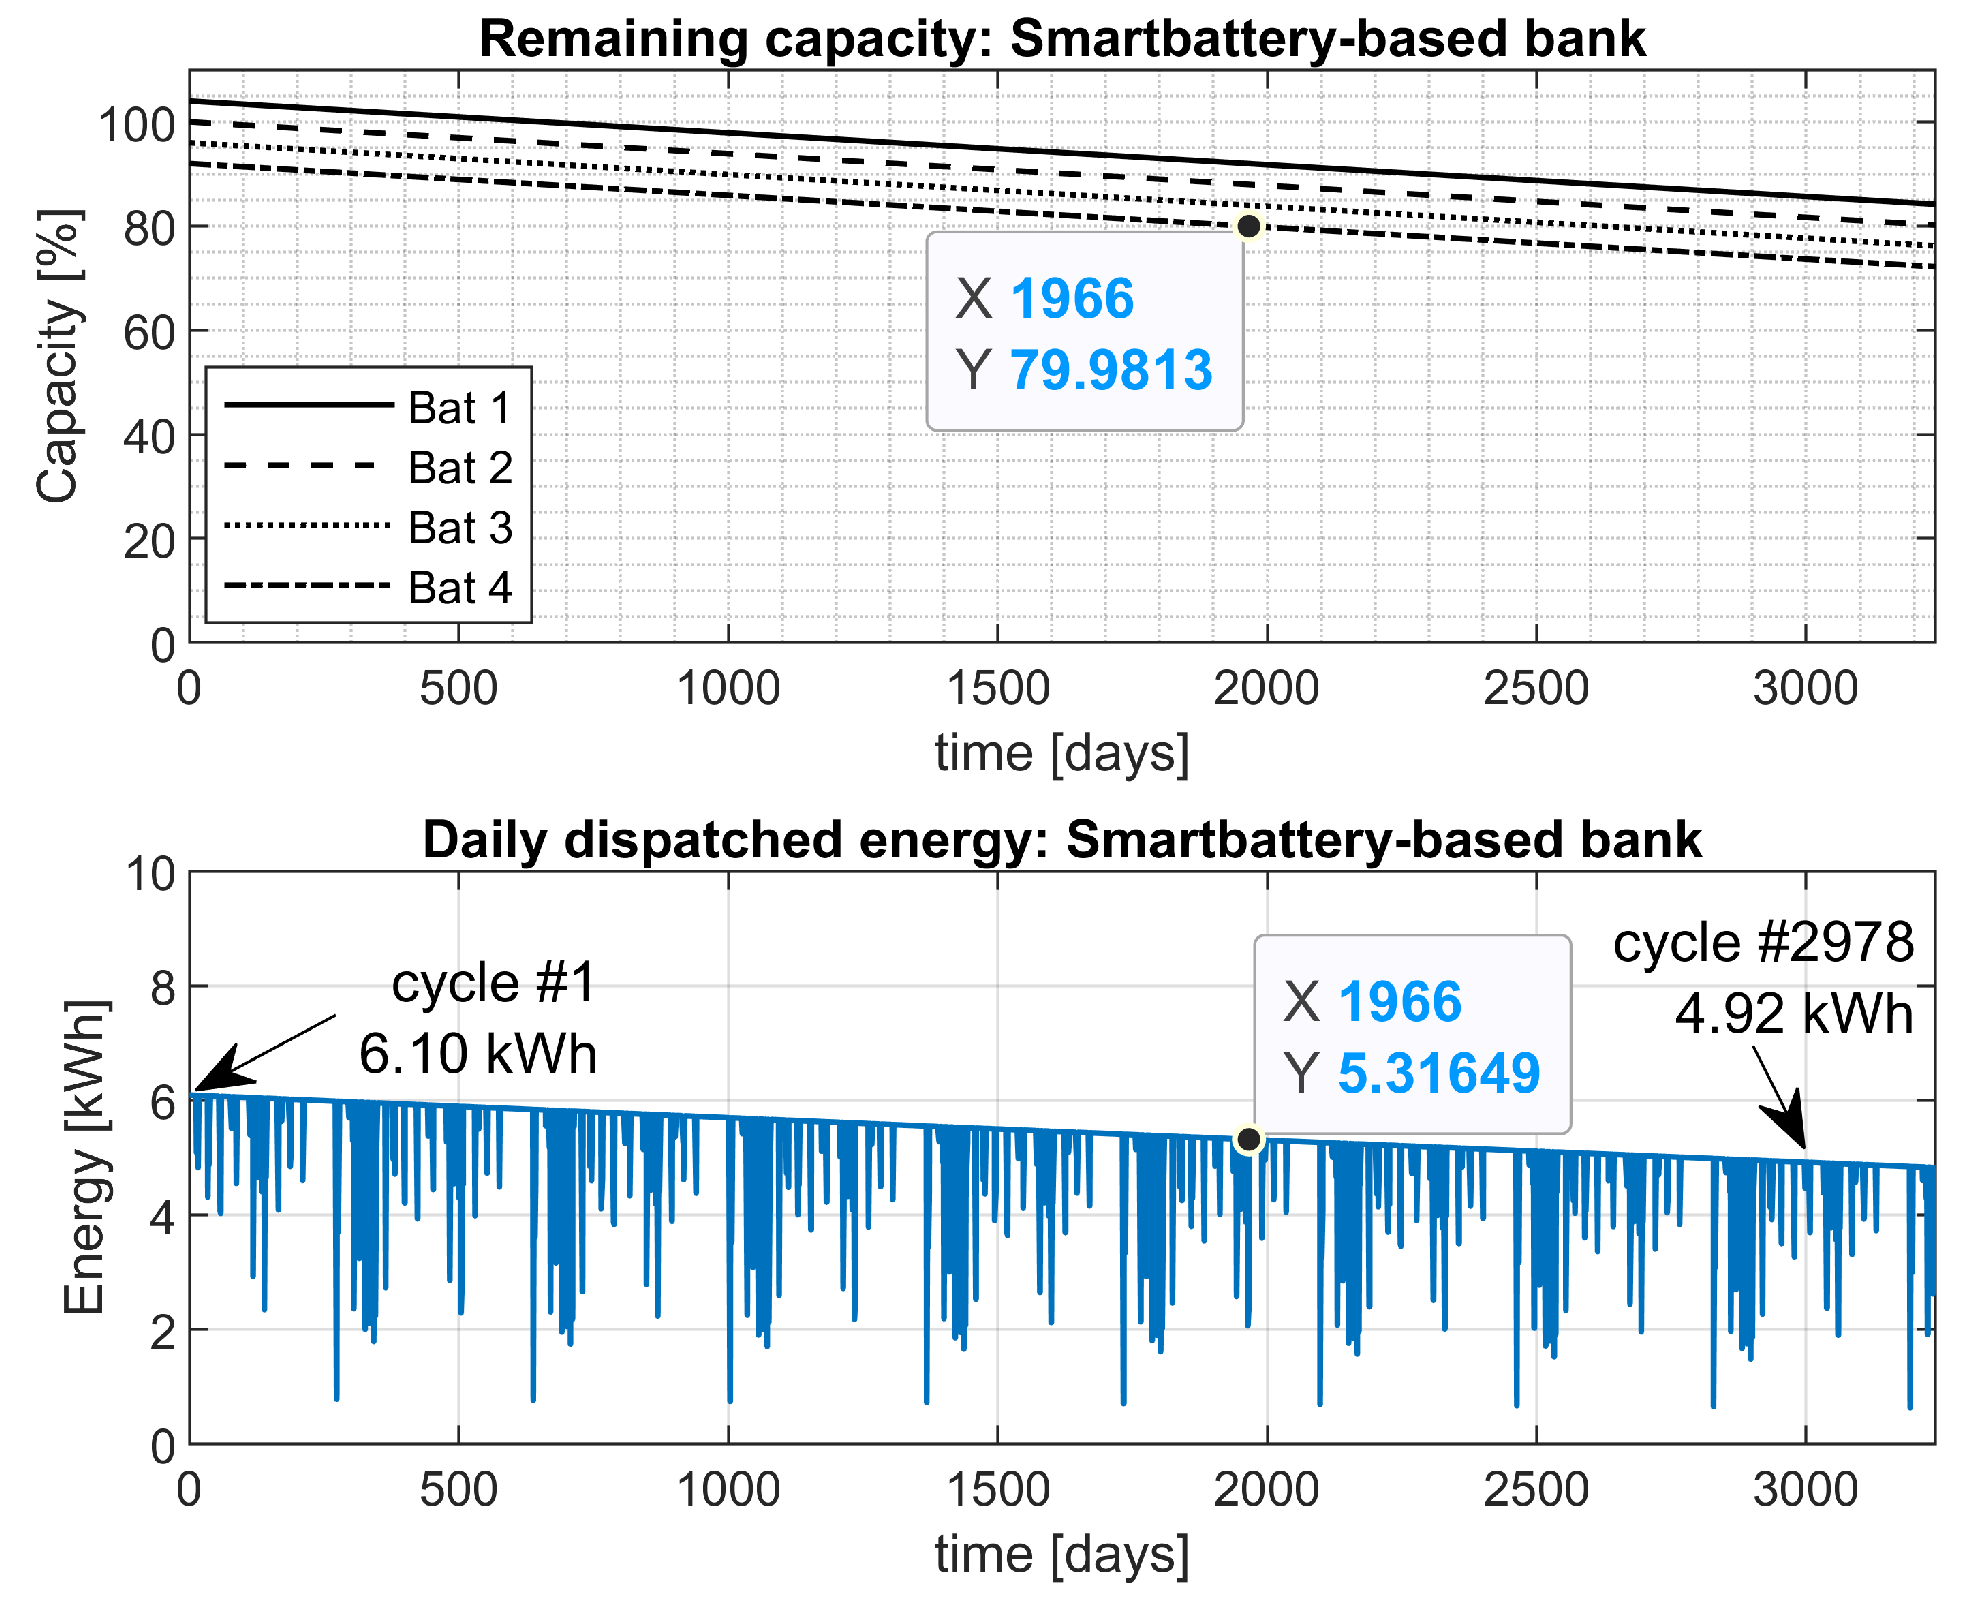
The battery capacity losses and the total daily dispatched energy over time are shown in
Figure 13. As can be seen, the gradual reduction in the health state on the batteries causes a corresponding deficit in the amount of daily dispatched energy. Furthermore, it is observed that battery 4 should reach 80% of its rated capacity after 1966 cycles, meeting the typical replacement criteria [
43,
51]. The battery bank starts its operation delivering a daily energy of 5.7 kWh but, after 1966 complete cycles, this value is reduced to 4.92 kWh. When using the battery model HZYSL12-230 at 50% DoD, the results are similar, except for the shorter lifespan and lower efficiency of the lead-acid batteries, as expected. For the lead-acid batteries, the replacement criterion is reached after only 391 operating cycles.
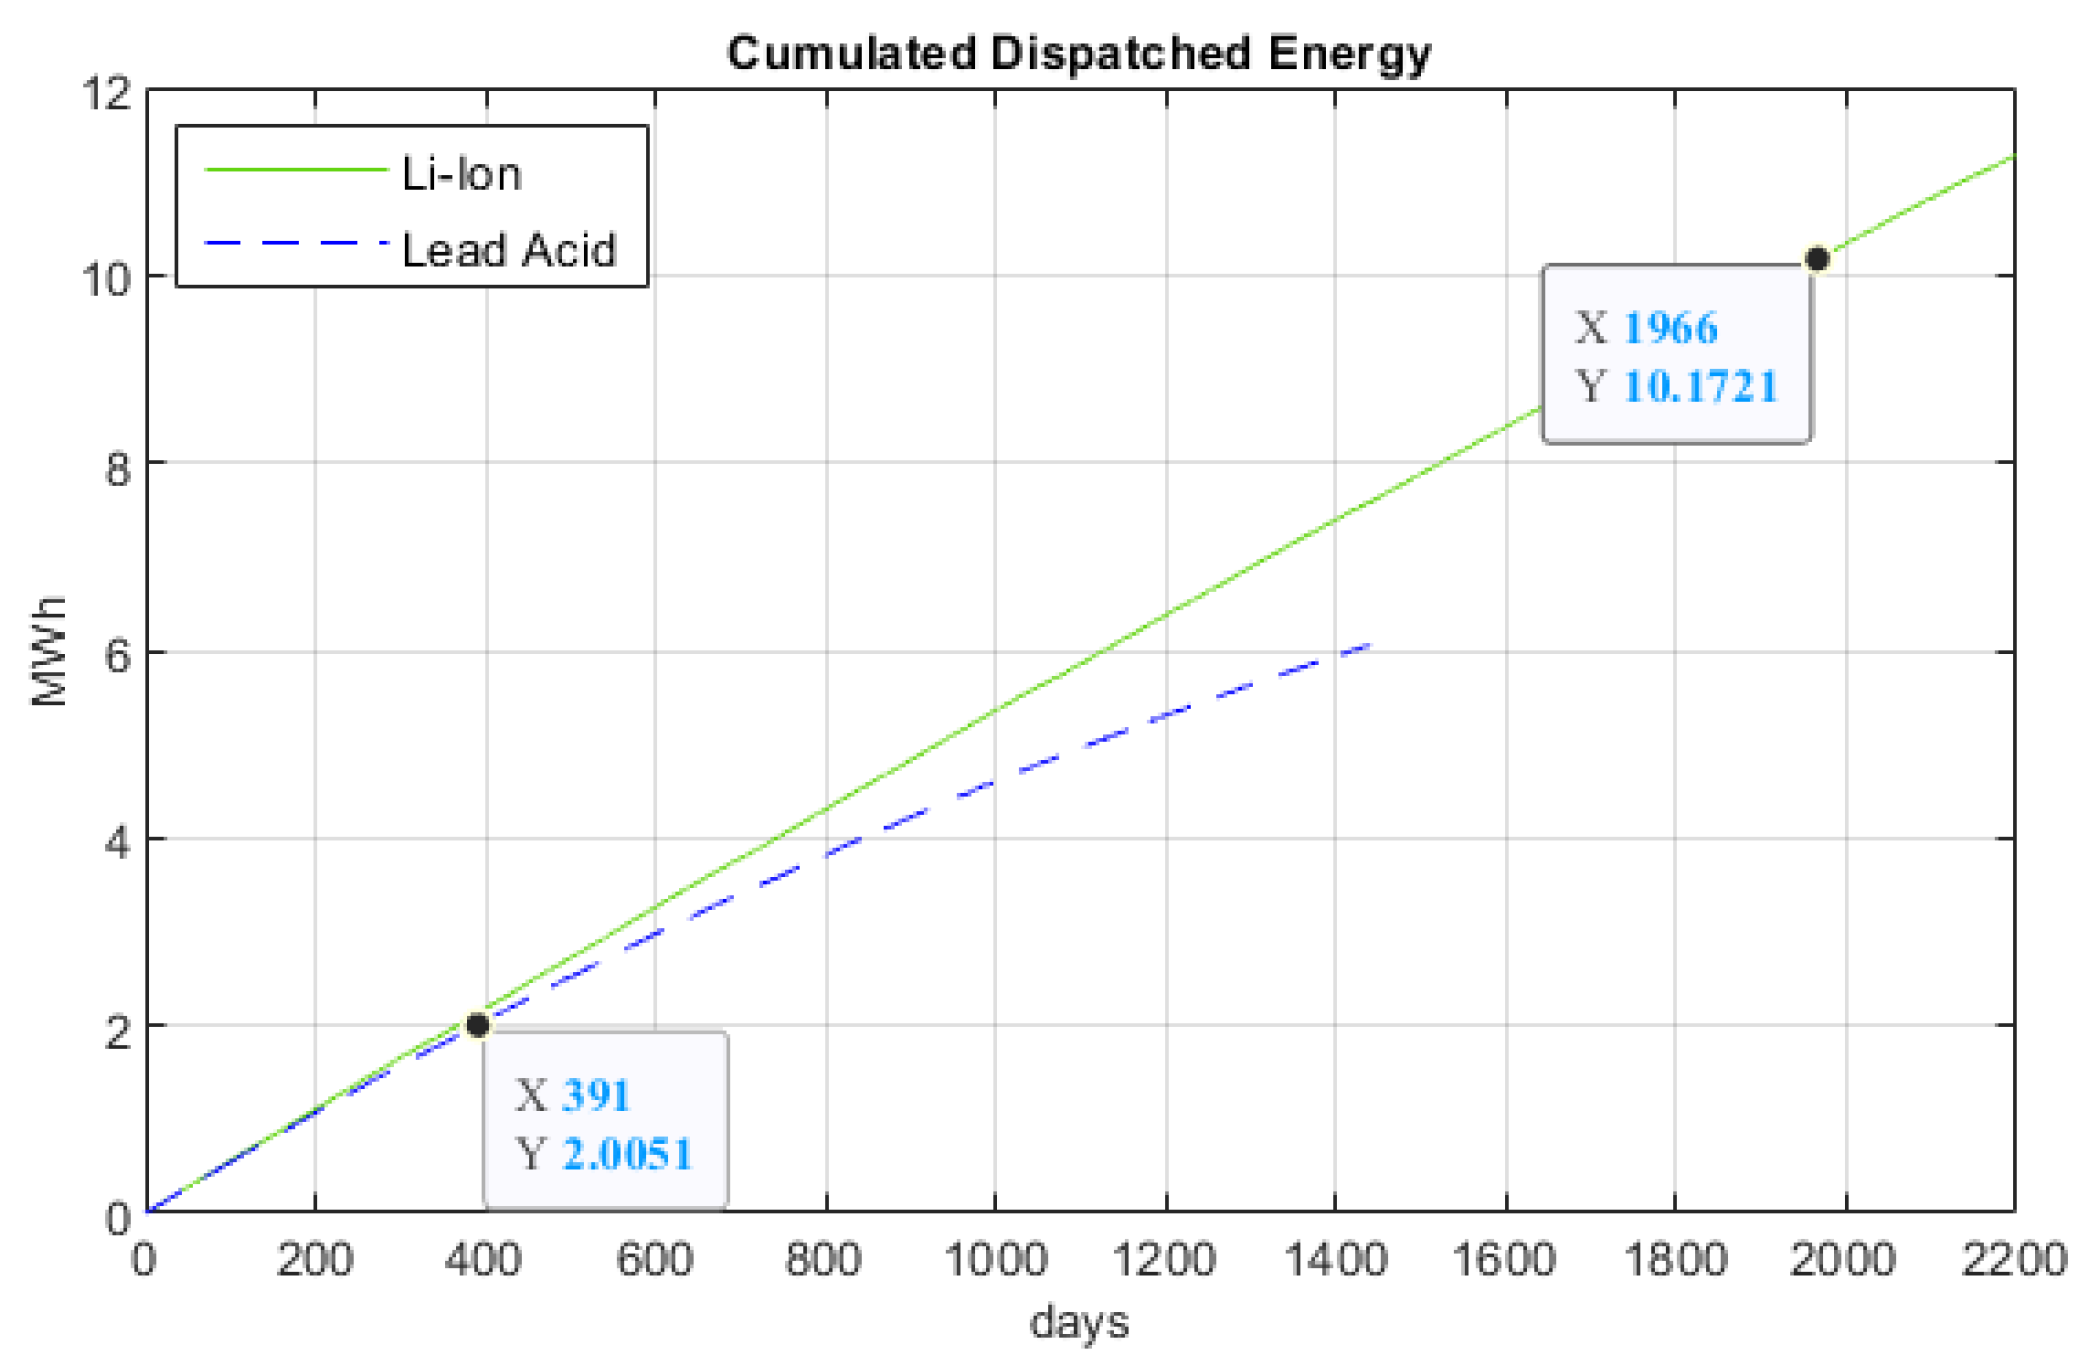
The cumulated dispatched energy (in MWh) along the battery bank lifetime is presented in
Figure 14 for the considered battery models. The highlighted points in this figure correspond to the number of cycles in which the lowest capacity battery is declared unusable, limiting the overall system useful life. Despite the restriction imposed by the more degraded or lower capacity battery, the storage system still has significant potential to operate beyond the highlighted point, with no service interruption. As discussed earlier, replacing the worst battery at this point is not an option, as the remaining batteries also present some debit in SoH, which would cause significant underutilization of the new installed units.
5.2. Storage System Based on Active Battery Modules
The next results correspond to the energy storage system employing the proposed technology. Each battery in the BESS is connected to its bidirectional power converter and now can be fully utilized thanks to the implemented power flow control.
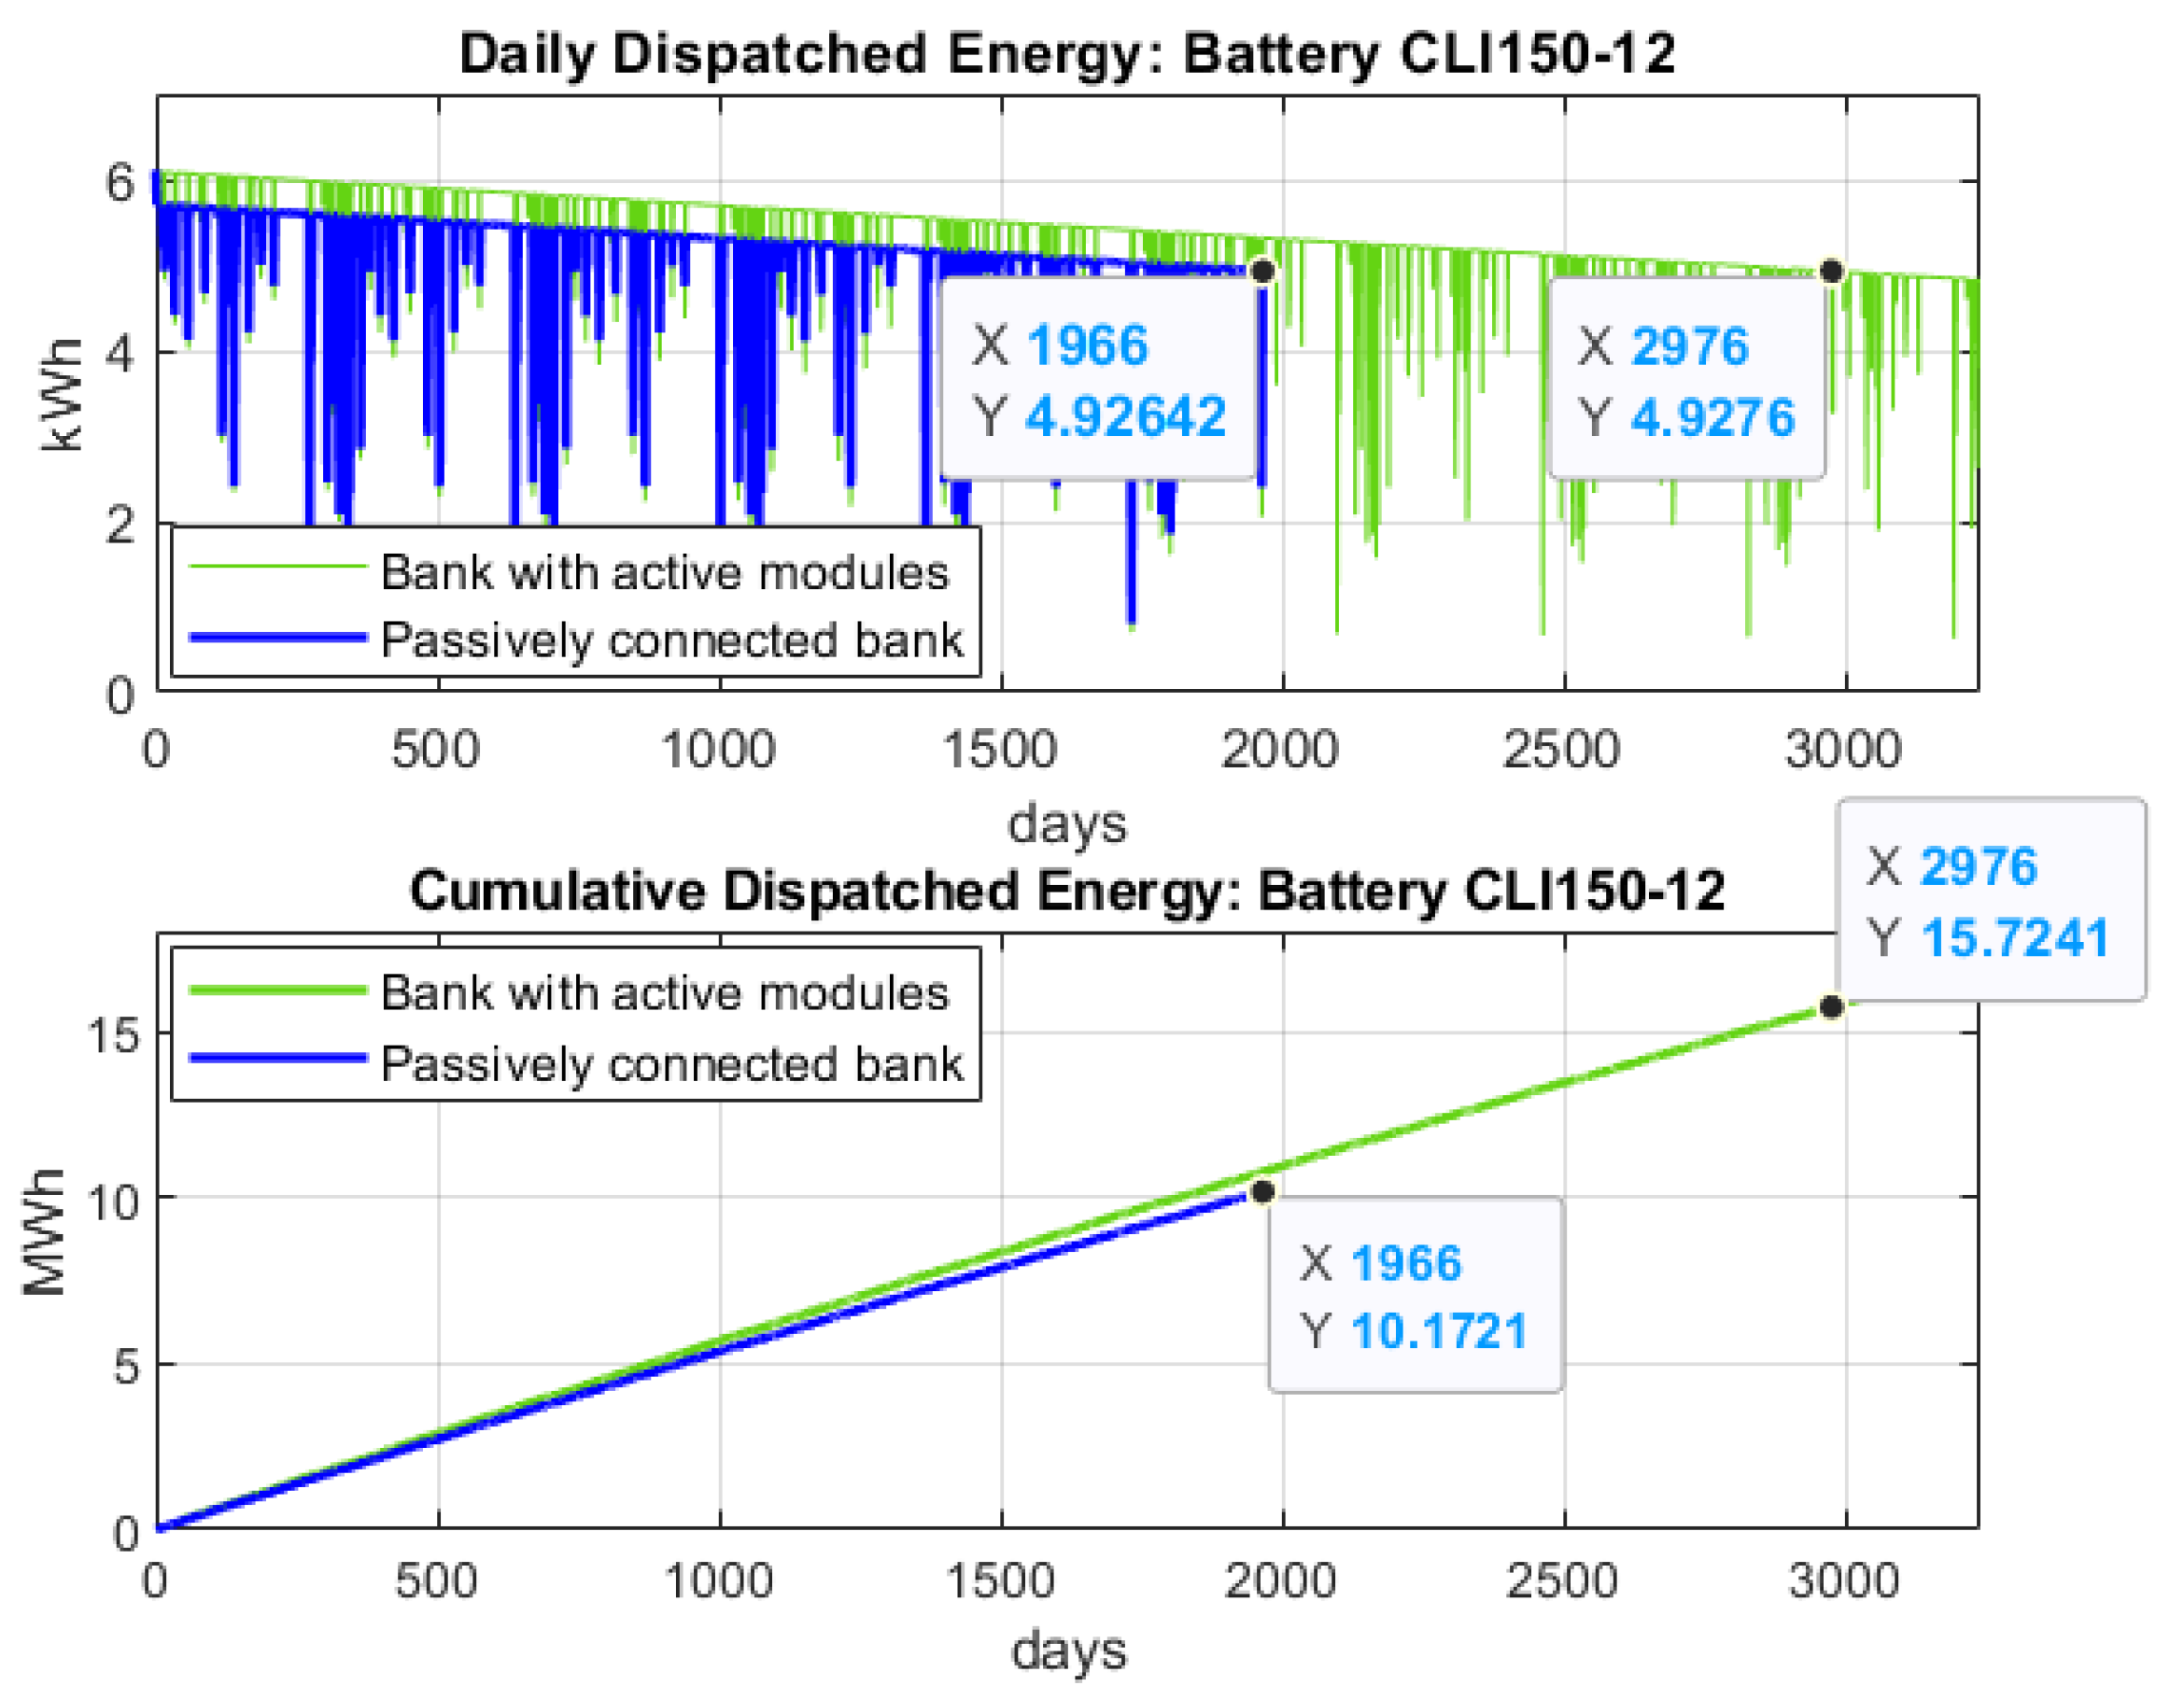
Figure 15 shows the SoC and electrical current profiles for Li-ion battery model CLI150-12. The capacity degradation trend for the batteries and the total daily dispatched energy over time are shown in
Figure 16.
As can be seen in
Figure 15, the situation is inverted compared to results shown in
Figure 12. The SoC profiles are now overlaid, indicating the full excursion of the relative SoC, between 20% and 80%, for all the batteries. As can also be seen in the bottom window of the same figure, the current levels are different for each battery according to its present conditions. The system remains tuned with all the batteries fully used.
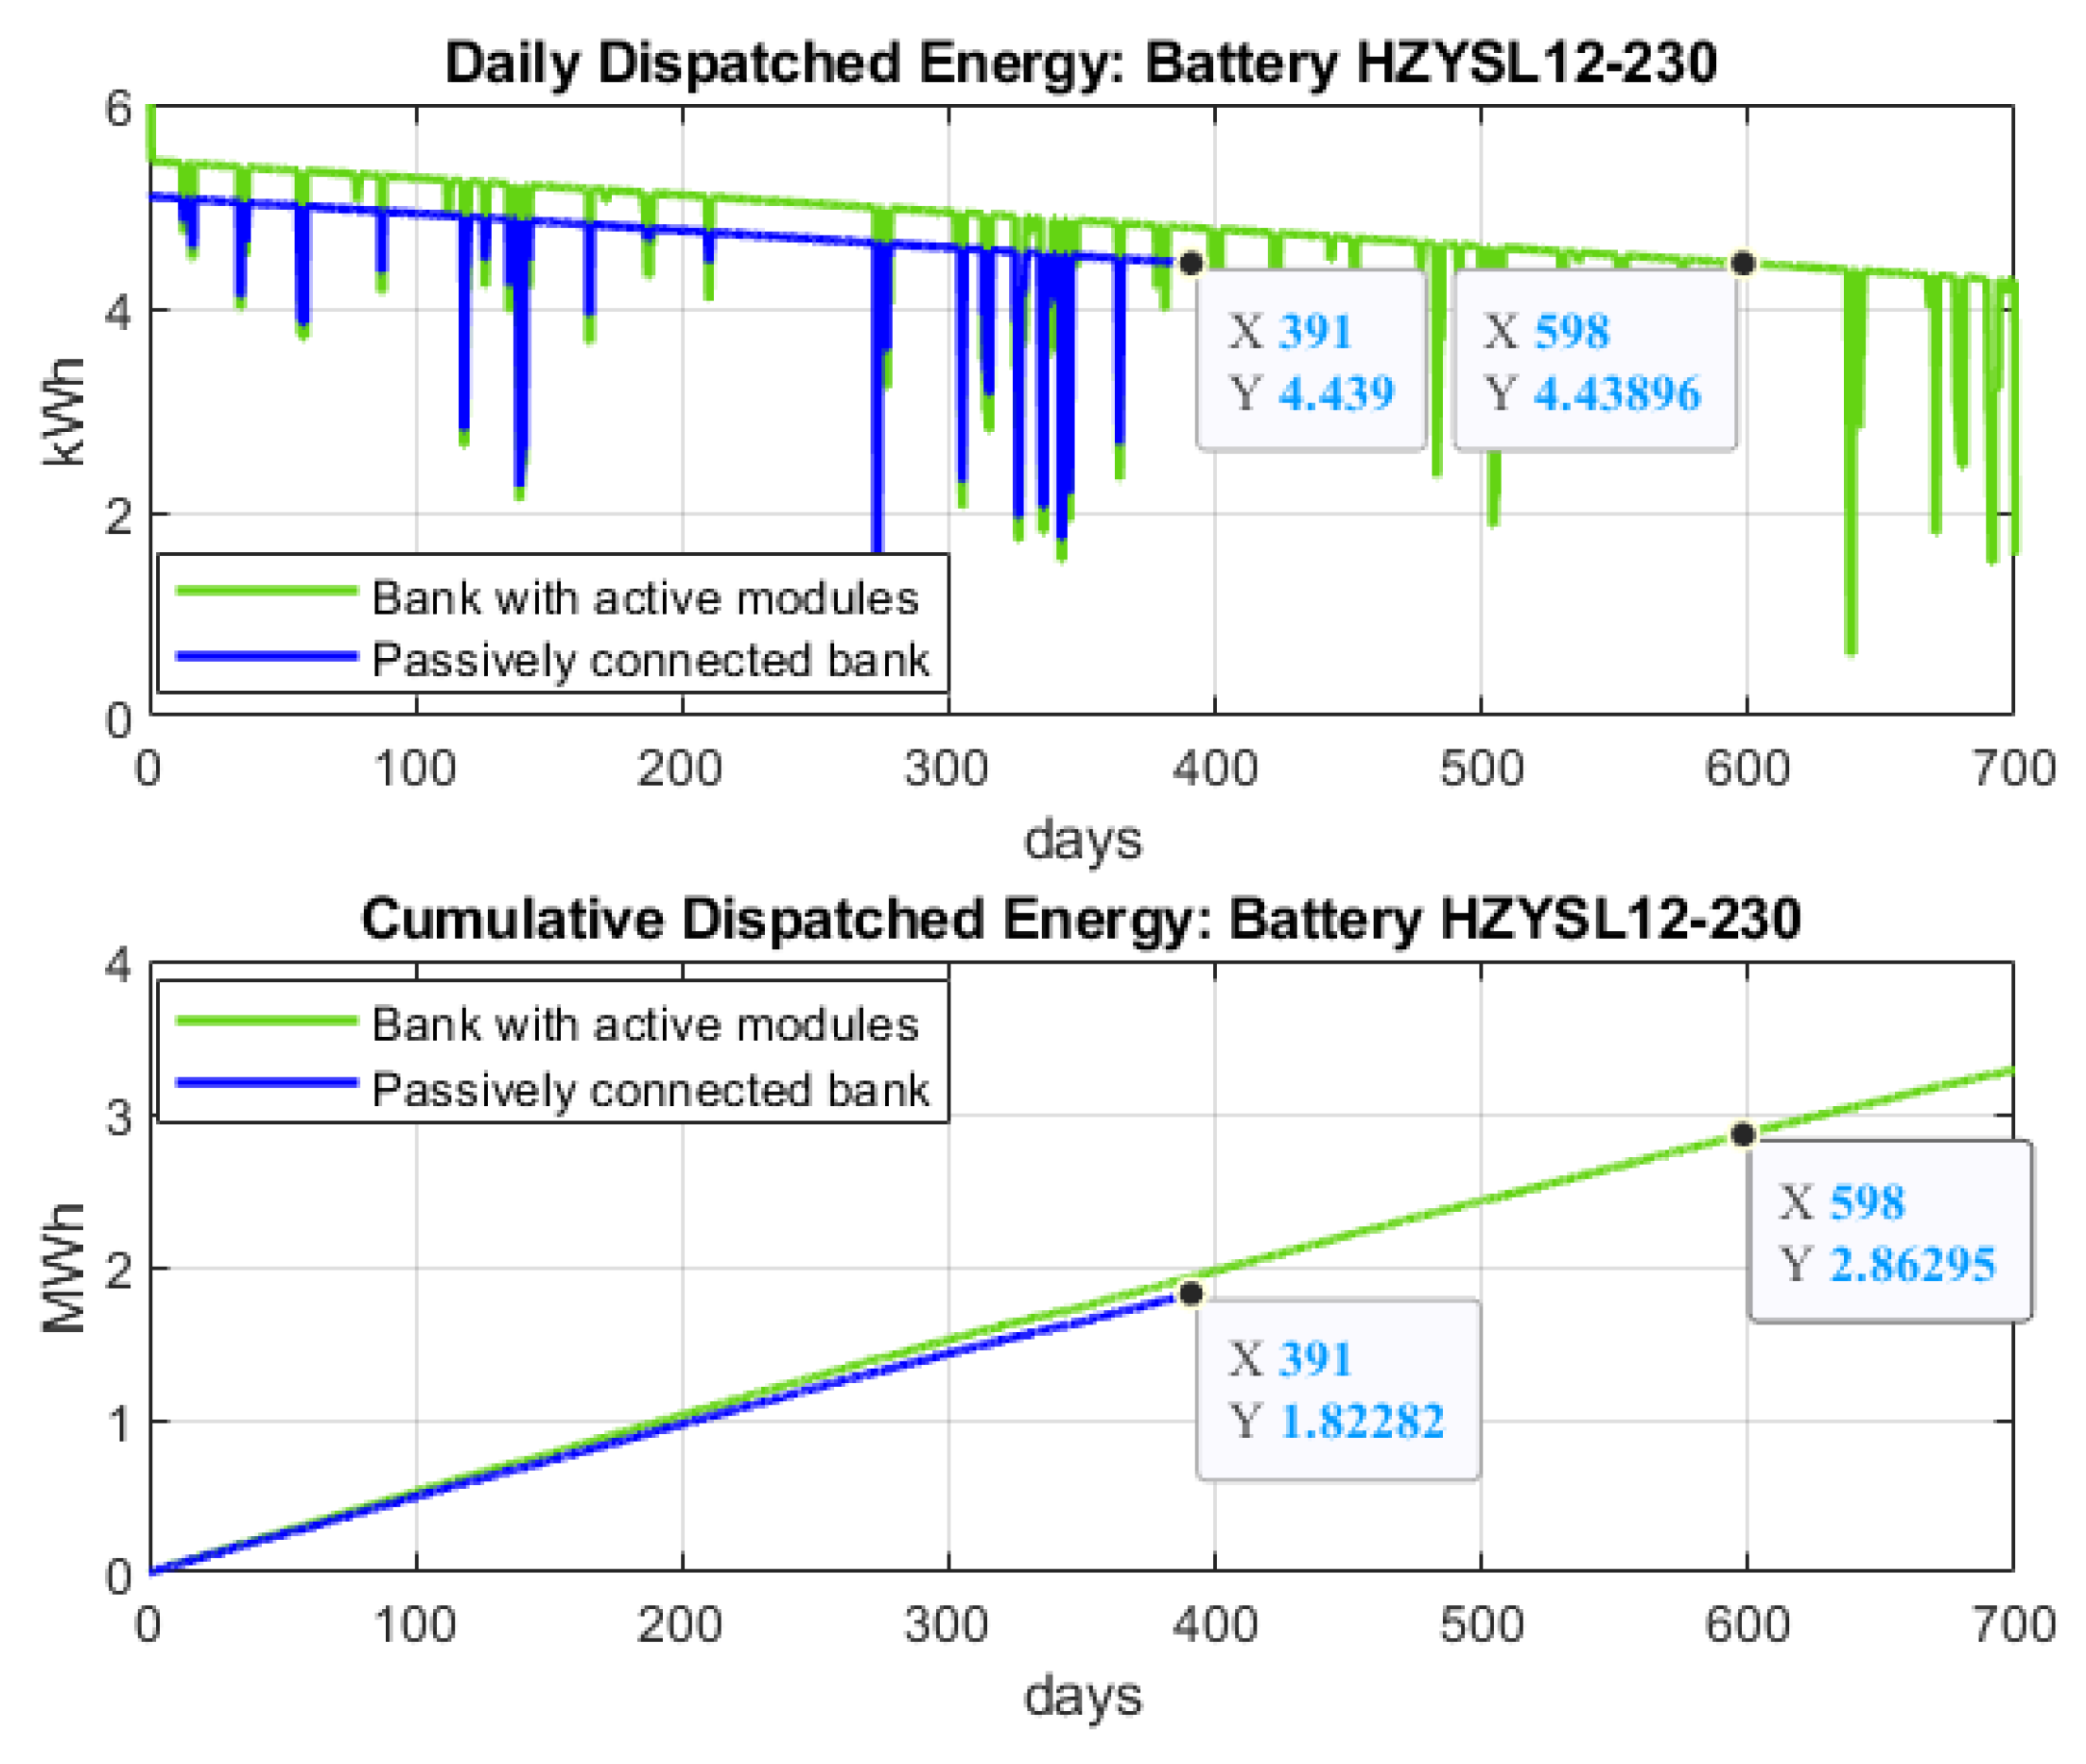
Figure 16 shows that keeping the battery models, operating profile and DoD, there are no significant changes in the battery capacity fade profiles. Despite this, the three highlighted points in the bottom window are noteworthy when we compare these results with those previously shown:
The available energy in the first operating cycle is already 7% higher;
After reaching the mark of 1966 cycles, the bank remains fully utilized, producing 8% of daily additional energy;
The previously observed end-of-life value for the daily dispatched energy is now reached after 2976 cycles.
7. Conclusions
This research paper investigates the benefits of energy storage systems based on batteries actively connected for peak load shaving applications. A two-stage bidirectional DC–DC converter was presented and experimentally evaluated to allow controlling the power flow from each battery, which is not possible for passively connected battery banks. The individual control of the charging and discharging processes allows the full use of system capacity, preventing its performance from being restricted to the lower capacity or more degraded batteries.
The proposed solution also makes it possible to overcome other inherent limitations of passively connected battery banks, as combining batteries of different electrochemical technologies, degradation states, capacities or ages, without limiting the use of the total available energy.
The proof of concept for the active power flow control was verified in a bench prototype formed by a mixed battery bank, with lead-acid and Li-Ion units of different capacities. The system proved capable of maintaining the power required by the load using each battery within its own limits.
Computer simulation results indicate that, regardless of the battery eletrochemical technology, the proposed solution enables gains that may exceed 50% both in bank longevity and in the total amount of dispatched energy. This is a promising result since the useful life of the battery bank has been shown to be a decisive factor for the economic viability of these systems. The research is ongoing to optimize the hardware components in terms of cost, volume and scalability. Power flow control algorithms are also being improved so that the achieved benefits can be extended to other applications that employ battery-based energy storage systems.


