Article

Optimal Design and Comparative Analysis of a PV/Mini-Hydropower and a PV/Battery Used for Electricity and Water Supply

by
Ruben Zieba Falama
1,*,
Wojciech Skarka
2,* and
Serge Yamigno Doka
1
1
National Advanced School of Mines and Petroleum Industries, University of Maroua, Maroua P.O. Box 46, Cameroon
2
Department of Fundamentals of Machinery Design, Silesian University of Technology, 44-100 Gliwice, Poland
*
Authors to whom correspondence should be addressed.
Energies 2023, 16(1), 307; https://doi.org/10.3390/en16010307
Submission received: 30 November 2022 / Revised: 21 December 2022 / Accepted: 22 December 2022 / Published: 27 December 2022
(This article belongs to the Collection Renewable Energy and Energy Storage Systems)

Abstract

:
This work proposed an optimal design of PV-system-based water-pumped energy storage for both electricity and water supply. A case study was considered in a rural community in Cameroon. The parameters of the assessment of the system were reliability, represented in the present work by the system supply deficiency (SSD), and economic accessibility, represented by the levelized cost of energy (LCOE). The obtained results showed that for 0% SSD, the optimal configuration of the system was composed of 438 PV modules of 235 W, an immersed solar motor pump of 35 kW, a hydroelectric turbine of 51.7 kW, an upper reservoir of 2307.1 m3, an inverter of 25.27 kW, and a total dynamic head of 88 m. The corresponding LCOE to this configuration is 0.224 USD/kWh. The economic accessibility of the designed system was evaluated by comparison with a PV-system-based battery energy storage. The optimal design configuration of the studied PV-system-based battery energy storage was a PV generator (120 PV modules of 235 W), solar motor pump (15 kW), upper reservoir (590.4 m3), battery capacity (351.78 kWh), inverter (25.27 kW), and total dynamic head (81 m). The corresponding LCOE to this configuration was 0.1857 USD/kWh. Although the PV-system-based battery storage appeared to be economically more cost-effective than the PV-system-based water-pumped energy storage, the sensitivity analysis revealed that there was the possibility for the PV-system-based water-pumped energy storage to be economically more profitable than the PV-system-based battery energy storage. This economic outperformance occurred when the project lifetime was a multiple of 7.5 years or when the costs of the storage components were reduced from 20% to 60%.

1. Introduction

The wide deployment of micro-grids-based renewable energies systems (RES) is the solution for energy challenges all over the world. The integration of micro-grids in national and regional strategies is the way to increase energy access, thus leading to sustainable development. The small-scale and standalone micro-grid systems are well-adapted for energy supply in rural and remote areas. These systems, in such cases, could be used for electrification, cooking, and water supply.
The main problem with using renewable energy systems is actually the low conversion efficiency and the high-cost energy storage devices (ESD) used for blackouts or lower production periods. The use of an energy storage system (ESS) is mandatory for the continuous availability of the energy demanded. The actual most-used energy storage system is the battery.
Water and energy supply from micro-grids for household applications could significantly improve the living conditions of people in rural and remote areas. Many studies used battery energy storage in water-pumping system-based renewable energies for electricity and water supply. Hegazy et al. [1] optimally designed a PV/battery system to supply water for irrigation in an isolated area of Egypt. The obtained results were found to be better than using a diesel generator or utility grid. Thapelo et al. [2] developed multi-criteria decision-making to select the optimal micro-grid configuration for water pumping. The PV/battery system has been detected as the best configuration. Malla et al. [3] studied a PV/battery water-pumping system for applications in the agricultural sector. The performance of the proposed study approach was demonstrated by the reliability of the system to respond efficiently to the load demand. The performance of a PV/battery system for electricity and water supply has been evaluated by Bhayo et al. [4]. Muralidhar and Rajasekar [5] demonstrated the feasibility of a PV/battery system for both lighting and water supply in a village in India. An energy management platform has been developed for this purpose. The techno-economic study of a standalone photovoltaic/water-pumping system for the water supply in rural and remote areas was performed by Falama et al. [6]. The optimally designed system was able to fulfill the water demand of 328 households. Ibrahim et al. [7] developed a computer program to create a comprehensive design of solar pumping-system components with different water demands. Verma et al. [8] reviewed the water pumping system powered by solar PV. It was found that the PV water pumping system was more advantageous than diesel-powered water pumps. An optimal detailed analysis of a standalone photovoltaic/battery system was realized by Falama et al. [9] for the electricity supply in rural and remote areas. The batteries’ size was identified as the most influential component on the studied system’s cost, while the reliability of the system was mostly influenced by the PV size.
Because of the high cost of the batteries and the high CO2 emissions during battery manufacturing, another alternative for energy storage is being explored and implemented by researchers and industrialists. Some of the energy storage solutions proposed in the literature are the hydrogen energy storage system, the flywheel energy storage, the water-pumped energy system, the thermal energy storage system, etc. Since water pumping is already integrated into an energy-system-based water supply, it is possible to suppress the battery and consider the energy storage based on the water pumping by integrating mini-hydroelectric power generation. Such a kind of study was developed by Sanna et al. [10], who realized the continuous operation of the high energy efficiency of a brackish water reverse-osmosis desalination plant based on photovoltaics and water-pumped energy storage. Gilton et al. [11] also demonstrated the importance of coupling the photovoltaic with pumped hydro energy storage for developing countries.
Different methods are used in the literature for the optimal design of power systems [12,13,14,15,16]. However, recently, metaheuristics algorithms have gained more attention for the optimization of energy systems [17,18,19,20].
Some research gaps have to be highlighted in the present study: (1) Many studies are performed in the literature for electricity and water supply in rural and remote areas communities, using two systems separately. The combination of the two systems in one could be more advantageous; (2) since pumped hydropower energy storage is expensive, the possibility of reducing the cost of renewable energy systems-based pumped hydropower energy storage should be explored in order to allow the extension of this clean energy production systems; and (3) few studies have considered the Firefly algorithm for performing multi-objective optimization of power systems; however, based on the performance of this method [21,22], it should also be widely used.
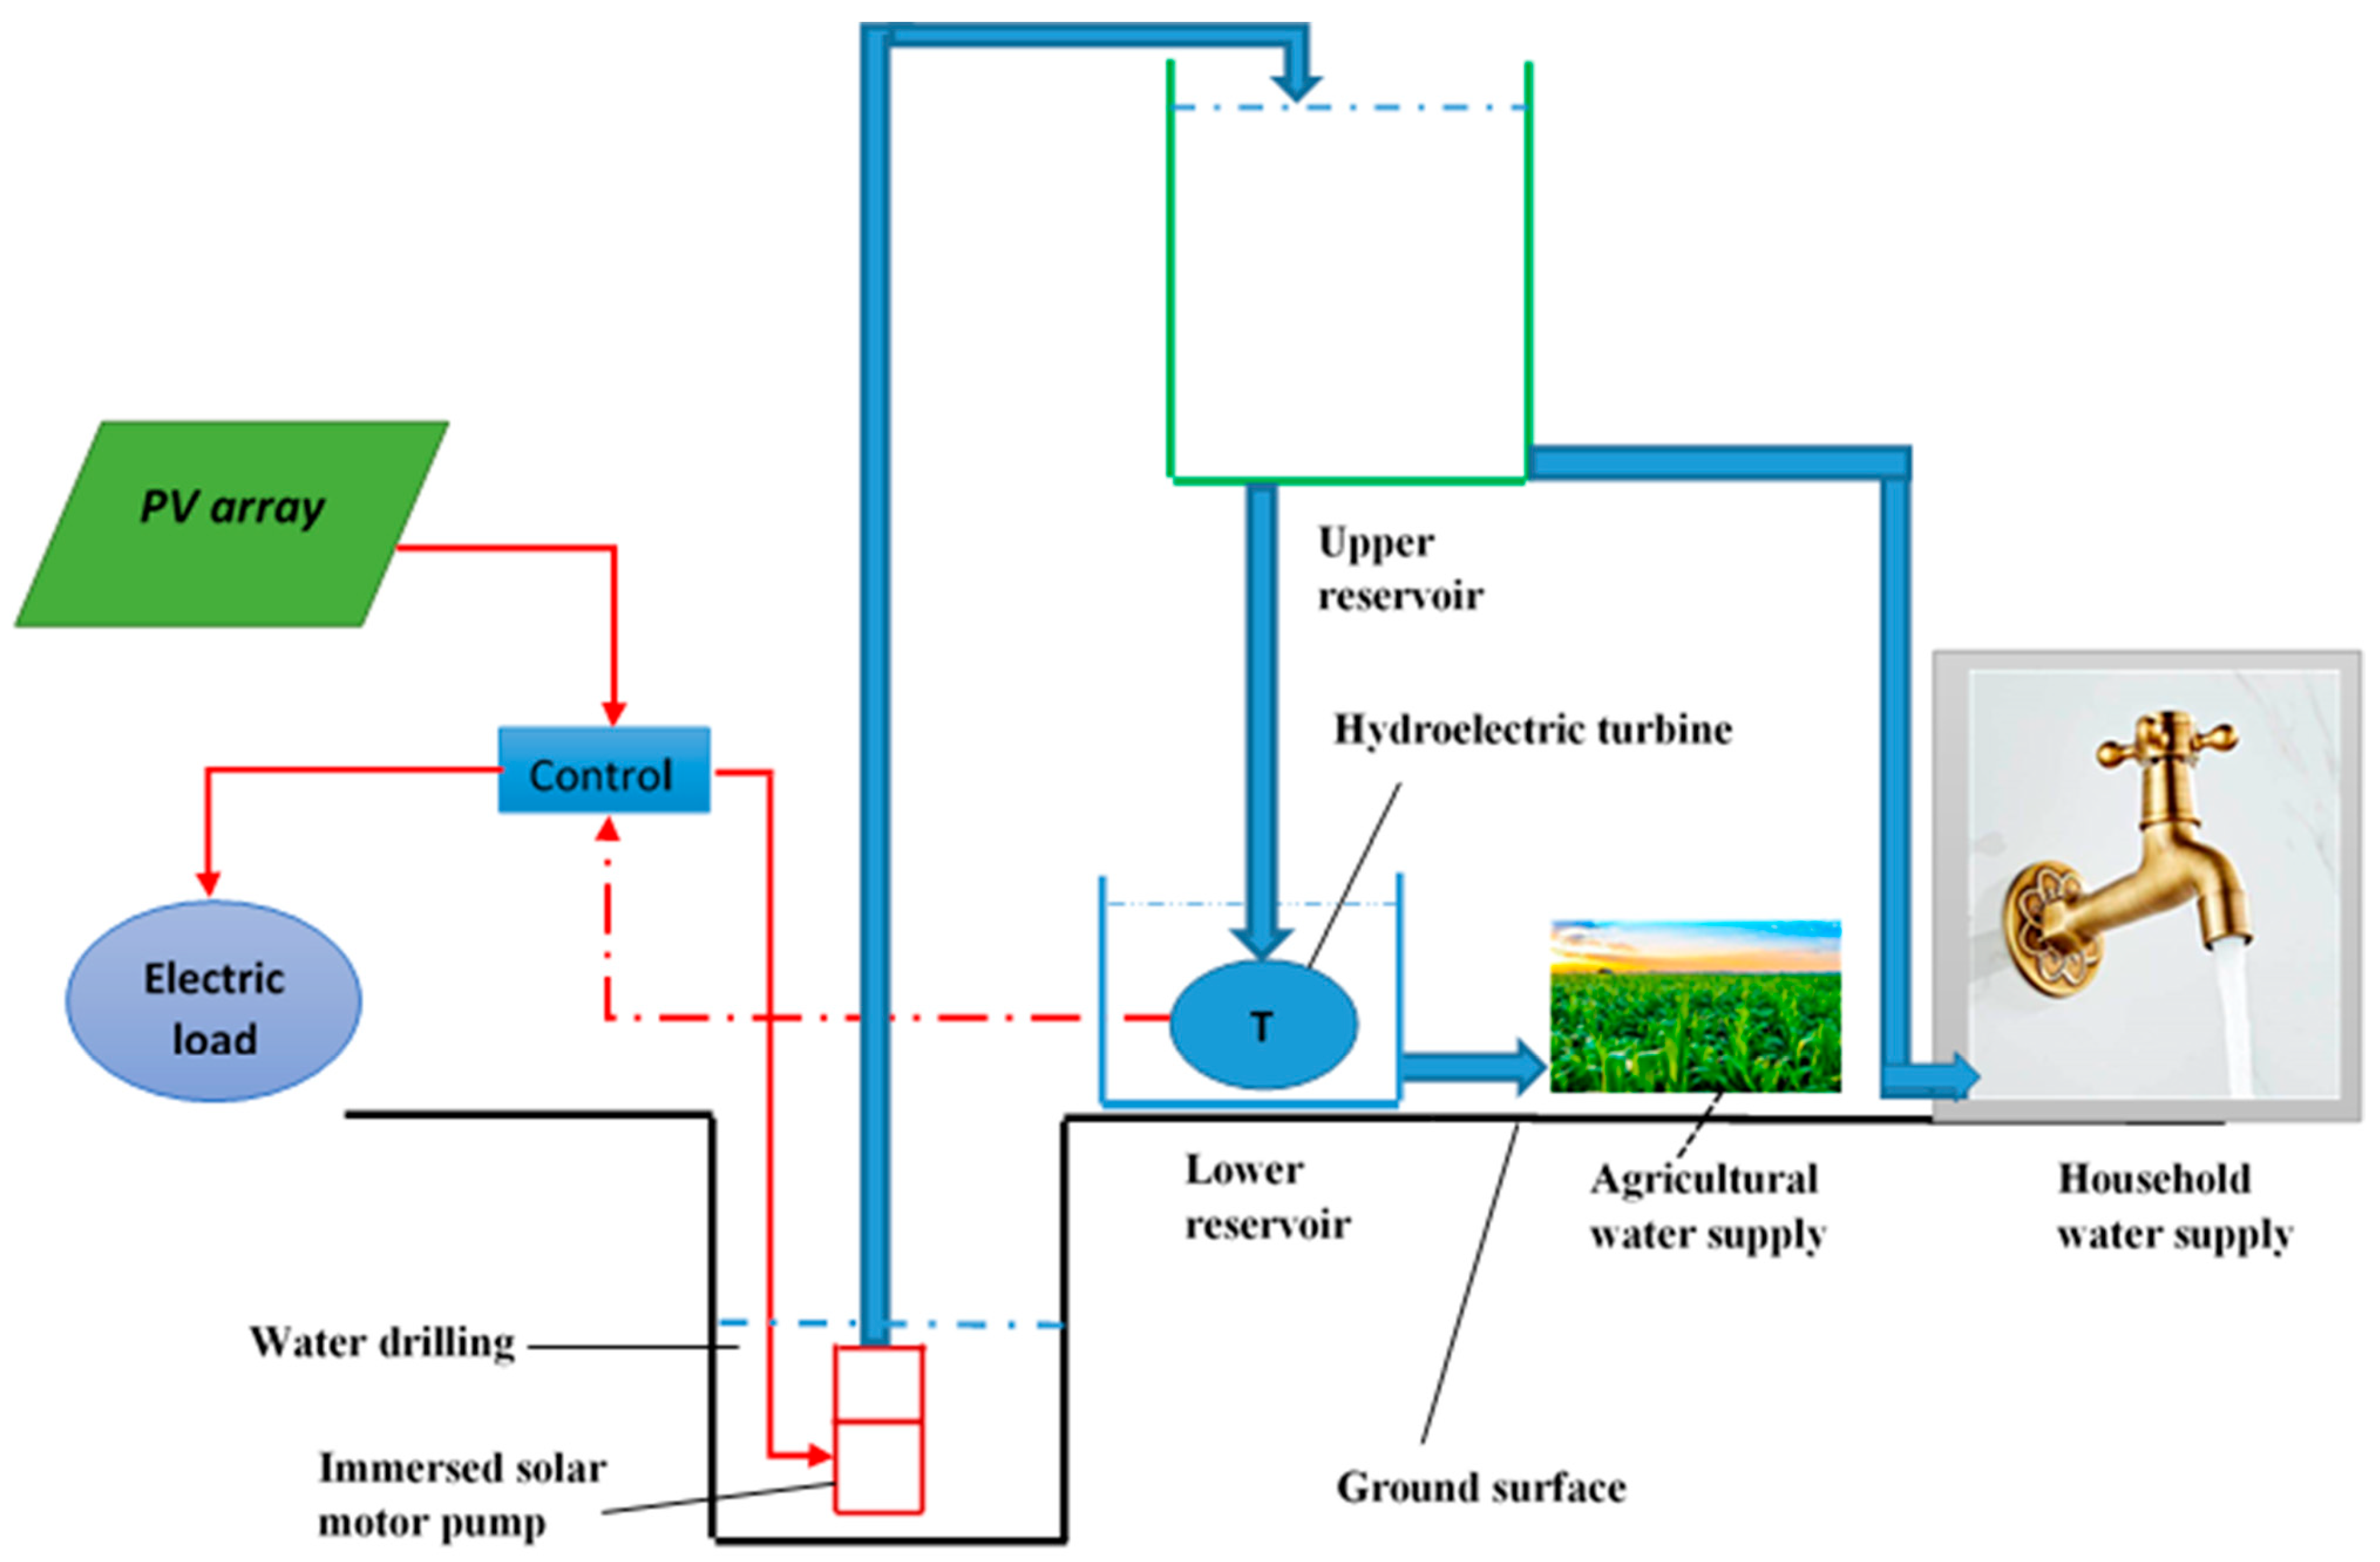
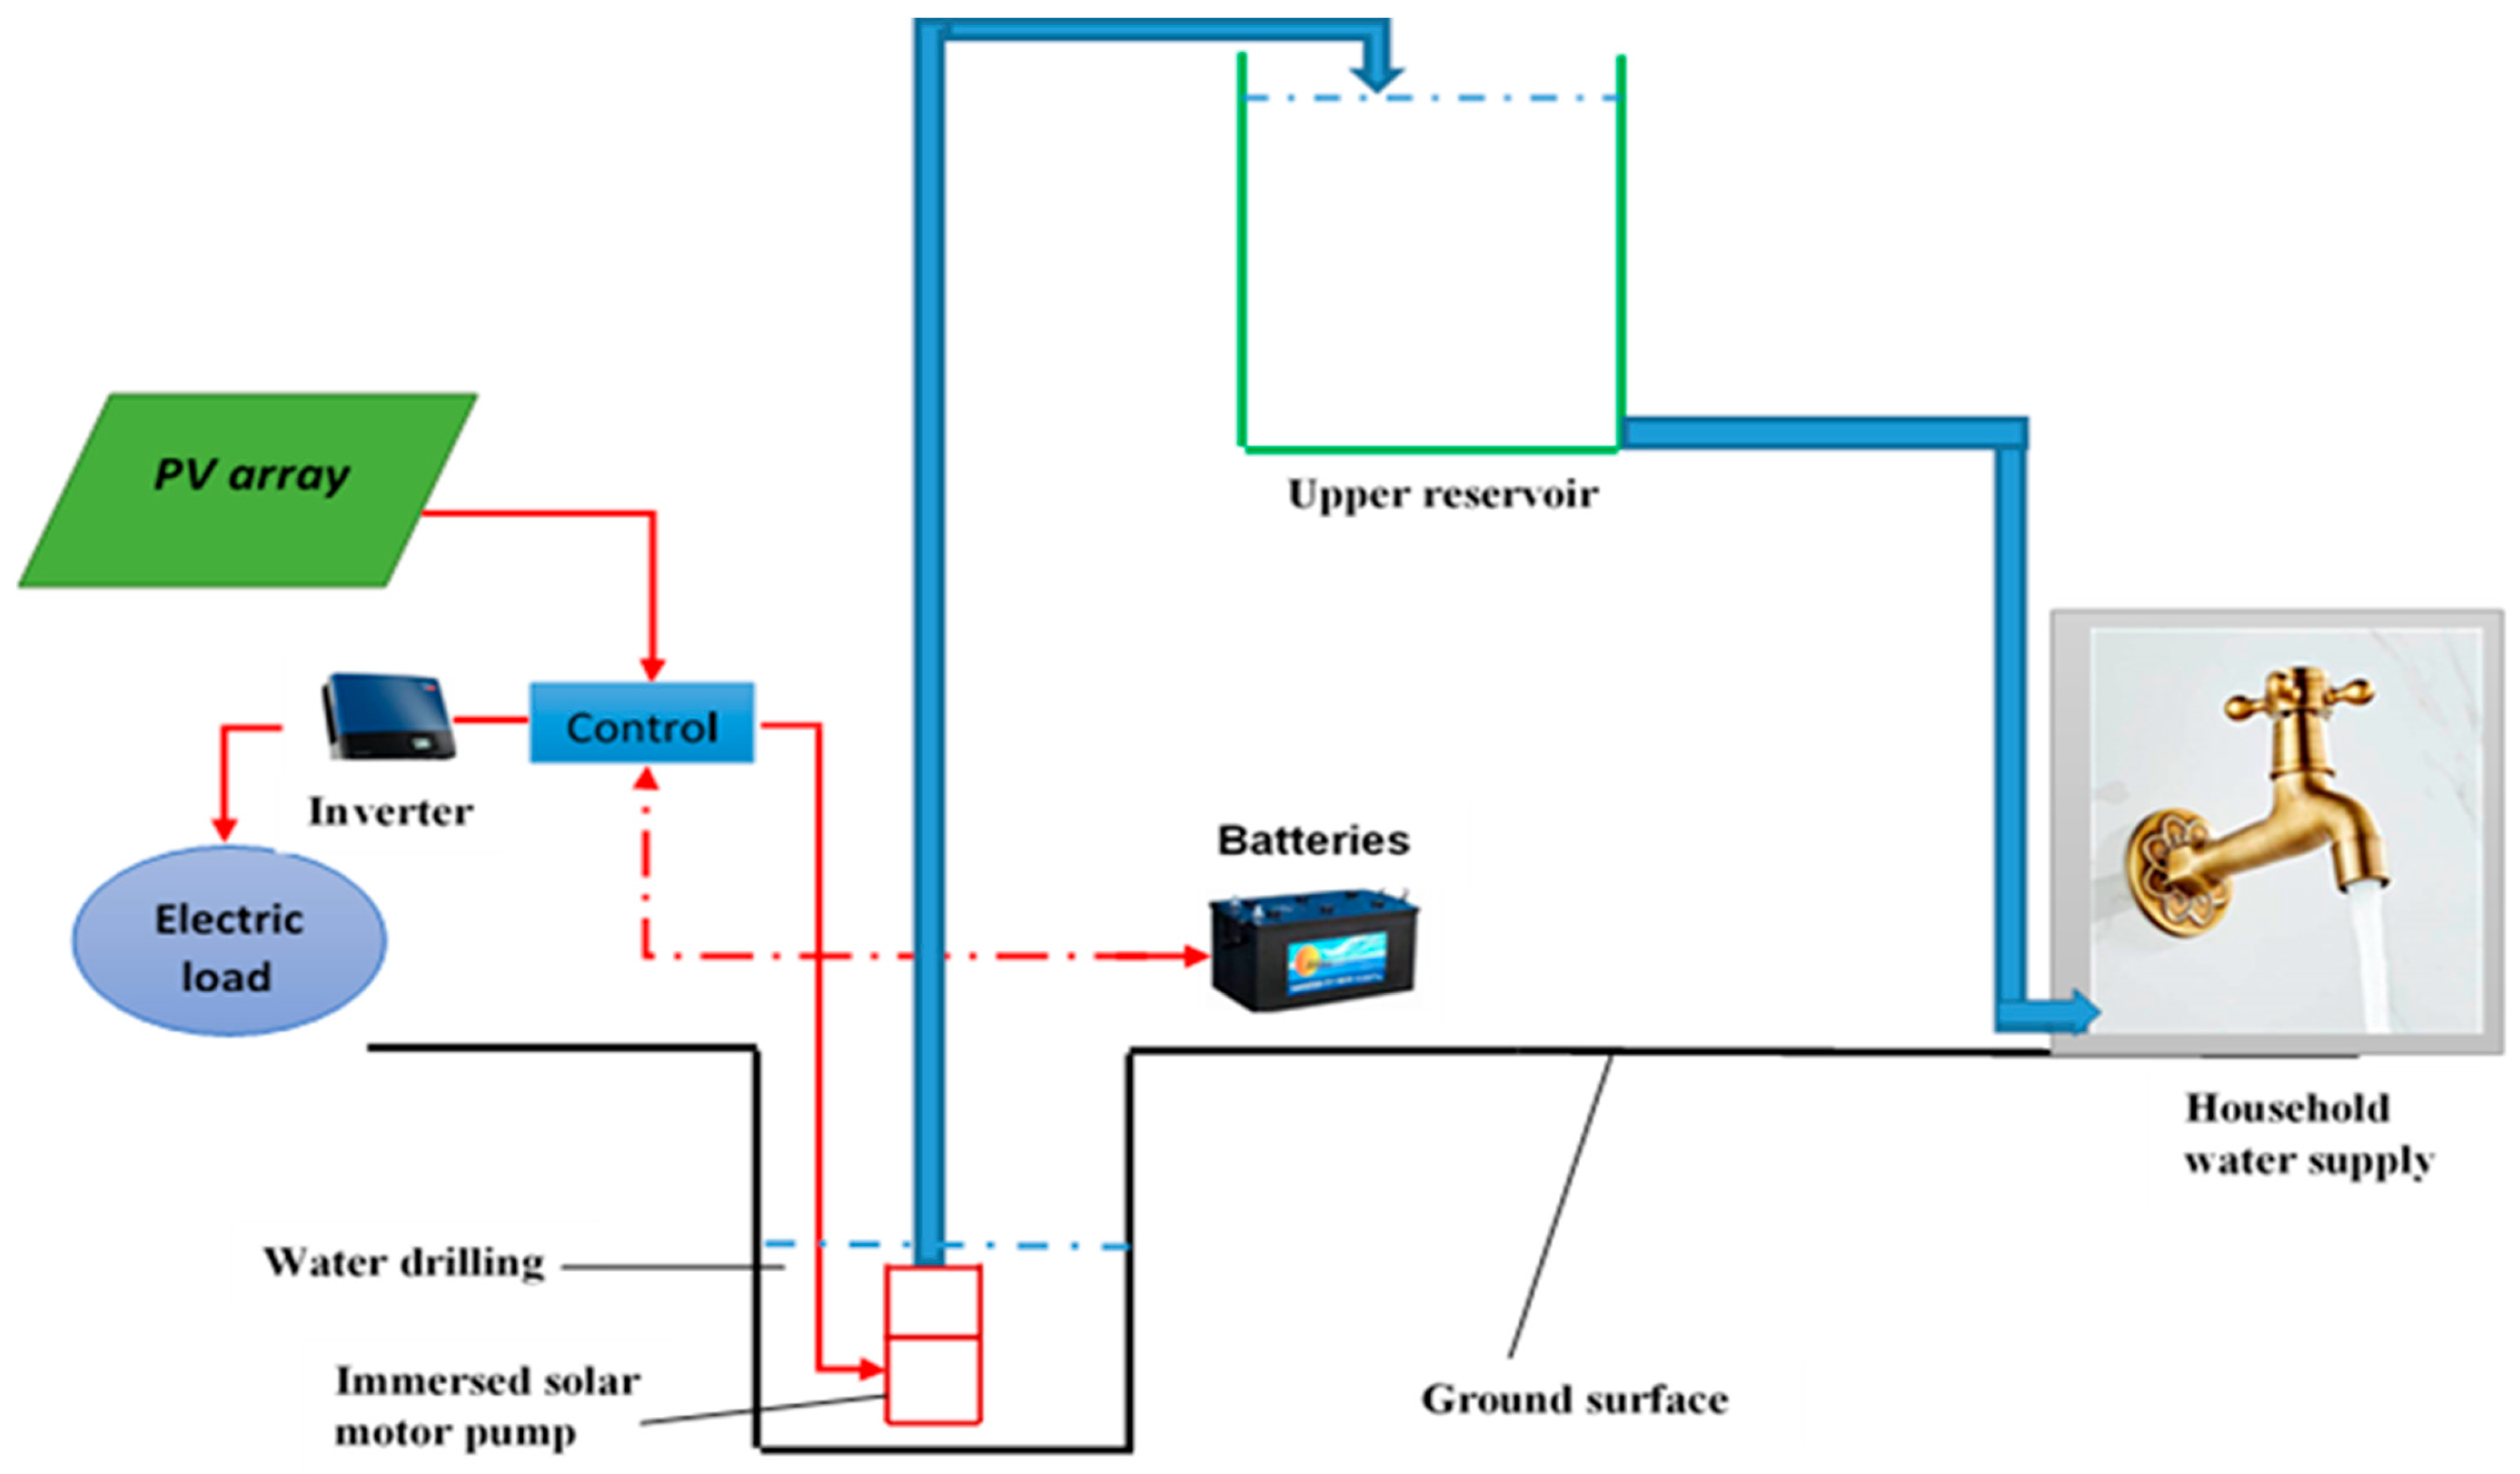
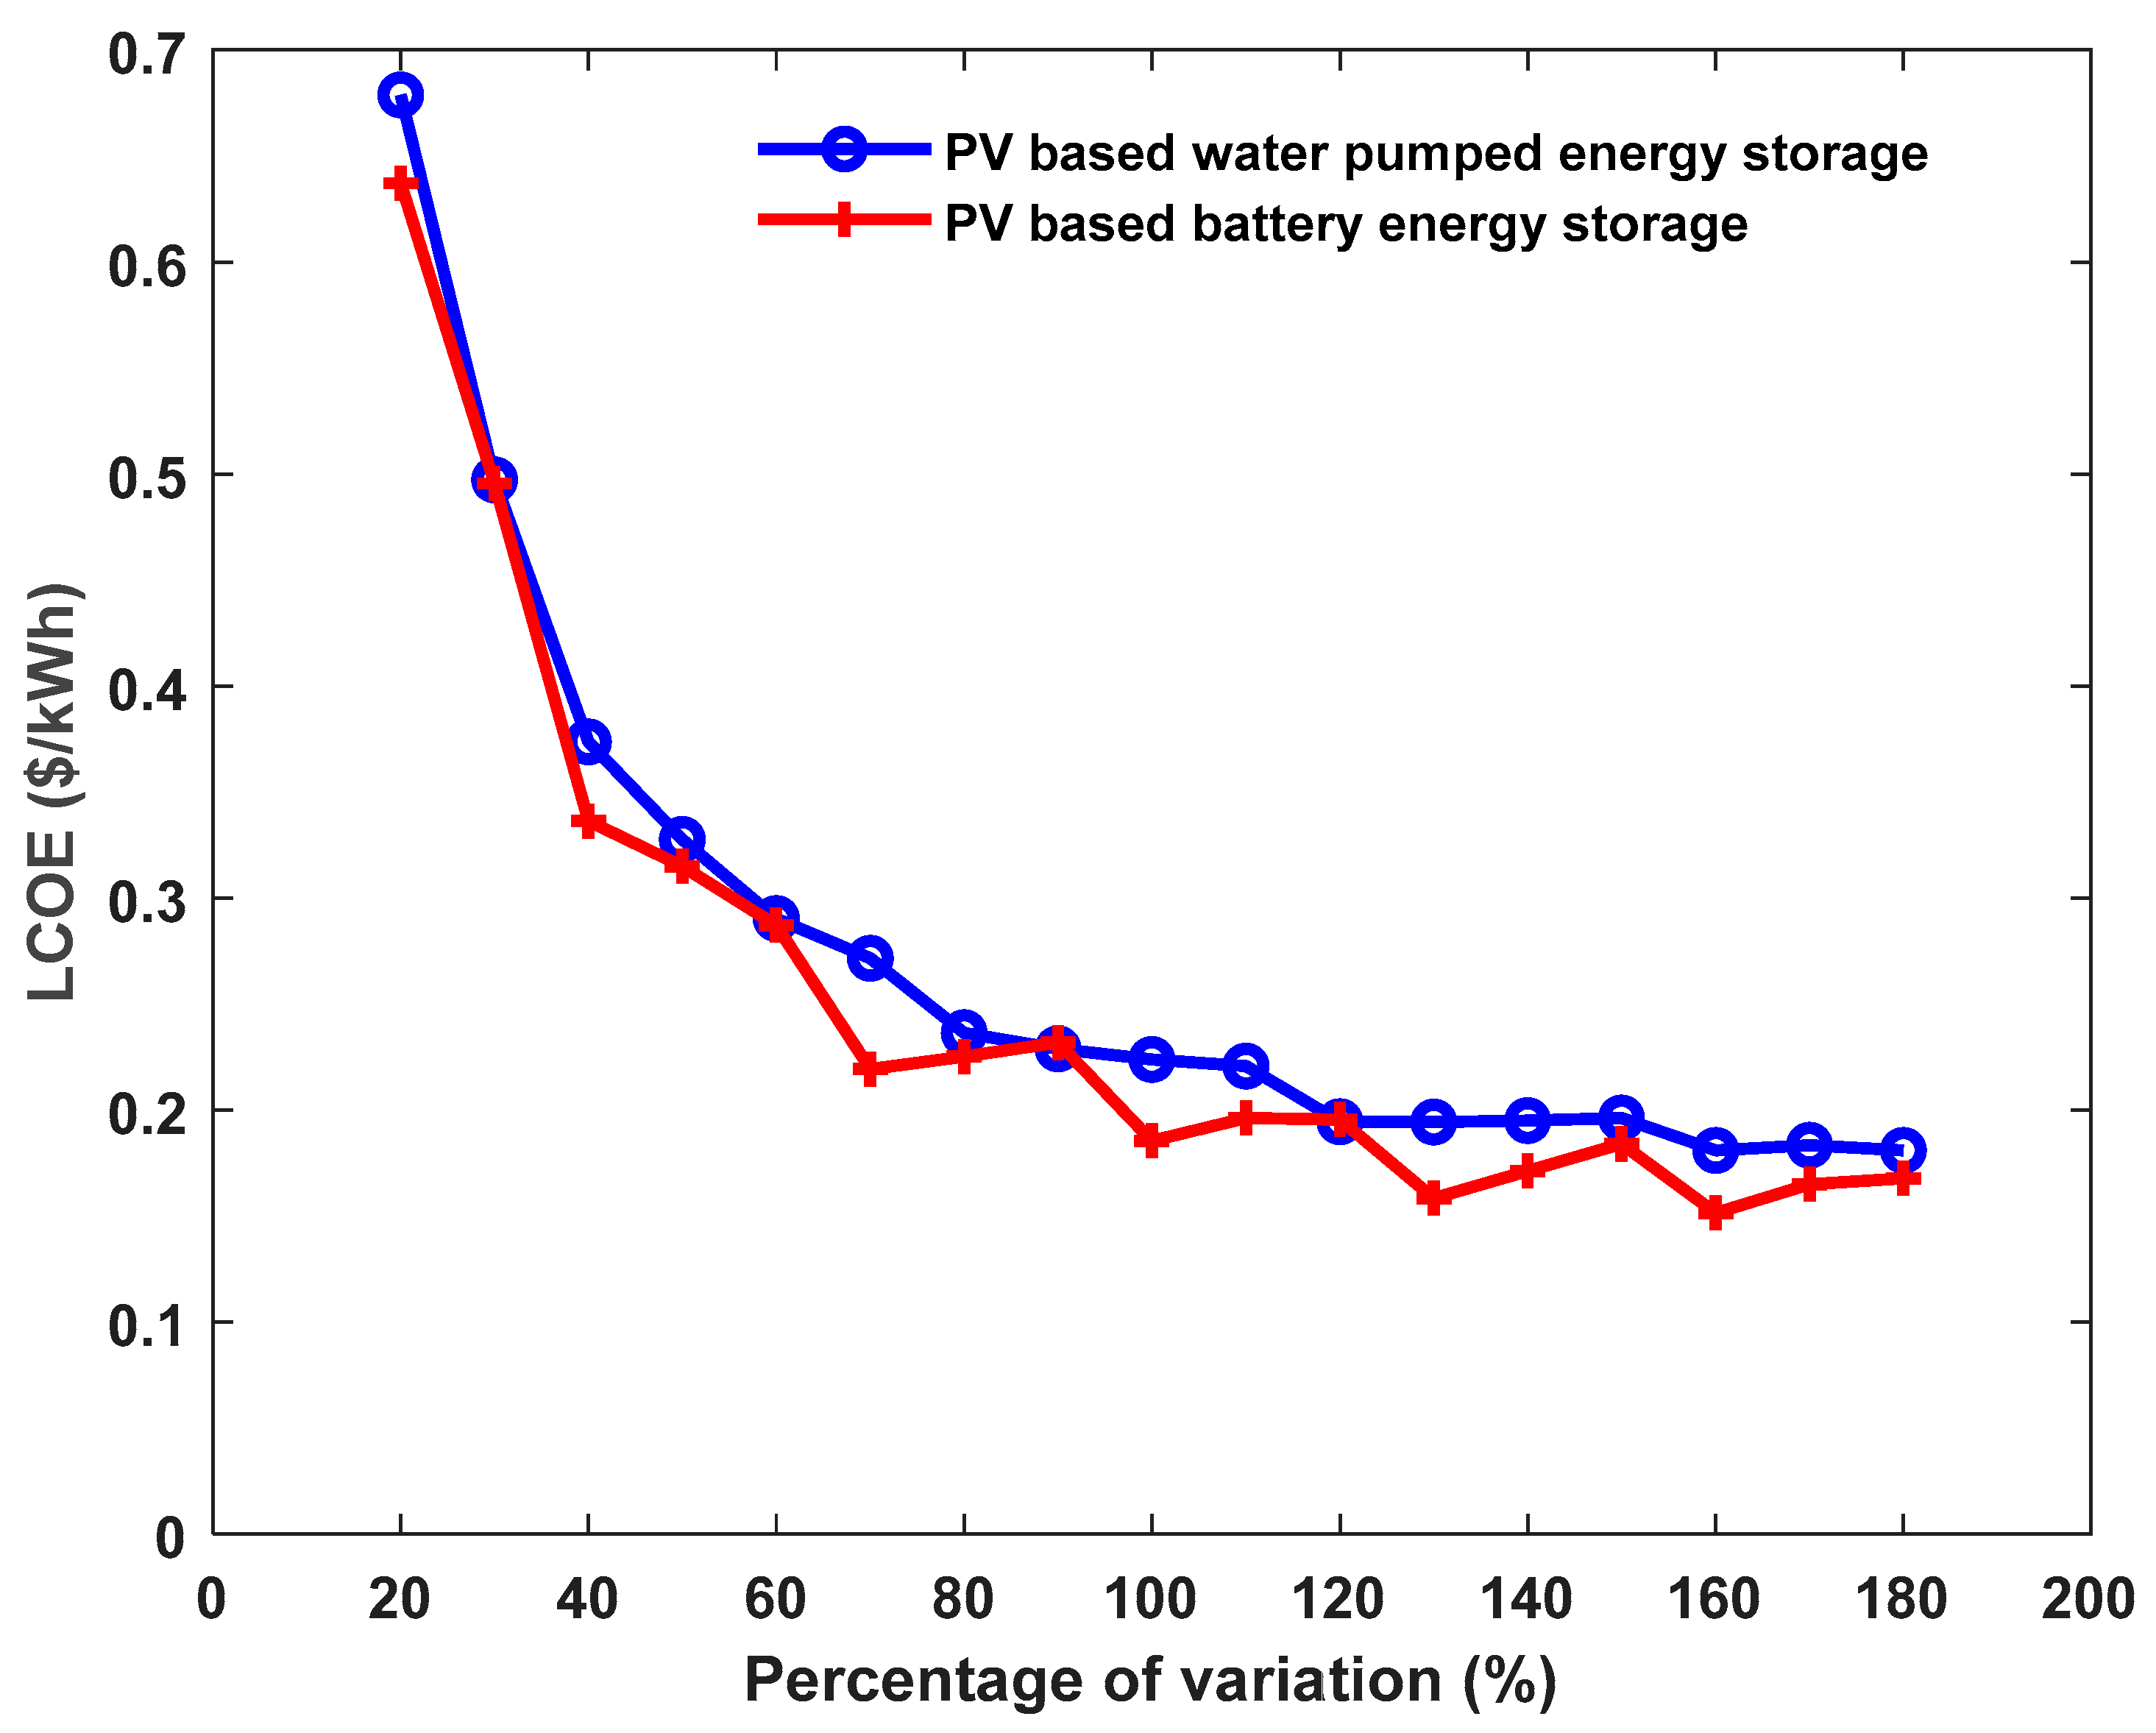
The aim of this research paper is to optimally design a cost-effective and reliable PV-system-based water-pumped energy storage for household electricity and water supply applications using a multi-objective Firefly algorithm. The contribution of this work is to (1) explore the benefits of using the PV-based water-pumped energy storage (WPES) system, (2) compare the PV/WPES with the PV energy battery energy storage for optimal decision-making, and (3) detail the operation of a PV/WPES and explore the possibility of his economic improvement, in order to increase the consideration and the interest of developing this system.

2. Presentation of the Study Site and the Proposed Systems

2.1. Description of the Study Site

The studied systems are designed to supply both electricity and water for a small community in rural or remote areas. The main objective is to optimally design a PV-energy system-based water pump energy storage and to compare the designed system with the option of using battery energy storage. The proposed configurations of the energy systems to study are presented in Figure 1 and Figure 2. In Figure 1, the PV energy generated is used to feed an electric load (household devices or appliances) and immersed solar motor pump. The pumped water is stored in an upper reservoir for household uses and to run a mini-hydroelectric turbine. The electricity generated by this mini-hydroelectric turbine is used as backup energy when the PV energy generated is unable to fulfill the electricity load demand. The stored water in the lower reservoir, after running the turbine, could be used for agricultural purposes. The main components of the energy storage for the system proposed in Figure 1 are the pump, the reservoirs, and the mini-hydroelectric turbine. The operating principle of the system configuration presented in Figure 2 is almost the same as the one described in Figure 1. However, the energy storage is assured by the battery in the system presented in Figure 2.

2.2. Study Site and Household Loads Profiles

The locality of Salak in northern Cameroon was used as a case study to perform the simulations. The geographic coordinates of Salak are 10°28′0″ N and 14°13′60″ E. The monthly hourly irradiance profile and the monthly hourly ambient temperature of Salak are, respectively, given in Figure 3 and Figure 4. It is assumed that all the days of a month have the same pattern over the various hours. Thus, the given hourly data can be considered as the average daily data corresponding to each month. The load demand is established for a population of 150 households. The daily energy demand for each household is 1515 Wh. Assuming that each household is composed of 8 persons, and considering that the daily water need for each person is 41 L, the total daily water demand of this population is 328 L. The daily household electrical and water load profiles are presented in Figure 5.

3. Mathematical Modeling

The proposed methods of analysis used to determine the optimal parameters of the system are based on model-based design and optimization methods, which are increasingly used for transdisciplinary analyzes of complex systems not only of a stationary nature, such as the proposed system, but also of complex mobile systems, i.e., land vehicles [23], mobile robots [24], or aircraft [25]. All the necessary abbreviations, symbols, and Greek symbols definitions are provided in Abbreviation section of the manuscript.

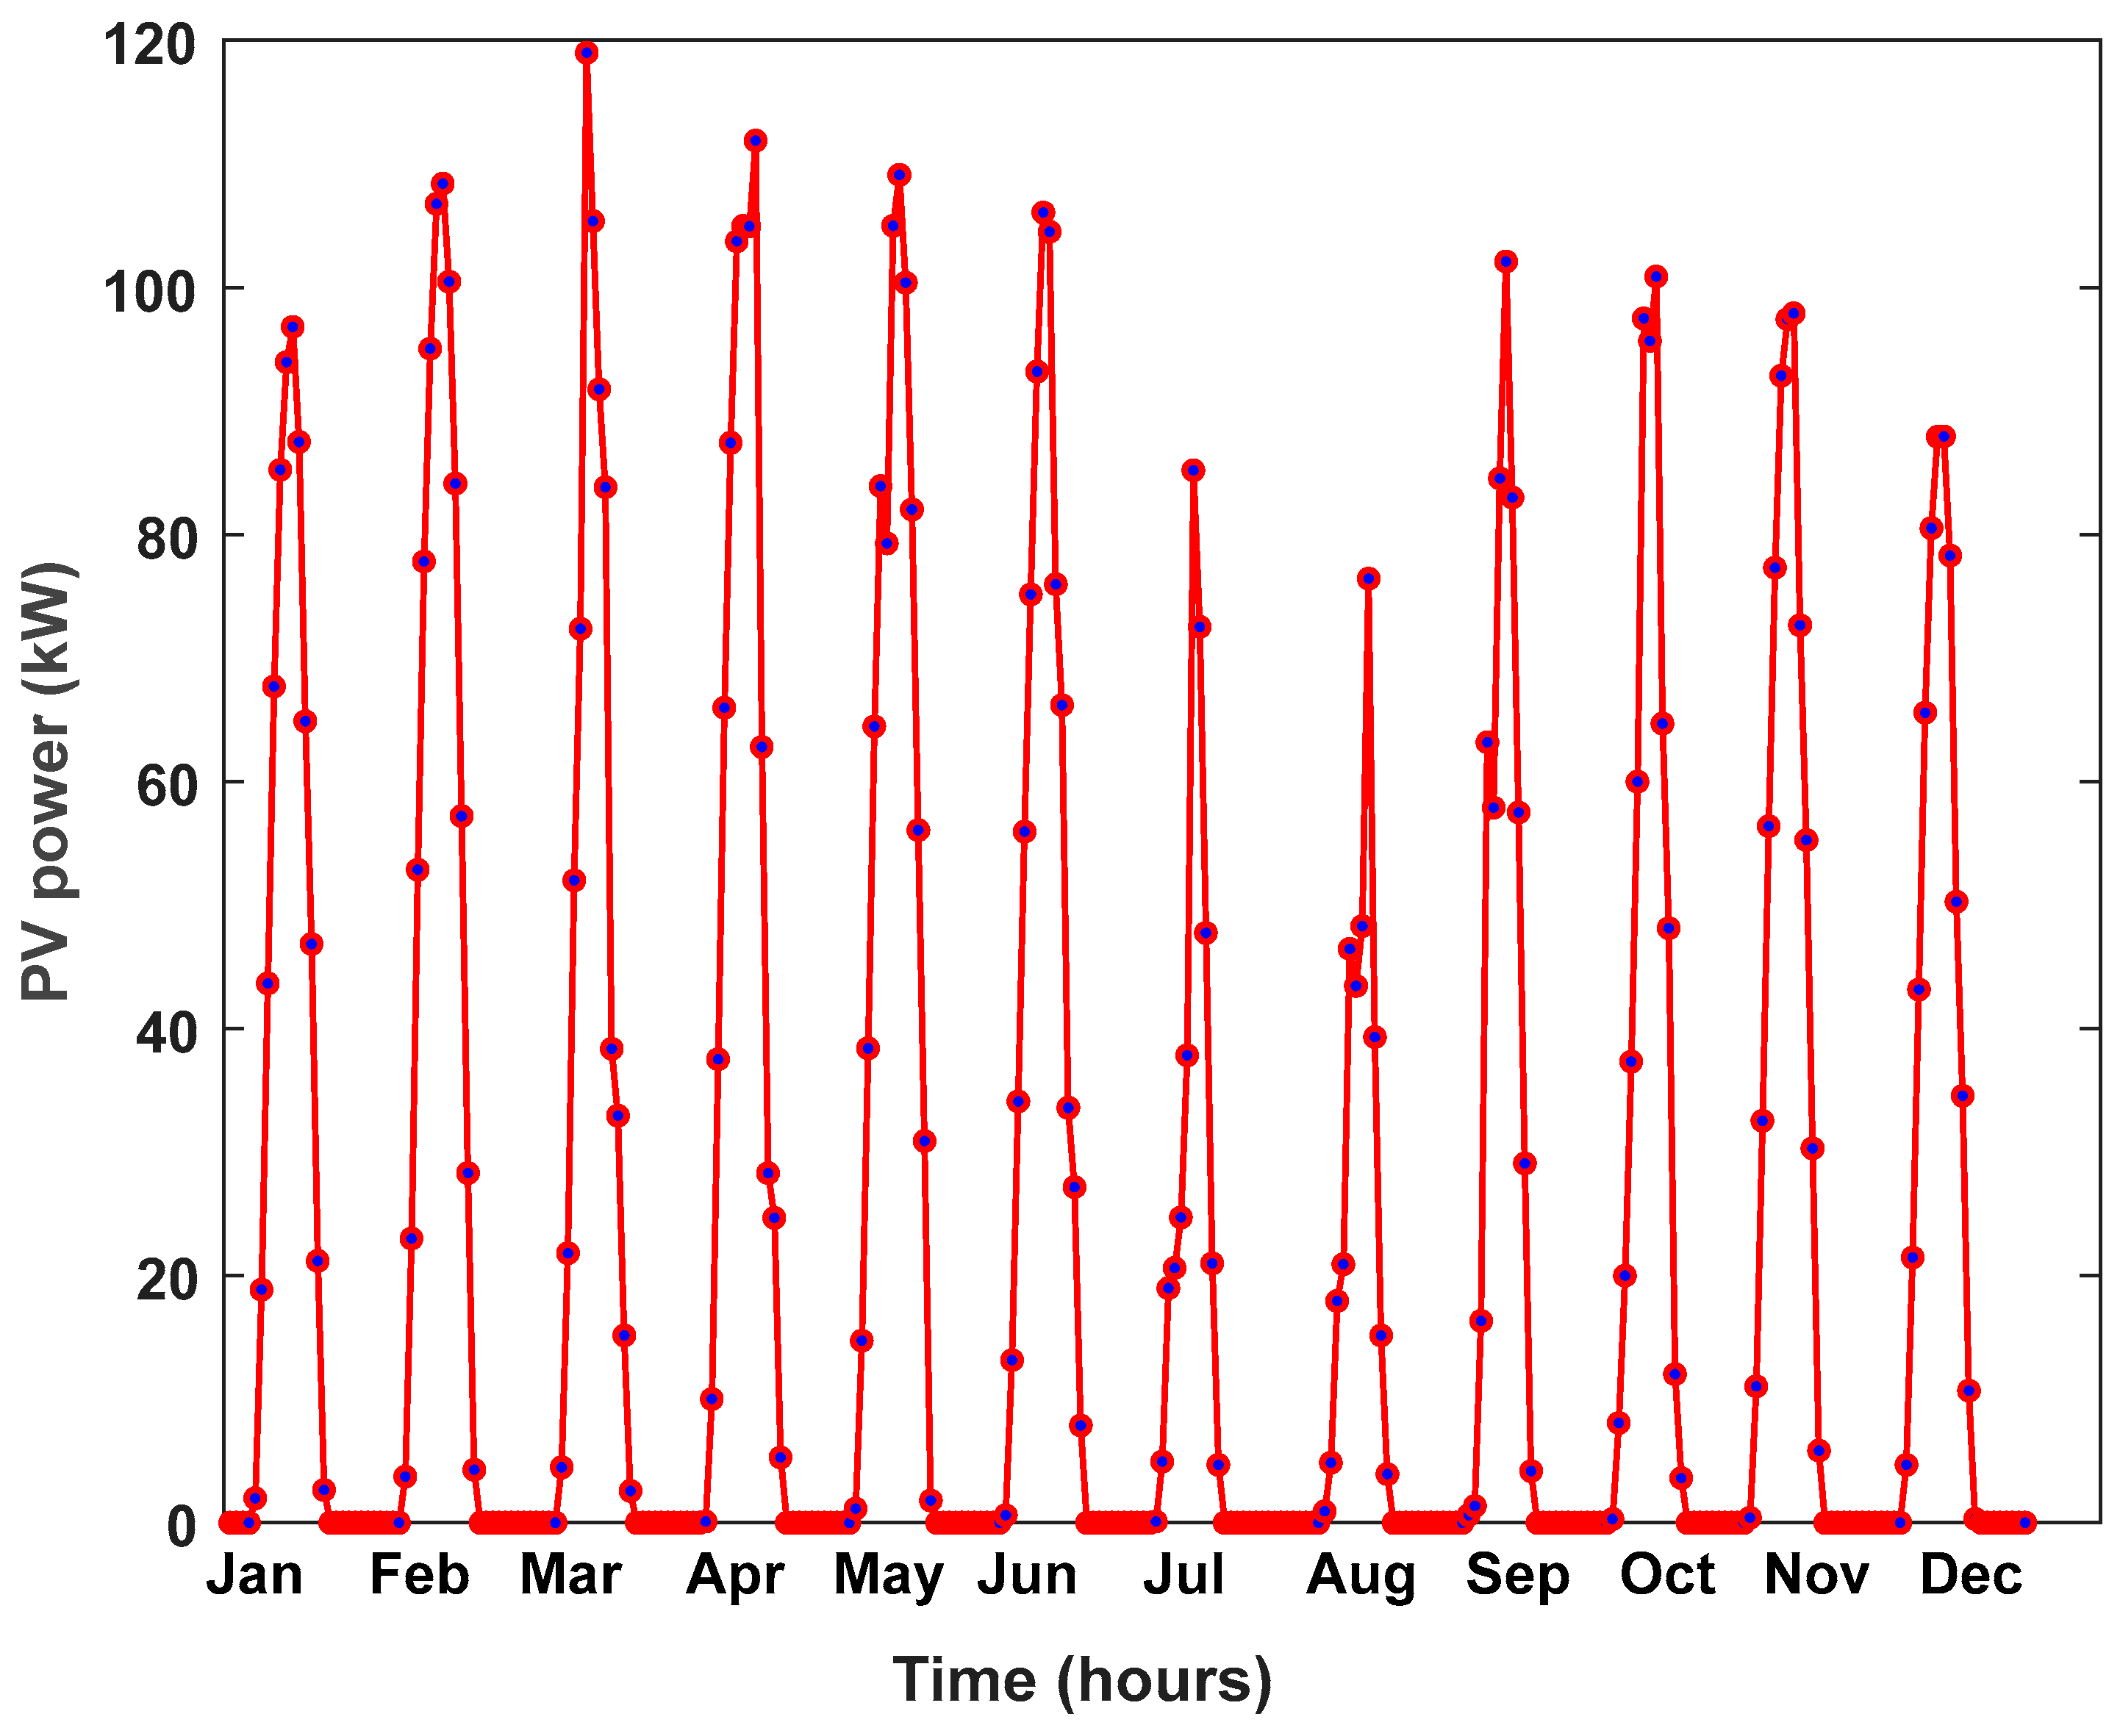
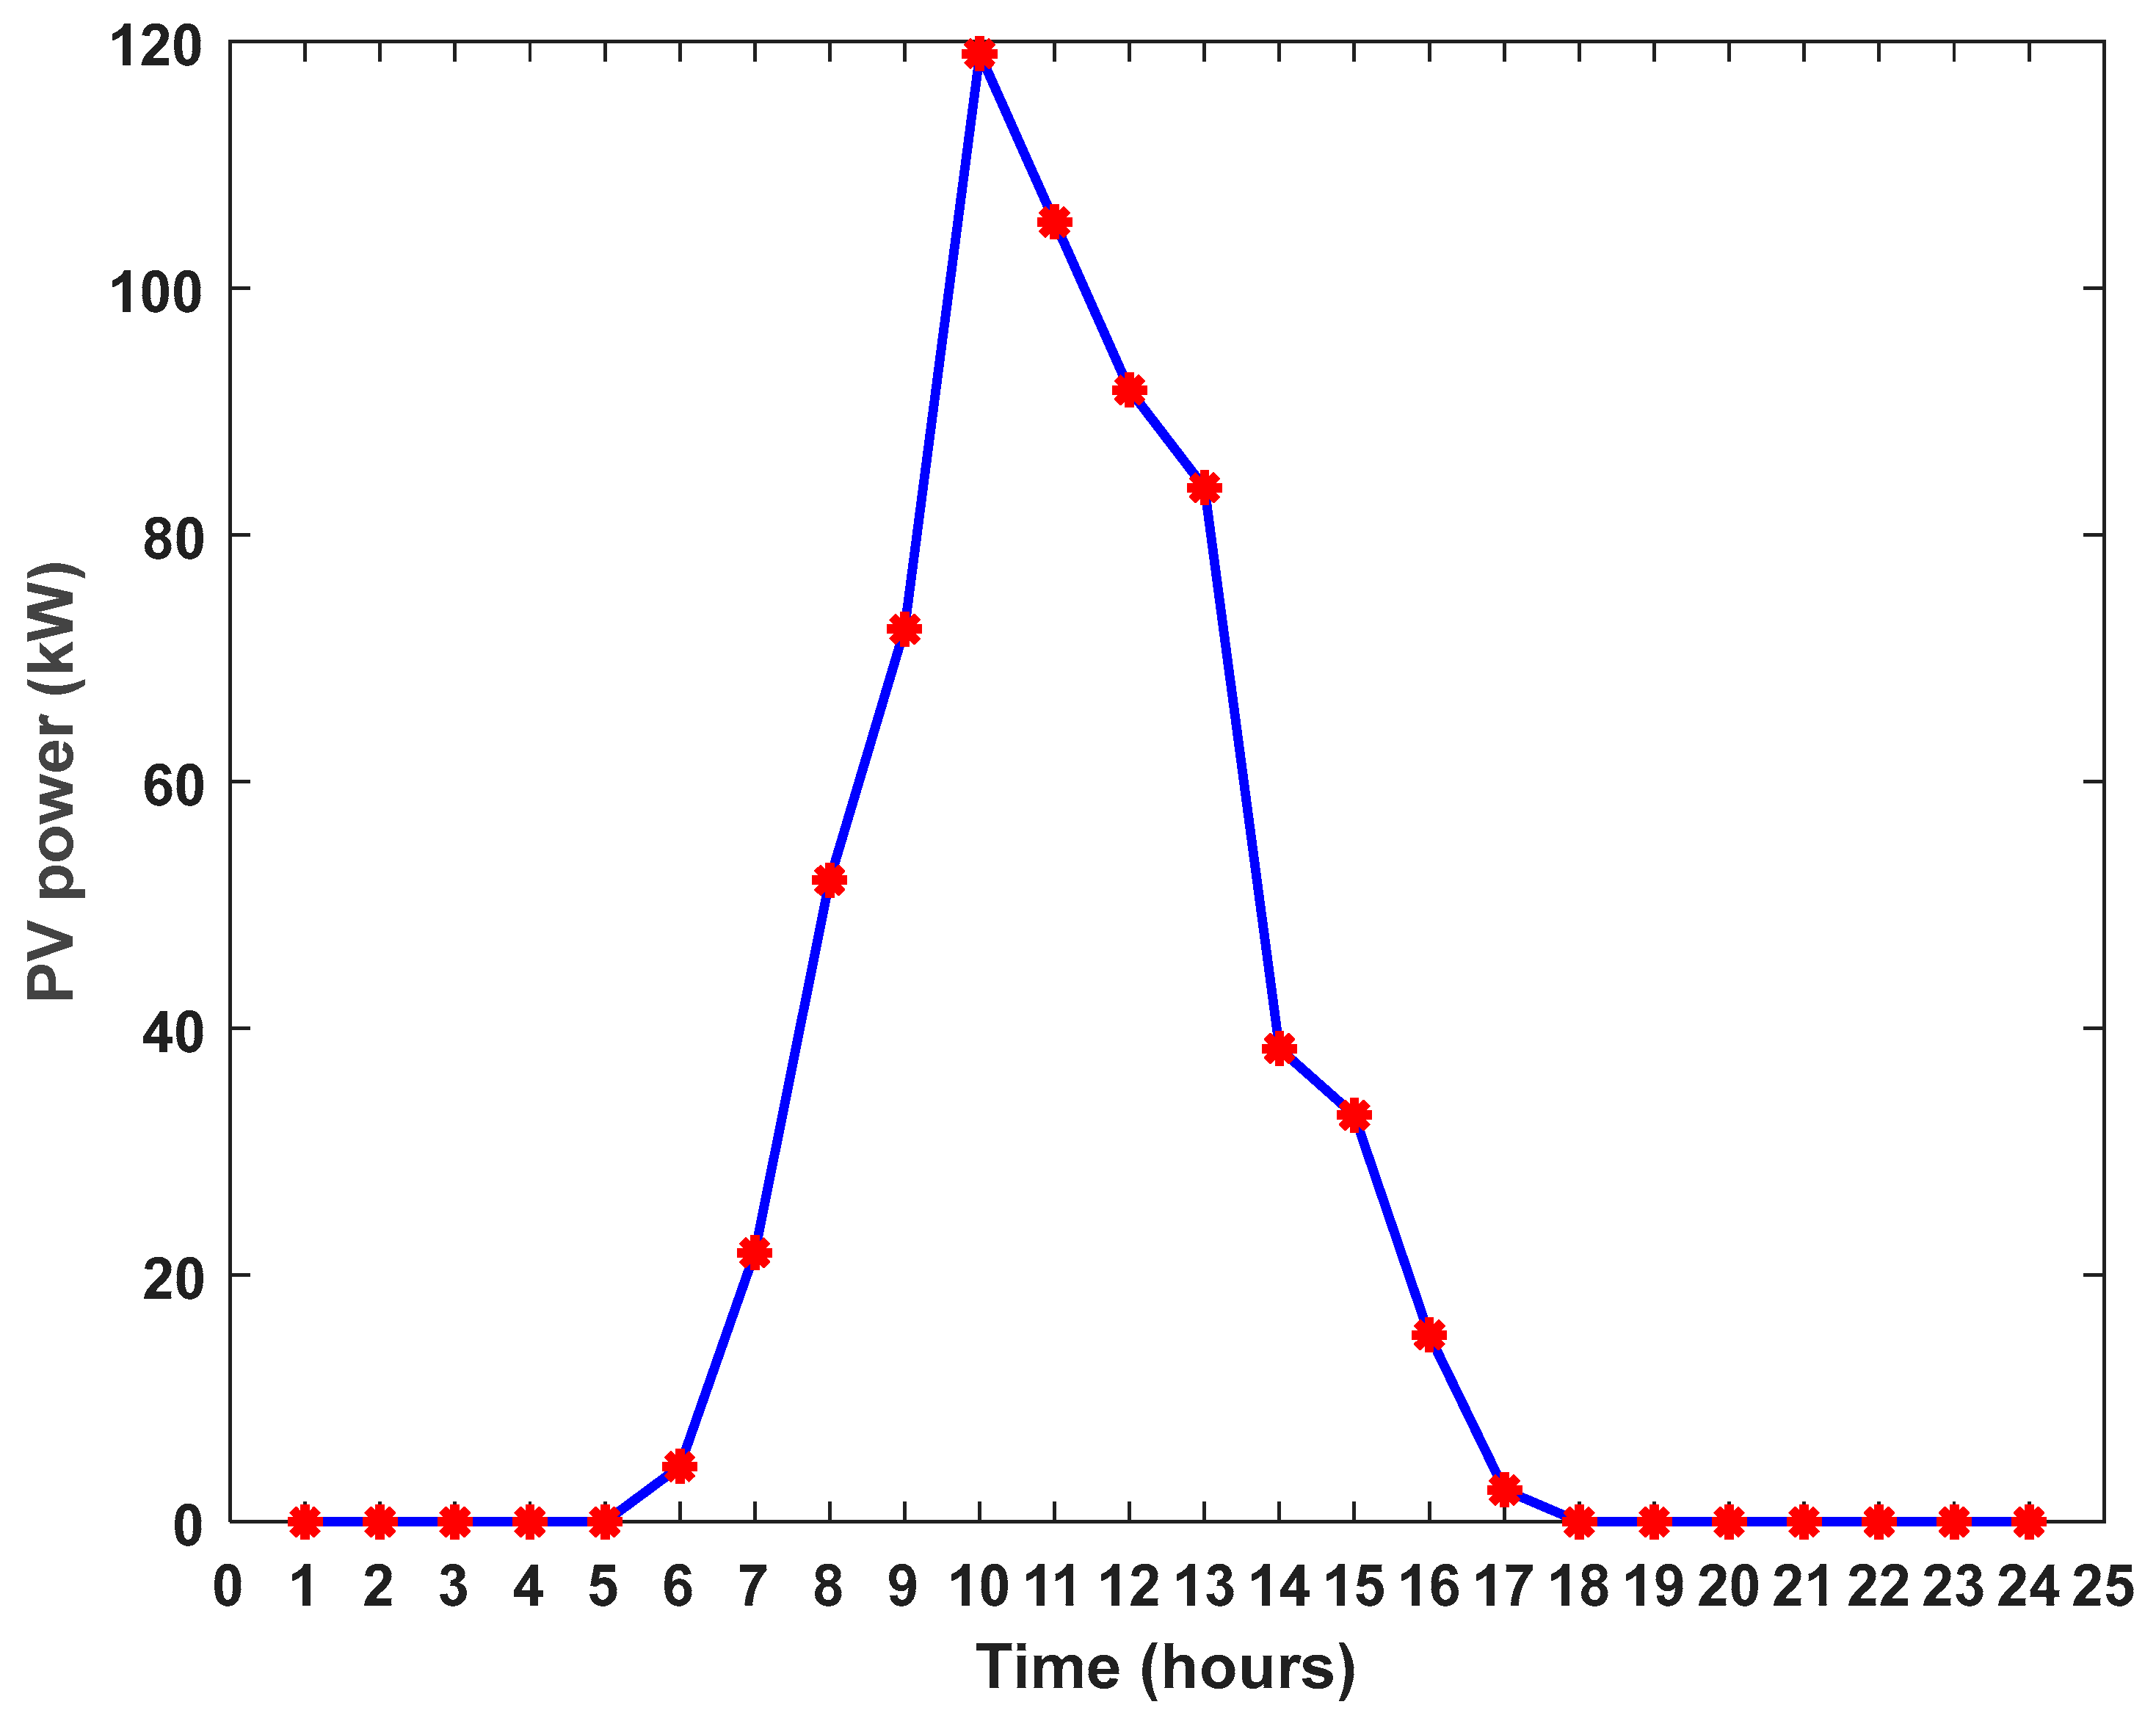
3.1. PV Output Calculation

The PV power output is calculated by the equation:
P p v ( t ) = X p v · P P v , r e f . ( G G r e f ) . [ 1 α ( T c T c , r e f ) ]
where
T c = T a + N O C T 20 800 · G
Ppv,ref is the power of the PV generator at the maximum point in standard test conditions given by the constructor, and Xpv is the number of PV modules.
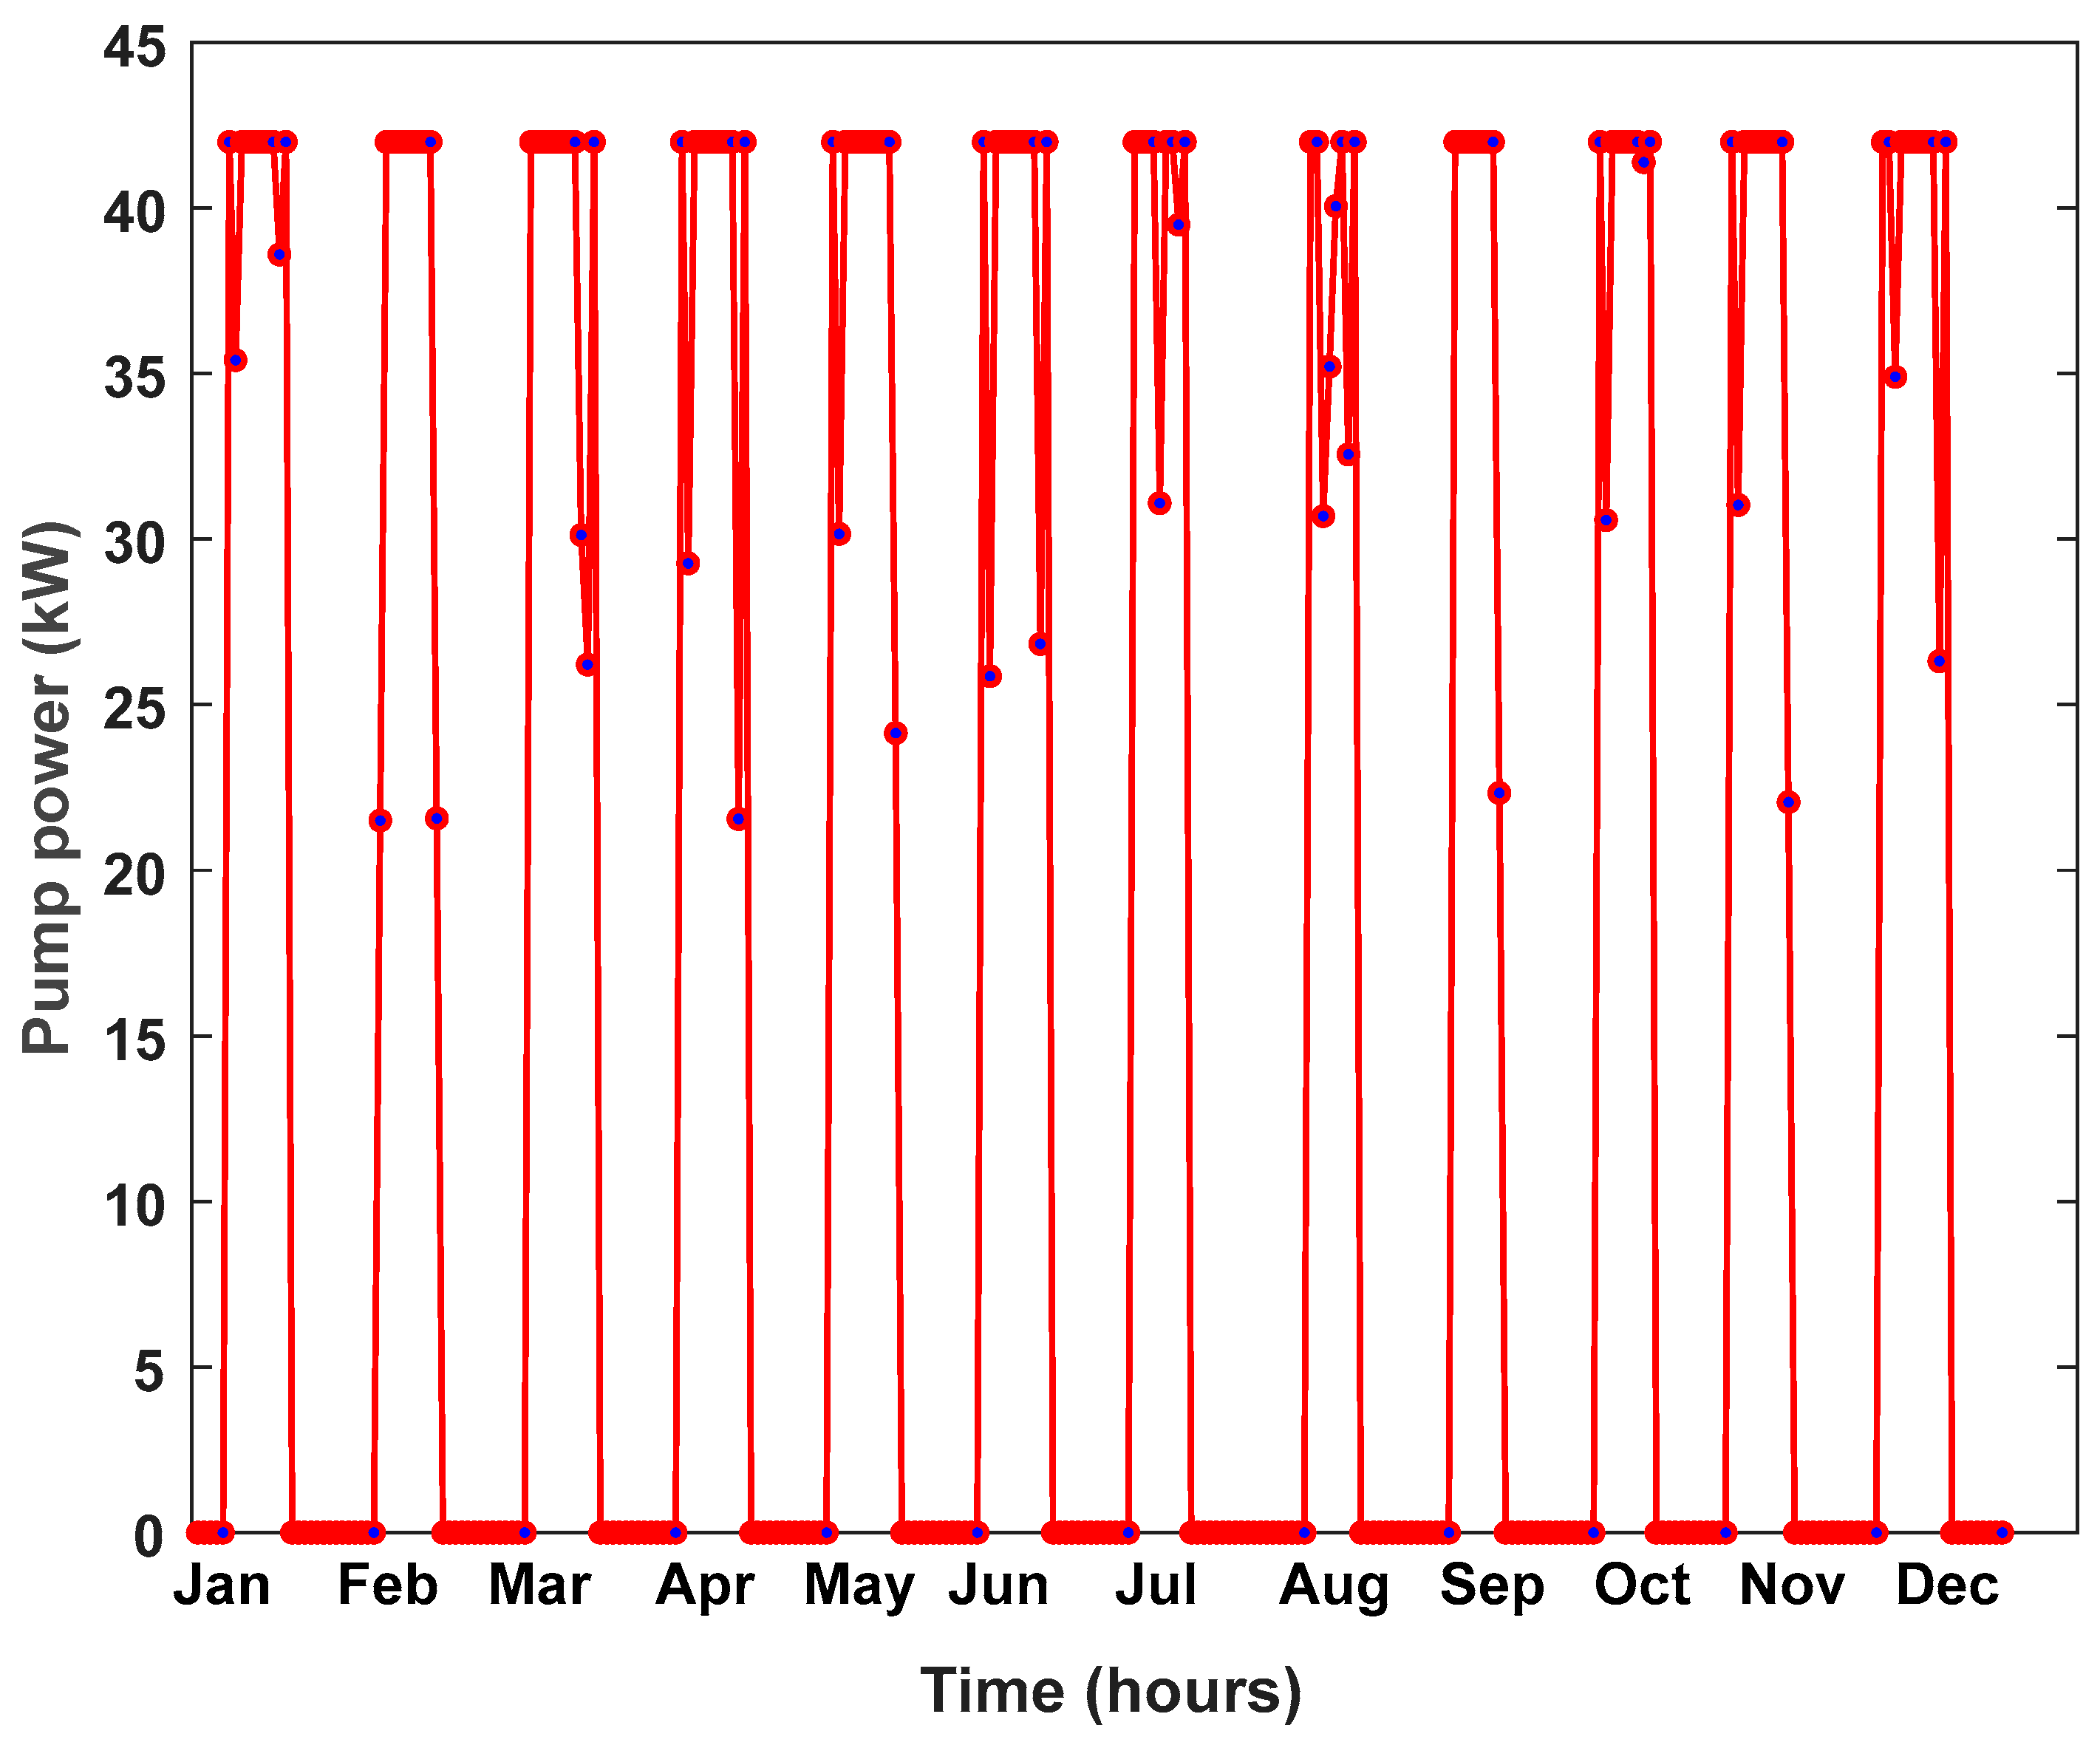
3.2. Pump Modeling

The pump’s nominal power is calculated as follows:
P p u m p _ n o m = X p × P p _ n o m
Xp is the multiplication factor of the pump’s nominal power.
At any time t, the volumetric flow rate of the pumped water is given as:
Q p ( t ) = η p × P p u m p ( t ) ρ × g × H t
In Equation (4), Ht is the total dynamic head.

3.3. Mini-Hydroelectric Turbine Modeling

The turbine power supply at any time t is given as:
P t ( t ) = η t × ρ × g × H t × Q t ( t )
The water volumetric flow rate input into the turbine is deduced from Equation (5) as:
Q t ( t ) = P t ( t ) η t × ρ × g × H t

3.4. The Household Water Supply Modeling

At any time t, the water supply for household uses is given as follows:
V D ( t ) = t t + 1 Q w ( t ) d t
Qw is the volumetric flow rate of the household water supply.

3.5. The Upper Reservoir Modeling

The maximum volume of the upper reservoir is modeled as follows:
V m a x = X r e s × ( E D ρ g H t + V D _ t )
ED is the daily electrical load demand, VD_t is the total daily water demand for household uses, and Xres is the multiplication factor of the upper reservoir volume.
The volume of water in the storage reservoir at any time t is determined by the relationship:
V R ( t + 1 ) = V R ( t ) + t t + 1 Q p ( t ) d t [ t t + 1 Q t ( t ) d t + t t + 1 Q w ( t ) d t ]
The instantaneous state of charge of the water tank is given as follows:
S O W ( t ) = V R ( t ) V m a x

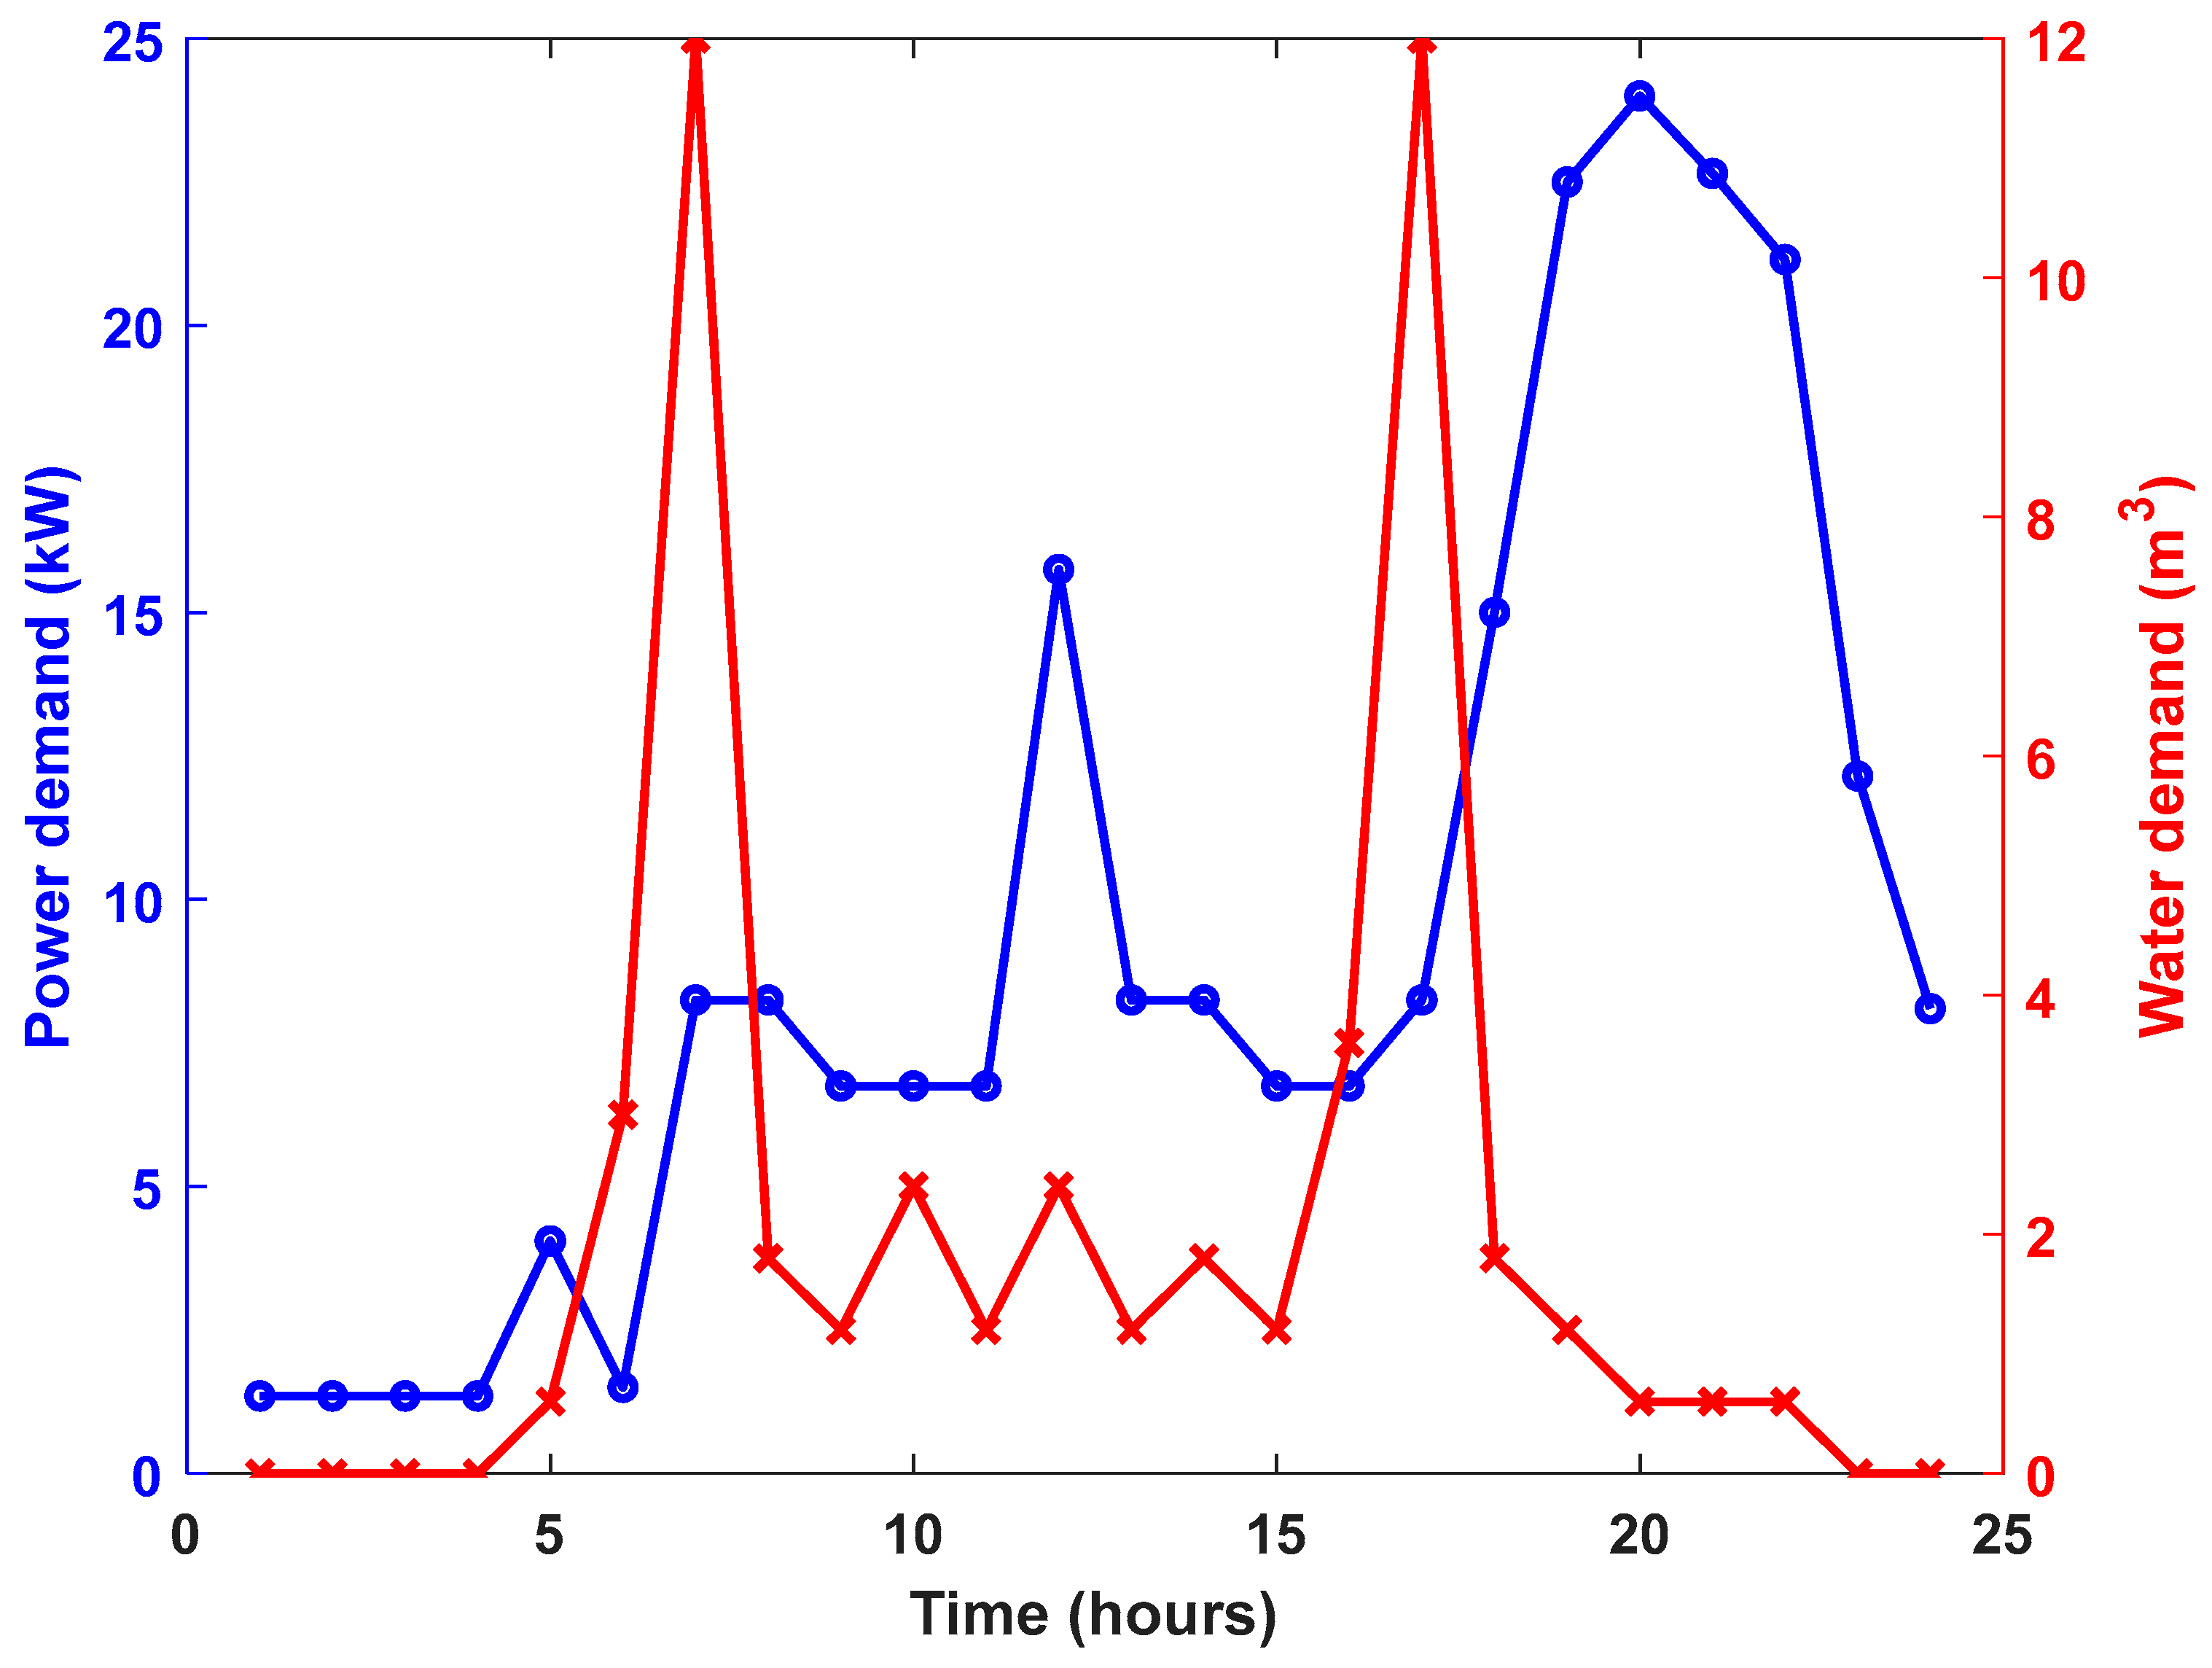
3.6. The Electrical Load Demand Modeling

The instantaneous total power demand is given in Equation (11):
P D ( t ) = P e l d ( t ) + P p u m p ( t )
The total annual energy demand is calculated as follows:
E D = t = 1 8760 P D ( t )
In Equation (11), Peld represents the power demand for household electrification.

3.7. Battery Modeling

The storage capacity of the batteries can be determined from the following relationship:
C b a t t , n ( W h ) = X b a t × M a x i m u m   d a i l y   l o a d   e n e r g y   ( W h ) D O D × η b a t t , _ c × η i n v e r t e × η r e g u l a t o r
The storage capacity and the state of charge of the batteries at any time t are respectively given by Equations (14) and (15).
C b a t t ( t ) = C b a t t ( t 1 ) + ( P p v ( t ) P D ( t ) ) × η b a t t _ c ( P D ( t ) P p v ( t ) ) η i n v e r t e r × η b a t t _ d
S O C ( t ) = C b a t t ( t ) C b a t t , n
Cbatt,n is the nominal capacity of the batteries.

3.8. Economic Modeling

The net present cost of the system includes the investment cost, the replacement cost, and the operation and maintenance costs. The net present cost of any component X of the system is given by Equation (16). Thus, the net present costs of the PV generator, the pump, the turbine, the reservoir, the battery, and the inverter, are respectively obtained by replacing, in Equation (16), X with PV, Pump, Turbine, Reservoir, Battery, and Inverter. The total net present cost of the system-based water-pumped energy storage is given in Equation (17). The total net present cost of the system-based battery storage is obtained by replacing Turbine with Battery in Equation (17).
X c o s t = X i n v + X r e p l + x = 1 N X O & M ( 1 + i f 1 + f ) x 1 X s a l v
N P C = P V c o s t + P u m p c o s t + T u r b i n e c o s t + R e s e r v o i r c o s t + I n v e r t e r c o s t
The salvage values of the PV generator, pump, turbine, reservoir, battery, and inverter are respectively obtained by replacing, in Equation (18), Y with PV, Pump, Turbine, Reservoir, Battery, and Inverter.
Y s a l v = Y r e p l × ( L i f e Y ( N L i f e Y × f l o o r ( N L i f e Y ) ) L i f e Y )
In the equations above, “floor” is a MATLAB function to obtain the integer part of a number, f is the annual inflation rate, i’ is the nominal interest rate, N is the project lifetime (years), and LifeY is the lifetime of the component Y.

4. Optimization

4.1. Operational Strategy

The PV energy delivered by the generator is determined for each time interval, here 1 h. This energy is used to supply the electrical load for household electrification and immersed solar pump in pumping water, which is stored in an elevated reservoir. The stored water is used for running a mini turbine, drinking, cooking, etc. Different cases can be considered when focusing on the PV-system-based water-pumped energy storage presented in Figure 1.
a.
When the PV energy generated is greater than the electrical load demand (excluding the pump power demand):
🗸
If the difference between the PV power and the load power (excluding the pump power demand) is greater than the maximum permissible energy of the pump ( P s _ p ( t ) > P p u m p , m a x ( t ) ), then the energy supplied to the pump is equal to the maximum permissible power, and the excess PV energy is lost. Thus, the turbine is off, meaning that the turbine power generation is zero in that case.
🗸
If the difference between the PV power and the load power (excluding the pump power demand) is in the permissible power range, that is to say, between Ppump,min and Ppump,max ( P p u m p , m i n ( t ) < P s _ p v ( t ) < P p u m p , m a x ( t ) ), then the running power of the pump is equal to Ps_p (t);
🗸
If the difference between the PV power and the load power (excluding the pump power demand) is less than the minimum permissible power ( P s _ p v ( t ) < P p u m p , m i n ( t ) ), then the turbine is on, and the turbine power generation is the difference between P s _ p v ( t )   and   P p u m p , m a x ( t ) . The pump power is P p u m p , m a x ( t ) in that case.
b.
When the PV energy generated is less than the electrical load demand (excluding the pump power demand):
🗸
The turbine is on, and the turbine power generation is the sum of the total power deficit.
🗸
The pump power is off in that case.
c.
The state of charge of the water (SOW) in the tank (the level of water in the upper reservoir) is determined for each time interval. If the volume of the water in the tank is greater than (or equal to) the maximum volume of the tank, the pump will stop working until the next time interval and will restart if the volume of the water in the tank decreases.
The operational strategy described below is also applied to the PV system presented in Figure 2, with the difference of considering the battery for energy storage. In that case, the instantaneous charge of the battery occurs when the state of charge (SOC) is less than 100% and the PV power generated is greater than the total power demand. The discharge of the battery occurs when the SOC is greater than 20% (the minimum state of charge of the battery) and the PV power generated is unable to fulfill the load demand.

4.2. Optimization

4.2.1. Presentation of the Optimization Algorithm

A double objective optimization technique based on the Firefly algorithm is used in the present study for the optimal design of the proposed systems. The Firefly algorithm is one of the metaheuristic algorithms used to solve optimization problems. Initially used to evaluate a single objective function, Yang [11], the developer of this bio-inspired algorithm, has later extended the algorithm for multi-objective optimization problems. For this purpose, Yang developed a pseudo-code consisting of a find a vector solution while minimizing the functions of assessment. This pseudo-code, presented in Algorithm 1, is used in the present study to optimally determine the parameters of the systems’ design. In this pseudo-code, the updated position p f 1 u p d a t e d of a firefly f1 is calculated with respect to the initial position p f 1 i n i t i a l of this firefly through Equation (19). The distance between the firefly f1 with another firefly f2 is calculated by Equation (20).
p f 1 u p d a t e d = p f 1 i n i t i a l + θ 0 e γ d f 1 f 2 2 ( p f 2 i n i t i a l p f 1 i n i t i a l ) + τ σ
d f 1 f 2 = k = 1 N ( μ f 1 , k μ f 2 , k ) 2
In the above equations, τ is the randomization parameter, σ is a random number drawn from a Gaussian distribution or a uniform distribution, γ is the light absorption coefficient, and θ0 is the attractiveness at d f 1 f 2 = 0 .
Algorithm 1 Double objective firefly optimization algorithm [26].
Define the assessment functions A1(p), A2(p) where the vector p = (μ1,…, μk), k is the number of variables
Initialize a population of Nf fireflies p f 1 (f1 = 1, 2, …, Nf)
While  iter ≤ Niter_max (maximum number of iterations)
  for f1 = 1:Nf
    for f2 = 1:Nf (f1 ≠f2)
        Evaluate the objectives functions
        if   p f 2 i n i t i a l  Pareto-dominates p f 1 i n i t i a l
              generate new solution  p f 1 u p d a t e d
                if  p f 1 u p d a t e d Pareto-dominates p f 2 i n i t i a l
                    p f 1 u p d a t e d  is the new solution in the Firefly population
                else
                     p f 1 i n i t i a l  is the new solution in the Firefly population
                End
          end
       End
    End
           Sort and find the current best approximation
           Update iter←iter+1
End
Results

4.2.2. Functions of Assessment and Optimization Constraints

The reliability of the system to supply both electrical energy and water must be ensured while minimizing the investment cost. The reliability of the system is measured by its capacity for supplying electricity and water without any deficiency. The function related to the system reliability calculates the sum of the loss of power supply probability (LPSP) and the sum of the loss of water supply probability (LWSP). This function, given by Equation (21), is called, in the present study, the system supply deficiency (SSD). The second function to optimize defines the total levelized cost of the energy of the system (LCOE) and is given by Equation (22).
S S D ( % ) = t = 1 8760 [ P s u p p l y ( t ) < P d e m a n d ( t ) ] + t = 1 8760 [ V s u p p l y ( t ) < V d e m a n d ( t ) ] 8760
L C O E ( $ k W h ) = N P C × C R F E D
The capital recovery factor CRF is given as follows:
C R F = i ( 1 + i ) γ ( 1 + i ) γ 1
where
i = i f 1 + f
The optimization constraints are given as follows:
P p v ( t ) + P t ( t ) P d e m a n d ( t )
V R ( t ) [ t t + 1 Q t ( t ) d t + t t + 1 Q w ( t ) d t ]
X p v , m i n X p v X p v , m a x
X P , m i n X P X P , m a x
X r e s , m i n X r e s X r e s , m a x
H t , m i n H t H t , m a x
X b a t , m i n X b a t X b a t , m a x
Xpv,min and Xpv,max are, respectively, the minimum and maximum values of the PV power multiplication factor, Xp,min and Xp,max are, respectively, the minimum and maximum values of the pump power multiplication factor, Xres,min and Xres,max are, respectively, the minimum and maximum values of the reservoir multiplication factor, Ht,min and Ht,max are, respectively, the minimum and the maximum values of the multiplication factor of the total dynamic head, and Xbat,min, and Xbat,max are, respectively, the minimum and the maximum values of the multiplication factor of the batteries capacity. The parameter specifications used for simulation are presented in Table 1.

5. Results and Discussion

5.1. Optimal Design of the PV-Based Water-Pumped Energy Storage System

The computational simulation of the system-based water pump energy storage, using Firefly double objective optimization, leads to the determination of the parameters given in Table 2. These parameters are obtained for an SSD of 0%, meaning that the system is perfectly reliable. The knowledge of these parameters leads to the calculations of the optimal characteristics of the system, given in Table 3. The optimal design of the proposed system corresponds to an LCOE of 0.224 USD/kWh. The optimal configuration of the system for 0% SSD is thus composed of 438 PV modules of 235 W, a solar pump of 35 kW, an upper reservoir of 2307.1 m3, a turbine of 51.7 kW, an inverter of 25.27 kW, and a total dynamic head of 88 m.
The daily PV power profile produced at the studied site for each month of the year is presented in Figure 6. It is shown in this figure that for the designed system, the PV peak power produced is 120 kW within the month of March. This result is obvious since this period corresponds to the hottest period of the year in northern Cameroon. As can be seen in Figure 7, the most important amount of the daily PV electricity produced for the month of March is recorded from 7:00 a.m. to 4:00 p.m.
The daily profile of the pump power demand for each month of the year is presented in Figure 8. It can be observed from Figure 8 that, mostly, the pump runs at its maximum power. This result proves the capability of the designed system to perfectly fulfill the electrical load demand requirement. The daily running time of the pump for each month of the year is presented in Figure 9. This figure shows that the maximum pump daily running time is 11 h (corresponding to the months of March, April, May, June, and December), thus giving the pump a minimum breaking time of 13 h per day, which could be advantageous to increase the pump’s lifetime. The daily profile of the pump power demand for the month of March, presented in Figure 10, shows that the pump is running only during the day (from 6:00 a.m. to 4:00 p.m.). This result proves that, for the proposed system, the pump running time slot is proportional to the time slot of the PV power availability (only during the day). Thus, the power generated by the mini-hydroelectric turbine is not used to power the pump during the night but is only used for household electrification. The sudden drop in power in Figure 10 occurs when the available power to run the pump is less than the maximum pump running power but higher than the minimum pump running power. Thus, the pump is running on this available power supply. The sudden increase in power means that the available instantaneous power to run the pump is higher than the maximum pump running power. In this case, the pump is running at its maximum power.
The daily profile of the turbine power for the months of the year is presented in Figure 11. Figure 12, which presents the daily profile of the turbine power for the month of March, shows that the turbine mostly operates during the night, corresponding to the period of the day when the PV generator is unable to produce electricity. However, for the period of the day when the PV generator produces the most important part of his energy (from 8:00 a.m. to 4:00 p.m.), the turbine is off since its output power is zero.
The comparison between the total power supply (PV power + turbine power) and the total power demand (household electrification + pump power) is presented in Figure 13. It is shown in this figure that the total load demand is fully satisfied at any time of the months of the year. The result of the comparison between the volume of the pumped water into the upper reservoir and the volume of the total water demand (including the volume of the requested water to run the turbine and the volume of water for household uses) is presented in Figure 14. This result reveals that the total water demand is fulfilled at any time of the year. The obtained results prove that the designed system responds efficiently to the load requirements.

5.2. Comparative Analysis of the PV/WPES and the PV/Battery

The optimized parameters of the system presented in Figure 2, when using the battery energy storage, are given in Table 4. These given parameters are obtained for 0% SSD, corresponding to an LCOE of 0.1857 USD/kWh. The obtained results show that the size of the PV generator, the pump, and the upper reservoir are significantly reduced when considering the energy storage with battery rather than considering the water pump energy storage. Even the total dynamic head is also reduced when using battery energy storage. The reduction of these listed parameters leads to the reduction of the LCOE. Thus, the PV-system-based battery energy storage used for electricity and water supply is more cost-effective than the PV-system-based water pump energy storage used for the same purpose. The optimized parameters given in Table 4 are used to calculate the characteristics of the system that is presented in Table 5. It comes out that the optimal PV-system-based battery storage considered in the present study is composed of 120 PV modules of 235 W, a solar motor pump of 15 kW, an upper reservoir of 590.4 m3 of volume, a battery capacity of 351.78 kWh, an inverter of 25.27 kW, and a total dynamic head of 81 m. Figure 15 compares the total power supply and the total power demand at any time of the year for system-based battery energy storage. It comes out that the power supply at any time of the year is greater than (or equal to) the power demand. This result is proof that the designed system is perfect for responding efficiently to the load demand.
A comparative analysis of the PV-system-based water-pumped energy storage and the PV-system-based battery energy storage is performed in the present study by considering the sensitivity of these systems to the variations of some parameters. The variation interval considered is from 20% to 180%. The optimized LCOE, given in Table 2 (0.224 USD/kWh for the PV-system-based water-pumped energy storage) and Table 4 (0.1857 USD/kWh for the PV-system-based battery energy storage), are considered for 100% variation of the parameters. When considering the variation of the project lifetime, as shown in Figure 16, it comes out that the LCOE of the PV-system-based water-pumped energy storage is the same as the LCOE of PV-system-based battery energy storage, respectively, for variations of 30% (corresponding to a project lifetime of 7.5 years), 60% (corresponding to a project lifetime of 15 years), 90% (corresponding to a project lifetime of 22.5 years), and 120% (corresponding to a project lifetime of 30 years). The obtained results prove that the PV-system-based water-pumped energy storage could economically challenge the PV-system-based battery energy storage when considering a project lifetime multiple of 7.5 years.
Figure 17 presents the influence of the variation in the cost of the energy storage system on the LCOE of the studied systems. The energy storage cost for the PV-based water-pumped energy storage includes the costs of the turbine and upper reservoir. The energy storage cost for the PV-based battery energy storage includes only the cost of the battery. It is shown in Figure 17 that, for the interval variation of from 20% to 60%, the PV-system-based water-pumped energy storage could be more cost-effective than the PV-system-based battery energy storage.

6. Conclusions

In this work, the optimal design of the PV-system-based water-pumped energy storage has been performed for electricity and water supply using the multi-objective Firefly optimization. A case study was considered in a rural community in North Cameroon, which has great solar potential. The obtained results proved that the designed system is reliable at 100% (0% SSD) and thus able to perfectly respond to the load requirements at any time of the year. A comparative analysis of the designed PV-system-based water-pumped energy storage was performed with a PV-system-based battery storage for the same load demands. It has been demonstrated that the optimally designed PV system configuration with battery energy storage is more cost-effective than the optimal PV system configuration with water-pumped energy storage. However, the sensitivity analysis has revealed that the PV-system-based water-pumped energy storage could be more cost-effective than the PV-system-based battery energy storage when the project lifetime is a multiple of 7.5 years or when the energy storage costs are reduced from 20% to 60% for the two systems compared. The outcomes of the present study prove that water-pumped energy storage could effectively replace battery energy storage. PV-system-based water-pumped energy storage could be well adapted for rural and remote areas by supplying both electricity and water.

Author Contributions

Conceptualization, R.Z.F. and W.S.; methodology, R.Z.F. and W.S.; software, R.Z.F.; validation, W.S.; formal analysis, R.Z.F. and W.S.; investigation, R.Z.F. and W.S.; resources, R.Z.F. and W.S.; data curation, R.Z.F. and W.S.; writing—original draft preparation, R.Z.F.; writing—review and editing, R.Z.F. and W.S.; visualization, R.Z.F.; supervision, W.S. and S.Y.D.; project administration, W.S.; funding acquisition, W.S. All authors have read and agreed to the published version of the manuscript.

Funding

The APC was funded by Silesian University of Technology.

Institutional Review Board Statement

Not applicable.

Informed Consent Statement

Not applicable.

Data Availability Statement

Not applicable.

Conflicts of Interest

The authors declare no conflict of interest.

Abbreviations

The following abbreviations, symbols, and Greek symbols are mentioned in the manuscript.
Abbreviations
PVPhotovoltaic
WPESWater pumping energy storage
BatBattery
NOCTNominal operating cells temperature (°C)
LCOELevelized cost of energy
SSDSystem Supply Deficit
ReplReplacement cost
InvInvestment cost
SalvSalvage value
CRFCapital Recovery Cost
O$MOperation and maintenance
invertInverter
Symbols
TaAmbient temperature (°C)
GSolar radiation (kWh/m2)
GrefIrradiance at reference condition (kW/m2)
GNOCTSolar radiation at NOCT (kWh/m2)
TcCell temperature (°C or K)
Tc,refCell temperature at reference condition (25 °C or 298 K)
ηbatt_cBattery discharge efficiency (%)
ηbaatt_dBattery charge efficiency (%)
ηinverterInverter efficiency (%)
xYear variation
PpvPhotovoltaic power (kW)
PpvPhotovoltaic at reference conditions (kW)
XpvNumber of PV modules
Ppump_nomPump nominal power (kW)
XpMultiplication factor of the pump nominal power
Pp_nomReference pump nominal power (1 kW)
QpWater-pumped flow rate (m3/s)
PpumpPump power consumed (kW)
ηpPump efficiency (%)
ρ Volumetric mass of water (1000 kg/m3)
gGravitational force (m/s²)
HtTotal dynamic head (m)
QtFlow rate of water into the turbine (m3/s)
PtTurbine power supply (kW)
ηtTurbine efficiency (%)
VDVolume of water demand (m3)
QwFlow rate of water supply (m3/s)
VmaxVolume of the upper reservoir (m3)
VD_tTotal daily water demand for household (m3/s)
XresMultiplication factor of the upper reservoir volume
VRVolume of water in the storage reservoir (m3/s)
SOCState of charge of water
EDAnnual energy demand (kWh)
PDTotal power demand (kW)
PeldPower demand for household electrification (kW)
Cbatt,nNominal capacity of the batteries (kWh)
CbattInstantaneous batteries capacity (kWh)
XbatMultiplication factor of batteries nominal capacity
DODDepth of discharge of batteries (%)
ηbatt_cEfficiency of charge batteries (%)
ηbatt_dEfficiency of discharge batteries (%)
ηinverterInverter efficiency (%)
ηregulatorRegulator efficiency (%)
XcostTotal investment cost of a component (USD)
XinvInitial investment cost of a component (USD)
XreplReplacement cost of a component (USD)
XOUSDMOperation and maintenance cost of a component (USD)
YsalvSalvage value of a component (USD)
YreplReplacement cost for the salvage value (USD)
Greek symbols
αTemperature coefficient (%/°C)
$US dollar

References

  1. Hegazy, R.; Mohammad, A.A.; Ghenai, C. Performance evaluation and optimal design of stand-alone solar PV-battery system for irrigation in isolated regions: A case study in Al Minya (Egypt). Sustain. Energy Technol. Assess. 2019, 36, 100556. [Google Scholar]
  2. Mosetlhe, T.; Babatunde, O.; Yusuff, A.; Ayodele, T.; Ogunjuyigbe, A. A MCDM approach for selection of microgrid configuration for rural water pumping system. Energy Rep. 2023, 19, 922–929. [Google Scholar] [CrossRef]
  3. Malla, J.M.R.; Manoj, K.S.; Subudhi, P.K. PV based water pumping system for agricultural sector. Mater. Today Proc. 2018, 5, 1008–1016. [Google Scholar]
  4. Bhayo, B.A.; Al-Kayiema, H.H.; Gilani, S.I. Assessment of standalone solar PV-Battery system for electricity generation and utilization of excess power for water pumping. Sol. Energy 2019, 194, 766–776. [Google Scholar] [CrossRef]
  5. Muralidhar, K.; Rajasekar, N. A new design and feasible architecture of DC microgrid for rural electrification. Int. Trans. Electr. Energy Syst. 2021, 31, e12973. [Google Scholar] [CrossRef]
  6. Falama, R.Z.; Bakari, H.; Dumbrava, V. Double-objective optimization based firefly algorithm of a stand-alone photovoltaic/water pumping system for water supply in rural and remote areas: A case study. J. Electr. Syst. Inf. Technol. 2021, 8, 1–25. [Google Scholar]
  7. Ibrahim, S.M.; El-Ghetany, H.H.; Shabak, A.G.M. Comprehensive design tool for sizing solar water pumping system in Egypt. Appl. Sol. Energy 2020, 56, 18–29. [Google Scholar] [CrossRef]
  8. Verma, S.; Mishra, S.; Chowdhury, S.; Gaur, A.; Mohapatra, S.; Soni, A.; Verma, P. Solar PV powered water pumping system–A review. Mater. Today Proc. 2021, 46, 5601–5606. [Google Scholar] [CrossRef]
  9. Zieba Falama, R.; Menga, F.D.; Hamda Soulouknga, M.; Kwefeu Mbakop, F.; Ben Salah, C. A case study of an optimal detailed analysis of a standalone Photovoltaic/Battery system for electricity supply in rural and remote areas. Int. Trans. Electr. Energy Syst. 2022, 2022, 7132589. [Google Scholar] [CrossRef]
  10. Sanna, A.; Buchspies, B.; Ernst, M.; Kaltschmitt, M. Decentralized brackish water reverse osmosis desalination plant based on PV and pumped storage–Technical analysis. Desalination 2021, 516, 115232. [Google Scholar] [CrossRef]
  11. Gilton, C.d.A.F.; Mesquita, A.L.A.; Hunt, J.D. Solar Photovoltaic Energy and Pumped Hydro Storage System Coupling in Southern Countries. Encycl. Energy Storage 2022, 3, 205–213. [Google Scholar]
  12. Melzi, B.; Kefif, N.; El Haj Assad, M. Modelling and optimal design of hybrid power system photovoltaic/solid oxide fuel cell for a Mediterranean City. Energy Eng. 2021, 118, 1767–1781. [Google Scholar] [CrossRef]
  13. Shaikh, A.; Shaikh, P.H.; Kumar, L.; Mirjat, N.H.; Memon, Z.A.; Assad, M.E.H.; Alayi, R. Design and Modeling of A Grid-Connected PV–WT Hybrid Microgrid System Using Net Metering Facility. Iran. J. Sci. Technol. Trans. Electr. Eng. 2022, 46, 1189–1205. [Google Scholar] [CrossRef]
  14. Zieba, F.R.; Ngangoum, W.F.; Soulouknga, H.M.; Mbakop, K.F.; Dadjé, A. Optimal Decision-Making on Hybrid Off-Grid Energy Systems for Rural and Remote Areas Electrification in the Northern Cameroon. J. Electr. Comput. Eng. 2022, 2022, 5316520. [Google Scholar]
  15. Ashtiani, M.N.; Toopshekan, A.; Astaraei, F.R.; Yousefi, H.; Maleki, A. Techno-economic analysis of a grid-connected PV/battery system using the teaching-learning-based optimization algorithm. Sol. Energy 2020, 203, 69–82. [Google Scholar] [CrossRef]
  16. Alshammari, N.; Asumadu, J. Optimum unit sizing of hybrid renewable energy system utilizing harmony search, Jaya and particle swarm optimization algorithms. Sustain. Cities Soc. 2020, 60, 02255. [Google Scholar] [CrossRef]
  17. Samy, M.M.; Mosaad, M.I.; Barakat, S. Optimal economic study of hybrid PV-wind-fuel cell system integrated to unreliable electric utility using hybrid search optimization technique. Int. J. Hydrogen Energy 2021, 46, 11217–11231. [Google Scholar] [CrossRef]
  18. Zieba, F.R.; Ngangoum, F.W.; Dadjé, A.; Dumbrava, V.; Djongyang, N. A solution to the problem of electrical load shedding using hybrid PV/battery/grid-connected system: The case of households’ energy supply of the Northern Part of Cameroon. Energies 2021, 14, 283. [Google Scholar]
  19. Falama, R.Z.; Saidi, A.S.; Soulouknga, M.H.; Salah, C.B. A techno-economic comparative study of renewable energy systems based different storage devices. Energy 2023, 266, 126411. [Google Scholar] [CrossRef]
  20. Javed, M.S. Performance comparison of heuristic algorithms for optimization of hybrid off-grid renewable energy systems. Energy 2020, 210, 118599. [Google Scholar] [CrossRef]
  21. Islam, Q.N.U.; Ahmed, A. Optimized controller design for islanded microgrid employing nondominated sorting firefly algorithm. In Nature-Inspired Computation and Swarm Intelligence; Academic Press: Cambridge, MA, USA, 2020; pp. 247–272. [Google Scholar] [CrossRef]
  22. Chaves-González, J.M.; Vega-Rodríguez, M.A. A multiobjective approach based on the behavior of fireflies to generate reliable DNA sequences for molecular computing. Appl. Math. Comput. 2014, 227, 291–308. [Google Scholar] [CrossRef]
  23. Skarka, W. Model-based design and optimization of electric vehicles. In Transdisciplinary Engineering Methods for Social Innovation of Industry 4.0, Proceedings of the 25th ISPE Inc. International Conference on Transdisciplinary Engineering; Advances in Transdisciplinary Engineering; Modena, Italy, 3–6 July 2018, Peruzzini, M., Pellicciari, M., Bil, C., Stjepandić, J., Wognum, N., Eds.; IOS Press: Amsterdam, The Netherlands, 2018; Volume 7, pp. 566–575. ISBN 978-1-61499-897-6. [Google Scholar] [CrossRef]
  24. Niestrój, R.; Rogala, T.; Skarka, W. An energy consumption model for designing an AGV energy storage system with a PEMFC stack. Energies 2020, 13, 3435. [Google Scholar] [CrossRef]
  25. Peciak, M.; Skarka, W. Assessment of the potential of electric propulsion for general aviation using model-based system engineering (MBSE) methodology. Aerospace 2022, 9, 74. [Google Scholar] [CrossRef]
  26. Yang, X.S. Multiobjective firely algorithm for continuous optimization. Eng. Comput. 2013, 29, 175–184. [Google Scholar] [CrossRef] [Green Version]
  27. BP Solar. 2019. Available online: https://www.0800sparks.com/SolarPower/pdfs/bp-essex-solar-power-3tseries.pdf (accessed on 17 October 2019).
  28. Falama, R.Z.; Kaoutoing, M.D.; Mbakop, F.K.; Dumbrava, V.; Makloufi, S.; Djongyang, N.; Salah, C.B.; Doka, S.Y. A comparative study based on a techno-environmental-economic analysis of some hybrid grid-connected systems operating under electricity blackouts: A case study in Cameroon. Energy Convers. Manag. 2022, 251, 114935. [Google Scholar] [CrossRef]
  29. Ismail, M.S.; Moghavvemi, M.; Mahli, T.M.I. Design of an optimized photovoltaic and microturbine hybrid power system for a remote small community: Case study of Palestine. Energy Convers. Manag. 2013, 75, 271–281. [Google Scholar] [CrossRef]
  30. Mahmoudimehr, J.; Shabani, M. Optimal Design of Hybrid Photovoltaic-Hydroelectric Standalone Energy System for North and South of Iran. Renew. Energy 2018, 115, 238–251. [Google Scholar] [CrossRef]
  31. Kaabeche, A.; Diaf, S.; Ibtiouen, R. Firefly-inspired algorithm for optimal sizing of renewable hybrid system considering reliability criteria. Sol. Energy 2017, 155, 727–738. [Google Scholar] [CrossRef]
  32. Jahangiri, M.; Soulouknga, M.H.; Bardei, F.K.; Shamsabadi, A.A.; Akinlabi, E.T.; Sichilalu, S.M.; Mostafaeipour, A. Techno-econo-environmental optimal operation of grid-wind-solar electricity generation with hydrogen storage system for domestic scale, case study in Chad. Int. J. Hydrogen Energy 2019, 44, 8613–28628. [Google Scholar] [CrossRef]
  33. Ma, T.; Yang, H.; Lu, L.; Peng, J. Pumped storage-based standalone photovoltaic power generation system: Modeling and techno-economic optimization. Appl. Energy 2015, 137, 649–659. [Google Scholar] [CrossRef]
Figure 1. PV-system-based water pump energy storage for electricity and water supply.
Energies 16 00307 g001
Figure 2. PV-system-based battery energy storage for electricity and water supply.
Energies 16 00307 g002
Figure 3. Monthly hourly irradiance of Salak.
Energies 16 00307 g003
Figure 4. Monthly hourly ambient temperature of Salak.
Energies 16 00307 g004
Figure 5. Electrical and water loads demand profiles.
Energies 16 00307 g005
Figure 6. PV power produced profile.
Energies 16 00307 g006
Figure 7. PV power produced profile for the month of March.
Energies 16 00307 g007
Figure 8. Pump power demand profile.
Energies 16 00307 g008
Figure 9. Pump daily running time.
Energies 16 00307 g009
Figure 10. Daily profile of the pump power demand for the month of March.
Energies 16 00307 g010
Figure 11. Turbine power profile.
Energies 16 00307 g011
Figure 12. Turbine power profile for the month of March.
Energies 16 00307 g012
Figure 13. The comparison between the total power supply and the total power demand at any time of the year.
Energies 16 00307 g013
Figure 14. Comparison between the water supply and the water demand at any time of the year.
Energies 16 00307 g014
Figure 15. The comparison between the total power supply and the total power demand at any time of the year for the PV-system-based battery energy storage.
Energies 16 00307 g015
Figure 16. Influence of the variation of the project lifetime on the COE of the studied systems.
Energies 16 00307 g016
Figure 17. Influence of the variation of the cost of the energy storage system on the LCOE of the studied systems.
Energies 16 00307 g017
Table 1. Parameter specifications used for simulation.
DesignationValue
PV specifications
Type of PV moduleBP 3 series [27]
PV rated power235 W
Initial investment1500 USD/kW [28]
Replacement cost1500 USD/kW
O&M cost1% of investment/year [29]
Lifetime (year)25
Solar motor pump specifications
Initial investment380.22 × nominal power—6360.9 [30]
Replacement costInitial investment
O&M cost100 USD/year
Lifetime (year)10
Upper reservoir specifications
Initial investment170 USD/m3 [30]
Lifetime (year)35
Battery specifications
Efficiency of charge and discharge85%
Depth of discharge80%
Minimum state of charge20%
Initial investment0.213 USD/Wh [31]
Replacement cost0.213 USD/Wh
O&M cost3% of investment/year [31]
Lifetime (year)25
Inverter specifications
Efficiency95%
Inverter utilization factor1
Initial investment715 USD/kW [28,29]
Replacement cost715 USD/kW
O&M cost100 USD/year [32]
Lifetime (year)15
Hydroelectric turbine specifications
Initial investment1000 USD/kW [33]
Replacement cost1000 USD/kW
O&M cost100 USD/year
Lifetime (year)10
Financial specifications
Interest rate8%
Annual inflation rate4%
Project lifetime25 years
Table 2. Optimized parameter values corresponding to the optimal best solution.
SSD (%)LCOE ($/kWh)XpvXpXresHt
00.2240438351.588
Table 3. The optimal characteristics of the proposed system.
Number of PV ModulesPump Power (kW)Volume of Reservoir (m3)Turbine Power (kW)Inverter Power (kW)Total Dynamic Head (m)
438352307.151.725.2788
Table 4. Optimized parameters of the system-based battery energy storage.
SSD (%)LCOE ($/kWh)XpvXpXresXbatHt
00.1857120151181
Table 5. Characteristics of the system component.
SSD (%)Number of PV ModulesPump Power (kW)Volume of Reservoir (m3)Battery Capacity (kWh)Inverter Power (kW)Total Dynamic Head (m)
012015590.4351.7825.2781
Disclaimer/Publisher’s Note: The statements, opinions and data contained in all publications are solely those of the individual author(s) and contributor(s) and not of MDPI and/or the editor(s). MDPI and/or the editor(s) disclaim responsibility for any injury to people or property resulting from any ideas, methods, instructions or products referred to in the content.

