Article

Solar Energy Powered Decentralized Smart-Grid for Sustainable Energy Supply in Low-Income Countries: Analysis Considering Climate Change Influences in Togo

by
Kokou Amega
1,*,
Yendoubé Laré
2,3,
Ramchandra Bhandari
4,*,
Yacouba Moumouni
5,
Aklesso Y. G. Egbendewe
6,
Windmanagda Sawadogo
7 and
Saidou Madougou
8
1
West African Science Service Centre on Climate Change and Adapted Land Use (Wascal), University Abdou Moumouni of Niamey, Niamey P.O. Box 10662, Niger
2
Laboratoire d’énergie Solaire, Département de Physique, Faculté des Sciences, Université de Lomé, Lomé P.O. Box 1515, Togo
3
Centre d’Excellence Régional pour la Maîtrise de l’Electricité (CERME), University of Lomé, Lomé P.O. Box 1515, Togo
4
Institute for Technology and Resources Management in the Tropics and Subtropics (ITT), Technische Hochschule Köln, Betzdorfer Strasse 2, 50679 Cologne, Germany
5
Department of Electrical and Electronics Engineering Higher Colleges of Technology, Ras Al Khaimah Women’s Campus, Ras Al Khaimah P.O. Box 4792, United Arab Emirates
6
Faculty of Economic and Management Sciences, University of Lomé, Lomé P.O. Box 1515, Togo
7
Chair for Regional Climate and Hydrology, Institute of Geography, University of Augsburg, 86159 Augsburg, Germany
8
Laboratory of Energetics, Electronics, Electrical Engineering, Automation and Industrial Computing (LAERT-LA2EI), University Abdou Moumouni of Niamey, Niamey P.O. Box 10963, Niger
*
Authors to whom correspondence should be addressed.
Energies 2022, 15(24), 9532; https://doi.org/10.3390/en15249532
Submission received: 8 November 2022 / Revised: 12 December 2022 / Accepted: 13 December 2022 / Published: 15 December 2022
(This article belongs to the Collection Renewable Energy and Energy Storage Systems)

Abstract

:
A smart and decentralized electrical system, powered by grid-connected renewable energy (RE) with a reliable storage system, has the potential to change the future socio-economic dynamics. Climate change may, however, affect the potential of RE and its related technologies. This study investigated the impact of climate change on photovoltaic cells’ temperature response and energy potential under two CO2 emission scenarios, RCP2.6 and 8.5, for the near future (2024–2040) and mid-century (2041–2065) in Togo. An integrated Regional Climate Model version 4 (RegCM4) from the CORDEX-CORE initiative datasets has been used as input. The latter platform recorded various weather variables, such as solar irradiance, air temperature, wind speed and direction, and relative humidity. Results showed that PV cells’ temperature would likely rise over all five regions in the country and may trigger a decline in the PV potential under RCP2.6 and 8.5. However, the magnitude of the induced change, caused by the changing climate, depended on two major factors: (1) the PV technology and (2) geographical position. Results also revealed that these dissimilarities were more pronounced under RCP8.5 with the amorphous technology. It was further found that, nationally, the average cell temperature would have risen by 1 °C and 1.82 °C under RCP2.6 and 8.5, in that order, during the 2024–2065 period for a-Si technology. Finally, the PV potential would likely decrease, on average, by 0.23% for RCP2.6 and 0.4% for RCP8.5 for a-Si technology.

1. Introduction

Energy is fundamental for the well-being of humans; it comes right after health, food, water, shelter, and welfare improvement such as education, comfort, and sustainable environment [1,2,3,4]. Thus, energy will remain essential to humans for life to prosper on earth [5,6]. As such, energy should be accessible to everyone under its various forms, and be affordable, reliable, and clean. Although electricity is a crucial enabler of the UN Sustainable Development Goals (SDGs) [7], it is still a daily challenge in some parts of the world. These energy issues are exacerbated in developing countries, which adds to the adverse impacts of climate change (CC). Therefore, decentralized energy resources (DER) such as renewable energy (RE) may not only play an essential role in a nation’s energy mix under present-day scenarios, but may also provide solutions to clean and reliable electricity supply to people, should the technology continue to unfold [8]. Adding to that, the smart and DER technologies are becoming environmentally friendly and more suitable for integration into the future electric power network [9,10]. Today, the aforementioned electrical system is referred to as the smart grid (SG) [11,12,13,14]. A smarter power grid is robust, resilient and reliable, and can ensure the sustainability of the whole system [15,16,17,18,19]. This new type of power grid was developed to overcome the weaknesses of the conventional electrical grid by using intelligent and net-metering strategies [20,21,22,23]. With the capability of the SG to integrate DER and enable energy storage, RE-based electricity production is projected to increase across the world [24,25,26]. Although RE is promising, some related challenges, such as intermittencies, need to be overcome [21,27,28,29,30].
Photovoltaic (PV) power is made by several solar cells in a parallel and/or series connection. These cells convert the incoming sunlight into electricity based on the photovoltaic effect. More details regarding the sunlight conversion into electricity can be found in [31,32]. Three types of PV technologies (monocrystalline, polycrystalline, and thin film or amorphous) dominate today’s global market. Each of the aforementioned technologies has distinctive features that make it unique [33]. The continuing impacts of CC in conjunction with the decline of fossil resources has given PV systems an important role in the worldwide energy mix. Hence, this globally increasing share of PV systems affects tremendously all aspects of the electricity supply and demand chains. For instance, the supply system is transformed into various decentralized systems closer to people through grid-tied, stand-alone and hybrid systems, while the transportation system is redefined by the utilization of electric cars [34,35,36]. Interestingly, the capacity of PV systems reached 849 GW in 2021. This installed capacity, equivalent to 28% of the global RE systems, has made PV the fastest growing clean energy system [37]. Concerning Togo, 6.48 MW of solar PV system was installed in 2020 [38]. This share contributes to effectively bridging and/or enhancing socio-economic development through (1) increasing access to electricity and security, (2) climate change mitigation, and (3) reducing environmental and health impacts [39,40,41,42,43]. However, PV cells’ efficiency is influenced by many factors, such as temperature, wind speed, insolation, clouds, and dust [44,45].
In that regard, studies have been undertaken in all aspects of research and development to understand the sustainability of energy systems, the nature of RE technologies and their integration into smart grids, obstacles hindering their promotion and wide-scale deployment, and possible impacts from CC. The sustainable energy system is closely dependent on the smart grid and RE promotion, as demonstrated in the literature. Islam et al. [16] conducted a review of global renewable energy-based electricity generation and smart grid systems for energy security and they pointed out that promoting RE could lead to sustainable energy. They justified their statement by arguing that the smart grid can drive the RE-base energy production to improve energy security and safety in the power system. Slootweg et al. [46] analyzed smart grids—intelligence for sustainable electrical power systems. The results of their study supported the claim that the smart grid can contribute to the sustainable energy system. Likewise, Elavarasan et al. [8], after conducting a holistic review of the present and future drivers of the renewable energy mix in Maharashtra State, India, stated that a sustainable energy sector may be enabled on the condition that a strong energy mix of RE is adopted. Anand et al. [17] and Romer et al. [47] acknowledged the variability in RE-based electricity production because of weather conditions and proposed decentralized electricity storage to address it. In this regard, Basit et al. [48] claimed that storage systems can help to reduce the challenges (power quality, reliability, power system stability, harmonics, sub synchronous oscillations, and reactive power compensation) that may occur as a result of RE integration onto the grid. Sathiyanathan et al. [49] investigated multi-mode power converter topology for renewable energy integration with smart grids. They raised challenges in solar photovoltaic (SPV) systems in terms of low cell efficiency and solar panel output affected by the climate conditions (solar irradiation and temperature) and proposed an alternative solution to control and regulate the available power generated.
Furthermore, the studies on CC have been of great interest to the energy sector and climate scientists in many parts of the world, including West Africa. Hence, the authors studied the impact of CC on photovoltaic potential (PVP), wind density, hydropower, and concentrated solar power (CSP) at regional and continental level. The West African researchers investigated the impacts of CC on RE resources across the region utilizing climate models. Sawadogo et al. (2019) studied the impact of global warming on the PVP utilizing 14 different simulation models at a distance of 50 km resolution run under RCP 2.6 and 8.5 scenarios in West Africa. They considered the deployment of monocrystalline technology. As a result, they found that CC may induce a decrease of 3.8% in PVP in any country in the region under the RCP8.5 scenario. This reduction may be plausible even under a 3 °C increase in global warming. In the following year, they conducted another study on the current and future potential of solar and wind energy in Africa utilizing the Regional Climate Model version 4 (RegCM4) calibrated at a 25 km resolution. Their results indicated a 2% decrease in PVP over the African continent in the mid-century under RCP8.5 [50]. Other authors investigated the impacts of future global warming on solar irradiance using RegCM4 driven by two global climate models (GCMs) at a 25 km resolution run under RCP2.6 and 8.5 [51]. This study was conducted over five selected Togolese cities across the five regions. The results revealed that there would be a rise in air temperature, while solar irradiance would decrease in the near future 2031–2060 and far future 2070–2099.
It is worth studying the potential of RE under the changing climatic conditions of a region or country. Unfortunately, the impact of CC on RE has yet to be assessed in Togo, much less the utilization of the RegCM4 CORDEX-CORE method to assess this effect down to the five administrative regions. The Togolese RE potential and its decentralized power systems are currently affected by the local climate. Therefore, to better decipher the local impacts of CC on PVP in the entire country, and contribute to setting a conducive environment for decentralizing smart power systems to achieve sustainable energy system, it is important to regionalize the utilization of the high-resolution model (RegCM4 CORDEX-CORE).
The government integrated solar energy into the energy mix to achieve 100% green power by 2030 through decentralized power systems such as grid-connected PV, solar mini-grids, solar kits, and solar public lights [52]. However, it is worth pointing out that this policy may seem too ambitious and unrealistic due to the inherent variability of RE.
The main objectives of the study are to: (1) assess the impact of CC on three kinds of PV cells (Amorphous silicon(a-Si), Monocrystalline(Mono-Si), and Polycrystalline(Poly-Si)) in view of solar power plants installation across the country, (2) investigate the temperature variations due to CC and PV generation potential based on the RegCM4 CORDEX-CORE ensemble, (3) utilize four weather variables (solar irradiation, air temperature, wind speed at 10 m above ground, and relative humidity) to seek meaningful and conclusive results, and (4) study the effects of CC in Togo, as a whole, and then drill the research down to the administrative regions (a contribution to solar power project prefeasibility studies), as each has a specific climate.
Therefore, the study intends to make several contributions to the country and beyond.
  • First, the impacts of CC on solar energy were investigated in Togo. The investigations were further downscaled to each of the five regions to gain deeper insights. Hence, this scheme has shed more light on some regional discrepancies that were previously harder to decrypt from the bigger picture, viz., impacts at the country level.
  • Second, the study filled in the gaps by analyzing the impacts of CC on PV cell temperature, considering three types of cell technology (amorphous, monocrystalline, and polycrystalline) and the above-mentioned weather variables. An additional variable was the Togolese PVP, at large, broken down into its five administrative regions. Results were obtained via CORDEX-CORE.
  • Third, the study gave an effective picture of the Togolese administrative regions’ weather conditions over the years. The understanding of this picture may help monitor the production of renewable energy for decades to come.
  • Finally, the knowledge of the present study could help not only to better select PV technologies, but also to enact green policy, taking into consideration the short and long-term climate interactions on RE.
The following section presents the data and method applied, while the results and discussion are presented in Section 3. Lastly, the conclusions are developed in Section 4.

2. Data and Methods

This section introduces the study area, clarifies the data, and elaborates on the methods. The datasets in question were model-simulated data and were derived from the Regional Climate Model version 4 (RegCM4). The approach was the energy rating methodology that offers the possibility to estimate the PV potential based on the knowledge of the total insolation for a specific period, using a performance ratio [50,53,54,55,56]. This method was preferred for the present work because the PVP is strongly dependent on weather variables. The approach could, therefore, serve as means to analyze the influence of climate change on PV technology.

2.1. Study Area

The land mass area under consideration is Togo. The country has five administrative zones: (1) Maritime, (2) Plateau, (3) Centrale, (4) Kara, and (5) Savannahs. Thus, the study focused on these five regions, as each has a unique climate. Togo is located in West Africa between 6° and 11° N latitude, and between 0°05′ W and 1°45′ E longitude. The total area is 56,600 km2. The geographical position of regions and their areas are presented in Table 1.

2.2. Data

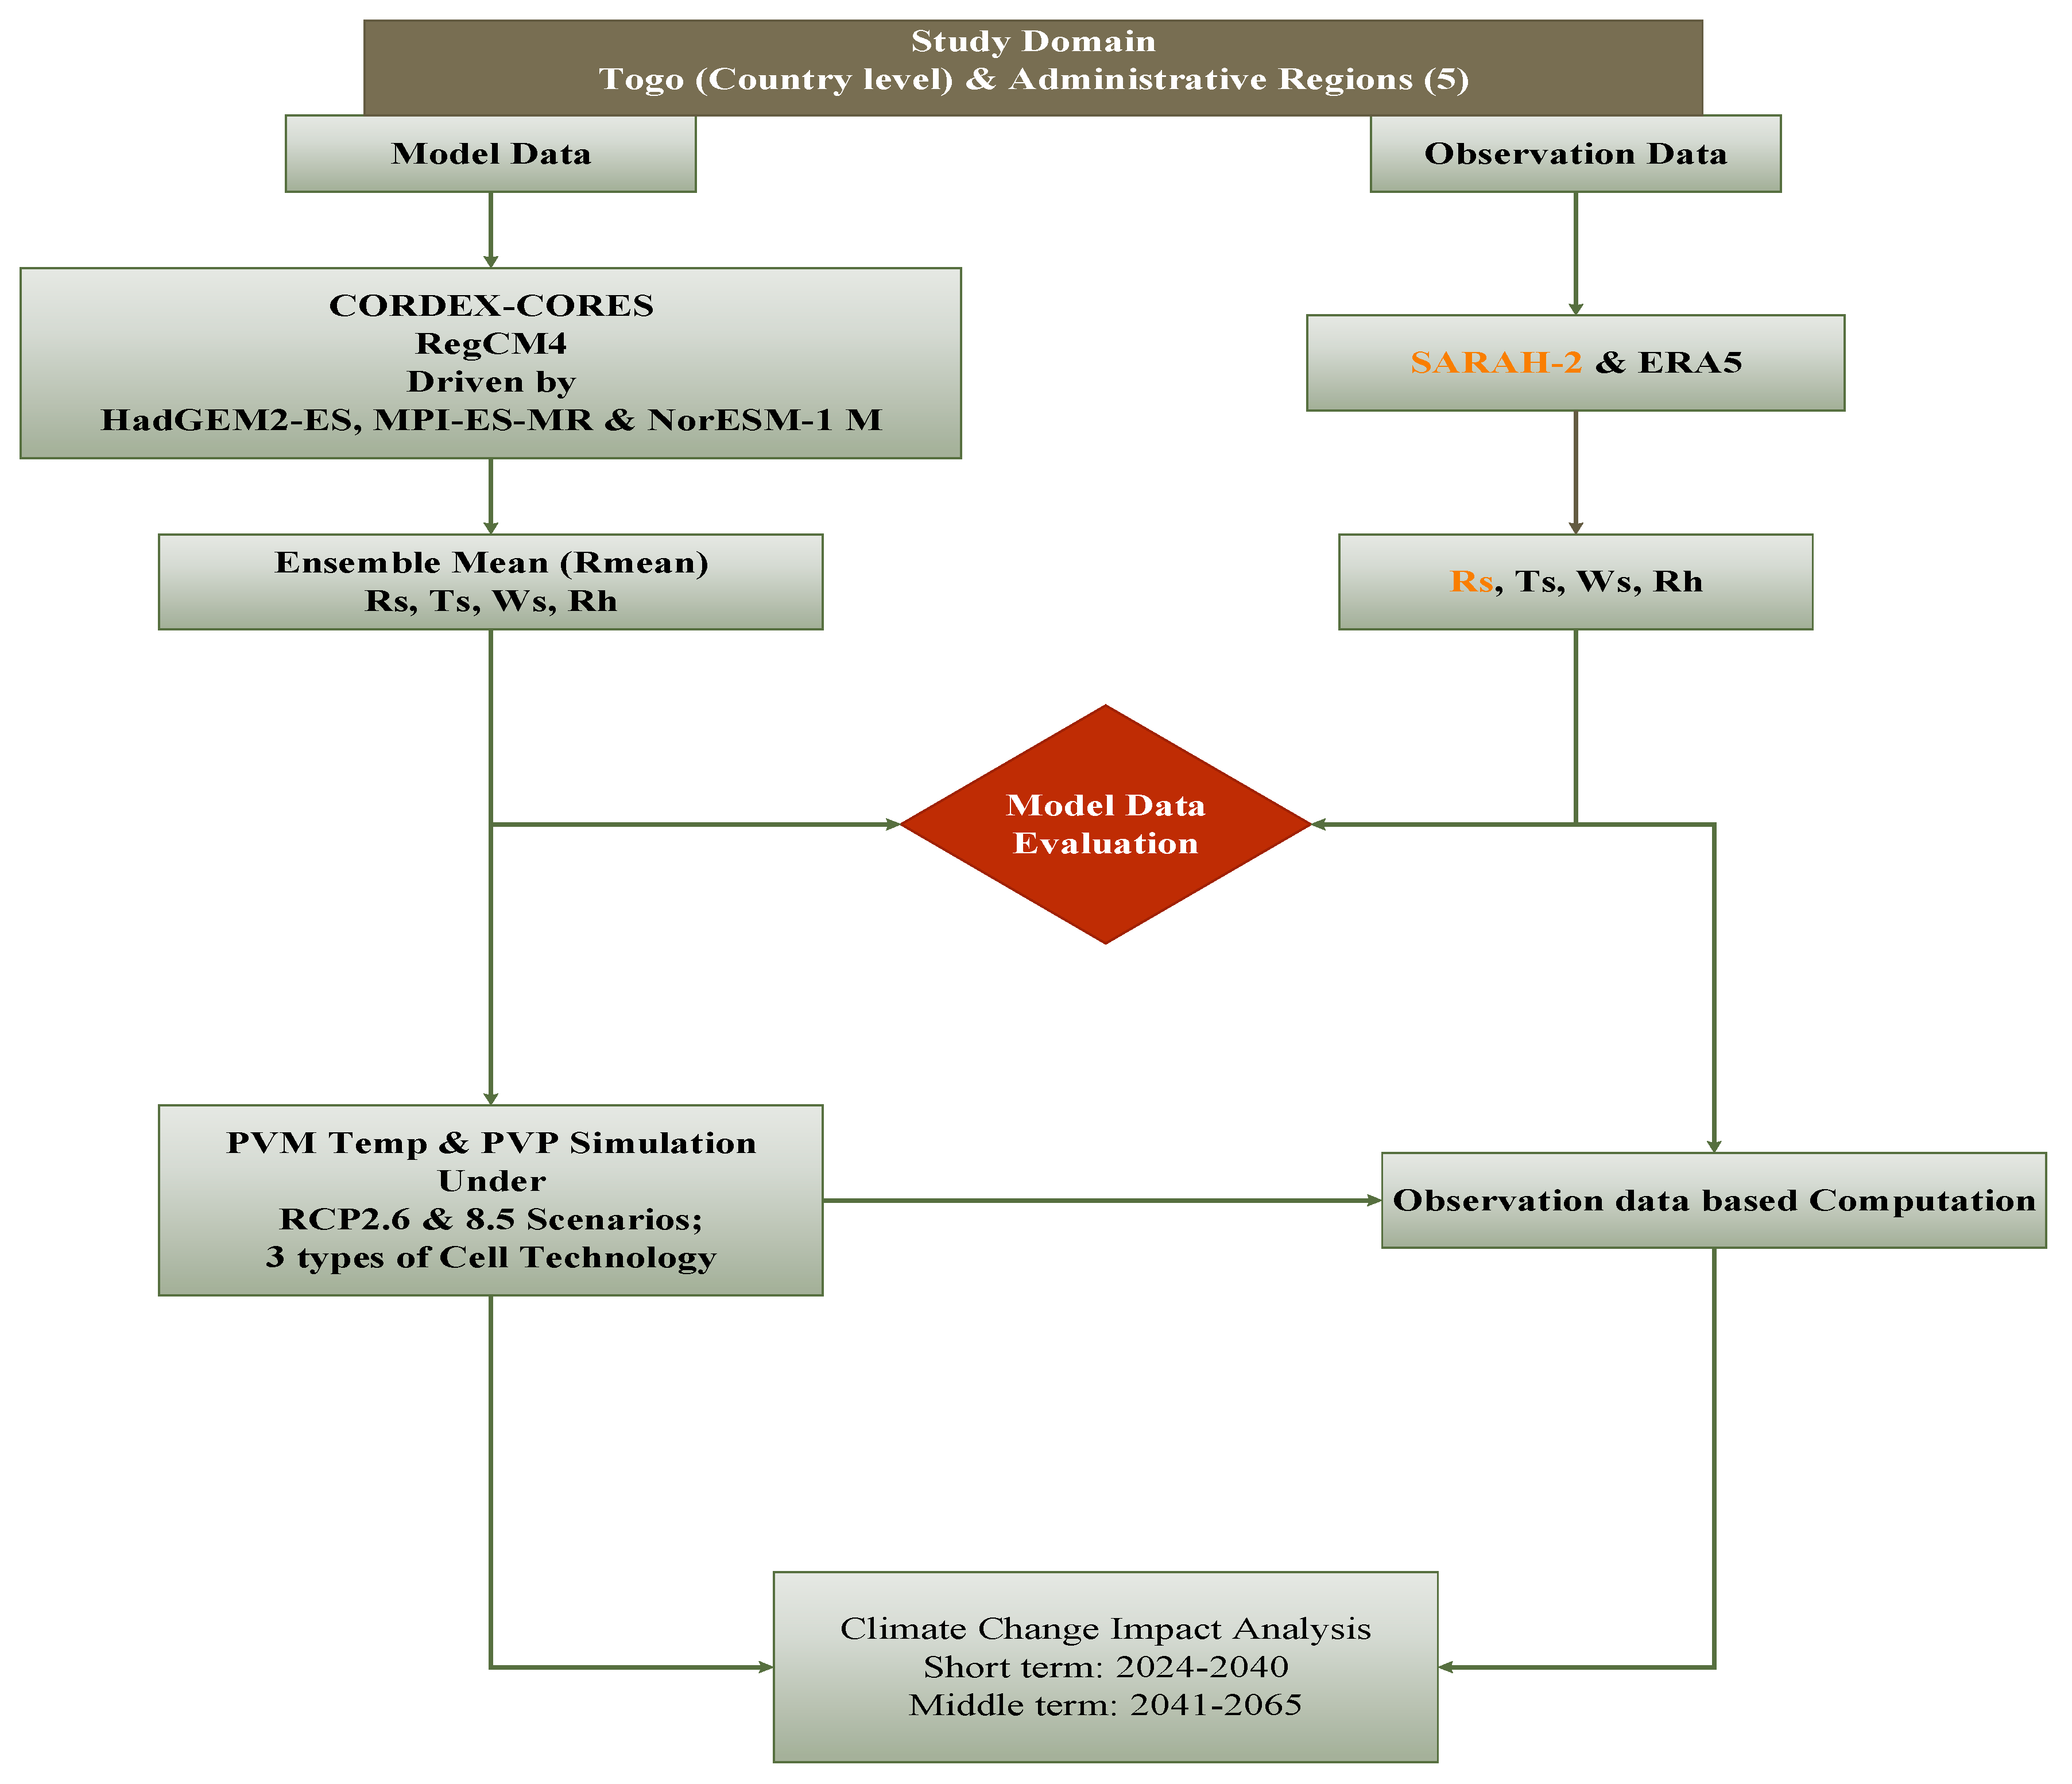
2.2.1. CORDEX-CORE Datasets and RCP Scenarios

The climate simulation data under consideration are from the Coordinated Regional Climate Downscaling Experiment-Common Regional Experiment (CORDEX-CORE) developed to support climate services [57], as presented in Table 2. CORDEX-CORE datasets perform well in relation to most CORDEX domains. They also represent well the climate sensitivity spread in the CMIP5-ESM as highlighted in the literature [50,58,59,60,61,62,63,64]. The simulation’s period spans from 1970 to 2100 for two representative and concentrative pathways (RCPs): RCP2.6 (low GHG concentrations) and RCP8.5 (high GHG concentrations) [65].
Within the framework of this research, monthly Rs, Tas, Rh and Wspd at 10 m above the ground were selected as model data. The periods 1976–2005, 2024–2040, and 2041–2065 were chosen as reference period, i.e., near future and mid-century, respectively. Ensmean stands for a mean of a variable of the nine models under CORDEX-CORE

2.2.2. Reference Datasets

Table 2 presents as well the reference data that were considered as observation data.
Table 2. Model and observation datasets.
DatasetsDescription
MODEL DATARegional Climate Model version 4 (RegCM4): Ta, Rs, Wspd & RhCoordinated Regional Climate Downscaling Experiment-Common Regional Experiment (CORDEX-CORE) initiative [57]
Nested in three Coupled Model Intercomparing Project—Phase 5 (CMIP5) Earth System Models (ESMs) Hadley Center Global Environment Model version 2, HadGEM2-ES [74,75]
Max Planck Institute Earth System Model, MPI-ES-MR [76]
Norwegian Earth System Model, NorESM-1 M [77,78]
25 km of the resolution
OBSERVATION DATASARAH-2: RS (1986–2015)Satellite Application Facility on Climate Monitoring (CM-SAF), second edition of the Surface Solar Radiation Data Set-Heliosat Edition 2, SARAH-2 [66]
ERA5 reanalysis: Ta, Wspd and Rh (1976–2005)European Centre for Medium-Range Weather Forecasts (ECMWF)’s fifth-generation reanalysis with a horizontal resolution of ~31 km [55,68]
The reference data used to evaluate the Rs dataset were from the second edition of the Surface Solar Radiation Data Set-Heliosat Edition 2, SARAH-2 [66]. SARAH-2 was a product derived from Meteosat satellites’ observations-based output on the visible channels of the MVIRI and the SEVIRI instruments used by several researchers to perform the evaluation of solar irradiation generated from climate models [50,54,67] because it exhibited low uncertainties and a high accuracy [55,68]. Monthly Rs were retrieved from the CM-SAF platform for the period of 30 years (1986–2015).
In addition, monthly Tas, Rh and Wspd were collected from the ERA5 reanalysis product [69,70] for the period of 30 years (1976–2005). The ERA5 data were used for their corresponding model datasets evaluation. ERA5 is concerned new reanalysis and an advanced dataset in place of ERA-Interim. However, this remained a model for which some systematic biases were attributed [50,71,72,73].

2.3. Methods

2.3.1. Flow Chart

The methodological approach adopted in this study is summarized in the flowchart presented in Figure 1.

2.3.2. Selection of Radiative Forcing Scenarios

In many parts of the world, governments, policies-makers, and energy and environmental agencies lack the commitment to combating CC. Togo is no exception to the rule, with no consistent policies enacted to date. This shortfall in active engagement has motivated the choice of the RCP2.6 and 8.5. Thus, only a dependable simulation strategy could help model the climate-change impact on renewable energy in Togo. RCP scenarios have been largely explained and documented in the literature [79]. They are intended to project the concentration of atmospheric greenhouse gas (GHG) emissions.
At the global level, the goals of the RCP2.6 scenario can be succinctly stated as including, but not being limited to, the following:
(1)
Based on the 2000 carbon emissions, a 4% reduction per annum is needed. The latter decrease can only be achievable if the GHG reduction were improved to about 5–6% annually.
(2)
Increasing use of RE, nuclear, efficient-energy measures, carbon capture and sequestration, and bioenergy reduce sufficiently all major emission sources.
(3)
Implementing new technologies for energy efficiency improvement.
(4)
Limiting agricultural areas for food production by means of high agricultural productivity.
(5)
Elaborating sustainable criteria for bioenergy production and management.
(6)
Reducing significantly non-CO2 greenhouse gas emissions [80].
Furthermore, utilizing the RCP2.6 is likely to maintain the global temperature rise at around 1.6 °C and well below 2 °C, respectively, by 2065 and 2100 [81].
Similarly, the RCP8.5 storyline simulates a global scenario. The conditions were such that:
(1)
Energy demand increases greatly because of unprecedented population growth,
(2)
Little progress is made in terms of energy efficiency and conservation because of low socio-economic investments,
(3)
International trade in energy and technology is still limited, thus hindering any further social and technological progress,
(4)
Future energy systems move toward coal-intensive technologies; these choices generate more GHGs.
(5)
Strong environmental concerns grow locally, especially in high- and medium-income regions.
(6)
Food security becomes a major issue, especially in low-income regions.
(7)
Agricultural productivity increases steadily; thus, a healthy agricultural system is needed to feed an increasing population [82,83].
To sum it up, under the conditions described in the scenario RCP8.5, the global temperature would likely increase by 2.6 °C and 4.8 °C by 2065 and 2100, in that order [81].

2.3.3. Simulation of PV Cell Temperature (PVct) and PV Generation Potential (PVGP)

Photovoltaic technology is green/clean at the point of application, silent, and environmentally friendly. The technology is comprised of many working parts—cells, modules, and arrays. However, the output is heavily dependent on two main factors: (1) the PVGP and (2) the installed capacity. Therefore, the output is the product of the nominal installed power (Watts) by the PVGP. The latter potential is a dimensionless factor that accounts for the performance of PV cells as compared to their nominal power under certain weather conditions [56]. Various factors may influence the magnitude of the PVGP. These variables range from local insolation, temperature, season, to cells’ efficiencies [84]. Thus, the PVGP is expressed as in Equation (1) [55,56,85].
P V G P ( t ) = P r ( t ) R s ( t )   R s ( S T C )  
where Rs(t) is the local shortwave radiation; STC is the standard test conditions under which Rs(STC) is equal to 1000 W/m2; Pr(t) is the PV performance ratio [55,56].
This ratio is computed utilizing Equation (2).
P r ( t ) = 1 + γ [ P V c t ( t ) T S T C ]
where PVct is the PV cell temperature; TSTC is the ambient temperature set at 25 °C under STC; and γ is—0.5%/°C.
It is worth pointing out that crystalline cells’ efficiency degrades in a hot environment at an average rate of about 0.4 to 0.5%/°C [55,56,86].
Also, three technologies—Monocrystalline, Polycrystalline, and Amorphous—and four atmospheric variables—Rs, Tas, Wspd, and Rh—were considered. A negligible impact of wind direction (WindDir) was assumed. Hence, PVct is modelled utilizing Equation (3) [87].
P V c t ( t ) = a + a 1 R s ( t ) + a 2 T a s ( t ) + a 3 W s p d ( t ) + a 4 R h ( t )
where the regression coefficients a, a1, a2, a3, and a4 are as presented in the Table 3 [87].

3. Results and Discussion

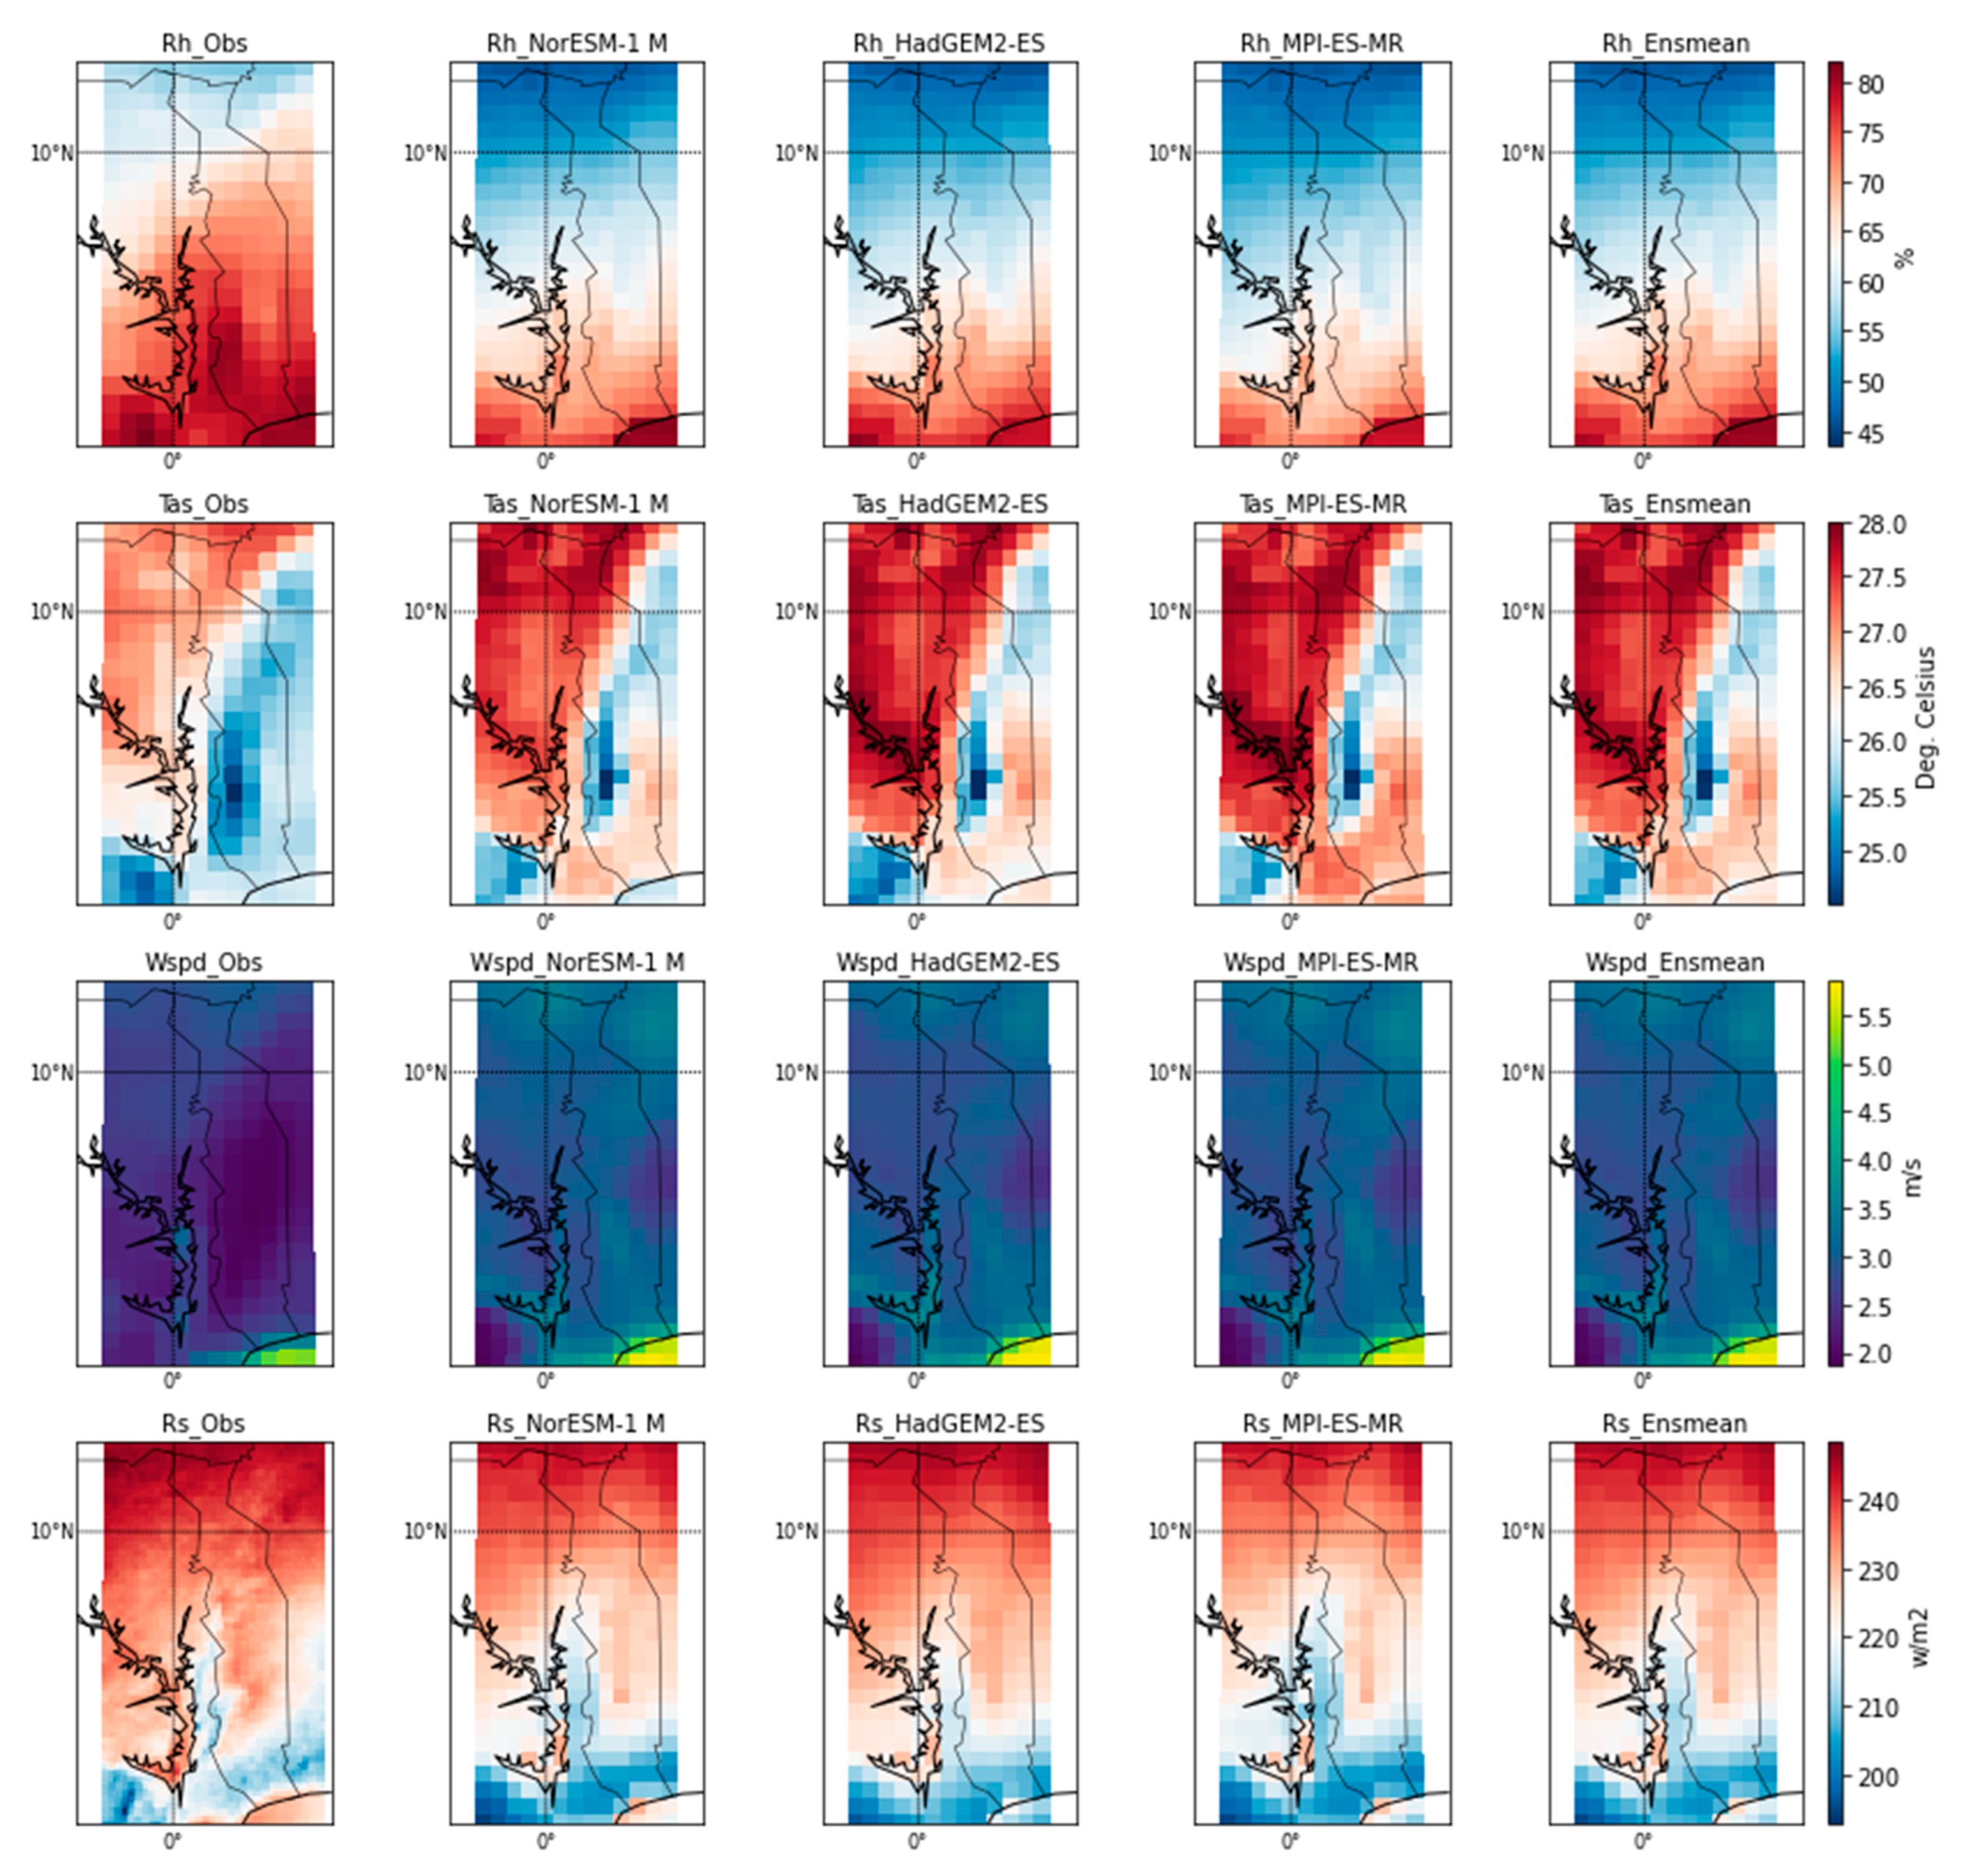
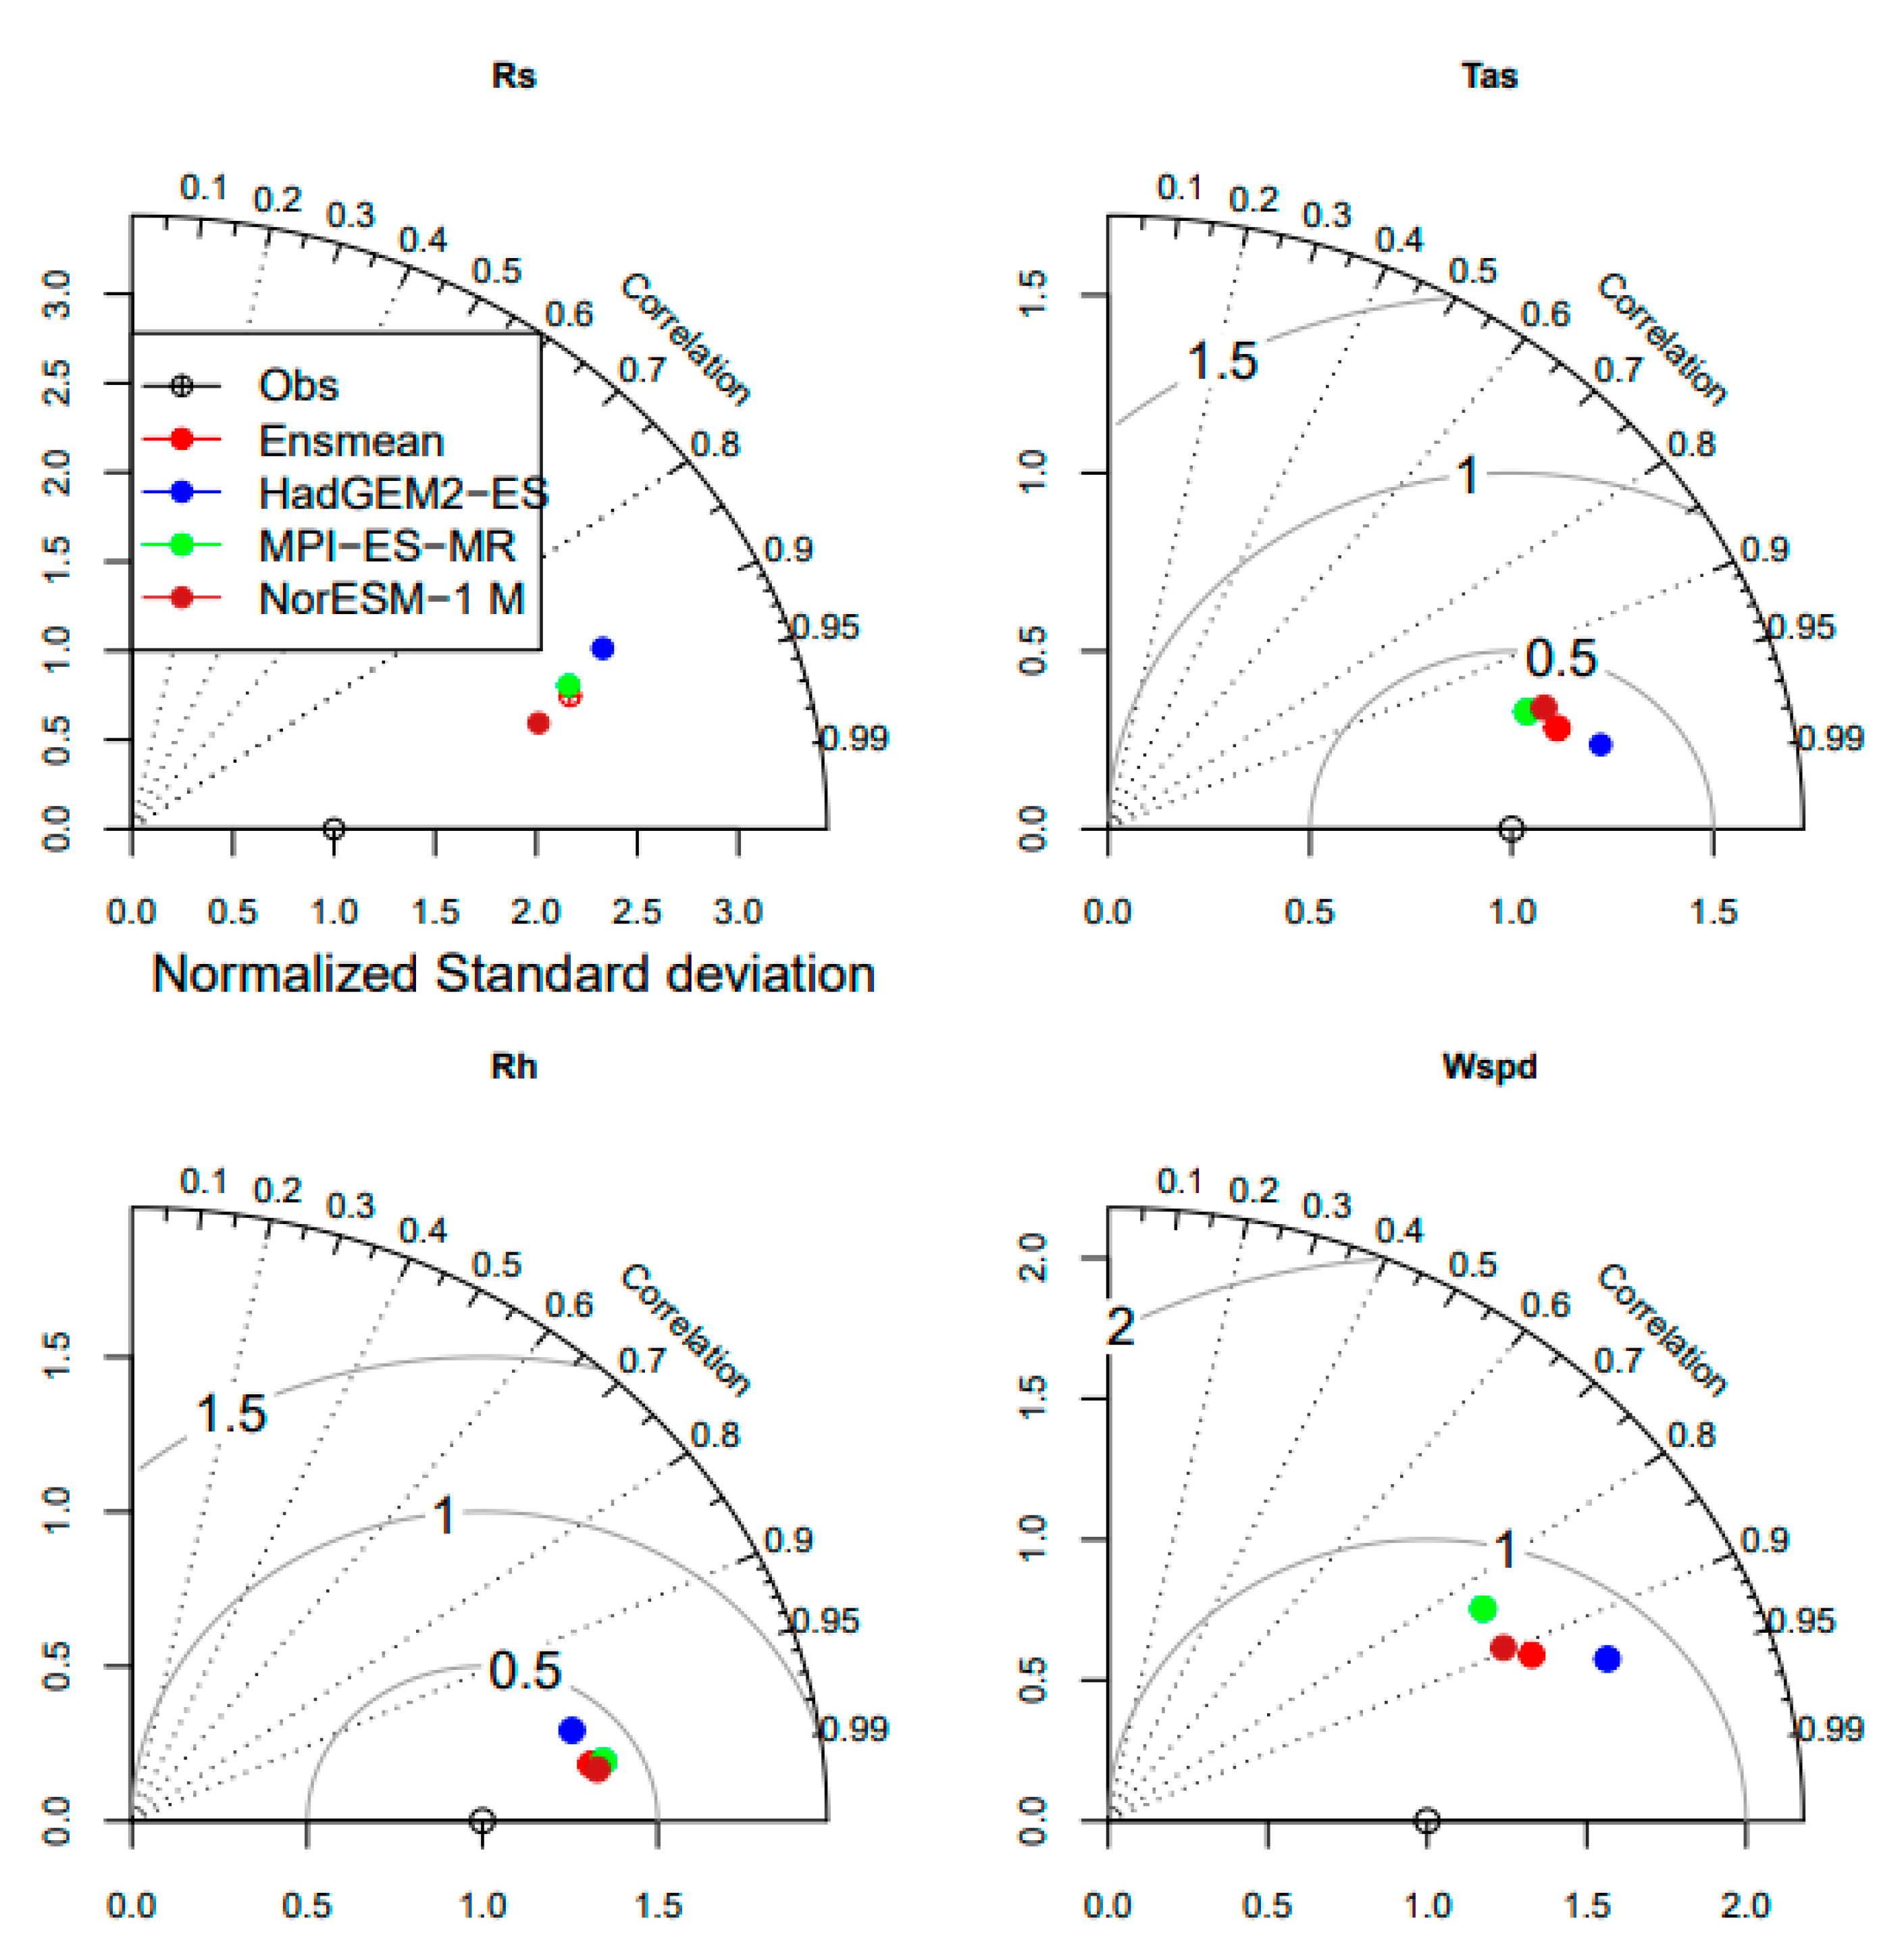
3.1. Model Data Evaluation

Figure 2 presents the ensemble mean (Ensmean) data reproduced by the model. These variables are wind speed (Wspd) at 10 m, solar irradiance (Rs), air temperature (Tas), and relative humidity (Rh) over the country.
Rs, for instance, is given in the mean solar irradiance datasets of nine consecutive models under CORDEX-CORE. The climatological correlation between the modeled and observed data is statistically significant at 95% as seen in Figure 3. However, this relationship varies from 0.91 in Wspd to 0.99 in Rh. The normalized standard deviation was 1.2 for Tas and 2.3 for Rs. In addition, the monthly observed spatial mean percentage deviation (MPD) performed by the Ensmean was −7.62%, −2.26%, −1.63%, and 12.39%, respectively, for Rs, Rh, Tas, and Wspd. It can be seen that this MPD was relatively low. Overall, a low root mean square deviation (RMSD) was recorded, which spanned from 0.29 (Tas) to 17.23 (Rs). As observed, the model captured perfectly the latitudinal variations of the aforementioned meteorological variables. These findings were in agreement with the observations across the five regions. For example, a lower Rs is usually observed in the Maritime region, while a higher Rs is the norm in the Savannah.
On a different note, the simulation was somewhat far from perfection, as it had some elements of bias as seen in Table 4. It is well known that simulations are mainly utilized to tune up performance, optimize processes, improve safety, test theories, and so forth. As a result, the models underestimated the Rs, Tas, and Rh over the country; their respective average was 16.88 W/m2, 0.44 °C, and 1.38%. In contrast, the model overestimated the Wspd by up to 0.44 m/s on average. Luckily, these results confirmed the findings of [20,24]. The model’s underestimation of Rsds can be noticed across these four regions: Maritime, Plateaux, Central, and Kara. It is interesting to mention that the underestimation of Rs declines from the Maritime region (South with 26.92 W/m2) to Kara, which is situated in the Savanna (Its value was approx. 5 W/m2). This type of phenomenon depicts a positive bias near the border with Burkina Faso (see Table 1 for details). This observation may be attributed to clouds and/or aerosols representation in the RCMs over the Gulf of Guinea and the SARAH-2 data [50,55,88,89,90,91]. In addition, the bias related to Rsds could be linked to some difficulties in representing clouds in the model [92,93,94]. The simulation of the Tas presents a positive bias across all regions, with a prevalence in the Savanna. Thus, Tas’s bias over the country falls in the range of 0.4–10 °C, as previously reported [50]. On the other hand, Rh showed an increasing negative bias from South to North. The simulation of Wspd over the country was such that it exhibited a positive bias over the South Kara and Savannah regions. Then, a negative bias was revealed over the Plateaux and Central regions.

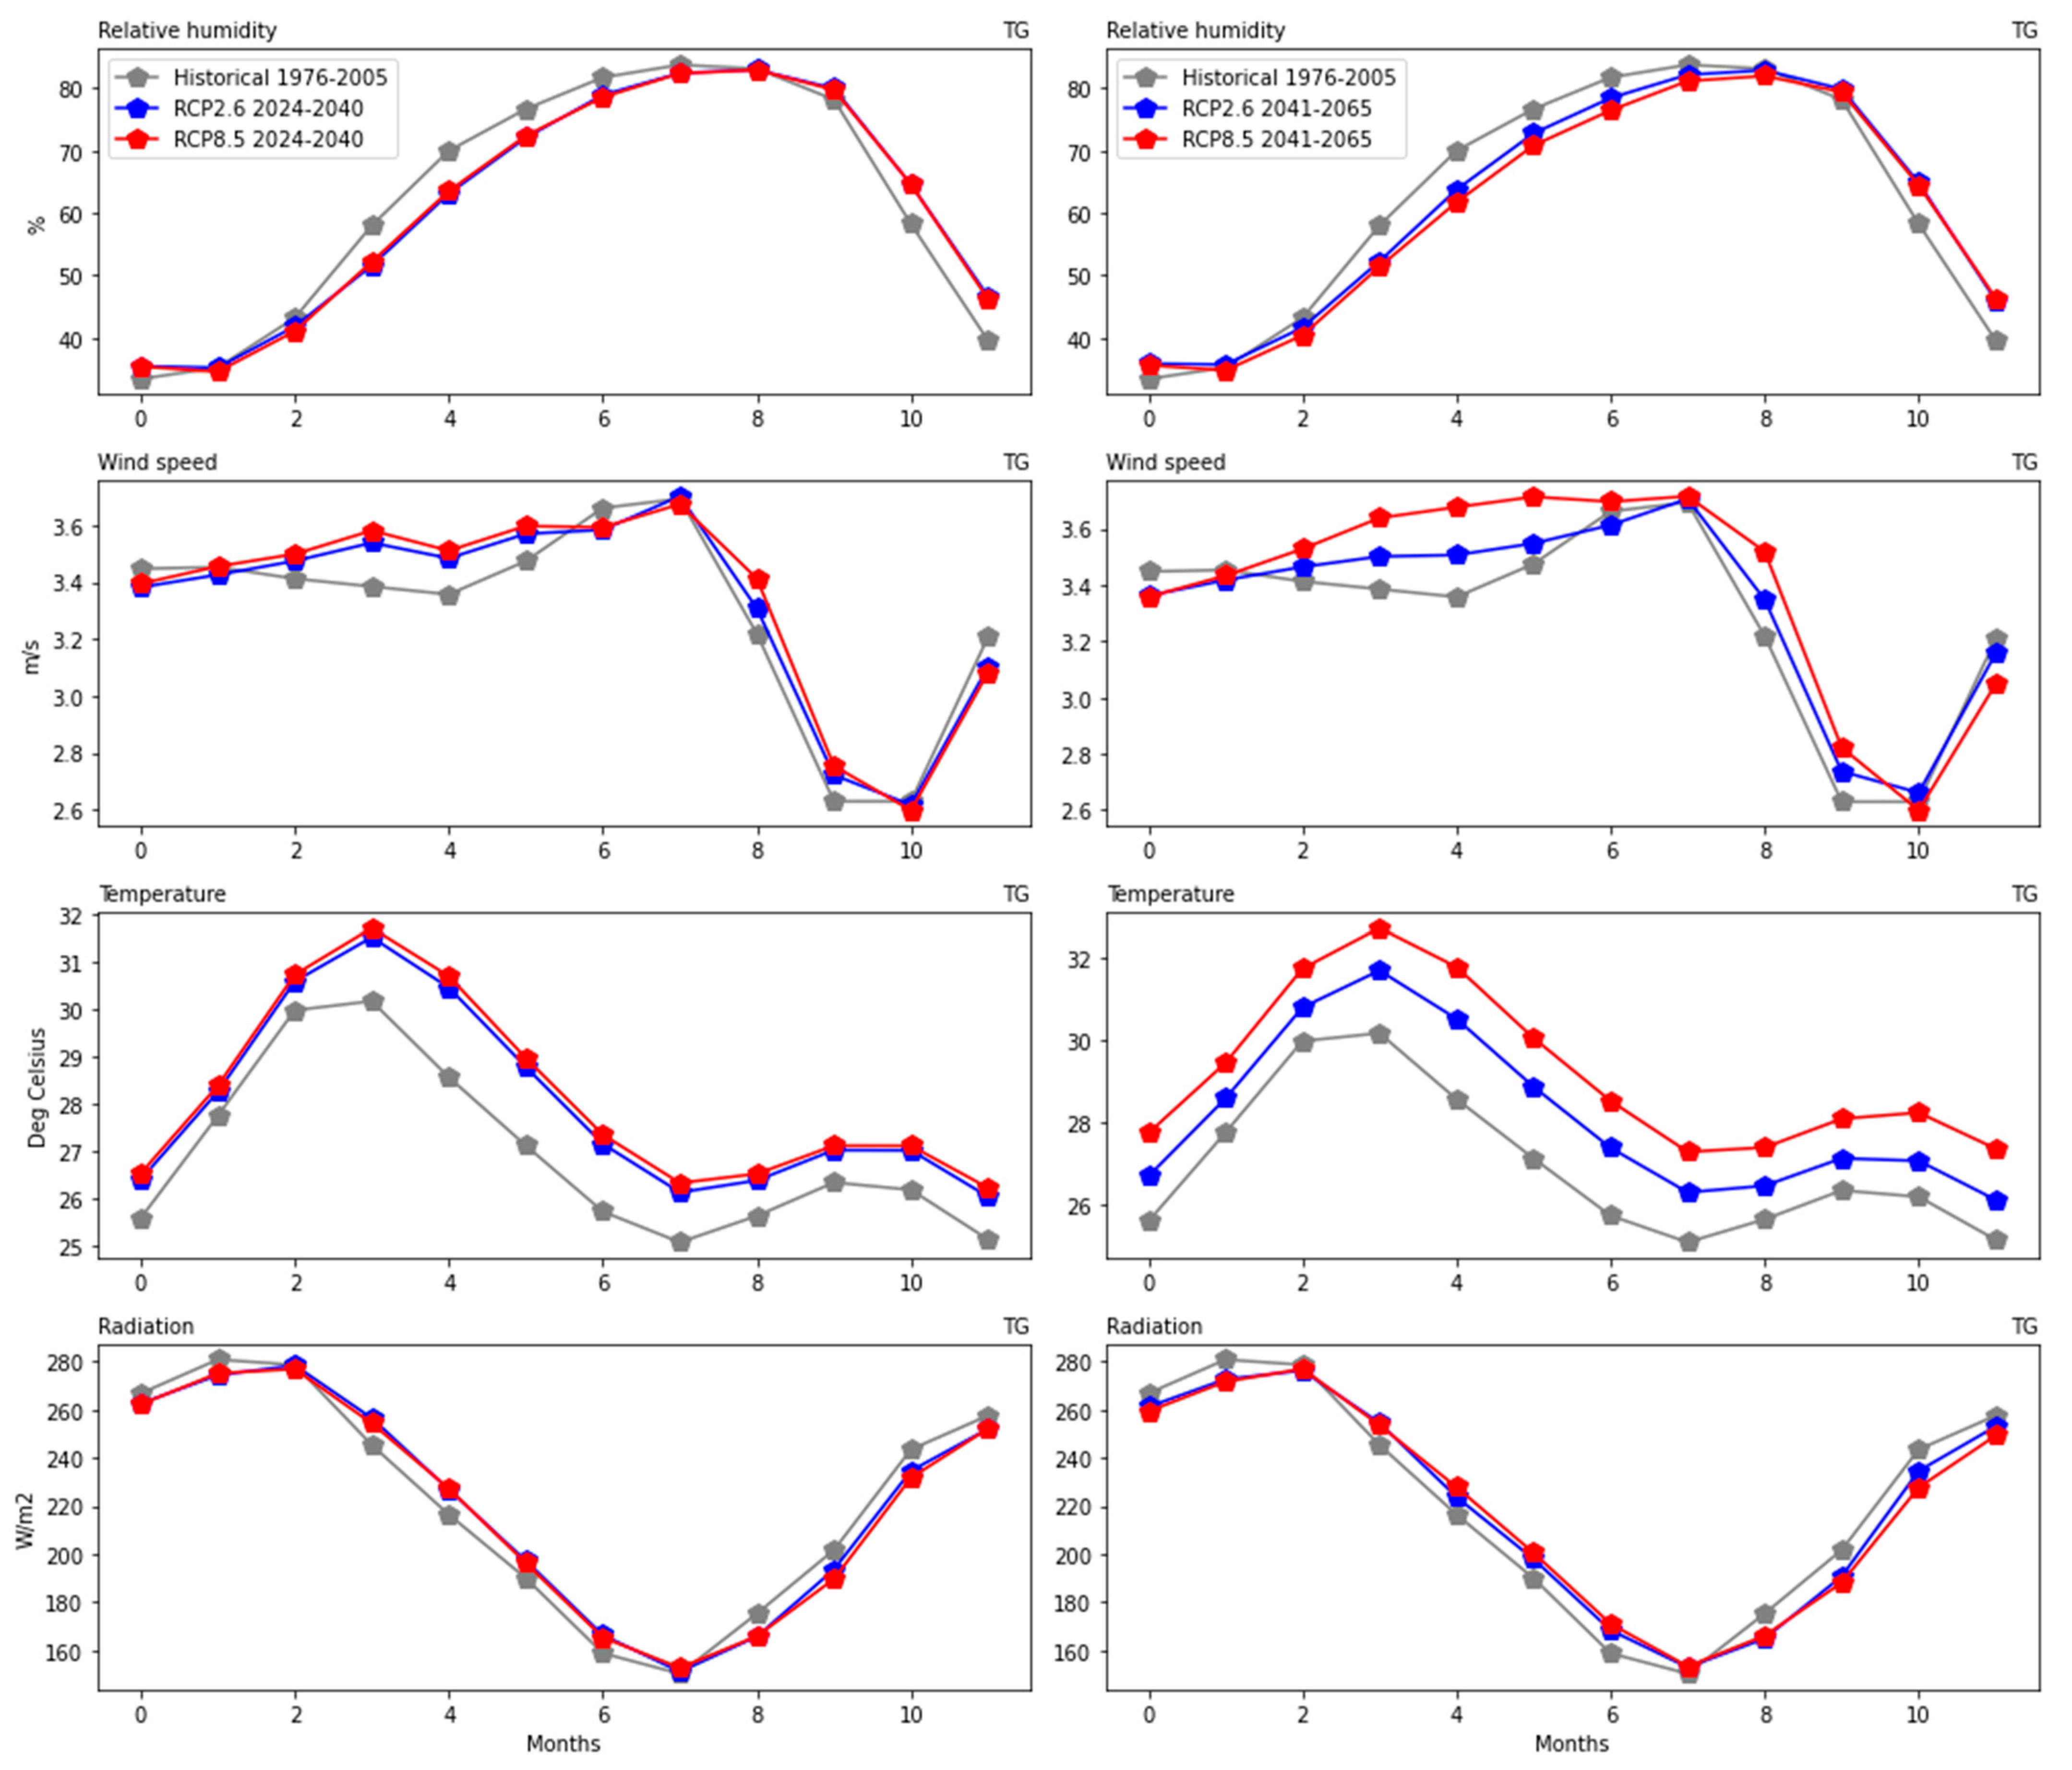
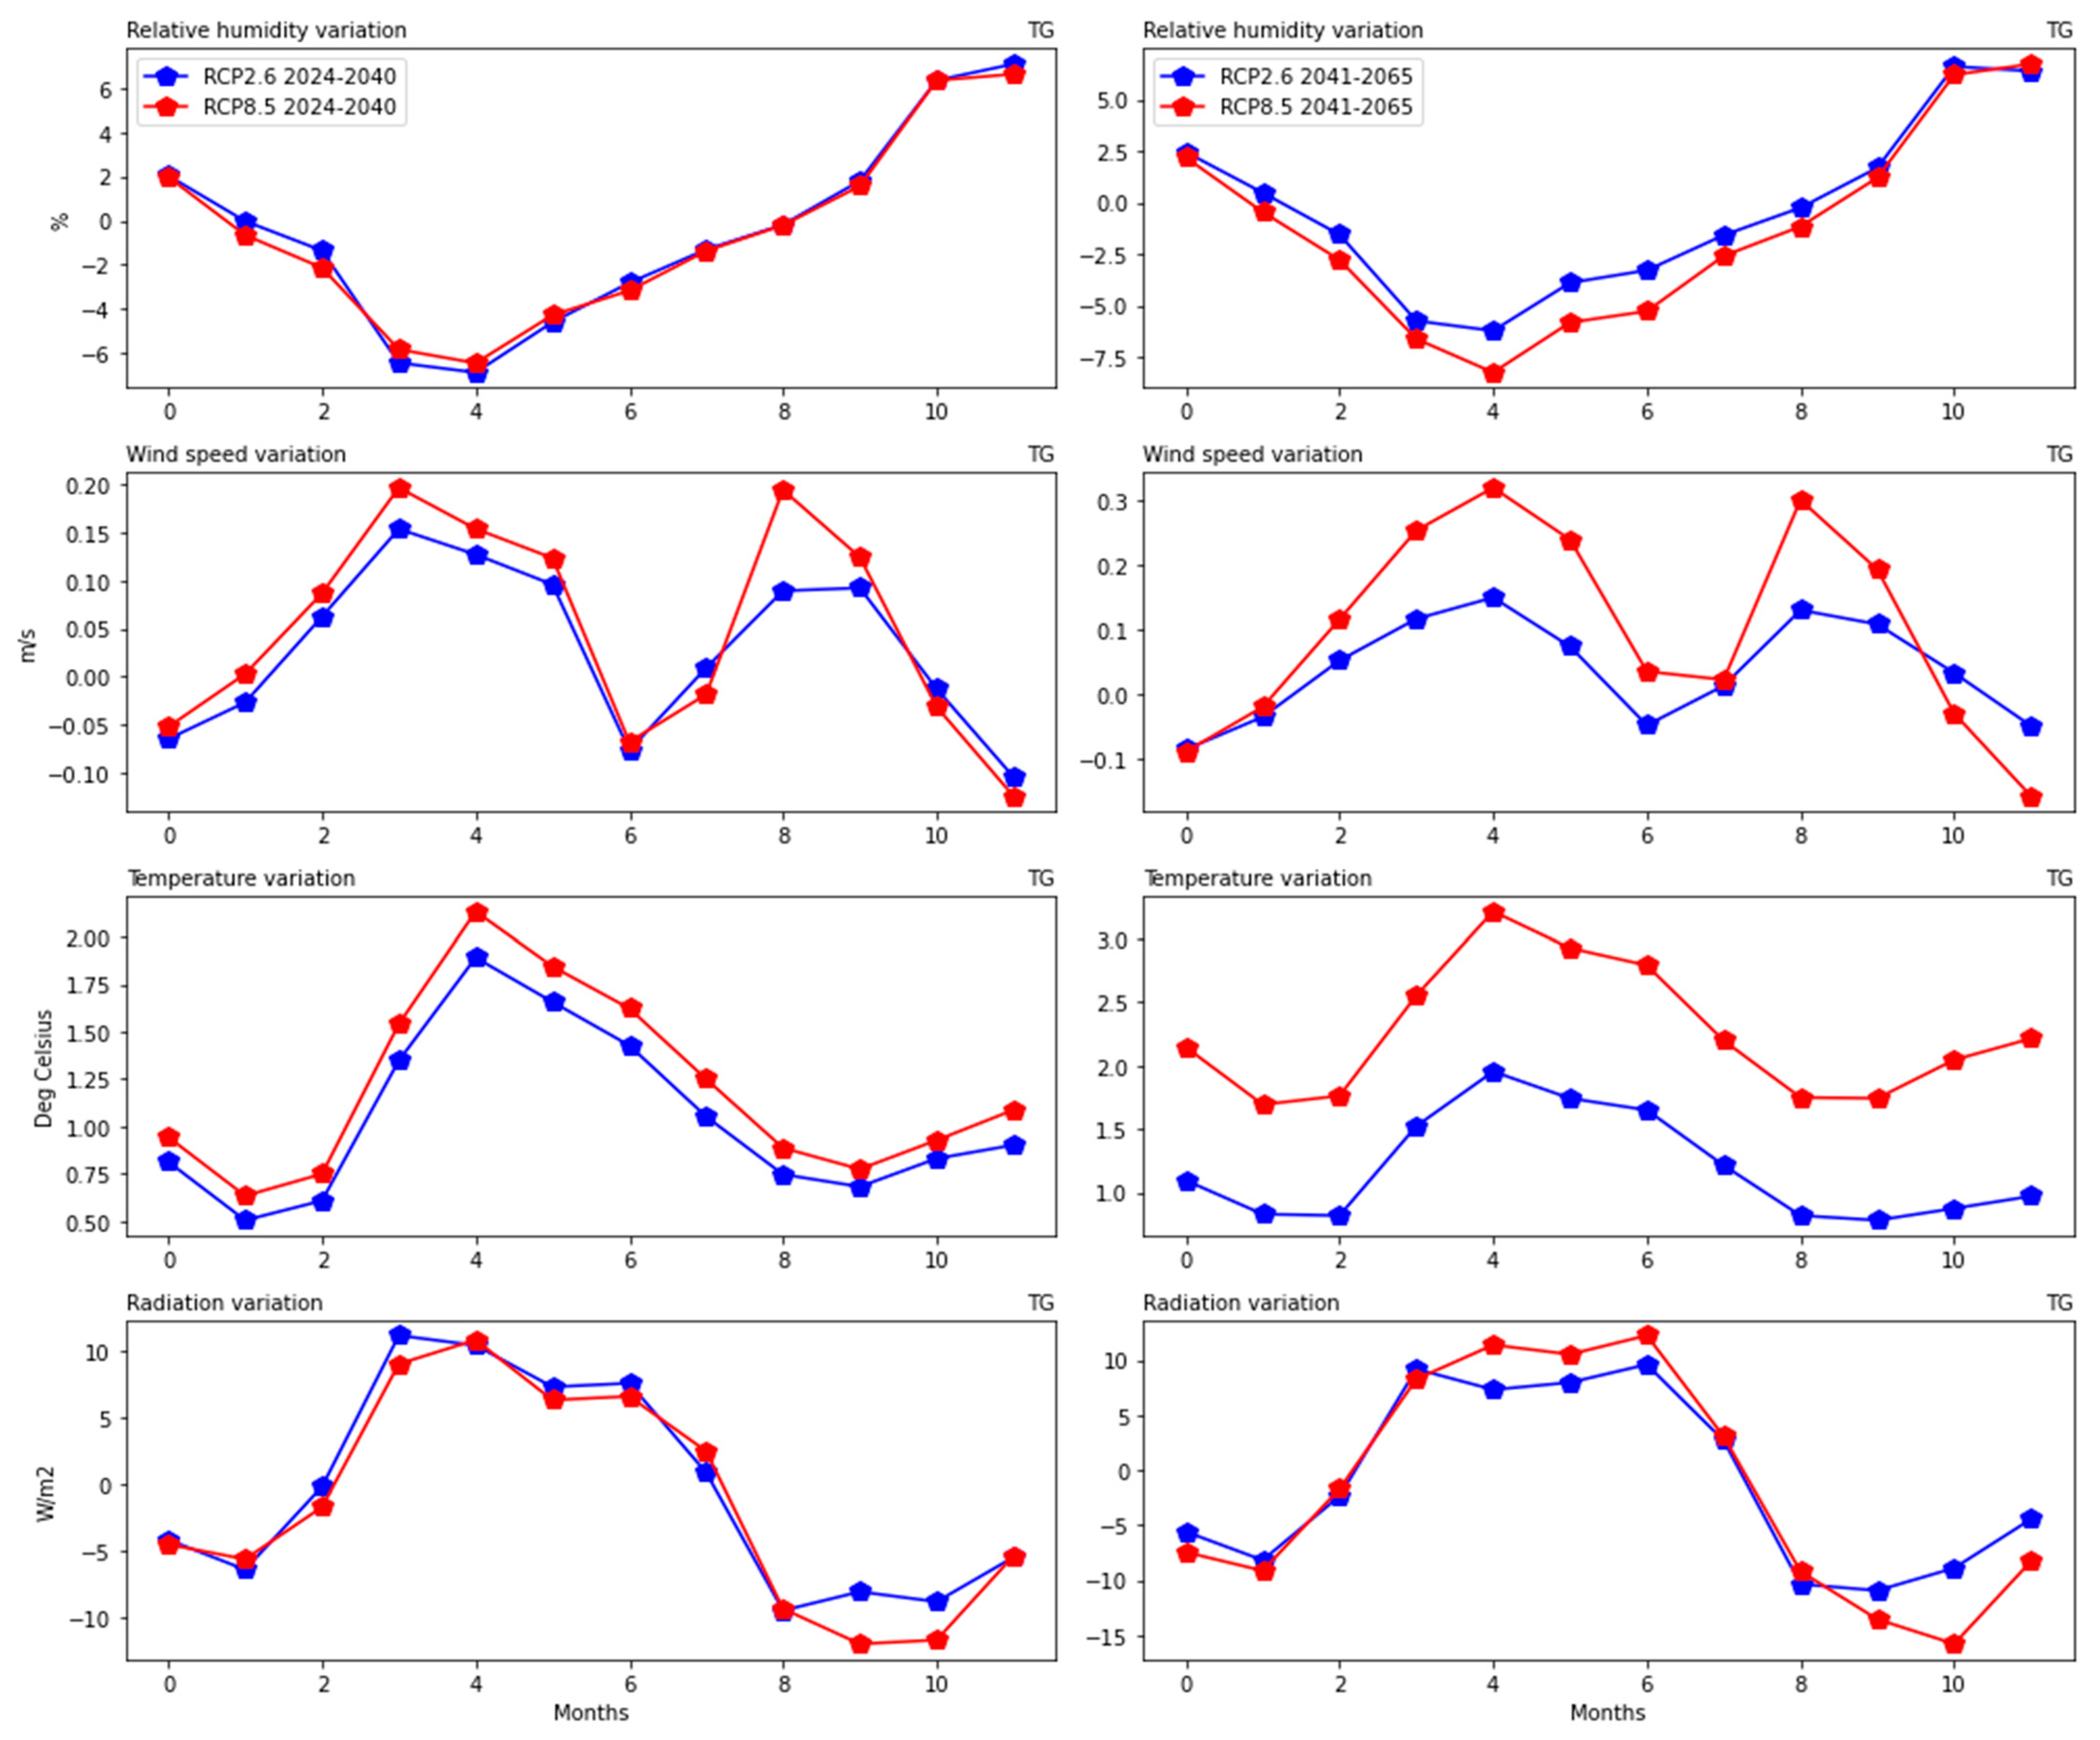
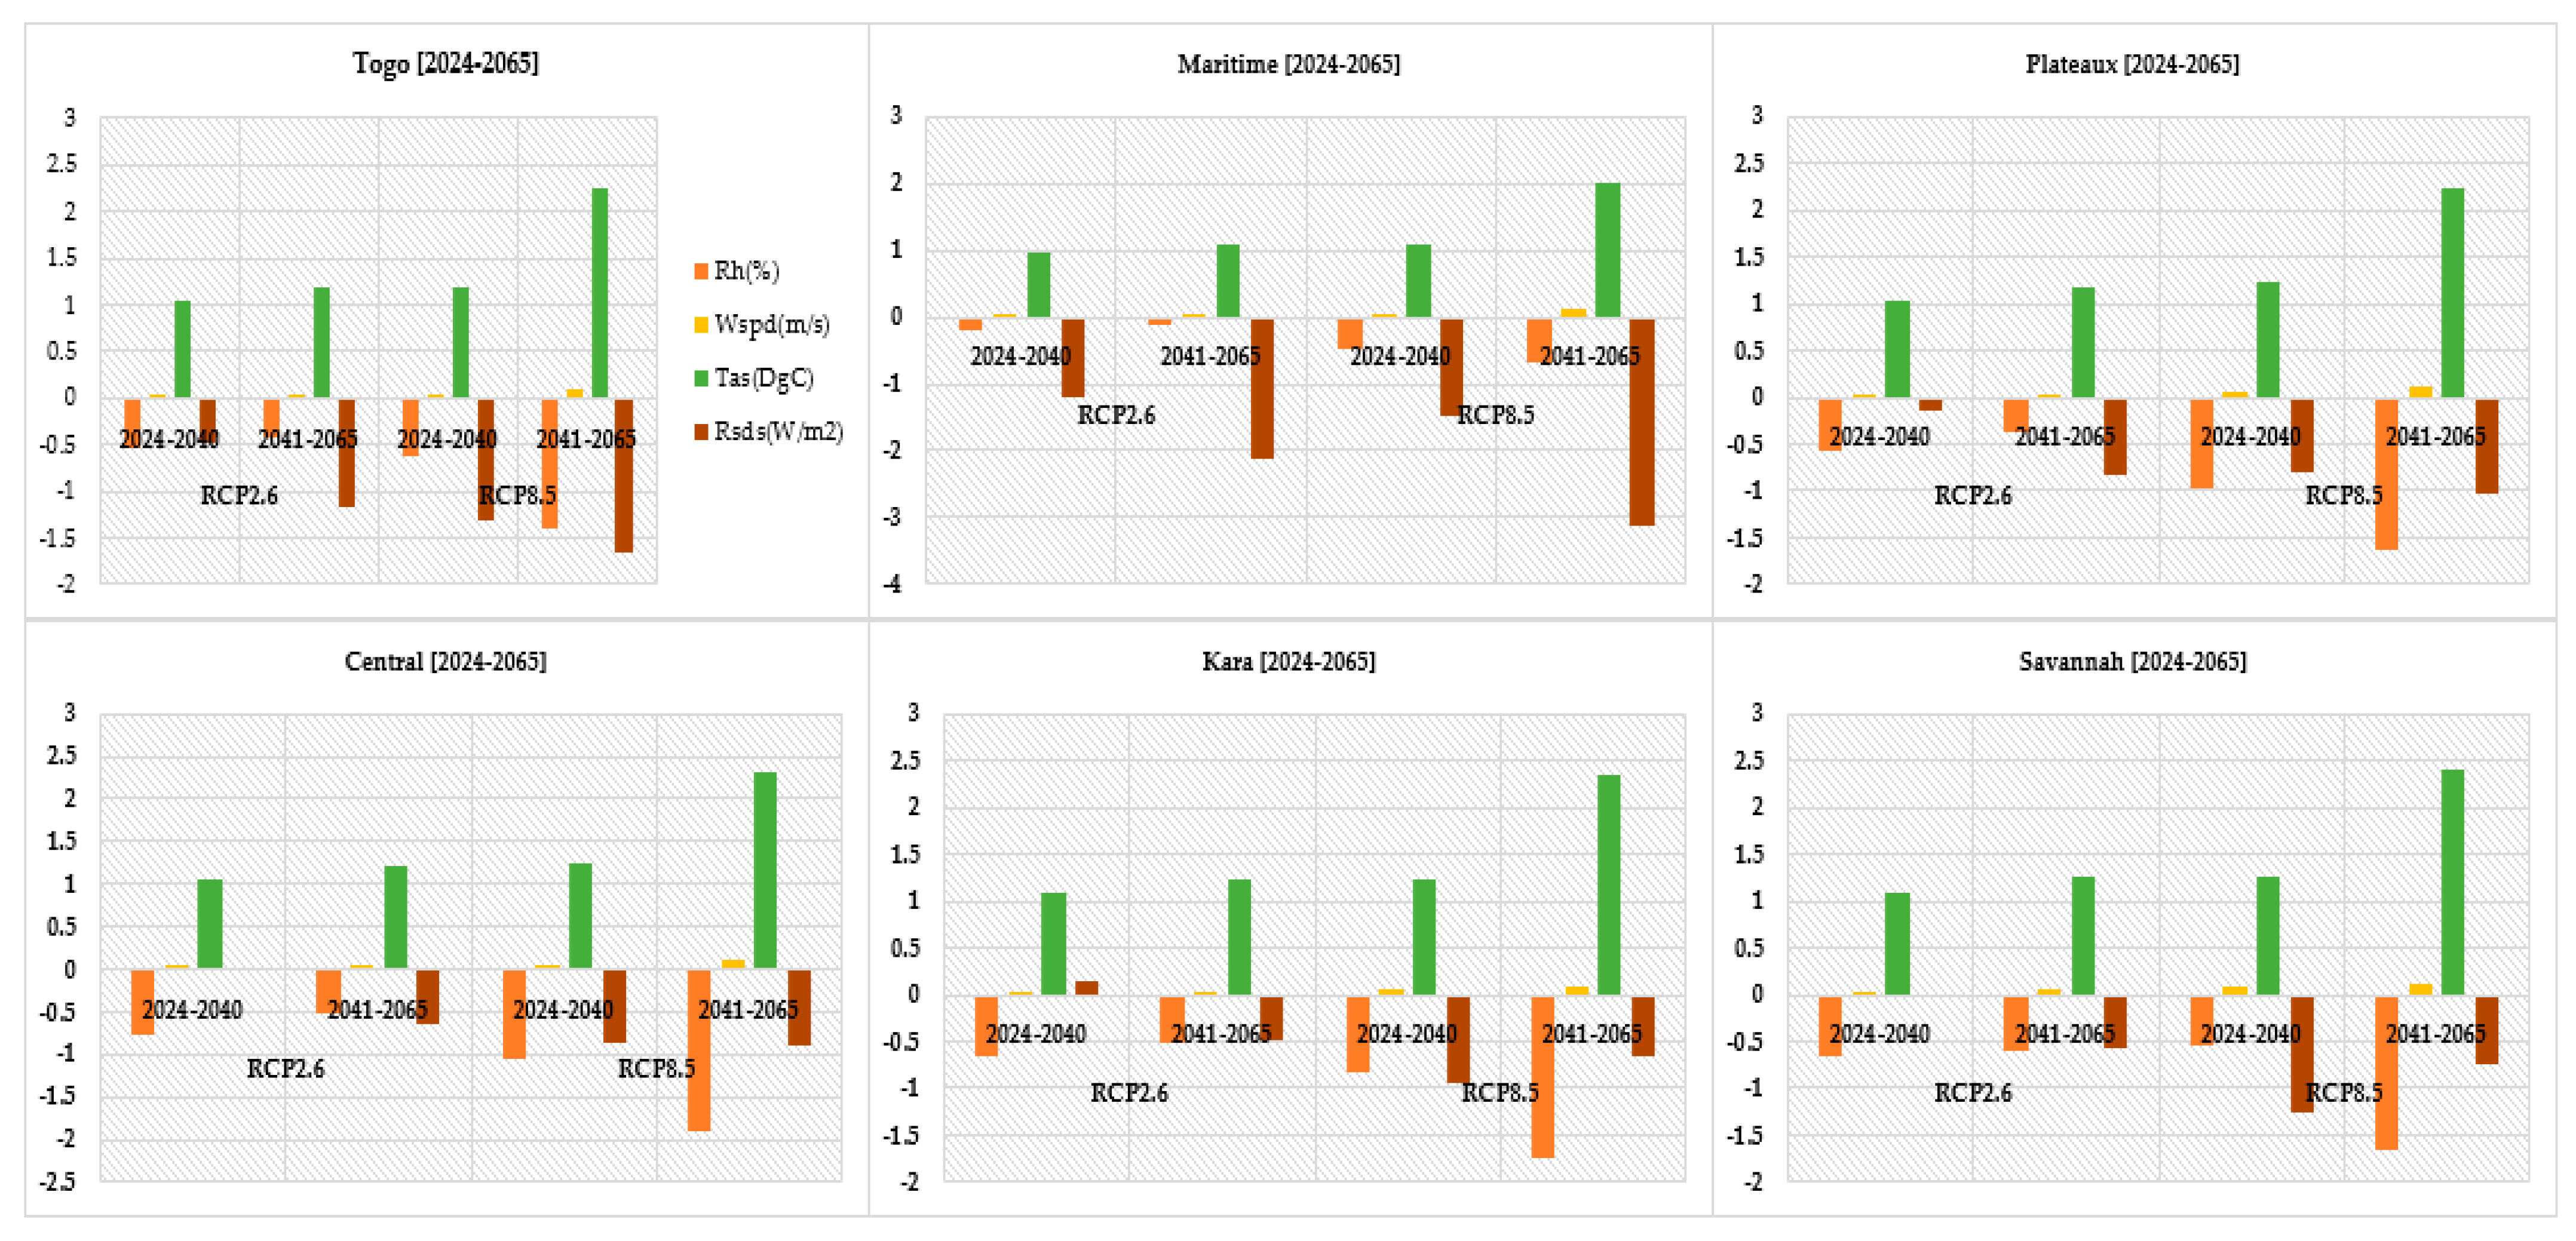
3.2. Atmospheric Variables under RCP2.6 and 8.5 during the near and Mid-Future

Under the mitigation pathway RCP2.6 and the worst-case CC scenario RCP8.5, atmospheric variables may fluctuate over the country. Thus, Figure 4 depicts that these variabilities were even more diverse in the administrative regions.
Figure 5 portrays their climatological variations. The scenarios reveal a decrease in the monthly Rh over the country. Under RCP2.6, a 0.53% monthly average decrease was achieved between 2024 to 2040 and 0.41% less during 2041–2065. Likewise, under RCP8.5, Rh would be impacted. Rh declines by approx. 0.63% and 1.39% on average, respectively, during 2024–2040 and 2041–2065. Conversely, Wspd is projected to slightly increase at a rate of 0.03–0.04m/s for RCP2.6 and 0.05–0.1 m/s for RCP8.5 in the near future and mid-century. Similarly, Tas would rise at a monthly rate of 1.04–1.19 °C for RCP2.6 and 1.2–2.25 °C for RCP8.5 over study periods under scrutiny. However, Rs may decrease at a rate of 0.48–1.18 W/m2 (RCP2.6) and 1.3–1.65 W/m2 (RCP8.5) during the near future and mid-future.
The general overview of the country suggests mild changes over the regions (Figure 6). In summary, Wspd and Tas would increase, while Rh and Rs decrease under the scenarios. The decline in Rs appears significant over the southern region (Maritime); this could be caused by more reflection of incoming shortwave radiation due to high concentration of aerosols in the atmosphere resulting from intense activities of increasing population and industries near the coast. A contrasting phenomenon was, however, observed concerning the Rs over the Central and Kara regions. This scenario divulges that Rs would increase on an average of 0.029 W/m2 and 0.14 W/m2 at the end of 2024 and 2040, in that order.

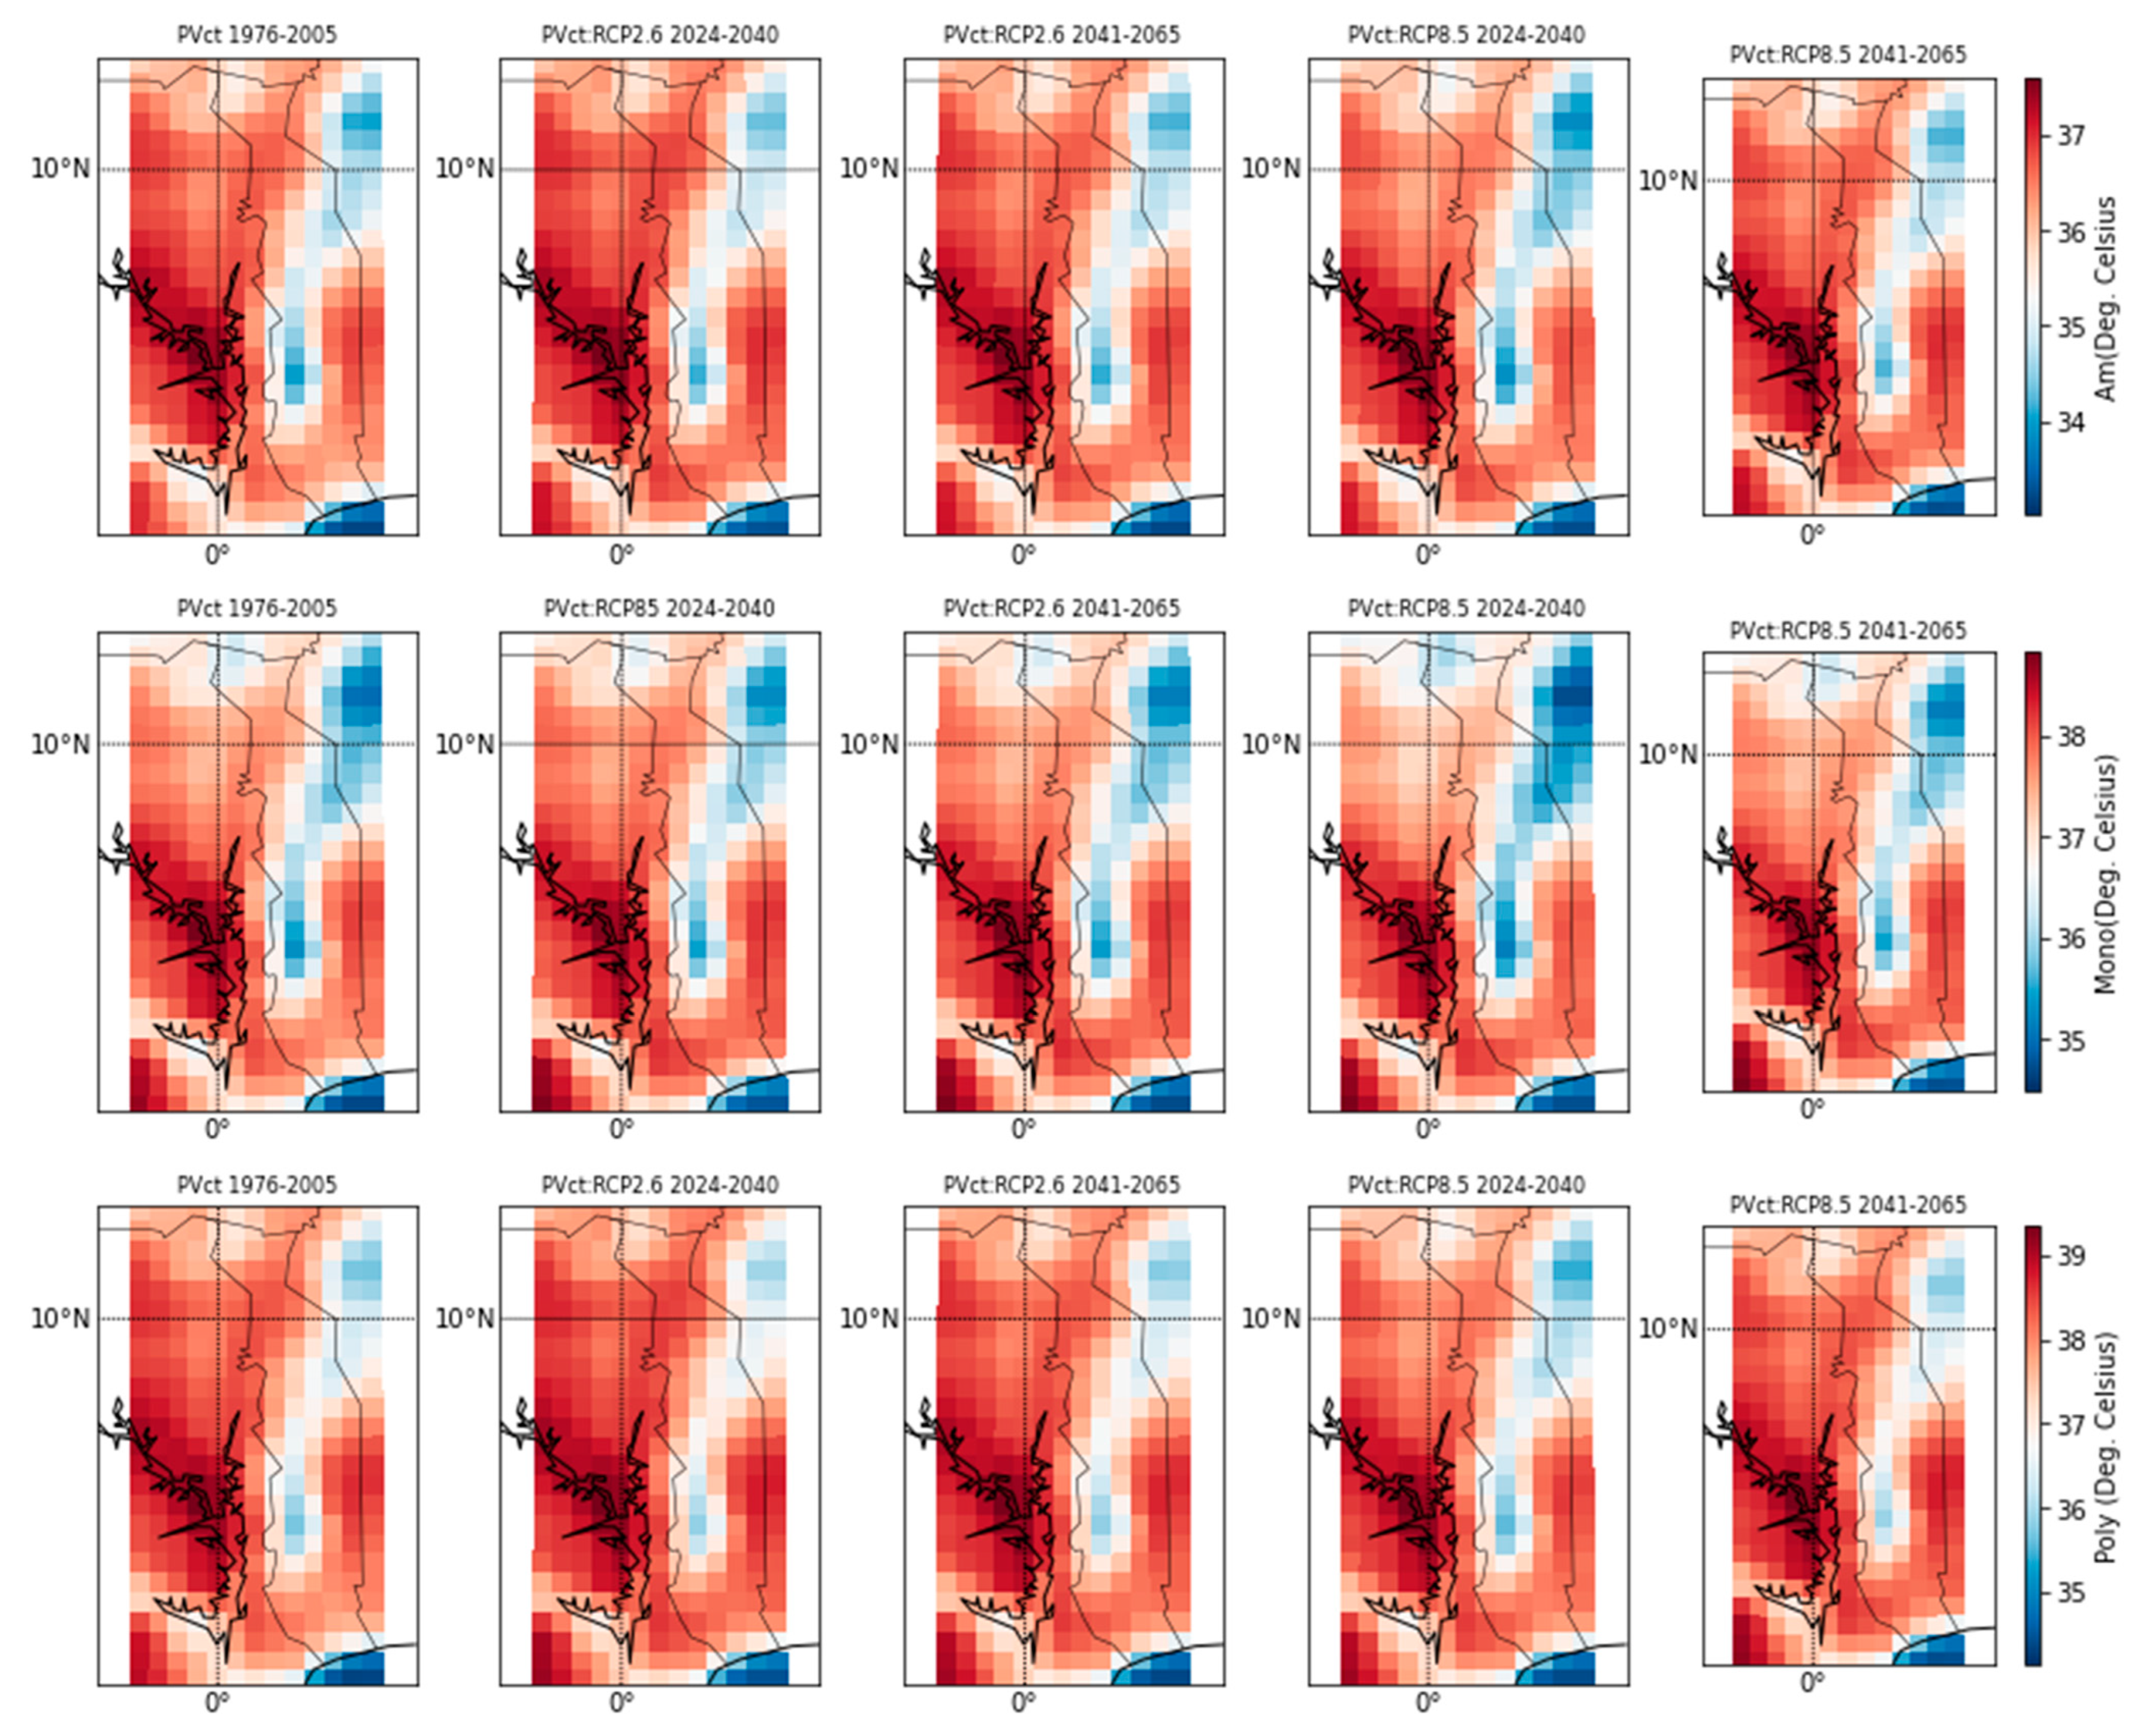
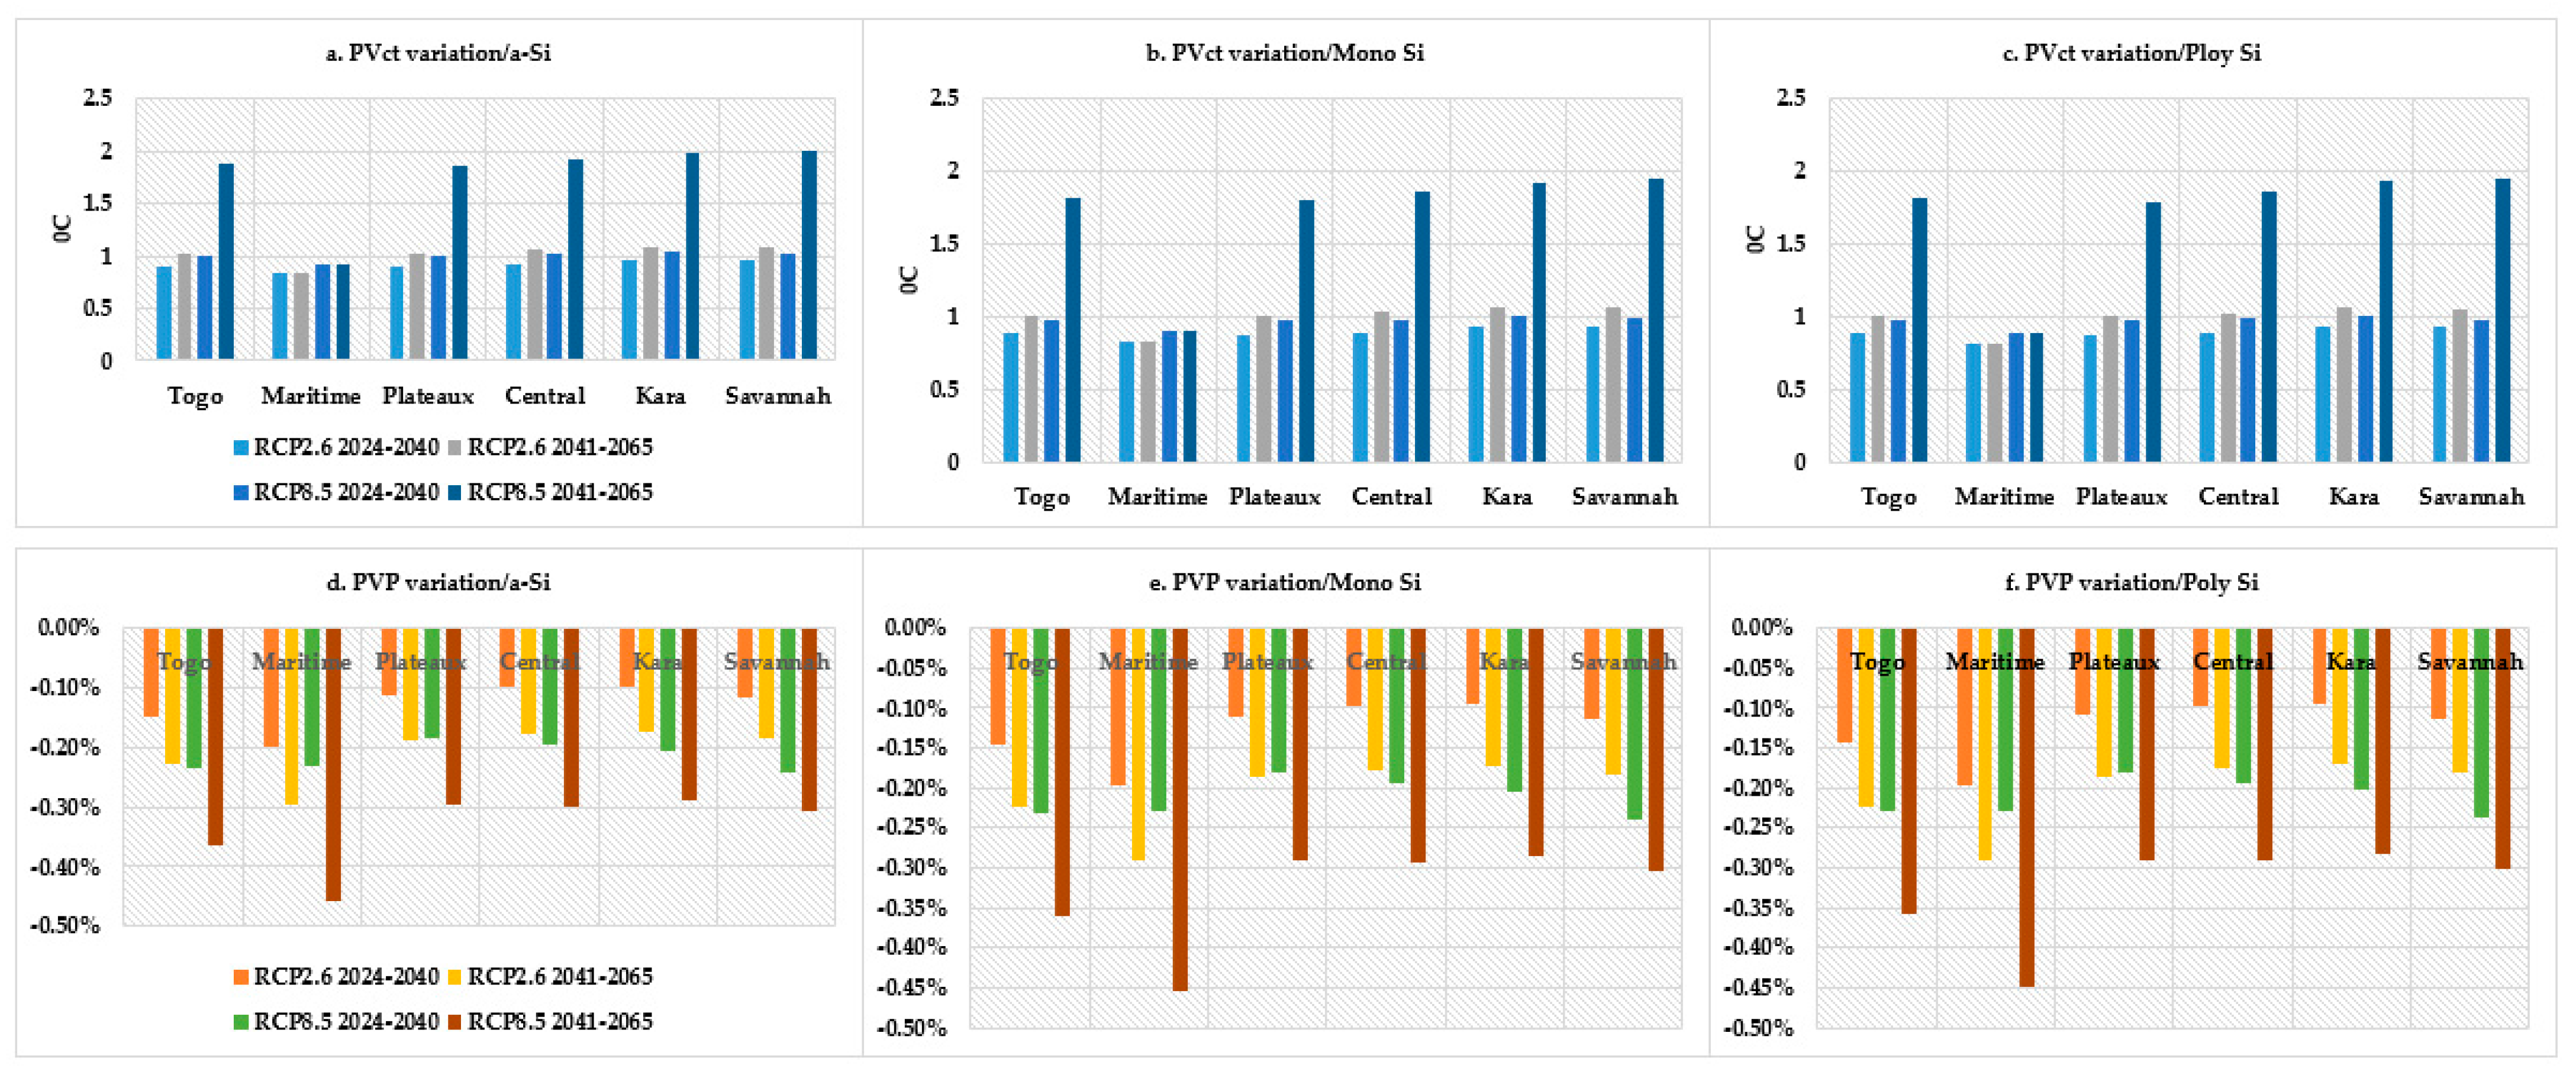
3.3. Projected PVct and PVGP Variations following Cell Technology

3.3.1. Projected PVct Changes over Togo

Figure 7 describes the annual spatial and temporal changes of the PVct from the present day to the mid-century (2065) under the RCP2.6 and 8.5. The climatological evolution, together with the RCP scenarios and cell technologies (a-Si, Mono-Si, and Poly-Si), were also analyzed. The results showed an increasing cell temperature over the near future (2024–2040) and mid-century (2041–2065). This growth was solely dependent on the radiative forcing as well as on the technology in question. The temperature variation would likely rise during March to July and September to December, compared to the reference period. In short, PV cells’ temperature would rise even further under RCP8.5 than RCP2.6. This eventuality could be attributed to the cell’s inherent nature and the geographical location of the country.
Moreover, it was observed that the temperature rises more for the amorphous than the two other counterparts. It was further remarked that the temperature has grown slightly more for monocrystalline than the polycrystalline-based cell. These discrepancies are presented in Figure 8a. Furthermore, these variations were found to have a strong correlation with the monthly insolation, with an average of 1 °C, 1.01 °C, and 1.03 °C under RCP2.6, respectively; and 1.81 °C, 1.82 °C, and 1.88 °C under RCP8.5 in that order. Again, the estimation period is 2041–2065, and the technologies under study are Poly-Si, Mono-Si, and a-Si. It remains a known fact that PV cells’ efficiency decreases with a rise in ambient temperature. Astonishingly, an exception was noticed in the Maritime region, where the amorphous cell showed a slight increase compared to the mono and poly. See Figure 8b for more details. On a different note, the absence of sound mitigation and adaptation strategies, at a global scale, towards a greener environment and economy, would hinder any real RE efforts. Furthermore, narrowing the analysis to the administrative regions, the results revealed that the variation of the cells’ temperature was different.

3.3.2. Projected PVct Changes over Maritime Region

Figure 8 shows the monthly mean cells’ temperature, under RCP2.5 and 8.5, and the three technologies in question over the administrative regions and country at large. The climatological variations, as well as the monthly mean variations of the PVct, are presented in Figure 8b, in relation to cell technology. Cells’ temperature rise was found to be low in the Southern regions compared to the rest of the regions. This discrepancy was probably caused by the seasonal breeze. Thus, the average rise in cells’ temperature, monthly, was projected to be 0.82 °C, 0.83 °C, and 0.84 °C for Poly-Si, Mono-Si, and a-Si, in that order, under RCP2.6. Similarly, these variations were found to be 0.89 °C, 0.9 °C, and 0.92 °C for Poly-Si, Mono-Si, and a-Si, respectively, under RCP8.5. Again, the simulation period spans from 2041 to 2065.

3.3.3. Projected PVct Changes over the “Plateau” Region

The Plateau lies within the Gulf of Guinea. As a result, it has a very dense forest where trees can grow up to 18.4 m. It is also very mountainous with Mount Agou culminating at 986 m above sea level. Over the Plateau, the yearly simulations of the PVct, as shown in Figure 8c, and its climatological variations to the cell technology, were analyzed. A monthly cell temperature rise was found to be 1.0 °C, 1.01 °C, and 1.03 °C for Poly-Si, Mono-Si, and a-Si, in that order, under RCP2.6. An increase of about 1.74 °C, 1.80 °C, and 1.85 °C were observed for Poly-Si, Mono-Si, and a-Si, respectively, under RCP8.5. Note that the simulation period is as stated above, viz., 2041 to 2065. The rise would be lower under poly-Si, medium under Mono-Si and high in a-Si technology over the region.

3.3.4. Projected PVct Changes over the Central Region

The central region straddles the Gulf of Guinea and the tropical Soudanese zone. This region is essentially mountainous; it contains the Tchaoudjo massif, Malfakassa, Faza, and Barba-Bassar mountains. It experiences two rainy and dry seasons yearly. The monthly average variation in cells’ temperature is presented in Figure 8d. As can be observed, the increase in PVct was projected to be 1.02 °C, 1.03 °C, and 1.05 °C for Poly-Si, Mono-Si, and a-Si, respectively, under RCP2.6. In addition, the temperature changes were 1.862 °C, 1.856 °C, and 1.92 °C for Poly-Si, Mono-Si, and a-Si, in that order, under RCP8.5. The aforementioned simulation period was kept the same. It is important to point out that the rise in PVct for the Poly-Si is slightly higher compared to Mono-Si during the near and mid-future under the RCP8.5.

3.3.5. Projected PVct Changes over Kara Region

Kara is composed of valleys, plains, and Plateaus. This region hosts an old rugged massif, extending to Benin and Ghana borders. Figure 8e presents the monthly mean projection of the rises in PVct. On the one hand, the latter increase was estimated at 1.067 °C for Poly-Si, 1.069 °C for Mono-Si, and 1.09 °C for a-Si under RCP2.6. On the other hand, the PVct increased to about 1.93 °C Poly-Si, 1.926 °C for Mono-Si, and 1.99 °C for a-Si under RCP8.5. For both cases, the simulation spans from 2041 to 2065. Likewise, the Poly-Si exhibited the same performance as in the Central region but differed from that of the Maritime region. Conclusively, the temperature rises of the Poly-Si were slightly higher than those of the Mono-Si.

3.3.6. Projected PVct Changes over the Savanna Region

Savannah, as the driest part of the country, has a tropical Soudanese climate. It has just two main seasons–the rainy season and the dry season—per year. The climatological variation of the PVct over the year for the three cell technologies was succinctly analyzed. The magnitude of the observed variations differed, not only monthly, but also across years. These changes were even more pronounced if anthropogenic-based pollution is factored into the study. Temperatures continue to increase drastically at a global level for RCP8.5. Figure 8f portrays the projection of PVct rise over the Savannah during the near and the mid-century. The results indicate that the monthly mean rise would be 1.05 °C for Poly-Si, 1.06 °C for Mono-Si, and 1.08 °C for a-Si under RCP2.6. The temperature change would be 1.942 °C, 1.945 °C, and 2.0 °C for Poly-Si, Mono-Si, and a-Si, in that order, under RCP8.5 during the mid-future. The trend in the PVct rise was somewhat similar to that in the Southern region. These results indicate that the rise would be lower for Poly-Si, medium for Mono-Si, and higher for a-Si technology.

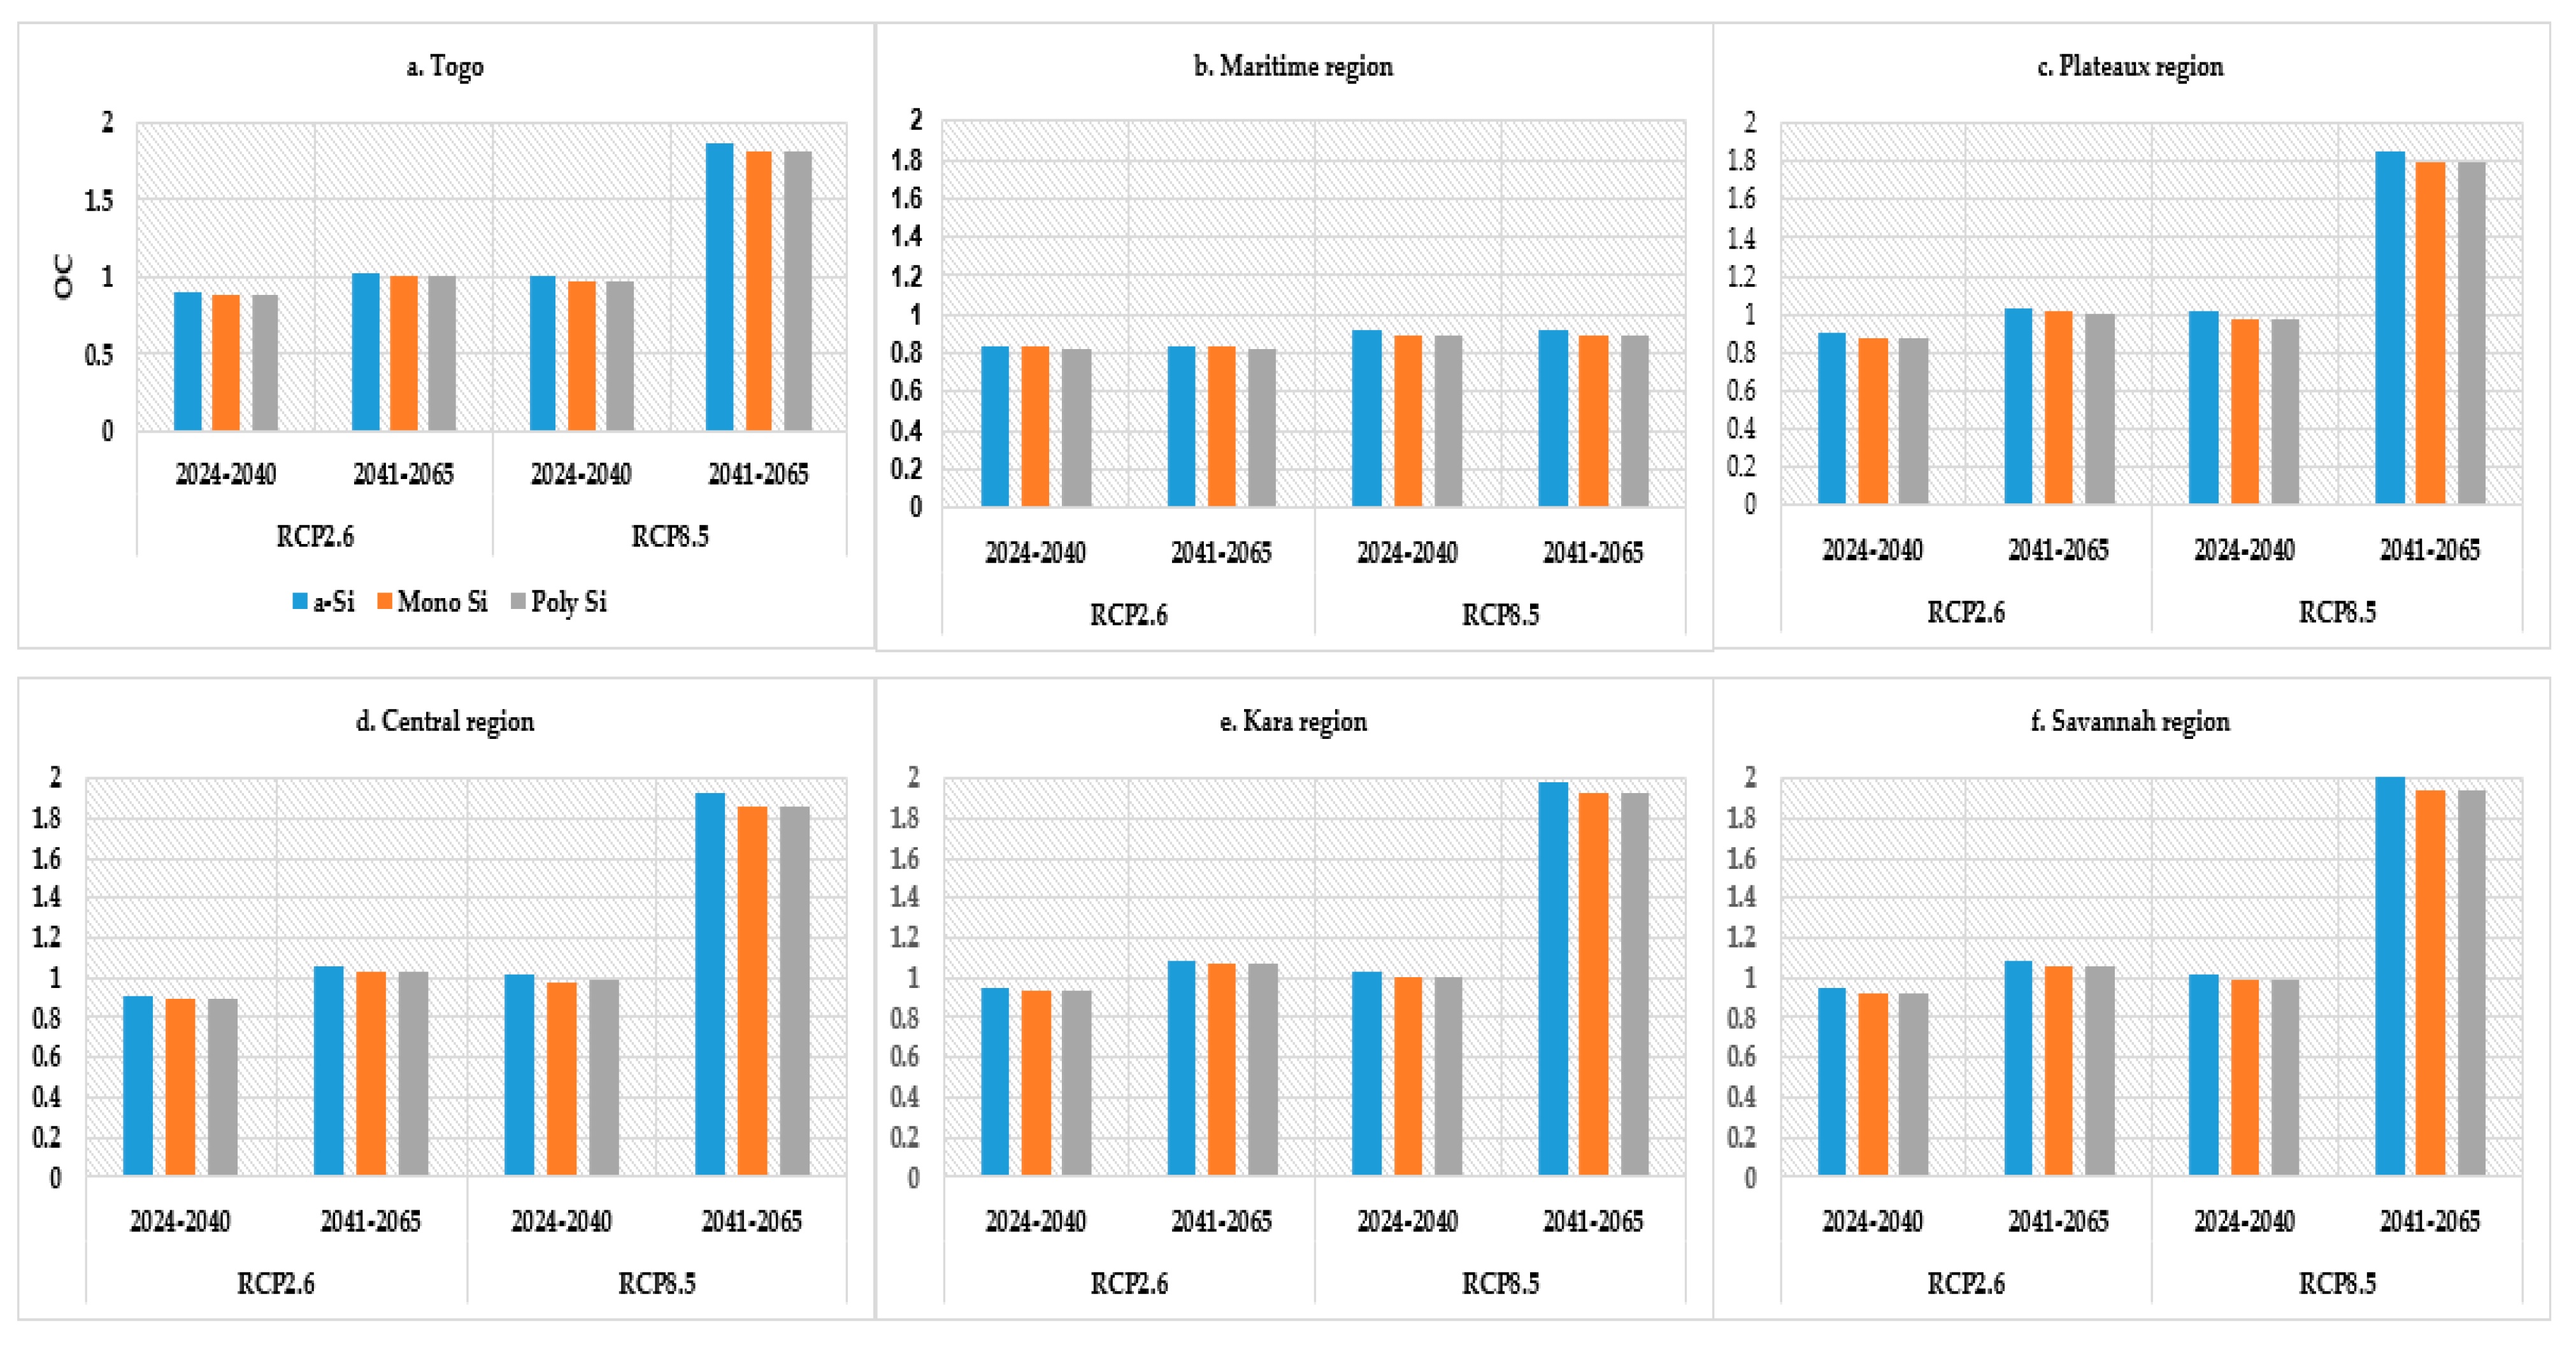
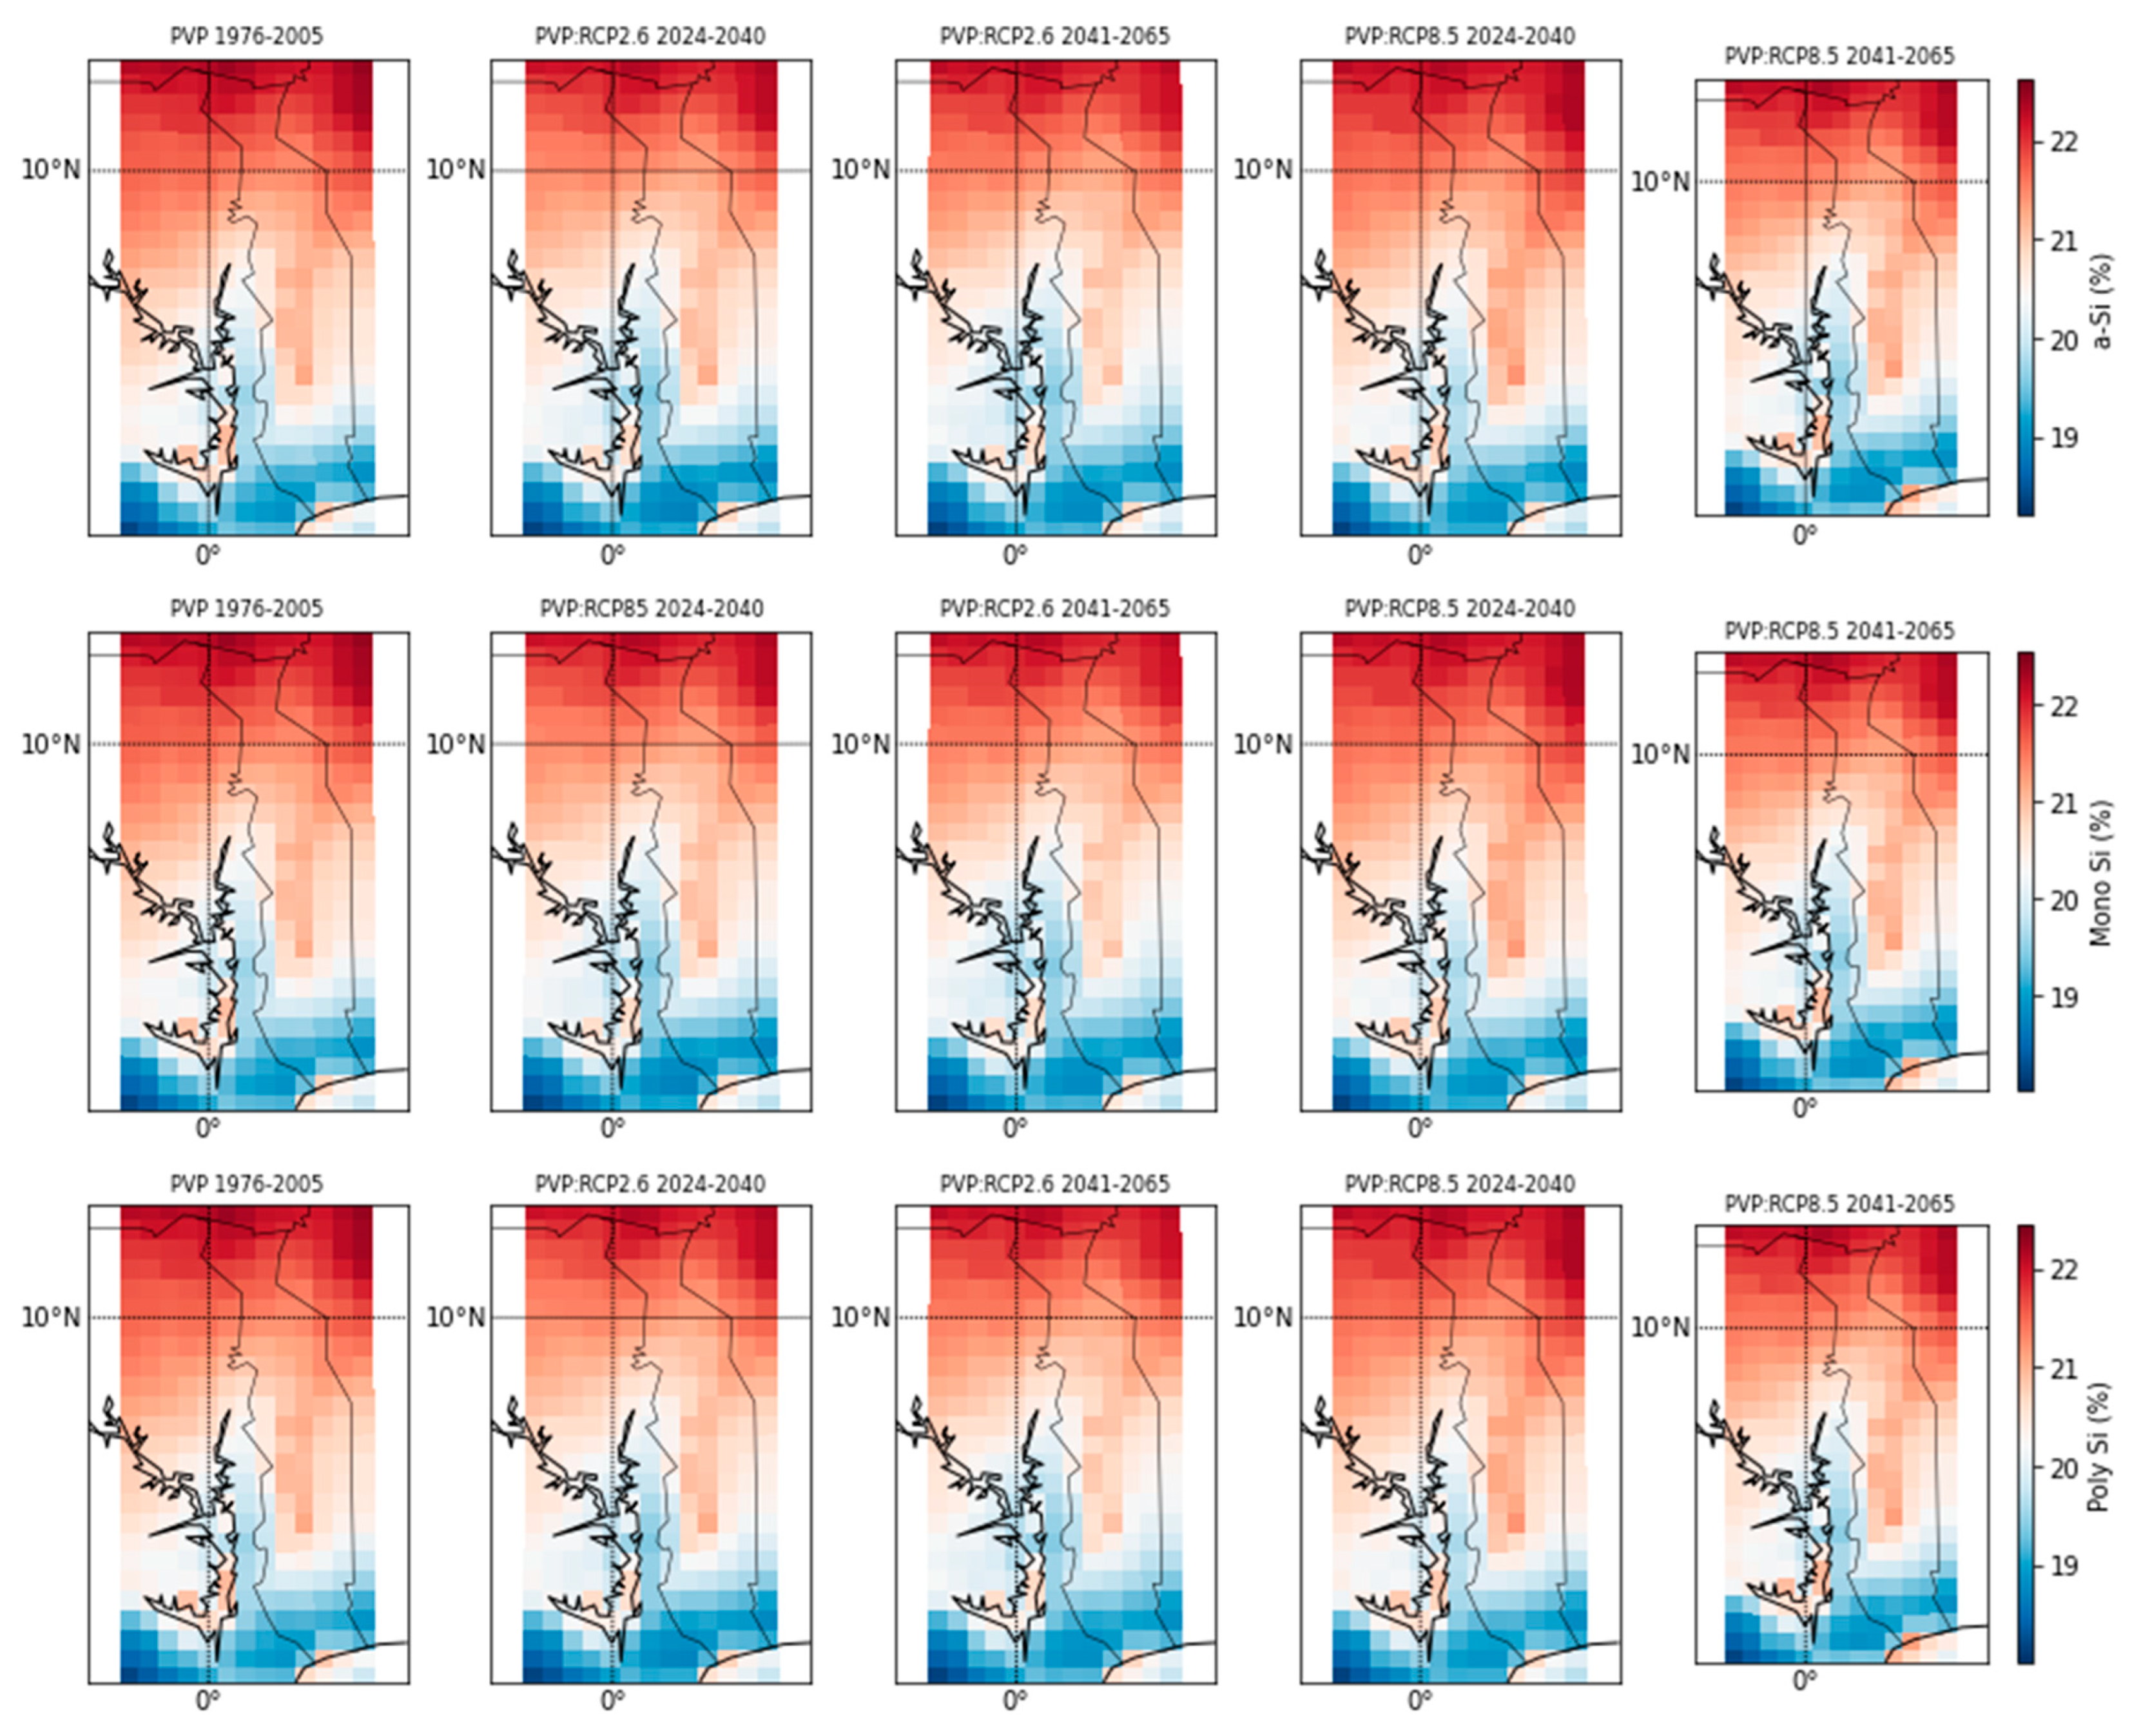
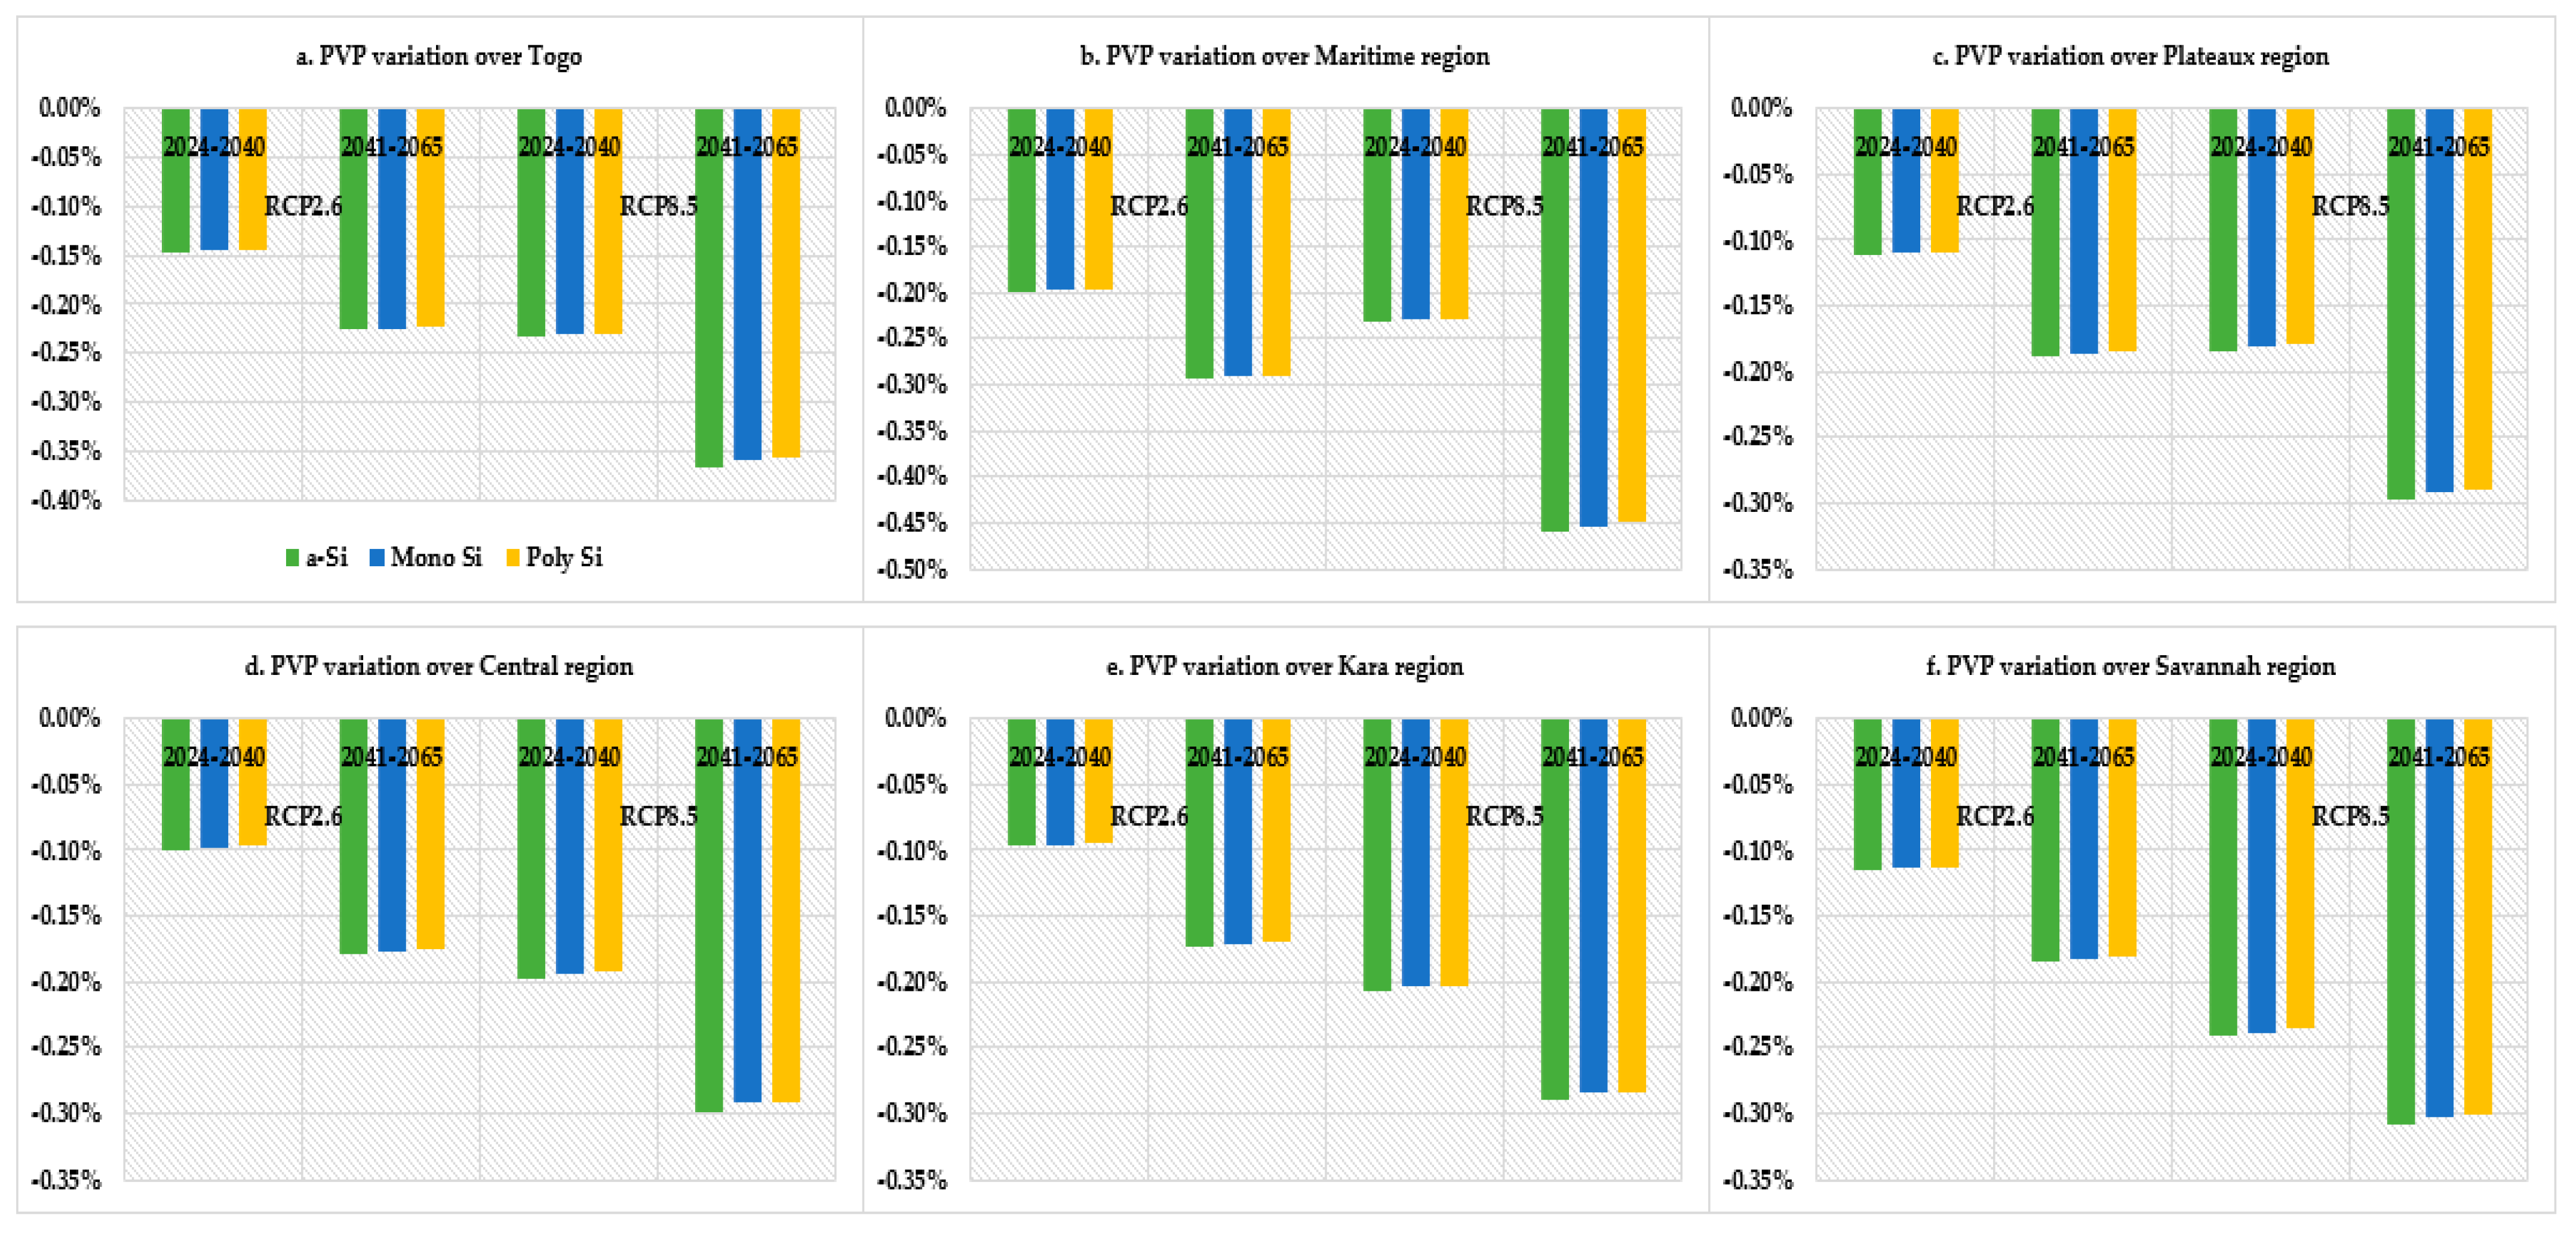
3.4. Projected PVGP Changes over Togo and Its Administrative Regions

3.4.1. PVP Projected Changes over Togo

Figure 9 illustrates the yearly spatial and temporal variations of the PVGP from 2024 to 2065 under the RCP2.6 and 8.5 over the country. These variations depend on the type of cell technology, as noticed in the figure. Hence, the PVGP was projected to vary across the country due to CC. The variabilities may be contingent on seasons. Further, the monthly average PV potential shrunk significantly per annum under the RCP8.5 scenarios. Long-term estimates revealed a PVGP reduction for Poly-Si, Mono-Si, and a-Si of 0.14%, 0.15%, and 0.15%, respectively, under the RCP8.5. The study also disclosed a PVGP rise of 0.22% for Poly-Si, 0.23% for Mono-Si, and 0.23% for a-Si under the RCP2.6 scenarios. The aforementioned studies were performed for the periods 2024–2040 and 2041–2065, in that order, as seen in Figure 10.
The reduction under RCP8.5 would become 0.23% for Poly-Si, 0.23% for Mono-Si, and 0.23% for a-Si during 2024–2040. Finally, these reductions would be 0.36%, 0.36%, and 0.37% for Poly-Si, Mono-Si, and a-Si, respectively, during 2041–2065. A close observation helps recognize that the reduction in the case of Poly-Si technology would be lower compared to Mono and Amorphous. This change in solar energy production potential due to climate change varied across the regions.

3.4.2. Projected PVGP over Maritime Region

This study estimated the impacts of CC on the PVP along the coastal region. The simulations forecast a yearly reduction in PVP irrespective of the PV cell technology. Therefore, the CC-induced reductions under the RCP2.6 scenarios were 0.195% for Poly-Si, 0.197% for Mono-Si, and 0.199% for a-Si over 2024–2040. As time goes on, this reduction worsens. Thus, the long-term catalyzed reductions, viz., for 2041–2065, were, respectively, 0.29%, 0.292%, and 0.295%.
Under the worst-case CC, i.e., RCP8.5, the reduction would likely increase over the region. The estimated reductions were 0.228% for Poly-Si, 0.229% for Mono-Si, and 0.232% for a-Si in 2024–2040. Likewise, the situation in the region continues to worsen even more. Hence, the forecast changes were 0.450%, 0.453%, and 0.459% for Poly, Mono, and Amorphous, in that order, for the mid-future (2041–2065). Under this scenario, the reduction induced in a-Si was the largest, as seen in Figure 10b.

3.4.3. Projected PVGP over the Plateau Region

This section describes the impact of CC on solar energy production over the Plateau. Results revealed a continuous shrinkage in the regional PVGP, as time unfolds. In addition, the reduction in PVGP, modeled by the CORDEX-CORE, closely depended on PV cell technology. Thus, the simulations, under the RCP2.6 scenarios, yielded an average monthly reduction of about 0.11% for each cell technology from 2024 to 2040. Simulations also showed, for the period 2041–2065, that the reductions were 0.185% for Poly-Si, 0.187% for Mono-Si, and 0.189% for a-Si.
However, under the worst-case CC scenarios (RCP8.5), the reductions would likely increase over the region. Additionally, the cut was uniform for all three technologies. This cut was 0.18% from 2024 to 2040. The results also disclosed that the cuts were 0.29% for Poly-Si, 0.29% for Mono-Si, and 0.30% for a-Si in 2041–2065. Thus, the induced-cut in a-Si was the highest, while Ply-Si exhibited the least, as seen in Figure 10c. All things being equal, the CC impacts on PV technology would be more pronounced in the Southern region than in the Plateau.

3.4.4. Projected PVGP over Central Region

Similarly, the impacts of climate change on the PVGP were analyzed for the Central region. It is worth pointing out that the aforementioned three technologies were tested under the same conditions. Astonishingly, the cut in PVGP was the same for all three technologies, but different per scenario. Hence, this CC-induced-reduction, under the RCP2.6 scenarios, was projected to be 0.10% in 2024–2040, while it became 0.18% in 2041–2065.
Nevertheless, under the worst-case climate change scenario (RCP8.5), the reduction would likely increase over the region. These cuts were 0.19% for Poly-Si, 0,19% for Mono-Si, and 0.20% for a-Si in 2024–2040. The changes, then, increased to 0.29%, 0.29%, and 0.30% for Poly, Mono, and Amorphous, respectively, in 2041–2065. The reduction induced in a-Si was projected to be the highest, while that of Poly-Si was the lowest, as seen in Figure 10d.

3.4.5. Projected PVGP over Kara Region

CC impacts on PVGP were investigated in Kara region. This study indicated a reduction in the PVGP over the years. The technologies under scrutiny were Poly-Si, Mono-Si, Amorphous. Under the RCP2.6 scenarios, the projected reductions were uniform across the technologies. This cut was 0.10% in 2024–2040 and 0.17% in 2041–2065.
Nevertheless, under the worst-case climate change scenarios (RCP8.5), the reduction in PVGP would likely increase. According to the projections, the cuts in PVGP were 0.20% for Poly-Si, 0.20% for Mono-SI, and 0.21% for a-Si in 2024–2040. These cuts then became 0.28%, 0.28%, and 0.29% in 2041–2065, respectively, for the Poly-Si, Mono-Si, and a-Si. A close observation divulged an induced-PVGP reduction for a-Si to slightly dominate, while the PVGP of Mono-Si was projected to stay medium, as seen in Figure 10e.

3.4.6. Projected PVGP over Savannah Region

Sound knowledge of the PVGP is necessary to accurately estimate the power generation capacity of the three technologies under investigation, viz., (1) Poly-Si, (2) Mono-Si, and (3) a-Si. It was found that the CC would negatively impact the above-mentioned cells installed in Savannah. Under the RCP2.6 scenarios, the reductions in PVGP were 0.11%, 0.11%, and 0.12% for Poly-Si, Mono-Si, and a-Si, respectively, in 2024–2040. For the mid-future, i.e., 2041–2065, this PVGP cut became 0.18%, irrespective of the cell in question.
However, under the worst-case climate change scenario (RCP8.5) the reduction would likely increase in Savannah. Thus, a uniform cut of 0.24% was estimated for all the cells in 2024–2040. In contrast, under the RCP8.5, the mid-future cuts were 0.30%, 0.30%, and 0.31% for Poly-Si, Mono-Si, and Amorphous), respectively, in that order. Finally, the induced reduction in a-Si was slightly to dominate, as seen in Figure 10f.

3.5. Comparative Analysis

A growing interest is noticed nowadays in developing countries to decentralize the socio-economic sector on one hand. On the other hand, tremendous efforts are put in place to diversify the energy generation mix. The Togolese economy is no exception. It is embarking on a transformative journey to cut down its GHG emissions through investing in clean and green energy. Hence, new transformative industries are encouraged through tax-cut and other incentives to be implanted in the South. Similarly, new power plants are planned to be commissioned far from the capital city, but near the load-centers to ensure an effective minimization of transmission costs. Therefore, it is of great importance to analyze the picture of each administrative region of the country under the CC-based scenarios. This investigation could help control the production of clean and renewable power. Throughout this study, CC was proved to significantly impact RE resources and its related technologies.
Under the current study, it was understood that the impacts of CC on solar energy projects in Togo gave an average overview of the situation for decades to come. Therefore, the findings shed light on the bigger picture that could be observed at a regional scale as succinctly depicted Table 5. Though a locality may fall within a particular zone, such as Guinea, Soudanese, and Sahelian, with fairly uniform characteristics, morphology, topography, and weather conditions, features varied from one locality to another.
At the regional scale, CC’s impact on PV cell temperature and solar energy production varied across the Togolese regions. From the projections, these variations depended solely on (1) RCP scenarios, (2) cell technology, and (3) region. See Figure 11 for more details. There would be a likely rise in cell temperature and a decrease in PVGP under all the climate scenarios during 2024–2065 across all the administrative regions. The rise in PVct may be more pronounced following a-Si technology and less with Poly-Si under either of the RCP2.6 and RCP8.5 scenarios over the five regions. Accordingly, the increase in PVct would likely result in PVGP decline over the regions. The Poly-Si-based technology appears to likely be more resilient followed by the Mono-Si based under the changing climate impacts over the years, under the Togolese weather conditions.
The PVct may rise on average at a rate of 0.82 °C over the Maritime region to 1.07 °C over Kara under the RCP2.6, and at a rate of 0.89 °C over the Maritime region to 1.94 °C over the Savannah under RCP8.5 if the Poly-Si technology is considered from 2024 to 2065.
The PVGP was projected to decrease with a rate of −0.1% over Kara to −0.3% over the Maritime under RCP2.6. The PVGP was also forecast to decline at a rate of −0.18% over the Plateau to −0.45% over the Maritime under RCP8.5 if Poly-Si was considered for the period 2024–2065.
In general, over the country, the average rise in the cell temperature would be between 0.88 °C to 1 °C and 0.97 °C to 1.82 °C during 2024–2040 under RCP2.6 and 8.5 concerning Poly-Si and a-Si, respectively. In addition, the average decrease would likely vary from −0.14% to −0.226% under RCP2.6 and −0.23% to −0.4% under RCP8.5 for Poly-Si and a-Si, in that order, over the country.

4. Conclusions

The long-term shifts in temperature and weather patterns, also known as climate change (CC), have inflicted severe socio-economic losses to the global economy. These economic forfeitures are so unprecedented that an assessment of their impacts on renewable energy potentials is necessary. This study investigated the impact of CC on photovoltaic cell temperature (PVct) and photovoltaic generation potential (PVP), considering three PV-cell technologies (i.e., amorphous, monocrystalline, and polycrystalline), under the Togolese climate conditions. The Regional Climate Model version 4 (RegCM4), licensed by the CORDEX-CORE initiative, was utilized. Hence, possible social and environmental impacts have been investigated for the period 2024–2065 under two climate scenarios—a low radiative forcing (RCP2.6) and a high radiative forcing (RCP8.5). Consequently, the PVct would likely rise, while the PVP would decrease during the period 2024–2065 under the two scenarios (RCP2.6 and RCP8.5). These variations depended on three main factors, namely the (1) climate scenario, (2) PV cell technology, and (3) geographical location (regions) of the country. The magnitude of the induced variation was found to be more pronounced under the scenario RCP8.5 for amorphous cells. The PVct would plausibly rise from 1.03 °C to 1.88 °C, while PVP would likely decrease by 0.23% and 0.37% under RCP2.6 and 8.5, respectively, for a-Si technology. Regionally, the magnitude of these impacts would most likely increase from the South (Maritime region) to North (Savanes region), regardless of the scenarios and PV cell technologies.
This study gave evidence that the outputs of solar PV plants would likely to be undermined by consequences of CC. Therefore, based on these findings, it is recommended that for decentralized solar power systems (viz., grid-tied, energy storage systems, mini-grid, and micro-grids), policy-makers, investors, and energy planners need to factor in the effects of CC in the following activities: (1) feasibility studies, (2) frequency of maintenance and monitoring, (3) planning for alternative solutions, and (4) responding to sudden changes in power stability and reliability. Finally, emerging nations—Togo and neighboring countries—are urged to develop a green energy policy to mitigate CC.

Author Contributions

Conceptualization, K.A. and Y.L.; methodology, K.A., Y.L., R.B. and Y.M.; software, K.A.; validation, K.A., Y.L., R.B. and Y.M.; formal analysis, K.A. and Y.L.; investigation, K.A., Y.L. and Y.M.; resources, K.A. and Y.L.; data curation, K.A. and W.S.; writing—original draft preparation, K.A., Y.L., R.B. and Y.M.; writing—review and editing, K.A., Y.L., Y.M., R.B., A.Y.G.E. and W.S.; supervision, Y.L., Y.M., R.B. and S.M.; funding acquisition, K.A., Y.L. and R.B. All authors have read and agreed to the published version of the manuscript.

Funding

K.A. (corresponding author) is grateful for the doctoral scholarship through WASCAL, with the funds provided by the BMBF. Y.L. and K.A. extend their acknowledgement to Centre d’Excellence Régional pour la Maîtrise de l’Electricité (CERME) of the University of Lomé for their support. R.B. would like to acknowledge the financial support from German Federal Ministry of Education and Research through its Project Management Agency Jülich under the framework of RETO-DOSSO project (no 03SF0598A).

Data Availability Statement

The data that support the findings of this study are available from the corresponding author upon request.

Conflicts of Interest

The authors declare no conflict of interest. The funders had no role in the design of the study; in the collection, analyses, or interpretation of data; in the writing of the manuscript; or in the decision to publish the results.

References

  1. Wirtschaft, Z.B.W.L. Development of Electricity Program, Electrificaty Ratio with Human Development Index in West Java Province, Indonesia. Mater. Test. 1999, 41, 307. [Google Scholar] [CrossRef]
  2. Akinyele, D.O.; Nair, N.K.C.; Rayudu, R.K.; Chakrabarti, B. Decentralized Energy Generation for End-Use Applications: Economic, Social and Environmental Benefits Assessment. In Proceedings of the 2014 IEEE Innovative Smart Grid Technologies-Asia (ISGT ASIA), Kuala Lumpur, Malaysia, 20–23 May 2014; pp. 84–89. [Google Scholar] [CrossRef]
  3. Akinyele, D.O.; Rayudu, R.K. Distributed Photovoltaic Power Generation for Energy-Poor Households: The Nigerian Perspective. In Proceedings of the 2013 IEEE PES Asia-Pacific Power and Energy Engineering Conference (APPEEC), Kowloon, Hong Kong, 8–11 December 2013. [Google Scholar] [CrossRef]
  4. International Renewable Energy Agency Fostering Livelihoods with Decentralised Renewable Energy: An Ecosystem Approach; International Renewable Energy Agency: Abu Dhabi, United Arab Emirates, 2022; ISBN 978-92-9260-412-7.
  5. Madurai Elavarasan, R.; Afridhis, S.; Vijayaraghavan, R.R.; Subramaniam, U.; Nurunnabi, M. SWOT Analysis: A Framework for Comprehensive Evaluation of Drivers and Barriers for Renewable Energy Development in Significant Countries. Energy Reports 2020, 6, 1838–1864. [Google Scholar] [CrossRef]
  6. Elavarasan, R.M.; Shafiullah, G.M.; Manoj Kumar, N.; Padmanaban, S. A State-of-the-Art Review on the Drive of Renewables in Gujarat, State of India: Present Situation, Barriers and Future. Energies 2019, 13, 40. [Google Scholar] [CrossRef] [Green Version]
  7. Santika, W.G.; Anisuzzaman, M.; Simsek, Y.; Bahri, P.A.; Shafiullah, G.M.; Urmee, T. Implications of the Sustainable Development Goals on National Energy Demand: The Case of Indonesia. Energy 2020, 196, 117100. [Google Scholar] [CrossRef]
  8. Elavarasan, R.M.; Selvamanohar, L.; Raju, K.; Vijayaraghavan, R.R.; Subburaj, R.; Nurunnabi, M.; Khan, I.A.; Afridhis, S.; Hariharan, A.; Pugazhendhi, R.; et al. A Holistic Review Of The Present And Future Drivers Of The Renewable Energy Mix in Maharashtra, State of India. Sustainability 2020, 12, 6596. [Google Scholar] [CrossRef]
  9. Speer, B.; Miller, M.; Gueran, L.; Reuter, A.; Widegren, K. The Role of Smart Grids in Integrating Renewable Energy The Role of Smart Grid in Integrating Renewable Energy; National Renewable Energy Lab.(NREL): Golden, CO, USA, 2015. [Google Scholar]
  10. Alotaibi, I.; Abido, M.A.; Khalid, M.; Savkin, A.V. A Comprehensive Review of Recent Advances in Smart Grids: A Sustainable Future with Renewable Energy Resources. Energies 2020, 13, 6269. [Google Scholar] [CrossRef]
  11. Gellings, C. EPRI Estimating the Costs and Benefits of the Smart Grid: A Preliminary Estimate of the Investment Requirements and the Resultant Benefits of a Fully Functioning Smart Grid; Electric Power Research Institute Final Report; Electric Power Research Institute (EPRI): Washington, DC, USA, 2011. [Google Scholar]
  12. Ayadi, F.; Colak, I.; Garip, I.; Bulbul, H.I. Impacts of Renewable Energy Resources in Smart Grid. In Proceedings of the 2020 8th International Conference on Smart Grid (icSmartGrid), Paris, France, 17–19 June 2020; pp. 183–188. [Google Scholar] [CrossRef]
  13. Clastres, C. Smart Grids: Another Step towards Competition, Energy Security and Climate Change Objectives. Energy Policy 2011, 39, 5399–5408. [Google Scholar] [CrossRef]
  14. Wissner, M. The Smart Grid—A Saucerful of Secrets? Appl. Energy 2011, 88, 2509–2518. [Google Scholar] [CrossRef]
  15. Nobre, P.; Pereira, E.B.; Lacerda, F.F.; Bursztyn, M.; Haddad, E.A.; Ley, D. Solar Smart Grid as a Path to Economic Inclusion and Adaptation to Climate Change in the Brazilian Semiarid Northeast. Int. J. Clim. Chang. Strateg. Manag. 2019, 11, 499–517. [Google Scholar] [CrossRef]
  16. Islam, M.A.; Hasanuzzaman, M.; Rahim, N.A.; Nahar, A.; Hosenuzzaman, M. Global Renewable Energy-Based Electricity Generation and Smart Grid System for Energy Security. Sci. World J. 2014, 2014, 197136. [Google Scholar] [CrossRef] [Green Version]
  17. Joshi, A.S.; Dincer, I.; Reddy, B.V. Role of Renewable Energy in Sustainable Development; Springer: Boston, MA, USA, 2010; ISBN 9781441910165. [Google Scholar]
  18. Oyedepo, S.O.; Babalola, O.P.; Nwanya, S.C.; Kilanko, O.; Leramo, R.O.; Aworinde, A.K.; Adekeye, T.; Oyebanji, J.A.; Abidakun, A.O.; Agberegha, O.L. Towards a Sustainable Electricity Supply in Nigeria: The Role of Decentralized Renewable Energy System. Eur. J. Sustain. Dev. Res. 2018, 2, 40. [Google Scholar] [CrossRef] [PubMed] [Green Version]
  19. Nyasapoh, M.A.; Elorm, M.D.; Derkyi, N.S.A. The Role of Renewable Energies in Sustainable Development of Ghana. Sci. African 2022, 16, e01199. [Google Scholar] [CrossRef]
  20. Pooja, B.; Ajmer, S. Smart Metering in Smart Grid Framework: A Review. In Proceedings of the 2016 Fourth International Conference on Parallel, Distributed and Grid Computing (PDGC), Waknaghat, India, 22–24 December 2016; pp. 7–9. [Google Scholar]
  21. Beidou, F.B.; Morsi, W.G.; Diduch, C.P.; Chang, L. Smart Grid: Challenges, Research Directions and Possible Solutions. In Proceedings of the The 2nd International Symposium on Power Electronics for Distributed Generation Systems, Hefei, China, 16–18 June 2010; pp. 670–673. [Google Scholar]
  22. Konstantelos, I.; Giannelos, S.; Member, S.; Strbac, G. Strategic Valuation of Smart Grid Technology Options in Distribution Networks. IEEE Trans. Power Syst. 2016, 8950, 1–11. [Google Scholar] [CrossRef] [Green Version]
  23. Bayindir, R.; Hossain, E.; Vadi, S. The Path of the Smart Grid -The New and Improved Power Grid. In Proceedings of the 2016 International Smart Grid Workshop and Certificate Program (ISGWCP), Istanbul, Turkey, 21–25 March 2016; pp. 62–69. [Google Scholar]
  24. Kumar, N.M.; Chand, A.A.; Malvoni, M.; Prasad, K.A.; Mamun, K.A.; Islam, F.R.; Chopra, S.S. Distributed Energy Resources and the Application of Ai, Iot, and Blockchain in Smart Grids. Energies 2020, 13, 5739. [Google Scholar] [CrossRef]
  25. Al Haj Hassan, H.; Gamboa, S.; Nuaymi, L.; Pelov, A.; Montavont, N. The Smart Grid and Future Mobile Networks: Integrating Renewable Energy Sources and Delay Tolerant Users. In Proceedings of the 2015 IEEE 82nd Vehicular Technology Conference (VTC2015-Fall), Boston, MA, USA, 6–9 September 2015. [Google Scholar] [CrossRef]
  26. Al-Shetwi, A.Q. Sustainable Development of Renewable Energy Integrated Power Sector: Trends, Environmental Impacts, and Recent Challenges. Sci. Total Environ. 2022, 822, 153645. [Google Scholar] [CrossRef]
  27. Phuangpornpitak, N.; Tia, S. Opportunities and Challenges of Integrating Renewable Energy in Smart Grid System. Energy Procedia 2013, 34, 282–290. [Google Scholar] [CrossRef]
  28. Sinsel, S.R.; Riemke, R.L.; Hoffmann, V.H. Challenges and Solution Technologies for the Integration of Variable Renewable Energy Sources—A Review. Renew. Energy 2019, 145, 2271–2285. [Google Scholar] [CrossRef]
  29. Begum, R.A.; Al-muhsen, N.F.O.; Soujeri, E. Solar Photovoltaic Energy Optimization Methods, Challenges and Issues: A Comprehensive Review. J. Clean. Prod. 2020, 284, 125465. [Google Scholar] [CrossRef]
  30. Arnold, B.G.W. Challenges and Opportunities in Smart Grid: A Position Article. Proc. IEEE 2011, 99, 2–7. [Google Scholar] [CrossRef]
  31. Xiang, C.; Zhao, X.; Tan, L.; Ye, J.; Wu, S.; Zhang, S.; Sun, L. A Solar Tube: Efficiently Converting Sunlight into Electricity and Heat. Nano Energy 2019, 55, 269–276. [Google Scholar] [CrossRef]
  32. Ibram, G. Solar Fuels Vis-à-Vis Electricity Generation from Sunlight: The Current State-of-the-Art (a Review). Renew. Sustain. Energy Rev. 2015, 44, 904–932. [Google Scholar] [CrossRef]
  33. Khursheed, M.U.N.; Nadeem Khan, M.F.; Ali, G.; Khan, A.K. A Review of Estimating Solar Photovoltaic Cell Parameters. In Proceedings of the 2019 2nd International Conference on Computing, Mathematics and Engineering Technologies (iCoMET), Sukkur, Pakistan, 30–31 January 2019; pp. 1–6. [Google Scholar] [CrossRef]
  34. Goel, S.; Sharma, R. Performance Evaluation of Stand Alone, Grid Connected and Hybrid Renewable Energy Systems for Rural Application: A Comparative Review. Renew. Sustain. Energy Rev. 2017, 78, 1378–1389. [Google Scholar] [CrossRef]
  35. Das, B.K. Optimal Sizing of Stand-Alone and Grid-Connected Solar PV Systems in Bangladesh. Int. J. Energy a Clean Environ. 2020, 21, 107–124. [Google Scholar] [CrossRef]
  36. Ghenai, C.; Bettayeb, M. Grid-Tied Solar PV/Fuel Cell Hybrid Power System for University Building. Energy Procedia 2019, 159, 96–103. [Google Scholar] [CrossRef]
  37. International Renewable Energy Agency. Renewable Capacity Highlights; IRENA: Abu Dhabi, United Arab Emirates, 2021. [Google Scholar]
  38. ARSE Rapports Annuels 2020. Available online: www.arse.tg (accessed on 7 July 2022).
  39. Srikranjanapert, M.; Junlakarn, S.; Hoonchareon, N. How an Integration of Home Energy Management and Battery System Affects the Economic Benefits of Residential Pv System Owners in Thailand. Sustain. 2021, 13, 2681. [Google Scholar] [CrossRef]
  40. Pillai, G.G.; Putrus, G.A.; Georgitsioti, T.; Pearsall, N.M. Near-Term Economic Benefits from Grid-Connected Residential PV (Photovoltaic) Systems. Energy 2014, 68, 832–843. [Google Scholar] [CrossRef]
  41. Raza, F.; Tamoor, M.; Miran, S.; Arif, W.; Kiren, T.; Amjad, W.; Hussain, M.I.; Lee, G.H. The Socio-Economic Impact of Using Photovoltaic (PV) Energy for High-Efficiency Irrigation Systems: A Case Study. Energies 2022, 15, 1198. [Google Scholar] [CrossRef]
  42. Litjens, G.B.M.A.; Worrell, E.; van Sark, W.G.J.H.M. Economic Benefits of Combining Self-Consumption Enhancement with Frequency Restoration Reserves Provision by Photovoltaic-Battery Systems. Appl. Energy 2018, 223, 172–187. [Google Scholar] [CrossRef]
  43. Liu, Y.; Zhang, R.Q.; Ma, X.R.; Wu, G.L. Combined Ecological and Economic Benefits of the Solar Photovoltaic Industry in Arid Sandy Ecosystems. J. Clean. Prod. 2020, 262, 121376. [Google Scholar] [CrossRef]
  44. Bonkaney, A.L.; Madougou, S.; Adamou, R. Impact of Climatic Parameters on the Performance of Solar Photovoltaic (PV) Module in Niamey. Smart Grid Renew. Energy 2017, 08, 379–393. [Google Scholar] [CrossRef] [Green Version]
  45. Bonkaney, A.; Madougou, S.; Adamou, R. Impacts of Cloud Cover and Dust on the Performance of Photovoltaic Module in Niamey. J. Renew. Energy 2017, 2017, 9107502. [Google Scholar] [CrossRef] [Green Version]
  46. Slootweg, J.G.; Jordán Córdova, C.E.P.; Montes Portela, C.; Morren, J. Smart Grids—Intelligence for Sustainable Electrical Power Systems. In Proceedings of the 2011 IEEE 33rd International Telecommunications Energy Conference (INTELEC), Amsterdam, The Netherlands, 9–13 October 2011; pp. 1–8. [Google Scholar] [CrossRef]
  47. Römer, B.; Reichhart, P.; Kranz, J.; Picot, A. The Role of Smart Metering and Decentralized Electricity Storage for Smart Grids: The Importance of Positive Externalities. Energy Policy 2012, 50, 486–495. [Google Scholar] [CrossRef]
  48. Basit, M.A.; Dilshad, S.; Badar, R.; Sami ur Rehman, S.M. Limitations, Challenges, and Solution Approaches in Grid-Connected Renewable Energy Systems. Int. J. Energy Res. 2020, 44, 4132–4162. [Google Scholar] [CrossRef]
  49. Sathiyanathan, M.; Jaganathan, S.; Josephine, R.L. Multi-Mode Power Converter Topology for Renewable Energy Integration With Smart Grid. In Integration of Renewable Energy Sources with Smart Grid; Wiley Online Library: New York, NY, USA, 2021; pp. 141–169. [Google Scholar] [CrossRef]
  50. Sawadogo, W.; Reboita, M.S.; Faye, A.; da Rocha, R.P.; Odoulami, R.C.; Olusegun, C.F.; Adeniyi, M.O.; Abiodun, B.J.; Sylla, M.B.; Diallo, I.; et al. Current and Future Potential of Solar and Wind Energy over Africa Using the RegCM4 CORDEX-CORE Ensemble. Clim. Dyn. 2020, 57, 1647–1672. [Google Scholar] [CrossRef]
  51. Patchali, T.E.; Ajide, O.O.; Matthew, O.J.; Salau, T.A.O.; Oyewola, O.M. Examination of Potential Impacts of Future Climate Change on Solar Radiation in Togo, West Africa. SN Appl. Sci. 2020, 2, 1941. [Google Scholar] [CrossRef]
  52. Presidence togolaise Stratégie d ’électrification Du Togo. Available online: https://togopresse.tg (accessed on 11 November 2021).
  53. Dubey, S.; Sarvaiya, J.N.; Seshadri, B. Temperature Dependent Photovoltaic (PV) Efficiency and Its Effect on PV Production in the World—A Review. Energy Procedia 2013, 33, 311–321. [Google Scholar] [CrossRef] [Green Version]
  54. Bichet, A.; Hingray, B.; Evin, G.; Diedhiou, A.; Kebe, C.M.F.; Anquetin, S. Potential Impact of Climate Change on Solar Resource in Africa for Photovoltaic Energy: Analyses from CORDEX-Africa Climate Experiments. Environ. Res. Lett. 2019, 14, 124039. [Google Scholar] [CrossRef]
  55. Sawadogo, W.; Abiodun, B.J.; Okogbue, E.C. Impacts of Global Warming on Photovoltaic Power Generation over West Africa. Renew. Energy 2019, 151, 263–277. [Google Scholar] [CrossRef]
  56. Jerez, S.; Tobin, I.; Vautard, R.; Montávez, J.P.; López-Romero, J.M.; Thais, F.; Bartok, B.; Christensen, O.B.; Colette, A.; Déqué, M.; et al. The Impact of Climate Change on Photovoltaic Power Generation in Europe. Nat. Commun. 2015, 6, 10014. [Google Scholar] [CrossRef] [Green Version]
  57. Remedio, A.R.; Teichmann, C.; Buntemeyer, L.; Sieck, K.; Weber, T.; Rechid, D.; Hoffmann, P.; Nam, C.; Kotova, L.; Jacob, D. Evaluation of New CORDEX Simulations Using an Updated Köppen-Trewartha Climate Classification. Atmosphere 2019, 10, 726. [Google Scholar] [CrossRef] [Green Version]
  58. Coppola, E.; Raffaele, F.; Giorgi, F.; Giuliani, G.; Xuejie, G.; Ciarlo, J.M.; Sines, T.R.; Torres-Alavez, J.A.; Das, S.; di Sante, F.; et al. Climate Hazard Indices Projections Based on CORDEX-CORE, CMIP5 and CMIP6 Ensemble. Clim. Dyn. 2021, 57, 1293–1383. [Google Scholar] [CrossRef]
  59. Torres-Alavez, J.A.; Das, S.; Corrales-Suastegui, A.; Coppola, E.; Giorgi, F.; Raffaele, F.; Bukovsky, M.S.; Ashfaq, M.; Salinas, J.A.; Sines, T. Future Projections in the Climatology of Global Low-Level Jets from CORDEX-CORE Simulations. Clim. Dyn. 2021, 57, 1551–1569. [Google Scholar] [CrossRef]
  60. Giorgi, F.; Coppola, E.; Jacob, D.; Teichmann, C.; Omar, S.A.; Ashfaq, M.; Ban, N.; Bülow, K.; Bukovsky, M.; Buntemeyer, L.; et al. The CORDEX-CORE EXP-I Initiative. Bull. Am. Meteorol. Soc. 2021, 103, 293–310. [Google Scholar] [CrossRef]
  61. Teichmann, C.; Jacob, D.; Remedio, A.R.; Remke, T.; Buntemeyer, L.; Hoffmann, P.; Kriegsmann, A.; Lierhammer, L.; Bülow, K.; Weber, T.; et al. Assessing Mean Climate Change Signals in the Global CORDEX-CORE Ensemble. Clim. Dyn. 2021, 57, 1269–1292. [Google Scholar] [CrossRef]
  62. Torres-Alavez, J.A.; Glazer, R.; Giorgi, F.; Coppola, E.; Gao, X.; Hodges, K.I.; Das, S.; Ashfaq, M.; Reale, M.; Sines, T. Future Projections in Tropical Cyclone Activity over Multiple CORDEX Domains from RegCM4 CORDEX-CORE Simulations. Clim. Dyn. 2021, 57, 1507–1531. [Google Scholar] [CrossRef]
  63. Giorgi, F.; Coppola, E.; Teichmann, C.; Jacob, D. Editorial for the CORDEX-CORE Experiment I Special Issue. Clim. Dyn. 2021, 57, 1265–1268. [Google Scholar] [CrossRef]
  64. Elguindi, N.; Giorgi, F.; Turuncoglu, U. Assessment of CMIP5 Global Model Simulations over the Subset of CORDEX Domains Used in the Phase I CREMA. Clim. Change 2014, 125, 7–21. [Google Scholar] [CrossRef]
  65. Moss, R.H.; Edmonds, J.A.; Hibbard, K.A.; Manning, M.R.; Rose, S.K.; Van Vuuren, D.P.; Carter, T.R.; Emori, S.; Kainuma, M.; Kram, T.; et al. The next Generation of Scenarios for Climate Change Research and Assessment. Nature 2010, 463, 747–756. [Google Scholar] [CrossRef]
  66. Pfeifroth, U.; Sanchez-Lorenzo, A.; Manara, V.; Trentmann, J.; Hollmann, R. Trends and Variability of Surface Solar Radiation in Europe Based On Surface- and Satellite-Based Data Records. J. Geophys. Res. Atmos. 2018, 123, 1735–1754. [Google Scholar] [CrossRef]
  67. Tang, C.; Morel, B.; Wild, M.; Pohl, B.; Abiodun, B.; Lennard, C.; Bessafi, M. Numerical Simulation of Surface Solar Radiation over Southern Africa. Part 2: Projections of Regional and Global Climate Models; Springer: Berlin/Heidelberg, Germany, 2019; Volume 53, ISBN 0123456789. [Google Scholar]
  68. Boilley, A.; Wald, L. Comparison between Meteorological Re-Analyses from ERA-Interim and MERRA and Measurements of Daily Solar Irradiation at Surface. Renew. Energy 2015, 75, 135–143. [Google Scholar] [CrossRef]
  69. Hersbach, H.; Bell, B.; Berrisford, P.; Hirahara, S.; Horányi, A.; Muñoz-Sabater, J.; Nicolas, J.; Peubey, C.; Radu, R.; Schepers, D.; et al. The ERA5 Global Reanalysis. Q. J. R. Meteorol. Soc. 2020, 146, 1999–2049. [Google Scholar] [CrossRef]
  70. Hersbach, H.; Bell, B.; Berrisford, P.; Horányi, A.; Sabater, J.M.; Nicolas, J.; Radu, R.; Schepers, D.; Simmons, A.; Soci, C.; et al. Global Reanalysis: Goodbye ERA-Interim, Hello ERA5. In ECMWF Newsletter No. 159; Lentze, G., Ed.; European Centre for Medium-Range Weather Forecasts (ECMWF): Reading, UK, 2019; pp. 17–24. [Google Scholar] [CrossRef]
  71. Dullaart, J.C.M.; Muis, S.; Bloemendaal, N.; Aerts, J.C.J.H. Advancing Global Storm Surge Modelling Using the New ERA5 Climate Reanalysis. Clim. Dyn. 2020, 54, 1007–1021. [Google Scholar] [CrossRef]
  72. Tall, M.; Albergel, C.; Bonan, B.; Zheng, Y.; Guichard, F.; Dramé, M.S.; Gaye, A.T.; Sintondji, L.O.; Hountondji, F.C.C.; Nikiema, P.M.; et al. Towards a Long-Term Reanalysis of Land Surface Variables over Western Africa: LDAS-Monde Applied over Burkina Faso from 2001 to 2018. Remote Sens. 2019, 11, 735. [Google Scholar] [CrossRef] [Green Version]
  73. Wang, C.; Graham, R.M.; Wang, K.; Gerland, S.; Granskog, M.A. Comparison of ERA5 and ERA-Interim near-Surface Air Temperature, Snowfall and Precipitation over Arctic Sea Ice: Effects on Sea Ice Thermodynamics and Evolution. Cryosphere 2019, 13, 1661–1679. [Google Scholar] [CrossRef] [Green Version]
  74. Collins, W.J.; Bellouin, N.; Doutriaux-Boucher, M.; Gedney, N.; Hinton, T.; Jones, C.D.; Liddicoat, S.; Martin, G.; O’Connor, F.; Rae, J.; et al. Evaluation of HadGEM2 Model; Met Office: Exeter, UK, 2008; 47p. [Google Scholar]
  75. Martin, G.M.; Bellouin, N.; Collins, W.J.; Culverwell, I.D.; Halloran, P.R.; Hardiman, S.C.; Hinton, T.J.; Jones, C.D.; McDonald, R.E.; McLaren, A.J.; et al. The HadGEM2 Family of Met Office Unified Model Climate Configurations. Geosci. Model Dev. 2011, 4, 723–757. [Google Scholar] [CrossRef] [Green Version]
  76. Giorgetta, M.A.; Jungclaus, J.; Reick, C.H.; Legutke, S.; Bader, J.; Böttinger, M.; Brovkin, V.; Crueger, T.; Esch, M.; Fieg, K.; et al. Climate and Carbon Cycle Changes from 1850 to 2100 in MPI-ESM Simulations for the Coupled Model Intercomparison Project Phase 5. J. Adv. Model. Earth Syst. 2013, 5, 572–597. [Google Scholar] [CrossRef]
  77. Iversen, T.; Bentsen, M.; Bethke, I.; Debernard, J.B.; Kirkevåg, A.; Seland, Ø.; Drange, H.; Kristjansson, J.E.; Medhaug, I.; Sand, M.; et al. The Norwegian Earth System Model, NorESM1-M—Part 2: Climate Response and Scenario Projections. Geosci. Model Dev. 2013, 6, 389–415. [Google Scholar] [CrossRef] [Green Version]
  78. Bentsen, M.; Bethke, I.; Debernard, J.B.; Iversen, T.; Kirkevåg, A.; Seland, Ø.; Drange, H.; Roelandt, C.; Seierstad, I.A.; Hoose, C.; et al. The Norwegian Earth System Model, NorESM1-M—Part 1: Description and Basic Evaluation of the Physical Climate. Geosci. Model Dev. 2013, 6, 687–720. [Google Scholar] [CrossRef] [Green Version]
  79. van Vuuren, D.P.; Edmonds, J.; Kainuma, M.; Riahi, K.; Thomson, A.; Hibbard, K.; Hurtt, G.C.; Kram, T.; Krey, V.; Lamarque, J.F.; et al. The Representative Concentration Pathways: An Overview. Clim. Change 2011, 109, 5–31. [Google Scholar] [CrossRef]
  80. van Vuuren, D.P.; Stehfest, E.; den Elzen, M.G.J.; Kram, T.; van Vliet, J.; Deetman, S.; Isaac, M.; Goldewijk, K.K.; Hof, A.; Beltran, A.M.; et al. RCP2.6: Exploring the Possibility to Keep Global Mean Temperature Increase below 2°C. Clim. Change 2011, 109, 95–116. [Google Scholar] [CrossRef]
  81. Gray, V. Climate Change 2007: The Physical Science Basis Summary for Policymakers. Energy Environ. 2007, 18, 433–440. [Google Scholar] [CrossRef] [Green Version]
  82. Riahi, K.; Rao, S.; Krey, V.; Cho, C.; Chirkov, V.; Fischer, G.; Kindermann, G.; Nakicenovic, N.; Rafaj, P. RCP 8.5-A Scenario of Comparatively High Greenhouse Gas Emissions. Clim. Change 2011, 109, 33–57. [Google Scholar] [CrossRef]
  83. San José, R.; Pérez, J.L.; González, R.M.; Pecci, J.; Garzón, A.; Palacios, M. Impacts of the 4.5 and 8.5 RCP Global Climate Scenarios on Urban Meteorology and Air Quality: Application to Madrid, Antwerp, Milan, Helsinki and London. J. Comput. Appl. Math. 2016, 293, 192–207. [Google Scholar] [CrossRef]
  84. Kafka, J.L.; Miller, M.A. A Climatology of Solar Irradiance and Its Controls across the United States: Implications for Solar Panel Orientation. Renew. Energy 2019, 135, 897–907. [Google Scholar] [CrossRef]
  85. Mavromatakis, F.; Makrides, G.; Georghiou, G.; Pothrakis, A.; Franghiadakis, Y.; Drakakis, E.; Koudoumas, E. Modeling the Photovoltaic Potential of a Site. Renew. Energy 2010, 35, 1387–1390. [Google Scholar] [CrossRef]
  86. Tonui, J.K.; Tripanagnostopoulos, Y. Performance Improvement of PV/T Solar Collectors with Natural Air Flow Operation. Sol. Energy 2008, 82, 1–12. [Google Scholar] [CrossRef]
  87. TamizhMani, G.; Ji, L.; Tang, Y.; Petacci, L.; Osterwald, C. Photovoltaic Module Thermal/Wind Performance: Long-Term Monitoring and Model Development For Energy Rating. In Proceedings of the NCPV and Solar Program Review Meeting Proceedings, Denver, Colorado, 24–26 March 2003; pp. 936–939. [Google Scholar]
  88. Wilcox, L.J.; Highwood, E.J.; Booth, B.B.B.; Carslaw, K.S. Quantifying Sources of Inter-Model Diversity in the Cloud Albedo Effect. Geophys. Res. Lett. 2015, 42, 1568–1575. [Google Scholar] [CrossRef]
  89. Wilcox, L.J.; Highwood, E.J.; Dunstone, N.J. The Influence of Anthropogenic Aerosol on Multi-Decadal Variations of Historical Global Climate. Environ. Res. Lett. 2013, 8, 024033. [Google Scholar] [CrossRef]
  90. France, O.B.; France, C.G.; Germany, C.H.; Uk, A.J. Clouds and Aerosols. In Climate Change 2013–The Physical Science Basis; Cambridge University Press: Cambridge, UK, 2013; pp. 571–658. [Google Scholar] [CrossRef]
  91. Wu, F.; Fu, C. Assessment of GEWEX/SRB Version 3.0 Monthly Global Radiation Dataset over China. Meteorol. Atmos. Phys. 2011, 112, 155–166. [Google Scholar] [CrossRef]
  92. Tang, C.; Morel, B.; Wild, M.; Pohl, B.; Abiodun, B.; Bessafi, M. Numerical Simulation of Surface Solar Radiation over Southern Africa. Part 1: Evaluation of Regional and Global Climate Models. Clim. Dyn. 2019, 52, 457–477. [Google Scholar] [CrossRef]
  93. Solomon, S.; Plattner, G.K.; Knutti, R.; Friedlingstein, P. Irreversible Climate Change Due to Carbon Dioxide Emissions. Proc. Natl. Acad. Sci. USA 2009, 106, 1704–1709. [Google Scholar] [CrossRef] [PubMed]
  94. Palmer, T.N. A Personal Perspective on Modelling the Climate System. Proc. R. Soc. A Math. Phys. Eng. Sci. 2016, 472, 20150772. [Google Scholar] [CrossRef] [PubMed]
Figure 1. Methodological flow chart.
Energies 15 09532 g001
Figure 2. Rh, Tas, and Wspd at 10 m and Rs, in the present climate (1976–2005) of the RegCM4 driven by three ESMs (HadGEM2-ES, MPI-ES-MR, and NorESM-1 M) and its ensemble mean (Ensmean) between observation and simulations.
Energies 15 09532 g002
Figure 3. Taylor diagrams comparing the statistics (spatial correlation and normalized standard deviation) of Rs, Tas, Rh, and Wspd as simulated by RegCM4 and observation.
Energies 15 09532 g003
Figure 4. Climatological evolution of Rh, Wspd, Tas and Rs over Togo under RCP2.6 and 8.5 scenarios during 2024–2040 and 2041–2065.
Energies 15 09532 g004
Figure 5. Climatological variation of Rh, Wspd, Tas and Rs over Togo under RCP2.6 and 8.5 scenarios during 2024–2040 and 2041–2065.
Energies 15 09532 g005
Figure 6. Climatological mean variation of Rh, Wspd, Tas and Rs over Togo under RCP2.6 and 8.5 scenarios during 2024–2040 and 2041–2065.
Energies 15 09532 g006
Figure 7. Estimated annual and spatial PVct variations, Togo.
Energies 15 09532 g007
Figure 8. Monthly mean cells’ temperature under RCP2.5 and 8.5 and technology, Togo.
Energies 15 09532 g008
Figure 9. Projected annual and spatial changes in PVP in Togo under RCP2.6 and 8.5.
Energies 15 09532 g009
Figure 10. Monthly average reduction in PVP from 2024–2065 under RCP2.6 and 8.5 scenarios over Togo for a-Si technology.
Energies 15 09532 g010
Figure 11. Summary of climate change on solar energy (PVct and PVP) under RCP2.6 and 8.5 as a result of PV cell technology usage 2024–2065 (near and middle futures).
Energies 15 09532 g011
Table 1. Geographic coordinates of the Togolese Administrative Regions.
Admin. RegionsLatitudeLongitudeArea (km2)
Maritime6°00′6°50′0°25′2°00′6100 km2
Plateau6°98°5′0°30′1°38′16,800 km2
Central8°09°15′0°15′1°35′13,317 km2
Kara9°20′10°050°55′1°25 E11,738 km2
Savannah10°11°8533 km2
Table 3. PV technology and corresponding PVct model regression coefficients.
PV Cella (°C)a1 (°C/W/m2)a2a3 (°C/m/s)a4 (°C/Rh%)
Mono Si1.570.02890.961−1.4570.109
Poly Si3.90.0300.954−1.6290.088
a-Si2.50.0260.964−1.4060.082
Table 4. Variables biases—Simulations vs. Observation.
Admin. RegionsRs Bias (W/m2)Tas Bias (°C)Rh Bias (%)Wspd Bias (m/s)
Maritime−26.9180.13−5.310.877
Plateau−17.9050.1289−14.215−0.10197
Central−12.04610.2406−18.9988−0.1329
Kara−4.9920.009−23.69150.1126
Savannah2.76923060.926079−29.5150.1907783
Table 5. Highlights of impact of CC on PVct and PVP over Togo and its Administrative Regions.
Rise in pv Cell Temperature from 2024–2065Decrease in pv Potential from 2024–2065
DOMAINSMinMaxScenarios (RCP)DomainsMinMaxScenarios (RCP)
TOGO (°C)0.88 (poly-Si)0.3 (a-Si)2.6Togo (%)0.14 (poly-Si)0.3 (a-Si)2.6
REGIONS (°C)0.82 (poly-Si) over Maritime1.09 (a-Si) over Kara2.6Regions (%)0.095 (poly-Si) in Kara0.3 (a-Si) in Maritime2.6
TOGO (°C)0.97 (poly-Si)1.88 (a-Si)8.5Togo (%)0.22 (poly-Si)0.37 (a-Si)8.5
REGIONS (°C)0.89 (poly-Si) over Maritime2.01 (a-Si) over Savanes8.5Regions (%)0.18 (poly-Si) in Plateaux0.45 (a-Si) in Maritime8.5
Publisher’s Note: MDPI stays neutral with regard to jurisdictional claims in published maps and institutional affiliations.

