Article

Impact of Multi-Year Analysis on the Optimal Sizing and Control Strategy of Hybrid Energy Systems

by
Ameer Al-Khaykan
1,*,
Ibrahim H. Al-Kharsan
2,3,
Mohammed Omar Ali
4,
Ali Jawad Alrubaie
5,
Hassan Falah Fakhruldeen
3,6 and
J. M. Counsell
7
1
Intelligent Medical Systems Department, Al-Mustaqbal University College, Hillah 51001, Babil, Iraq
2
Computer Technical Engineering Department, College of Technical Engineering, The Islamic University, Najaf 54001, Iraq
3
Electrical Engineering Department, College of Engineering, University of Kufa, Kufa 54001, Iraq
4
Department of Electrical Power Techniques Engineering, Al-Hussain University College, Karbala 56001, Iraq
5
Medical Instrumentation Techniques Engineering Department, Al-Mustaqbal University College, Hillah 51001, Babil, Iraq
6
Computer Techniques Engineering Department, Faculty of Information Technology, Imam Ja’afar Al-Sadiq University, Baghdad 10011, Iraq
7
Head of Electronics and Electrical Engineering Department, University of Chester, Parkgate Rd., Chester CH1 4BJ, UK
*
Author to whom correspondence should be addressed.
Energies 2023, 16(1), 110; https://doi.org/10.3390/en16010110
Submission received: 5 November 2022 / Revised: 10 December 2022 / Accepted: 13 December 2022 / Published: 22 December 2022
(This article belongs to the Section A: Sustainable Energy)

Abstract

:
Grid-connected hybrid energy systems (HESs) represent a very promising option for addressing the problem of power outages worldwide. The selection of a suitable optimization approach and operational strategy are important aspects of the optimal design and operation of these HESs. This study aimed to find the optimal grid-connected PV/battery system sizes to supply electricity for a residential house in Karbala, Iraq, using two control strategies, load following (LF) and cycle charging (CC). The optimization was performed using HOMER software with and without the multi-year effects. The comparison analysis was carried out by considering the techno-economic and environmental performance of the feasible systems. The simulation results indicate that optimal configuration is achieved by using the CC strategy. Furthermore, the multi-year module affects the optimal results dramatically. Under the CC strategy, the multi-year effects increase the required PV size from 6 kW to 7 kW and the required number of batteries from 18 to 20, leading to an increase in the net present cost from $26,750 to $33,102 and a decrease in CO2 emissions from 7581 kg/year to 7379 kg/year. The results also show that the optimization results are highly affected by the variations of some critical parameters, such as solar radiation, average load, and battery degradation limits. The achievements indicate the higher effectiveness of the multi-year effects and control strategy on the optimal design of HESs.

1. Introduction

Ensuring access to sustainable and reliable energy is crucial to achieving social and economic development [1]. A large percentage of the global energy demand is covered by fossil fuels, which have a negative environmental impact. When fossil fuels are burned, toxic greenhouse gasses are released into the atmosphere, endangering people’s health and causing climate change [2]. Furthermore, over the past years, there has been increasing concern about running out of fossil fuels because they are non-renewable sources [3]. For these reasons, it is vital to cover the energy demand using renewable energy resources (RESs) such as wind, hydro, solar, geothermal, biomass, etc. RESs offer viable indigenous alternatives to conventional energy sources since they are secure, economically competitive, clean, and sustainable [4]. The use of RESs in producing electricity would help minimize energy imports and fossil fuel use, which are presently utilized in several applications, such as providing power for community and household buildings, pumping, irrigation, and other purposes [
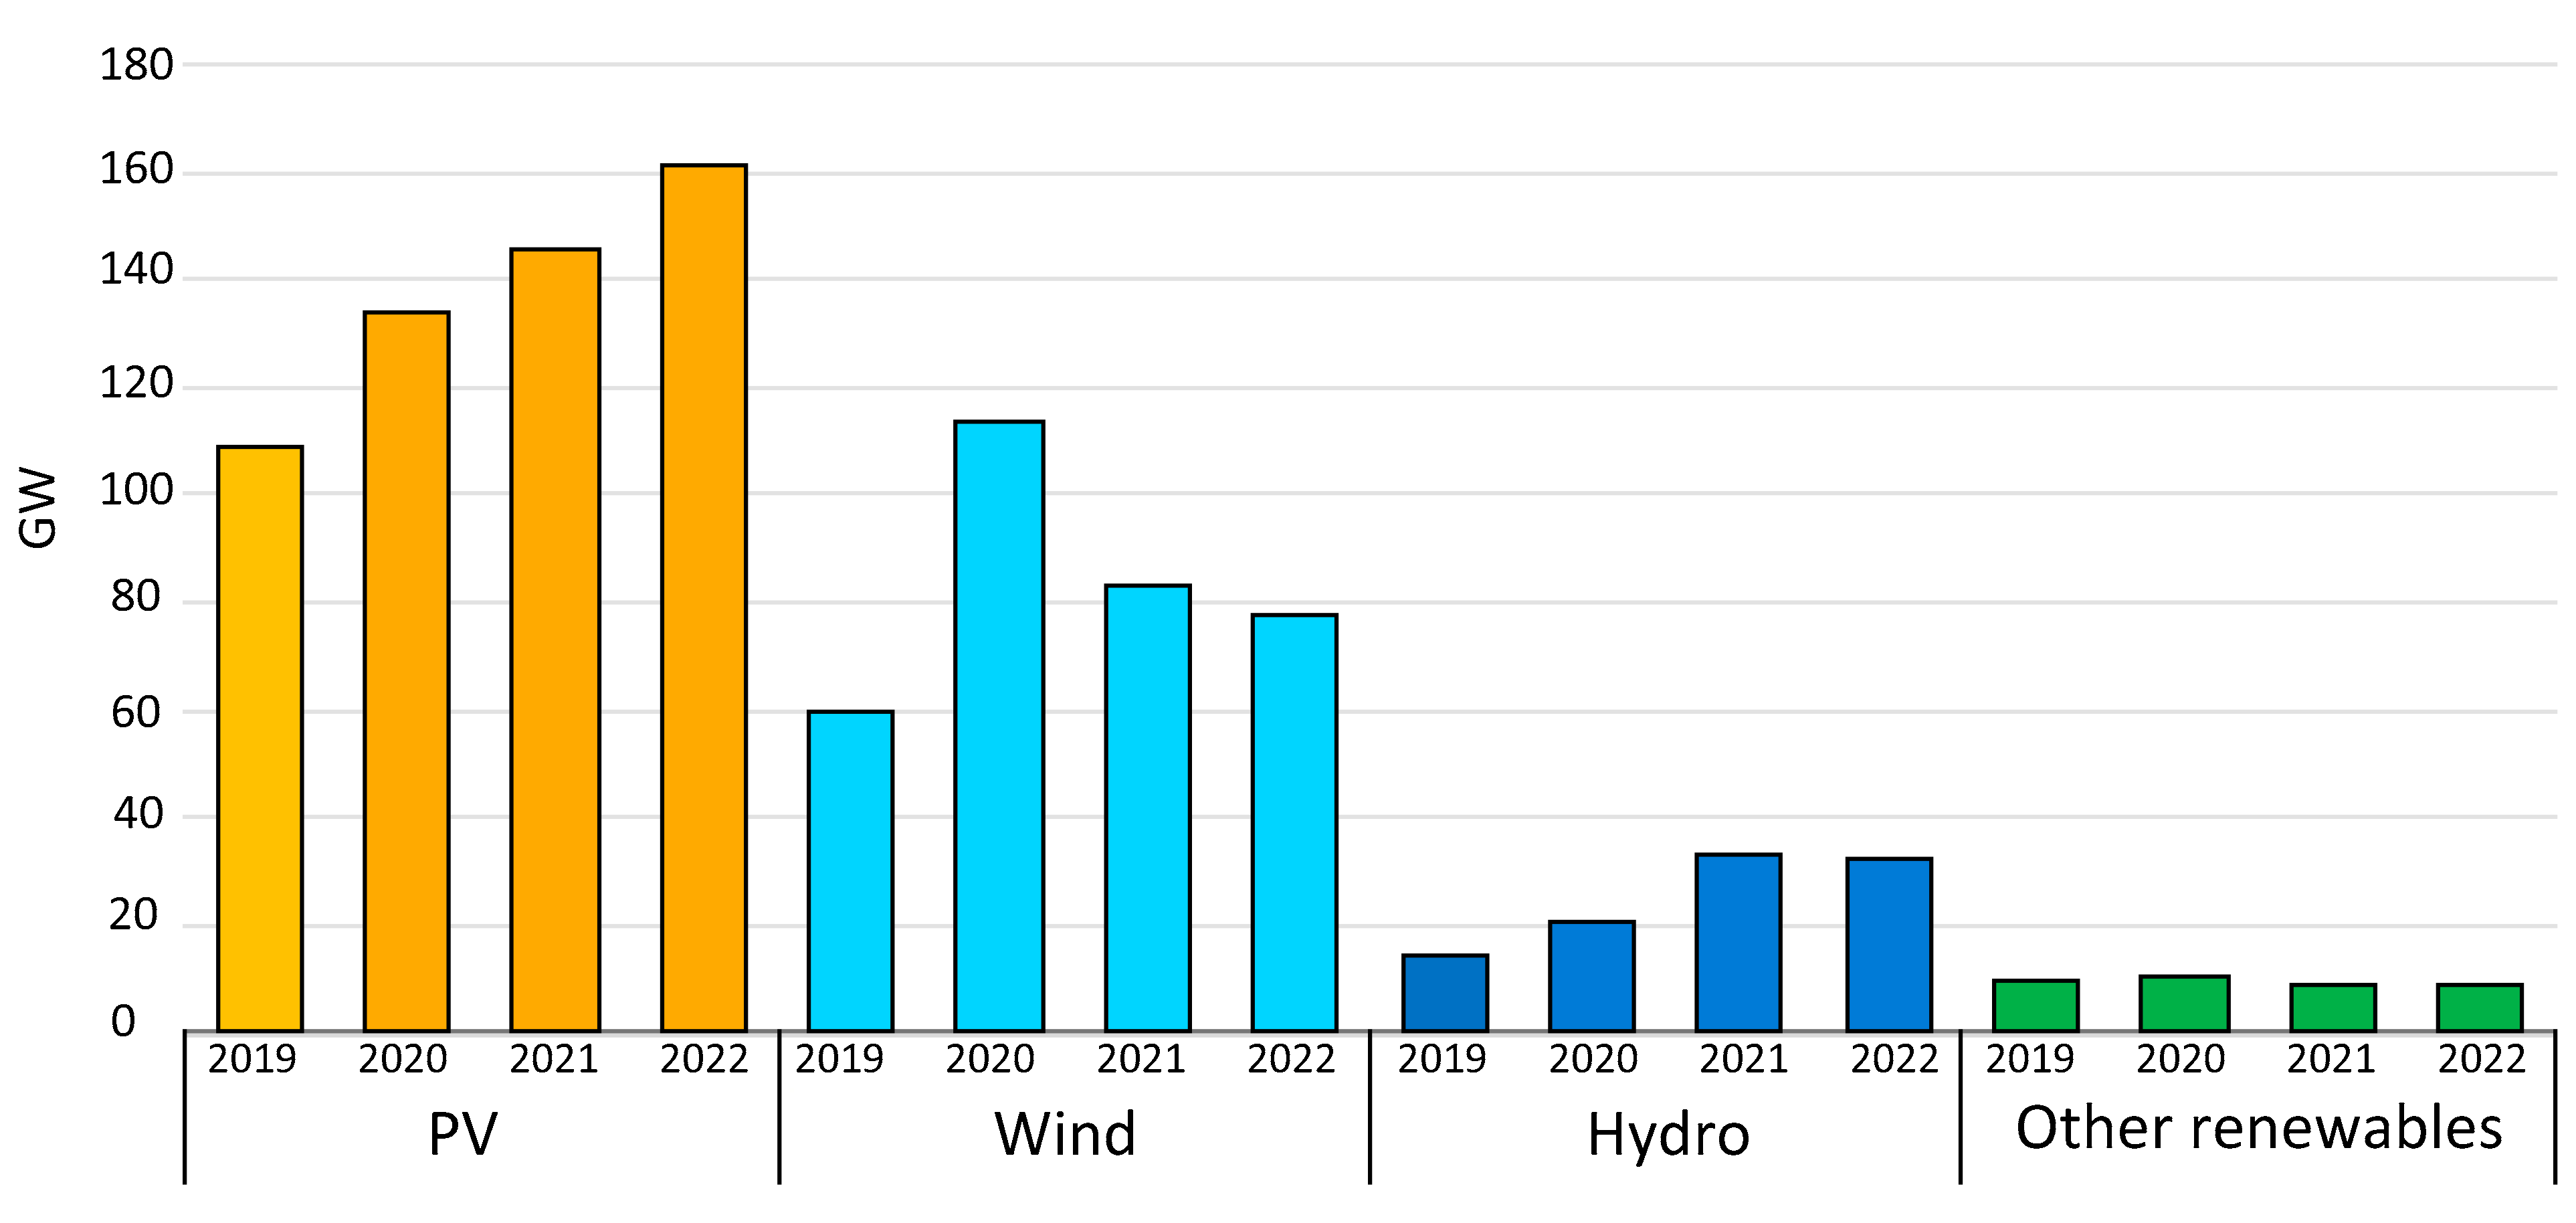
5]. The high rate of renewable energy capacity expansions was maintained in 2021, with an additional value of 270 GW. Moreover, this expansion is likely to continue in 2022, with an expected value addition of around 280 GW. Around 90% of the power capacity increase in 2021–2022 comes from RESs. This increment is about 50% higher than the capacity additions of 2017–2019. Net renewable capacity additions from 2019 to 2022 are depicted in Figure 1 [6].
Uncertainty and variability are known characteristics of RESs. Backup components, such as battery energy storage and diesel generators, are used with these sources to overcome these problems. HESs that consist of RESs and backup components are capable of improving system reliability and reducing reliance on national grids [7].
The optimal design of HESs is a vital challenge to achieve a cost-effective, reliable, and clean system. The components capacity of the HESs, such as wind turbines, PV, generators, and energy storage, must be optimally designed to meet all constraints and maximize/minimize the objective functions [8].
Optimizing HESs using different techniques has been discussed in several studies. In [9], different optimization algorithms were developed to find the optimal design of an off-grid PV/wind/biomass/battery HES to cover the electrical load of a rural area in Egypt. It was found that the HES consisting of wind turbines, biomass, and batteries using the Slime Mould algorithm was the optimal configuration in terms of cost of energy (COE), net present cost (NPC), and loss of power supply probability. The authors in [10] used HOMER software to investigate the optimal design of a grid-connected PV system for a household in South Africa. The results showed that the suggested combination is a feasible option from the technical, environmental, and economic point of view. The optimal design of a grid-connected HES comprising PV, wind turbine, and fuel cell used for a case study in Qingdao, China, was presented in [11]. A modified seagull optimization technique was used to minimize the power generation cost. The results concluded that utilization of the proposed HES is an attractive option despite the intermittency in RESs. García-Vera et al. [12] conducted a techno-economic feasibility study using different stand-alone HESs consisting of PV, wind turbines, hydraulic turbines, diesel generators, and batteries to supply electricity for different locations in Colombia using iHOGA software. The study demonstrated that access to energy problems could be solved using the proposed isolated HESs.
The authors in [13] performed an optimization study to find the optimal sizes of a grid-connected PV/fuel cell hybrid generation system for the electrification of a small shopping complex at an Indian university campus. Artificial bee colony, particle swarm optimization, and a combination of both were used to find the optimal design based on the least NPC. It was found that using PV and hydrogen could reduce reliance on the overburdened national grid. In [14], a techno-economic and environmental assessment was performed using RETScreen software to find the best capacity size of a grid-connected PV system for a case study in Nigeria. The optimization analysis showed that the suggested system was an attractive choice for all selected sites. In [
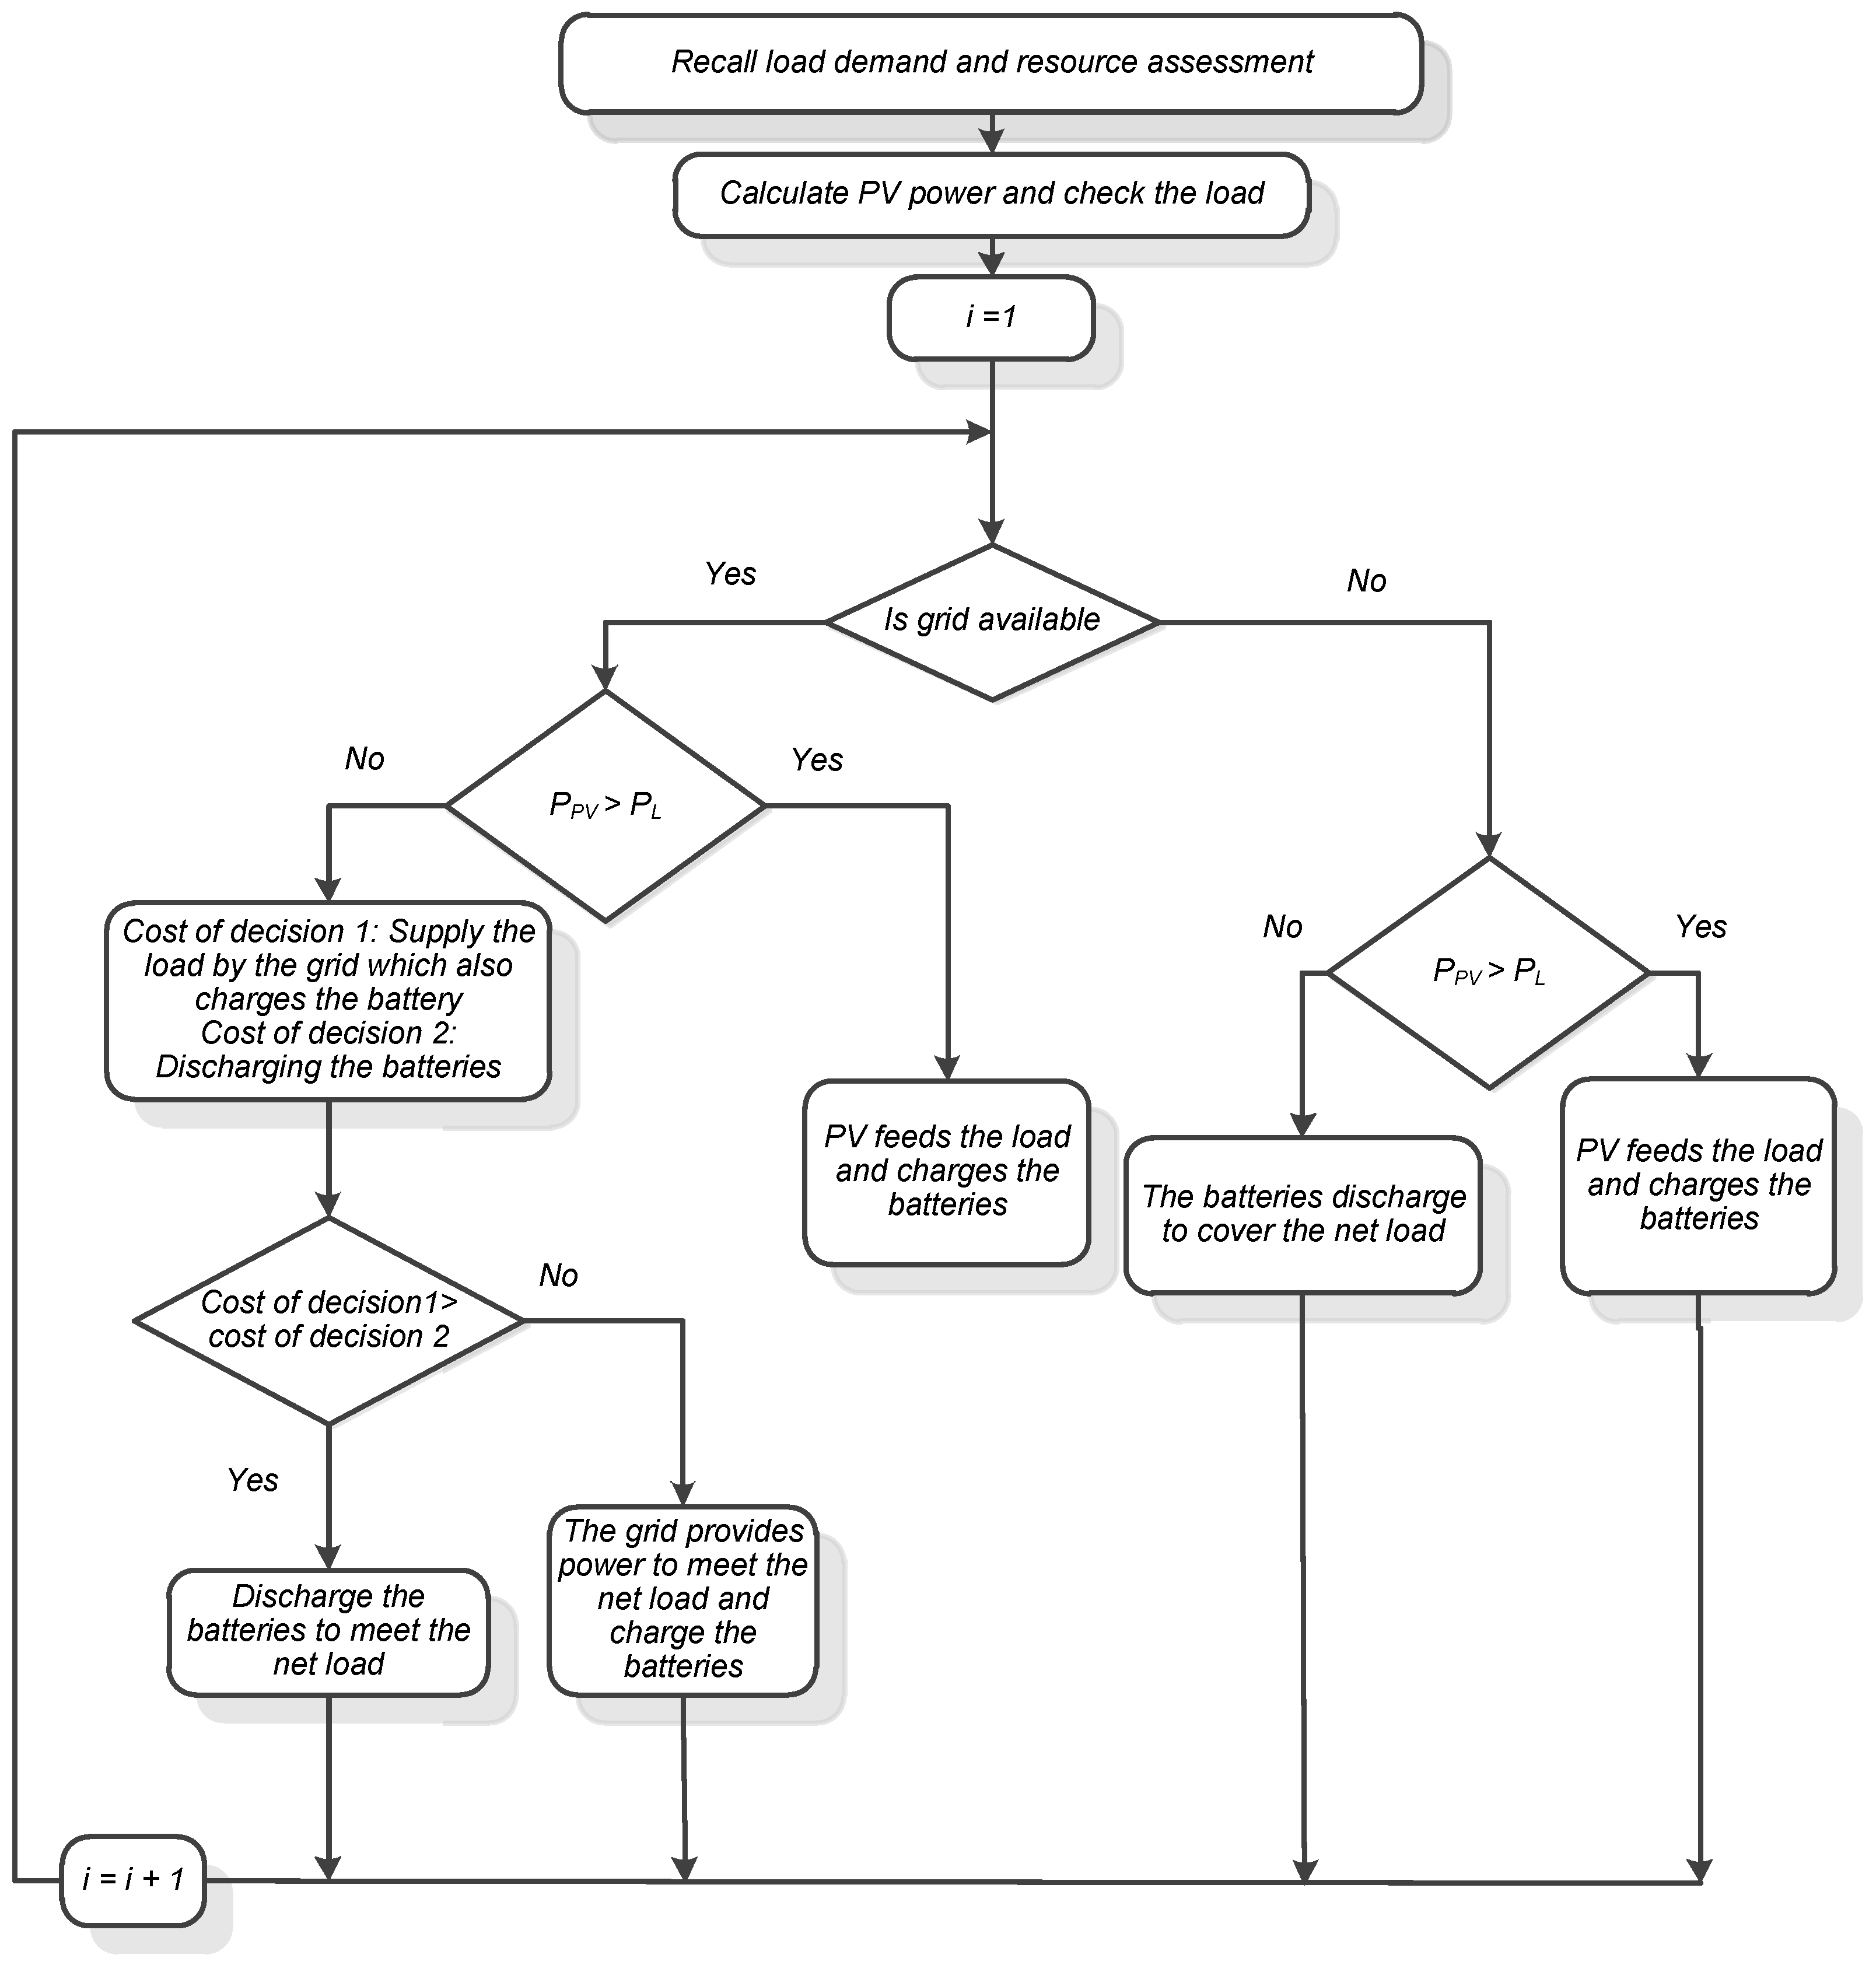
15], two different control strategies, load following (LF) and cycle charging (CC), were used to control the operation of an HES proposed to cover the load of a certain area in Turkey. The optimization was performed using HOMER software. CC strategy achieved better economic performance than the LF strategy. An optimization study to find the best control strategy based on power prediction of PV/wind HES was carried out [16]. Predicting the power of the proposed system was achieved using the WPNN model. The results indicated that the suggested technique was efficient in forecasting the power. Fares et al. [17] applied different metaheuristics optimization techniques to explore the optimal configuration of an off-grid wind/PV/battery to cover an electrical load in Algeria. The authors found that simulated annealing and flower optimization algorithms presented higher accuracy and robustness than the other techniques.
According to the literature mentioned above, the optimal planning and design of the proposed systems were performed by considering different objectives for a certain project lifetime. However, the simulation was conducted for only one year, and the results were extended over the rest of the project’s lifetime. Therefore, changes that occur over the project’s lifetime, such as PV and battery degradation, were not considered in these studies.
The present work fills the existing research gap by investigating the optimal configuration of a PV battery system in a grid-connected residential home in Karbala, Iraq. HOMER software was utilized as a simulation and optimization tool by considering the techno-economic performance of the HES using two different control strategies, LF and CC. The simulation was carried out using a multi-year module by running a simulation for every year of the project’s lifetime. Hence, some important phenomena that cannot be captured in a single-year simulation, such as PV and battery degradation, were considered in this study. As per the author’s knowledge, exploring the multi-year effects on the optimal sizing and control strategy of HES represents an original contribution.

2. Methodology

This section provides the method to find the optimal design of the proposed hybrid generation system.

2.1. Location and Electric Load Data

The present work was conducted in Karbala, Iraq, where a residential home was selected as a case study. Karbala, like other cities in Iraq, suffers from widespread power cuts and has only a few hours of electricity daily. The estimated hours of operation, quantity, and component type were used to construct the electrical load of the selected house. The daily load profile in the summer season is depicted in Figure 2. However, the daily load profile changes based on weather conditions. Figure 3 shows the monthly load profile. The daily energy load is approximately 46.89 kWh, with a peak demand of 2.77 kW.

2.2. Meteorological Data

Solar farm location is a top priority for planners because it is crucial to the success of energy projects. Iraq is rich in solar energy, putting it at the forefront of countries capable of using solar energy to produce electricity. The direct normal radiation ranges between 1800 and 2390 kWh/m2/year [18]. HOMER used the monthly average temperature and global horizontal radiation as input parameters. The average ambient temperature varies between 9.28 °C in January to 36.97 °C, with an annual average temperature of 23.81 °C (Figure 4). The monthly average solar radiation and clearness index is depicted in Figure 5. The yearly average solar radiation at the site is 5.16 kWh/m2/day, and it varies from 2.64 kWh/m2/day in December to 7.94 kWh/m2/day in June. Data on the ambient temperature and solar radiation are taken from NASA [19].

2.3. Configuration of the HES

The main components of the HES are the national grid, PV, battery, and converter (Figure 6). The proposed HES’s power sources are PV and the national grid. The converter is used to convert between alternating current and direct current. The excess electrical energy is stored in the battery, which discharges it when needed. Table 1 provides the technical specifications of each component, while the economic data are given in Table 2. The technical and economic specifications are taken from different references [20,21,22].
The grid power price in Iraq is estimated based on monthly electricity consumption, as shown in Table 3 [23]. The national grid scheduled rates for each month are shown in Figure 7. There are two rates, $0.0069/kWh for low demand and $0.024/kWh for high demand.
As mentioned earlier, there is a daily electricity shortage in Iraq. In this study, the number and mean duration of power outages are set to set to 1750/year and 2 h, respectively, with a 10% repair time variance [24].

2.4. Multi-Year Module

Using the multi-year module, it is possible to model some phenomena during the project lifetime, such as PV and battery degradation. In this study, the PV degradation is set to 0.5%/year, meaning that the PV output power will decrease at a rate of 0.5% each year [25]. On the other hand, the modified kinetic battery model is chosen, which experiences cycling and calendar degradation. The battery should be replaced when the battery capacity decreases by the degradation limit of 25%.

2.5. Mathematical Model of the System

The mathematical modeling of the components and economics of the system is presented in this section.

2.5.1. PV Panels

PV is a non-mechanical device that generates electricity directly from sunlight. The power generated by a PV array can be expressed as [26]:
PV o u t = F D P R I S I S , S T C   1 + ( T C T S T C ) δ T
where FD: PV derate factor [%]. PC: PV-rated capacity [kW]. IS: Incident radiation on the PV array [kW/m2]. IS,STC: Standard radiation [1 kW/m2]. TC: PV cell temperature [°C]. TSTC: PV cell temperature under standard test conditions [25 °C]. δT: Temperature coefficient [%/°C].

2.5.2. Battery

Batteries store chemical energy and convert it into electricity when required. They are the most widely used energy storage in HESs. The storage discharge efficiency can be calculated using the following expression [27]:
η b a t t , d i s c h = η b a t t , r t
where ηbatt,rt: Battery round-trip efficiency [%].

2.5.3. Estimation of NPC

In HOMER software, the configuration that has the lowest NPC is considered the optimal HES. The total NPC of the system is calculated using [28]:
NPC = C A C R F ( d , T p r o j e c t )
where CA: Annualized cost [$/year]. CRF: Capital recovery factor. d: Real discount rate [%]. Tproject: Project lifetime [year].

2.6. Control Algorithm

Optimizing hybrid generation systems requires a suitable control strategy to control the electricity production, storage, and energy flow among components. In HOMER software, users select their control strategy, which affects the outcome of the optimization results dramatically. In the present work, LF and CC control strategies were implemented for optimization. Both approaches decided on the most cost-effective manner of feeding the load at each step. Predicting the most effective option prior to running the model is challenging. In the LF strategy, the national grid is responsible for covering the required load only, without charging the battery, which can be charged only by surplus PV power. Figure 8 shows the control algorithm of the LF strategy, while by using CC as a control strategy, the national grid can cover the required load besides charging the battery for later use. The control algorithm of the CC strategy is depicted in Figure 9.

3. Results and Discussion

Results of using different control strategies to find the optimal HES design for the residential house are presented in this section. The comparison analysis considers technical, economic, and environmental performance. The simulation was carried out with and without the multi-year effects of PV and battery degradations throughout the project’s lifetime. First, the optimal design of the proposed HES based on the economic performance was investigated for different control strategies, and then the technical and environmental characteristics were discussed in detail. A sensitivity analysis is also provided in this section to explore the effects of critical parameters on the optimization results. The values of critical parameters required to run the simulation are provided in Table 4.

3.1. Optimal Design

This study examined the optimal design of the grid-connected PV system to electrify a residential house based on the lowest NPC. HOMER software was used to simulate and optimize all possible combinations. An hourly time series simulation was performed for each feasible HES to examine the technical and economic feasibility to obtain the best feasible economic scenario. The optimization results for the HES using different control strategies are depicted in Table 5. It is evident from the results that the optimal HES is achieved by using the CC strategy. When considering the effects of the multi-year parameters, the optimal design using the CC strategy consists of 7 kW PV, 20 batteries, 4 kW converter with average power grid purchases of 11,675 kWh/year. In this scenario, NPC is calculated as $33,102, which is 23.7% more expensive than the system using the CC strategy without considering the multi-year parameters that comprise 6 kW PV, 18 batteries, and a 4 kW converter with average power grid purchases of 11,995 kWh/year. On the other hand, the LF strategy is much more expensive than the CC strategy. The system using the LF strategy with the effect of multi-year parameters consists of 23 kW PV, 36 batteries, 4 kW converter, and average power grid purchases of 6215 kWh/year. The NPC of this option is estimated at 
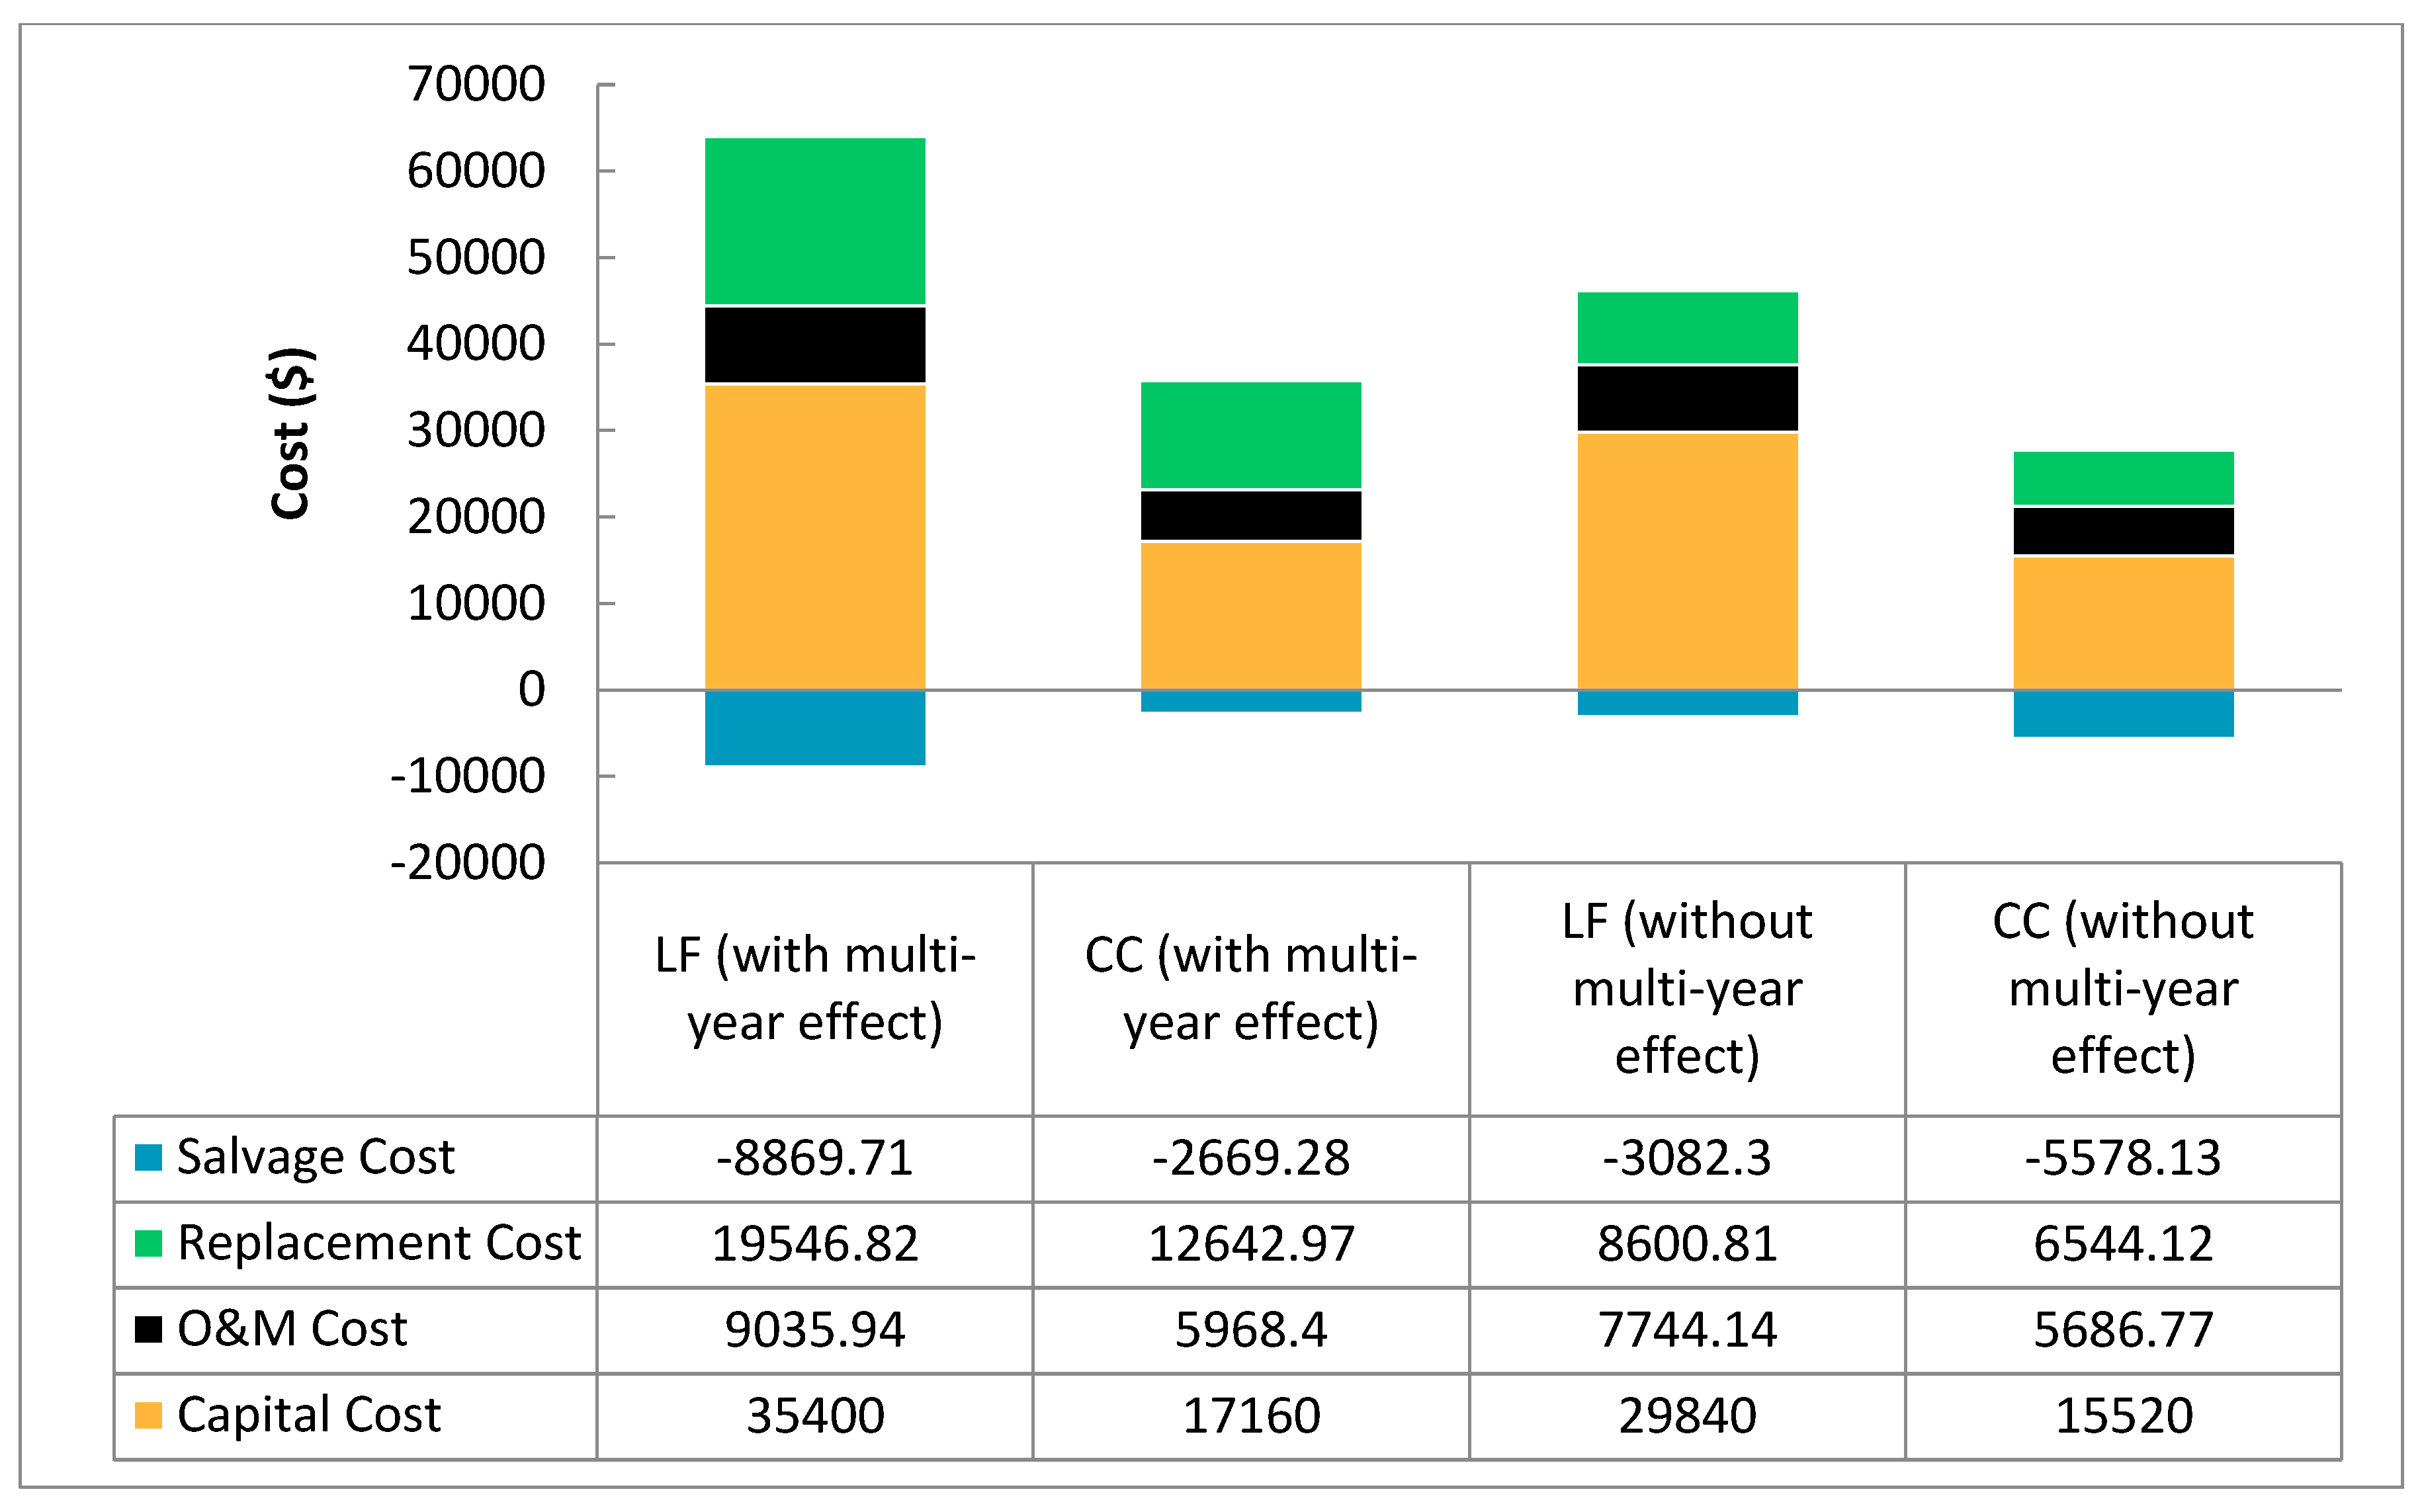
$55,113, which is 35.7% higher than the NPC of the system using LF strategy without considering the multi-year parameters that consist of 19 kW PV, 30 batteries, 4 kW converter with power grid purchases of 6299 kWh/year. This finding is mainly due to the fact that by considering the effects of multi-year parameters, such as PV and battery degradation, higher PV and battery capacity are required to compensate for the loss of power resulting from the degradation. Moreover, the study assumed that the battery must be replaced when the degradation exceeds 30% of the battery capacity, which leads to an increase in the replacement cost. All these factors result in increasing the NPC. The cost summary of the suggested hybrid generation configuration using LF and CC strategies with and without the effect of multi-year parameters is provided in Figure 10.

3.2. Technical and Environmental Evaluations

Table 6 shows the technical specifications of the optimal scenarios. Note that with the multi-year effects, the value of each parameter represents the average amount for 20 years. It is clear from the results that the PV production in the LF strategy is higher than that of the CC strategy. This is mainly because the national grid in the LF strategy is not capable of charging the battery, which can be charged only by the excess power of the PV. Therefore, a large PV capacity is required, which results in high PV production and hence a high renewable fraction. On the other hand, the national grid in the CC strategy can feed the load and charge the battery. This leads to an increase in grid purchases, reduces the PV capacity, and reduces the renewable fraction. For the LF strategy with the effect of a multi-year module, the renewable fraction is evaluated at 69.6%, while this value is reduced to 68.7% by neglecting the multi-year effects. On the other hand, the renewable fraction for the system with and without the multi-year module for CC strategy is calculated as 37.6% and 34.7%, respectively. These findings are based on the argument that by considering the multi-year effects, such as PV and battery degradation, higher renewable components capacity is required to cover load demand.
The electrical load which cannot be covered by the HES is referred to as unmet load. It occurs when the output power of the HES is lower than the required load demand. Minimizing the unmet load enhances system reliability. The results show that optimal designs with multi-year effects have a lower unmet load than those without. The unmet load for LF and CC with multi-year effects is calculated as 114 and 121 kWh/year. For the system without multi-year effects, these values are estimated at 155 and 129 kWh/year.
Battery autonomy is an important technical indicator in the HES. It refers to the period in which the battery alone can satisfy the load in the event of power shortages. The analysis demonstrates that the LF strategy outperforms the CC strategy regarding autonomy. The LF strategy for the system with and without multi-year effects has battery autonomies of 13.2 and 11.8 h, respectively, while for the CC strategy, these values are evaluated at 7.23 and 7.06.
Another important parameter is the battery life. High battery life leads to a more cost-effective system since it reduces the replacement cost of the battery. It is obvious from the results that the battery life, when considering the multi-year effects, is shorter and lower than the battery life without multi-year effects. This is because when considering the multi-year effects, the battery degradation reduces the battery lifetime. With multi-year effects, the battery life for the LF and CC strategies is calculated as 9.92 and 7.75 years, respectively. In the case of neglecting the multi-year effects, these values become 15 and 10.2 years. It is clear that the LF strategy has higher battery life than the CC strategy. This is mainly because the battery in the LF strategy is not charged by the national grid, which results in reducing the charging/discharging cycles per year and hence increasing the battery life. On the other hand, the battery in the CC strategy can be charged by both PV and national grid, and this increases the charging/discharging cycles per year and hence decreases the battery life.
Greenhouse gases are the major driver of global warming. It is expected that there will be a 3.2–5.4 °C increase in the global temperature by the end of the century based on the current greenhouse gas emissions. The combustion of fossil fuels releases CO2, which makes up most of greenhouse gas emissions [29,30]. In this study, the national grid is the only source of emissions. The environmental analysis shows that the LF strategy is more environmentally friendly than the CC strategy. This is mainly due to the high grid purchases in the CC strategy compared to the LF strategy. The CO2 emissions for LF and CC with multi-year effects are calculated as 3928 and 7379 kg/year, respectively [31]. On the other hand, for a system without multi-year effects, these values are estimated as 3981 and 7581 kg/year.

3.3. Year–Year Analysis

The multi-year model takes into account the changes that occur throughout a project. The simulation is carried out every year during the project’s life. When neglecting the multi-year effects, a one-year simulation is carried out, and the results are extrapolated over the remainder of the project’s lifespan.
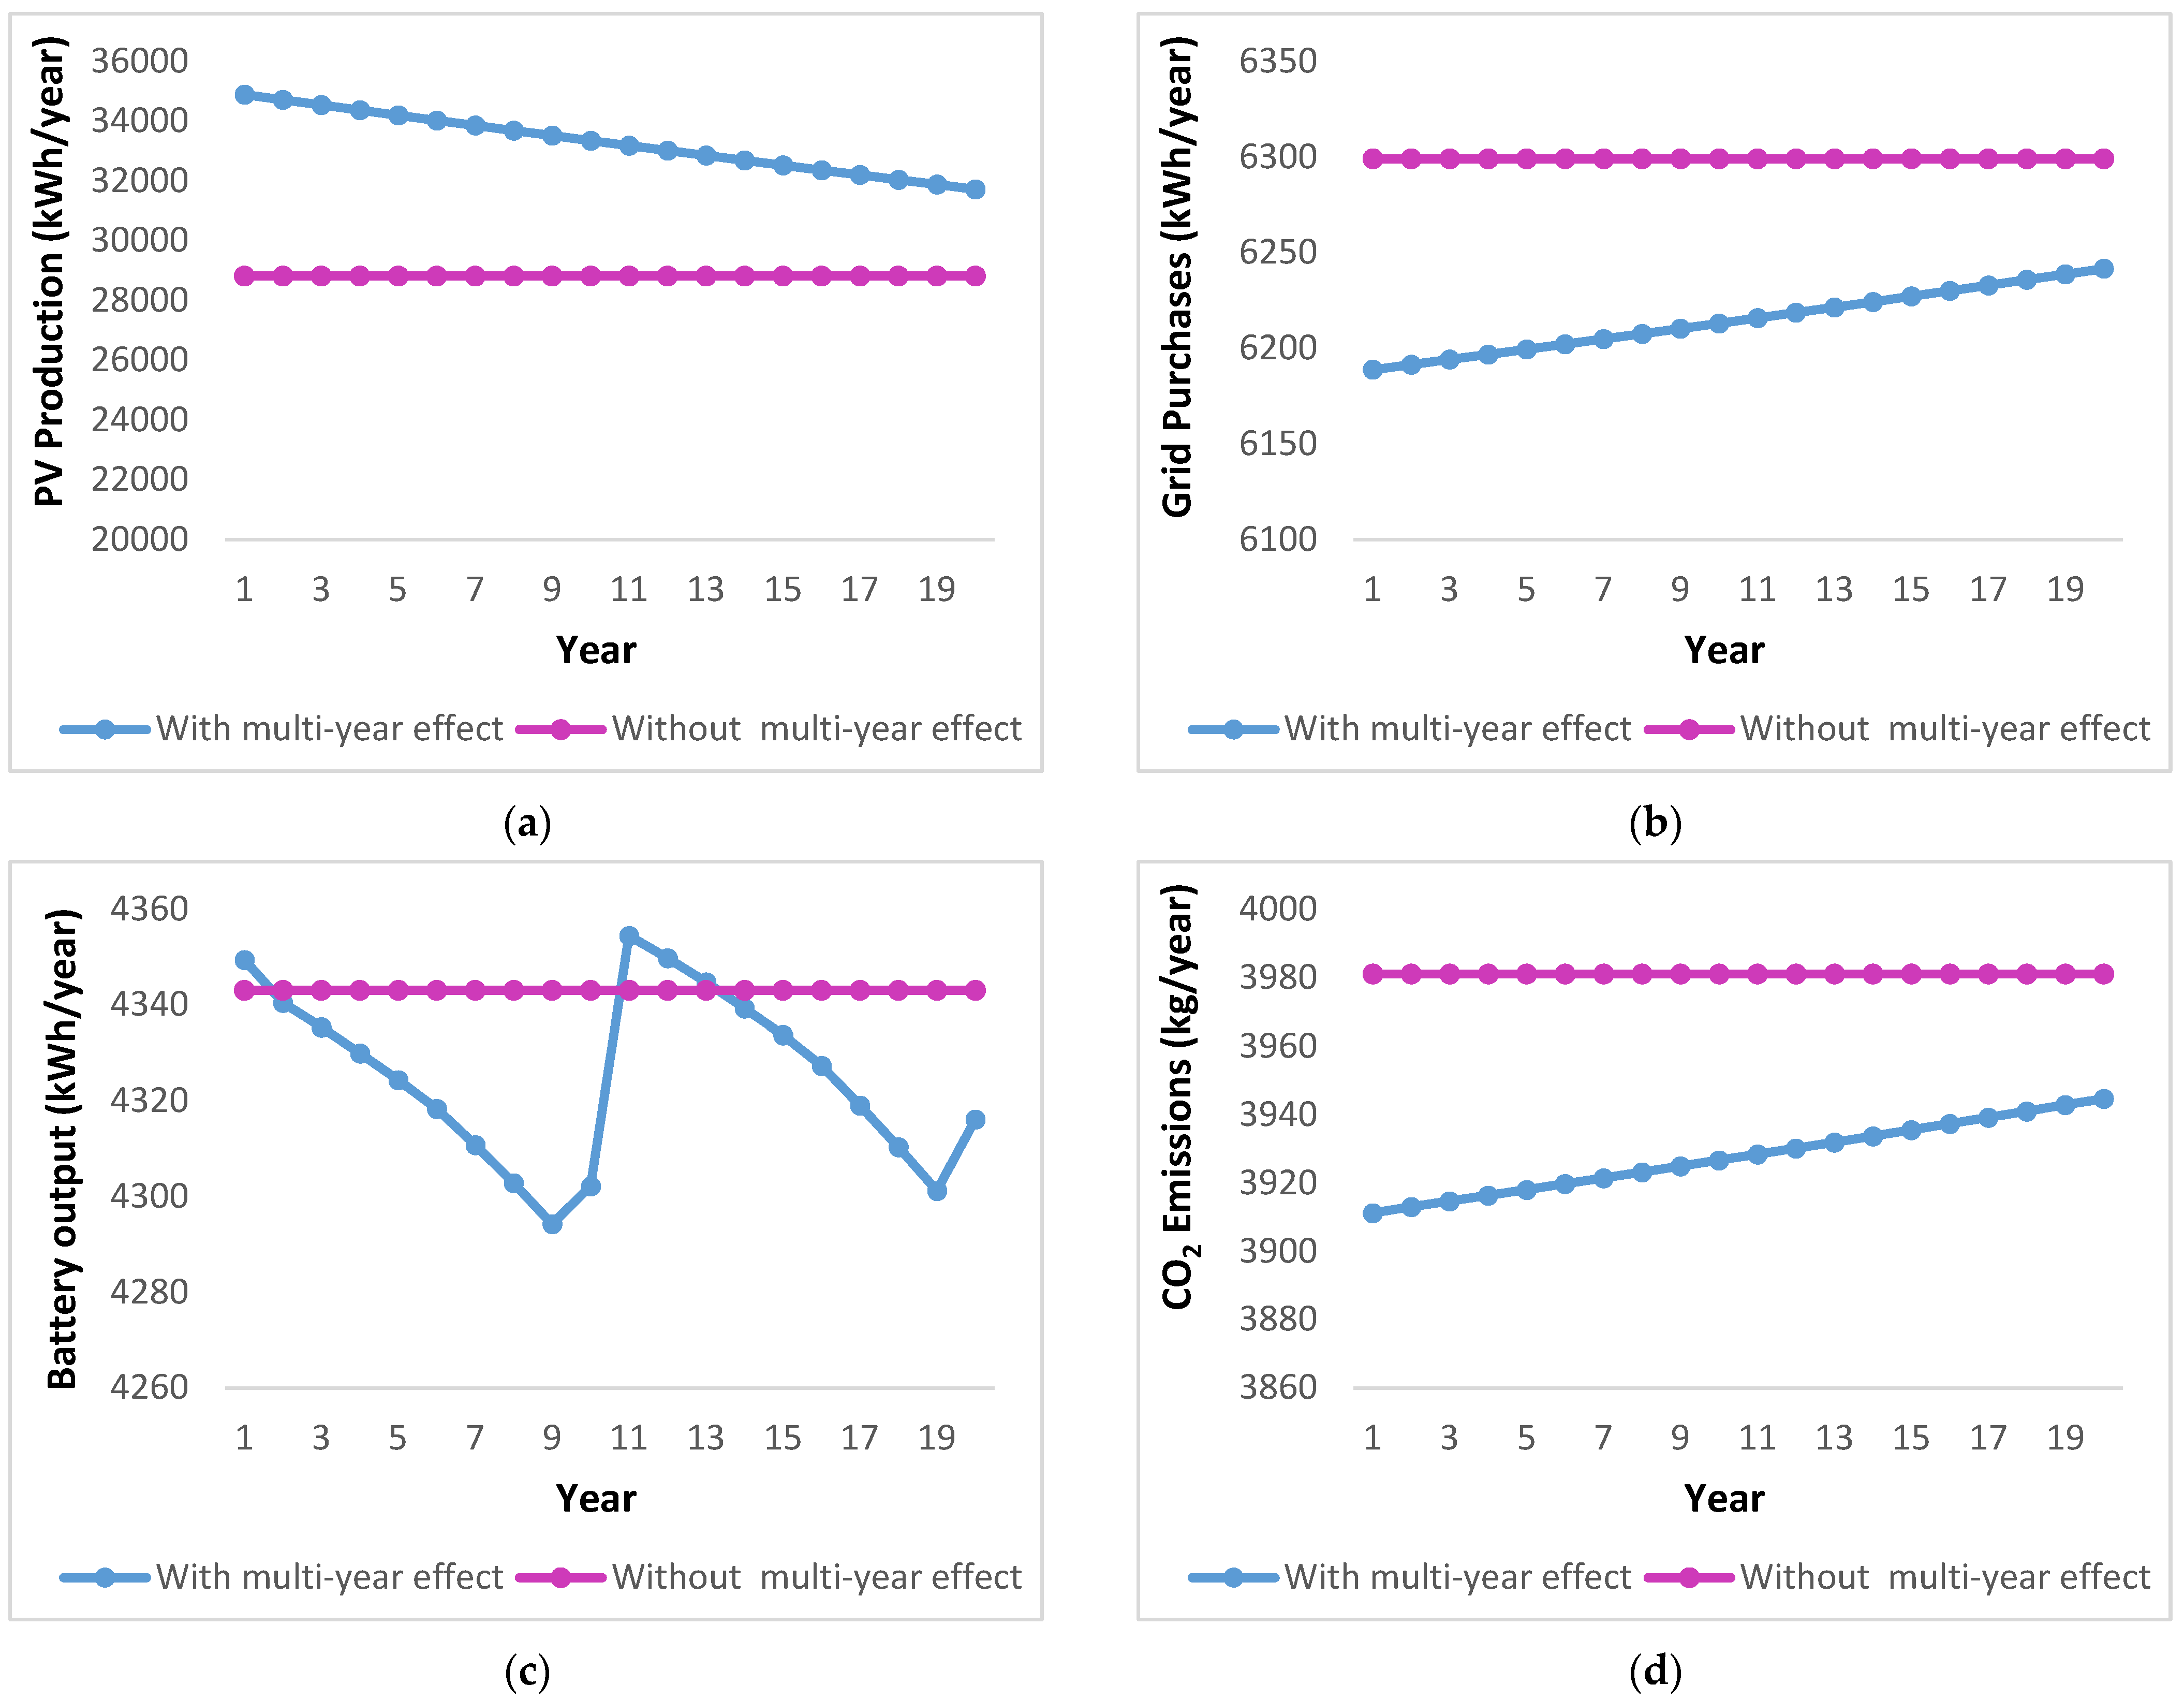
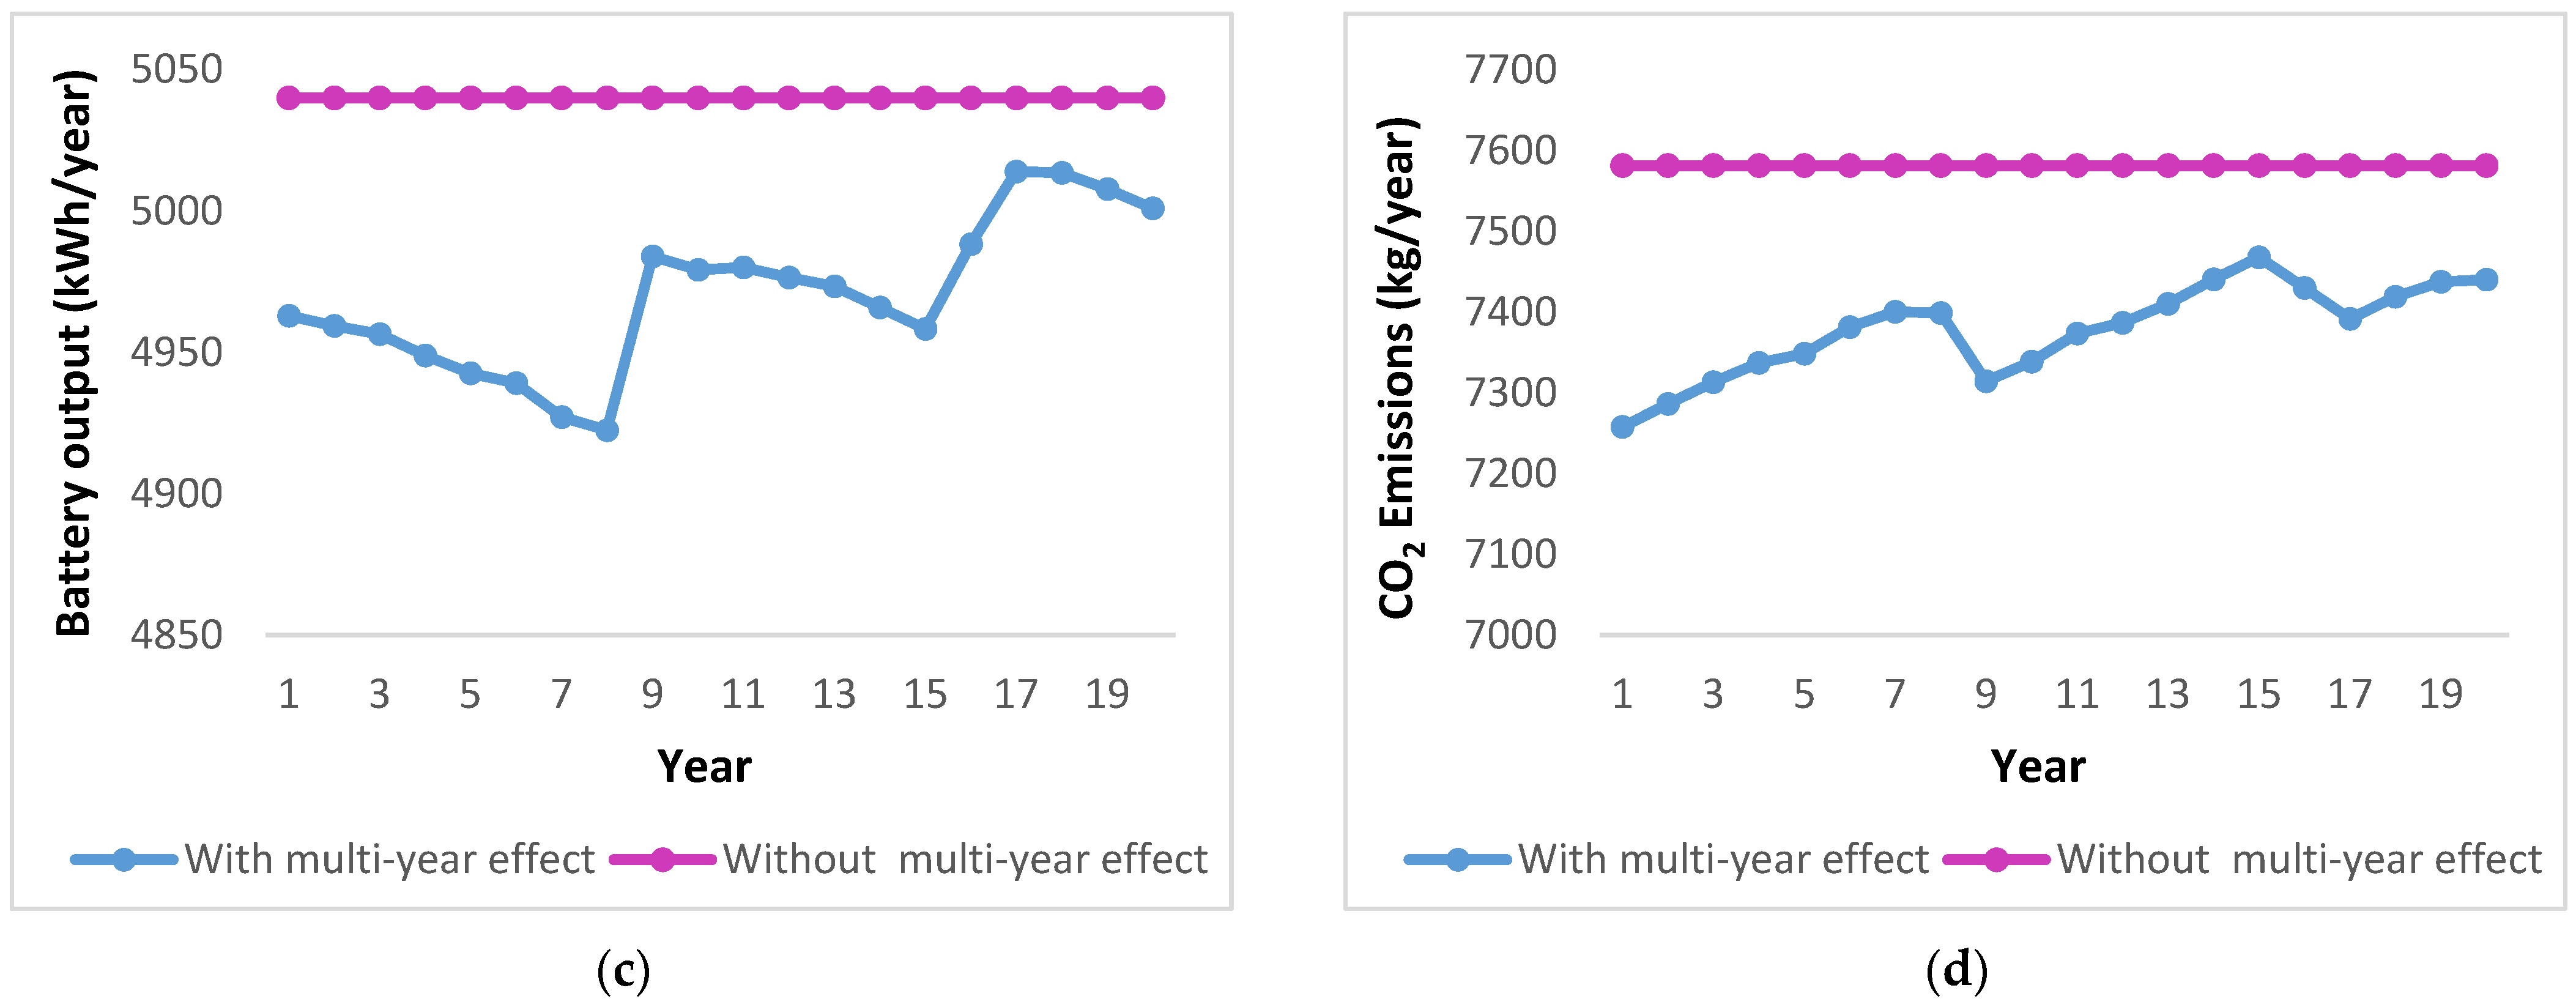
 Figure 11 and Figure 12 show the year–year analysis using the LF and CC strategies, respectively. The results indicate that by neglecting the multi-year effects, the values of PV production, grid purchases, battery output energy, and CO2 do not show any variation for the project’s lifetime. On the other hand, when considering the multi-year effects, PV production decreases over the years, mainly due to the effects of degradation. This leads to increasing the grid purchases and hence increasing the CO2 emissions. For the LF strategy, the PV production decreases from 34,882.46 to 31,713.61 kWh/year after 20 years, leading to an increase in grid purchases from 6188.8 to 6241.54 kWh/year and CO
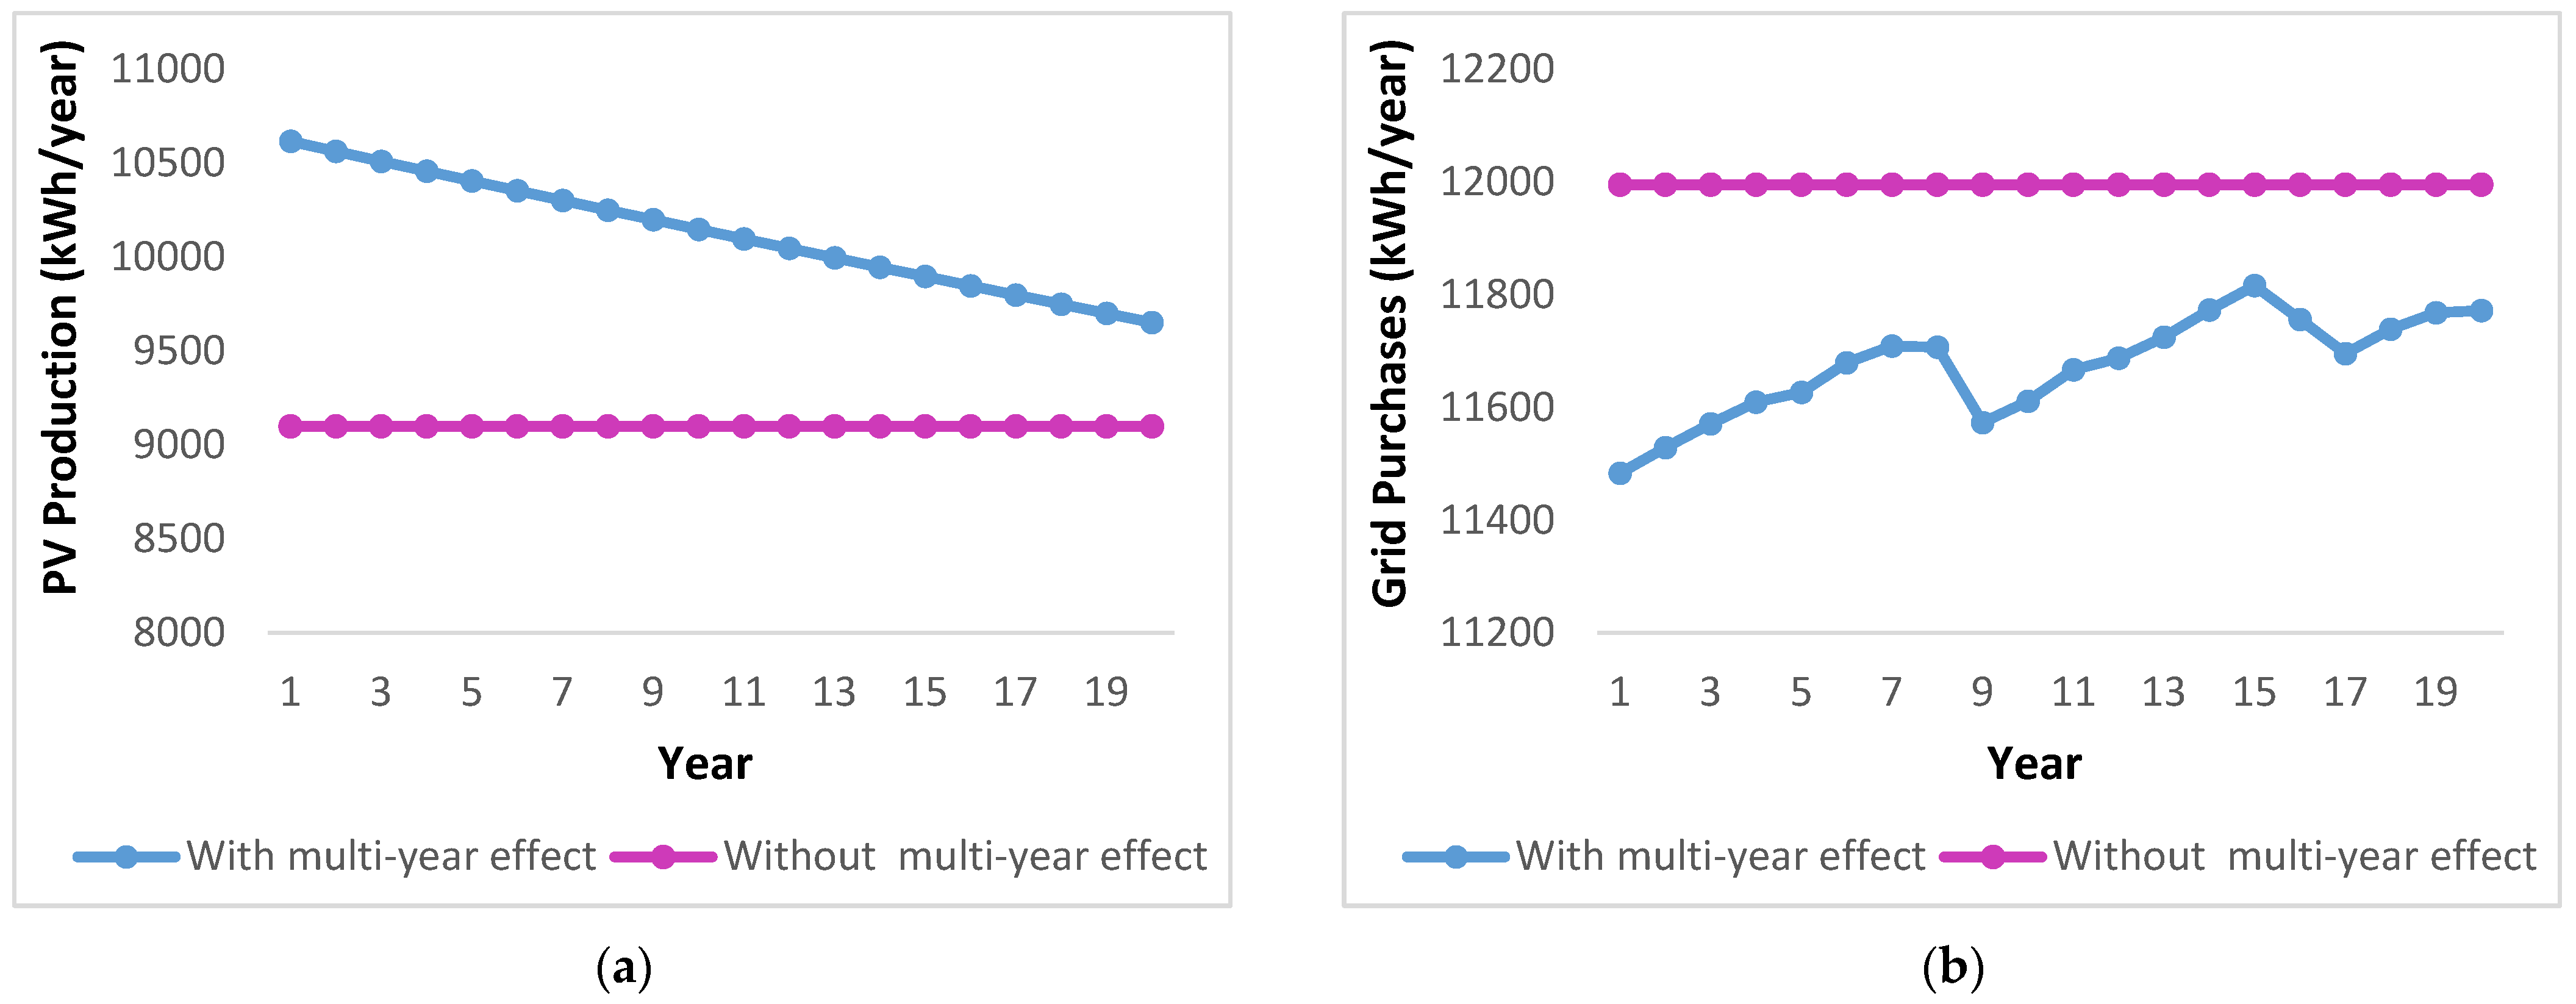
2 emissions from 3911.2 to 3944.65 kg/year. In the case of the CC strategy, the PV production decreases from 10,616.4 to 9651.97 kWh/year, leading to increased grid purchases from 11,483.6 to 11,771.9 kWh/year and CO2 emissions from 7286.29 to 7439.84 kg/year with some fluctuations among years. Moreover, the results show that the battery output energy decreases for certain years due to the battery degradation and then suddenly increases again, which relates to the battery replacement.

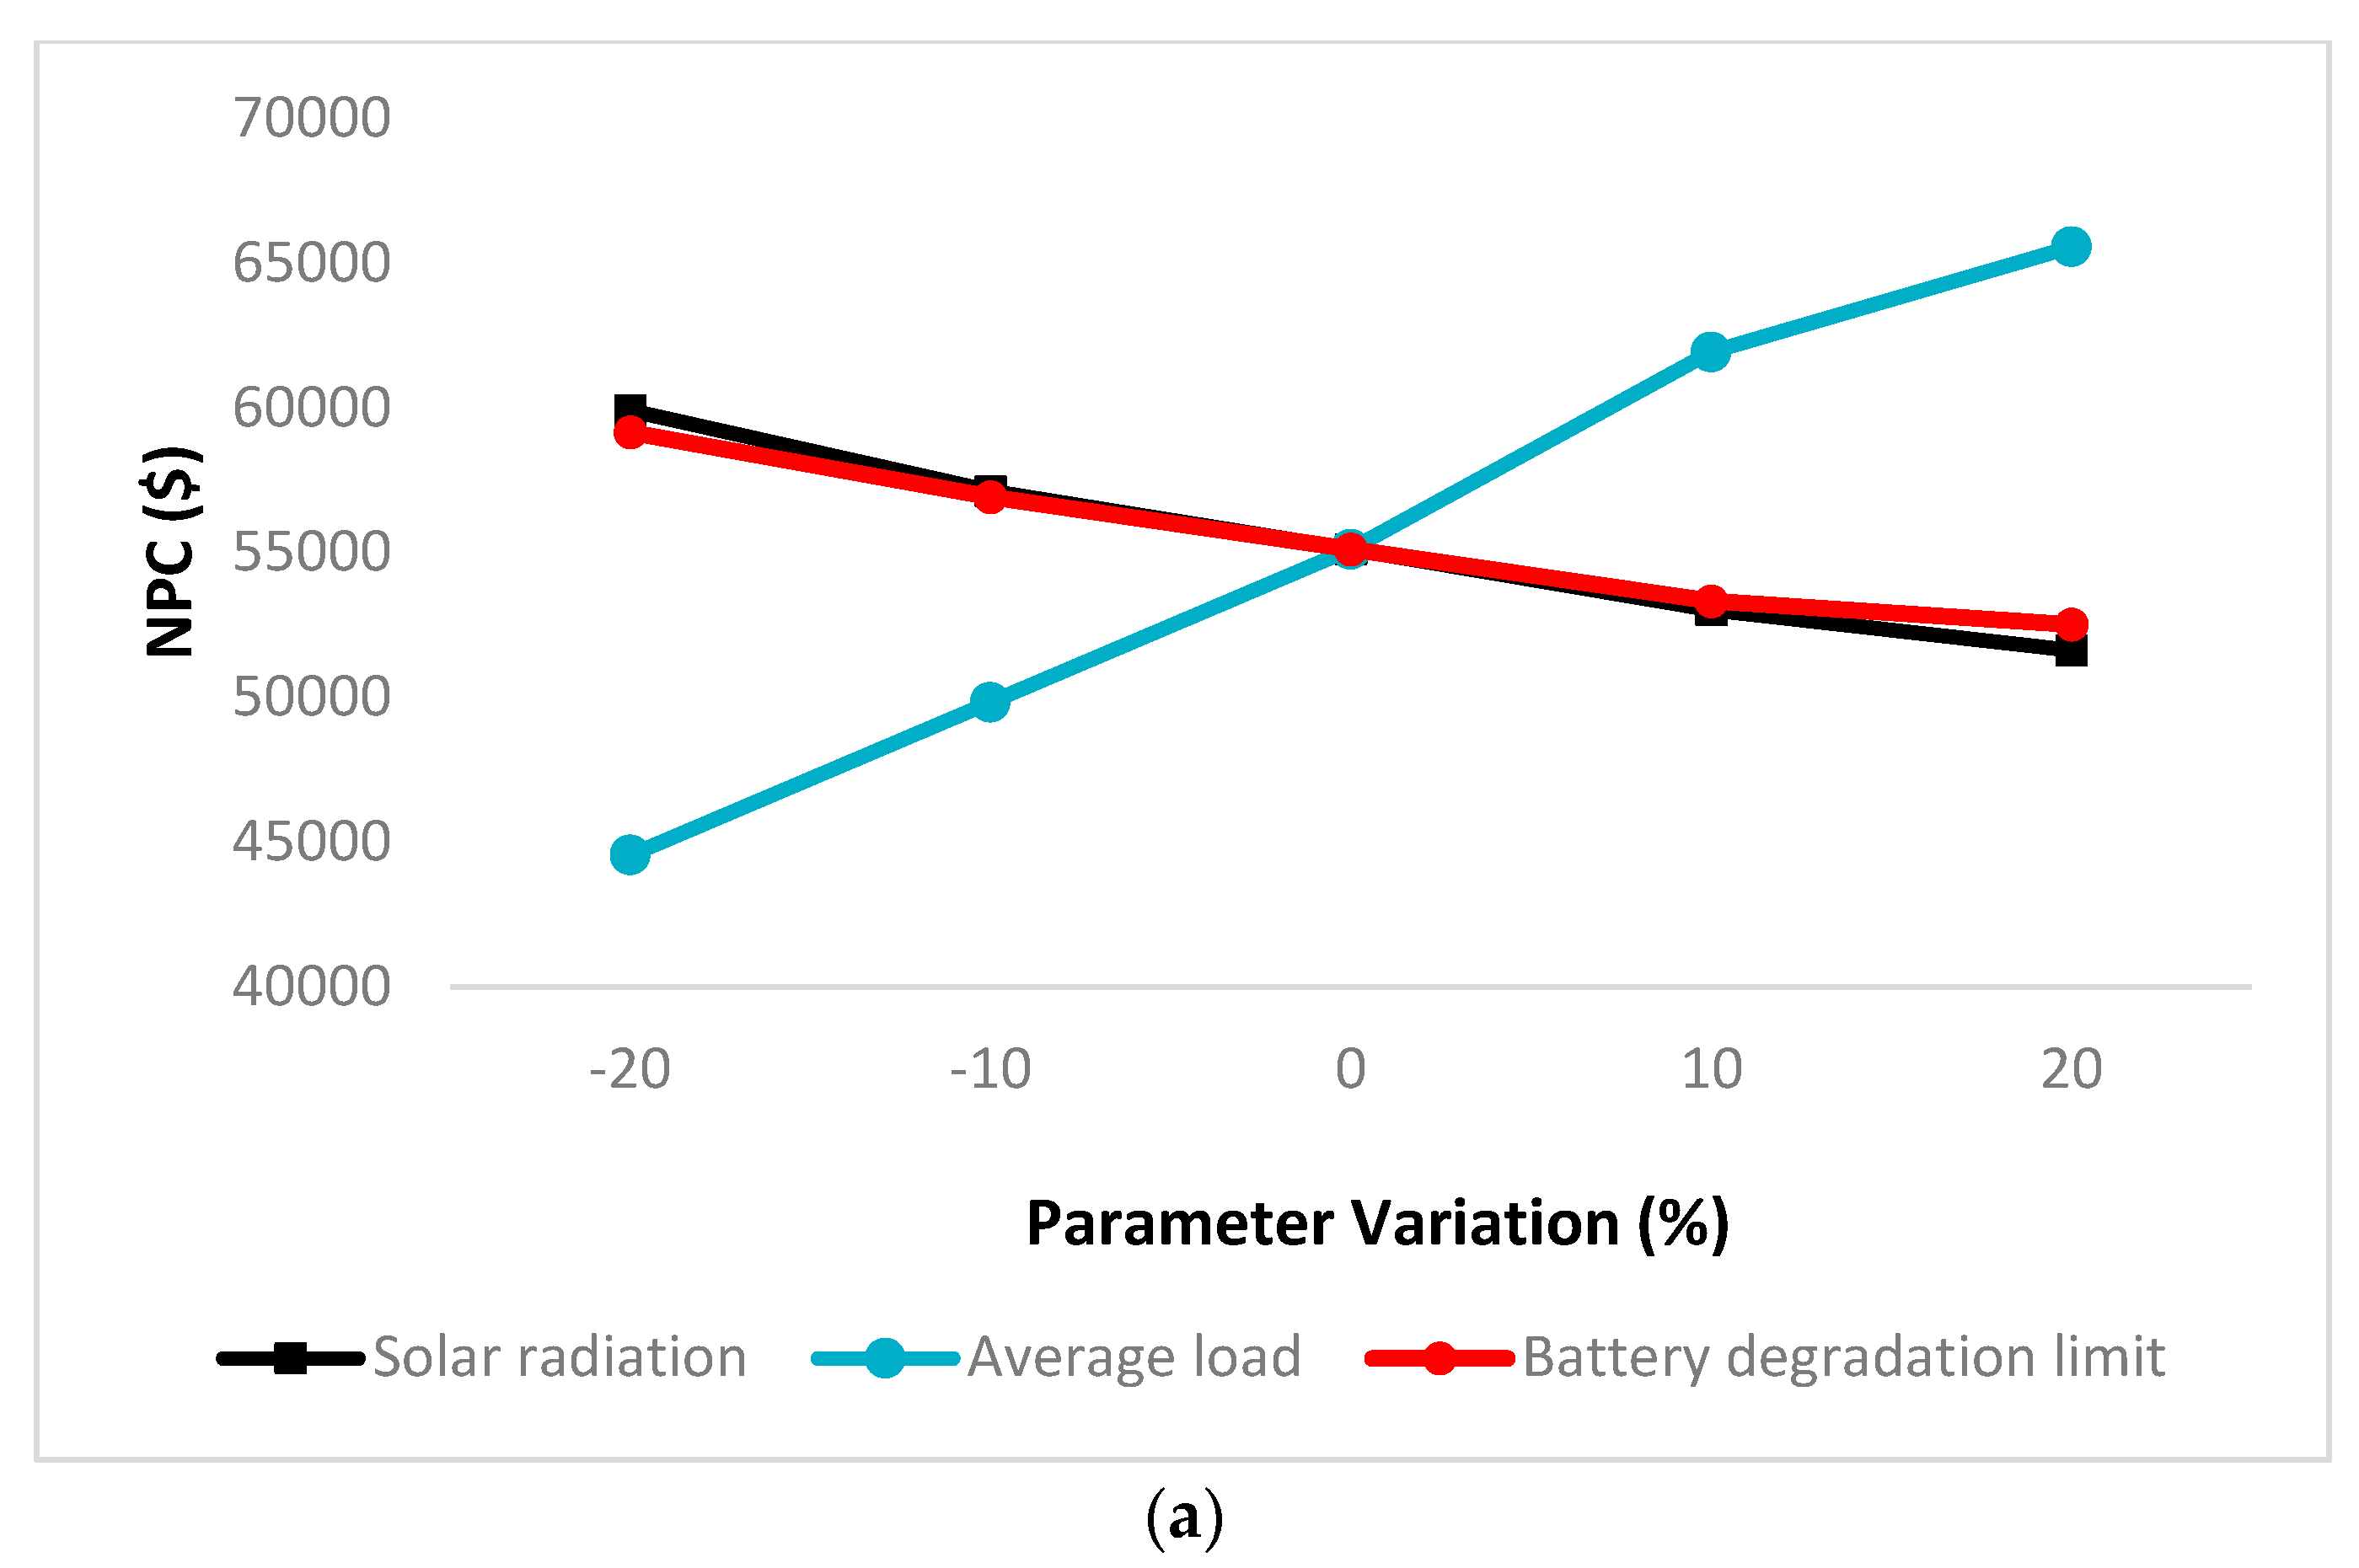
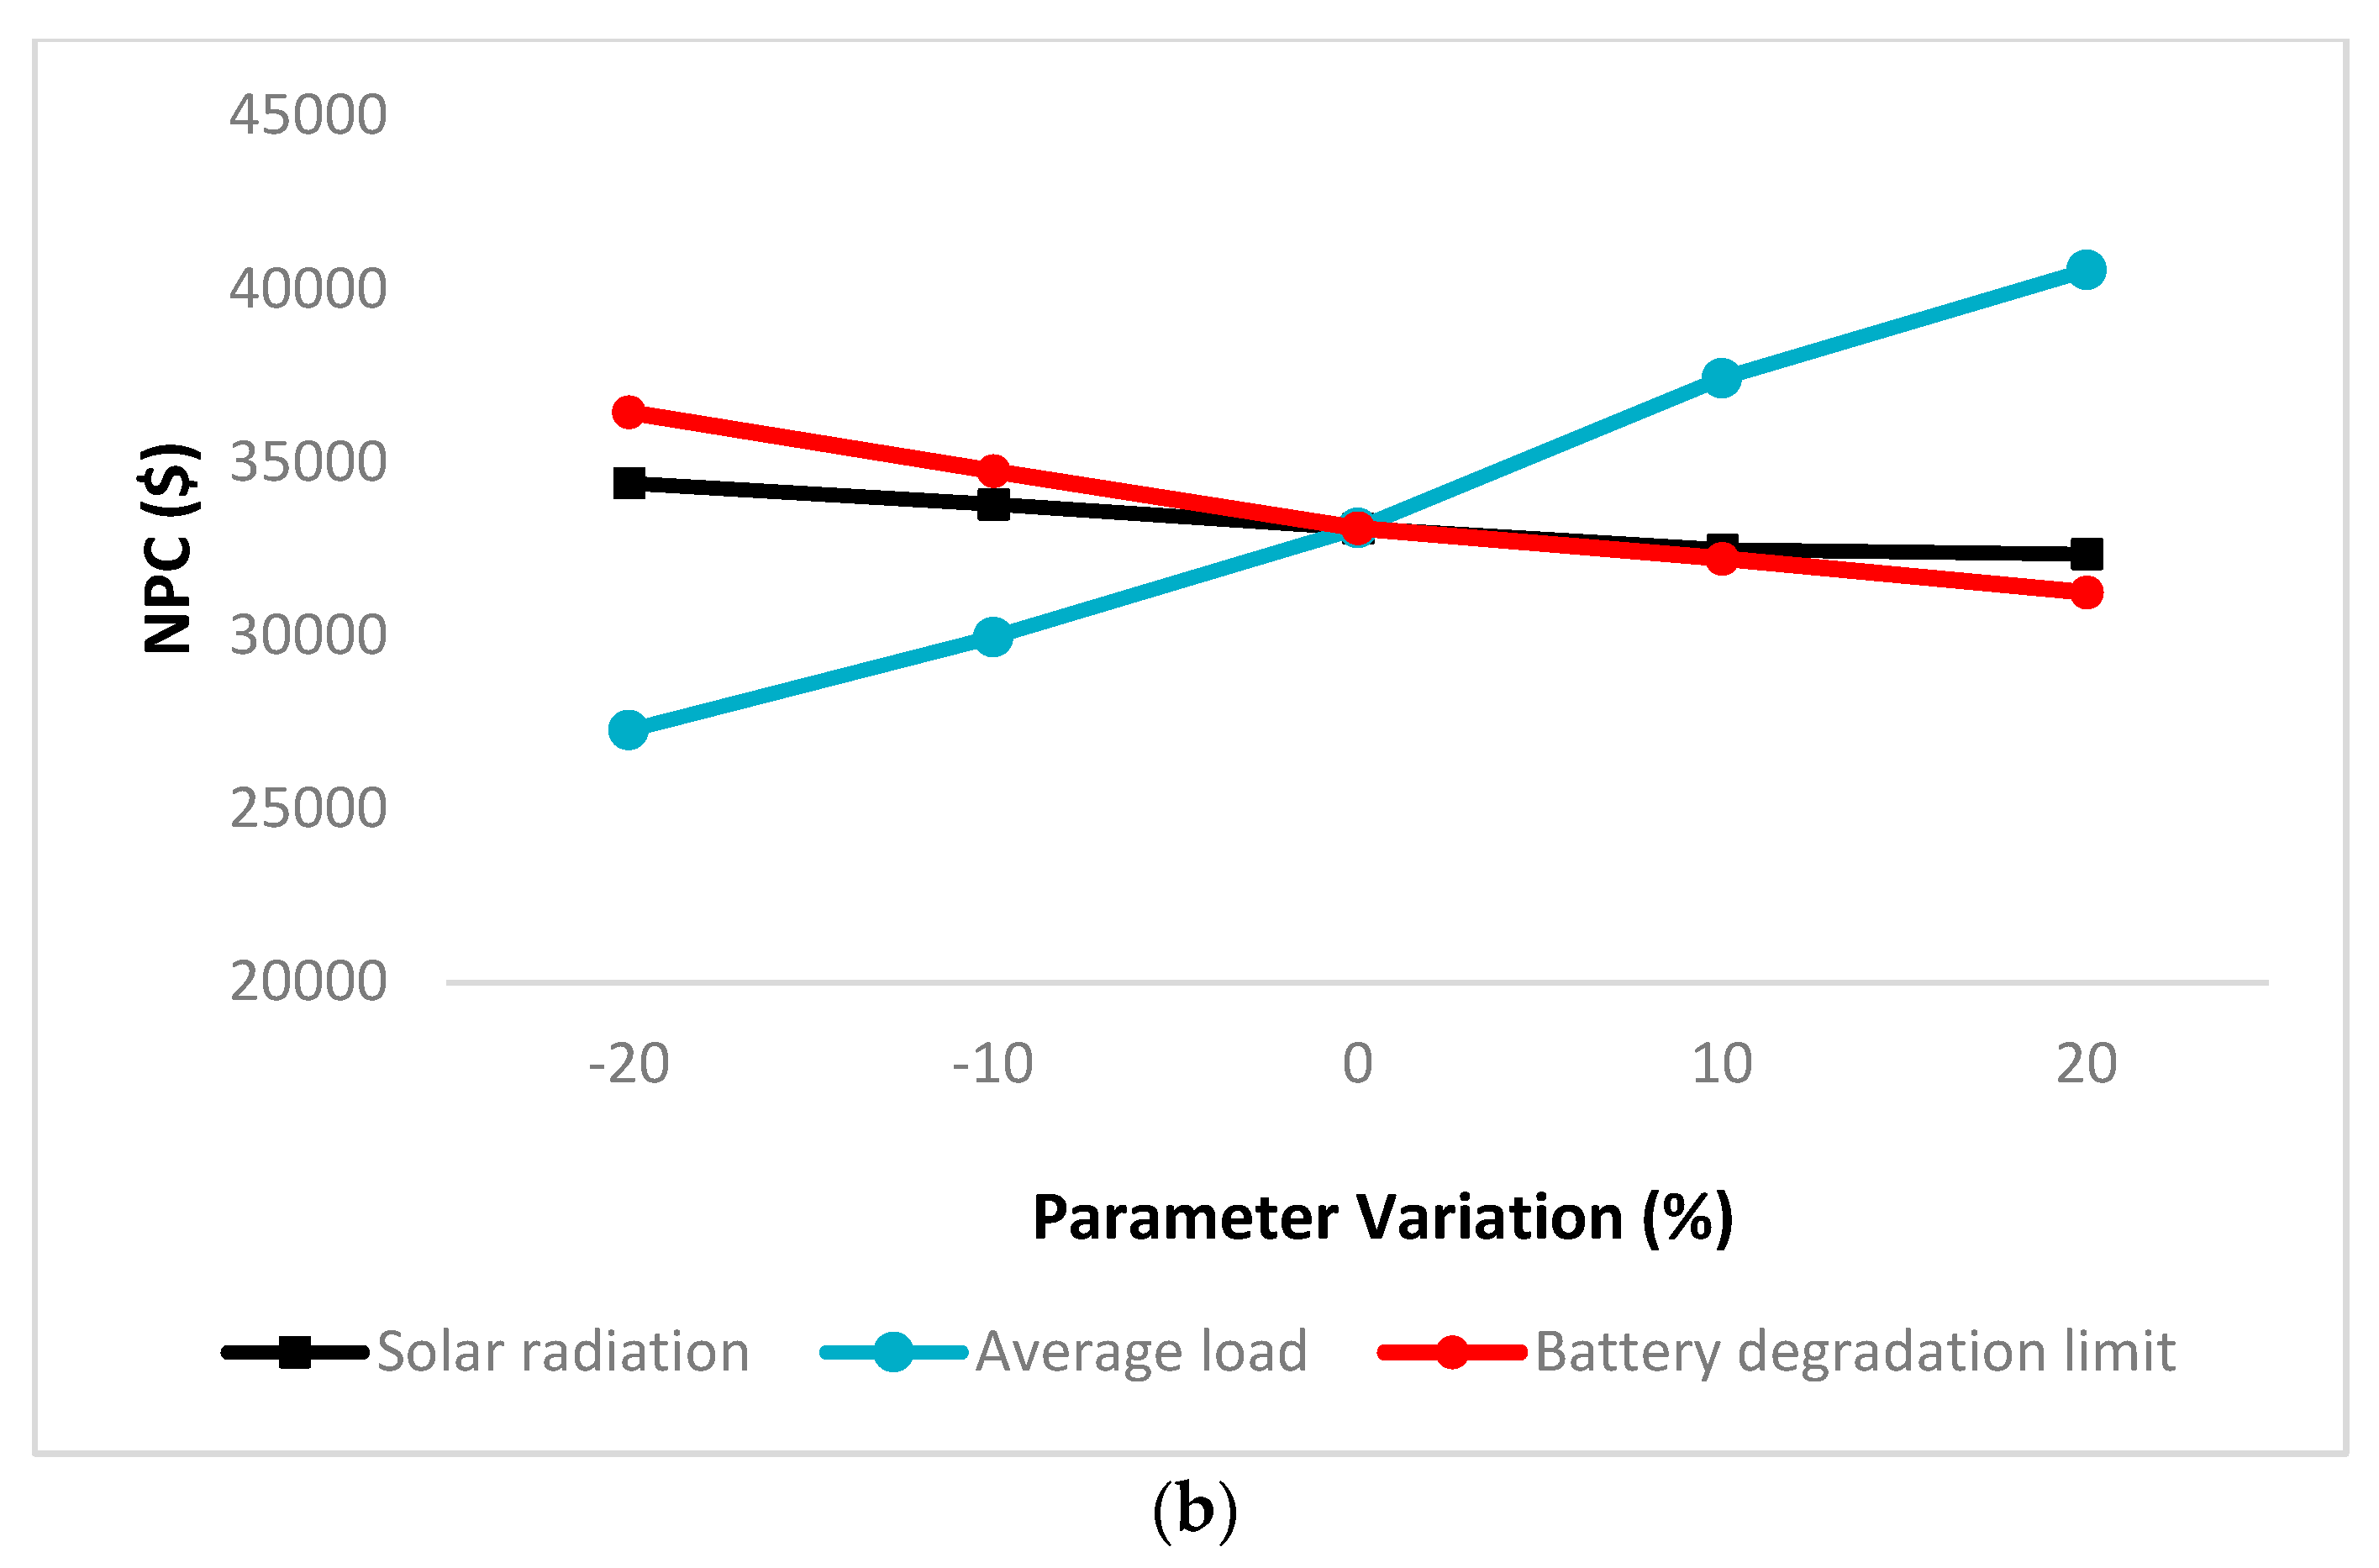
3.4. Sensitivity Analysis

The effects of some critical parameter variations on the NPC concerning the multi-year effects are discussed in this section. The sensitivity analysis of the solar radiation, average load, and battery degradation limits considering −20% and +20% variations of the original value of each parameter are depicted in Figure 13. It is obvious that the variation of the solar radiation from −20% to +20% of its original value leads to a decrease in the NPC by 13.8% and 5.9% for LF and CC, respectively. The same variation rate in the average load increases the NPC by 47.1% and 48.6% for LF and CC, respectively. Moreover, the NPC decreases by 11.2% and 14.2% for LF and CC, respectively, with the same variation ratio in the battery degradation limit.

4. Conclusions

Integrating RESs into the grid can provide reliable, economical, and environmentally friendly power sources. The best component selection and control technique are critical considerations in the design of the HESs. The present study investigates the optimal design of a grid-connected PV/battery system to electrify a residential house in Karbala, Iraq, using HOMER software. LF and CC are used to control the energy flow among components. A detailed technical, economic, and environmental assessment is performed with and without the multi-year effects, such as PV and battery degradation. The results demonstrate that the CC strategy is more economical than the LF strategy for the proposed HES. Under the CC strategy, the multi-year effects increase the required PV size from 6 kW to 7 kW and the required number of batteries from 18 to 20, leading to an increase in the net present cost from $26,750 to $33,102 and a decrease in the CO2 emissions by 2.66%. While, for the LF strategy, considering the multi-year effects leads to an increase in the required PV size from 19 kW to 23 kW and the required number of batteries from 30 to 36, resulting in an increase in the net present cost from $40,607 to $55,113 and decrease the CO2 emissions by 1.33%. Variations in some critical parameters, such as solar radiation, average load, and battery degradation limits, affect the optimization results dramatically. The findings of this work show the importance of the multi-year effects and control strategy in the optimal design of HES.

Author Contributions

Methodology, J.M.C.; Formal analysis, M.O.A.; Resources, A.J.A.; Writing—original draft, I.H.A.-K.; Supervision, H.F.F.; Project administration, A.A.-K. All authors have read and agreed to the published version of the manuscript.

Funding

The authors are grateful for the financial and technical support from Al-Mustaqbal University College (grant code: 0122).

Acknowledgments

Many thanks to Headway to Green Future company for technical and information support.

Conflicts of Interest

The authors declare no conflict of interest.

References

  1. Li, J.; Liu, P.; Li, Z. Optimal design and techno-economic analysis of a hybrid renewable energy system for off-grid power supply and hydrogen production: A case study of West China. Chem. Eng. Res. Des. 2022, 177, 604–614. [Google Scholar] [CrossRef]
  2. Turkdogan, S. Design and optimization of a solely renewable based hybrid energy system for residential electrical load and fuel cell electric vehicle. Eng. Sci. Technol. Int. J. 2021, 24, 397–404. [Google Scholar] [CrossRef]
  3. Kumar, D.; Tewary, T. Design and analysis of grid-connected sustainable urban residential energy systems. Int. J. Energy Sect. Manag. 2021, 16, 704–727. [Google Scholar] [CrossRef]
  4. Tahir, M.U.R.; Amin, A.; Baig, A.A.; Manzoor, S.; Haq, A.U.; Asgha, M.A.; Khawaja, W.A.G. Design and optimization of grid Integrated hybrid on-site energy generation system for rural area in AJK-Pakistan using HOMER software. AIMS Energy 2021, 9, 1113–1135. [Google Scholar] [CrossRef]
  5. Al-Najjar, H.; El-Khozondar, H.J.; Pfeifer, C.; Al Afif, R. Hybrid grid-tie electrification analysis of bio-shared renewable energy systems for domestic application. Sustain. Cities Soc. 2022, 77, 103538. [Google Scholar] [CrossRef]
  6. IEA. Renewable Energy Market Update 2021; IEA: Paris, France, 2021.
  7. Wesly, J.; Brasil, A.C., Jr.; Frate, C.A.; Badibanga, R.K. Techno-economic analysis of a PV-wind-battery for a remote community in Haiti. Case Stud. Chem. Environ. Eng. 2020, 2, 100044. [Google Scholar] [CrossRef]
  8. Aziz, A.S.; Tajuddin, M.F.N.; Hussain, M.K.; Adzman, M.R.; Ghazali, N.H.; Ramli, M.A.; Zidane, T.E.K. A new optimization strategy for wind/diesel/battery hybrid energy system. Energy 2022, 239, 122458. [Google Scholar] [CrossRef]
  9. El-Sattar, H.A.; Sultan, H.M.; Kamel, S.; Khurshaid, T.; Rahmann, C. Optimal design of stand-alone hybrid PV/wind/biomass/battery energy storage system in Abu-Monqar, Egypt. J. Energy Storage 2021, 44, 103336. [Google Scholar] [CrossRef]
  10. Mosetlhe, T.; Ntombela, M.; Yusuff, A.; Ayodele, T.; Ogunjuyibe, A. Appraising the efficacy of the hybrid grid-PV power supply for a household in South Africa. Renew. Energy Focus 2021, 37, 14–19. [Google Scholar] [CrossRef]
  11. Lei, G.; Song, H.; Rodriguez, D. Power generation cost minimization of the grid-connected hybrid renewable energy system through optimal sizing using the modified seagull optimization technique. Energy Rep. 2020, 6, 3365–3376. [Google Scholar] [CrossRef]
  12. García-Vera, Y.E.; Dufo-López, R.; Bernal-Agustín, J.L. Techno-economic feasibility analysis through optimization strategies and load shifting in isolated hybrid microgrids with renewable energy for the non-interconnected zone (NIZ) of Colombia. Energies 2020, 13, 6146. [Google Scholar] [CrossRef]
  13. Singh, S.; Chauhan, P.; Singh, N. Capacity optimization of grid connected solar/fuel cell energy system using hybrid ABC-PSO algorithm. Int. J. Hydrogen Energy 2020, 45, 10070–10088. [Google Scholar] [CrossRef]
  14. Owolabi, A.B.; Nsafon, B.E.K.; Roh, J.W.; Suh, D.; Huh, J.-S. Validating the techno-economic and environmental sustainability of solar PV technology in Nigeria using RETScreen Experts to assess its viability. Sustain. Energy Technol. Assess. 2019, 36, 100542. [Google Scholar] [CrossRef]
  15. Polat, S.; Sekerci, H. The Determination of Optimal Operating Condition For an Off-Grid Hybrid Renewable Energy Based Micro-Grid: A Case Study in Izmir, Turkey. Emitter Int. J. Eng. Technol. 2021, 9, 137–153. [Google Scholar] [CrossRef]
  16. Liu, S.; You, H.; Liu, Y.; Feng, W.; Fu, S. Research on optimal control strategy of wind–solar hybrid system based on power prediction. ISA Trans. 2022, 123, 179–187. [Google Scholar] [CrossRef]
  17. Fares, D.; Fathi, M.; Mekhilef, S. Performance evaluation of metaheuristic techniques for optimal sizing of a stand-alone hybrid PV/wind/battery system. Appl. Energy 2022, 305, 117823. [Google Scholar] [CrossRef]
  18. Al-Kayiem, H.H.; Mohammad, S.T. Potential of renewable energy resources with an emphasis on solar power in iraq: An outlook. Resources 2019, 8, 42. [Google Scholar] [CrossRef] [Green Version]
  19. NASA Power. Available online: https://power.larc.nasa.gov/ (accessed on 10 April 2022).
  20. Prakash, V.J.; Dhal, P.K. Techno-Economic Assessment of a Standalone Hybrid System Using Various Solar Tracking Systems for Kalpeni Island, India. Energies 2021, 14, 8533. [Google Scholar] [CrossRef]
  21. Lithium Werks. Available online: https://lithiumwerks.com/ (accessed on 15 April 2022).
  22. Must Energy. Available online: https://www.mustsolar.com/ (accessed on 15 April 2022).
  23. Aziz, A.S.; Tajuddin, M.F.N.; Adzman, M.R.; Mohammed, M.F.; Ramli, M.A. Feasibility analysis of grid-connected and islanded operation of a solar PV microgrid system: A case study of Iraq. Energy 2020, 191, 116591. [Google Scholar] [CrossRef]
  24. The Ministry of Electricity of Iraq. Available online: https://moelc.gov.iq/index.php (accessed on 15 August 2022).
  25. Aziz, A.S.; Tajuddin, M.F.N.; Adzman, M.R.; Ramli, M.A.M. Feasibility analysis of PV/diesel/battery hybrid energy system using multi-year module. Int. J. Renew. Energy Res. 2018, 8, 1980–1993. [Google Scholar]
  26. Elsaraf, H.; Jamil, M.; Pandey, B. Techno-Economic Design of a Combined Heat and Power Microgrid for a Remote Community in Newfoundland Canada. IEEE Access 2021, 9, 91548–91563. [Google Scholar] [CrossRef]
  27. HOMER Energy. Available online: https://www.homerenergy.com/ (accessed on 20 April 2022).
  28. Barua, P.; Ghosh, B. Feasibility Analysis of Renewable Energy Based Hybrid Power System in a Coastal Area, Bangladesh. In Proceedings of the 2020 Emerging Technology in Computing, Communication and Electronics (ETCCE), Dhaka, Bangladesh, 21–22 December 2020; pp. 1–6. [Google Scholar]
  29. Stewart, M.; Counsell, J.M.; Al-Khaykan, A. Assessment of Multi-Domain Energy Systems Modelling Methods; World Academy of Science, Engineering and Technology: Paris, France, 2017. [Google Scholar]
  30. Sitharam, T.G.; Yang, S.Q.; Falconer, R.; Sivakumar, M.; Jones, B.; Kolathayar, S.; Sinpoh, L. Sustainable Water Resource Development Using Coastal Reservoirs; Butterworth-Heinemann: Oxford, UK, 2020. [Google Scholar]
  31. Alrubaie, A.J.; Al-Khaykan, A.; Malik, R.Q.; Talib, S.H.; Mousa, M.I.; Kadhim, A.M. Review on MPPT Techniques in Solar System. In Proceedings of the 2022 8th International Engineering Conference on Sustainable Technology and Development (IEC), Tanjung Pinang, Indonesia, 23–24 February 2022; pp. 123–128. [Google Scholar]
Figure 1. Global increase in renewable generation capacity between 2019 and 2022.
Energies 16 00110 g001
Figure 2. Hourly load profile for a summer weekday.
Energies 16 00110 g002
Figure 3. Monthly average electricity consumption.
Energies 16 00110 g003
Figure 4. Monthly average ambient temperature.
Energies 16 00110 g004
Figure 5. Monthly average solar radiation and clearness index.
Energies 16 00110 g005
Figure 6. Configuration of the proposed HES.
Energies 16 00110 g006
Figure 7. National grid scheduled rates.
Energies 16 00110 g007
Figure 8. LF strategy for grid-connected PV/battery system.
Energies 16 00110 g008
Figure 9. CC strategy for grid-connected PV/battery system.
Energies 16 00110 g009
Figure 10. Cost summary of the HES using different control strategies.
Energies 16 00110 g010
Figure 11. Year-year analysis for; (a) PV production; (b) Grid purchases; (c) Battery output energy; (d) CO2 emissions, using LF strategy.
Energies 16 00110 g011
Figure 12. Year–year analysis for (a) PV production; (b) Grid purchases; (c) Battery output energy; (d) CO2 emissions, using CC strategy.
Energies 16 00110 g012aEnergies 16 00110 g012b
Figure 13. Effects of critical parameter variations on the NPC using (a) LF strategy and (b) CC strategy.
Energies 16 00110 g013aEnergies 16 00110 g013b
Table 1. Technical characteristics of the HES components.
ParameterDescription
1. PV
TypeFlat plate
Nominal efficiency18%
Nominal operating cell temperature47 °C
Tracking systemNo tracking
Ground Reflectance20%
Lifetime25 years
2. Battery
TypeGeneric 1 kWh Li-Ion
Maximum Capacity276 Ah
Nominal capacity1.02 KWh
Round trip efficiency90%
Nominal voltage3.7 V
3. Converter
Rectifier capacity100%
Efficiency93%
Lifetime15 years
Table 2. Financial cost values of the components.
Cost TypePVBatteryConverter
Cost of capital$640/kW$500/battery$645/kW
Annual O & M cost$10/kW$10/battery$10/kW
Cost of replacement$500/kW$450/battery$500/kW
Table 3. National grid residential electricity prices.
Electricity Consumption Per Month (kWh)Price ($ Per kWh)Price (IQD Per kWh)
>40000.0827120
3001–40000.055080
1501–30000.024035
1–15000.006910
Table 4. Critical input parameters.
ParameterValueUnit
Project lifetime20Year
Maximum annual capacity shortage 1%
Battery minimum SOC25%
Real discount rate4%
Table 5. Optimal HESs using LF and CC strategies.
DescriptionUnitWith Multi-Year EffectsWithout Multi-Year Effects
LFCCLFCC
HES components
PVkW237196
Battery-36203018
ConverterkW4444
Grid purchaseskWh/year621511,675629911,995
Economic optimization
NPC$55,11333,10240,60726,750
Table 6. Technical and environmental specifications of the HES using different control strategies.
DescriptionUnitWith Multi-Year EffectsWithout Multi-Year Effects
LFCCLFCC
PV productionkWh/year33,27410,12728,8169100
Renewable fractionkW69.637.668.734.7
Unmet loadkWh/year114121155129
Battery autonomyhour13.27.2311.87.06
Battery lifeyear9.927.751510.2
CO2 emissionskg/year3928737939817581
Disclaimer/Publisher’s Note: The statements, opinions and data contained in all publications are solely those of the individual author(s) and contributor(s) and not of MDPI and/or the editor(s). MDPI and/or the editor(s) disclaim responsibility for any injury to people or property resulting from any ideas, methods, instructions or products referred to in the content.

