Article

Scenario Analysis of the GHG Emissions in the Electricity Sector through 2030 in South Korea Considering Updated NDC †

Department of Electrical and Electronics Engineering, Konkuk University, 120 Neungdong-ro, Gwangjin-gu, Seoul 05029, Korea
*
Author to whom correspondence should be addressed.
The present work is an extension of the paper “Scenario Analysis of the CO2 Emissions in the Electricity Sector in South Korea” presented to APAP 2021 Conference, Jeju, Korea, 11–14 October 2021.
Energies 2022, 15(9), 3310; https://doi.org/10.3390/en15093310
Submission received: 28 February 2022 / Revised: 8 April 2022 / Accepted: 21 April 2022 / Published: 2 May 2022

Abstract

:
South Korea announced an energy transition roadmap, CO2 roadmap, and national greenhouse gas reduction target of nationally determined contribution (NDC) for the Paris Agreement. Furthermore, the government has also set a goal of reducing its CO2 emissions to reach net-zero carbon emissions by 2050. Additionally, the Korean government submitted an enhanced update of the first NDC at the end of 2021. In the electricity sector, the updated NDC proposed the GHG emissions target of 149.9 million tons in 2030. In this study, we model eight scenarios based on future energy mix and demand forecast considering the government’s latest plans to evaluate the possible emission reduction and impacts in the electricity sector. The scenario-based analysis is conducted to check whether it can satisfy the CO2 reduction target by using PLEXOS, a production simulation model. The results show that emission reduction targets are difficult to accomplish in the short term and can lead to significant changes in the operation of generators and increased costs to realize the decarbonization pathway.

1. Introduction

As part of the Paris Climate Agreement in 2015, governments around the world agreed to limit global warming to levels well below 2 °C relative to pre-industrial levels and pursue efforts to limit it to 1.5°C. In this context, more than 197 countries worldwide submitted their nationally determined contributions (NDCs), outlining voluntary climate actions until 2030 and considering national development goals. In this proposal, the Korean government plans to reduce its greenhouse gas emissions by 37% from the business-as-usual (BAU, 850.6 MtCO2eq) level by 2030 across all economic sectors. Korea has continued to deal with climate change problems across all economic sectors according to the Framework Act on low carbon and green growth, and the country is focusing on efforts to reduce its GHG emissions to meet short-term goal.
Korea has expanded its renewable electricity generation as an effort to transform its economy into a low-carbon one. Korean energy policies—publicized in the 9th Basic Plan for Long-term Electricity Supply and Demand (BPE) (2020) [1], 2050 Carbon neutral strategy (2020) [2], the 8th Basic Plan for Long-term Electricity Supply and Demand (2017) [3], and the 3rd Korea Energy Master Plan (2019) [4]—seek to increase the proportion of renewable electricity generation. The direction of these policies has been to reduce thermal and nuclear power generation and to increase renewable electricity generation for a safe and environmentally friendly energy system.
First mentioned in the 8th BPE, the target for CO2 emissions in the electricity generation sector was 237 million tons in 2030, a reduction of 26.4% compared to the BAU of 322 million tons. The 9th BPE proposed a target of 192.6 million tons of greenhouse gas emissions in 2030, a reduction of 23.6% compared to the previous target of 237 million tons. To achieve the target, the Korean government is considering various measures, including decommissioning aging coal generators and fuel conversion from coal to liquefied natural gas (LNG) generation. Additionally, reflecting the Green New Deal policy (2020) [5], the renewable supply target by 2025 has been raised. Moreover, a generation cap on operating coal power plants was enforced.
In October 2020, President Moon declared that the country would aim to reach carbon neutrality by 2050. In May 2021, Moon declared that a more ambitious target would be announced at the COP26 climate change conference in Glasgow in November 2021 in response to criticism about the country’s lack of ambition in terms of emissions reduction. Finally, the Korean government submitted its update of the first NDC [6]. Figure 1 shows historical GHG emissions, emission target at NDC, and emission trajectory up to 2050 carbon neutrality. The updated target is to reduce total national GHG emissions by 40% from the 2018 level by 2030. In the revised plan, the GHG emissions target in the power generation sector was changed from 192.6 million tons to 149.9 million tons in 2030. To achieve this goal, the government suggested some measures that included reducing oil and coal power generation, expanding renewable energy generation, and introducing ammonia co-firing.
The new NDC reflects the strong will of the government to reduce GHG emission. However, it is a very difficult task because Korea has an industrial structure with a high proportion of manufacturing. Moreover, as the NDC was set assuming linear reduction pathways from 2018 to 2050 net-zero, the time is quite short to achieve the target.
In some previous studies [7,8,9,10,11,12,13], GHG emission mitigation targets and the plans of Korea were reviewed. However, most of them focused on mid- and long-term views, using top-down approaches that consider the energy, industry, building, transportation, agriculture, livestock farming and fisheries, and waste sectors to review the nation’s total GHG emissions. Additionally, they did not focus on the electricity sector and did not reflect the latest policies.
The GHG reduction target in the electricity sector of the government’s plan would need to be quite aggressive, so it is essential to research whether it can be achieved in the short term. Thus, from this point of view, our article organizes several scenarios on energy mix and forecasted load demand considering the government’s latest plans to evaluate the potential GHG emission reduction in the electricity sector and analyzes scenarios to discover whether the GHG reduction target of the electricity sector will be achievable in the short to mid-term by using deterministic production simulations. The simulations were run in the PLEXOS [14], a commercial model developed by Energy Exemplar for electricity market simulation. It is not open source; however, it has been used for a wide range of analyses [15,16,17,18,19,20,21,22] by utilities and researchers alike. This study tried to derive policy implications for supply and demand and generation mix. In addition, we reviewed the feasibility of Korean GHG emission target and suggested several alternatives for achieving the GHG emissions target.
The rest of this paper is organized as follows. Section 2 explains the simulation model, the methodology and the database structuring, which are used to evaluate GHG emissions. Additionally, we build several scenarios considering electricity demand, power plant construction plan, and the level of renewable penetration. Section 3 evaluates CO2 projections, generation mix, and total costs by scenarios. Conclusions and suggestions are discussed in Section 4.

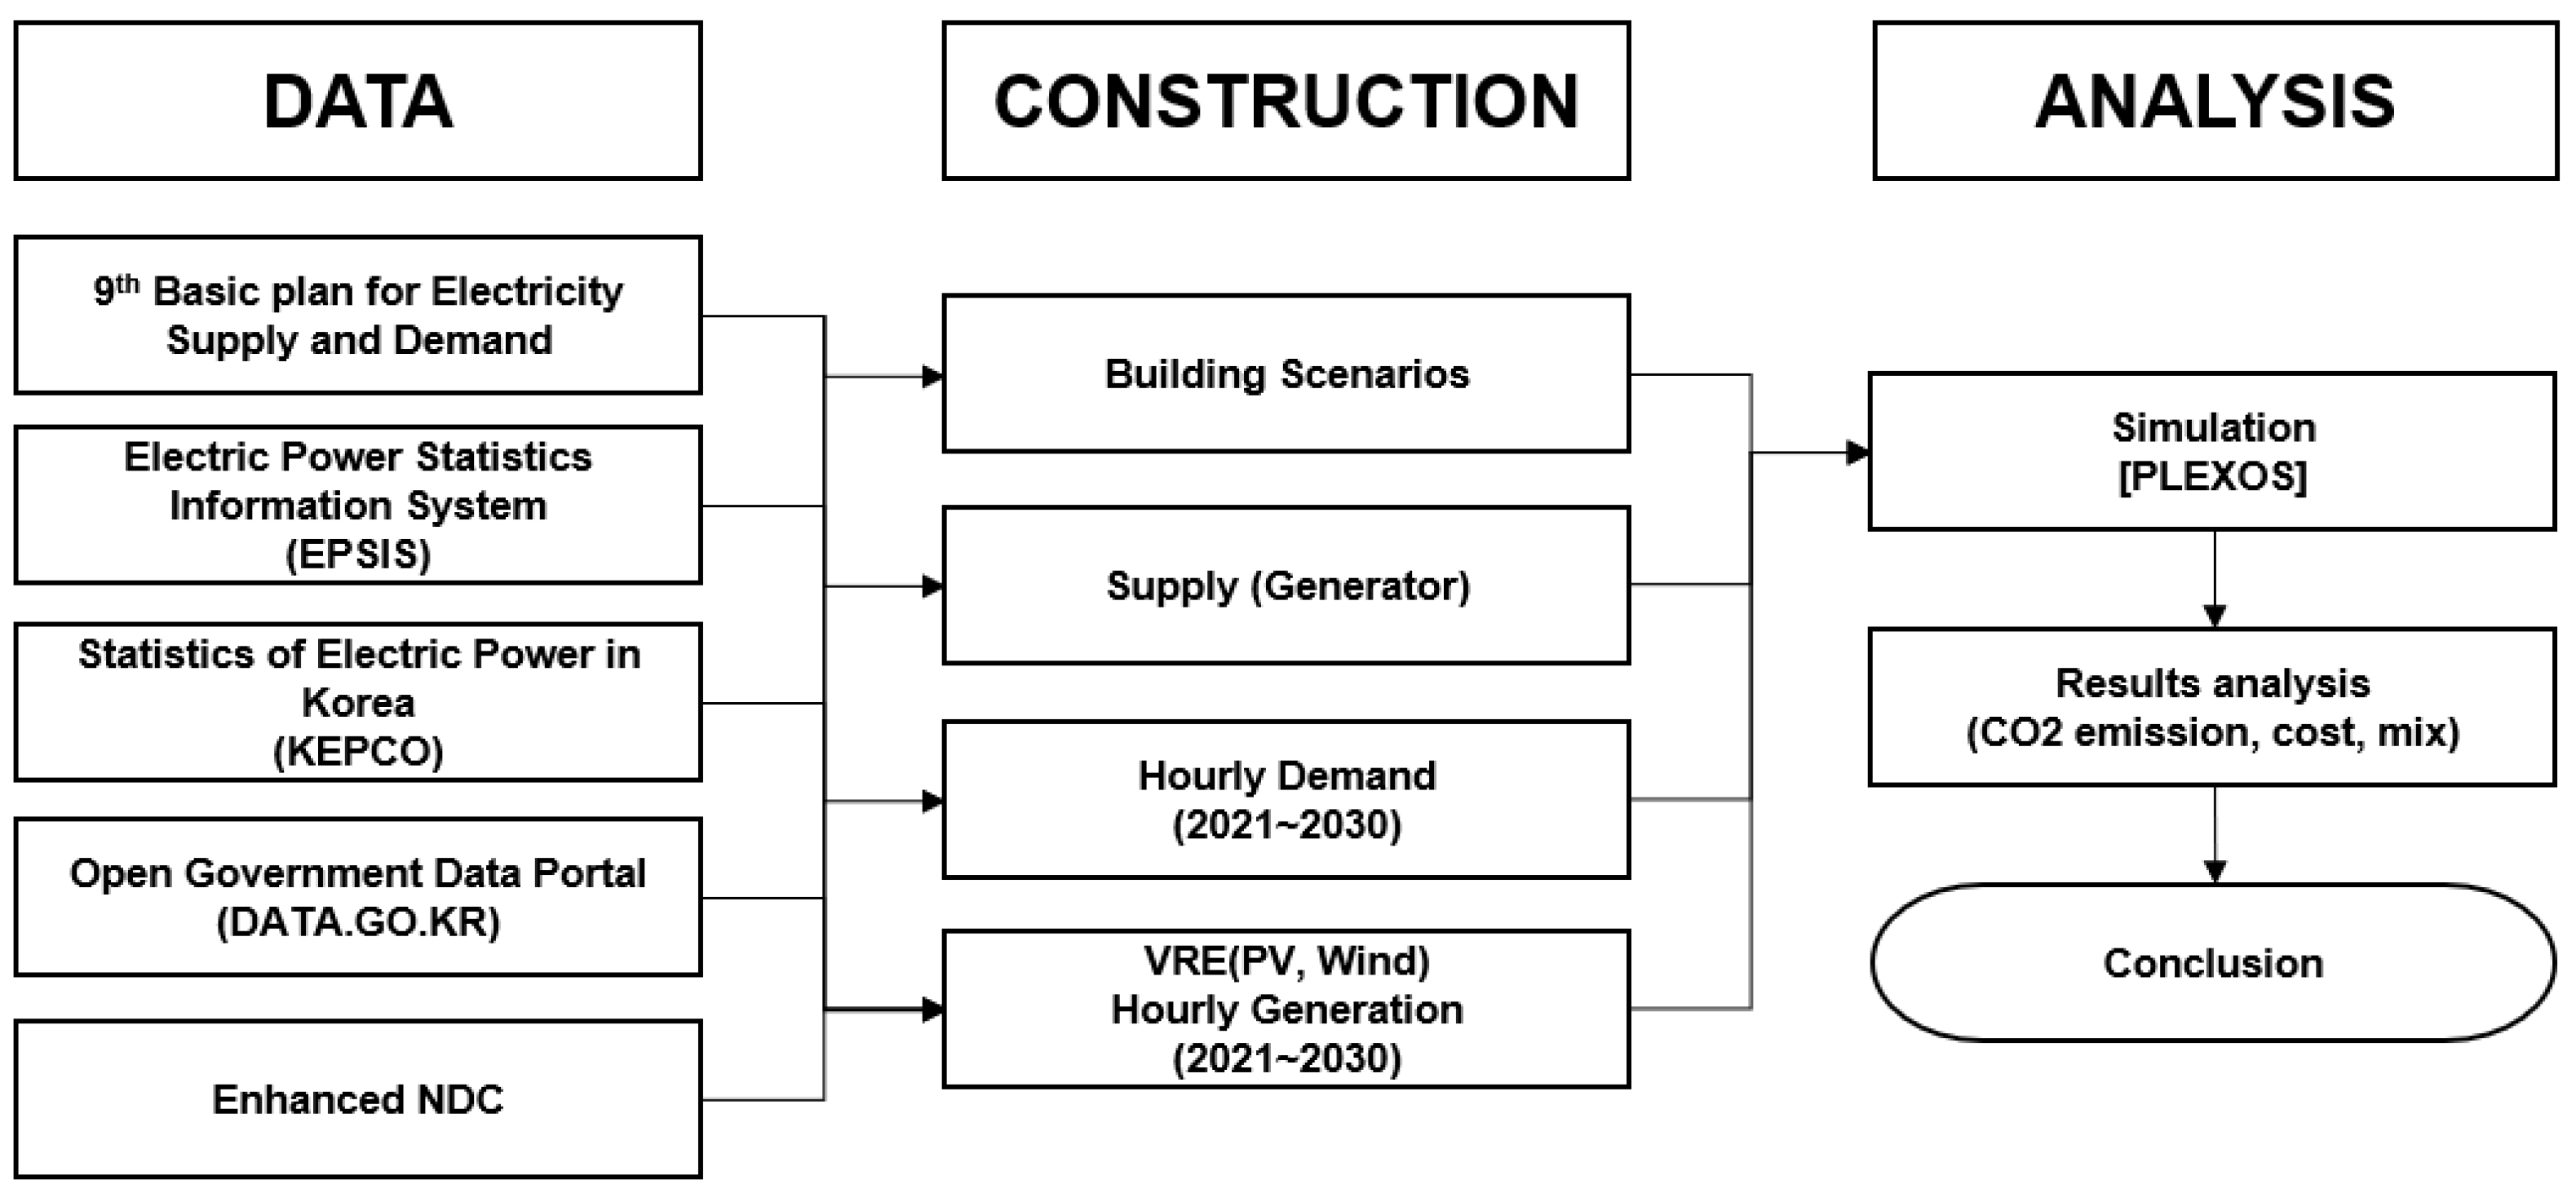
2. Data Input and Methodology

2.1. Unit Commitment and Economic Dispatch Model

PLEXOS is a simulation software that is used by energy market participants, system planners, investors, regulators, consultants, and analysts. [14,15,16,17,18,19,20,21,22] In this study, PLEXOS was used to solve the Unit Commitment [23] and Economic Dispatch [24] (UCED) problems. The unit commitment problem is the problem of finding an optimal combination of on/off decisions for all generating units across a given horizon, ensuring the supply meets the total demand at each simulation period. Economic dispatch refers to the optimization of generator dispatch levels for the given unit commitment solution.
The model’s objective function is to minimize the total system cost, which includes operational costs such as fuel and start-up costs, while considering various constraints on system, generation, and transmission, such as load balance, minimum up time and minimum down times, power plant ramp rates, available generation capacities, annual capacity factor, and emissions [25]. More detailed explanations of the PLEXOS software can be found in other published works [26]. This software accommodates a range of planning horizons, from long to short, and a variety of time steps. The simulated time frames can be set to minutes, hours, days, weeks, months, or years. The model was run at the hour resolution in our study.
This work used rounded linear relaxation (RLR), which enabled faster solution times than MILP solutions because it is less computationally intensive than integer programming while maintaining significant precision.
We developed a detailed database based on the assumptions described below. Based on the optimal dispatch results, GHG emissions from the electricity sector were estimated. The simulations have been performed on an AMD Ryzen Thread ripper 3990X processor 2.90 GHz with 256 GB Memory with IBM CPLEX 20.1.0.0 as a solver.

2.2. Supply Assumption

The simulation input data are constructed based on the official announcement of the 9th BPE, and historical data from the Electric Power Statistics Information System (EPSIS) of Korea Electricity Exchange (KPX), Korea Electric Power Corporation (KEPCO), and Open Government Data portal, as described in Figure 2 and Table 1.
The generation capacity mix based on the 9th BPE is shown in Table 2. While nuclear power plant and coal-fired steam turbine capacity is expected to decline compared to current levels, renewable and LNG capacity, which includes combined cycle gas turbines [27] and combined heat and power plants, is expected to increase. Technical data of generator can be seen in [28]. Korea currently has seven operational fixed-speed pumped storage hydrogenerators (PSHs) that contribute 4700 MW of generation capacity. Additionally, three new adjustable speed PSHs have been planned until 2034 to handle the variability and uncertainty created by renewable generation. In updated NDC, ammonia has 22.1 TWh in the generation mix in 2030. Ammonia means co-firing technology by co-burning coal and ammonia. It has been simply modeled as a carbon-free generator, not co-fired with coal in this study. The nuclear availability factor was estimated to be around 80% to 85%. In some scenarios, the coal capacity factor is capped. Renewable energy capacity and generation projections are based on the 9th BPE. In some scenarios, we assume 75% wind generation capacity, reflecting the current slow wind penetration with delays in major offshore wind projects. In the updated NDC, the government projected the renewable generation share in 2030 to be 30.0%, which is higher than the 20.8% share of the 9th BPE. In the updated NDC, renewable supply trajectories were not provided, so we assumed solar and wind supply penetration from 2026 to 2030.
Our scenarios reflect the 9th BPE and the updated NDC in terms of capacity and the total amount of renewable energy generation. Additionally, the hourly generation of photovoltaic and wind energy was generated using the generation pattern from the open government data portal in 2019. Figure 3 shows hourly capacity factor of photovoltaic and wind in 2019. Other renewables, meanwhile, were applied in a monthly generation pattern.

2.3. Demand Assumption

The hourly electricity demand in 2020 is used to project chronological load data from 2021 to 2030 corresponding to the government’s target demand. In the updated NDC, the government forecasted that demand in 2030 would increase by 4.6% compared to the 9th BPE, considering widespread electrification, and including electric vehicles’ charging demand. In scenarios based on the updated NDC, the effect of increased demand from 2026 was similarly applied to the renewable assumption. Table 3 shows our demand assumption of 9th BPE and NDC. Figure 4 shows the annual demand forecasting results up to 2030.

2.4. Other Assumption

Table 4 shows the CO2 emission factor of generation resources. This is the average emission factor which was calculated through the historical generation and emissions of power plants in Korea in 2014. [29] We assumed that nuclear, renewables and ammonia do not emit GHG in this study. The fuel prices in Table 5 are the latest three-year averages from 2019 to 2021 received from EPSIS [30].

2.5. Scenario Building

The following scenarios were created to evaluate CO2 emissions and whether the 2030 emission target can be met, as shown in Table 6. In scenario A, we assume that there are no policy measures in place to reduce emissions, such as a coal power generation cap. As a result, this scenario minimized the total cost without emissions or external costs of supplying the power demand. Scenario B has the same capacity mix as scenario A, but it constrains the coal power plants’ annual average capacity factor to 60%, which is the historical annual average capacity factor of the coal power plants in 2020 caused by government policy to reduce dust. From 2026, it is limited to 55 percent. Scenario C is based on the current situation in Korea, which is experiencing delays in the development of offshore wind projects. This scenario assumes that new wind power construction will reach 75% of the 9th plan level. Thus, it is the least efficient capacity mix for meeting the emission target. Scenario D has the same assumption as A, but it considers annual GHG emissions constraints. It was built to estimate the cost required to meet emissions targets compared to A. X-1 scenarios were based on the 9th BPE plan, and the updated NDC was used in X-2 scenarios.

3. Results and Discussion
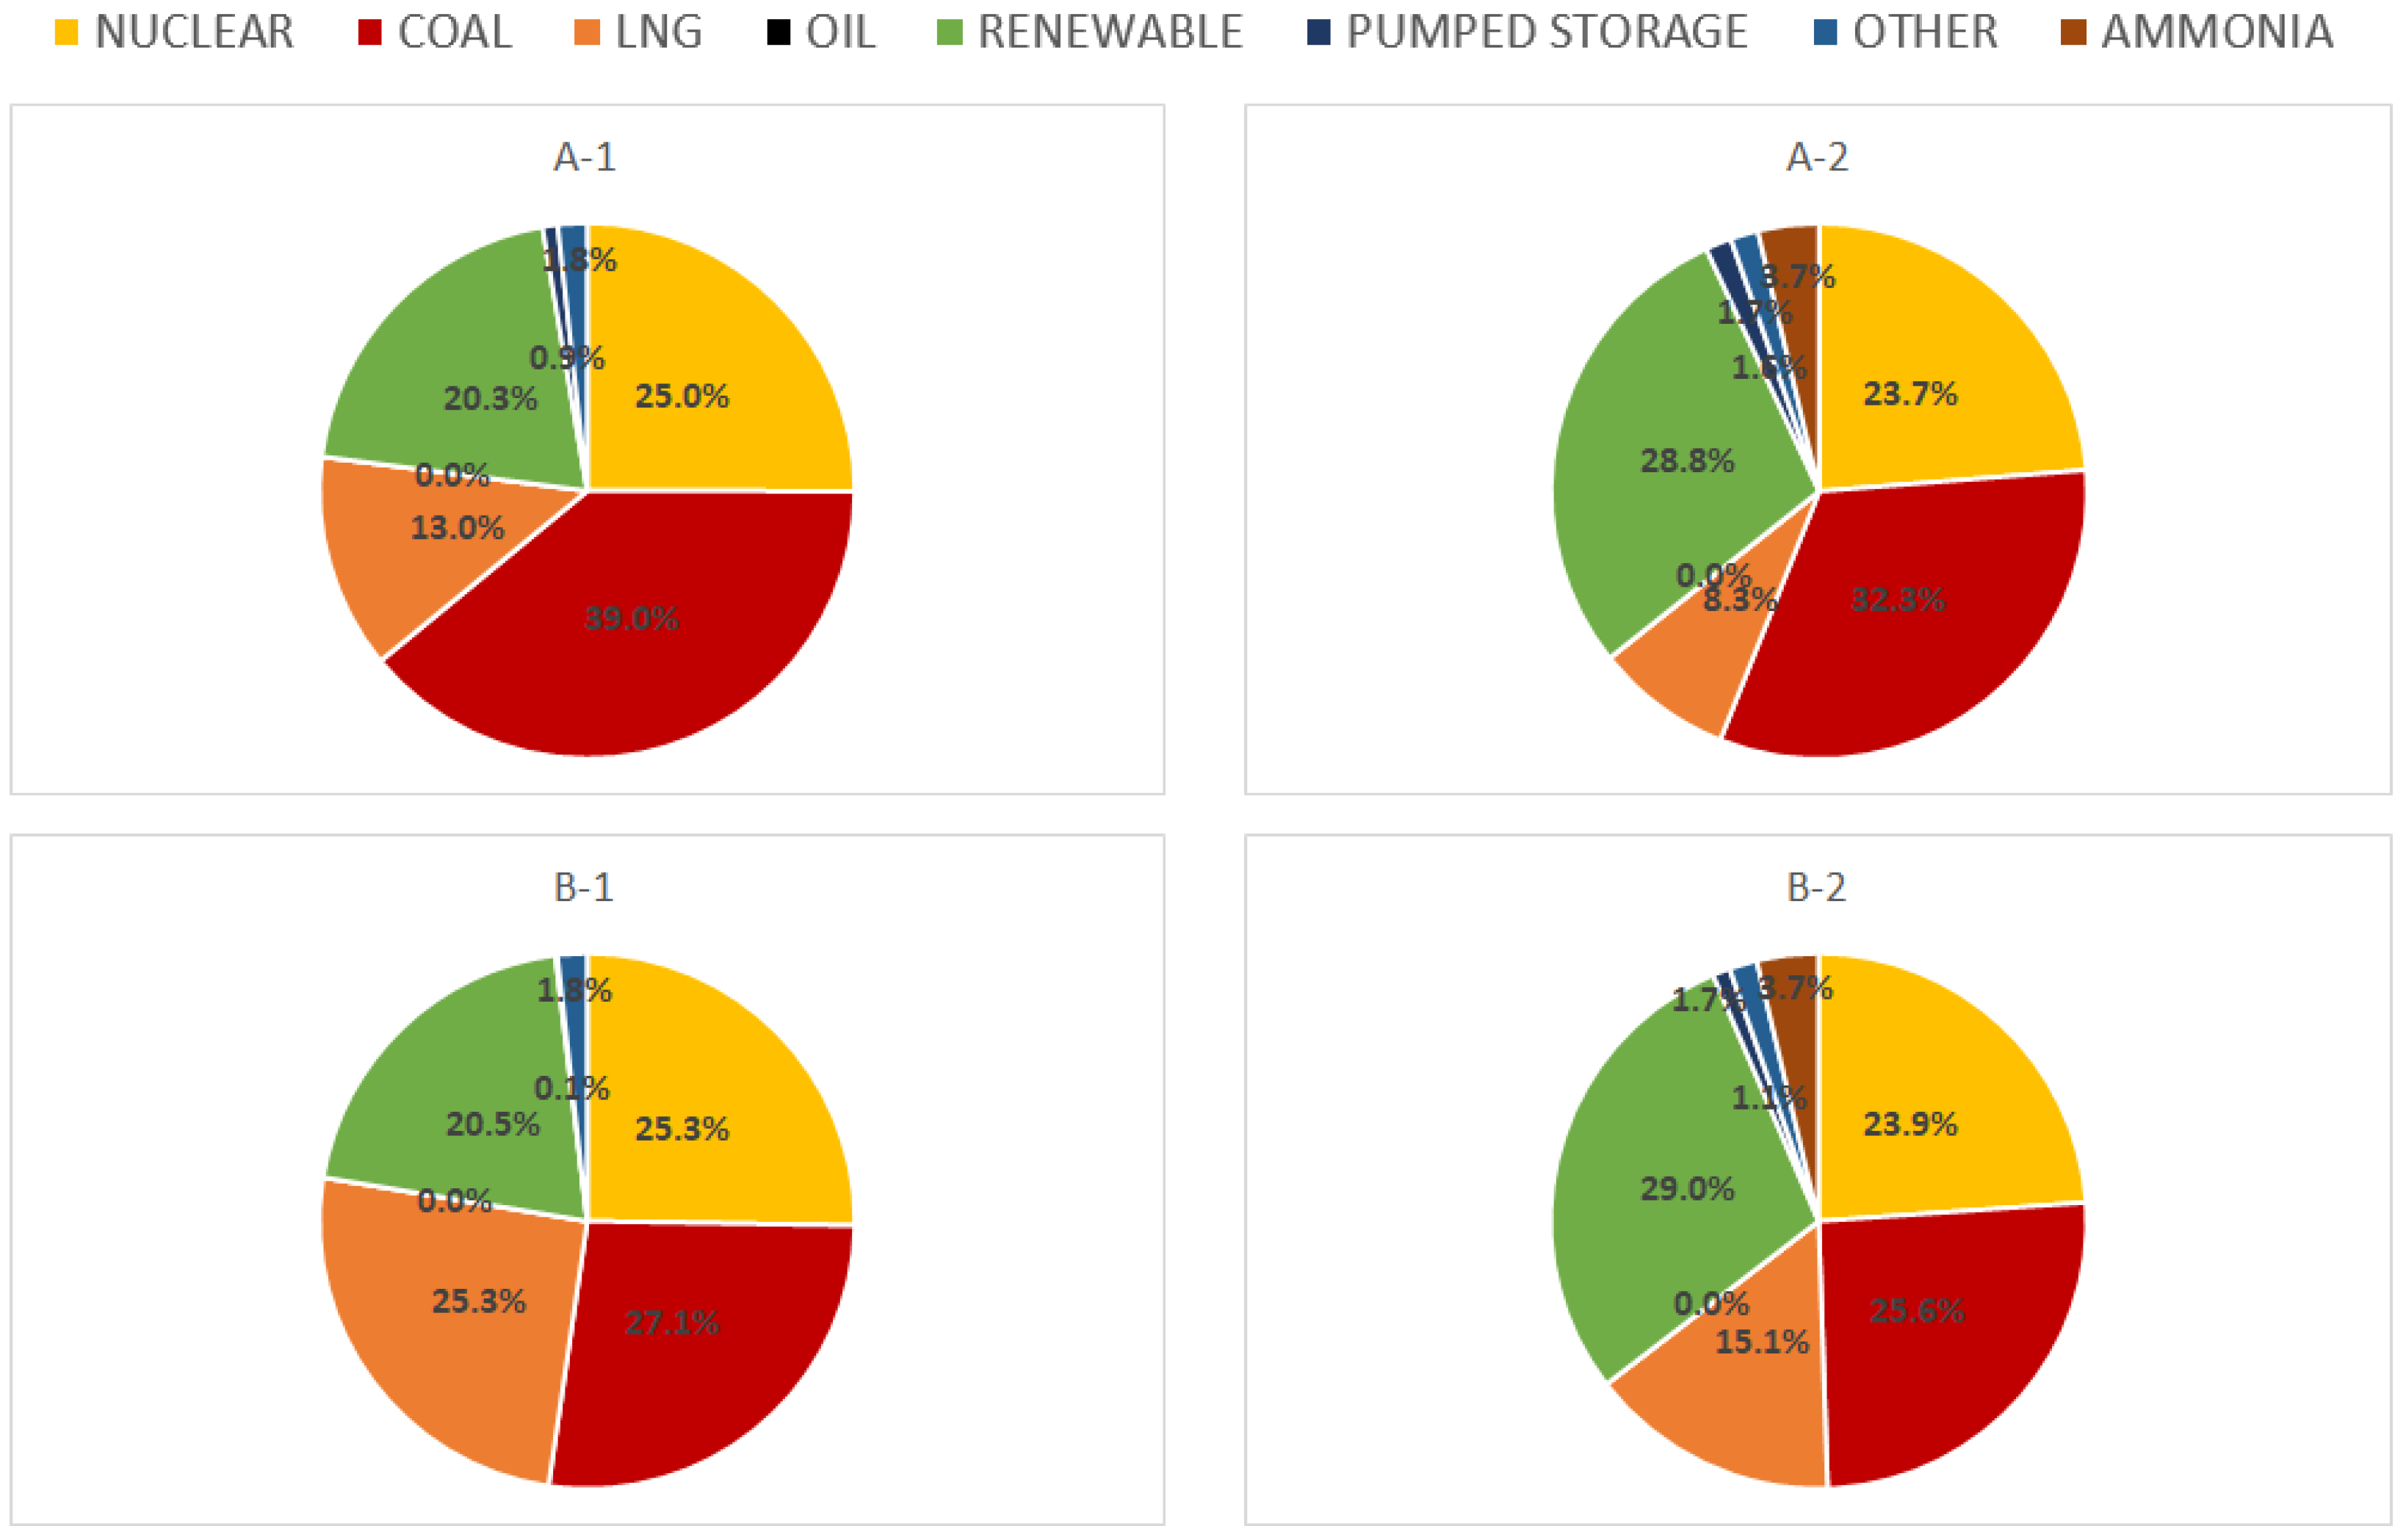
3.1. Generation Mix

The simulation results for each scenario are shown in Figure 5. PLEXOS also considers the curtailment of renewable energy. In this study, the curtailment happens due to the assumption that nuclear plants cannot rapidly increase and decrease their generation. As a result, the share of renewable energy generation was simulated to be lower than the input of the 9th BPE and updated NDC input. In the scenarios based on the 9th BPE, coal provides the most electricity (39.0%, 27.1%, 27.1%, 26.5%) in all scenarios (A-1, B-1, C-1, and D-1). LNG has between 13.0% of the generation share in A-1 and 26.9% in C-1, depending on renewable coal generation. Scenario D-1 achieves a 0.5% higher share than scenario B-1 to meet the 9th BPE’s emission target.
Among the scenarios based on the updated NDC, renewable energy generation took up the largest proportion in B-2, C-2, and D-2. In Scenario A-2, which considers cost minimization without constraints, the share of coal was still higher than that of renewable energy generation. The share of coal generation in X-2 decreases compared to X-1 because of ammonia co-firing and renewable penetration. Additionally, LNG in A-2 has the smallest share of generation due to the increase in renewable energy. To accomplish the new emission target, the share of LNG in D-2 increased at least 7.5% compared to B-2.
Table 7 shows the simulation results of all scenarios. To achieve 192.6 MT in the planned power mix, the capacity factor (CF) of coal must be lower than 53.9%, and to achieve the updated NDC target, the CF of coal must be lower than 38.8%, assuming that renewable energy is supplied as planned.

3.2. CO2 Emission

Figure 6 shows the historical CO2 emission trajectories and short-term forecasts until 2030 based on the 9th BPE and the updated NDC. Emissions from the electricity sector in 2020 were estimated to decrease by 31 million tons (12.4%) compared to the previous year due to a 1.9% decrease in electricity consumption caused by COVID-19, a 13.6% decrease in coal power generation, and a 12.2% increase in renewable energy generation.
Scenario A-1 was projected to peak at 260 million tons in 2021. From 2024 to 2029, nearly 240 million tons per year are expected, and finally, 233 million tons was forecasted in 2030. In scenario B-1, as renewable generation increases and coal generation decreases, CO2 emission is projected to decrease by 16.4% compared to scenario A-1; however, it is expected that the target of 192.6 million tons cannot be achieved. Due to constraints, only Scenario D-1 was able to meet the emission target. According to the scenario, the average CO2 intensity of electricity generation in 2030 will be 0.410, 0.346, 0.352, and 0.342 kgCO2/kWh.
Although electricity demand increased in the X-2 scenarios, the effect of increasing renewable energy was greater, and CO2 emissions in the X-2 scenarios decreased compared to those in X-1 scenarios. In 2030, scenario A-2 expects 197.8 million tons, but it will fall short of both the 9th BPE and the updated NDC targets. This means that it is difficult to achieve emission targets by only increasing renewables, so additional reduction measures must be adopted. In scenarios B-2 and C-2, the 9th BPE’s target was achieved, but not the target of the updated NDC. The CO2 intensity of electricity generation in 2030 is calculated to be 0.330, 0.294, 0.300, and 0.253 kgCO2/kWh in X-2 scenarios.

3.3. Total Generation Cost

Figure 7 shows the total generation costs of all scenarios. The total generation costs in 2030 for B-1, C-1, and D-1 increased by 109.8%, 113.6%, and 109.2%, respectively, when compared to scenario A-1. To meet the CO2 emission target, generation mode operation of pumped hydro storages was increased in D-1.
However, pumping load of D-1 was significantly smaller than in B-1, resulting in a lower total demand in the simulation than in B-1. Although the generation share increased by replacing coal with LNG, the total energy of D-1 was smaller than that of B-1, so the total generation cost was simulated to be lower in D-1 than in B-1, when compared to scenario A-1. However, the cumulative cost for 10 years was 109.2% for D-1 and 108.9% for B-1. On the other hand, C-1 and C-2 show that a slowdown in renewable investment can increase total costs drastically.
Due to the electrification, the electricity demand increased in scenarios A-2~D-2, but the total costs in them decreased because of the high penetration of renewable energy. Additionally, total generation costs in scenario B-2~D-2 are 106.6%, 111.4% and 113.4% of that in scenario A-2. Compared to A-2, The accumulated costs of B-2, C-2, and D-2 are ranked in ascending order at 108.1%, 110.3%, and 114.0%.

4. Conclusions

We have organized several scenarios and estimated CO2 emissions in each scenario to check whether the national GHG reduction target could be accomplished and compared the total costs of each scenario. As was reviewed through scenarios, it was found that the emission target cannot be accomplished. There are various options for reducing CO2 emissions, including the construction of new nuclear plants, increasing the share of renewable energy, strengthening demand-side management, and fuel conversion of coal into LNG. Among these, fuel conversion was selected in D-1 and D-2 scenarios. Additionally, it was identified that a significant proportion of replacement between coal and natural gas was necessary to achieve the NDC goal. Thus, natural gas demand for generation will increase further to meet the emission target. However, this option may incur considerable costs. When we consider the rapid rise in fuel prices, the costs may increase more than in this analysis. Thus, this option may require a national consensus especially from final consumers who have to pay the increased costs. In addition, it is necessary to review whether the LNG infrastructure is sufficiently planned to meet the natural gas demand. On the other hand, the results may underestimate CO2 emissions compared to that in real power systems because this study did not consider the minimum coal generation requirement for the secure power system operation. In conclusion, additional policy measures and advanced technology may be needed to further reduce CO2 emissions. However, the only possible option to achieve the short-term goal, considering energy security, economic costs, and industrial impact, is a reduction in coal generation.
As part of future work, we plan to examine the integration costs caused by the renewables’ volatility and impact of advanced technologies, including CCUS.

Author Contributions

Conceptualization, W.-C.J., J.H.R. and J.-B.P.; methodology, W.-C.J., D.-H.L., J.H.R. and J.-B.P.; software, W.-C.J. and D.-H.L.; validation, W.-C.J., D.-H.L., J.H.R. and J.-B.P.; writing—original draft preparation, W.-C.J.; writing—review and editing, D.-H.L., J.H.R. and J.-B.P. All authors have read and agreed to the published version of the manuscript.

Funding

This work was supported by the 2019 basic research and development project grant from Korea Electric Power Corporation (KEPCO) (Project No.: R19XO02-02).

Data Availability Statement

Not applicable.

Acknowledgments

This work was supported by the Human Resources Program in Energy Technology of the Korea Institute of Energy Technology Evaluation and Planning (KETEP) and the Ministry of Trade, Industry and Energy (MOTIE) of the Republic of Korea (No. 20204010600220).

Conflicts of Interest

The authors declare no conflict of interest.

References

  1. Ministry of Trade, Industry and Energy (MOTIE). The 9th Basic Plan of Electricity Supply and Demand; Ministry of Trade, Industry and Energy (MOTIE): Sejong, Korea, 2020. [Google Scholar]
  2. The Government of the Republic of Korea. 2050 Carbon Neutral Strategy of the Republic of Korea; The Government of the Republic of Korea: Seoul, Korea, 2020.
  3. Ministry of Trade, Industry and Energy (MOTIE). The 8th Basic Plan of Electricity Supply and Demand; Ministry of Trade, Industry and Energy (MOTIE): Sejong, Korea, 2017.
  4. Ministry of Trade, Industry and Energy (MOTIE). Third Energy Master Plan; Ministry of Trade, Industry and Energy (MOTIE): Sejong, Korea, 2019.
  5. Ministry of Economy and Finance (MOEF). The Korean New Deal National Strategy for a Great Transformation; Ministry of Economy and Finance (MOEF): Sejong, Korea, 2020.
  6. United Nations Framework Convention on Climate Change (UNFCCC). The Republic of Korea’s Enhanced Update of Its First Nationally Determined Contribution; United Nations Framework Convention on Climate Change (UNFCCC): Bonn, Germany, 2021.
  7. Jeong, W.C.; Lee, D.H.; Roh, J.H.; Park, J.B. Scenario Analysis of the CO2 Emissions in the Electricity Sector in South Korea. In Proceedings of the APAP 2021 Conference, Jeju, Korea, 11–14 October 2021. [Google Scholar]
  8. Baek, M.; Kim, S. Nationally Determined Contributions Target Achievement and Its Impact on National Energy System. J. Korean Soc. Miner. Energy Resour. Eng. 2018, 55, 452–465. [Google Scholar] [CrossRef]
  9. Hong, J.H.; Kim, J.; Son, W.; Shin, H.; Kim, N.; Lee, W.K.; Kim, J. Long-Term Energy Strategy Scenarios for South Korea: Transition to a Sustainable Energy System. Energy Policy 2019, 127, 425–437. [Google Scholar] [CrossRef]
  10. Choi, W.; Yoo, E.; Seol, E.; Kim, M.; Song, H.H. Greenhouse Gas Emissions of Conventional and Alternative Vehicles: Predictions Based on Energy Policy Analysis in South Korea. Appl. Energy 2020, 265, 114754. [Google Scholar] [CrossRef]
  11. Lim, J.; Kim, D.K. A Study on Korea’s Remaining GHG Emissions Allowance and Capped-Emissions Trajectories under the Paris Agreement Goal. J. Clim. Chang. Res. 2021, 12, 255–270. [Google Scholar] [CrossRef]
  12. Oh, J.-G. Comparative Analysis of the 2030 GHG Reduction Target for Eleven Major Countries and Its Implications. J. Clim. Chang. Res. 2018, 9, 357–368. [Google Scholar] [CrossRef]
  13. Ko, D. Evaluation of Korea’s Mid- and Long-Term Greenhouse Gas Mitigation Targets: Meta-Analysis of Burden Sharing Based on Equity. J. Clim. Chang. Res. 2021, 12, 493–504. [Google Scholar] [CrossRef]
  14. Energy Exemplar, PLEXOS Simulation Software. 2021. Available online: https://energyexemplar.com/ (accessed on 12 July 2021).
  15. Cleary, B.; Duffy, A.; O’Connor, A.; Conlon, M.; Fthenakis, V. Assessing the Economic Benefits of Compressed Air Energy Storage for Mitigating Wind Curtailment. IEEE Trans. Sustain. Energy 2015, 6, 1021–1028. [Google Scholar] [CrossRef] [Green Version]
  16. Collins, S.; Deane, J.P.; Ó Gallachóir, B. Adding Value to EU Energy Policy Analysis Using a Multi-Model Approach with an EU-28 Electricity Dispatch Model. Energy 2017, 130, 433–447. [Google Scholar] [CrossRef]
  17. Denny, E.; O’Mahoney, A.; Lannoye, E. Modelling the Impact of Wind Generation on Electricity Market Prices in Ireland: An Econometric versus Unit Commitment Approach. Renew. Energy 2017, 104, 109–119. [Google Scholar] [CrossRef]
  18. Zappa, W.; Junginger, M.; van den Broek, M. Is a 100% Renewable European Power System Feasible by 2050? Appl. Energy 2019, 233–234, 1027–1050. [Google Scholar] [CrossRef]
  19. Tomšić, Ž.; Raos, S.; Rajšl, I.; Ilak, P. Role of Electric Vehicles in Transition to Low Carbon Power System—Case Study Croatia. Energies 2020, 13, 6516. [Google Scholar] [CrossRef]
  20. Huang, J.; Purvins, A. Validation of a Europe-Wide Electricity System Model for Techno-Economic Analysis. Int. J. Electr. Power Energy Syst. 2020, 123, 106292. [Google Scholar] [CrossRef]
  21. Brinkerink, M.; Gallachóir, B.; Deane, P. Building and Calibrating a Country-Level Detailed Global Electricity Model Based on Public Data. Energy Strategy Rev. 2021, 33, 100592. [Google Scholar] [CrossRef]
  22. Dalala, Z.; Al-Omari, M.; Al-Addous, M.; Bdour, M.; Al-Khasawneh, Y.; Alkasrawi, M. Increased Renewable Energy Penetration in National Electrical Grids Constraints and Solutions. Energy 2022, 246, 123361. [Google Scholar] [CrossRef]
  23. Ramli, N.F.; Kamari, N.A.M.; Abd Halim, S.; Zulkifley, M.A.; Sahri, M.S.M.; Musirin, I. A Non-Convex Economic Dispatch Problem with Point-Valve Effect Using a Wind-Driven Optimisation Approach. J. Electr. Eng. Technol. 2022, 17, 85–95. [Google Scholar] [CrossRef]
  24. Vasiyullah, S.F.S.; Bharathidasan, S.G. Profit Based Unit Commitment of Thermal Units with Renewable Energy and Electric Vehicles in Power Market. J. Electr. Eng. Technol. 2021, 16, 115–129. [Google Scholar] [CrossRef]
  25. Energy Exemplar, PLEXOS User Manual. 2021. Available online: https://xpert.energyexemplar.com/ (accessed on 10 December 2021).
  26. Deane, J.P.; Drayton, G.; Ó Gallachóir, B.P. The Impact of Sub-Hourly Modelling in Power Systems with Significant Levels of Renewable Generation. Appl. Energy 2014, 113, 152–158. [Google Scholar] [CrossRef]
  27. Kim, T.H.; Shin, H.; Kim, W.; Cho, K.; Lee, S. Consideration of a Combined Cycle Gas Turbine’s Operating Modes in Pricing Mechanisms: A Korean Electricity Market Study. J. Electr. Eng. Technol. 2019, 14, 1919–1931. [Google Scholar] [CrossRef]
  28. Min, C.G.; Kim, M.K. Flexibility-Based Evaluation of Variable Generation Acceptability in Korean Power System. Energies 2017, 10, 825. [Google Scholar] [CrossRef] [Green Version]
  29. KEEI. A Study on the Achievement of Long-Term Greenhouse Gas Reduction Goals in Power Sector (KOREAN); KEEI: Seoul, Korea, 2016. [Google Scholar]
  30. Electric Power Statistics Information System (EPSIS). 2022. Available online: http://epsis.kpx.or.kr/ (accessed on 3 January 2022).
Figure 1. Historical GHG emissions, emission target of Korea, and 2050 net-zero [6].
Energies 15 03310 g001
Figure 2. The procedure of data collection and analysis.
Energies 15 03310 g002
Figure 3. A historical hourly capacity factor of 2019: (a) PV; (b) Wind.
Energies 15 03310 g003
Figure 4. Historical demand and projection.
Energies 15 03310 g004
Figure 5. The 2030 generation mix results.
Energies 15 03310 g005aEnergies 15 03310 g005b
Figure 6. Projected annual CO2 emission trajectories of all scenarios.
Energies 15 03310 g006
Figure 7. Total generation cost of all scenarios (a) 10 years; (b) target year.
Energies 15 03310 g007
Table 1. Simulation input data.
ClassDetailsReference
DemandAnnual Peak/Energy9th BPE [1]
Hourly Load pattern (‘20)KPX
ThermalCapacity9th BPE
Technical DataEPSIS/KEPCO/[25]
RenewableAnnual Energy9th BPE
PV, Wind Hourly pattern (‘19)OGD
Fuel2018~2020 AverageEPSIS
EmissionEmission factor (kg/kWh)KEEI [27]
Table 2. Assumed installed capacity mix in the Korean power system.
Resource2019 (Actual)2030 (9th Plan)2030 (Updated NDC)
Capacity [MW]Share [%]Capacity [MW]Share [%]Capacity [MW]Share [%]
Nuclear23,25018.520,40011.820,4009.1
Coal36,99229.532,61218.932,61214.6
LNG39,65531.655,49632.155,49624.8
RES15,79112.658,04333.6103,88446.4
PSH47003.752003.052002.3
Other49504.112370.612370.6
Ammonia----50002.2
Sum125,338100172,988100 223,829100
Table 3. Peak demand and electricity consumption of 9th BPE and NDC.
YearThe 9th BPEUpdated NDC
Electricity Consumption (GWh)Peak Demand (GW)Electricity Consumption (GWh)Peak Demand (GW)
2019520,499 90,314 520,499 90,314
2026532,767 97,582 537,88098,519
2030542,307 100,383 567,000104,954
Table 4. Greenhouse gas emission factor.
Emission FactorCoalLNGOilNuclearRESAmmonia
CO2 [tCO2/MWh]0.850.380.70000
Table 5. Fuel Price (2019~2021 average).
Fuel PriceNuclearBituminousAnthraciteOilLNG
[KRW/Gcal]2444 24,165 25,361 71,030 49,788
Table 6. Scenario design for emission estimation.
X-1DetailsX-2Details
A-1Based on the 9th BPE without constraintA-2Based on the updated NDC without constraint
B-1A-1+ CF limit of Coal
‘21~’25 60%, ‘26~’30 55%
B-2A-2 + CF limit of Coal
‘21~’25 60%, ‘26~’30 55%
C-1B1 + slow deployment (75%)C-2B-2 + slow deployment (75%)
D-1A-1 + GHG emission constraintsD-2A-2 + GHG emission constraints
Table 7. Average capacity factor of 2030.
CF [%]A-1B-1C-1D-1A-2B-2C-2D-2
NUCLEAR83.7
COAL80.155.055.053.969.955.055.038.8
LNG15.129.231.029.810.118.420.327.5
OIL-
RENEWABLE22.722.722.722.719.019.018.819.0
PSH11.51.61.42.020.713.812.69.9
OTHER67.3
AMMONIA-50.5
Publisher’s Note: MDPI stays neutral with regard to jurisdictional claims in published maps and institutional affiliations.

