Article

On the Design and Topology Selection of Permanent Magnet Synchronous Generators for Natural Impedance Matching in Small-Scale Uncontrolled Passive Wind Generator Systems

by
Casper J. J. Labuschagne
* and
Maarten J. Kamper
Department of Electrical and Electronic Engineering, Stellenbosch University, Stellenbosch 7600, South Africa
*
Author to whom correspondence should be addressed.
Energies 2022, 15(5), 1888; https://doi.org/10.3390/en15051888
Submission received: 5 January 2022 / Revised: 6 February 2022 / Accepted: 25 February 2022 / Published: 4 March 2022
(This article belongs to the Special Issue Wind Energy Technologies Development)

Abstract

:
Small-scale uncontrolled passive wind generator systems are an attractive solution for rural energy generation because of the system’s reliability and low cost. However, designing these uncontrolled wind generators for good power matching with the wind turbine is challenging and often requires external impedance matching. In this paper, permanent magnet generators with different stator and rotor structures were investigated and designed to increase the generator’s synchronous inductance for a natural impedance matching. For the design methodology, multi-objective optimisation was used to design the generators for near-maximum turbine power matching, whereby internal impedance matching was reached as much as possible. It was shown that altering the placement and orientation of the permanent magnets in the rotor is a viable method to achieve the desired impedance matching; however, these generators do not have the best performance. It was found that the surface-mounted permanent magnet generator with semi-closed slots was the optimum topology. An optimised generator prototype was tested for the experimental validation. All designs were verified by comparing the results of 2D and 3D finite-element analysis.

1. Introduction

Energy generation for and the electrification of rural communities and farms are still some of the main socio-economic issues in developing countries. Especially for Sub-Sahara African countries, where it is estimated that a relatively small percentage of the rural population currently has access to electricity. In this context of rural energy generation and with the goal of climate change mitigation, distributed small-scale wind generator systems are an attractive option for independent AC or DC microgrids and can easily be deployed where there is no utility grid connection. However, reports have shown that these small-scale wind generator systems need to be more cost effective [1,2]; hence, there are currently incentives such as those outlined in [3] to make small-scale wind energy technology more cost competitive.
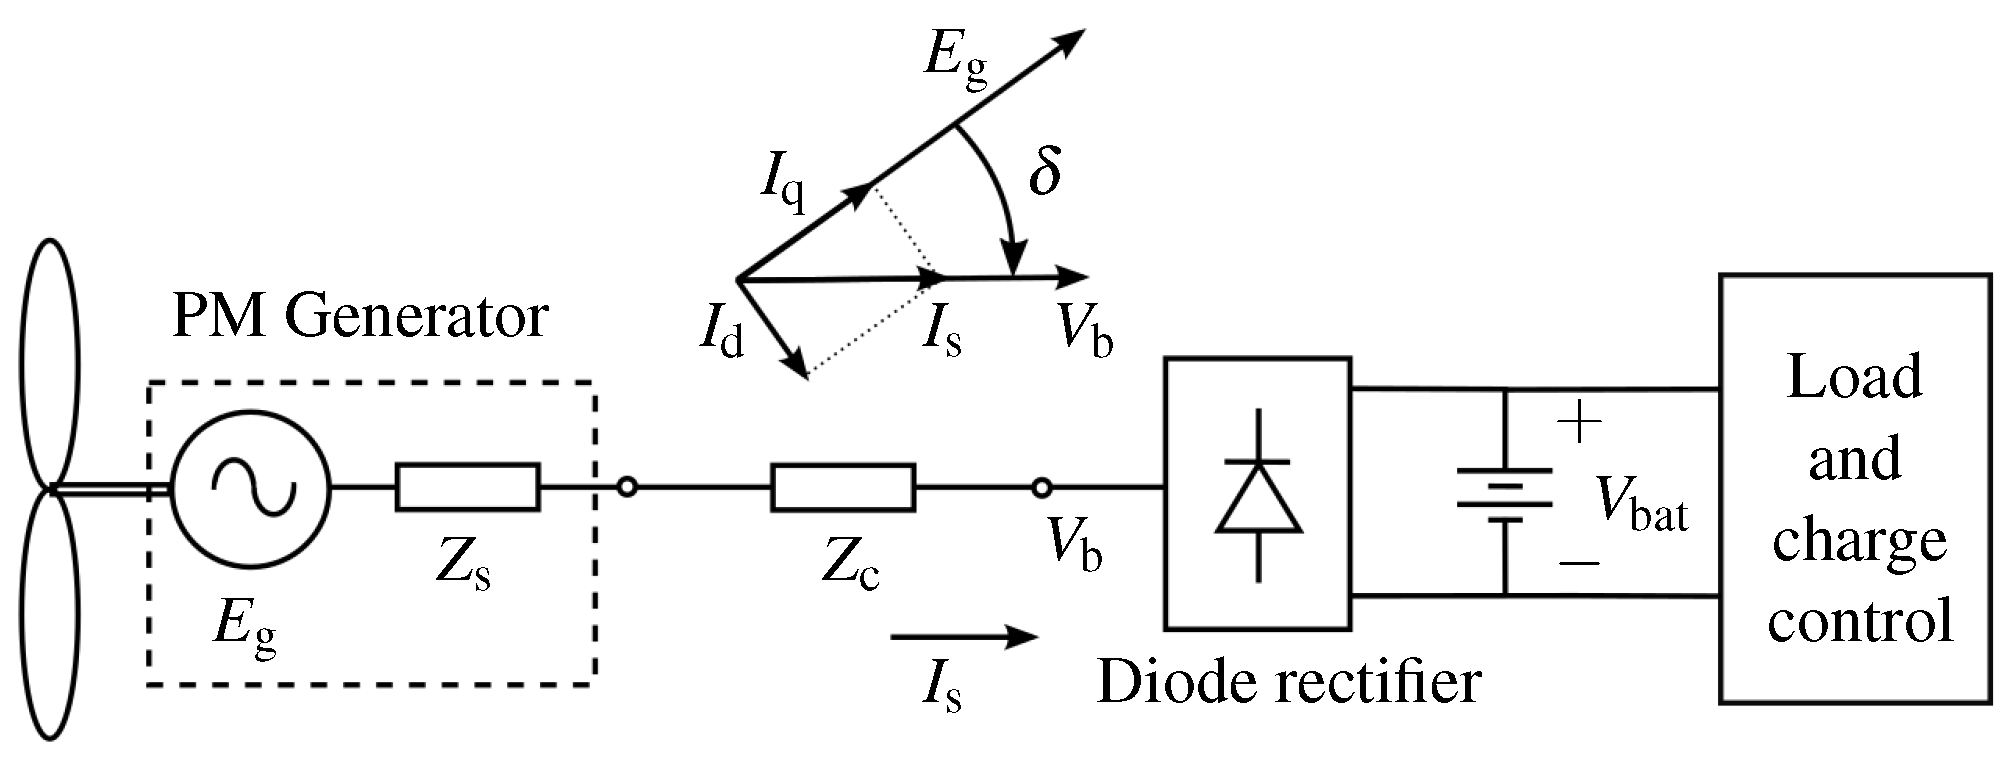
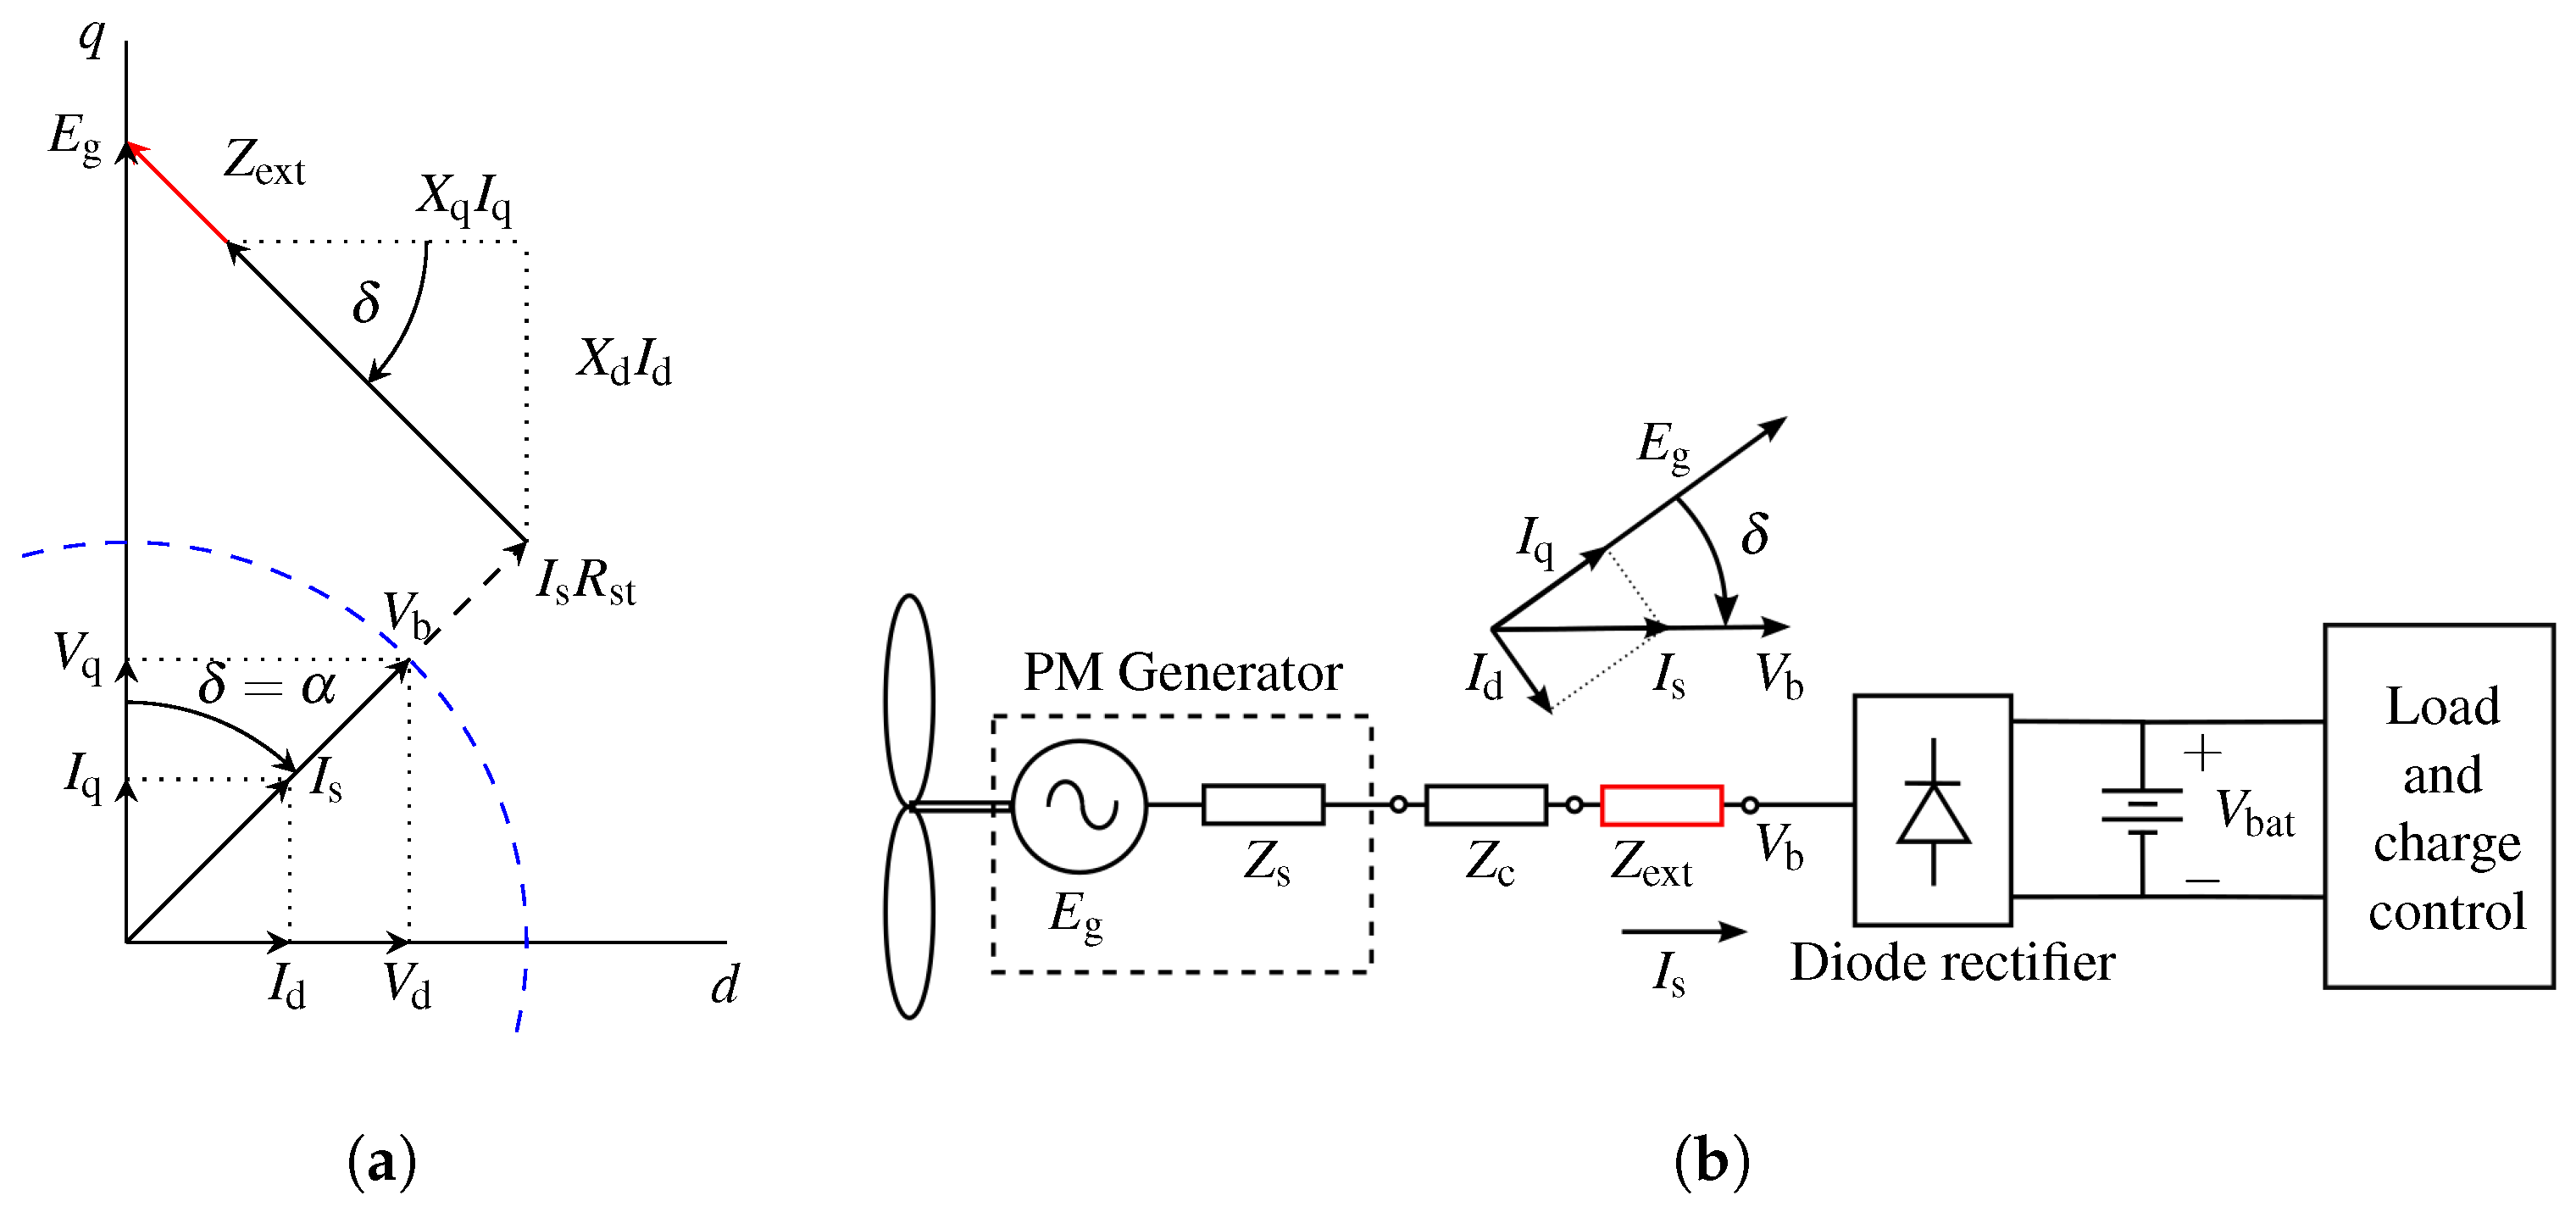
The small-scale uncontrolled passive wind generator system shown in Figure 1 is ideal for these rural applications. In Figure 1, only a diode bridge rectifier is used to directly connect the wind generator to the battery storage. Thus, the passive system uses minimal power electronics and is therefore conceivably more cost effective. The power electronics in small-scale wind energy systems are also the components most prone to failure [4,5]. The passive system in Figure 1 is therefore potentially more reliable, also reducing the operation and maintenance costs. The preferred generator technology for these small-scale systems is the permanent magnet synchronous generator (PMSG) [6]. However, because the system is uncontrolled, it is challenging to design the wind generator to have good power matching with the wind turbine. Therefore, the focus in this paper was on designing PMSGs for these small-scale passive wind energy systems.
Small-scale wind generator systems are deployed according to the need, and not necessarily at the optimum wind site, as in the case of utility-scale wind farms. Therefore, it is imperative that the wind generator matches well the available power from the wind turbine at lower wind speeds. Failure in this regard was highlighted by [7] as a major issue with current small-scale wind energy systems. Therefore, the design approach for the uncontrolled passive PMSGs, as in [8,9,10], where the wind generator was optimally designed according to a perceived “typical wind cycle”, does not guarantee good power matching at low wind speeds and is not always considered ideal. In [11], the wind turbine’s parameters were adjusted according to the generator to improve power matching. However, changing the wind turbine’s parameters is not desirable. The challenge then, when designing these PMSGs, is to ensure good power matching with the wind turbine at lower wind speeds, as well as maximum power matching at the rated wind speed. It should also be noted that the PMSGs in [8,9,10,11] were all for power ratings lower than 1.5 kW.
In terms of the design optimisation strategy for the PMSGs, there are multiple approaches found in the literature. As already discussed, there are those in [8,9,10,11] for a passive system. In a more general sense, the recent reviews in [12,13] on optimisation trends for electric machines highlighted that the use of genetic algorithms for multi-objective design optimisation approaches is favourable for design problems with several performance measures. Moreover, multi-objective design optimisation is the most common approach for wind generator design, e.g., [14,15,16,17]. In [14,15,16,17], the actively controlled wind generators with maximum power point tracking (MPPT) were optimised for a specified drive-cycle to maximise annual energy production. However, as outlined in the previous paragraph, site-specific design is not necessarily the best option for small-scale uncontrolled wind generators. The generators in these small-scale uncontrolled passive wind energy systems must be designed to be geographically independent. Therefore, in this case, the main design problem is to match the wind generator’s power with that of the wind turbine at lower wind speeds and at the specified rated operating point.
In [18], a method of external impedance matching was used to match the wind generator’s power with the wind turbine, whereby an external inductance impedance was connected between the generator and the diode rectifier, shown in Figure 1. Although this method can be used effectively, as was done in [18,19], the additional external inductor is an unwanted component to the system. This incentivised the investigation performed in [20], which was to design PMSGs for a natural impedance matching the wind turbine, i.e., where the internal synchronous inductance of the PMSG alone was sufficient for good power matching. Hence, this paper is an extension of the work performed in [18,20] and forms part of an overarching study on PMSGs for passive wind generator systems.
In this paper, various methods of designing the PMSG to have an increased synchronous inductance for a natural impedance matching were investigated. These methods included altering the placement and orientation of the PMs in the rotor to change the magnetic saliency of the PMSG, as well as the stator slot’s structure to increase leakage flux. The various PMSG structures were designed for a sub-5 kW passive wind generator system, using a unique design methodology that ensured that the desired power matching with the wind turbine was achieved. The overall performance and cost effectiveness of the designed PMSGs were then evaluated to determine the optimal solution for this application. The results in this paper were validated with the experimental results of an optimally designed PMSG prototype.

2. Passive Wind Generator System

In this section, the wind generator specifications and equivalent circuit modelling are discussed. An analytical approximation for the impedance matching requirement is also given.

2.1. System Specifications

The wind turbine power versus turbine speed curves for a 4.2 kW passive wind generator system are shown in Figure 2. Shown also in Figure 2 is the maximum available turbine power that can be extracted from the wind (power curve A). Typically, generator operation along power curve A can be achieved by using an actively controlled synchronous rectifier in the system with MPPT. However, in the case of the uncontrolled passive system, the PMSG needs to be designed to match naturally the wind turbine power. Power curve B, in Figure 2, emulates power curve A at the cut-in speed and maximum rated power, showing the desired operation of the PMSG for the passive system. Thus, two operating points were specified for the PMSG’s design, i.e., (i) the cut-in speed operating point, n c , at which the PMSG starts supplying power to the battery storage and (ii) the rated speed operating point, n r , where the rated power is generated. The cut-in and rated operating points are indicated in Figure 2, and the system’s specifications are summarised in Table 1.

2.2. Wind Turbine

The wind turbine data in Figure 2 are for a horizontal axis wind turbine (HAWT). A schematic of the nacelle’s assembly is shown in Figure 3. The wind turbine’s blades and the PMSG were mounted off-centre in relation to the tower and tail vane, as shown in Figure 3b. Under extreme conditions, the wind pushes the turbine and generator out of the wind and against the tail mechanism, which stays in line with the wind direction. In this way, the input power from the wind turbine is lowered, and system protection is provided. Furthermore, the HAWT’s nacelle has an uncontrolled full degree of rotation and, therefore, requires brush slip rings for power transmission.

2.3. Impedance Matching

Because it is an uncontrolled passive system, the internal impedance of the PMSG, Z s in Figure 1, needs to match correctly the battery storage (note that this is without external impedance matching). This then ensures that the PMSG’s generated power matches the available wind turbine power at the rated operating point, n r . Consider the following theoretical estimation of the necessary impedance:
The PMSG was modelled in the dq-reference frame. From the dq-equivalent circuits in Figure 4, the steady-state dq-equations in generator mode are:
V q = R st I q ω e L d I d + ω e λ PM = R st I q ω e L d I d + E g V d = R st I d + ω e L q I q .
In Equation (1) and Figure 4, ω e is the synchronous electrical speed, λ PM is the PM flux linkage, E g is the induced generator voltage, and R st is the total per-phase resistance, which includes the PMSG’s stator resistance, R i , and the combined resistance of the brush slip rings and the resistance of the transmission cable, R c . The phasor diagram for the passive system is shown in Figure 5a. In Figure 5a, the constrained terminal voltage, V b , is the fixed fundamental per-phase voltage on the AC side of the diode rectifier. Due to the diode rectifier, the passive system will always operate at a unity displacement power factor [21], i.e., I s and V b are in phase.
For simplification, it was further assumed that R st in (1) and Figure 5a is negligible. Therefore, we now have the phasor diagram in Figure 5b, and the voltage equations of (1) can be rewritten as:
V q = ω e L d I d + E g = X d I d + E g V d = ω e L q I q = X q I q .
At rated power, E g can be calculated using:
E g = a V b
with:
a = n r n c = 320 110 = 2.91 .
From Figure 5b, we also have:
cos ( δ ) = V b E g = 1 a δ = cos 1 1 a
and:
tan ( δ ) = V d V q = I d I q = X d I d X q I q X d X q = 1.0 .
Subsequently, by substituting a into (5) and then δ into (6), we have:
I d I q = tan ( 69.9 ° ) = 2.73
with V b = I s = 1.0 pu, the per-unit values at rated power can be calculated and are summarised in Table 2.
Although R st in Figure 5a cannot be ignored, the estimated per-unit results in Table 2 are remarkable in terms of how high the per-unit reactance must be to have the desired power matching. The required reactance at base speed is X d = X q = 2.73 / 2.91 = 0.94 pu, whereas surface-mounted PMSGs with non-overlapping windings have per-unit reactance values that are typically between 0.2 pu and 0.4 pu. Therefore, it is often necessary to add an external inductance, L ext , between the PMSG and the diode rectifier [18]. With external impedance matching, the dq-equations in (1) are then:
V q = R st I q ω e ( L d + L ext ) I d + ω e λ PM V d = R st I d + ω e ( L q + L ext ) I q .
However, as explained before, the external inductance in the passive system is an undesired component. To eliminate the necessity of L ext , careful consideration is needed when selecting the PMSG topology and the design of the PMSG in order to significantly increase the PMSG’s impedance (reactance).

3. PMSG Topologies

3.1. Machine Selection

For small-scale wind generators, it is important that the generator has a low cogging torque. The wind turbine torque at the low cut-in wind speed (3 m/s) has to overcome this cogging torque for the generator to start generating power. A good indicator for predicting whether a PMSG will have a small no-load cogging torque is the least common multiple (LCM) between the number of stator slots, Q s , and the number of poles, p. It generally holds true that the larger the value of the PMSG’s LCM, the smaller the no-load cogging torque will be.
Seeing that the machine selection was for a low-speed direct-drive application, PMSGs with fractional-slot concentrated (non-overlapping) windings are very attractive [22]. Non-overlapping winding PMSGs (NO-PMSGs) have shorter end-winding lengths, resulting in less copper losses and a more compact mechanical structure [23]. Possible PMSG slot–pole combinations and their relevant characteristics are summarised in Table 3 for comparison. From Table 3, the best generator choice is the 30–28 PMSG. This particular combination has a good fundamental winding factor of k w 0.951 and a large LCM( Q s , p) compared to the other slot–pole combinations.

3.2. Stator Design

For the stator’s structure, it is advantageous to have open slots with rectangular teeth, as shown in Figure 6a. This allows for preformed coils to be used, which are easier to manufacture. However, as shown in Section 2.3, it is desired to increase the PMSG’s per phase synchronous inductance, L s , for improved power matching. Therefore, alterations can be made to the stator structure in an attempt to increase L s . Using rectangular semi-closed slots, as shown in Figure 6b, is one way to increase the PMSG’s synchronous inductance:
The per-phase synchronous inductance can be calculated as:
L s = L m ( 1 + τ d ) + L sl + L e ,
where L m is the magnetisation inductance, τ d is the differential harmonic leakage flux coefficient, L sl is the slot-leakage inductance, and L e is the end-winding inductance. The magnetisation inductance is given by:
L m = m ( W k w ) 2 d i l Fe μ 0 π p 2 g air K s ,
where m is the number of phases, W is the number of turns in series per phase, k w is the winding factor of the generator’s working harmonic, d i is the air gap diameter, l Fe is the axial stack length, g air is the resultant air gap length taking Carter’s factor into account, and K s is the saturation factor.
The slot-leakage inductance can be calculated as in [24,25], using:
L sl = 4 m Q s μ 0 l Fe W 2 λ uv .
Here, λ uv is the slot permeance factor for a double-layer non-overlapping winding with a vertical coil side arrangement,
λ uv k 1 h s 3 b s + k 2 h hs b o .
In (12), k 1 and k 2 are given by:
k 1 = 1 3 16 y q W q k 2 = 1 y q W 4 q
as in [24]. From (12) and the geometry definitions in Figure 6, it is shown theoretically that L sl , and therefore L s , can be increased by closing the stator slots and using a rectangular slot shape ( λ uv is inversely proportional to b s and b o ). PMSGs with a semi-closed stator slot structure are therefore more likely to meet the desired impedance matching requirements.
The differential harmonic leakage flux coefficient in (9) is calculated from the harmonic analysis and is given by:
τ d = n j ( k w n n ) 2 ( k w j j ) 2 .
The τ d values for the different slot–pole PMSGs are given in Table 3. Typically, PMSGs with non-overlapping windings have much larger τ d values than PMSGs with overlapping windings, which is another reason for using non-overlapping winding PMSGs for passive wind generator systems.

3.3. Rotor Design

In terms of the PM rotor structure, it is possible to increase the synchronous inductance by altering the placement and the orientation of the PMs in the rotor, thus effectively “building” the necessary external inductance into the PMSG. In [20], this was shown to be a valid approach for designing PMSGs to have a natural impedance matching in a passive wind generator system. The different rotor structures considered in this investigation are shown in Figure 7. Figure 7a shows the surface-mounted PM (S-PM) rotor; Figure 7b shows the embedded PM (E-PM) rotor; Figure 7c the interior-spoke-type PM (SP-PM) rotor. As a result of using interior PM rotors, there is a significant increase in stator magnetisation flux compared to that of an S-PM rotor. This also results in a larger difference between the direct-axis and quadrature-axis inductances of the machine (also referred to as the magnetic saliency) [25]. Typical machine saliency properties for the different rotor topologies in Figure 7 are summarised in Table 4.
Opting to use either surface (S-PM) or interior PM (E-PM and SP-PM) rotor structures has certain tradeoffs when it comes to manufacturing and machine performance. In the case of an S-PMSG, the PMs are exposed, whereas for the interior PM rotors, the PMs are protected and at a low risk of being damaged. Embedding the PMs in the rotor also has the additional advantage that the PMs are well protected against demagnetisation. It is also apparent from Figure 7 that the S-PMSG is more likely to use less iron material than the E-PMSG and SP-PMSG. The latter is an important design aspect, considering the need for a low top-tower mass.
Designing the SP-PMSG rotor as the one in [26] could reduce the active mass; however, it could also compromise the structural integrity of the PMSG. For the structural integrity of the SP-PM rotor in Figure 7c, the yoke needs support on at least one side of the interior embedded PM. It is shown in Figure 8 that the support section on the rotor yoke adds an additional path for stray leakage flux from the PMs. Shown also in Figure 8, there is a large component of leakage flux to the exterior air region of the rotor. The effect of the outer air region was not taken into account in [20], and it was later found to have a significant effect on the SP-PMSG’s performance and the outcome of the comparison.

4. Design and Optimisation

In this section, the design approach and methodology for the different PMSG topologies outlined in Section 3 is discussed. The PMSG topologies then were the S-PMSG, E-PMSG, and SP-PMSG with open slots and the S-PMSG, E-PMSG, and SP-PMSG with semi-closed rectangular slots.
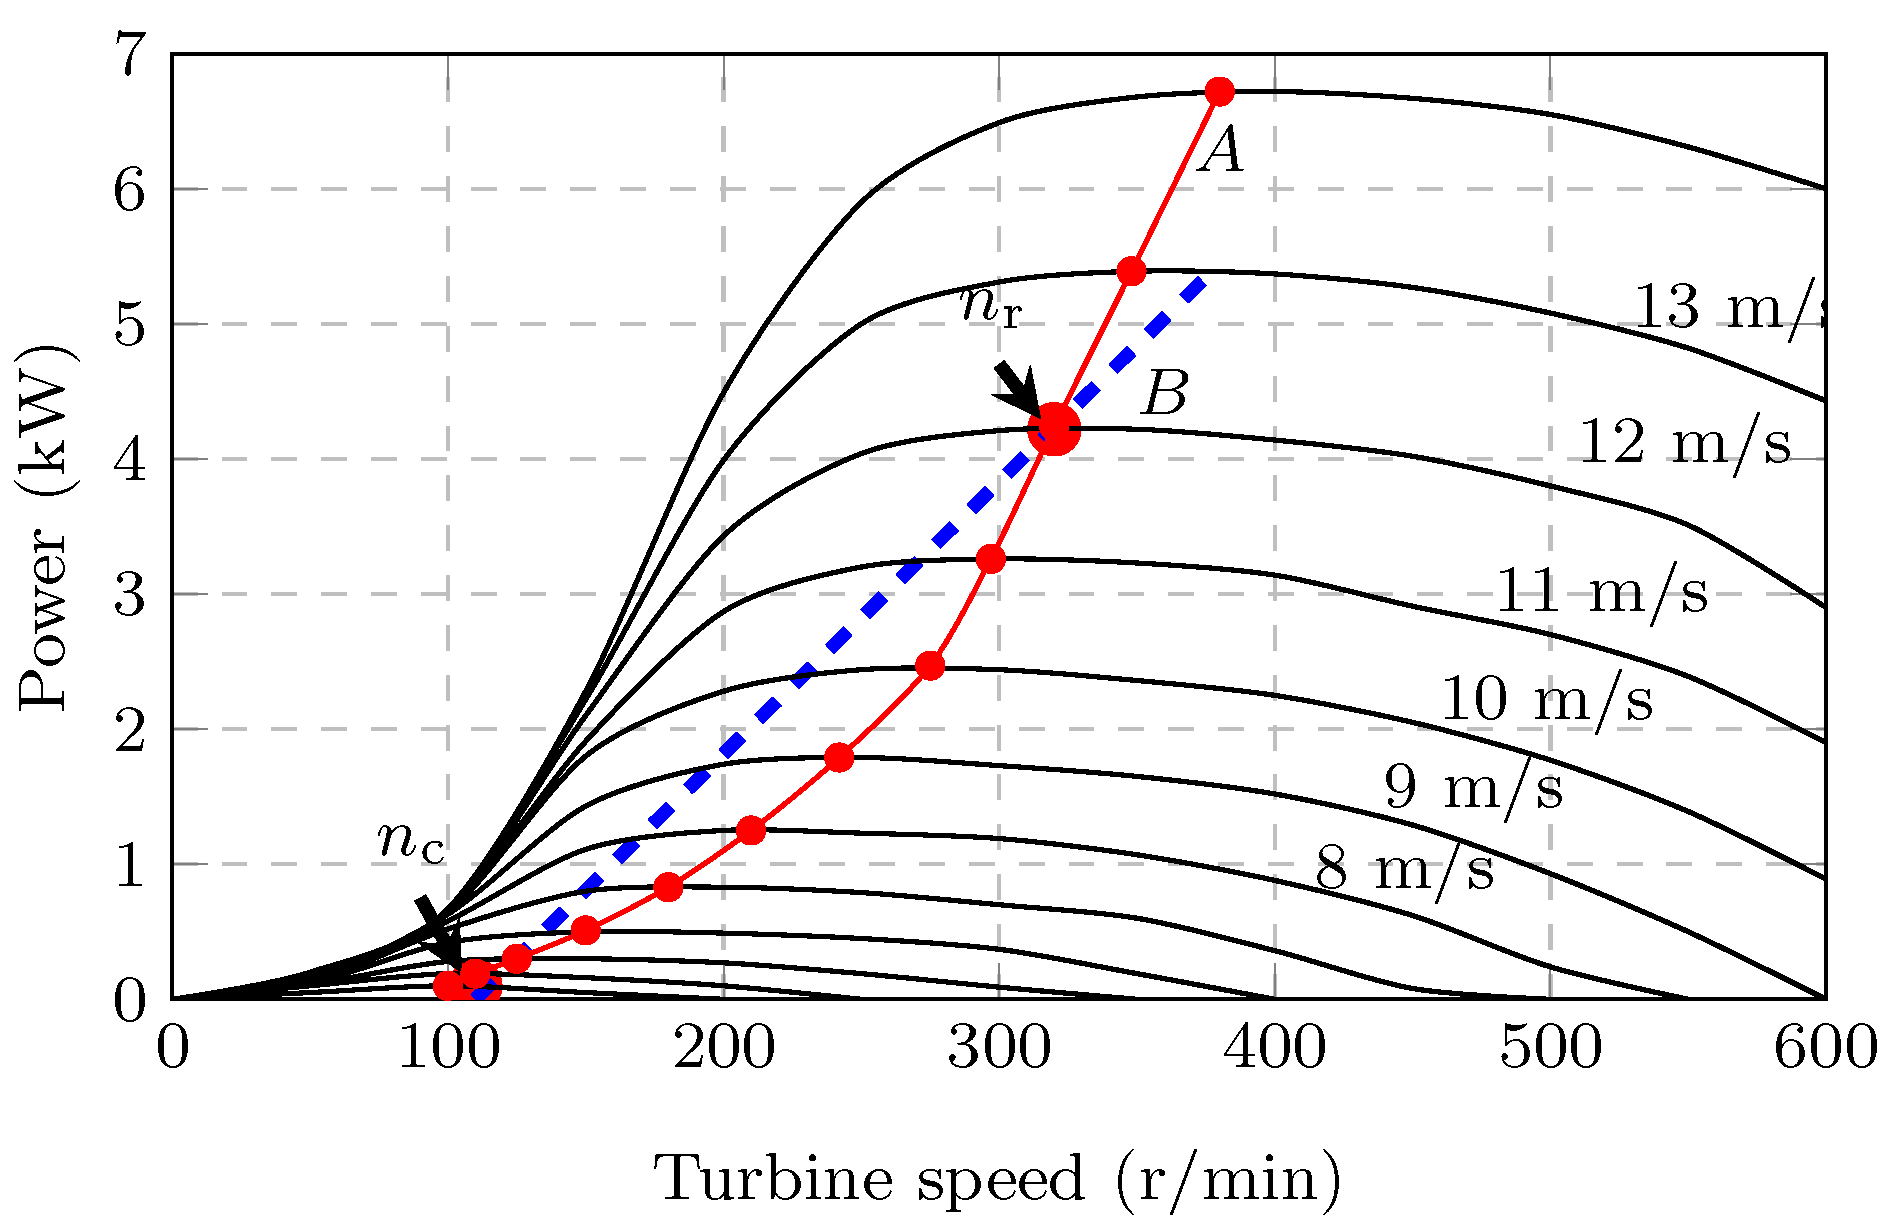
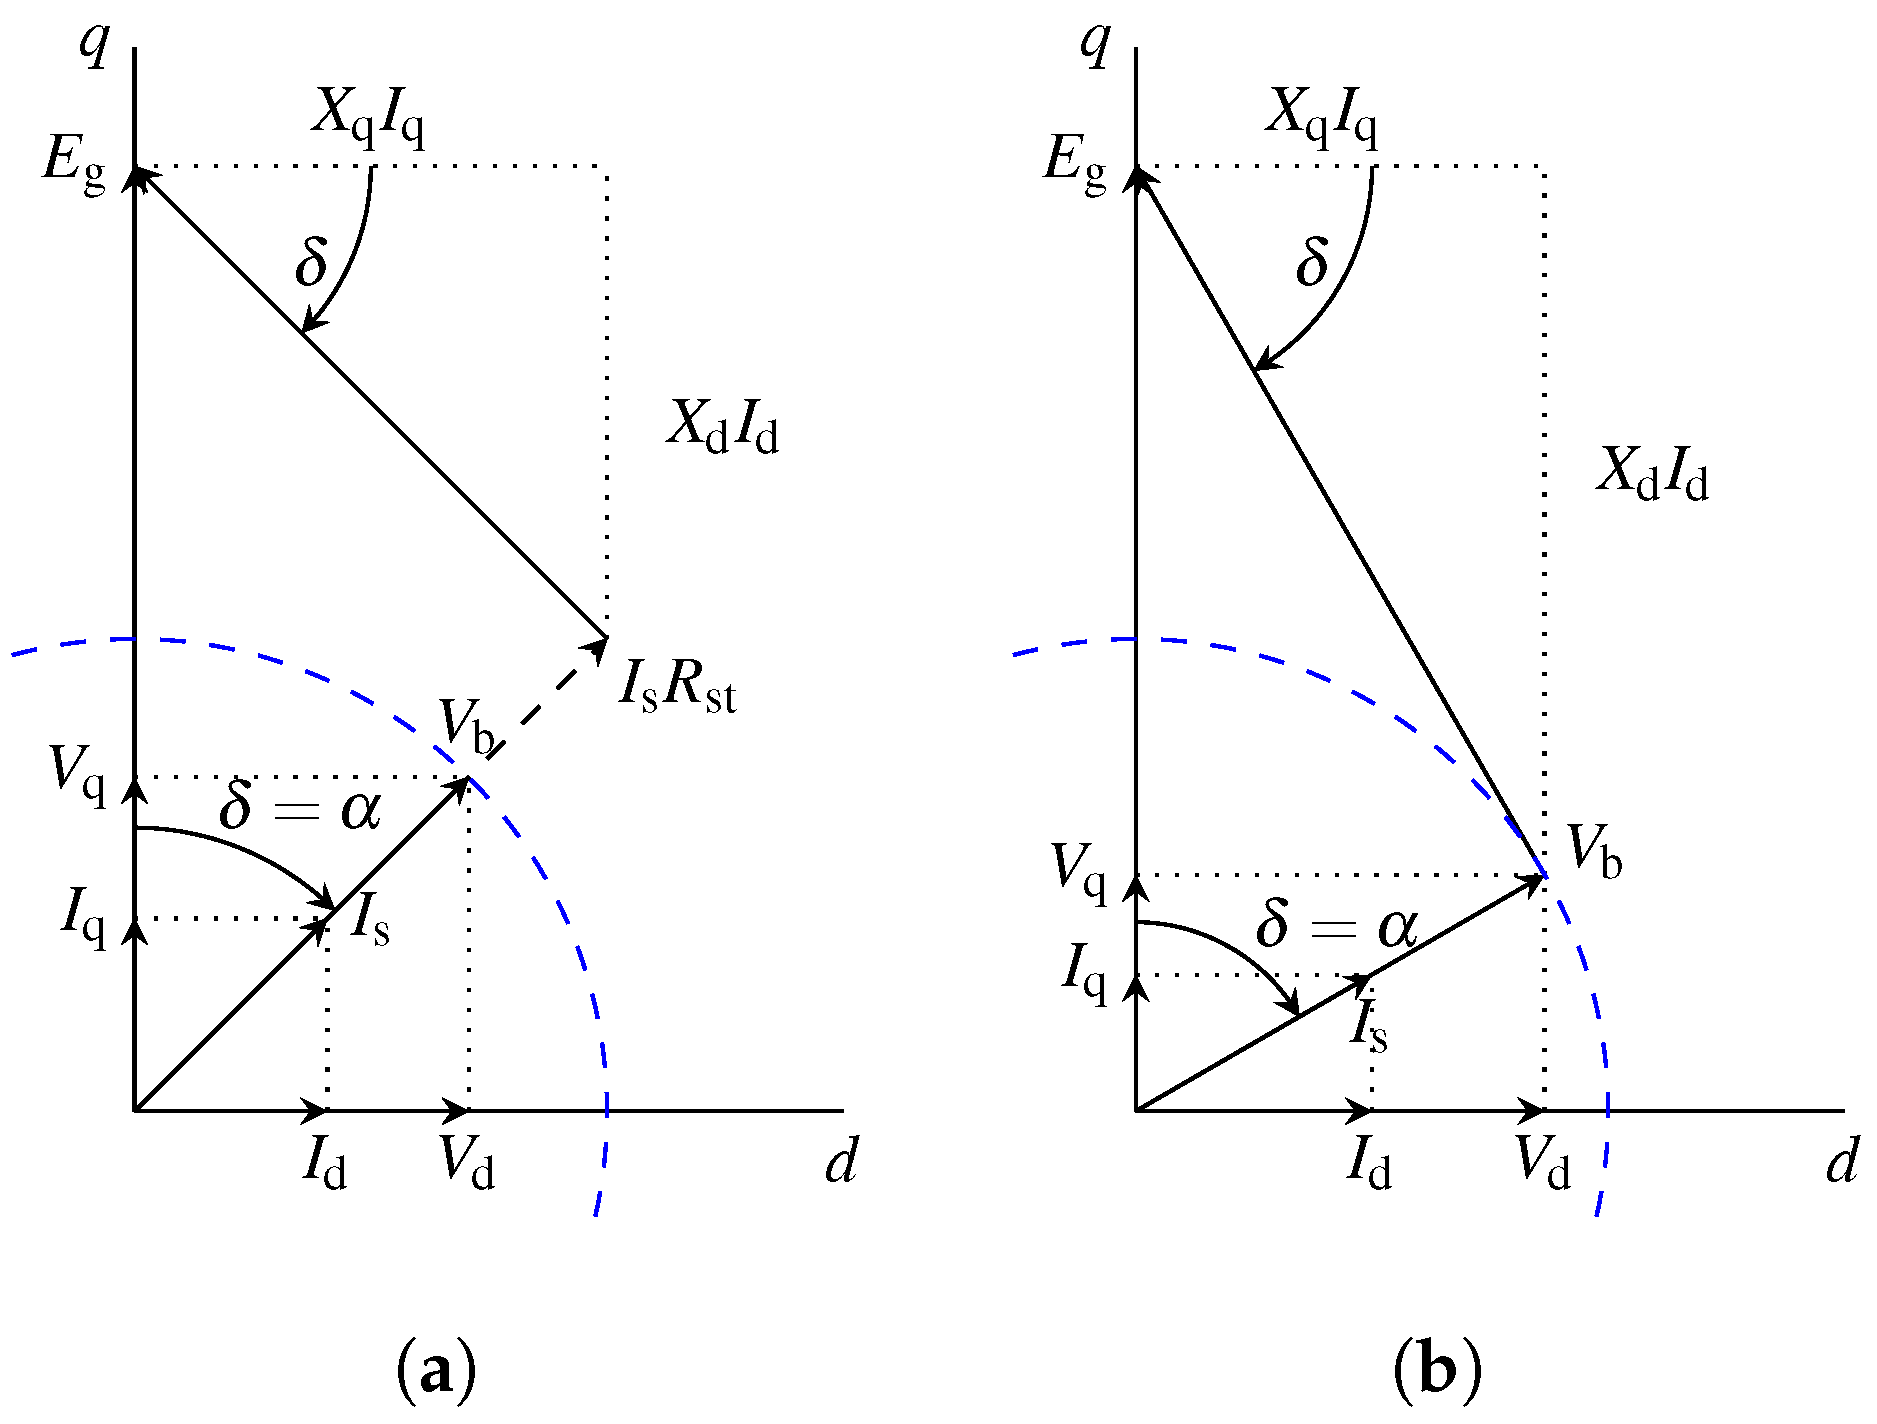
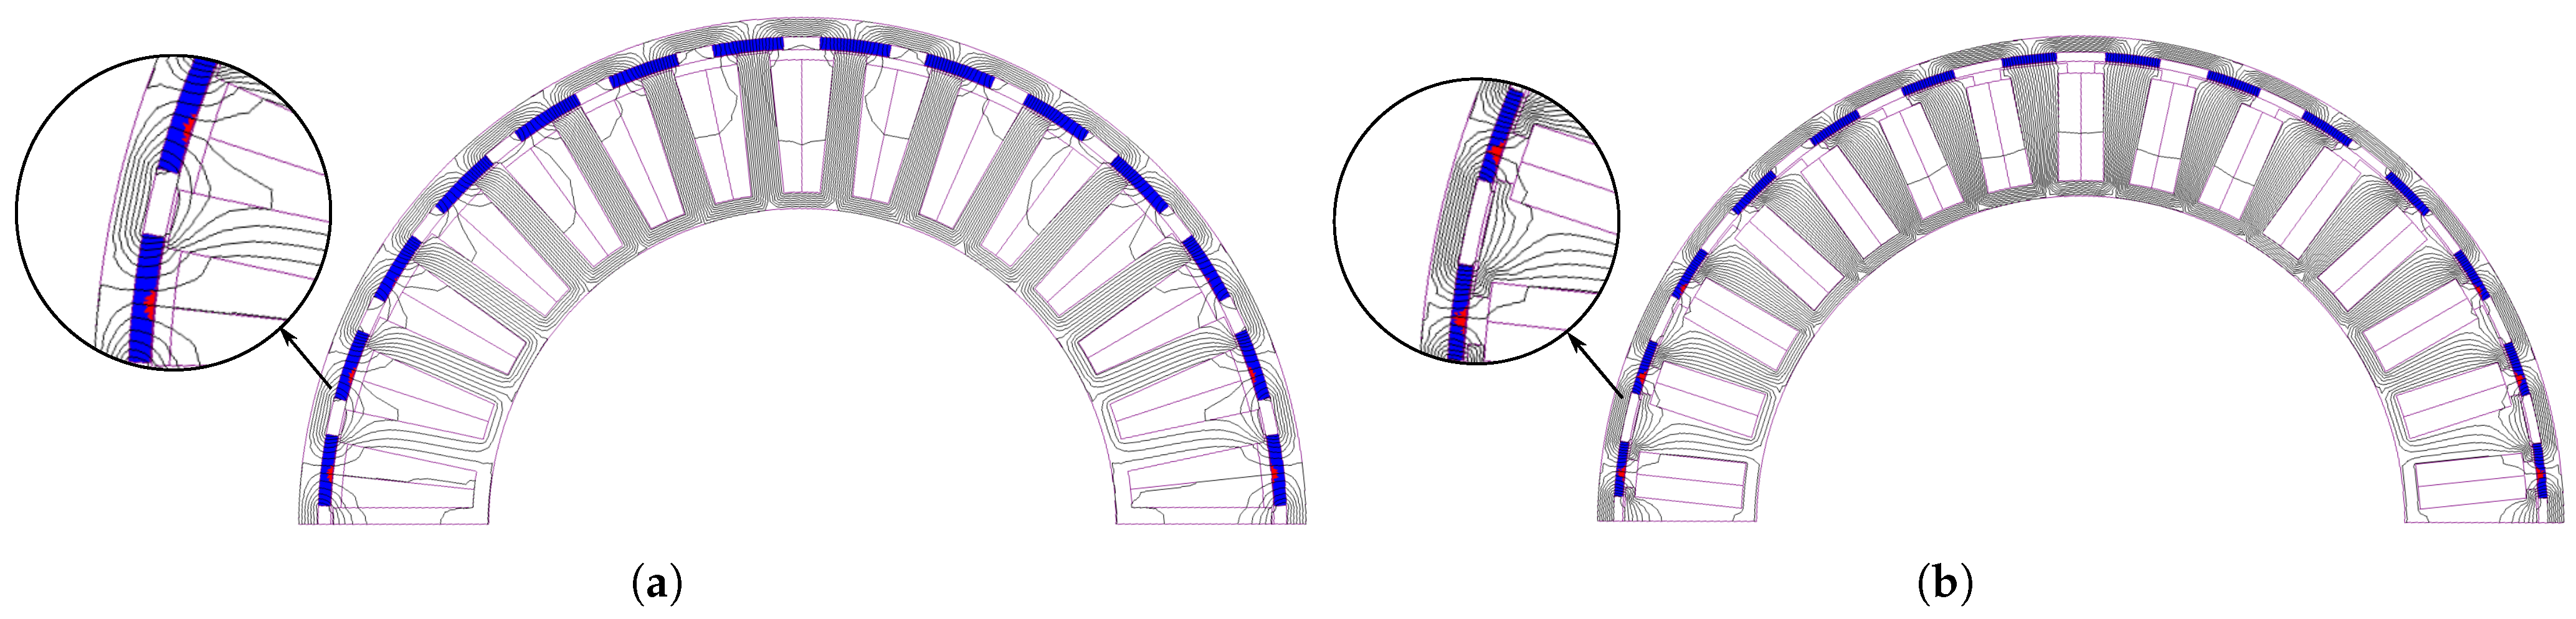
With iron-cored PMSGs, it is difficult to accurately take saturation and armature reaction into account, even more so in this case, with the PMSG operating with a large direct-axis current, as shown in Figure 1 and Figure 5. In [10], an analytical model was used to design the PMSG for a passive wind generator system; however, substantial errors of 17% and 26% were reported for the generated torque and back-EMF. Furthermore, in [18], it was also shown that using analytical calculations for the synchronous inductance resulted in a significant error in power matching with the wind turbine. The results in [10,18] confirmed that it is better to use finite-element analysis (FEA) for PMSGs in passive wind generator systems. Therefore, the performance of the PMSGs in this paper was solved using 2D static FEA. End-effects were taken into account in the 2D FEA for the respective PMSGs, as in [27,28].

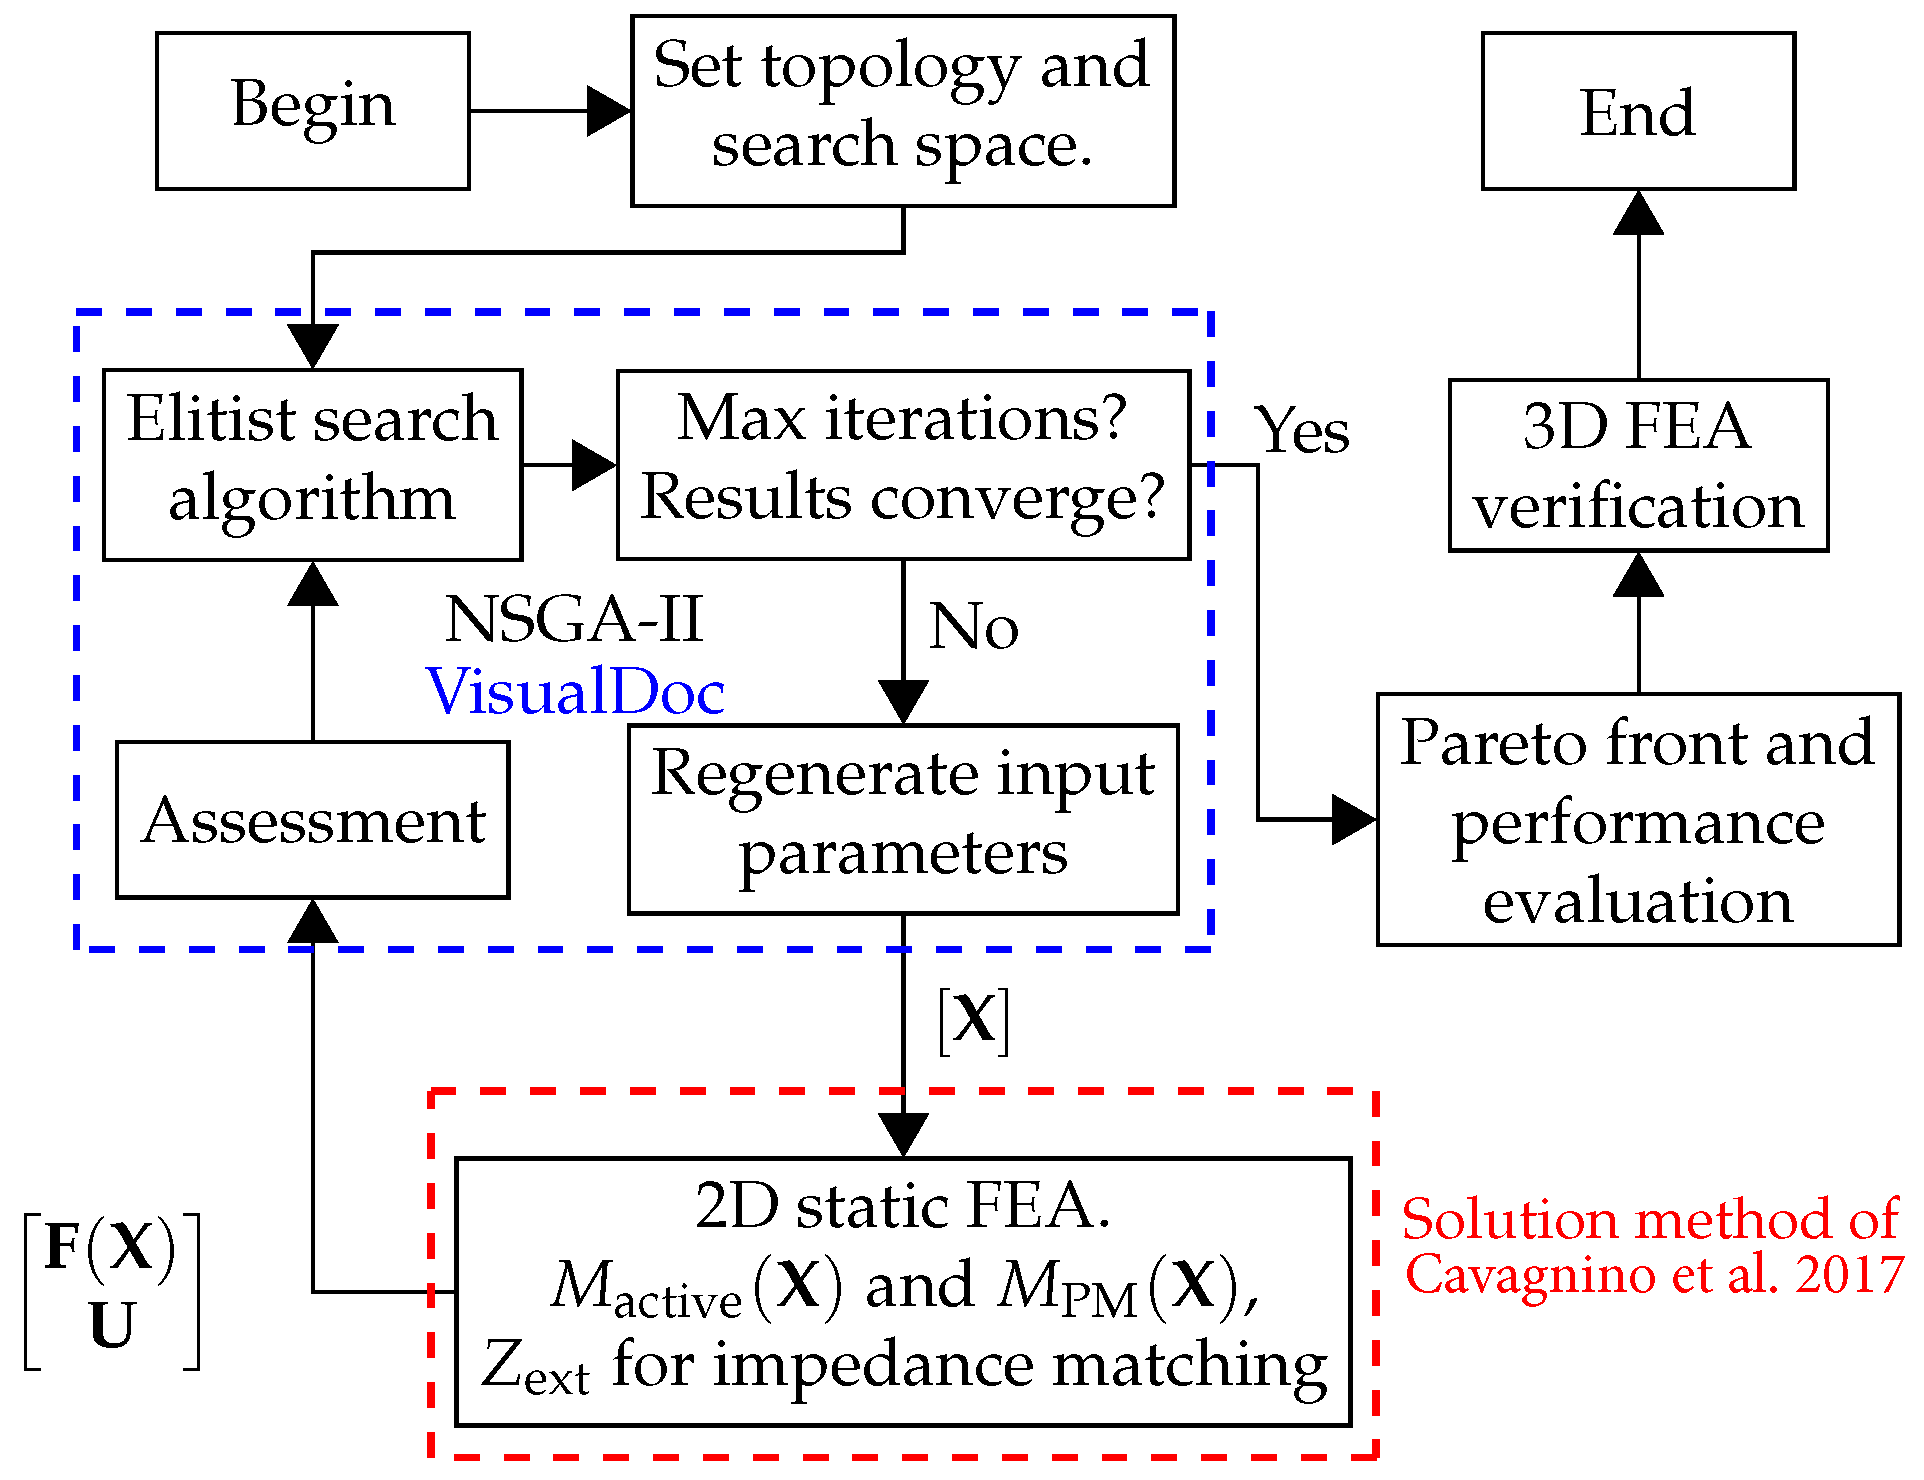
4.1. Multi-Objective Optimisation

The population-based non-gradient genetic algorithm II (NSGA-II) [29] was used in conjunction with the 2D static FEA solutions to optimise the PMSGs. The design optimisation workflow is shown in Figure 9.
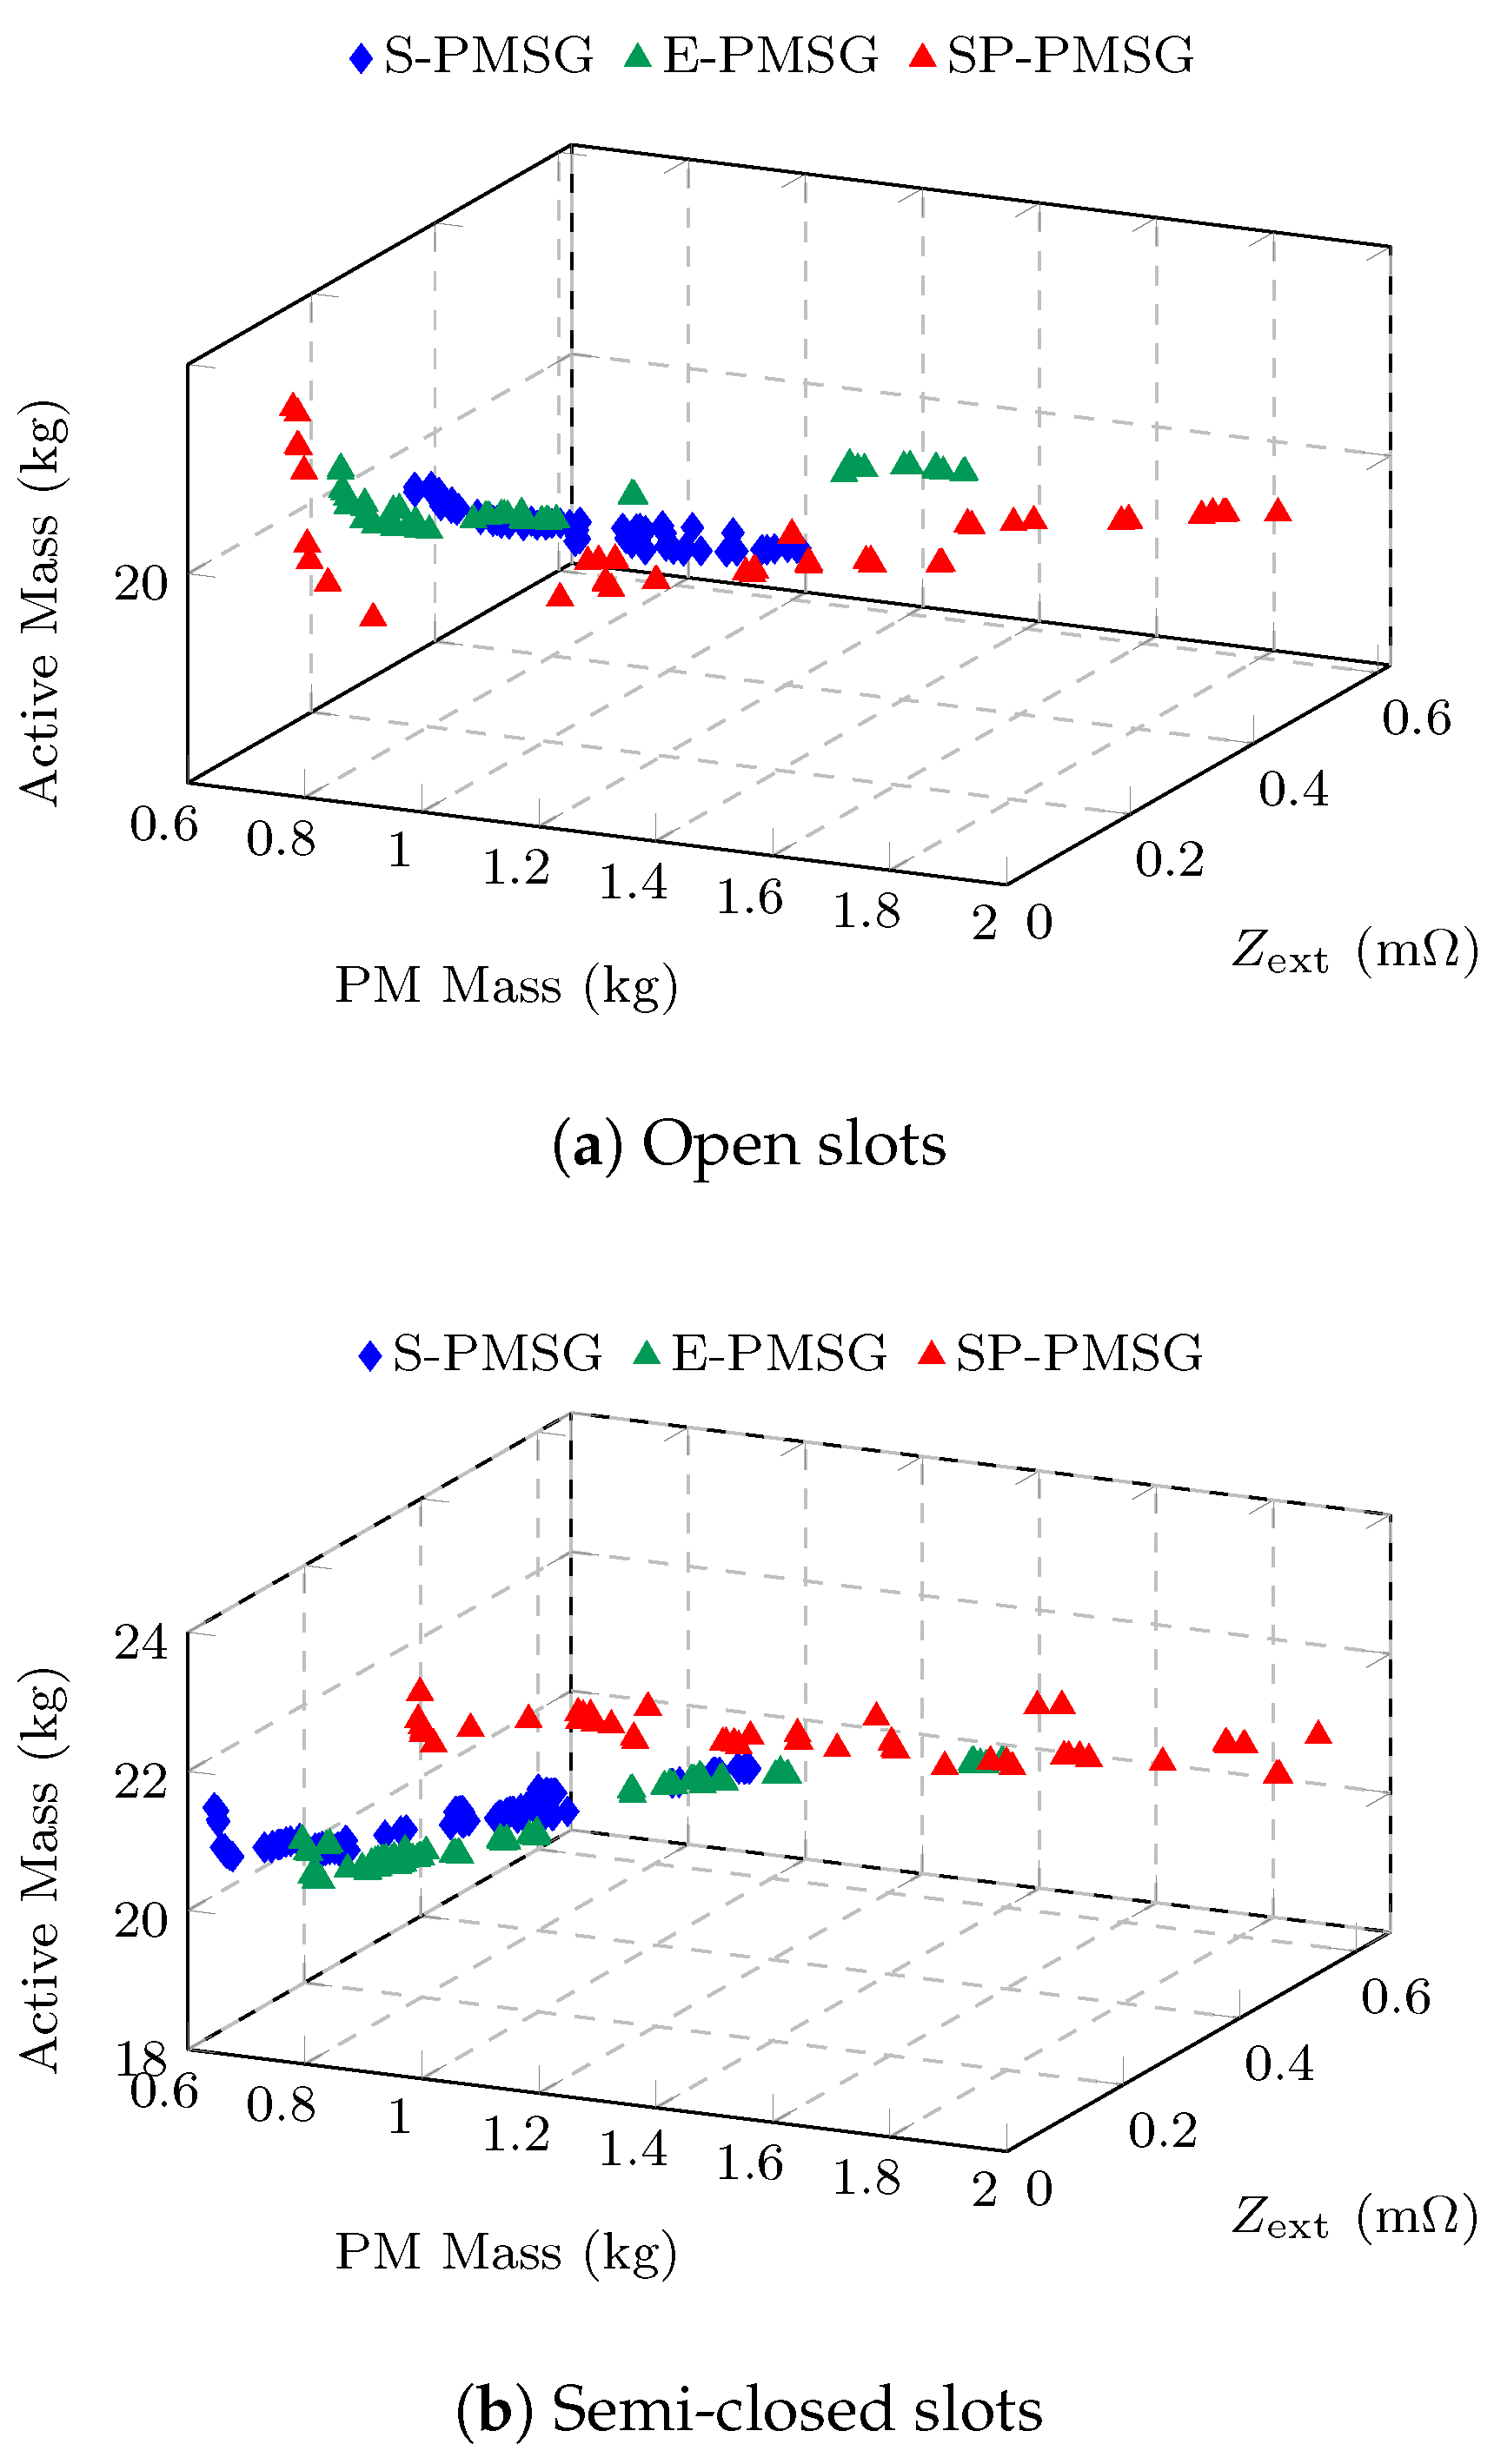
Reducing the PMSG’s cost and minimizing the top-tower mass are important for small-scale wind generators. Therefore, the first two objectives of the multi-objective function given in (15) were to minimise the PMSG’s active mass, M active , and the generator’s PM mass, M PM . Minimizing M active has the dual purpose of reducing the generator’s cost and the top-tower mass. The generator’s PM mass, M PM , is the most expensive material and, given its volatile cost, needs to be minimised as a separate objective.
min X F ( X ) = min X M active ( X ) M PM ( X ) Z ext ( X ) .
The PMSG’s active mass in (15) is calculated as:
M active = M Fe + M PM + M Cu ,
where M Fe is the collective mass of the stator and rotor iron laminations and M Cu is the total copper winding mass, which includes the end-winding mass.
The other objective in (15) is to minimise the impedance error, Z ext . This is the required difference in generator impedance, if not zero, to match the generator’s power with the turbine at the rated operating point, as shown in Figure 10a. The impedance error is visually illustrated in Figure 10b as a physical external impedance component ( Z ext = j ω e L ext ), which is added, if necessary, to the passive generator system between the generator and the diode bridge rectifier. As shown in Figure 9, the impedance error is calculated with the solution method for external impedance matching given in [18]. The impedance error is then given as feedback to the optimisation algorithm. In this way, the optimisation algorithm finds non-dominated PMSG solutions where Z ext = 0 , i.e., where the PMSGs are designed for the correct synchronous impedance Z s that matches naturally the maximum wind turbine power, or alternatively, where the PMSGs match the wind turbine power with the correct external impedance added to the system.

4.2. Design Constraints and Input Parameters

The design constraints for the PMSGs at the rated operating point are given by:
U = P g η J rms = 4.2 kW 90 % 5 A / mm 2 .
In (17), P g is the rated power, η is the generator efficiency, and J rms is the maximum allowed RMS current density. The constraint on P g was imposed to ensure that the desired power matching was achieved between the PMSG and the wind turbine. The constraint on J rms is a thermal constraint and is a typical value for small-scale machines of this power rating [25].
In (15), 
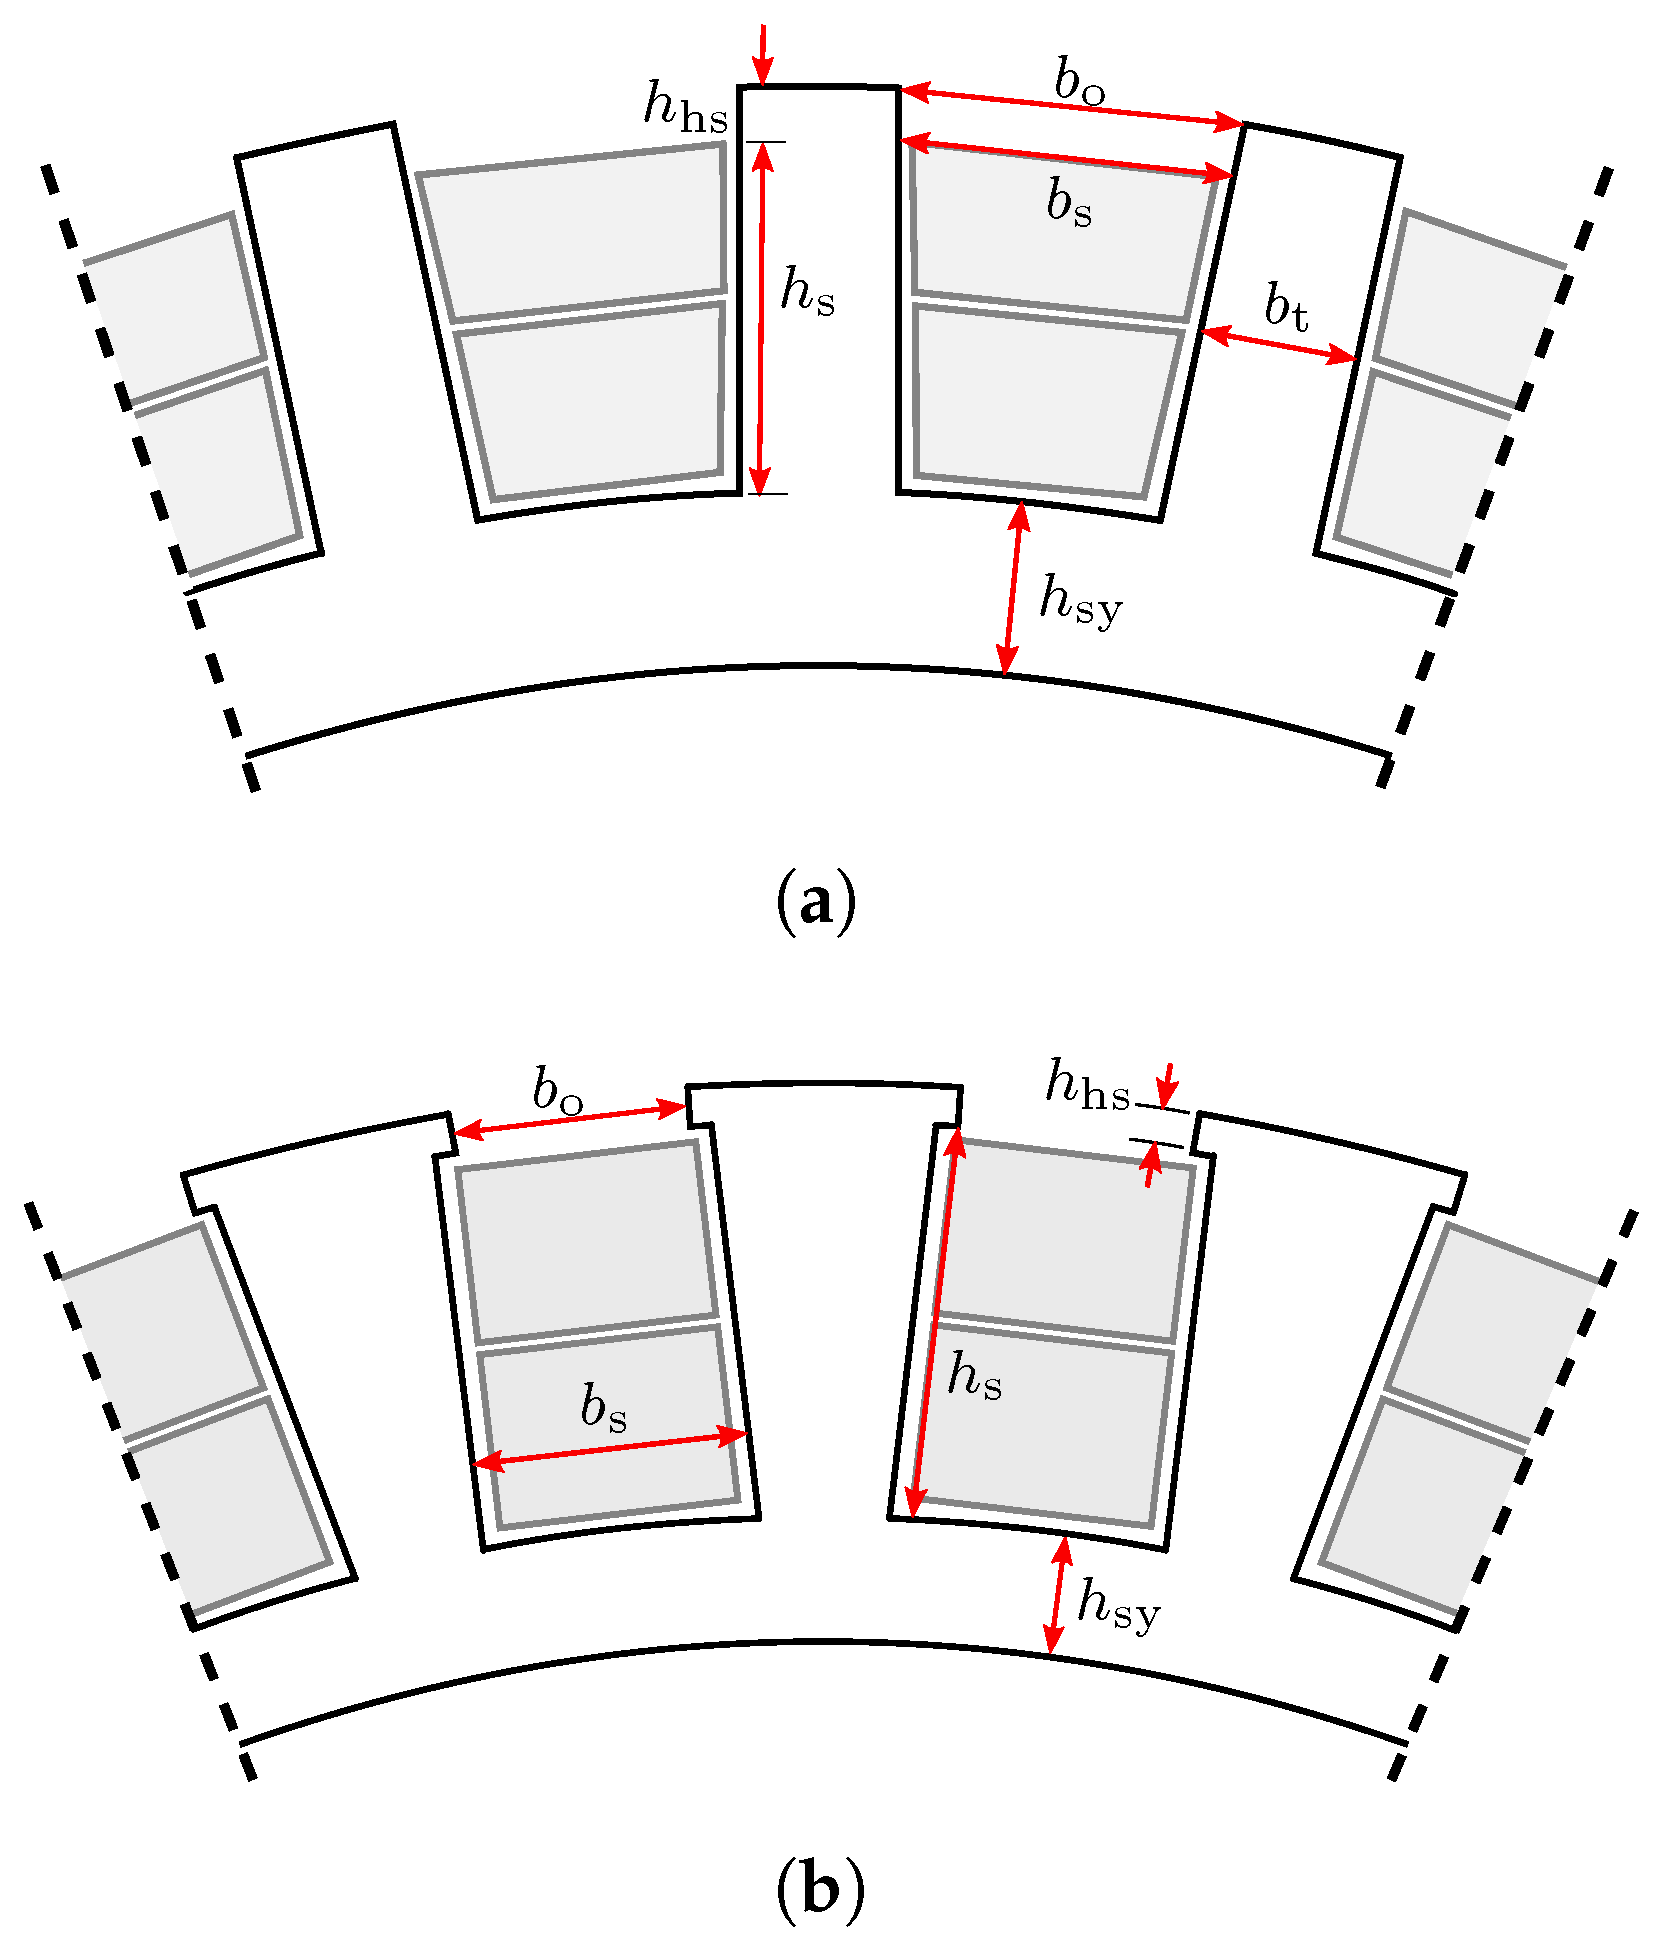
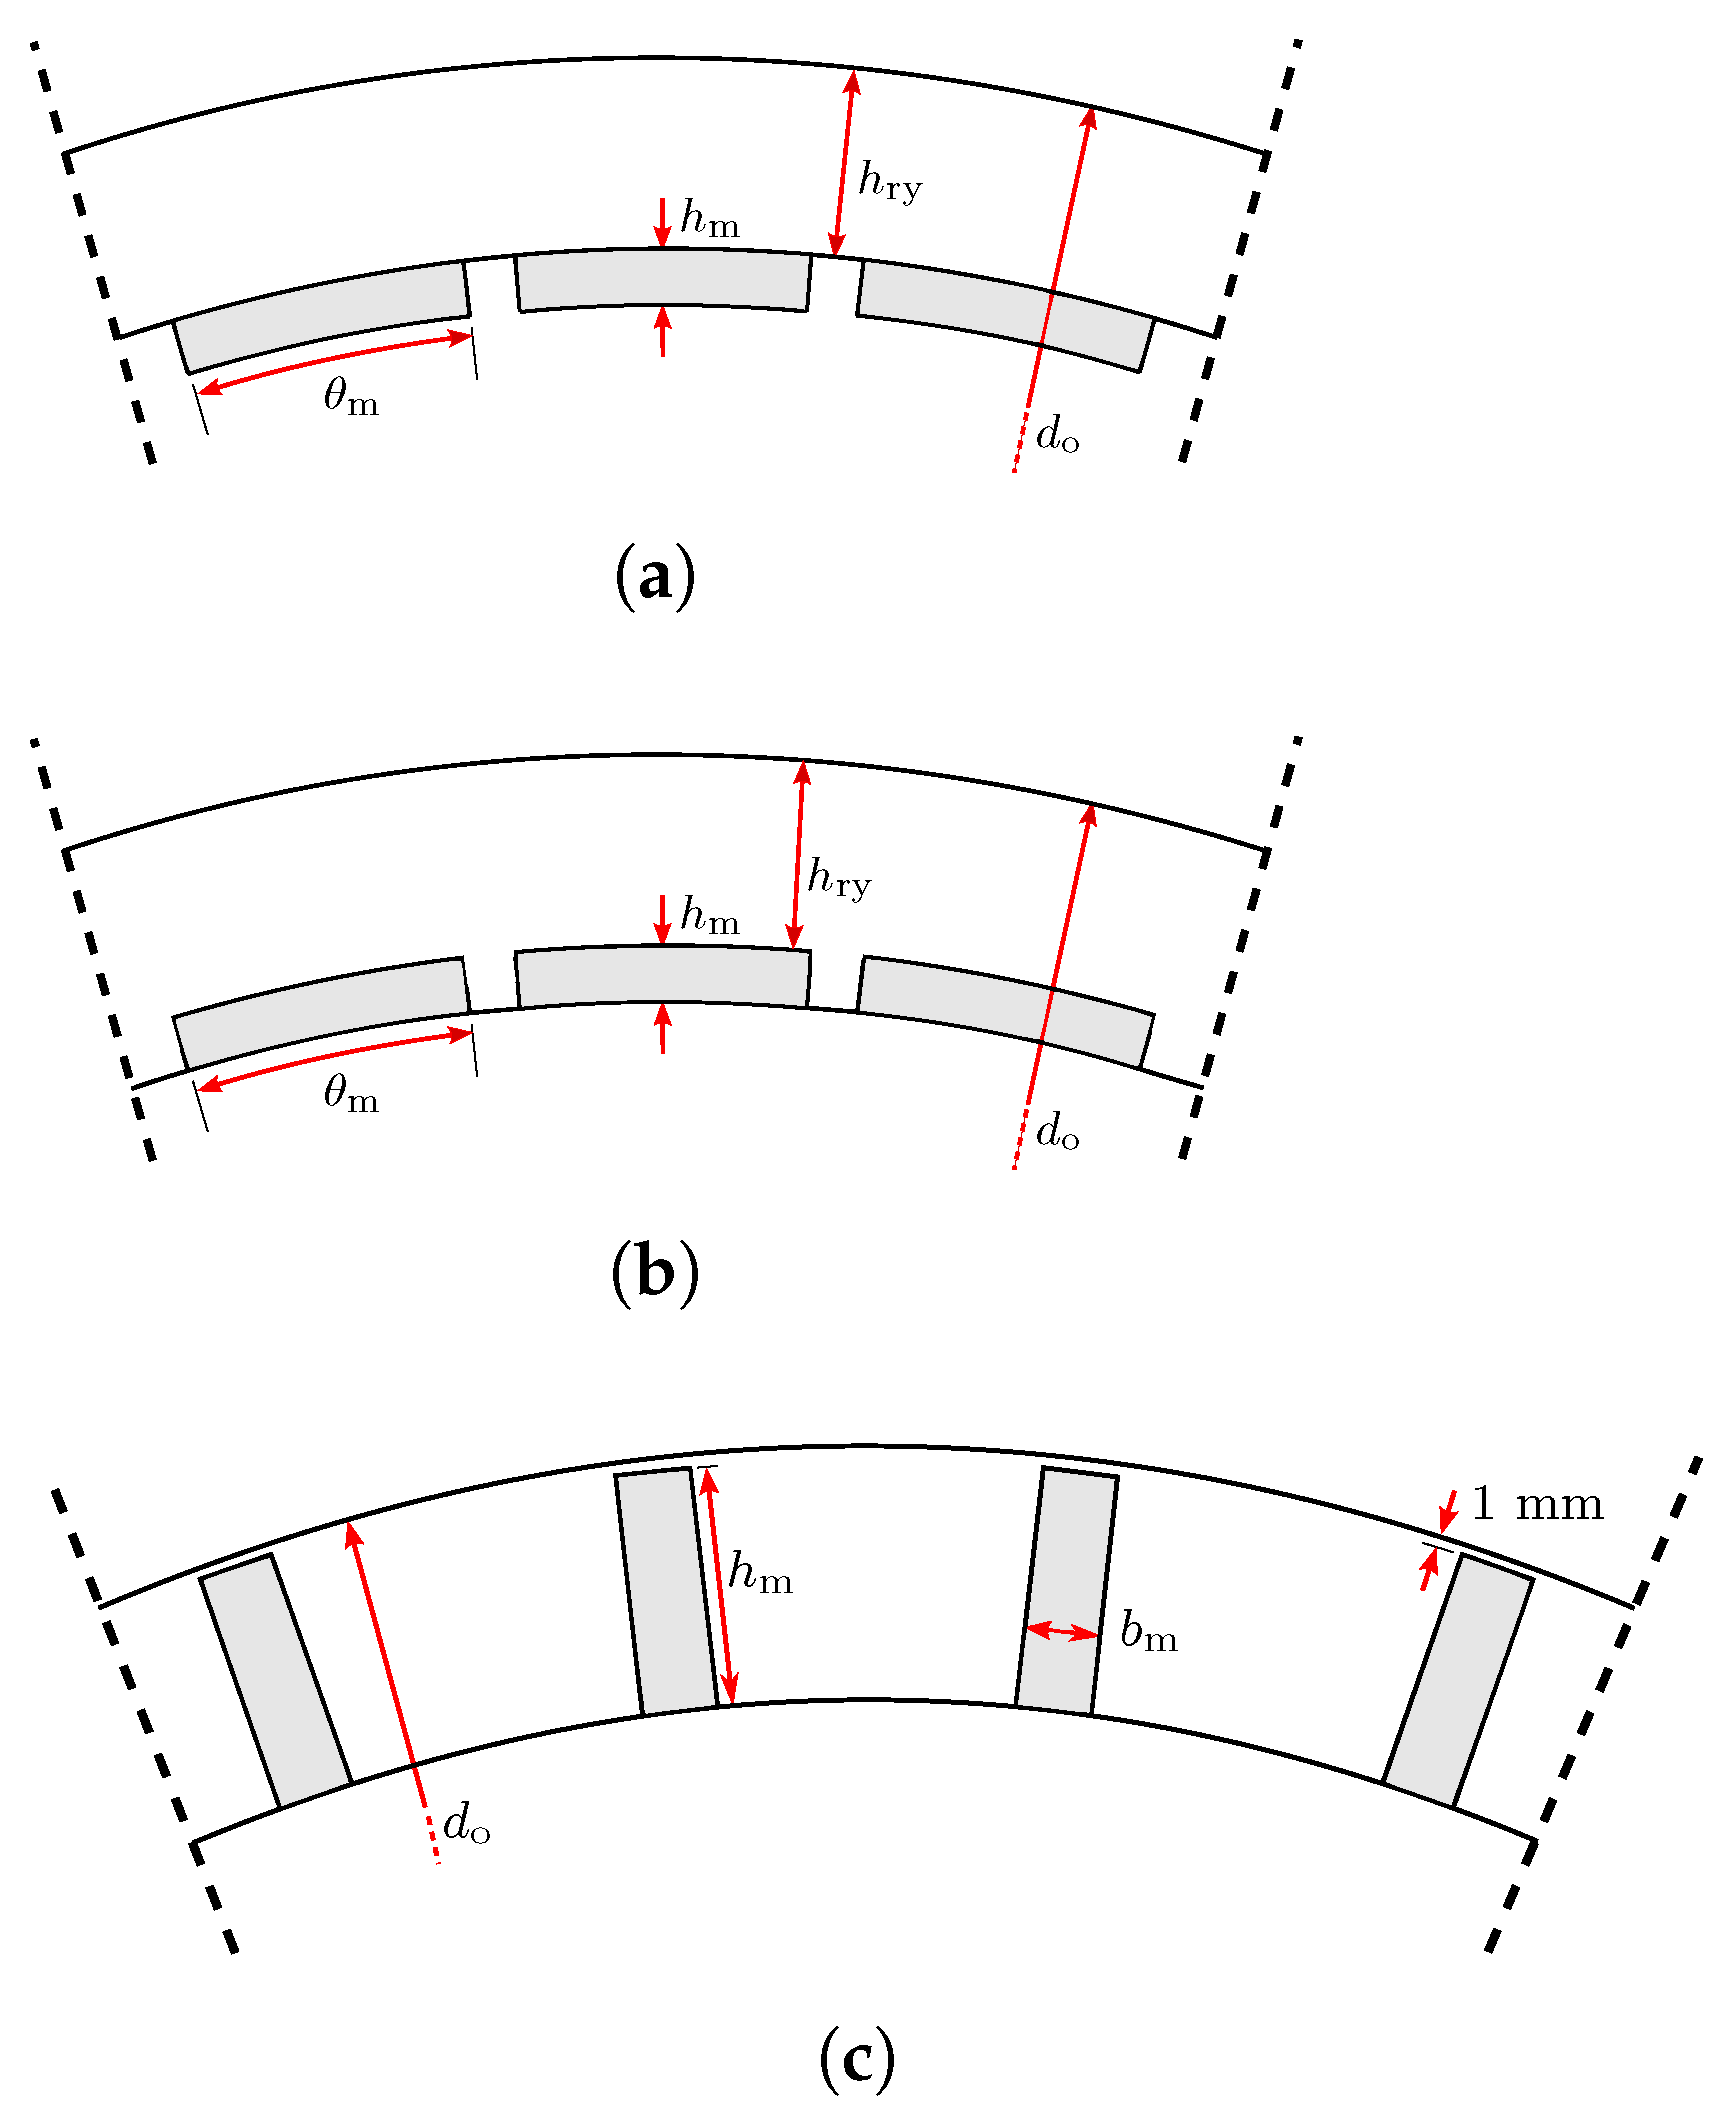
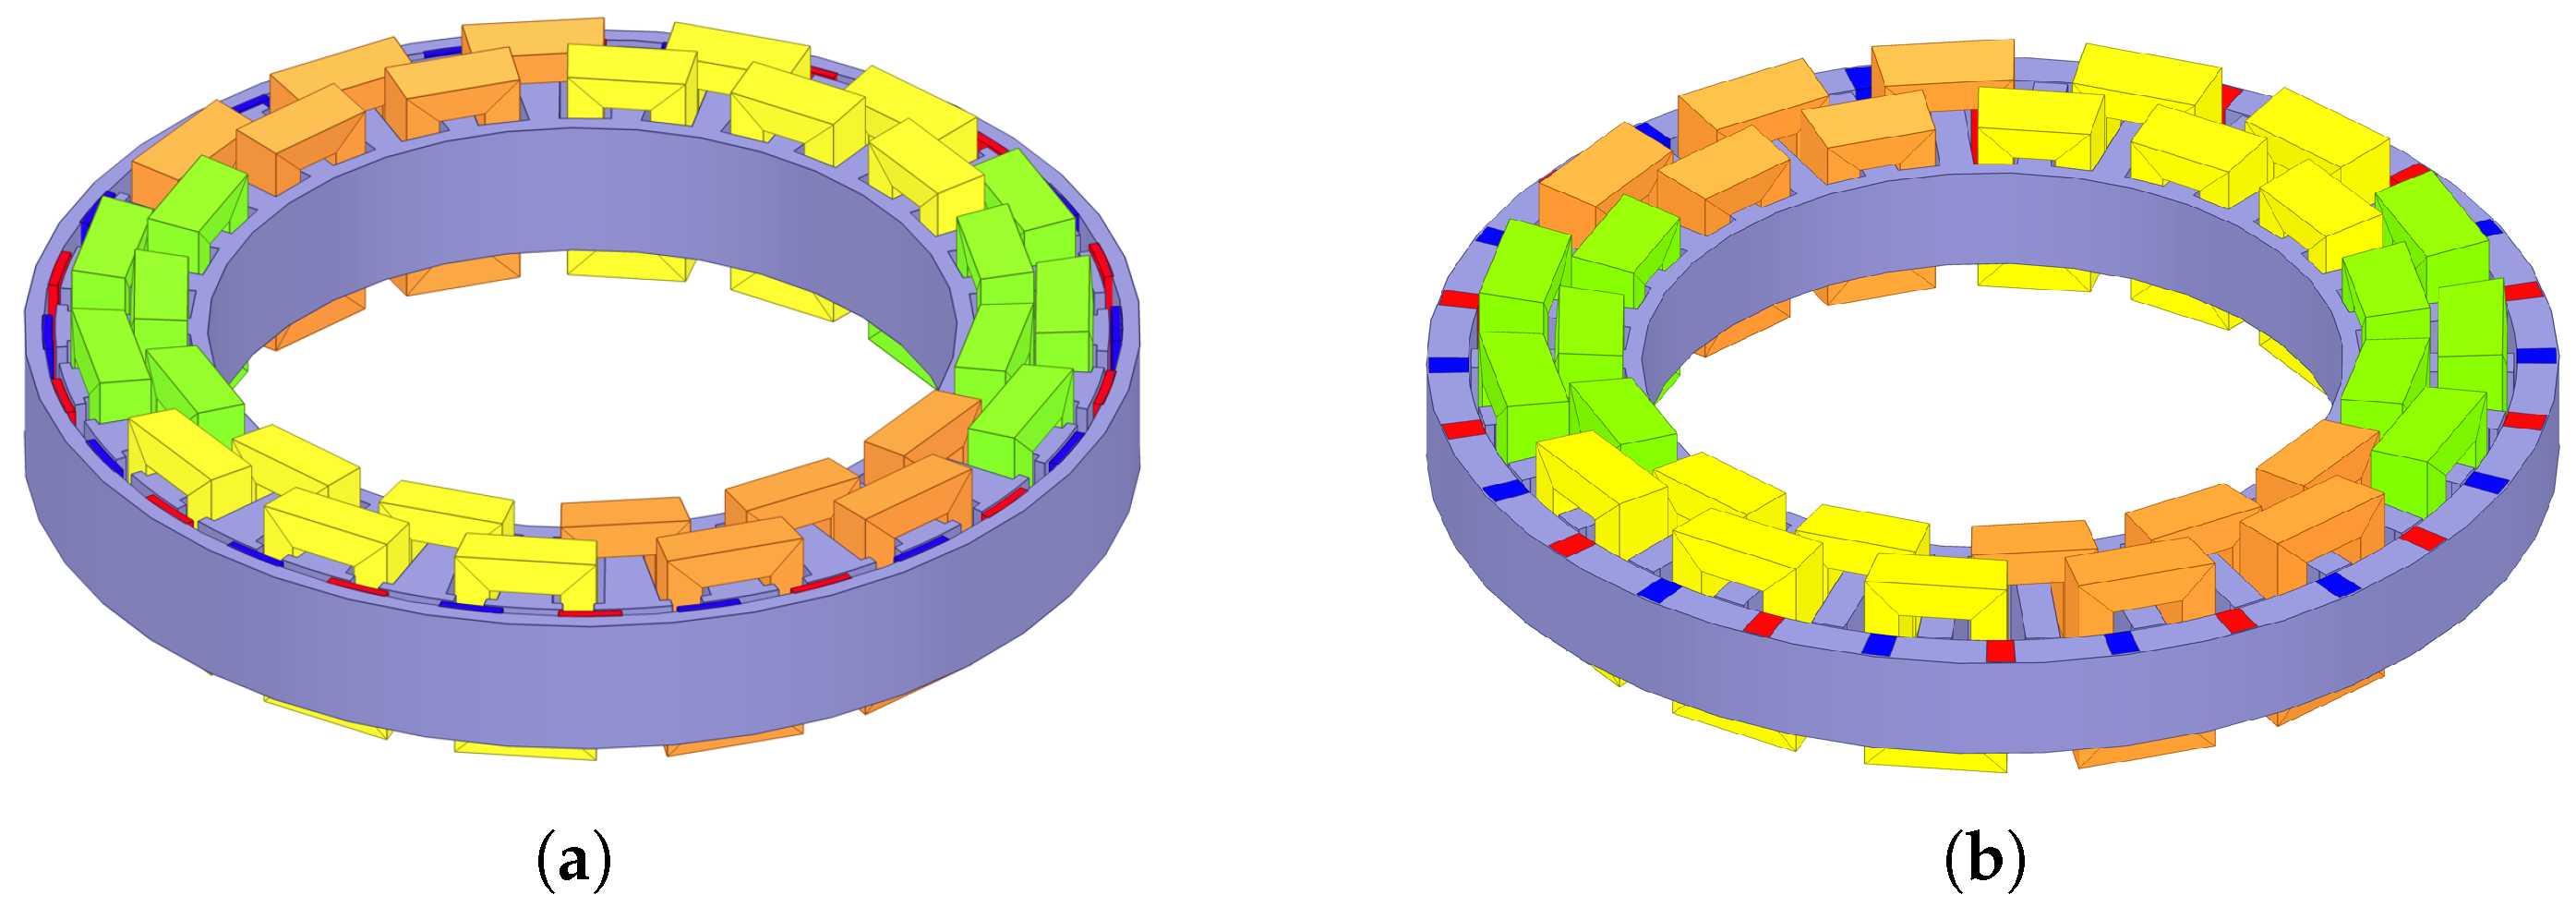
X is the input vector generated by NSGA-II containing the relevant dimensions for each topology, as defined in Figure 6 and Figure 7. A parameterised geometry was used to maintain a realistic optimisation search space, and four geometric boundaries were imposed: the outer diameter was limited to that of the wind turbine’s nacelle d o < 400 mm; the relevant rotor and stator yoke heights had to be h ry , h sy > 6 mm to maintain structural integrity; as a precaution for demagnetisation and for manufacturing ease (brittle PMs) of the S-PMSG, the minimum allowed PM height was h m > 3 mm. For all the PMSG designs, the mechanical air gap was kept constant at g air = 1 mm. For the SP-PMSGs, the rotor yoke support, as shown in Figure 7c, was kept constant at 1 mm. For the PM material, NdFeB N48 was used.

5. FEA Results and Evaluation

5.1. Optimisation Results

The multi-objective optimisation Pareto front results are shown in Figure 11. The Pareto fronts in Figure 11 show the tradeoff between M active and M PM and provide insight into how the different PMSG topologies compare with one another. For the third objective in (15), to minimise Z ext , the PMSG solutions where Z ext = 0 are also indicated in Figure 11. For these solutions, the internal impedance of the PMSG was sufficient for near-maximum power matching. It is shown in Figure 11a that, for the S-PMSG with open stator slots, none of the solutions met the desired natural impedance matching and required an external inductance for good power matching. Moreover, the Pareto front results in Figure 11 confirmed that altering the stator slot and rotor structure to increase L sl and the magnetic saliency, ξ , were both viable methods to increase L s for a natural impedance matching. For the 3D Pareto front plots, refer to Figure A1 in Appendix A.
For each PMSG topology, the optimum design was selected at the optimal tradeoff between the design objectives, as indicated in Figure 11. The performance results are summarised in Table 5. Although the efficiency values in Table 5 were slightly lower than specified, they were still deemed acceptable. Altogether, the results in Table 5 confirmed that the performance constraints in (17) were met. In terms of M active and M PM , the SP-PMSG with open slots and the S-PMSG with semi-closed slots were the best options. This is also evident from the Pareto fronts shown in Figure 11. However, the difference between these two PMSG topologies was not that significant. The S-PMSG with open slots was also competitive in terms of M active and M PM . However, this topology can be discarded due to the necessary external inductance. The dimensions of the optimum PMSGs in Table 5 are given in Table A1 in Appendix A.

5.2. Power Matching

To illustrate the natural impedance matching of the respective PMSGs in Table 5, the FEA predicted power curves are plotted against the wind turbine’s power curves in Figure 12. The PMSGs start generating power at the specified cut-in speed and achieve good power matching at low wind speeds, which is essential for this application. The respective PMSGs also match the wind turbine at the rated operating speed. Overall, the power matching plots in Figure 12 are desirable, with the respective E-PMSGs and SP-PMSGs, as well as the S-PMSG with semi-closed slots matching naturally the wind turbine. To show that the generators maintain a high efficiency over a wide range of speeds and torques, the semi-closed slot S-PMSG’s FEA predicted output power, P out , is plotted in Figure 12b.

5.3. Torque Quality

Good torque quality is essential for small-scale wind generators, specifically the generator’s cogging torque, since the wind turbine has to overcome this to start generating power. The cogging torque, Δ T cog , and rated torque ripple, Δ T r , results for the respective PMSGs in Table 5 are summarised in Table 6. All of the PMSGs had a very low cogging torque, with Δ T cog < 2.1 % for all of the PMSGs. However, the torque ripple results for the interior embedded PMSG topologies in Table 6 are undesired ( Δ T r > 10 %). For comparison, the FE predicted Δ T cog and Δ T r for the semi-closed rectangular slot S-PMSG and the open slot SP-PMSG are shown for the mechanical rotation of one rotor pole pair (360 electrical degrees) in Figure 13.

5.4. Demagnetisation

Irreversible demagnetisation in small-scale PM wind generators can occur during short-circuit fault conditions or at high PM temperatures. Furthermore, at the full-load rated operating point, the PM generator in an uncontrolled passive wind generator system will operate with a relatively large d-axis current. This causes a strong magnetic field that opposes that of the PMs, which in turn may cause demagnetisation to occur. The geometric constraint on h m in the design optimisation was imposed to reduce the risk of demagnetisation. Regardless, the PMSG designs in Table 5 still need to be evaluated for irreversible demagnetisation to determine the risk thereof.
It is evident from the power curves in Figure 12 that the power in the passive wind generator system was limited independent of the wind speed. Therefore, PM demagnetisation in the PMSGs was analysed at the generator’s rated speed, n r (thus at rated load). The demagnetisation prediction plots for the two S-PM rotor topologies are shown in Figure 14a,b respectively. It is shown in Figure 14a that, for the open-slot S-PMSG, demagnetisation will start occurring at PM temperatures > 50 ° C. However, the temperature of the PMs during operation are not expected to surpass 50 ° C. In Figure 14b, it is shown that the PMs in the semi-closed slot S-PMSG were at very low risk of demagnetizing, with demagnetisation only occurring at >80 ° (this was later confirmed with thermal measurements that are given in Figure A3 in Appendix B). Similarly, for the embedded interior E-PMSG and SP-PMSG topologies, it was found that the PMSGs were at low risk of demagnetizing, with slight demagnetisation only starting to occur at PM temperatures > 80 ° C.

5.5. Three-Dimensional FEA Performance Validation

To validate the 2D FEA solutions and optimisation results, the performance of the respective PMSGs in Table 5 were also solved using 3D FEA. The 3D models of the semi-closed slot S-PMSG and the open-slot SP-PMSG are shown in Figure 15a,b, respectively. The 2D versus 3D FEA results are summarised in Table 7.
It is shown in Table 7 that the 3D-FEA-generated torque, T g , and generator efficiency, η , at rated speed n r correlated well with the 2D FEA results. Given also in Table 7 are the calculated iron losses, P Fe , at both n r and n c . The iron losses at n c are important because the wind turbine needs to overcome the PMSG’s open-circuit losses (predominantly P Fe ) up to the cut-in speed, n c , to start generating power. It is shown in Table 7 that the 2D and 3D FEA core losses at n c compared well. For the interior embedded PMSG topologies, the 2D-FEA-calculated core losses at n r were lower than the 3D-FEA-calculated core losses. However, the effect on the PMSGs’ performance at n r is shown to be minor.

5.6. Discussion

Considering all aspects of the performance evaluation performed in the previous subsections, it is evident that the S-PMSG with semi-closed slots is the best generator topology. The results in Table 5 indicate that this PMSG is competitive in terms of active material costs and the generator’s active mass. Furthermore, this PMSG has good power matching with the wind turbine, achieving the desired natural impedance matching, as well as having superior torque quality.

6. Prototype and Experimental Validation

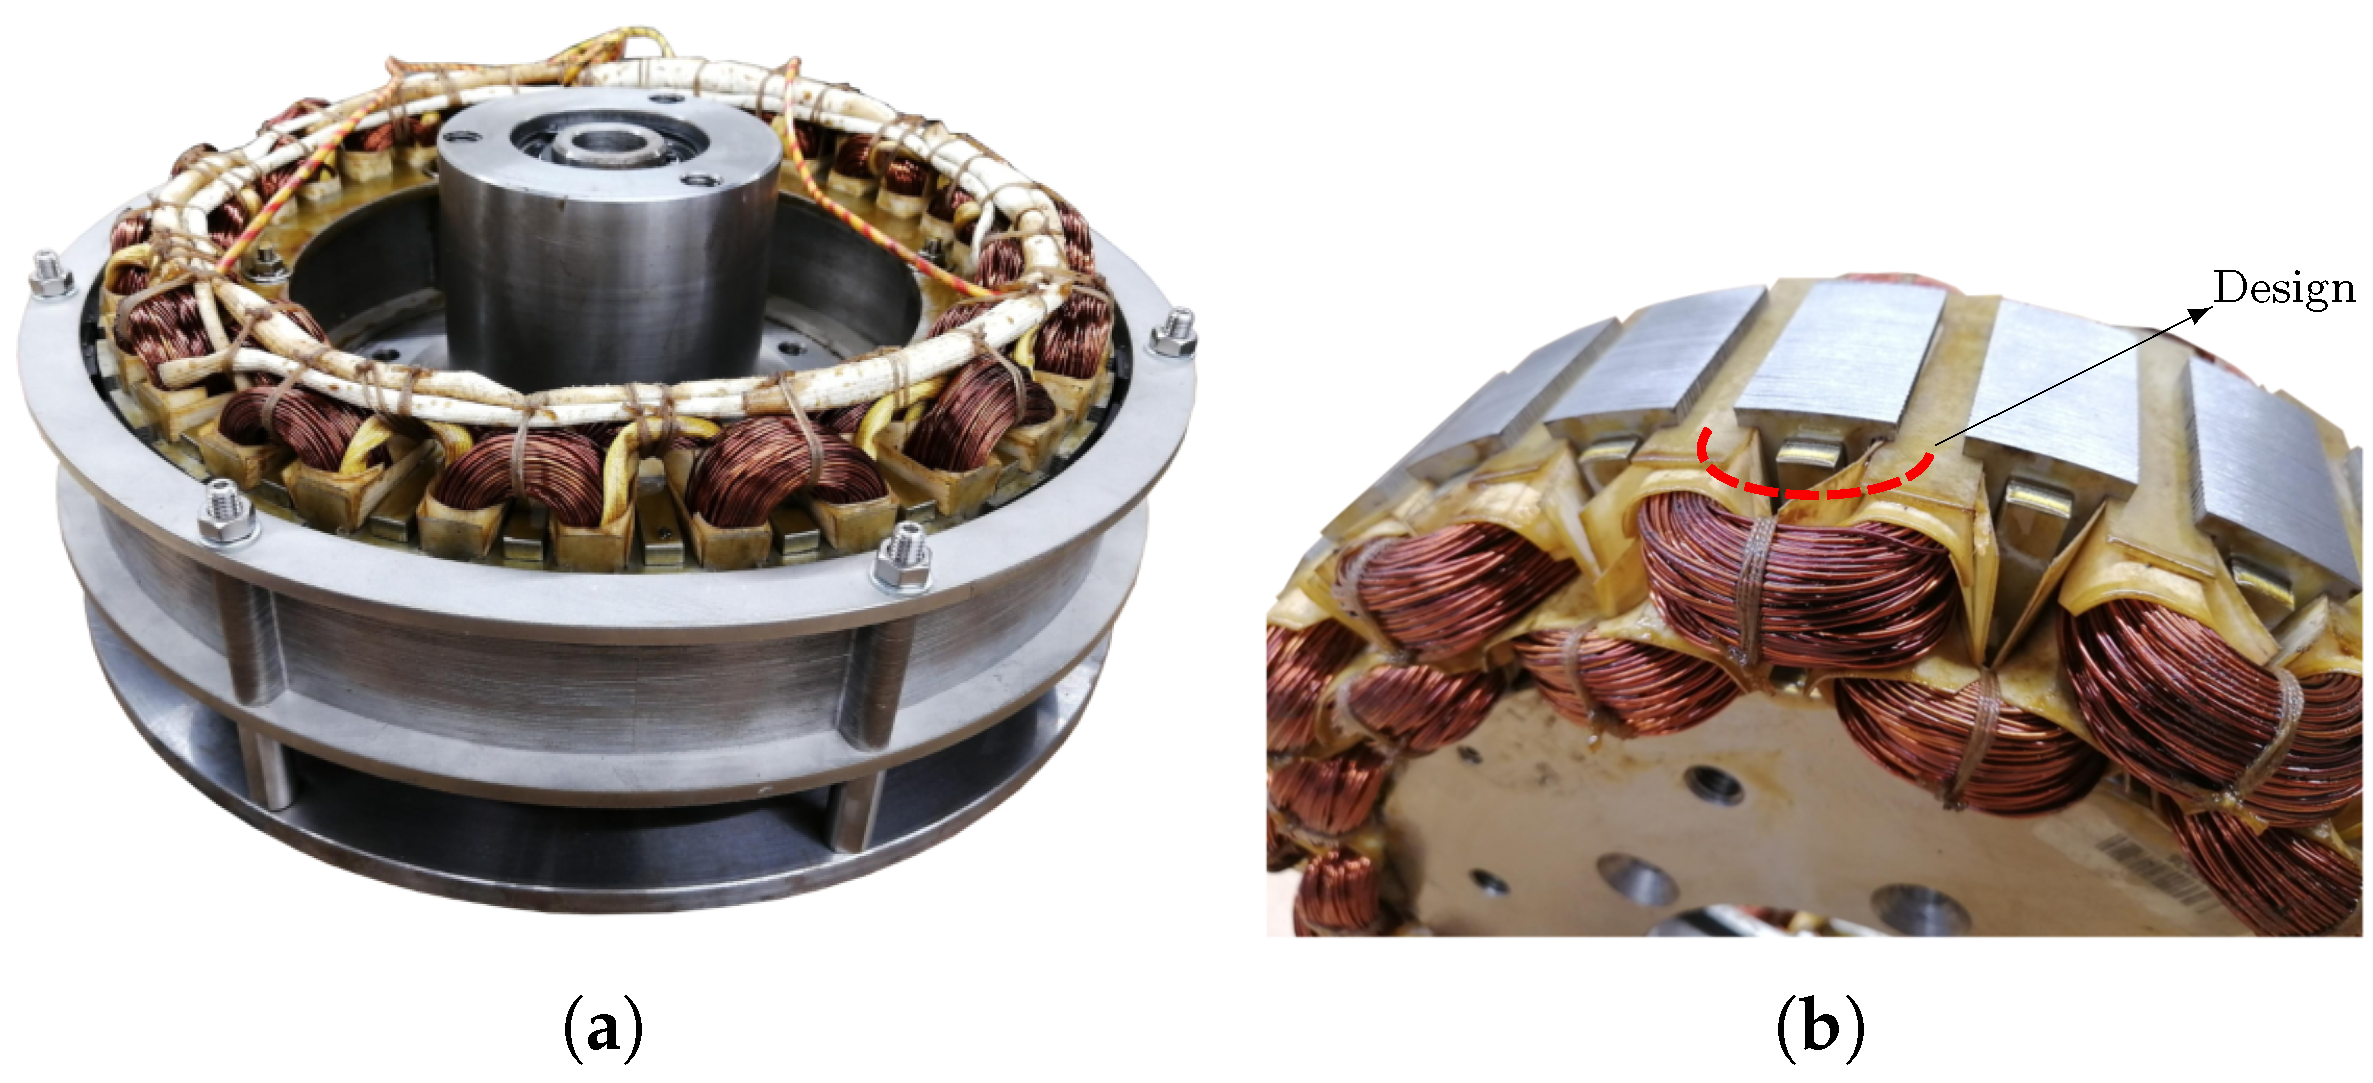
For the experimental validation, a prototype of the S-PMSG with semi-closed slots in Table 5 was built. The manufactured prototype is shown in Figure 16a. It is shown in Figure 16b that the axial overhang of the end-winding length, l g , was larger than what was designed. In the 2D FEA, this length was taken as l g = 5 mm; however, the actual measured value was l g = 20 mm (This is an error by the winder. It is possible to wind the machine for the designed overhang length.). For the experimental validation, this length was taken into account in the FEA solutions.
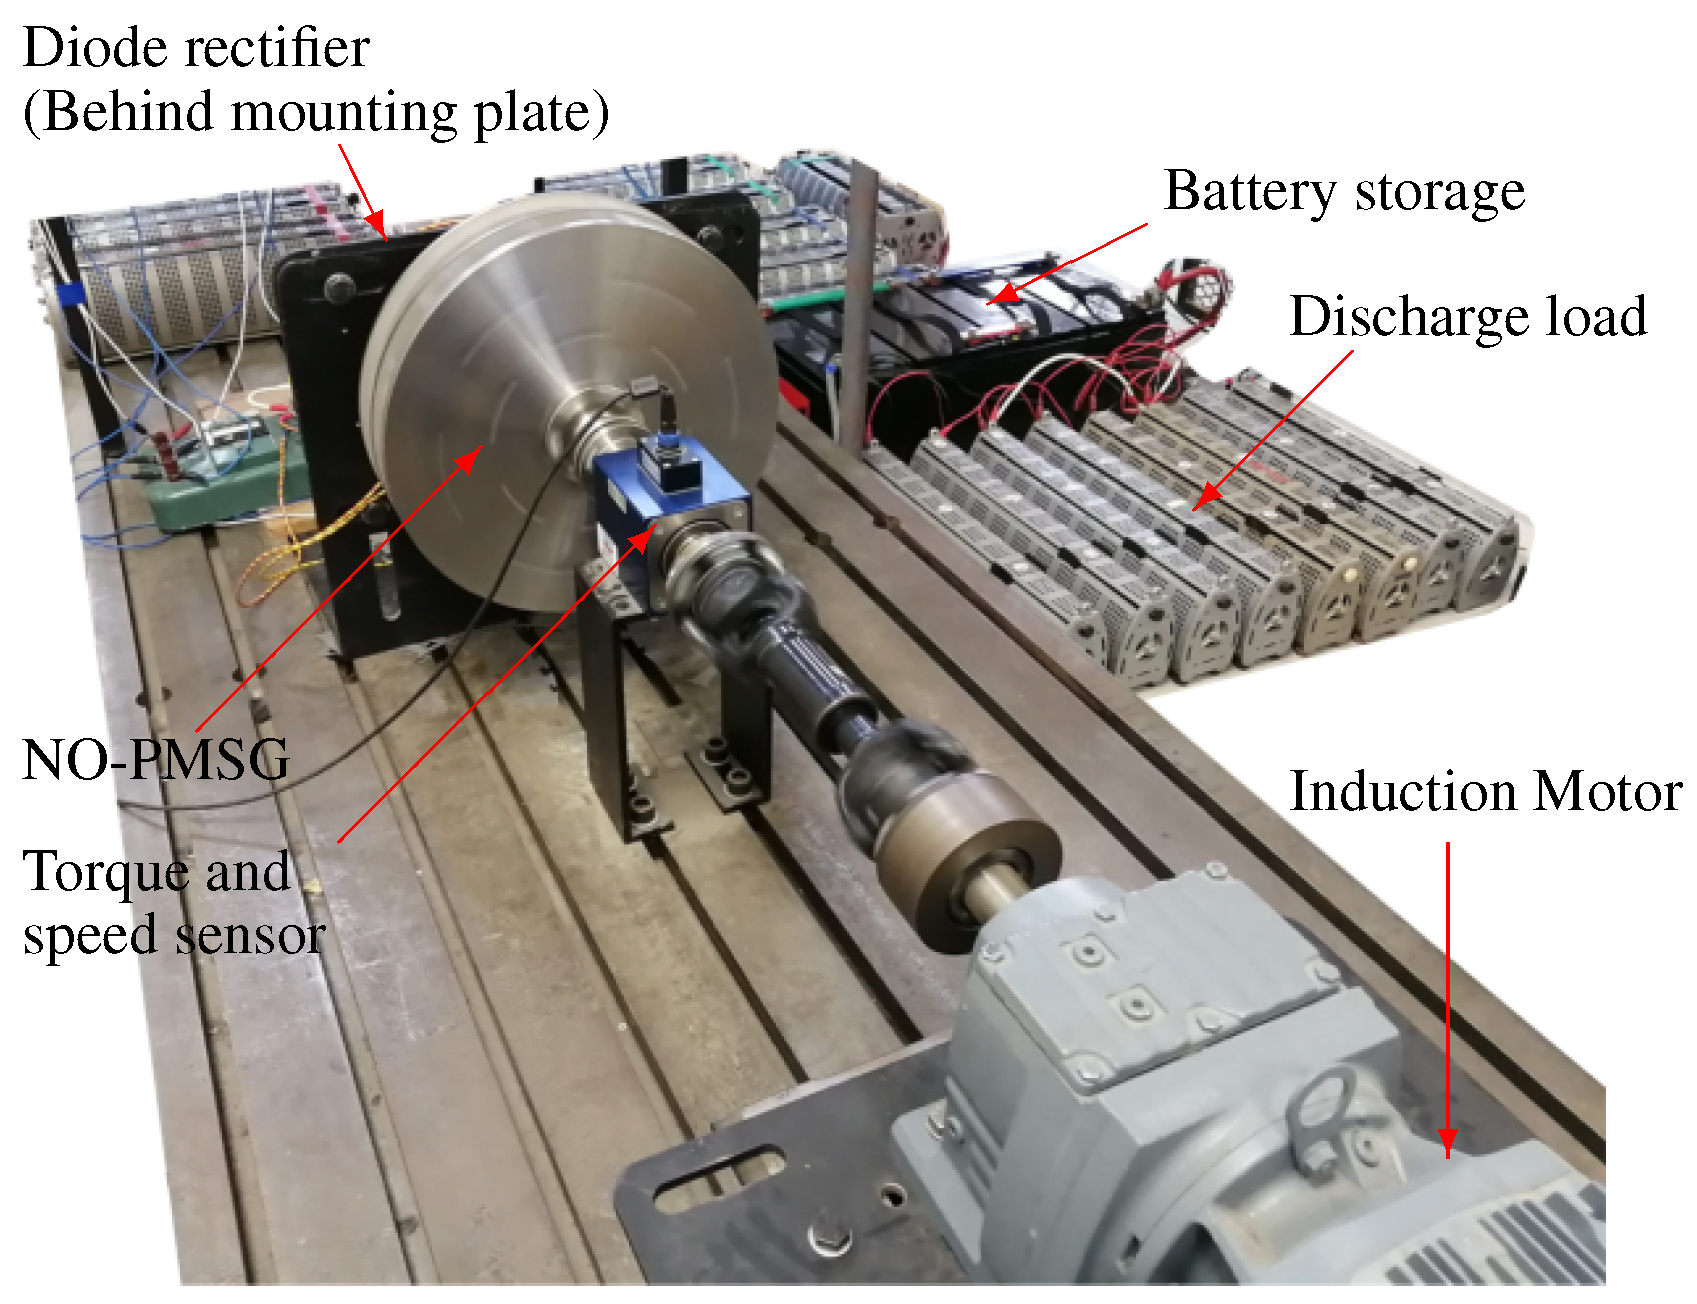
The experimental setup on the test bench is shown in Figure 17. In Figure 17, the S-PMSG prototype was mechanically connected to a geared induction motor drive that emulated the wind turbine. The torque sensor in Figure 17 was used to measure the input power. The S-PMSG prototype was electrically connected to the battery bank via a diode bridge rectifier. The 48 V battery bank energy storage and discharge load are also shown in Figure 17.

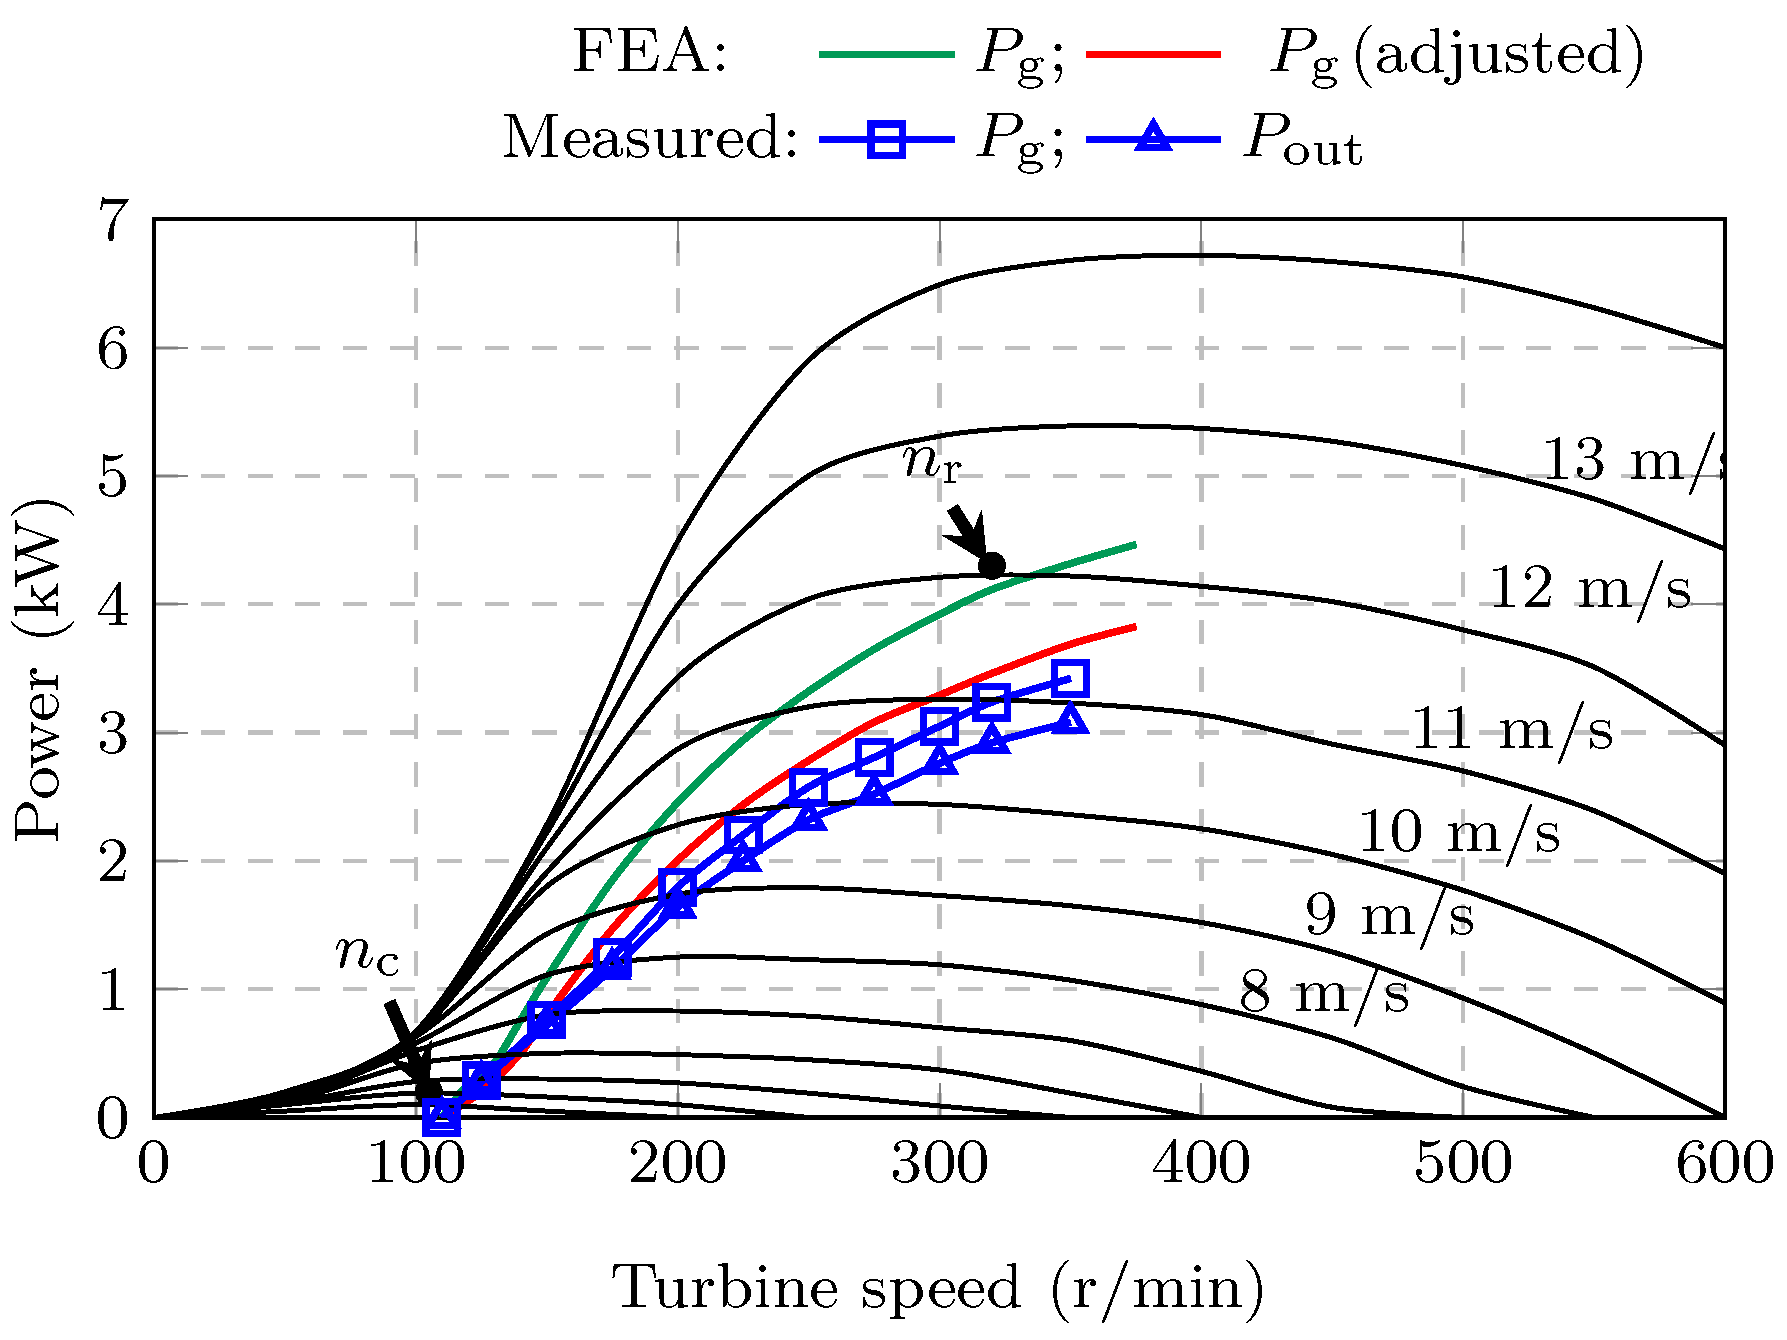
6.1. Power Matching Measurements

The measured results for the S-PMSG prototype’s generated power, P g , and output power, P out , are shown in Figure 18. It is shown that the P g power measurements were much lower than what was designed (green FEA curve). The following explanation accounts for the measured results in Figure 18.
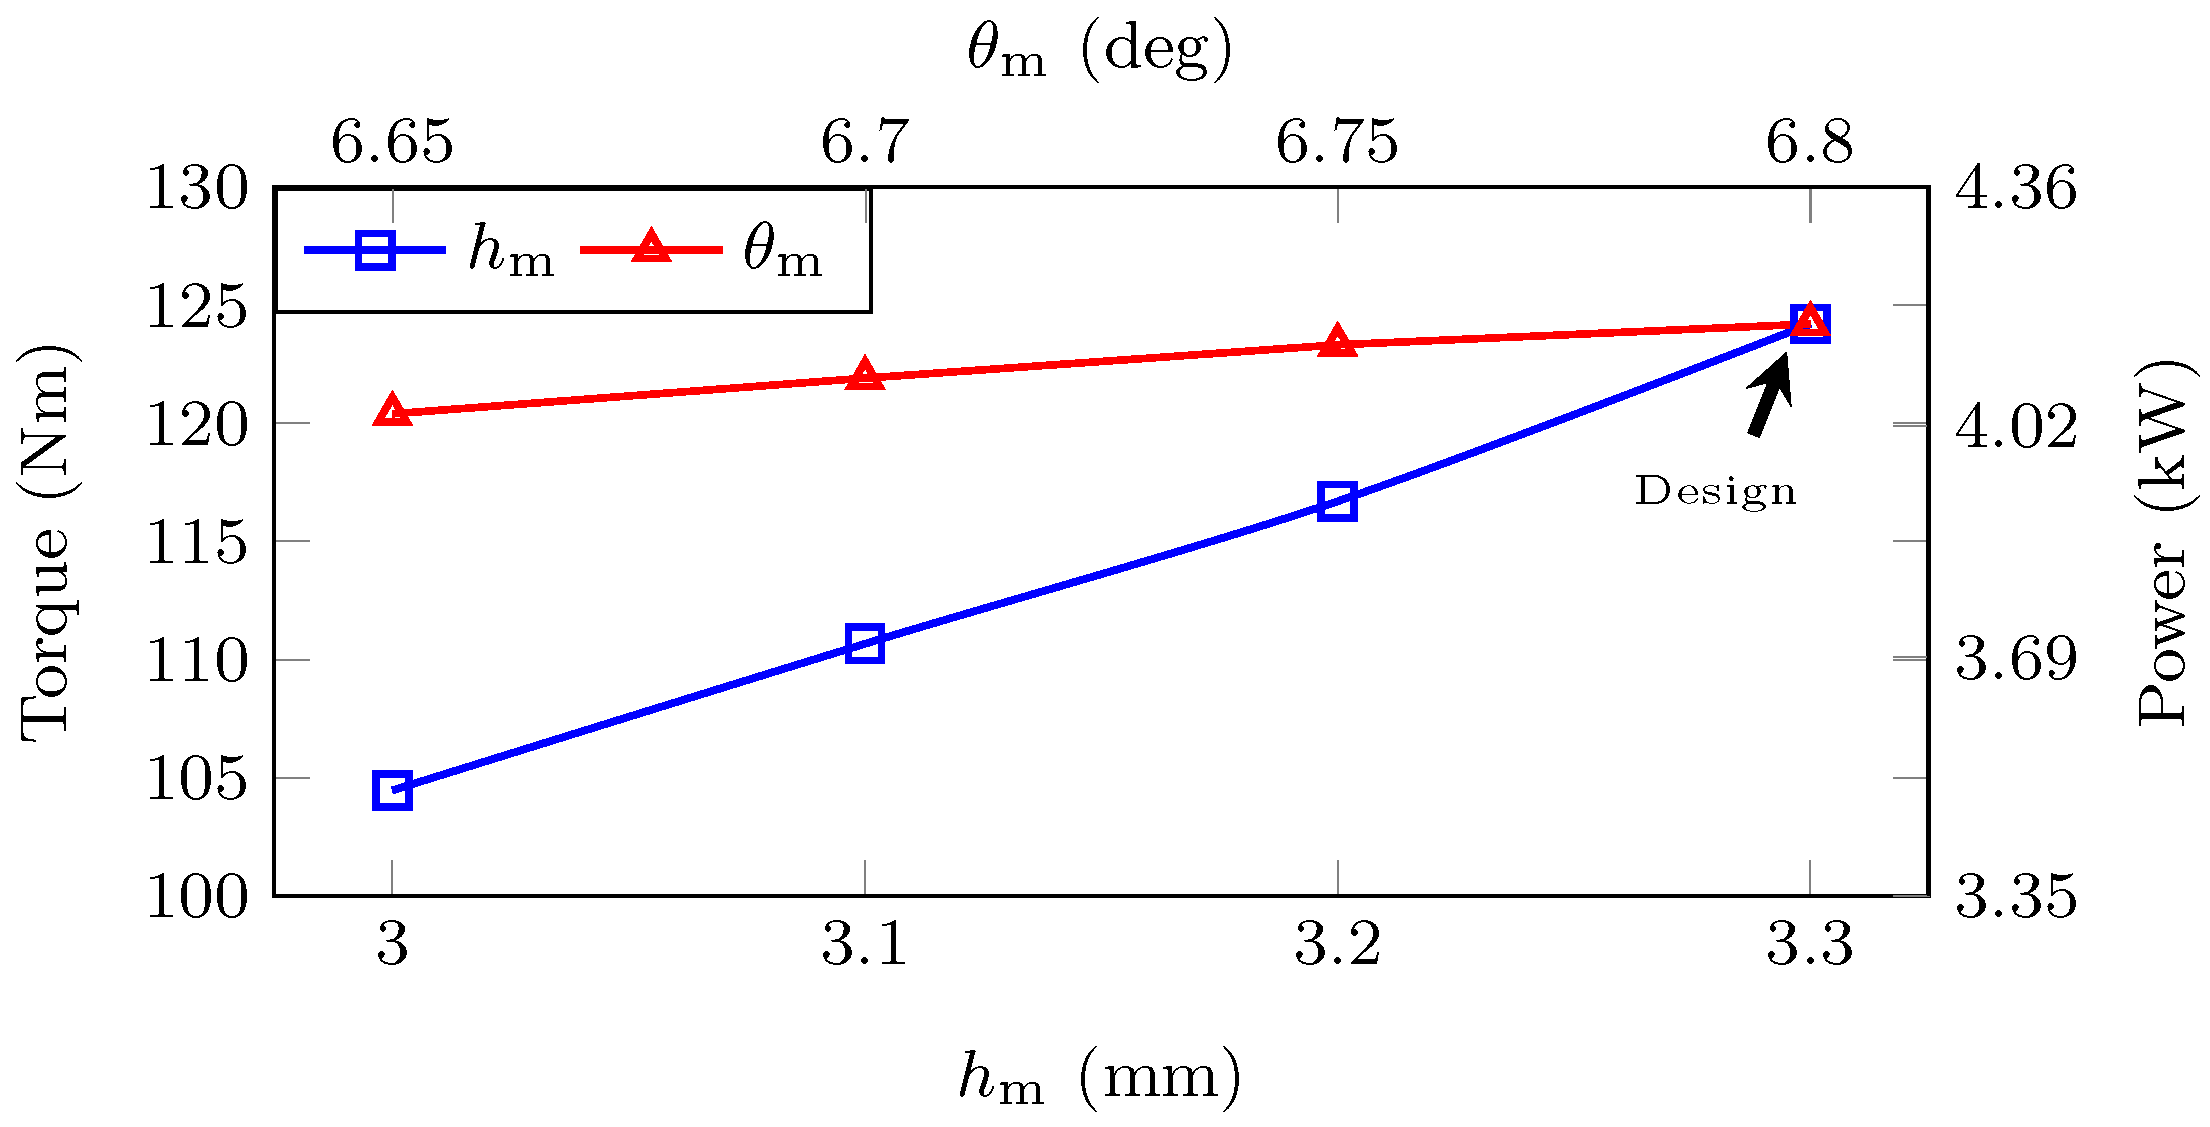
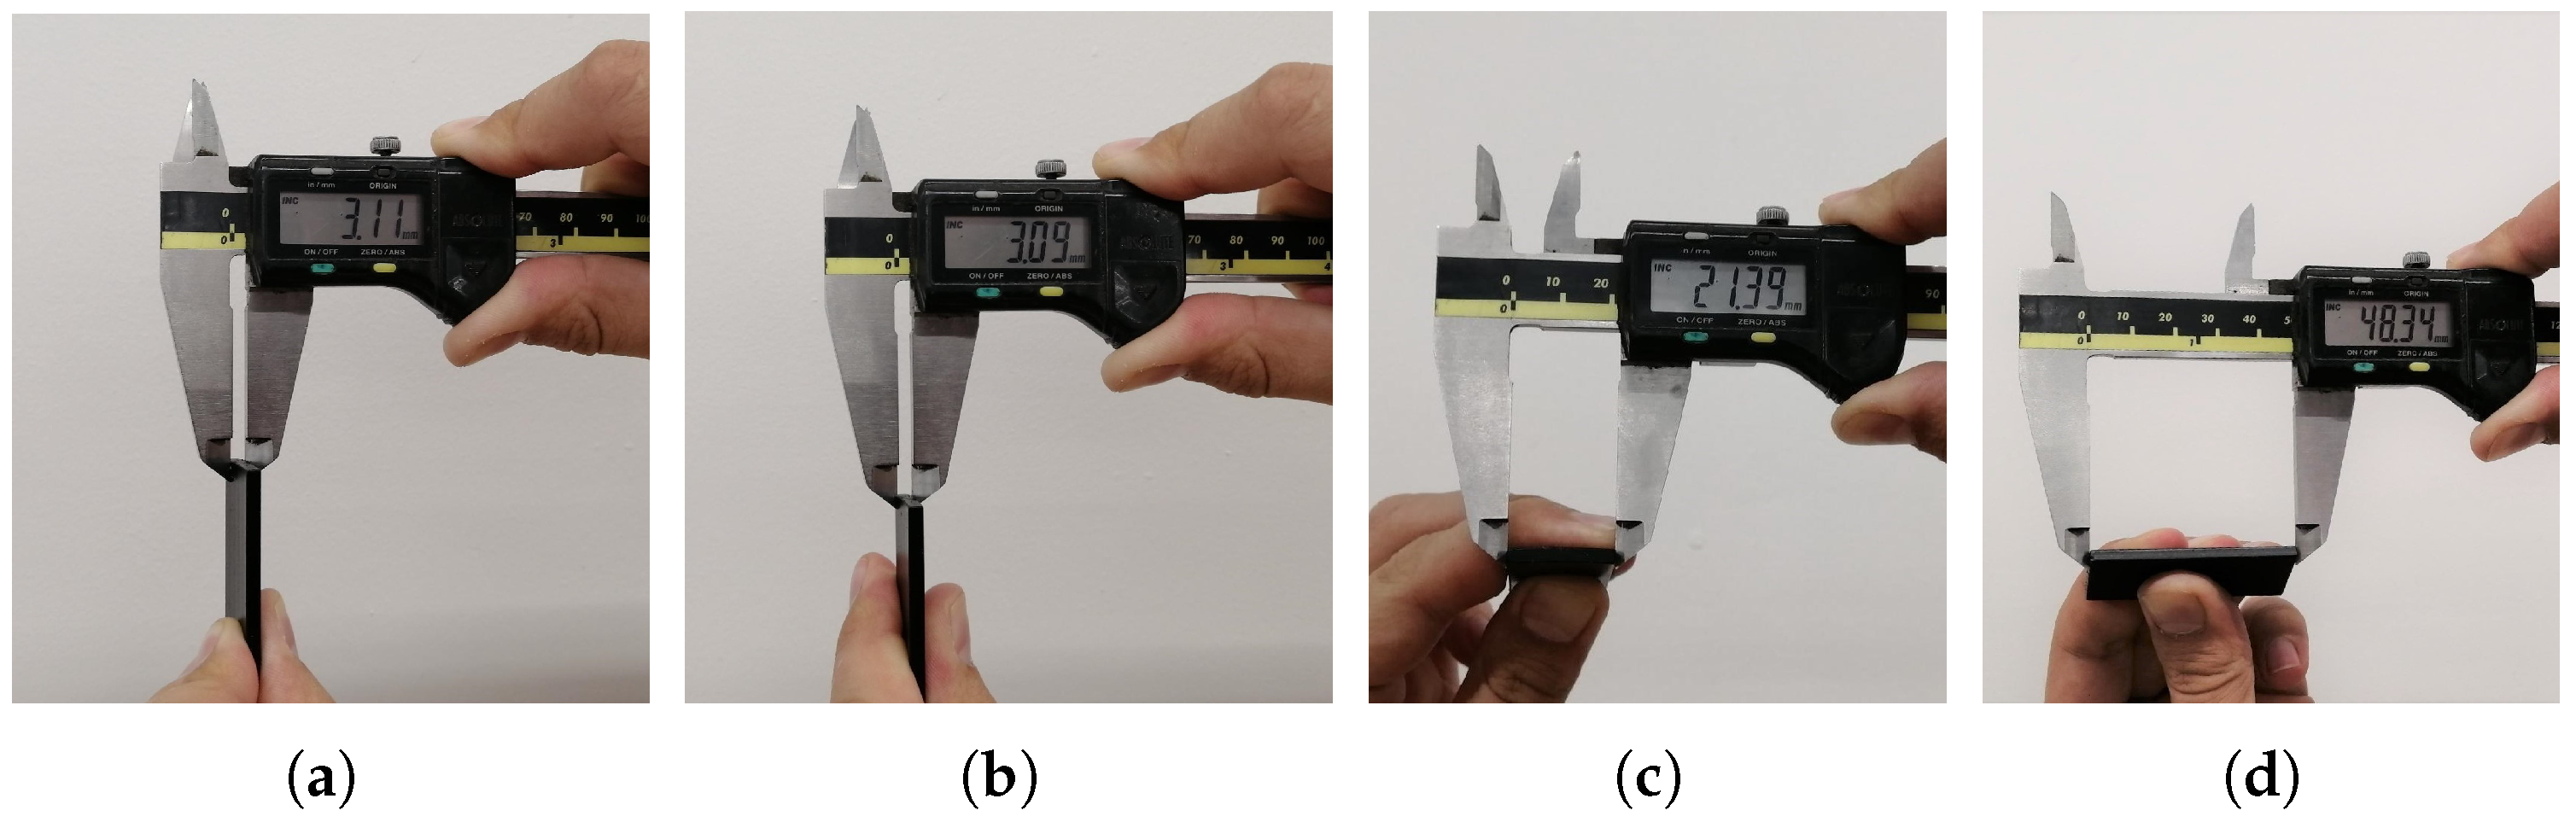
The manufacturer of the prototype’s PMs could only guarantee certain dimensional tolerances on the PMs. Initially, these tolerances were considered insignificant. However, Figure 19 shows that the S-PMSG’s performance was very sensitive to these manufacturing tolerances, i.e., the magnet height h m and the magnet pitch angle θ m . It is shown in Figure 19 that the PMSG’s generated torque was particularly sensitive to h m , seeing as a smaller magnet height also results in a larger air gap. Attempts to measure the height and width of the PMs with a digital calliper are shown in Figure A2 in Appendix B. In Figure A2a,b, it is shown that the average PM height was h m 3.1 mm, instead of the h m = 3.3 mm for which the PMs were designed. Shown also in Figure A2c,d is that the magnet pitch angle and PM length were also slightly below the designed values.
It is shown in Figure 18 that, if the PMs’ dimensions were adjusted in the FEA accordingly, a better correlation between the measured power matching and the FEA (red curve) predicted power matching would be obtained. The measured and FEA results are also summarised in Table 8. The adjusted 2D and 3D FEA results are both included in Table 8. The deviation between the measured and 2D FEA predicted P g in Table 8 at n r = 320 r/min was 5 % 
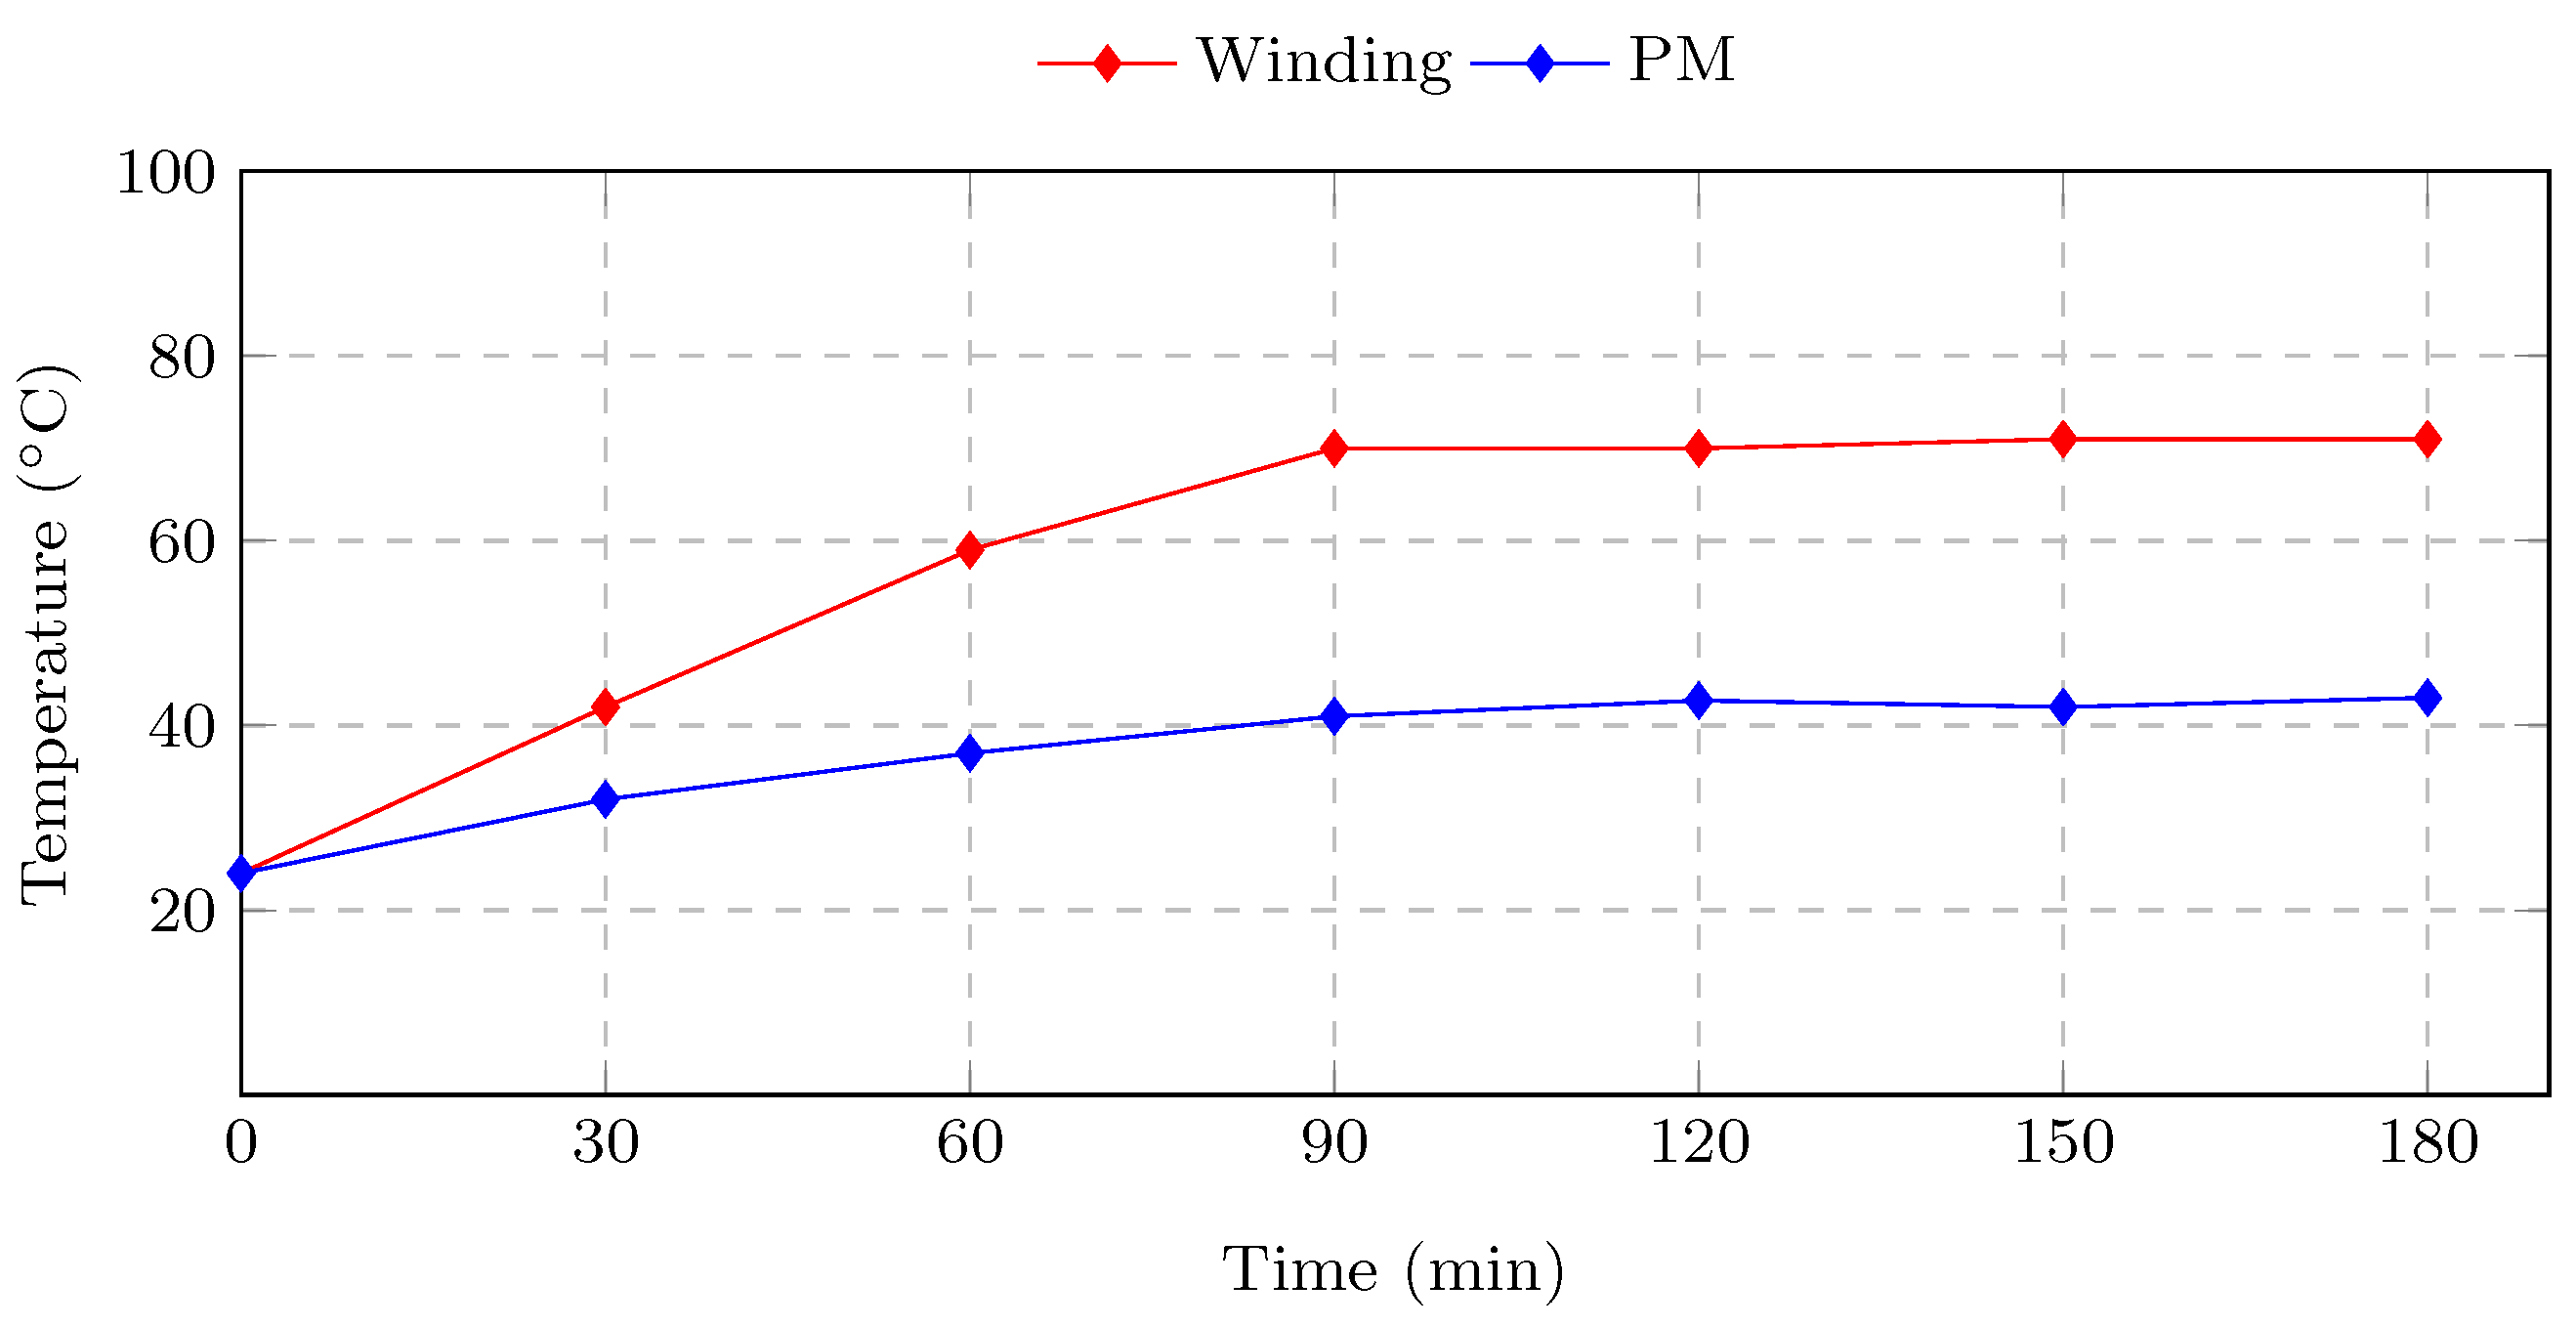
. All measurements were taken at steady-state temperature. The thermal measurements are given in Figure A3 in Appendix B.
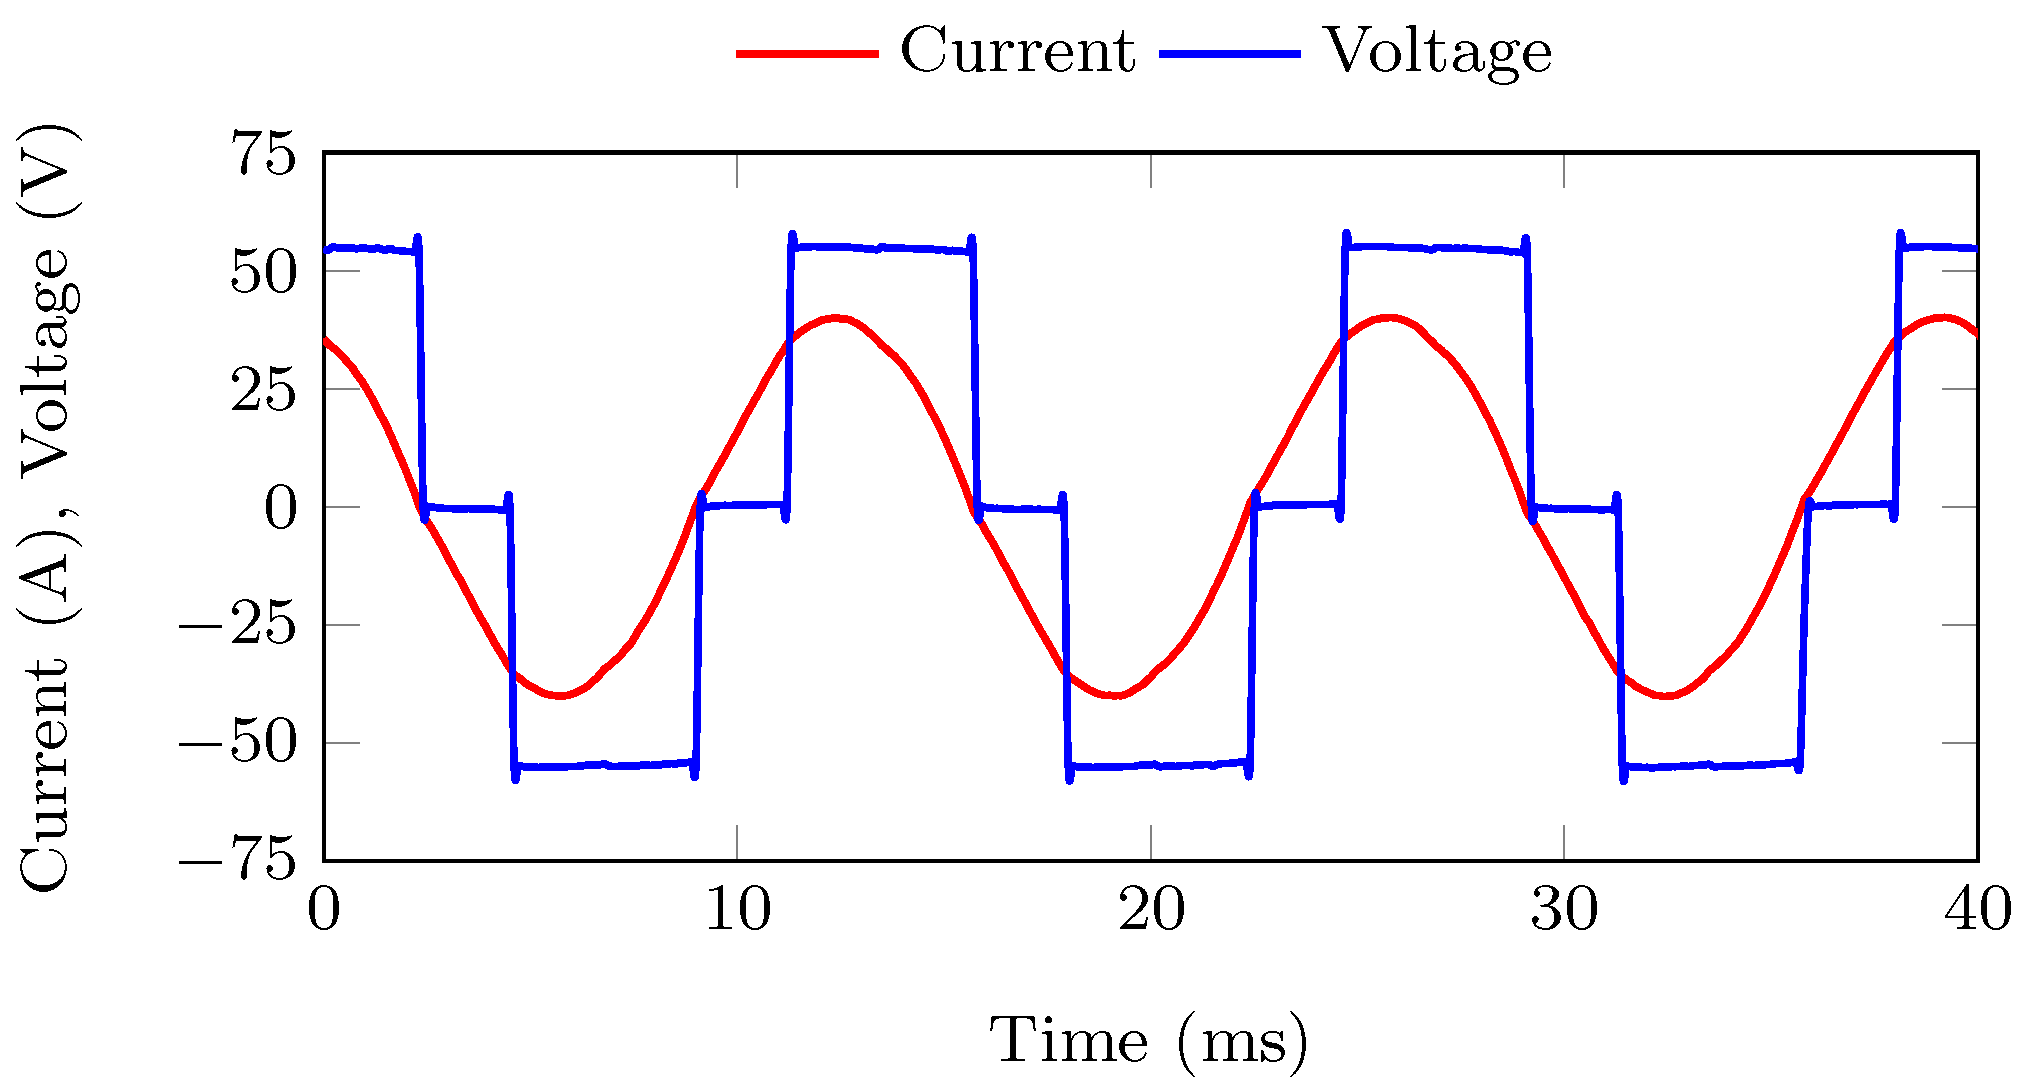
The measured current and voltage waveforms are shown in Figure 20. The current waveform in Figure 20 are sinusoidal and also correctly 30 deg out of phase with the fundamental line voltage, i.e., the PMSG was operating at a unity displacement power factor.

6.2. No-Load and Short-Circuit Measurements

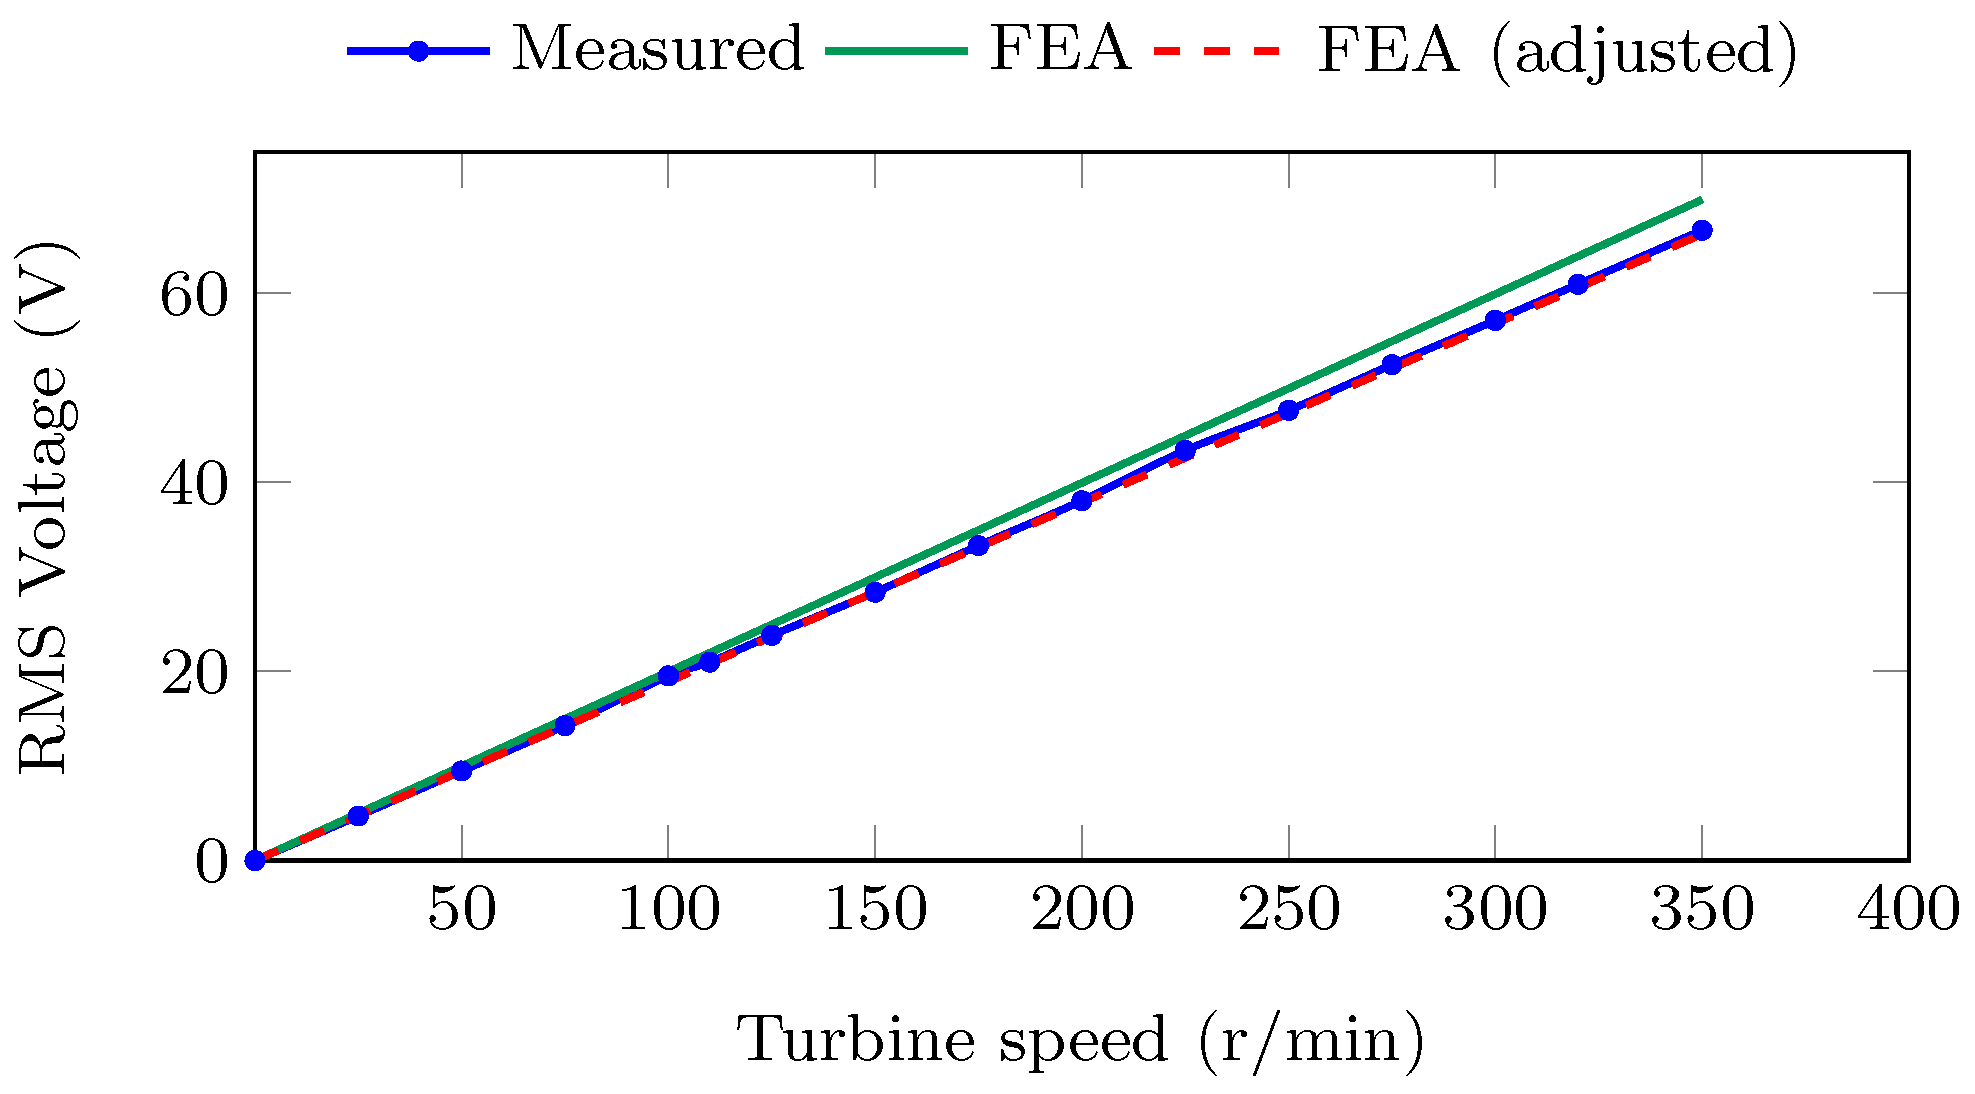
The no-load open-circuit voltage measurements versus FEA-calculated voltage are shown in Figure 21. The values for the measured no-load open circuit voltage at n r = 320 r/min are also summarised in Table 8. The measured versus FEA results in Figure 21 showed a good correlation. This verified the results in the previous subsection and the effect of the manufacturing tolerances of the PMs.
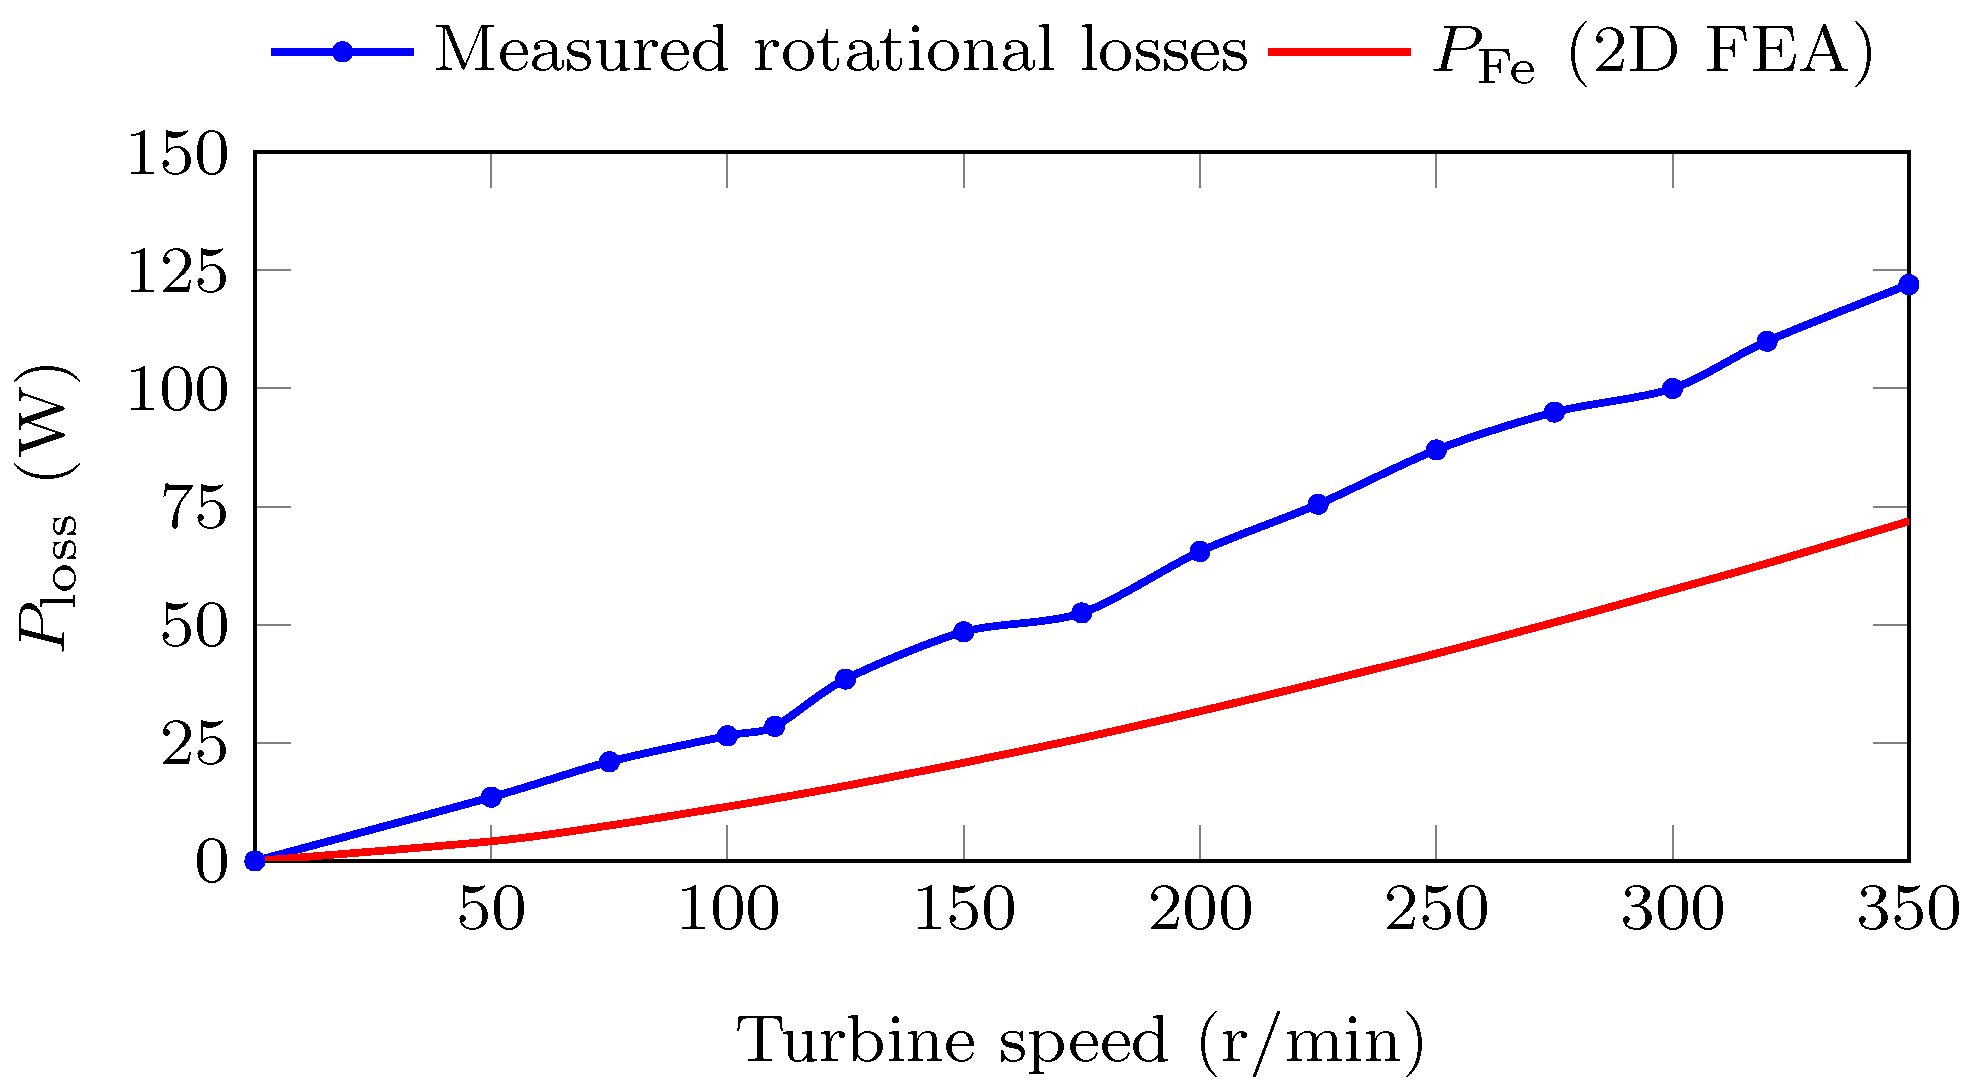
The measured no-load rotational losses are also plotted in Figure 22 and are compared to the no-load 2D FEA-predicted iron losses P Fe . The difference can be attributed to wind and friction losses that were not accounted for in the design process. These additional wind and friction losses then also accounted for a portion of the 5 % difference between the measured and FEA-predicted P g in Figure 18 and Table 8, as well as the difference in efficiency η . The measured rotational losses at n r and rated load were 118 W. As shown in the no-load measurements in Figure 18, wind and friction losses accounted for approximately half of this. the latter indicates that the iron losses P Fe at rated load were slightly higher than what was predicted in the FEA solutions and would account for the lower efficiency measurement in Table 8.
The internal synchronous inductance was measured by means of a number of short-circuit tests to obtain an average value. It is shown in Table 8 that the average measured L s was very close to the FEA calculated values.

7. Conclusions

In this paper, different topology PMSGs were considered in the design process of wind generators for small-scale uncontrolled passive wind generator systems. This was performed to investigate whether the resulting higher internal impedance of the generator, from either using an interior PM rotor or a different stator slot structure, was sufficient to achieve the desired power matching with the wind turbine. The respective PMSGs were designed using a multi-objective design optimisation approach. The following main conclusions were drawn from the investigation:
For PMSGs with surface-mounted PMs on the rotor, it was shown that the required impedance for a natural impedance matching with the wind turbine could be attained by changing the stator structure. Using semi-closed slots, as opposed to open slots, was shown to be a better design choice. Using semi-closed slots reduced the risk of PM demagnetisation and did not compromise the generator’s torque quality. The S-PMSG with semi-closed slots was also the most cost-effective generator and, therefore, ultimately, the optimal generator choice.
Altering the rotor structure and the orientation of the PMs in the rotor to increase the magnetic saliency was shown to be another viable method to achieve the desired impedance matching. However, in this case, it was clear that an open-slot stator structure should be used. The E-PMSG and SP-PMSG topologies also had poor torque quality compared to the S-PMSG generators. Therefore, it is not recommended that these topologies be used for small-scale wind generators. Careful attention should also be paid to the leakage and end-effects of SP-PMSGs, as these can have a significant impact on the generator’s performance if ignored.
The results presented in this paper were validated by a good comparison between the calculated and measured results of a prototype S-PMSG with semi-closed stator slots. However, it was shown that, when the PM material was minimised to the extreme in the design optimisation, the manufacturing tolerances on the PMs could have a significant effect on the power matching results. This was a very important outcome, showing that manufacturing tolerances should be accounted for more rigorously in the design process and manufacturing, especially in relation to PM height.

Author Contributions

Conceptualisation, C.J.J.L. and M.J.K.; methodology, C.J.J.L. and M.J.K.; software, C.J.J.L.; validation, C.J.J.L.; formal analysis, C.J.J.L.; investigation, C.J.J.L.; resources, M.J.K.; data Curation, C.J.J.L.; writing—original draft preparation, C.J.J.L.; writing—review and editing, C.J.J.L. and M.J.K.; visualisation, C.J.J.L.; supervision, M.J.K.; project administration, M.J.K.; funding acquisition, M.J.K. All authors have read and agreed to the published version of the manuscript.

Funding

This research was funded by the Centre for Renewable and Sustainable Energy Studies (CRSES) at Stellenbosch University, South Africa, and the Department of Science and Innovation (DSI) in South Africa.

Acknowledgments

The authors would like to acknowledge K. Cloete and A. W. Labuschagne for their help with the mechanical drawings for the prototype. Thanks also to the workshop staff at the Department of Electrical and Electronic Engineering, Stellenbosch University, for their help with the prototype’s assembly and manufacturing.

Conflicts of Interest

The authors declare no conflict of interest.

Abbreviations

The following abbreviations are used in this manuscript:
FEAFinite-element analysis
HAWTHorizontal axis wind turbine
LCMLeast common multiple
NO-PMSGNon-overlapping winding permanent magnet synchronous generator
NSGA-IINon-dominated sorting genetic algorithm II
PMSGPermanent magnet synchronous generator
S-PMSurface-mounted permanent magnet
E-PMEmbedded interior permanent magnet
SP-PMSpoke-type interior permanent magnet

Appendix A. Additional Design Detail

The 3D Pareto front results are shown in Figure A1. The boundaries and optimal values of the decision variables in the optimisation are summarised in Table A1.
Figure A1. Multi-objective optimisation Pareto front results of all three objectives.
Energies 15 01888 g0a1
Table A1. Decision variables of the optimal selected PMSGs in Table 5.
Open slotBoundariesS-PMSGE-PMSGSP-PMSG
d o (mm) d o 400 375.5374.7382.9
h yr (mm) 6 h yr 20 7.17.01.0
h m (mm) 3 h m 10 4.53.0-
h m (mm) 3 h m 30 --13.3
θ m (deg) c 0.5 θ m 0.9 8.59.3-
b m (mm) c 0.05 b m 0.5 --9.1
h hs (mm) 3 h hs 10 3.03.03.0
h s (mm) 10 h s 75 49.143.348.5
b t (mm) a 0.1 b t 0.7 12.212.811.6
h ys (mm) 6 h ys 20 6.17.16.0
l Fe (mm) 20 l Fe 200 40.047.436.2
Semi-closed slotBoundariesS-PMSGE-PMSGSP-PMSG
d o (mm) d o 400 375.6376.3384.3
h yr (mm) 6 h yr 20 6.27.41.0
h m (mm) 3 h m 10 3.33.0-
h m (mm) 3 h m 30 --12.6
θ m (deg) c 0.5 θ m 0.9 6.88.8-
b m (mm) c 0.05 b m 0.5 --8.8
h hs (mm) 3 h hs 10 3.83.13.1
h s (mm) 10 h s 75 41.537.347.7
b o (mm) b 0.5 b o 1.0 10.512.715.9
b s (mm) a 0.3 b s 0.9 17.519.416.9
h ys (mm) 6 h ys 20 6.06.17.7
l Fe (mm) 20 l Fe 200 48.547.642.4
Boundaries are imposed in terms of the a slot pitch, b slot opening pitch, or c pole pitch.

Appendix B. Supplementary Measurements

Appendix B.1. PM Dimensions

Figure A2 shows the attempted measurements of the actual PM dimensions using a digital calliper. Figure A2a,b is for different PMs to show that the average value was taken.
Figure A2. Measuring the PM dimensions. (a) h m = 3.11 mm; (b) h m = 3.09 mm; (c) θ m < 6.8 deg; (d) l Fe < 48.5 mm.
Energies 15 01888 g0a2

Appendix B.2. Thermal Measurements

The thermal measurements are shown in Figure A3. The thermal measurements confirmed that indirect cooling through self-ventilation would be effective and that the PMs were at low risk of demagnetizing.
Figure A3. Temperature measurements while performing the load tests at rated speed n r .
Energies 15 01888 g0a3

References

  1. Hermanus, L.; Scholtz, L. Small-Scale Renewable Energy Technologies in East Africa: An Overview; Technical Report; WWF South Africa: Cape Town, South Africa, 2018. [Google Scholar]
  2. Fitzgerald, D.; Terblanche, U. Potential East African Localisation of Small-Scale Renewable Energy Manufacture; Technical Report; Centre for Renewable and Sustainable Energy Studies (CRSES): Stellenbosch, South Africa, 2020. [Google Scholar]
  3. Orrell, A.C.; Kazimierczuk, K.; Sheridan, L. Distributed Wind Market Report, 2021st ed.; Technical Report; Pacific Northwest National Laboratory (PNNL): Richland, WA, USA, 2021.
  4. Carroll, J.; McDonald, A.; McMillan, D. Reliability Comparison of Wind Turbines With DFIG and PMG Drive Trains. IEEE Trans. Energy Convers. 2015, 30, 663–670. [Google Scholar] [CrossRef] [Green Version]
  5. Arifujjaman, M.; Iqbal, M.T.; Quaicoe, J.E. Reliability analysis of grid connected small wind turbine power electronics. Appl. Energy 2009, 86, 1617–1623. [Google Scholar] [CrossRef]
  6. Alnasir, Z.; Kazerani, M. An analytical literature review of stand-alone wind energy conversion systems from generator viewpoint. Renew. Sustain. Energy Rev. 2013, 28, 597–615. [Google Scholar] [CrossRef]
  7. Ani, S.O.; Polinder, H.; Ferreira, J.A. Comparison of Energy Yield of Small Wind Turbines in Low Wind Speed Areas. IEEE Trans. Sustain. Energy 2013, 4, 42–49. [Google Scholar] [CrossRef]
  8. Sareni, B.; Abdelli, A.; Roboam, X.; Tran, D. Model simplification and optimization of a passive wind turbine generator. Renew. Energy 2009, 34, 2640–2650. [Google Scholar] [CrossRef] [Green Version]
  9. Tran, D.H.; Sareni, B.; Roboam, X.; Espanet, C. Integrated Optimal Design of a Passive Wind Turbine System: An Experimental Validation. IEEE Trans. Sustain. Energy 2010, 1, 48–56. [Google Scholar] [CrossRef] [Green Version]
  10. Agrebi, H.Z.; Benhadj, N.; Chaieb, M.; Sher, F.; Amami, R.; Neji, R.; Mansfield, N. Integrated Optimal Design of Permanent Magnet Synchronous Generator for Smart Wind Turbine Using Genetic Algorithm. Energies 2021, 14, 4642. [Google Scholar] [CrossRef]
  11. Aredjodoun, J.G.; Chetangny, P.K.; Houndedako, S.; Vianou, A.; Chamagne, D.; Espanet, C. Optimal adaptation of the wind rotor to the permanent magnets synchronous generator of a small passive wind turbine. In Proceedings of the 2019 IEEE PES/IAS PowerAfrica, Abuja, Nigeria, 20–23 August 2019; pp. 164–169. [Google Scholar]
  12. Cavagnino, A.; Bramerdorfer, G.; Tapia, J.A. Optimization of electric machine Designs-Part II. IEEE Trans. Ind. Electron. 2017, 65, 1700–1703. [Google Scholar] [CrossRef]
  13. Bramerdorfer, G.; Tapia, J.A.; Pyrhönen, J.J.; Cavagnino, A. Modern electrical machine design optimization: Techniques, trends, and best practices. IEEE Trans. Ind. Electron. 2018, 65, 7672–7684. [Google Scholar] [CrossRef]
  14. Jung, S.Y.; Jung, H.; Hahn, S.C.; Jung, H.K.; Lee, C.G. Optimal Design of Direct-Driven PM Wind Generator for Maximum Annual Energy Production. IEEE Trans. Magn. 2008, 44, 1062–1065. [Google Scholar] [CrossRef]
  15. Isfahani, A.H.; Boroujerdi, A.H.S.; Hasanzadeh, S. Multi-objective design optimization of a large-scale directdrive permanent magnet generator for wind energy conversion systems. Front. Energy 2014, 8, 182–191. [Google Scholar] [CrossRef]
  16. Bazzo, T.; Kolzer, J.; Carlson, R.; Wurtz, F.; Gerbaud, L. Multidisciplinary design optimization of direct-drive PMSG considering the site wind profile. Electr. Power Syst. Res. 2016, 141, 467–475. [Google Scholar] [CrossRef]
  17. Dmitrievskii, V.; Prakht, V.; Kazakbaev, V. Design optimization of a permanent-magnet flux-switching generator for direct-drive wind turbines. Energies 2019, 12, 3636. [Google Scholar] [CrossRef] [Green Version]
  18. Labuschagne, C.J.J.; Kamper, M.J. Wind Generator Impedance Matching in Small-Scale Passive Wind Energy Systems. IEEE Access 2021, 9, 22558–22568. [Google Scholar] [CrossRef]
  19. Stegmann, J.A.; Kamper, M.J. Design Aspects of Double-Sided Rotor Radial Flux Air-Cored Permanent-Magnet Wind Generator. IEEE Trans. Ind. Appl. 2011, 47, 767–778. [Google Scholar] [CrossRef]
  20. Labuschagne, C.J.J.; Kamper, M.J. Evaluation of PM Rotor Topologies for Impedance Matching of Small-Scale Passive DC-Connected Wind Generator Systems. In Proceedings of the 2020 International Conference on Electrical Machines (ICEM), Gothenburg, Sweden, 23–26 August 2020; Volume 1, pp. 1896–1902. [Google Scholar] [CrossRef]
  21. Mohan, N.; Undeland, T.M.; Robbins, W.P. Power Electronics: Converters, Applications, and Design; John Wiley & Sons: Hoboken, NJ, USA, 2003. [Google Scholar]
  22. Chen, H.; Zuo, Y.; Chau, K.T.; Zhao, W.; Lee, C.H.T. Modern electric machines and drives for wind power generation: A review of opportunities and challenges. IET Renew. Power Gener. 2021, 15, 1864–1887. [Google Scholar] [CrossRef]
  23. EL-Refaie, A.M. Fractional-Slot Concentrated-Windings Synchronous Permanent Magnet Machines: Opportunities and Challenges. IEEE Trans. Ind. Electron. 2010, 57, 107–121. [Google Scholar] [CrossRef]
  24. Madariaga, C.; Jara, W.; Tapia, J.A.; Pyrhönen, J.; Lindh, P.; Riedemann, J.A. Closed-Form Solution for the Slot Leakage Inductance of Tooth-Coil-Winding Permanent Magnet Machines. IEEE Trans. Energy Convers. 2019, 34, 1572–1580. [Google Scholar] [CrossRef]
  25. Pyrhonen, J.; Jokinen, T.; Hrabovcova, V. Design of Rotating Electrical Machines; John Wiley & Sons: West Sussex, UK, 2013. [Google Scholar]
  26. Chirca, M.; Oprea, C.; Teodosescu, P.D.; Breban, S. Optimal design of a radial flux spoke-type interior rotor permanent magnet generator for micro-wind turbine applications. In Proceedings of the 2016 International Conference on Applied and Theoretical Electricity (ICATE), Craiova, Romania, 6–8 October 2016; pp. 1–5. [Google Scholar] [CrossRef]
  27. Potgieter, J.H.J.; Kamper, M.J. Calculation Methods and Effects of End-Winding Inductance and Permanent-Magnet End Flux on Performance Prediction of Nonoverlap Winding Permanent-Magnet Machines. IEEE Trans. Ind. Appl. 2014, 50, 2458–2466. [Google Scholar] [CrossRef]
  28. Volpe, G.; Marignetti, F.; Roggia, S.; Popescu, M.; Goss, J. Modified 2-D Model for 3-D Rotor Magnet Leakage Effects in PM Spoke Machines. IEEE Trans. Ind. Appl. 2019, 55, 3087–3096. [Google Scholar] [CrossRef]
  29. Deb, K.; Pratap, A.; Agarwal, S.; Meyarivan, T. A fast and elitist multiobjective genetic algorithm: NSGA-II. IEEE Trans. Evol. Comput. 2002, 6, 182–197. [Google Scholar] [CrossRef] [Green Version]
Figure 1. Single-line diagram of a passive wind energy system with an uncontrolled diode rectifier and battery storage.
Energies 15 01888 g001
Figure 2. Wind turbine power versus speed curves, with wind generator impedance matching examples.
Energies 15 01888 g002
Figure 3. Schematic of the off-centre wind generator and tail vane assembly. (a) Side view. (b) Top view.
Energies 15 01888 g003
Figure 4. Per-phase dq-equivalent circuit diagram of the PMSG.
Energies 15 01888 g004
Figure 5. Passive system phasor diagrams.
Energies 15 01888 g005
Figure 6. Stator slot structures and dimensions. (a) Open slot with rectangular teeth. (b) Semi-closed slot.
Energies 15 01888 g006
Figure 7. Rotor structures and dimensions. (a) Surface-mounted PM rotor; (b) embedded PM rotor; (c) interior PM spoke-type rotor.
Energies 15 01888 g007
Figure 8. Enlarged section of an SP-PMSG, showing the PM flux paths and leakage flux in the rotor.
Energies 15 01888 g008
Figure 9. Design and optimisation flow diagram [12].
Energies 15 01888 g009
Figure 10. (a) Passive system phasor diagram with external impedance matching, Z ext . (b) Single-line diagram of the PM wind generator with external inductance for impedance matching connected in the passive wind turbine system. The optimisation (15) accordingly minimises Z ext to zero if possible.
Energies 15 01888 g010
Figure 11. Multi-objective optimisation Pareto front results. (a) Open slots; (b) semi-closed slots.
Energies 15 01888 g011
Figure 12. Power curves of the selected PMSGs in Table 5. (a) Open slots; (b) semi-closed slots.
Energies 15 01888 g012
Figure 13. FE-predicted cogging torque and torque ripple of the S-PMSG with semi-closed slots and the SP-PMSG with open slots in Table 5. (a) Cogging torque, Δ T cog ; (b) torque ripple, Δ T r .
Energies 15 01888 g013
Figure 14. Demagnetisation prediction at different temperatures (indicated by red colour in the magnets) for the S-PMSGs in Table 5 at rated conditions (320 r/min and full load), using NdFeB N48. (a) S-PMSG open slots, 50 ° C PM temperature; (b) S-PMSG semi-closed slots, 80 ° C PM temperature.
Energies 15 01888 g014
Figure 15. Three-dimensional FEA models for some of the PMSGs in Table 5. (a) S-PMSG, semi-closed slots; (b) SP-PMSG, open slots.
Energies 15 01888 g015
Figure 16. S-PMSG prototype with semi-closed slots. (a) PMSG; (b) design versus actual end-winding overhang length.
Energies 15 01888 g016
Figure 17. Experimental test bench setup of the manufactured PMSG prototype.
Energies 15 01888 g017
Figure 18. Measured power matching results of the S-PMSG prototype.
Energies 15 01888 g018
Figure 19. Effect of PM manufacturing tolerances on the generated torque and power at n r = 320 r/min.
Energies 15 01888 g019
Figure 20. Measured phase current and line voltage at n r = 320 r/min, showing the operation at a unity displacement power factor.
Energies 15 01888 g020
Figure 21. Measured open-circuit voltage versus FEA-calculated voltage.
Energies 15 01888 g021
Figure 22. Measured no-load open-circuit losses versus no-load FEA-calculated iron losses.
Energies 15 01888 g022
Table 1. Summary of specified operating points.
n c n r
Wind speed3 m/s12 m/s
Turbine speed110 r/min320 r/min
Generated power, P g 0 kW 4.2 kW
Battery/DC grid voltage, V b 48 V
Table 2. Predicted PMSG dq values at rated power.
P = 1.0 pu         V b = 1.0 pu         I s = 1.0 pu         E g = 2.91 pu
V d = 0.94 pu            I d = 0.94 pu X d = 2.73 pu
V q = 0.344 pu            I q = 0.344 pu X q = 2.73 pu
Table 3. Comparison of potential slot–pole combinations for machines with fractional-slot concentrated windings.
Slot-Pole36–3036–3230–28
(6–5)(9–8)(15–14)
LCM( Q s , p)180288420
k w , working harmonic winding factor0.9330.9450.951
τ d , differential harmonic leakage flux coefficient1.431.431.40
Table 4. Typical saliency properties of different rotor structures and relative slot-leakage inductance of different stator slot openings.
Rotor StructureSaliency, ξ Stator Structure L sl
Surface-mounted PM L q L d Open slotSmaller L sl
Interior embedded PM L q > L d Semi-closed slotLarger L sl
Interior-spoke-type PM L q > L d
Table 5. Comparison of selected Pareto front PMSG solutions.
Open SlotS-PMSGE-PMSGSP-PMSG
M PM (kg)1.00.870.92
M active (kg)19.4921.6719.60
Z ext ( Ω )0.3600
P g (kW)4.184.174.12
η (%)89.189.889.8
J (A/mm 2 )5.04.934.97
T g (Nm)124.9124.3122.8
L q (mH)2.713.903.43
L d (mH)2.582.943.00
ξ 1.051.331.14
X s (pu)1.62.482.28
d o (mm)376375383
l Fe (mm)404736.2
Semi-closed slotS-PMSGE-PMSGSP-PMSG
M PM (kg)0.720.820.99
M active (kg)21.3320.7223.15
Z ext ( Ω )000
P g (kW)4.264.104.10
η (%)89.889.989.8
J (A/mm 2 )5.05.04.9
T g (Nm)127.1122.2122.4
L q (mH)3.124.253.95
L d (mH)2.953.012.69
ξ 1.061.411.41
X s (pu)1.952.522.37
d o (mm)376376384
l Fe (mm)494842
Table 6. Comparison of PMSG torque quality.
Open slotS-PMSGE-PMSGST-PMSG
Δ T cog , (%)1.21.22.0
Δ T r , (%)6.612.412.5
Semi-closed slotS-PMSGE-PMSGST-PMSG
Δ T cog , (%)1.51.92.1
Δ T r , (%)4.913.017.1
Table 7. Comparison of 2D versus 3D FEA PMSG performance.
Open slotS-PMSGE-PMSGSP-PMSG
2D3D2D3D2D3D
T g (Nm)124.9128.8124.3131.6122.8113.7
η (%)89.189.489.890.089.888.7
P Fe at n r (W)25.128.521.937.520.731.8
P Fe at n c (W)10.712.610.012.311.410.5
Semi-closed slotS-PMSGE-PMSGSP-PMSG
2D3D2D3D2D3D
T g (Nm)127.1126.7122.2118.9122.4115.4
η (%)89.889.989.889.289.889.0
P Fe at n r (W)31.333.929.449.826.535.0
P Fe at n c (W)13.912.512.413.711.611.8
Table 8. Summary of C-PMVG prototype measurements.
FEA (Adjusted)Measured
2D3D
Parameters
- PM height, h m (mm)3.13.1
- PM angle, θ m (deg)6.756.75
- PM length, l Fe (mm)48.3548.35
- Phase resistance, R s ( Ω )0.1330.1330.130
- Synchronous inductance, L s (mH)3.233.463.48
Performance at n r = 320 r/min
- P g (kW)3.433.463.26
- η (%)89.388.686.5
     P rot (W) 118
     P Cu (W) 337
- E g (V)61.460.660.9
Publisher’s Note: MDPI stays neutral with regard to jurisdictional claims in published maps and institutional affiliations.

