Article

Effect of the Hot Streak on the Overall Cooling Performance of a Coated Rotor Blade

School of Mechanical Engineering, Xiangtan University, Xiangtan 411105, China
*
Author to whom correspondence should be addressed.
Energies 2022, 15(5), 1887; https://doi.org/10.3390/en15051887
Submission received: 10 September 2021 / Revised: 18 October 2021 / Accepted: 19 October 2021 / Published: 3 March 2022

Abstract

:
The influence of the HS (hot streak) and unsteady wake on the overall cooling performance of a rotor blade was studied in this paper. The results show that: (1) Both the magnitude and temperature of the HS gradually drops down as it passes downstream of the vane passage. (2) Within one stator period, the highest cooling performance of the blade can be observed at the initial time points, when the LE (leading edge) of the blade turns towards the trailing edge of the vane. (3) The lowest cooling performance of the blade can be observed at the time point 0.5 T, when the LE of the blade turns towards the center of the vane passage. (4) Surface temperatures in areas with unfavorable local heat flow are usually higher than the temperature of the coolant. The additional TBCs may exert adverse effects on heat dissipation from the substrate metal to the mainstream, which has a negative effect on the improvement of the overall cooling effectiveness of the coated blade. (5) Within a stator period, a relatively higher overall cooling effectiveness increment due to the coating can be observed at the relative location with lower cooling performance. Consequently, the additional TBCs are beneficial for decreasing the surface temperature difference and thus controlling the thermal stress under the HS inlet condition.

1. Introduction

To achieve higher performance and efficiency, the gas temperature of the turbine stage inlet far exceeds the melting point of the metal material [1,2]. To protect the blades in such harsh running conditions, thermal protection technologies are always needed in the blade design, which usually include internal and external cooling. External cooling is divided into film cooling and thermal barrier coating (TBC) technology [3,4,5].
For a film-cooled blade, coolant forms a protective cooling film over the blade surface to reduce the surface temperature. For a coated blade, additional TBCs can reduce blade temperature gradients without reducing the gas turbine efficiency. The blade cooling performance can be improved by the combination of film cooling and TBC technologies. Bohn [6] conducted numerical simulations on the cooling performance of the Mark II vane with internal cooling and TBCs. Their research showed that the SS (suction side) of the vane results in a relatively higher increment of the overall cooling effect. For the film-cooled blade with coatings, the coatings prevent heat transfer to the substrate metal in most parts of the blade. In the negative local heat flux components, the coatings hinder the heat dissipation of the substrate metal surface, which is harmful to the improvement of the cooling performance. Shi [7] researched the comprehensive effects of multi-layer TBCs on the cooling performances of C3X vane with film cooling; they concluded that the additional thermal barrier coatings can both reduce the surface temperature of the blade and have the opposite effect.
The high-pressure turbine stage is located at the exit of the combustion chamber. Due to the combined effects of the combustion chamber structure, combustion and the cooling arrangement, significant circumferential and radial temperature gradients can be observed at the exit of the combustion chamber [8,9]. The high-temperature core is called the “hot streak” [8,9]. Feng [8,9] reviewed the research progress on HS migration inside the gas turbine stage. Griffini [10] studied the cooling performance of turbine blades with film cooling under the HS effect. They concluded that the HS exerted the greatest influence on the LE of the vane heat load distribution when the HS directly faces the LE of the vane. Shang [11] studied the influence of the HS on the turbine blade heat load distribution. They concluded that the HS significantly increased the non-uniformity of the heat load distribution over the blade surface. Shi [12] studied the effect of the HS on the overall cooling performance of the turbine vane additional TBCs and film cooling. They concluded that TBCs could reduce the influence of the hot streaks on the overall cooling performance. A large number of studies have shown that the migration of the HS is mainly affected by the separation of the hot and cold gas flow, secondary flow, buoyancy and rotor–stator interaction inside the turbine stage [13,14,15,16]. Due to the rotor–stator interaction, the HS may occur at any circumferential location. Therefore, reasonable matching of the HS circumferential position and the “clocking effect” between blade rows is expected to improve aerodynamic efficiency and reduce heat load to a certain extent [13]. Jenny [13] studied the influence of unsteady rotor–stator interaction on the HS migration in the turbine stage. They concluded that HS would cause a high heat load on the blade surface of the high-pressure turbine stage. Zhou [14] studied the comprehensive effect of the HS and unsteady wake on the flow field of the blade passage. They concluded that the HS circumferential position influences the interactions between the HS and the unsteady wake [14].
With the increase of the inlet temperature of the gas turbine, the influence of the HS on the aerodynamic and heat transfer mechanism inside the gas turbine becomes more and more complicated [15,16,17,18]. Research on the HS migration phenomenon inside the turbine stage has not only determined the design of the cooling arrangement of the turbine cascade, but also the consumption of coolant which is critical to the overall aerodynamic performance of the gas turbine [15,16]. Being under the direct effect of the HS, the combination of film cooling with TBC technologies has become a development trend in cooling arrangement designs for the first stage of gas turbines [15,16]. However, most of the current literature only focuses on the influence of the HS on the cooling performance of the uncoated vane or blade, and few studies have focused on the coated blade [17,18]. Based on these viewpoints, unsteady numerical simulation has been applied to the gas turbine stage with rows of the NASA C3X guide vane and a VKI rotor blade in this study. The HS is located at the center of the guide vane passage. The influence of the HS and unsteady wake on the overall cooling performance of four different time points within one stator period have been studied to reveal the influence of the HS on TBC insulation and overall cooling performance of the coated blade.

2. Materials and Methods

2.1. Mesh Generation and Calculation Techniques

In this paper, the single-stage turbine cascade was used as the physical model of calculation [19]. The computational domain contained one stator vane, two rotor blades and their surrounding fluid domains. The computational domain extended 1.5 Cax upstream of the stator vane and 1.5 Cax downstream of the rotor blade [20]. The stator vane was an internally cooled C3X vane, as seen in Figure 1. The main geometric characteristics of the C3X vane and the VKI blade are shown in Table 1. Ten cylindrical cooling channels were arranged inside the C3X vane [19,21].
The central coordinates of the 10 cooling channels are shown in references [19,20]. Three cylindrical cooling channels were mounted on the LE, pressure side (PS) and SS of the VKI blade [22]. The diameter of the cooling channels is shown in Table 2.
In order to study the effect of HS on the thermal insulation performance of the TBCs, a layer of thermal barrier coating with a thickness of 0.52 mm was installed on the external surface of the substrate metal of the two rotor blades [23,24]. The material properties are shown in Table 3.
The computational domain and mesh are shown in Figure 2, respectively. The left and right sides of the calculation domain were set as the boundary conditions of the rotation period [19]. The upper and lower sides were set as the insulation wall surfaces. In this paper, the experimental working condition Case 4521 from the literature [19] was selected as the verification and reference working condition. The total inlet pressure of the gas was 213.286 kPa, with a uniform turbulence intensity Tu of 8.0%. The mass average total temperature of the hot gas was 818 K [19].
The temperature profile of the HS was fitted with a polynomial, as seen in Figure 3 [20]. In Figure 3, the normalized temperature ratio θ was the temperature ratio between the circumferentially averaged temperature and the mass-averaged temperature of the mainstream. For the rotor blade, the mass flow rate of the coolant was about 3% of the mainstream [25]. The temperature of the coolant was 50% of the mainstream [25]. In addition, the mass flow of coolant of the LE, SS and PS cylindrical cooling channels were 40%, 35% and 25% of the total coolant, respectively [26]. The boundary conditions of C3X internal cooling channels were consistent with Case Run 157 [19].
To estimate the influences of the HS on the aerothermal and TBC insulation performance of the blade, an unsteady numerical calculation was conducted with the commercial code ANSYS FLUENT 18.2 [17]. Both the mainstream and coolant were defined as the ideal compressible gases [18]. The molecular viscosity and thermal conductivity of the gas were controlled as a function of temperature [19]. The specific heat capacity of the gas was fitted with a temperature polynomial. The k-ε model was used to solve the turbulence model. The governing equation was handled by the space discrete method of the finite volume method [19]. The pressure and velocity coupling were handled with the SIMPLE algorithm [21]. To estimate the influences of the rotor–stator interaction, the rotor–stator interface was handled with a sliding mesh method. A total of 128 physical time steps were selected for each stator period [19]. In addition, 20 steady sub-iteration steps were selected for each physical time [19]. Three mesh systems were handled to validate the experimental results [21]. The dimensionless temperature distributions along the mid-span are shown in Figure 4. The maximum deviations between calculated values of different meshes were smaller than 5%. As all the mesh systems had been validated with experimental results, the medium-mesh was selected for simulation. The local mesh refinement method was applied in the boundary layer mesh. The value of y+ of the grids in the region close to the blade surface was below 2 for the medium mesh model. In order to improve the calculation accuracy, the residual levels of the continuity equation, the momentum equation and the energy equation were reduced to 10−5, 10−5 and 10−8, respectively. The convergence history of the normalized pressure and temperature ratio were monitored and recorded during the unsteady numerical simulation, as seen in Figure 5. It can be observed that the profiles were periodic over time after 4 stator periods, which indicates the convergence of the unsteady simulation.

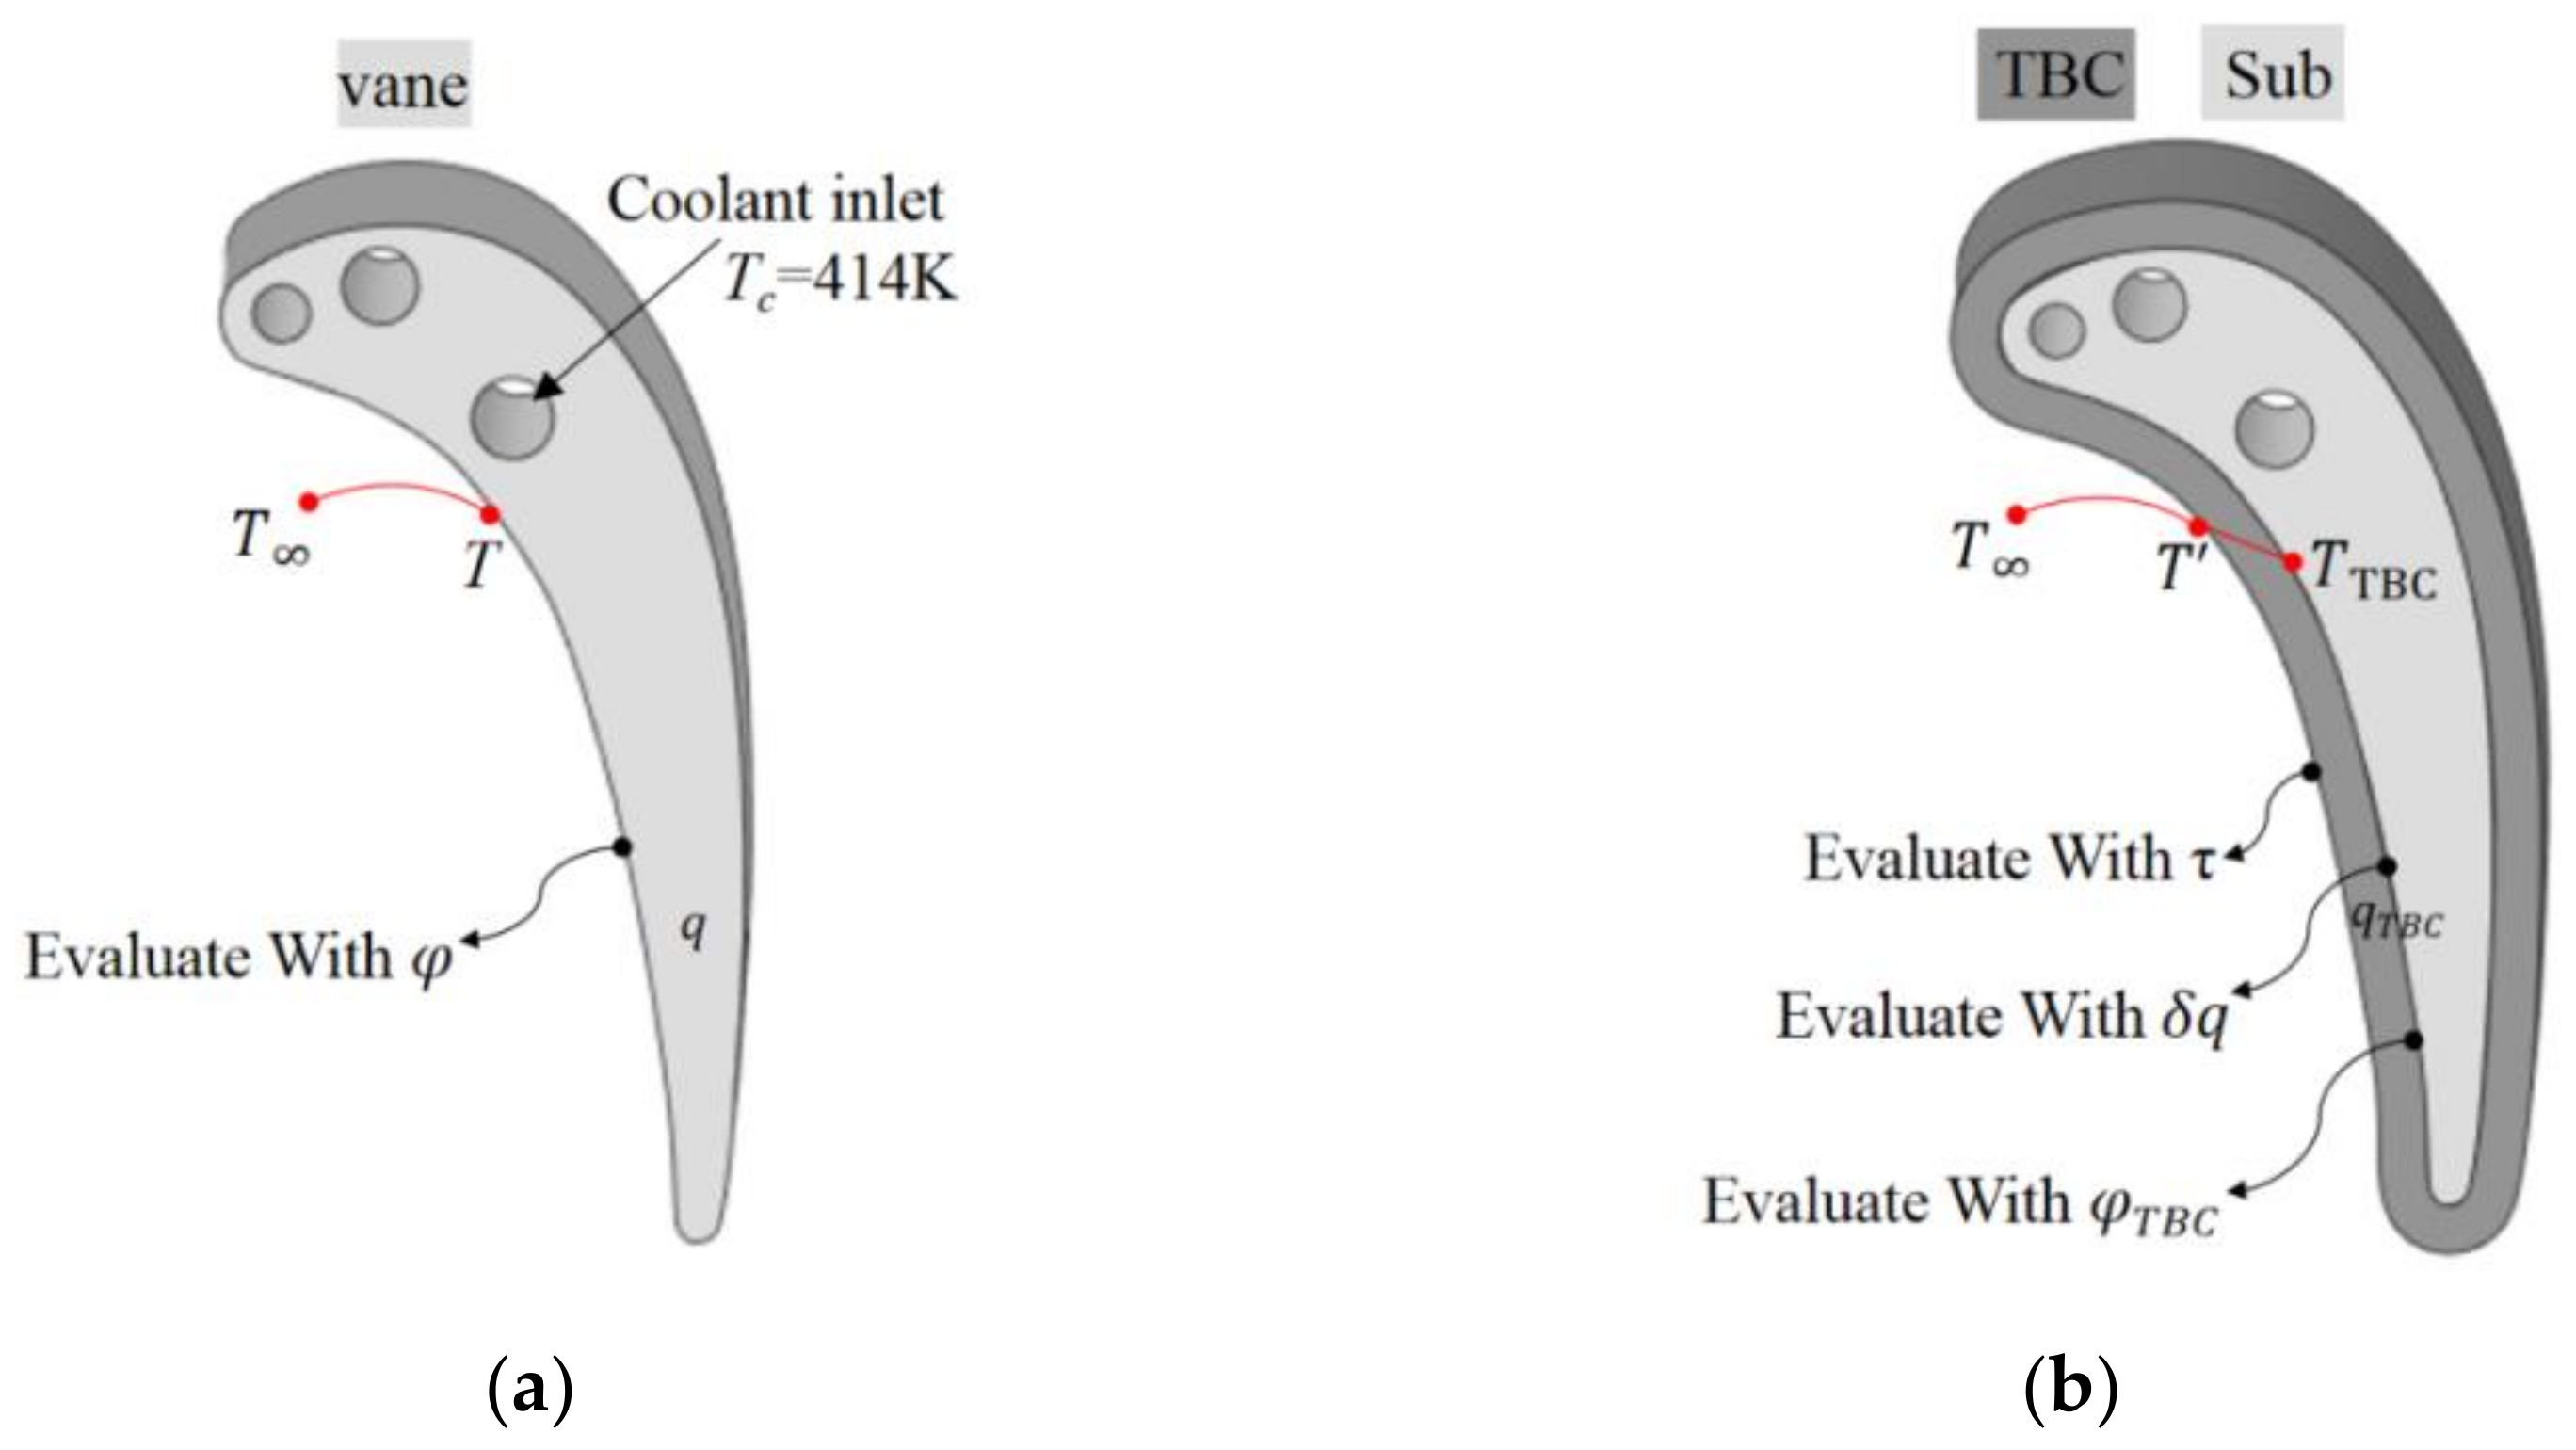
2.2. Thermal Parameter Definition

In this paper, Formulas (1)–(4) are used to define thermal parameters, as seen in Figure 6.
(1)
Overall cooling effectiveness   φ :
φ = T T w T T c
(2)
Overall cooling effectiveness ( φ T B C ) :
φ T B C = T T T B C T T c
The above two parameters were used to analyze the overall cooling performance of the uncoated and coated rotor blade.
(3)
The local heat flux reduction δq due to the TBCs:
δ q = q q T B C
Local heat flux reduction (δq) could be analyzed due to the influence of TBCs on the heat flux drop.
(4)
Overall cooling effectiveness increment due to the TBCs   δ ϕ :
δ ϕ = ϕ T B C ϕ ϕ × 100 %
Overall cooling effectiveness increment   δ ϕ could be analyzed due to the influence of TBCs on the metal temperature.

3. Discussion

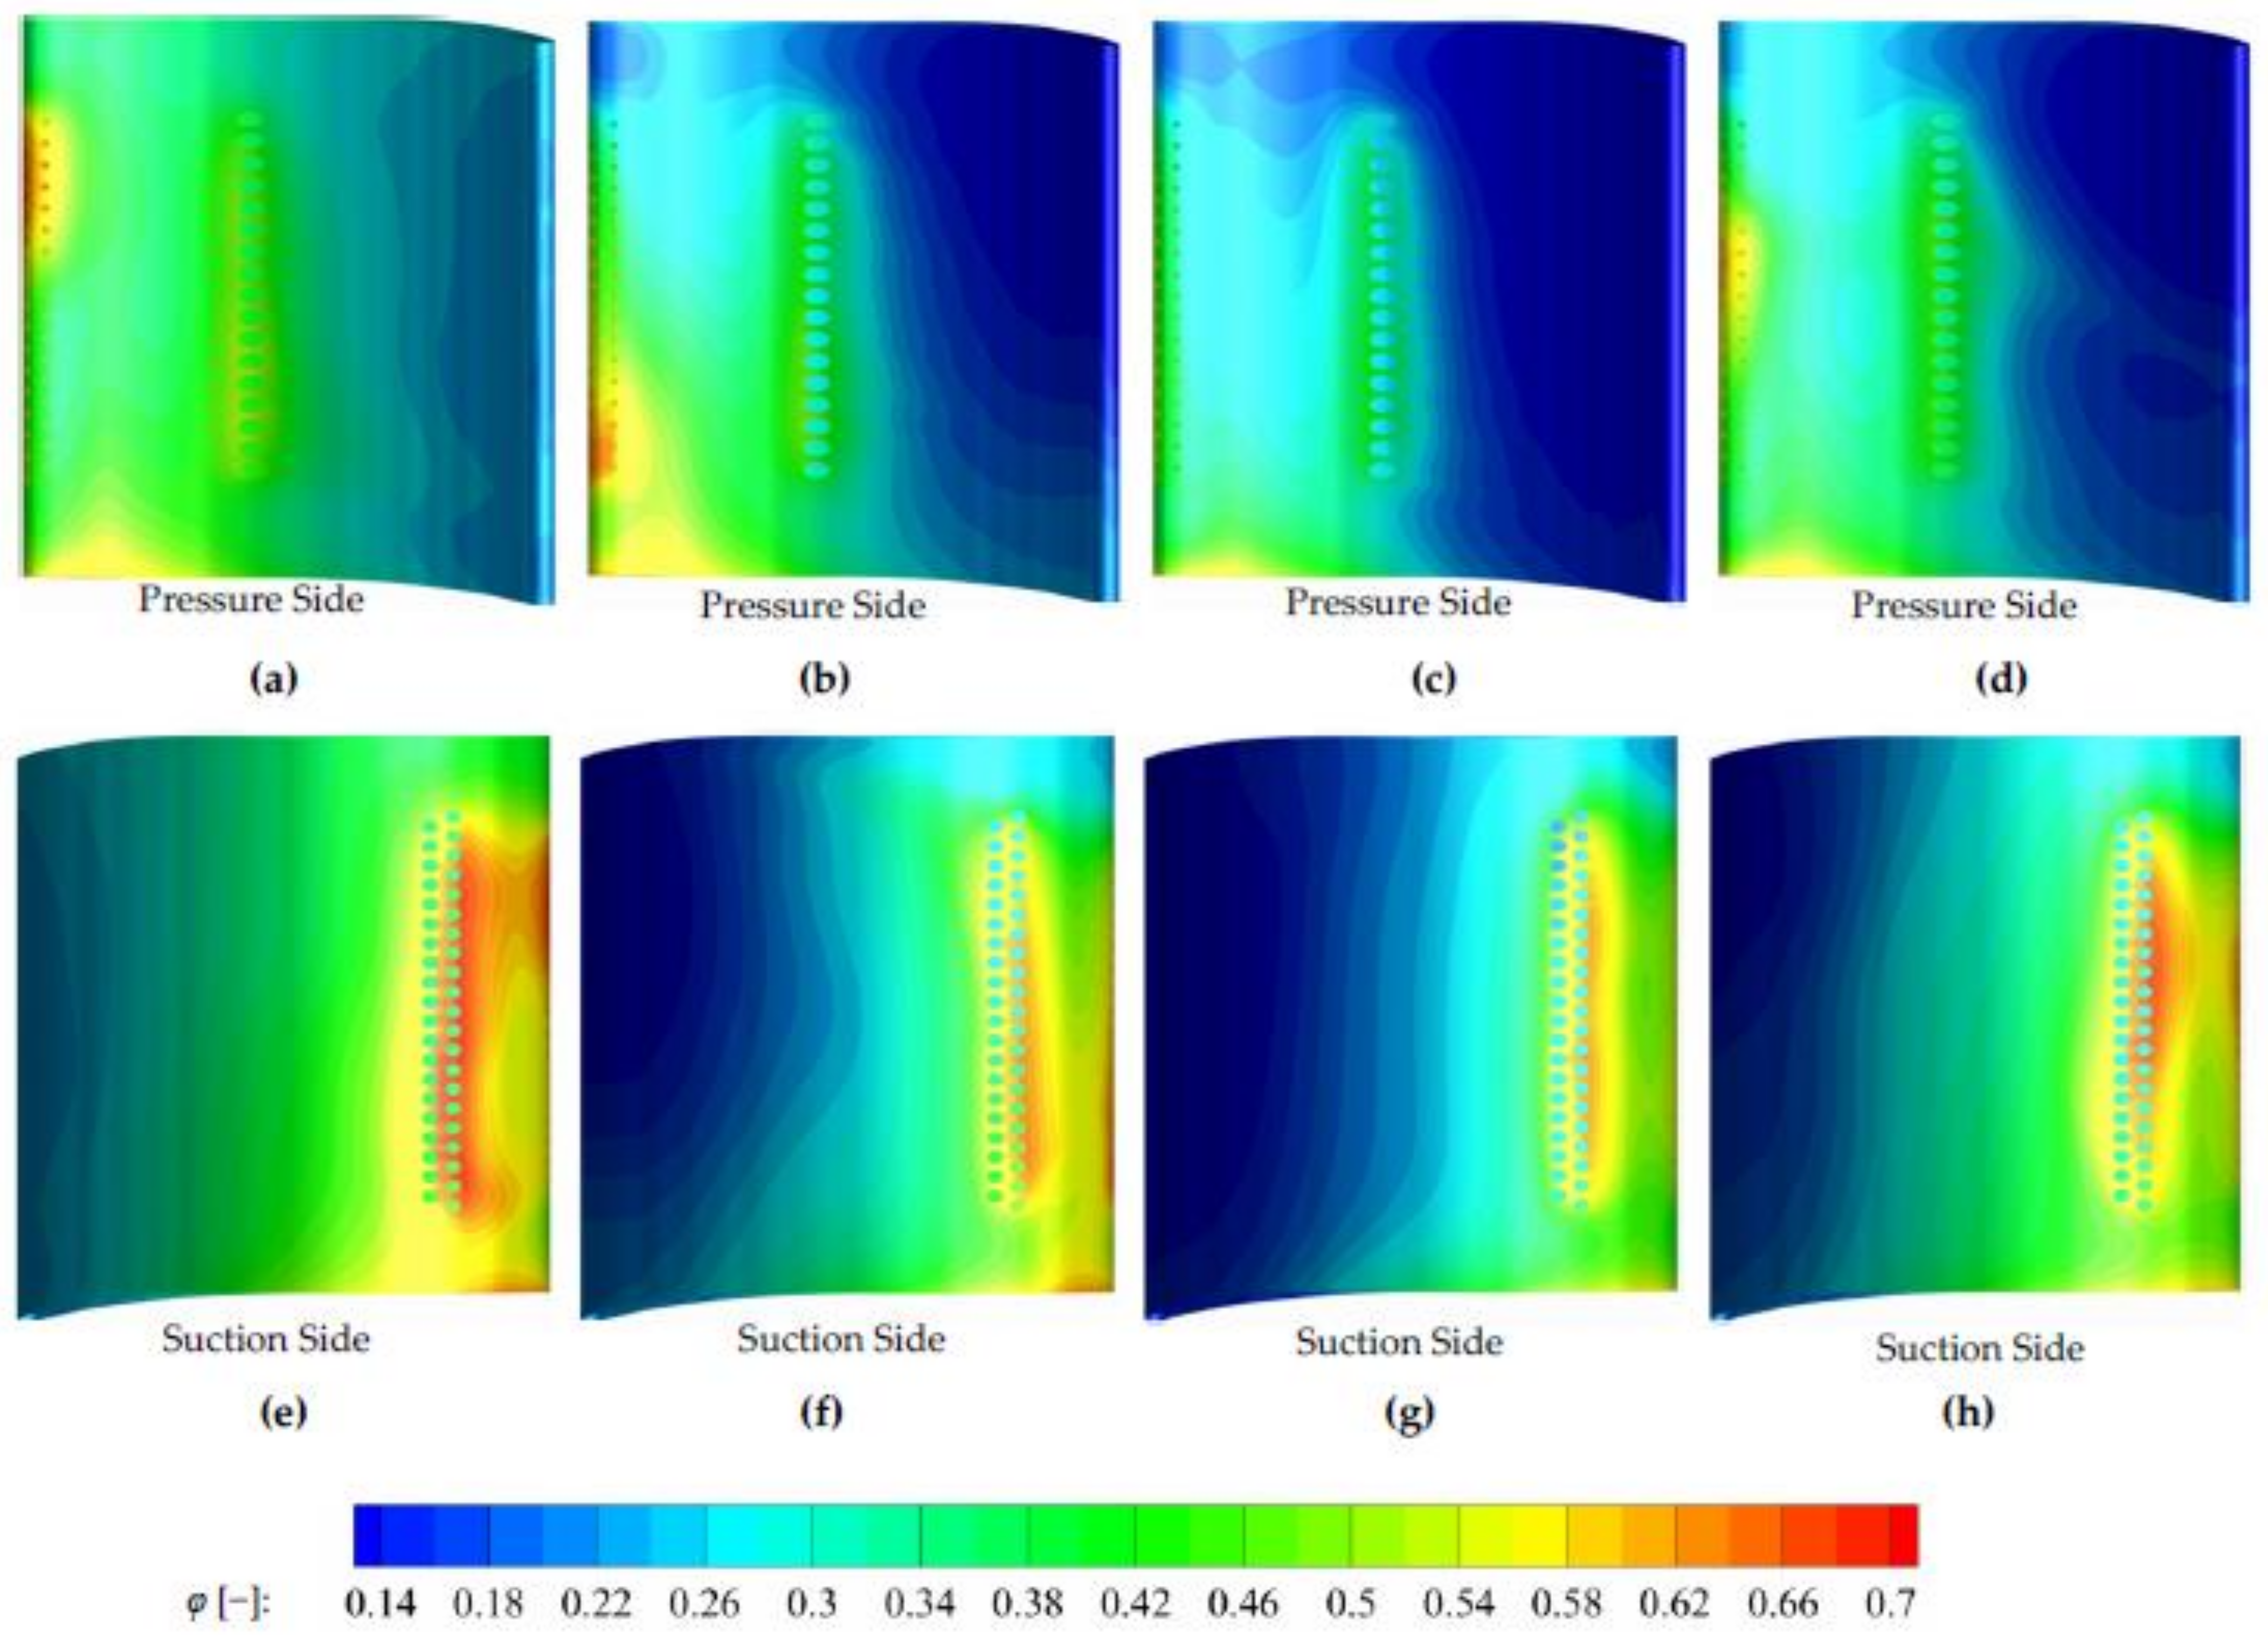
3.1. Influence of HS on the Overall Cooling Performance of the Metal Blade

Within a stator period, four different time points were examined to study the effect of the HS. At the initial time points (0 T), the LE of the blade turned towards the trailing edge of the vane. At the time point 0.5 T, the LE of the blade turned towards the center of the vane passage. At the other two time points, the LE of the blade moveed close to the SS and PS of the stator vane, respectively. Figure 7 shows the comparison of the total temperature distribution in the mid-span of the stage at different time points. It can be observed that the magnitude of the HS gradually narrowed down as it passed downstream of the vane passage. In addition, the gas temperature of the HS decreased as it passed downstream of the vane passage. At the initial time point, the temperature field near the wall surface was affected by the unsteady wake. At the time point 0.25 T, the influence region of HS was located on the suction side of the leading edge of the vane. At the time point 0.5 T, the influence region of the HS turned towards the pressure side of the leading edge. At the time point 0.75 T, the influence region moved further downstream near the trailing edge of the blade. Figure 8 shows the comparison of the overall cooling effectiveness distribution on the blade surface at different time points. In this work, four different time points within one stator period were studied to reveal the influence of the HS and the wake. Consequently, the distance was relatively far between different locations of the stator and blade. Due to the high speed of revolution, the influence of the unsteady wake lasted for only a short period of time within one stator period. Consequently, the influence of the wake was far less than that of the HS. The influence of the unsteady wake on the overall cooling performance of the blade was more notable at the initial time points. Due to the convective heat transfer between the high temperature mainstream and low temperature blade surface, the gas temperature of the unsteady wake was relatively lower than that of the mainstream. Consequently, a relatively higher cooling performance could be observed at the initial time points. The influence of the unsteady wake lasted for only a short period of time. At the time point 0.25 T, the overall cooling effect decreased on both sides of the blade, especially on the SS. In addition, a further reduction of the overall cooling effect could be clearly seen at the time point 0.50 T, especially in the region far away from the film cooling rows. At the time point 0.75 T, the overall cooling effectiveness of the blade began to increase, especially on the suction side of the blade.
Figure 9 shows the comparison of the overall cooling effectiveness profiles at different time points. It can be observed that the profiles of the overall cooling effectiveness followed the analogous change rules at different time points. On the SS, a local maximum could be seen in the area near 0.20 Cax, which is near the film cooling rows. Further downstream, the overall cooling effectiveness began to drop to the local minimum at the trailing edge. On the PS of the blade, a regional maximum was seen near the hysteresis line. Further downstream, another local maximum located at the region close to the −0.40 Cax, close to the PS film cooling rows. In addition, relatively lower values could also be observed on the trailing edge of the PS. At the initial time points, the overall cooling effect of most areas of the blade was better. At the time point 0.25 T, the overall cooling effectiveness of both the PS and SS of the blade decreased, but the SS decreased more significantly than the PS. Compared with that of the initial time points, the overall cooling effect decreased from 0.419 to 0.382 at −0.40 Cax in the mid-span. On the SS of the blade, the value decreased from 0.632 to 0.585 at 0.20 Cax of the mid-span. At the time point 0.50 T, a further reduction of the overall cooling effect was seen in most parts of the blade surface. Compared with that of the time point 0.25 T, it is clear that the values decreased from 0.382 to 0.314 at −0.40 Cax in the mid-span, while from 0.585 to 0.556 at 0.20 Cax of the mid-span. At the time point 0.75 T, the overall cooling effectiveness began to increase, especially in the region far away from the film cooling rows on SS. Compared with that of the time point 0.50 T, it is clear that the values increased from 0.314 to 0.353 at −0.40 Cax in the mid-span, while from 0.556 to 0.616 at 0.20 Cax in the mid-span.
In summary, the highest cooling performance of the blade could be observed at the initial time points of each stator period, when the LE of the blade turned towards the trailing edge of the vane. The lowest cooling performance of the blade could be observed at the time point 0.5 T, when the LE of the blade turned towards the center of the vane passage. At the time point 0.75 T, the overall cooling effectiveness began to increase until the initial state of the blade was returned to.

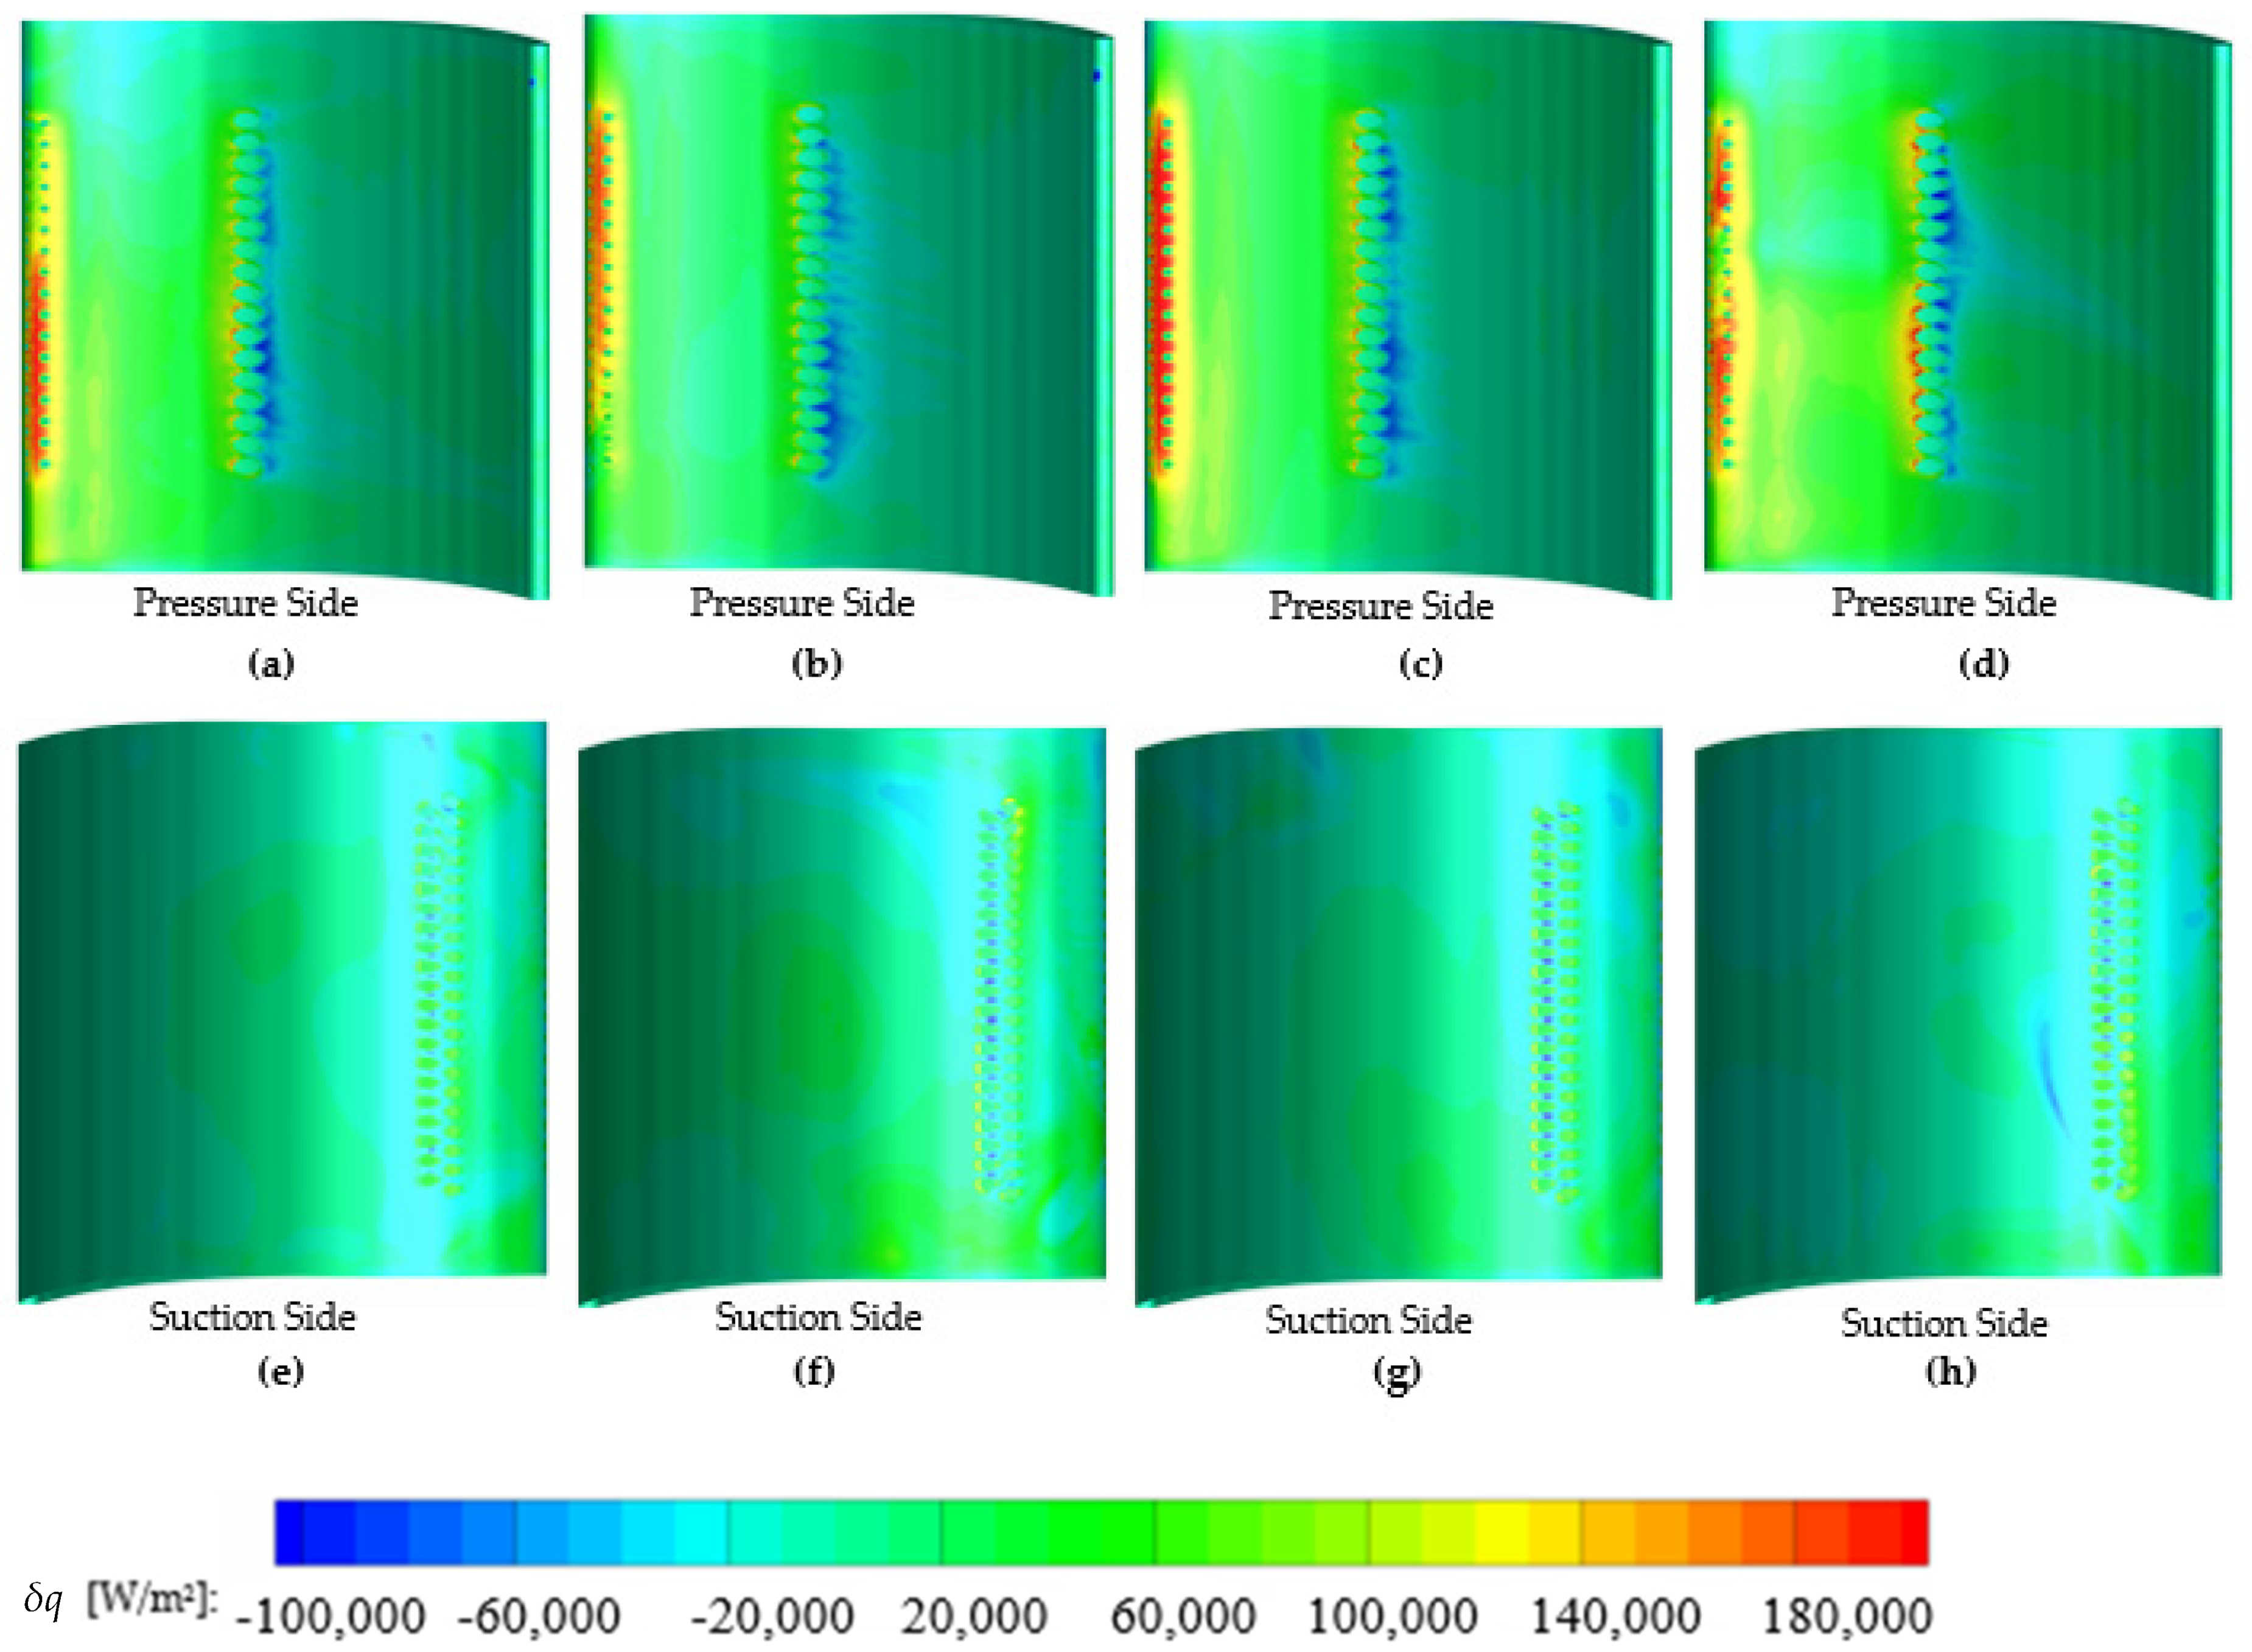
3.2. Influence of HS on the Insulation Performance of Coating

Figure 10 shows the local heat flux distribution on the blade surface at different time points. It can be observed that there was relatively higher local heat flux density on the LE of the blade, especially on the region upstream of the film cooling rows. The values gradually decreased on the region downstream the film cooling rows. In addition, negative values were seen downstream of the film cooling rows. It is noted that film cooling is mainly for reducing heat transfer by forming a cooling film on the surface of the blade. In the area where the local heat flow was negative, the surface temperature of the blade was higher than the surface temperature of the coolant. Therefore, the coolant directly cooled down the blade surface. For the uncoated blade, this phenomenon is beneficial for reducing the surface temperature of the blade. For the coated blade, a relatively higher substrate metal surface temperature may be adverse to the overall cooling performance improvement. At the initial time points, the local heat flow was relatively lower in most areas of the blade, especially on the end wall area near the tip of the blade. At the time point 0.25 T, the influence region of the HS was located at the SS of the leading edge. Therefore, it could be seen that the local heat flux in these areas had improved, especially in the areas near the hub. On the region downstream of the SS film cooling rows, the magnitude of negative local heat flux region increased, which indicated that the direct cooling effect of the film cooling increased with the increase of surface temperature. At the time point 0.5 T, the influence region turned towards the pressure side of the leading edge. There was a significant increase in the local heat flux in those areas. On the SS of the blade, the magnitude of the negative local heat flux region decreased with the decrease of surface temperature. At the time point 0.75 T, the effect of the HS decreased over the blade surface. Therefore, the local heat flux began to decrease in most parts of the blade surface.
Figure 11 shows the local heat flux decrease distribution on the blade surface at four time points. It can be observed that the distribution of the local heat flux decrease followed an analogous change rule with that of the local heat flux. Relatively higher heat flux decrease was located in those regions with larger local heat flux. The area of negative heat flux decrease was located downstream of the film cooling rows.
Figure 12 shows the comparison of the local heat flux at different time points. It was noticed that the profiles of the local heat flux followed an analogous change rule at different time points. The local maximum was seen near the stagnation line. A big shock in the profiles could be seen in the area near the film cooling rows. The area where the local heat flux was negative could be seen downstream of the film hole rows. On the LE of the blade, it could be observed that the negative region was located close to the origin point of the mid-span. On the SS of the blade, adverse values were seen in the region between 0.20 Cax and 0.20 Cax of the mid-span. On the PS of the blade, negative values could be observed at the region between −0.55 Cax and −0.45 Cax of the mid-span. In addition, the local heat flux of the trailing edge was much lower than that of the LE. Figure 13 shows the comparison of the heat flux reduction profiles at different time points. It can be observed that the profiles of the local heat flux reduction followed analogous change rules at different time points. The local maximum was seen near the stagnation line. It is clear that relatively larger values could be observed at the region upstream of the film cooling rows, while negative values were seen in the region downstream of the film cooling rows. In addition, relatively lower local heat flux reduction was seen at the area near the trailing edge.
In summary, the surface temperature of the area with negative local heat flux was always above the surface temperature of the coolant. Therefore, the coolant directly cooled the blade surface. For the uncoated blade, this phenomenon is beneficial for reducing the surface temperature of the blade. For the coated blade, the additional TBCs may exert adverse effects on the heat dissipation from the substrate metal to the mainstream, and thus have a negative effect on the increase in the overall cooling effectiveness for the coated blade.

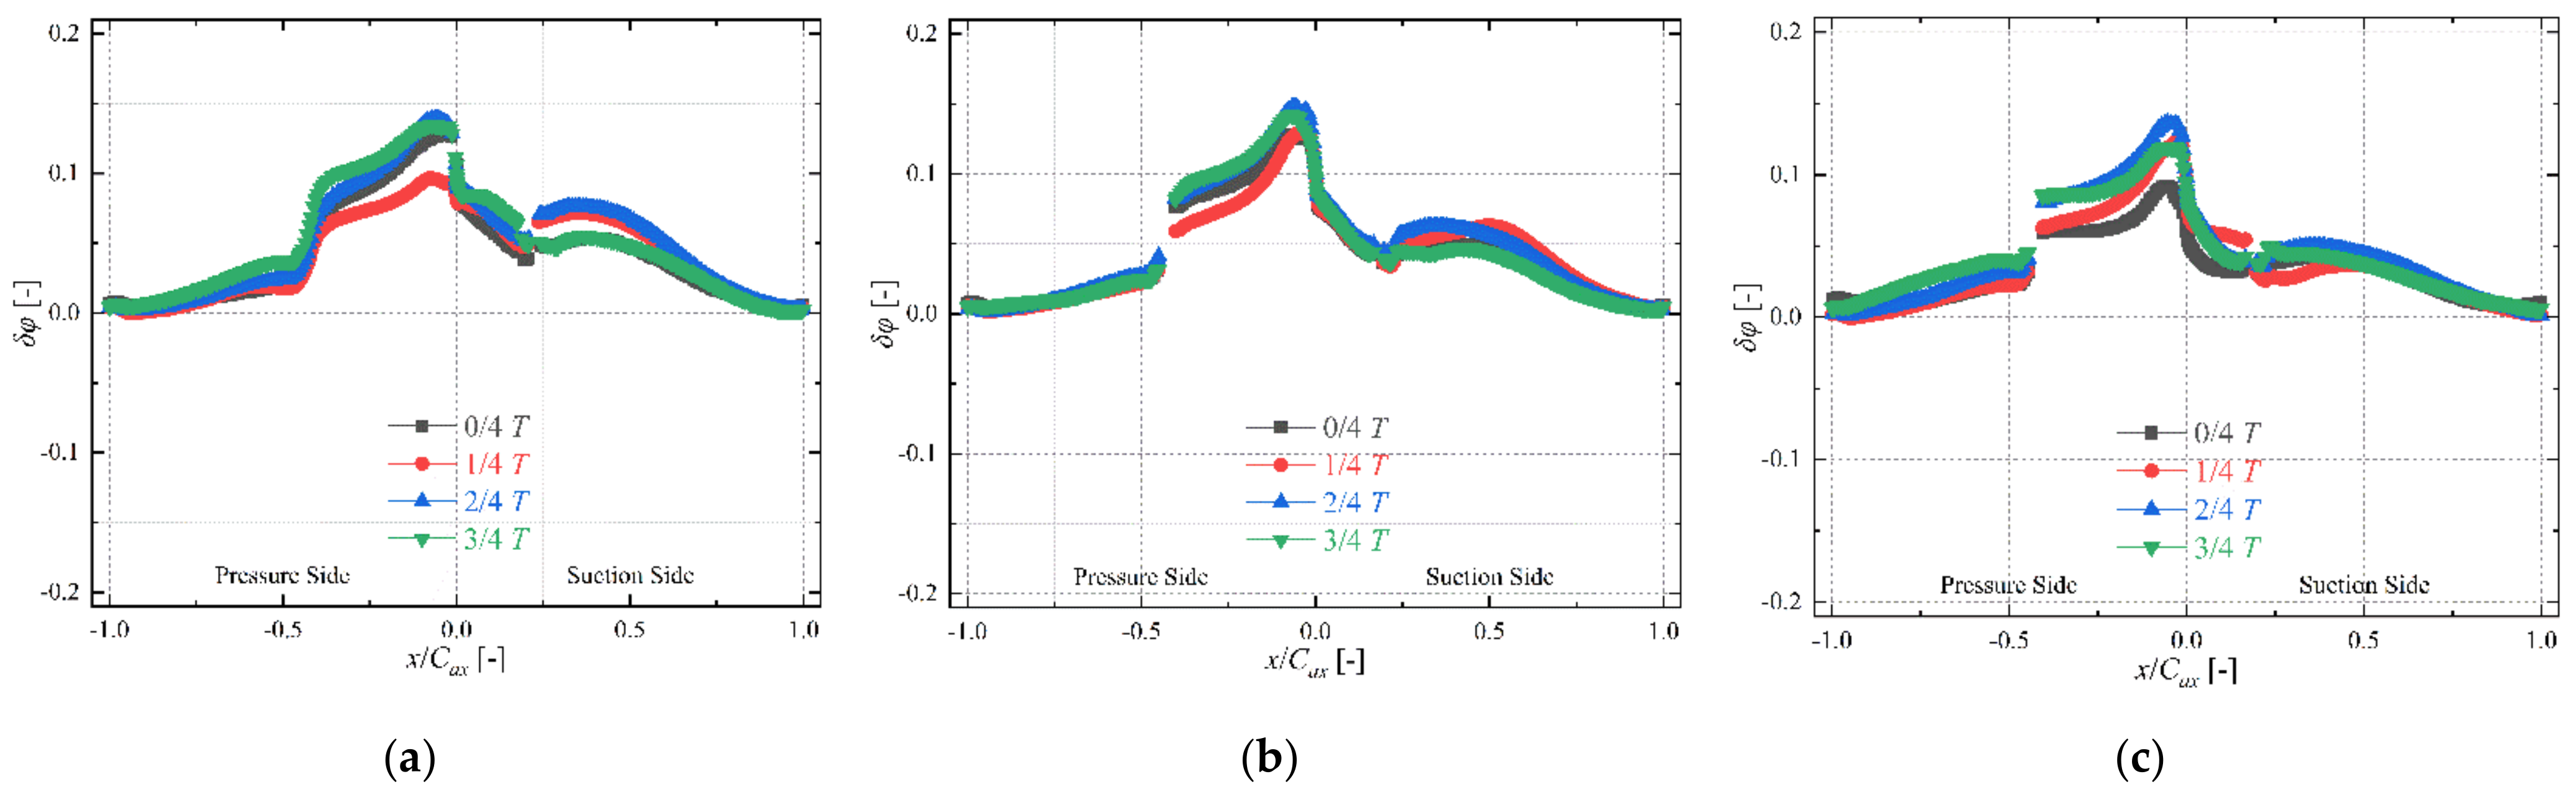
3.3. Influence of HS on the Overall Cooling Performance of the Coated Blade

Figure 14 shows the distribution of the overall cooling effect of the coated blade at different time points. Comparing Figure 8 and Figure 14, it is obvious that the overall cooling effectiveness of the coated blade followed an analogous change rule with that of the uncoated blade. For the coated blade, the additional coatings not only improved the cooling performance over the blade surface but also decreased the surface temperature difference at different time points.
Figure 15 shows the overall cooling efficiency increment distribution for the coated blade metal surface at different time points. It is obvious that a positive increase in the overall cooling effect could be seen in most areas of the blade, especially upstream of the film cooling rows. In addition, a relatively larger increment could be seen in the areas near the hub area, especially near the cylinder channel and film cooling rows. In the area near the trailing edge, the additional TBCs exerted a relatively limited impact on the cooling effectiveness increment, especially in the area near the tip of the blade. At the initial time points, a relatively lower temperature of the external hot gas exerted a relatively limited impact on the cooling effectiveness increment for the coated blade. At the time point 0.25 T, the influence region of the HS was located at the SS of the leading edge of the vane. Consequently, a relatively larger increment of cooling effect could be noticed on the side of the coated blade. At the time point 0.5 T, the influence region of the HS turned towards the PS of the leading edge, where an obvious increment could be seen, especially in the area near the film cooling rows. Compared with that of the time point 0.5 T, the overall cooling effectiveness increment began to decrease at the time point 0.75 T.
Figure 16 shows the comparison of the overall cooling effectiveness profiles at different time points. The additional TBCs decreased the surface temperature difference at different time points, especially on the LE of the blade.
Figure 17 shows the comparison of the overall cooling effectiveness increment profiles at different time points. The local maximum was seen near the stagnation line. On the PS of the blade, the overall cooling effect increment gradually decreased until −0.4 Cax, which is near the upstream of the PS film cooling rows. Then, a rapidly decrease was seen in the area of the film cooling rows. Further downstream, the values gradually decreased until the trailing edge. On the SS of the blade, the overall cooling effectiveness increment rapidly decreased until 0.2 Cax, which was upstream of the SS film cooling rows. Then, the values first increased and then decreased until the trailing edge. A relatively larger overall cooling effect could be observed at the front of the pressure side of the blade. The additional TBCs exerted a more obvious effect on the aft of the suction side of the blade. At the initial time points, a local maximum of 0.126 could be observed close to the origin point of the mid-span. Compared with that of the initial time points, it was clear that the values increased from 0.126 to 0.129 at the time point 0.25 T. As mentioned above, a relatively lower cooling performance can be observed at the time point 0.5 T. Consequently, a local maximum of 0.212 could be observed on the origin point of the mid-span. Furthermore, it was obvious that the overall cooling effectiveness increment decreased to 0.134 at the time point 0.75 T at the same location.
In summary, a relatively lower overall cooling effectiveness increment could be observed at the initial time points, while the maximum could be observed at the time point 0.5 T. At the time point 0.75 T, the overall cooling effectiveness increment began to decrease until the initial state. On the front portion of the blade, a relatively larger increment of overall cooling effect could be noticed on the PS of the blade. At the end of the blade, the additional TBCs exerted a more apparent influence on the SS.

4. Conclusions

The influence of the HS and unsteady wake on the overall cooling performance of a rotor blade were studied in this paper. The following conclusions can be drawn:
(1)
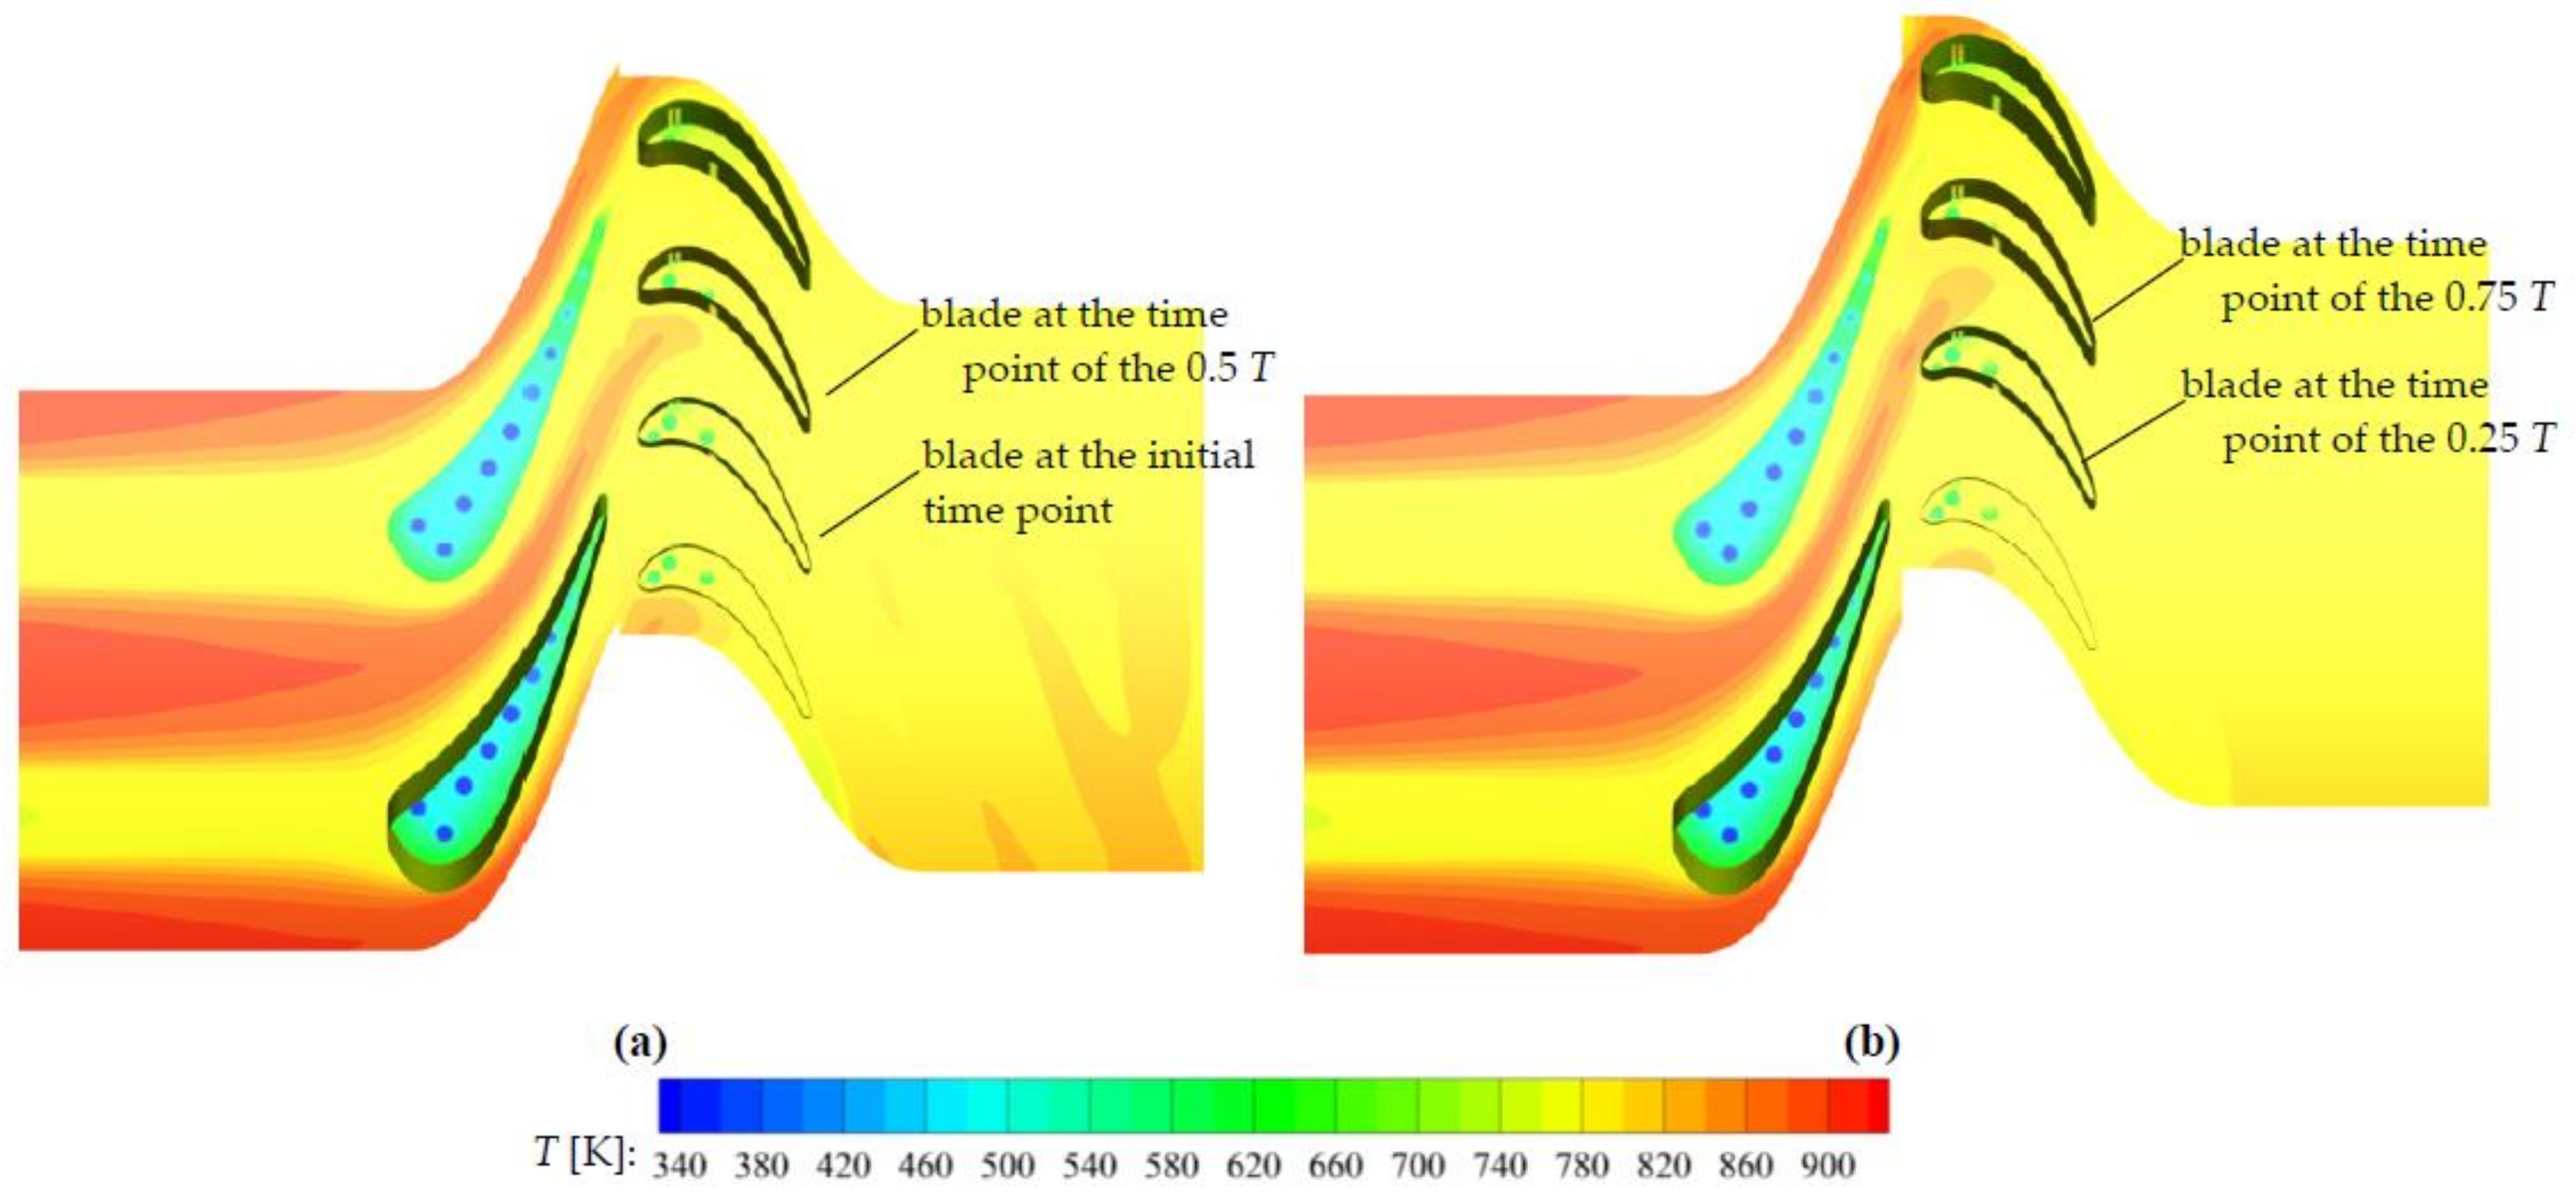
The highest cooling performance could be observed at the initial time points, when the LE of the blade turned towards the trailing edge of the vane. The lowest cooling performance could be observed at the time point 0.5 T, when the LE of the blade turned towards the center of the vane passage. Compared with that of the time point 0.25 T, it is clear that the values decreased from 0.382 to 0.314 at −0.40 Cax of the mid-span, while from 0.585 to 0.556 at the 0.20 Cax of the mid-span at the time point 0.5 T.
(2)
At the area where the local heat flux was negative, the surface temperature of the blade was higher than that of the coolant. Therefore, the coolant directly cooled the blade surface. For the uncoated blade, this phenomenon is beneficial for reducing the surface temperature of the blade. For the coated blade, the additional TBCs may be harmful to heat dissipation from the metal to the mainstream, and thus harmful for the increment of overall cooling performance in the coated blade.
(3)
Relatively higher overall cooling effectiveness increment due to the coating could be observed compared to locations with lower cooling performance. Compared with that of the initial time points, it is clear that the values increased from 0.126 to 0.212 close to the origin point of the mid-span at the time point 0.50 T. Consequently, the additional TBCs decreased the surface temperature difference, which is beneficial for controlling thermal stress under the hot streak inlet condition.

Author Contributions

In this paper, L.S. carried out the simulation, and wrote this paper. Y.L. and H.H. improved the discussion and the paper overall. All authors have read and agreed to the published version of the manuscript.

Funding

This research was funded by National Natural Science Foundation of China, grant number 51806184 and Natural Science Foundation of Hunan Province, grant number 2019JJ50590.

Institutional Review Board Statement

Not applicable.

Informed Consent Statement

Not applicable.

Data Availability Statement

Data is contained within the article.

Conflicts of Interest

The authors declare no conflict of interest.

Nomenclature

Caxaxial chord [mm]
x/Caxrelative chord length
ppressure [Pa]
T inlet temperature [K]
Tctemperature of the cooling gas in the cooling channel [K]
TTBCmetal surface temperature with TBC [K]
Twvane local wall temperature [K]
Tinlet temperature of mainstream [K]
Tsurface temperature outside the coating [K]
Tthe stator period [s]
T u uniform turbulence intensity
Greek Symbols
φoverall cooling effectiveness
φTBCoverall cooling effectiveness of the coated blade
Δφoverall cooling effectiveness increment due to coating
τ TBC effectiveness
Abbreviations
NGVnozzle stator vane
TBCthermal barrier coating
HShot streak
CHTconjugate heat transfer
LEleading edge
PSpressure side
SSsuction side

References

  1. Huh, M.; Han, J.C. Recent studies in turbine blade internal cooling. Heat Transf. Res. 2010, 41, 803–828. [Google Scholar] [CrossRef]
  2. Zhang, J.; Zhu, X.D.; Huang, Y.; Wang, C.H. Investigation on film cooling performance from a row of round-to-slot holes on flat plate. Int. J. Therm. Sci. 2017, 118, 207–225. [Google Scholar] [CrossRef]
  3. Arnome, A.; Bonaiuti, D.; Forcacci, A. Parametric optimization of a high-lift turbine vane. Turbo Expo Power Land Sea Air 2004, 41707, 1469–1479. [Google Scholar]
  4. Qureshi, I.; Smith, A.D.; Povey, T. HP vane aerodynamics and heat transfer in the presence of aggressive inlet swirl. J. Turbomach. 2013, 135, 021040. [Google Scholar] [CrossRef]
  5. Padture, N.P.; Gell, M.; Jordan, E.H. Thermal barrier coatings for gas-turbine engine applications. Science 2002, 296, 280–284. [Google Scholar] [CrossRef]
  6. Bohn, D.E.; Tümmers, C. Numerical 3-D Conjugate flow and heat transfer investigation of a transonic convection-cooled thermal barrier coated turbine guide vane with reduced cooling fluid mass flow. Turbo Expo Power Land Sea Air 2003, 36886, 279–286. [Google Scholar]
  7. Shi, L.; Sun, Z.Y.; Lu, Y.F. The Combined influences of film cooling and thermal barrier coatings on the cooling performances of a film and internal cooled vane. Coatings 2020, 10, 861. [Google Scholar] [CrossRef]
  8. Wang, Z.; Liu, Z.; Feng, Z. Influence of mainstream turbulence intensity on heat transfer characteristics of a HP turbine stage with inlet hot streak. Turbo Expo Power Land Sea Air 2015, 56727, V05BT13A010. [Google Scholar]
  9. Wang, Z.; Wang, D.; Wang, Z.; Feng, Z. Heat transfer analyses of film-cooled HP turbine vane considering effects of swirl and hot streak. Appl. Therm. Eng. 2018, 142, 815–829. [Google Scholar] [CrossRef]
  10. Griffini, D.; Insinna, M.; Salvadori, S.; Martelli, F. Clocking effects of inlet nonuniformities in a fully cooled high-pressure vane: A conjugate heat transfer analysis. J. Turbomach. 2015, 138, 021006. [Google Scholar] [CrossRef]
  11. Shang, T.; Epstein, A.H. Analysis of hot streak effects on turbine rotor heat load. J. Turbomach. 1997, 119, 544–553. [Google Scholar] [CrossRef]
  12. Shi, L.; Huang, H.; Lu, Y.F. The combined influences of hot streak and swirl on the cooling performances of C3X stator vane with or without TBCs. Coatings 2021, 11, 688. [Google Scholar] [CrossRef]
  13. Jenny, P.; Lenherr, C.; Abhari, R.S.; Kalfas, A. Effect of hot streak migration on unsteady blade row interaction in an axial turbine. J. Turbomach. 2012, 134, 051020. [Google Scholar] [CrossRef]
  14. Zhou, K.; Zhou, C. Transport mechanism of hot streaks and wakes in a turbine cascade. J. Propul. Power 2016, 32, 1045–1054. [Google Scholar] [CrossRef]
  15. Zhao, Q.J.; Wang, H.S.; Tang, F.; Zhao, X.; Xu, J. Investigation of influencing factors of hot streaks migration in high pressure stage of a vaneless counter-rotating turbine. Sci. China Ser. E 2008, 51, 127–144. [Google Scholar] [CrossRef]
  16. Qureshi, I.; Smith, A.D.; Chana, K.S.; Povey, T. Effect of temperature nonuniformity on heat transfer in an unshrouded transonic hp turbine: An experimental and computational investigation. Turbo Expo Power Land Sea Air 2010, 43994, 255–270. [Google Scholar]
  17. Ong, J.; Miller, R.J. Hot streak and vane coolant migration in a downstream rotor. Turbo Expo Power Land Sea Air 2008, 43161, 1749–1760. [Google Scholar]
  18. Basol, A.M.; Jenny, P.; Ibrahim, M.; Kalfas, A.I.; Abhari, R.S. Hot streak migration in a turbine stage: Integrated design to improve aerothermal performance. J. Eng. Gas Turb. Power 2011, 133, 061901. [Google Scholar] [CrossRef]
  19. Hylton, L.D.; Mihelc, M.S.; Turner, E.R.; Nealy, D.A.; York, R.E. Analytical and Experimental Evaluation of the Heat Transfer Distribution over the Surfaces of Turbine Vanes; NASA Technical Report, NASA-CR-168015; NASA Lewis Research Center: Cleveland, OH, USA, 1982.
  20. Li, Y.; Su, X.; Yuan, X. The effect of mismatching between combustor and HP vanes on the aerodynamics and heat load in a 1-1/2 stages turbine. Aerosp. Sci. Technol. 2019, 86, 78–92. [Google Scholar] [CrossRef]
  21. Hylton, L.D.; Nirmalan, V.; Sultanian, B.K.; Kauffman, R.M. The Effects of Leading Edge and Downstream Film Cooling on Turbine Vane Heat Transfer; NASA Technical Report, NASA-CR-182133; NASA: Washington, DC, USA, 1988.
  22. Camci, C. Experimental and Theoretical Study of Film Cooling on a Gas Turbine Blade. Ph.D. Thesis, Von Karman Institute for Fluid Mechanics, Katholieke Universiteit Leuven, Leuven, Belgium, 1985. [Google Scholar]
  23. Prasert, P.; Soemsak, Y.; Suwin, S. Investigation of cooling performances of a non-film-cooled turbine vane coated with a thermal barrier coating using conjugate heat transfer. Energies 2018, 11, 1000. [Google Scholar]
  24. Liu, J.H.; Liu, Y.B.; He, X.; Liu, L. Study on TBCs insulation characteristics of a turbine blade under serving conditions. Case Stud. Therm. Eng. 2016, 8, 250–259. [Google Scholar] [CrossRef] [Green Version]
  25. Ke, Z.; Wang, J.H. Conjugate heat transfer simulations of pulsed film cooling on an entire turbine vane. Appl. Therm. Eng. 2016, 109, 600–609. [Google Scholar] [CrossRef]
  26. Camci, C.; Arts, T. An Experimetal convective heat transfer investigation around a film cooled gas turbine Blade. J. Turbomach. 1990, 112, 497–503. [Google Scholar] [CrossRef]
Figure 1. (a) Computation domain; (b) Grid.
Energies 15 01887 g001
Figure 2. Temperature distribution.
Energies 15 01887 g002
Figure 3. Hot streak profile.
Energies 15 01887 g003
Figure 4. Grid independence test.
Energies 15 01887 g004
Figure 5. Convergence history. (a) Pressure ratio; (b) Temperature ratio.
Energies 15 01887 g005
Figure 6. Parameter definition. (a) Uncoated blade; (b) Coated blade.
Energies 15 01887 g006
Figure 7. Comparison of the total temperature distribution in the mid-span. (a) At t = 0/4 T; (b) at t = 1/4 T.
Energies 15 01887 g007
Figure 8. Comparison of the overall cooling effectiveness distribution at different time points. (a) 0 T; (b) 0.25 T; (c) 0.5 T; (d) 0.75 T; (e) 0 T; (f) 0.25 T; (g) 0.5 T; (h) 0.75 T.
Energies 15 01887 g008
Figure 9. Comparison of the overall cooling effectiveness profiles at different time points. (a) 25% span; (b) mid-span; (c) 75% span.
Energies 15 01887 g009
Figure 10. Comparison of the local heat flux distribution at different time points. (a) 0 T; (b) 0.25 T; (c) 0.5 T; (d) 0.75 T; (e) 0 T; (f) 0.25 T; (g) 0.5 T; (h) 0.75 T.
Energies 15 01887 g010
Figure 11. Comparison of the heat flux reduction distribution at different time points. (a) 0 T; (b) 0.25 T; (c) 0.5 T; (d) 0.75 T; (e) 0 T; (f) 0.25 T; (g) 0.5 T; (h) 0.75 T.
Energies 15 01887 g011
Figure 12. Comparison of the local heat flux profiles at different time points. (a) 25% span; (b) mid-span; (c) 75% span.
Energies 15 01887 g012
Figure 13. Comparison of the heat flux reduction profiles at different time points. (a) 25% span; (b) mid-span; (c) 75% span.
Energies 15 01887 g013
Figure 14. Comparison of the overall cooling effectiveness distribution at different time points. (a) 0 T; (b) 0.25 T; (c) 0.5 T; (d) 0.75 T; (e) 0 T; (f) 0.25 T; (g) 0.5 T; (h) 0.75 T.
Energies 15 01887 g014
Figure 15. Comparison of the overall cooling effectiveness increment distribution at different time points. (a) 0 T; (b) 0.25 T; (c) 0.5 T; (d) 0.75 T; (e) 0 T; (f) 0.25 T; (g) 0.5 T; (h) 0.75 T.
Energies 15 01887 g015
Figure 16. Comparison of the overall cooling effectiveness profiles at different time points. (a) 25% span; (b) mid-span; (c) 75% span.
Energies 15 01887 g016
Figure 17. Comparison of the overall cooling effectiveness increment profiles at different time points. (a) 25% span; (b) mid-span; (c) 75% span.
Energies 15 01887 g017
Table 1. Geometric characteristics of the C3X vane and VKI blade.
ParametersC3X VaneVKI Blade
Axial chord length (mm)78.1680
Blade height (mm)77.22100
Stagger angle (degree)59.8938.5
Inlet flow anger (degree)46.3530
Table 2. Geometric characteristics of the cooling channels.
VaneCooling ChannelsDiameter (mm)
1–76.30
C3X8–93.10
101.98
VKILeading-edge4.5
Suction-side6
Pressure-side6
Table 3. Material properties.
MaterialParametersValue
GasDensity (kg∙m−3)Ideal gas assumption
Specific heat capacity (J∙kg−1∙K−1)938 + 0.196 T
Thermal conductivity (W∙m−1∙K−1)0.0102 + 5.8 × 10⁻⁵ T
SUBDensity (kg∙m−3)8055
Specific heat capacity (J∙kg−1∙K−1)438.5 + 0.177 T
Thermal conductivity(W∙m−1∙K−1)11.2 + 0.0144 T
TBCsDensity (kg∙m−3)5500
Specific heat capacity (J∙kg−1∙K−1)418
Thermal conductivity (W∙m−1∙K−1)1.04
Publisher’s Note: MDPI stays neutral with regard to jurisdictional claims in published maps and institutional affiliations.

