Article

Differences of Carbon Emission Efficiency in the Belt and Road Initiative Countries

School of Economics and Management, Beijing University of Technology, Beijing 100124, China
*
Author to whom correspondence should be addressed.
Energies 2022, 15(4), 1576; https://doi.org/10.3390/en15041576
Submission received: 20 January 2022 / Revised: 10 February 2022 / Accepted: 17 February 2022 / Published: 21 February 2022
(This article belongs to the Collection Energy Transition towards Carbon Neutrality)

Abstract

:
Carbon emission efficiency, which is mainly affected by economic output, energy efficiency and energy structure, is the effect of carbon emissions generated in economic activities. Improving carbon emission efficiency and narrowing regional differences are very important for green development in Belt and Road Initiative regions with developing countries as the main body. The existing literature mostly uses the Theil index to study the temporal differences in carbon emission efficiency, but spatial differences and the reasons for the differences have rarely been examined. This paper measures the differences of carbon emission efficiency using the Theil index and examines the reasons based on the Logarithmic Mean Divisia index (LMDI) method in five groups of 60 Belt and Road Initiative countries. The results show that the Theil index of carbon emission efficiency in these countries is 0.196, with an intra-group difference of 0.165 and an inter-group difference of 0.031. Between most of the groups, energy efficiency is the dominant factor affecting carbon emission efficiency differences, especially between East Asia and Central and Eastern Europe, South Asia and East Asia. Between most of the countries with the highest and lowest carbon emission efficiency in the same group, such as Singapore and Vietnam in East Asia, energy efficiency is still the primary factor affecting the differences. Only some differences between a few groups, countries and sectors have been caused mainly by energy structures. Therefore, improving energy efficiency is the first way for those countries with low carbon emission efficiency to catch up other countries with high carbon emission efficiency, followed by improving the energy structure.

1. Introduction

Since the industrial revolution, economic development has led to a gradual deepening of human impact on the natural environment. Carbon emissions have become one of the crucial concerns of the world with the increasing global climate problems. A climate agreement was reached at COP26 in the United Kingdom, which was the first explicit plans to reduce coal use [1]. The United States of America also set a goal of zero carbon electricity by 2035 [2]. In addition, the European Union adopts binding legislation to guarantee climate neutrality by 2050 [3]. Although the European Union ranks among the forefront in the world in terms of carbon efficiency, there are differences between countries within the European Union in terms of their focus on carbon emissions and the formulation of policies. Germany, for example, is more aggressive in its carbon reduction targets and expects to phase out coal power by 2030 [4]. In contrast, France had shelved its proposal to tax on carbon emissions. Serbia did not join the European Union carbon emissions trading market [3]. The Belt and Road Initiative (BRI) was proposed by the Chinese government as an effort to support international trade and to construct a community of interests, responsibilities, and destiny [5]. At present, more than 170 countries have participated in the BRI, and their economies and carbon emissions occupy an important position in the world, with a proportion of 30% and 16%, respectively [6]. Most of the BRI countries are developing countries that are under double pressure to promote economies and reduce carbon emissions [7]. Therefore, it is particularly important to improve the carbon emission efficiency. Moreover, due to the huge discrepancy in economic development and energy consumption among BRI countries, there is also a huge difference in carbon emission efficiency, which is not conducive to building a green community [8].
Carbon emission efficiency research is one of the research hotspots. However, so far, little research has given a clear definition and unified quantitative measure of carbon emission energy efficiency. Table 1 summarizes general definitions and calculated indicators of existing literature. Referring to the existing literature [9,10,11,12], we define the carbon emission efficiency as the effect of carbon emissions generated in economic activities. According to this definition, carbon emission efficiency can be evaluated by carbon dioxide emissions per capita of GDP [11]. There are two methods to measure carbon emission efficiency: single-factor and total-factor. The single-factor method generally defines carbon emission efficiency as the ratio of two variables, such as the ratio between GDP and total carbon emissions [13]. This single-factor method is good at considering the promotion or suppression effects of economic growth on carbon emissions. The total-factor method regards carbon emissions as an unexpected output [14,15,16,17] and considers carbon emissions in the whole economic system [17,18]. This total-factor method focuses on the contribution of total factors with the results more comprehensive [14]. Existing studies of carbon emission efficiency pay close attention to the temporal changes [19,20] and spatial differences [21,22] in one country or between different countries.
The representative research method to measure carbon emission efficiency differences between countries or regions includes the coefficient of variation [23], the Gini coefficient [16] and the Theil index [24], etc. The Theil index is the most mainstream method which provides accurate estimation results [25]. The Theil index is a regional differences analysis method proposed by Theil in 1967, which is widely used to measure the regional differences in economy, energy and carbon emissions. The value of the Theil index ranges from 0 to 1; a greater value indicates a greater difference. When calculating the regional differences, the Theil index can be divided into some groups to measure the intra-group differences and inter-group differences, respectively.
Currently, there are some influencing factors in the research of carbon emissions efficiency, including energy efficiency, energy structure, industrial structure and urbanization level [15,26,27,28]. Energy efficiency is one of the crucial indicators in carbon emissions efficiency. Although there are several definitions of energy efficiency, there is no consistent concept. Table 2 lists some typical literature on energy efficiency research. The definition of energy efficiency can be divided into two categories: broad sense and narrow sense. The former mainly refers to the use of less energy to produce the same amount of services or useful output [29,30]. In a narrow sense, energy efficiency is the GDP per unit of energy consumption [24,28]. This paper defines energy efficiency as the GDP per unit of energy consumed. Studies reveal that energy consumption, carbon emission efficiency and economic development are closely linked [31,32,33,34]. The representative research method to measure the factors affecting carbon emission efficiency includes the Structural Decomposition Analysis (SDA) [23], the Index Decomposition Analysis (IDA) [34,35] and the Logarithmic Mean Divisia index (LMDI) [36,37,38]. LMDI is extensively applied in the studies, and solves the residual error and zero value problems [37]. Based on the LMDI method, the Theil index of carbon emission efficiency is also decomposed by scholars [39,40] to study the reasons for the change of Theil index, but few have analyzed the reasons for the difference of the Theil index in different regions.
With the growing influence of the Belt and Road Initiative, many studies of carbon emission efficiency in BRI countries have emerged. Most of the BRI countries are developing countries at the stage of industrialization and modernization, whose patterns are more extensive than that of developed countries [41,42]. Although plentiful progress of carbon emissions efficiency has been made in BRI countries [43], the imbalance exists among different countries due to the great differences in economic development and resource endowment [41,42]. The literature about the differences in carbon emission efficiency in BRI countries focuses on two specific countries or regions, such as China and India [44], China and Southeast Asian countries [45], and some specific sectors, such as electric power [46,47], construction [14,48] and transportation [35]. These studies measured carbon emission efficiency of some BRI countries, especially in some specific sectors.
In summary, although dramatic progress has been made in the related studies of carbon emissions efficiency differences in BRI countries, there are still some gaps. First, temporal changes of carbon emission efficiency have been measured by using the single-factor method, while spatial differences have rarely been analyzed in BRI countries. Second, the Theil index has been widely used to study carbon emission efficiency differences in some BRI countries, however the differences between and within groups are not compared. Third, the reasons for carbon emissions efficiency changes in BRI countries have been analyzed, but the reasons for the differences in carbon emission efficiency have not been examined.
Under the above background, this paper puts forward four questions. First, are there differences in carbon emission efficiency among BRI countries? Second, what are the degrees of the differences? Third, what are the reasons for the differences? Fourth, how to narrow the differences in the future? In order to answer these questions, this paper measures the differences of carbon emission efficiency in BRI countries and examines the reasons. It is very important for the policy-making of BRI countries to improve carbon emission efficiency, and narrow the differences to build a green community.
Therefore, based on the previous literature, this paper measures the differences of carbon emission efficiency and its influencing factors in BRI countries using the Theil index and the LMDI method. This study contributes to the literature in the following ways: (1) Adopting a single-factor perspective, this paper measures the carbon emission efficiency of BRI countries in 26 sectors. (2) Considering the large differences in resource endowments and economic development, this paper uses the Theil index to measure the carbon emission efficiency and its spatial differences degree in BRI countries. (3) Based on five groups of BRI countries, the carbon emission efficiency differences inter-group and intra-group are compared. (4) Using the LMDI method, the reasons for the differences between and within groups are analyzed. The technical framework of this paper is shown in Figure 1.
The rest of the paper is organized as follows: Section 2 summarizes the existing literature. Section 3 presents methods and data. Section 4 analyses and discusses the results. Section 5 draws the conclusions and gives the policy suggestions.

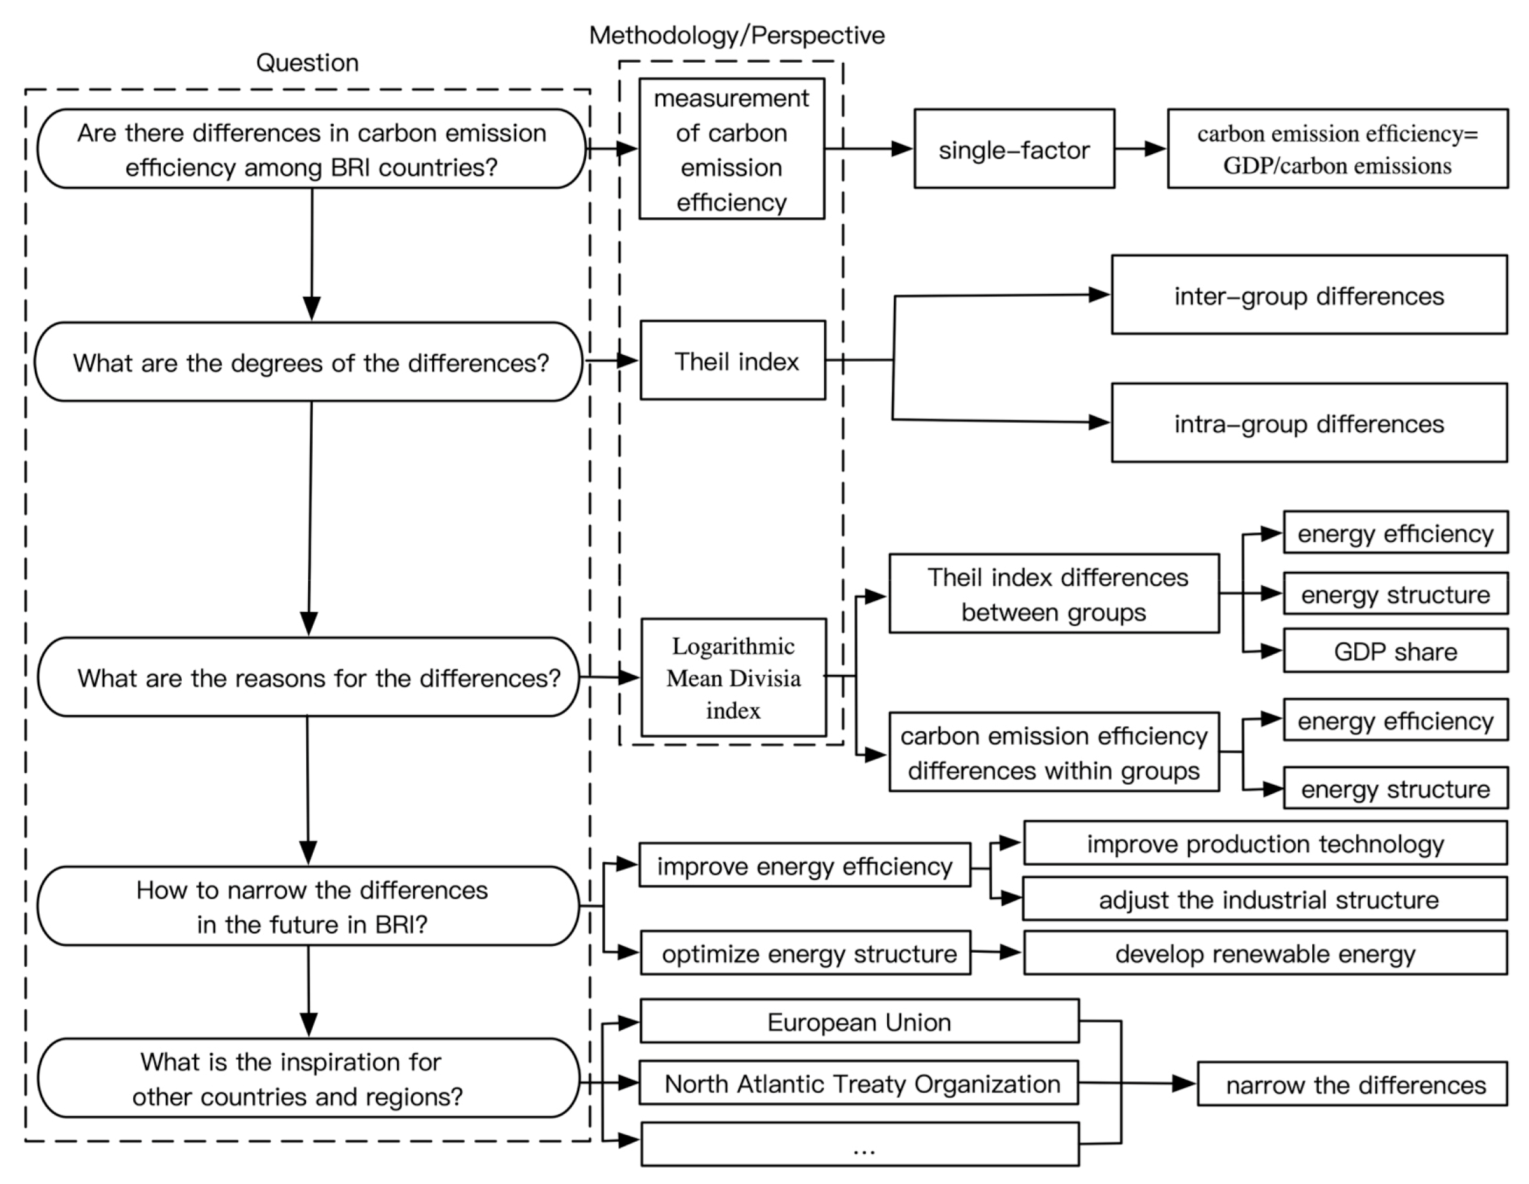
2. Methodology and Data

2.1. Theil Index

As mentioned above, measurement of carbon emission efficiency mainly has two approaches: single-factor and total-factor. Compared with the total-factor approach of carbon emission efficiency, the single-factor approach has advantages such as the prominent subject which is simple to calculate. Based on existing research [37,38], this paper measures carbon emission efficiency from a single-factor perspective, that is, from the perspective of the ratio between GDP and total carbon emissions. Therefore, the carbon emission efficiency of a BRI country i is set as follows:
E i = G i C i
where G i is the GDP of the BRI country i , and C i is the carbon emissions of the BRI country i .
The coefficient of variation, the Gini coefficient and the Theil index are the main research methods to measure the carbon emission efficiency differences [49,50,51,52]. Because of the distinction between intra-group differences and inter-group differences, the Theil index is further used to measure the differences in carbon emission efficiency of BRI countries in this paper. To calculate the Theil index of carbon emission efficiency of BRI countries, this paper divides n BRI countries into l groups. T represents the Theil index of carbon emission efficiency of BRI countries. T a and T b respectively represent intra-group differences and inter-group differences. T a , T b and T is composited as:
T a = 1 n r r = 1 l i = 1 n r n r n × E r E × E r i E r × ln E r i E r
T b = r = 1 l n r n × E r E × ln E r E
T = T a + T b = 1 n r r = 1 l i = 1 n r n r n × E r E × E r i E r × ln E r i E r + r = 1 l n r n × E r E × ln E r E
where n is the total number of BRI countries, n r is the total number of BRI countries in the group r , r 1 , l , E r is the average of carbon emission efficiency of BRI countries in the group r , E is the average carbon emission efficiency of BRI countries, E r i is the carbon emission efficiency of BRI countries in the group r , and E r is the average carbon emission efficiency of BRI countries in the group r .

2.2. Decomposition of the Theil Index Differences

To explore the reasons for the differences in carbon emission efficiency among each group, this paper decomposes the Theil index of carbon emission efficiency by the Kaya principle. Referring to the common influencing factors of carbon emission efficiency in existing studies [15,26], carbon emission efficiency of the BRI country i can be divided into two driving factors, namely energy efficiency (F) and energy structure (S):
E i = G i C i = j G i j T E i j × T E i j C i j = j F i j × S i j
where G i j is the GDP of the industry j in the BRI country i , T E i j is the energy consumption of the industry j in the BRI country i , C i j is the carbon emissions of the industry j in the BRI country i , F i j is the GDP per unit of energy consumption of the industry j in the BRI country i , which represents energy efficiency, and S i j is the energy consumed per unit of carbon emissions of the industry j in the BRI country i , which represents energy structure.
The carbon emission efficiency differences between the BRI country i and the group r can be attributed to these two driving factors:
E r i E r = j F i j S i j j F r j S r j = D F i r D S i r
where D F i r and D S i r are the carbon emission efficiency differences between BRI country i and group r caused by energy efficiency and energy structure of energy consumption, respectively. By apply LMDI to the Equation (6) by referring to the method described by Ang [53], it is possible to calculate the carbon emission efficiency differences between BRI country i and group r :
D F i r = exp j ω i j ω ln F i j F r j
D S i r = exp j ω i j ω ln S i j S r j
where ω i j ω presents the weight function:
ω i j ω = L ( E i j , E r j ) L ( E i , E r )
where L is the logarithmic mean function, E i j is the carbon emission efficiency of the industry j in the BRI country i , E r j is the carbon emission efficiency of the industry j in group r , E i is the carbon emission efficiency of the BRI country i , and E r is the carbon emission efficiency of BRI countries in group r .
L ( E a , E b ) = E a E b ln E a ln E b , i f E a E b E a , i f E a = E b
By defining α r = n r n × E r E × E r i E r , the intra-group Theil index of group r is composited as:
T a r = r i α r ln ( D F i r D S i r ) = r i α r ln D F i r + r i α r ln D S i r = r i j α r × ω i j a × ln F i j F r j + r i j α r × ω i j a × ln S i j S r j = T a F r + T a S r
T a F r , T a S r is the effect of energy efficiency and energy structure on intra-group differences in carbon emission efficiency, respectively.
Suppose x and y are two respective groups, x , y 1 , l . The differences of the intra-group Theil index of carbon emission efficiency of group x and group y can be expressed as:
T a x y = T a x T a y = T a s h a r e + T a F + T a S
where T a s h a r e , T a F , T a S reflects the impact due to the contribution of GDP share, energy efficiency disparity, and energy structure disparity, respectively.
T a s h a r e = 1 2 i j ( α x α y ) × ( ω i j a x × ln F i j F x j + ω i j a y × ln F i j F y j + ω i j a x × ln S i j S x j + ω i j a x × ln S i j S y j )
T a F = 1 2 i j ( α x + α y ) × ( ω i j a x × ln F i j F y j ω i j a x × ln F i j F x j )
T a S = 1 2 i j ( α x + α y ) × ( ω i j a y × ln S i j S y j ω i j a x × ln S i j S x j )
where α x = n x n × E x E × E x i E x , α y = n y n × E y E × E y i E y .

2.3. Decomposition of the Carbon Emission Efficiency Differences

In order to explore the reasons for differences in carbon emission efficiency within each group, we use LMDI to explore driving factors of carbon emission efficiency differences. Similar to decomposition of the Theil index, carbon emission efficiency of BRI country i can be divided into energy efficiency (F) and energy structure (S), as in Formula (5).
The differences of carbon emission efficiency between country c and country d can be expressed as:
E c d r = E c r E d r = E F + E S
E F = i j E c j E d j ln E c j ln E c j ln F c F d
E S = i j E c j E d j ln E c j ln E d j ln S c S d
where E F , E S reflects the impact due to the contribution of energy efficiency disparity and energy structure disparity, respectively. F c is the GDP per unit of energy consumption of country c , S d is the energy consumed per unit of carbon emissions of country d , F d is the GDP per unit of energy consumption of country d , and S d is the energy consumed per unit of carbon emissions of country d .

2.4. Data Source

The carbon emissions and GDP data of this paper are, respectively, from the Eora database and the World Bank database. The global input–output table in Eora covers 26 sectors in 189 countries and territories around the world. The reasons for choosing 2015 data are as follows: first, the BRI is proposed in 2013. Therefore, data from 2013 onwards must be selected. Second, this study attempts to analyze the detailed 26 sectoral carbon emission efficiency differences. Although the IEA database updates to 2019, it is only available for five sectors. Therefore, the Eora database for 2015 was chosen for the study. Referring to existing literature [54], 65 countries were selected. The Eora database includes 64 countries, excluding Palestine. Three countries (Montenegro, Macedonia and Pakistan) lack carbon emissions data. Therefore, based on the principle of data availability, this paper covers 60 BRI countries in 2015. In addition, based on the division of Wang (2021), this paper divides the above countries of the BRI into five groups: East Asia (EA), South Asia (SA), West Asia and North Africa (WA), Central and Eastern Europe (CE) and Central Asia (CA). The specific countries are shown in Table 3.

3. Results

3.1. Measurement Results of the Theil Index

Formula 4 is used to calculate the Theil index of the BRI countries. The results demonstrate that the total Theil index of carbon emission efficiency in BRI countries is 0.196, with an intra-group difference of 0.165 and an inter-group difference of 0.031. Thus, there are significant differences in carbon emission efficiency among the BRI countries, and more than 80% of the differences are caused by intra-group differences. According to the calculation results of Formula 3, it can be seen that the intra-group Theil index of the Central and Eastern Europe (CE) is the largest (0.235), followed by East Asia (EA), South Asia (SA), West Asia (WA) and North Africa (NA) (0.213, 0.104 and 0.088). The intra-group Theil index of the Central Asia (CA) is the smallest (0.080) (as shown in Table 2).
Ultimately, the dramatic difference between carbon emissions and GDP of countries within each group is a significant reason for the differences in carbon emission efficiency of the BRI countries. Table 4 demonstrates the average carbon emission efficiency and the extreme of the five groups. The average carbon emission efficiency of East Asia (EA) is the highest (2348.4 $/ton), while that of Central Asia (CA) is the lowest (683.9 $/ton). East Asia (EA) is more than three times as much as that of Central Asia (CA). Within each group, the differences in carbon emission efficiency are much greater than this. The extreme value ratio of carbon emission efficiency in Central and Eastern Europe (CE) is 111.2, which is the highest among the five groups. The extreme value ratio of Central Asia (CA) is the smallest (3.5), which is still higher than the inter-group extreme value ratio. It can be seen that the intra-group differences are much higher than the inter-group differences.
Moreover, further comparison demonstrates that the intra-group differences of total carbon emissions and total GDP are much larger than inter-group differences. From the perspective of the inter-group, the extreme value ratio of total carbon emissions and total GDP of each group is 4.0 and 5.9, respectively. Within the group, the extreme value ratio of carbon emissions in South Asia (SA) is the highest, reaching 2723.5. West Asia and North Africa (WA) and Central and Eastern Europe (CE) all have extreme carbon emission ratios of more than 100. The extreme value ratio of GDP in Central and Eastern Europe (CE) is 1334.9, which is the highest among the five groups. The other four groups also exceed 30. It can be seen that carbon emissions and economic development are not uniform within each group.
In addition, in order to investigate the specific contribution of different sectors in the carbon emission efficiency differences, the Theil index is used to measure the carbon emission efficiency of different sectors in BRI countries. Figure 2 shows the Theil index of carbon emission efficiency in 26 sectors. First, the Theil index of 20 sectors are higher than the total Theil index. The private household (S24) has the highest Theil index (0.74), followed by the transportation equipment (S10) (0.64). Second, the intra-group differences are higher than the inter-group differences for 23 sectors, such as the agriculture (S1) and the fish (S2). The vast majority of sectors are more affected by intra-group differences, and only a few sectors used to meet the consumption needs of the population are slightly more affected by inter-group differences in carbon emission efficiency, such as the food (S4) and the textiles and clothing (S5) sectors.

3.2. Decomposition Results of the Theil Index Differences between Groups

As mentioned above, the differences in carbon emission efficiency of the BRI countries are mainly caused by intra-group differences. Therefore, the intra-group differences decomposition method of carbon emission efficiency described in 3.2 are used to analyse the reasons for the intra-group differences of carbon emission efficiency between groups. The differences of Theil index are decomposed into three factors: energy efficiency, energy structure and GDP share. The results demonstrate that energy efficiency is the dominant factor affecting carbon emission efficiency differences between most groups, and only a few groups are mainly influenced by energy structure and GDP share differences. Differences between East Asia and Central and Eastern Europe (EA–CE), South Asia and East Asia (SA–EA) and West Asia and North Africa and South Asia (WA–SA) are all dominated by differences in energy efficiency. Among them, the difference of the Theil index between East Asia and Central and Eastern Europe (EA–CE) is 10.76%. The contribution of energy efficiency, energy structure and GDP share are 6.38%, 3.05% and 1.31%, respectively (as shown in Figure 3). The differences between South Asia and East Asia (SA–EA), West Asia and North Africa and South Asia (WA–SA) are 103.53%, 18.41% and 10.74%, respectively. The contribution rate of energy efficiency differences is over 40%, which is higher than the contribution rate of energy structure differences. It can be seen that energy efficiency is the main reason for the differences of the Theil index between groups, followed by the differences in energy structure. The differences in GDP share have the least contribution.
Further, the differences in energy efficiency between groups are explored in depth. Central and Eastern Europe (CE) have the largest differences in both the Theil index of carbon emission efficiency and energy efficiency. The country with the highest carbon emission efficiency in Central and Eastern Europe (CE) are more than 90 times the country that has the least. Central and Eastern European countries include both countries whose service industries account for more than three quarters, such as Latvia and Croatia, and countries whose agriculture and industry account for more than 40 per cent, such as Albania and Belarus. As a result, energy efficiency varies widely. Central Asia has the smallest Theil index and the smallest differences in energy efficiency between countries. The reason is that these five countries are rich in mineral resources and are resource-based countries. The industrial structure is highly similar. The tertiary industry makes up a large proportion. In addition to Turkmenistan, the four countries accounted for more than 45% of the three industries. Tajikistan has the highest energy efficiency in the group and Turkmenistan the lowest. However, the former was only three times more than the latter, less significant than the differences between the East Asia and Central and Eastern Europe groups (EA–CE).
In order to study the specific differences of carbon emission efficiency in different sectors, we measured the differences in sectors of energy efficiency Theil index between groups. Figure 4 demonstrates the decomposition of the carbon emission efficiency Theil index for BRI countries in typical sectors. It is obvious that energy efficiency is the main reason for the differences in the sectoral Theil index between the groups. Between Central Asia and West Asia (CA–WA), ten sectors including recycling (S12), electricity, natural gas and water (S13) in West Asia (WA) have a higher Theil index than in Central Asia (CA), which is mainly caused by energy efficiency differences. It is worth noting that the energy structure of the food sector (S4) is the main factor contributing to the differences in the Theil index. Similar differences are seen between Central Asia and West Asia (CA–WA), between West Asia and South Asia (WA–SA), South Asia and East Asia (SA–EA), East Asia and Central and Eastern Europe(EA–CE), with almost half of sectors including other manufacturing industries (S11) in latter having a higher Theil index than in the former. However, between East Asia and Central and Eastern Europe (EA–CE), more than half of the sectors in East Asia (EA) have a higher carbon efficiency Theil index than in Central and Eastern Europe (CE). Energy structure is the dominant factor of carbon emission efficiency differences among most sectors. Energy efficiency still dominates most sectors, except for private households (S24) and re-export (S26) between South Asia and East Asia (SA–EA), and recycling (S12) between East Asia and Central and Eastern Europe (EA–CE).

3.3. Decomposition Results of Carbon Emission Efficiency Differences within Groups

To explore driving factors of carbon emission efficiency differences within five groups, LMDI described in Section 2.3 is used to measure the differences within groups. The countries with the highest and lowest carbon emission efficiency in each group are selected separately. The decomposition of carbon emission efficiency for two countries in each group illustrates that energy efficiency represents the main factor influencing the intra-group differences and effectively promotes the differences of carbon emission efficiency between countries with the highest and lowest carbon emission efficiency in East Asia (EA), South Asia (SA), West Asia and North Africa (WA), and Central Asia (CA). As can be seen from Figure 5, energy efficiency differences within most groups play a significant role in differences in carbon emission efficiency. Among the five groups, energy efficiency differences in East Asia (EA), South Asia (SA), Central Asia, West Asia and North Africa (WA) all contributed to the carbon emission efficiency differences, while the differences in energy structure in Central and Eastern Europe (CE) led to the differences in carbon emission efficiency within the group. In East Asia (EA), Vietnam has the lowest carbon emission efficiency, while Singapore has the highest carbon emission efficiency, which is 1267.47% higher than Vietnam. Differences in energy efficiency drive 59.82%, while differences in energy structure drive only 40.18%. The differences between the highest carbon emission efficiency country and the lowest in South Asia (SA), West Asia and North Africa (WA) and Central Asia (CA) are 344.56%, 558.87% and 253.83%, respectively. The contribution rate of energy efficiency differences is over 35%, which is higher than the contribution rate of energy structure differences. It can be seen that energy efficiency is the main reason for the differences in carbon emission efficiency within East Asia (EA), South Asia (SA), Central Asia (CA), West Asia and North Africa (WA), followed by the differences in energy structure.
In order to observe the reasons for the carbon emission efficiency differences of countries within groups, the differences in energy efficiency of each group are explored. Energy efficiency mainly depends on the technology used in the production process. Due to the different development levels and technology status of different countries in each group, there are certain differences in the energy efficiency of different countries. In addition, the energy efficiency of each country is related to its industrial structure. Countries with a low proportion of energy-intensive industries, such as financial intermediation, are more energy efficient. Taking East Asia (EA) for example, the differences in carbon emission efficiency in East Asia (EA) are significantly affected by financial intermediation and commercial activities. Singapore and other countries enjoy good economic development, and the tertiary industry has a great advantage; on the other hand, Vietnam and other countries have less developed service industries, which leads to unbalanced development within the group. West Asia and North Africa (WA), South Asia (SA) and Central Asia (CA) development is more balanced. Countries in West Asia and North Africa (WA) own rich oil and gas resources, for example, Iran. With the advanced petrochemical industry, national economic structure and production levels are similar in West Asia and North Africa (WA) countries. South and Central Asian countries have similar industrial structures. However, Central and Eastern Europe (CE) have both developed countries like Slovenia and developing countries with high external dependence on raw materials, energy and technology, such as Moldova. It can be seen that there is a large difference in energy structure within Central and Eastern Europe (CE).
To specifically study the carbon emission efficiency differences between countries within the groups, the sectoral carbon emission efficiency in five groups are decomposed (Figure 5). Figure 6a represents typical sectors in which energy efficiency causes more carbon efficiency differences than energy structure, and Figure 6b shows the typical sectors in which energy structure causes more carbon efficiency differences than energy efficiency. It can be seen that energy efficiency is the focal factor within five groups. The least carbon efficient countries in the South Asia (SA) and Central Asia (CA) all need to improve their energy efficiency in electricity, natural gas, and water (S13) to decrease the difference with the largest carbon emission efficient country within groups. Take East Asia (EA) as an example, Vietnam needs to improve energy efficiency in textiles and clothing (S5) and electricity, natural gas and water (S13), while the energy structure of food (S4) and retail trade (S17) needs to be optimized to narrow the gap with Singapore. As for West Asia and North Africa (WA), Iran needs to improve energy efficiency in electricity, natural gas and water (S13) and private households (S24), optimize energy structure in transportation (S19) and re-export (S26), and reduce the carbon efficiency gap with Iraq.

4. Discussion

We find that the Theil index of BRI is larger than that of other economic cooperation organizations [55], which shows that carbon emission efficiency varies greatly in BRI countries. Therefore, the carbon emission differences in the Belt and Road region need to be reduced. This study finds that the intra-group differences are much larger than the inter-group differences, so it is important to focus on countries that are geographically close to each other. We also find that energy efficiency causes the main carbon emission efficiency differences. By promoting the development of cleaner production technologies and improving the energy structure, the carbon emission efficiency differences will be effectively reduced. The results and findings of this paper have guiding implications for the green development of the BRI and even other economic cooperation organizations.
This paper is a decomposition based on Theil index to explore the sources of differences of carbon emission efficiency in the BRI countries. Previous studies only use the Theil index as a measure of variation but have not explored the causes of variation in depth [24]. We find that differences in energy efficiency mainly cause most of the intra-group differences, while energy structure mainly causes inter-group differences, such as in Central and Eastern Europe (CE). Additionally, the GDP share plays a major role in the inter-group differences, for example in Central Asia and West Asia (CA–WA). Energy efficiency is the main factor affecting the difference in carbon emission efficiency. This conclusion confirms the findings of some previous studies [13,22]. The new finding of the article is that the degree of the differences due to energy efficiency varies across country groups, especially between South Asia and East Asia (SA–EA), by 42.85%. In addition, there has been no research focusing on the differences in carbon emission efficiency in the different sectors. This paper finds that the impact of energy efficiency on mining and quarrying (S3), and electricity, natural gas and water (S13) is particularly pronounced between South Asia and East Asia (SA–EA), of where differences are evident.
Diverse regional cooperation development organizations play a primary role in addressing climate change. There is a need to increase efficiency and reduce differences within the organizations to jointly address climate change and economic development issues. Considering the widespread geographical scope and large differences in economic development, we select BRI countries to focus on. Our study finds that there are indeed differences in BRI countries; there are also differences within various economic cooperation organizations [17,20]. Compared to other organizations, the BRI has a greater degree of variation. The findings of this study have significant implications for other economic cooperation development organizations such as the European Union and the North Atlantic Treaty Organization. Improving energy efficiency is particularly urgent for developing countries. Improving the energy structure is instructive for countries both inside and outside the BRI.
The limitations of this article are mainly two aspects. On the one hand, only the spatial differences in carbon emission efficiency are examined, but temporal perspective is not combined. In the next step, a more comprehensive investigation on the carbon emission efficiency differences of the countries along the route can be conducted by integrating the spatial and temporal perspectives. On the other hand, there is a lack of research comparison with other economic cooperation organizations, such as European Union or North Atlantic Treaty Organization. Future research can study the difference and the degree of difference within other organizations, extending the scope to a comprehensive study of the causes of the differences and the paths to reduce the differences.

5. Conclusions and Policy Implications
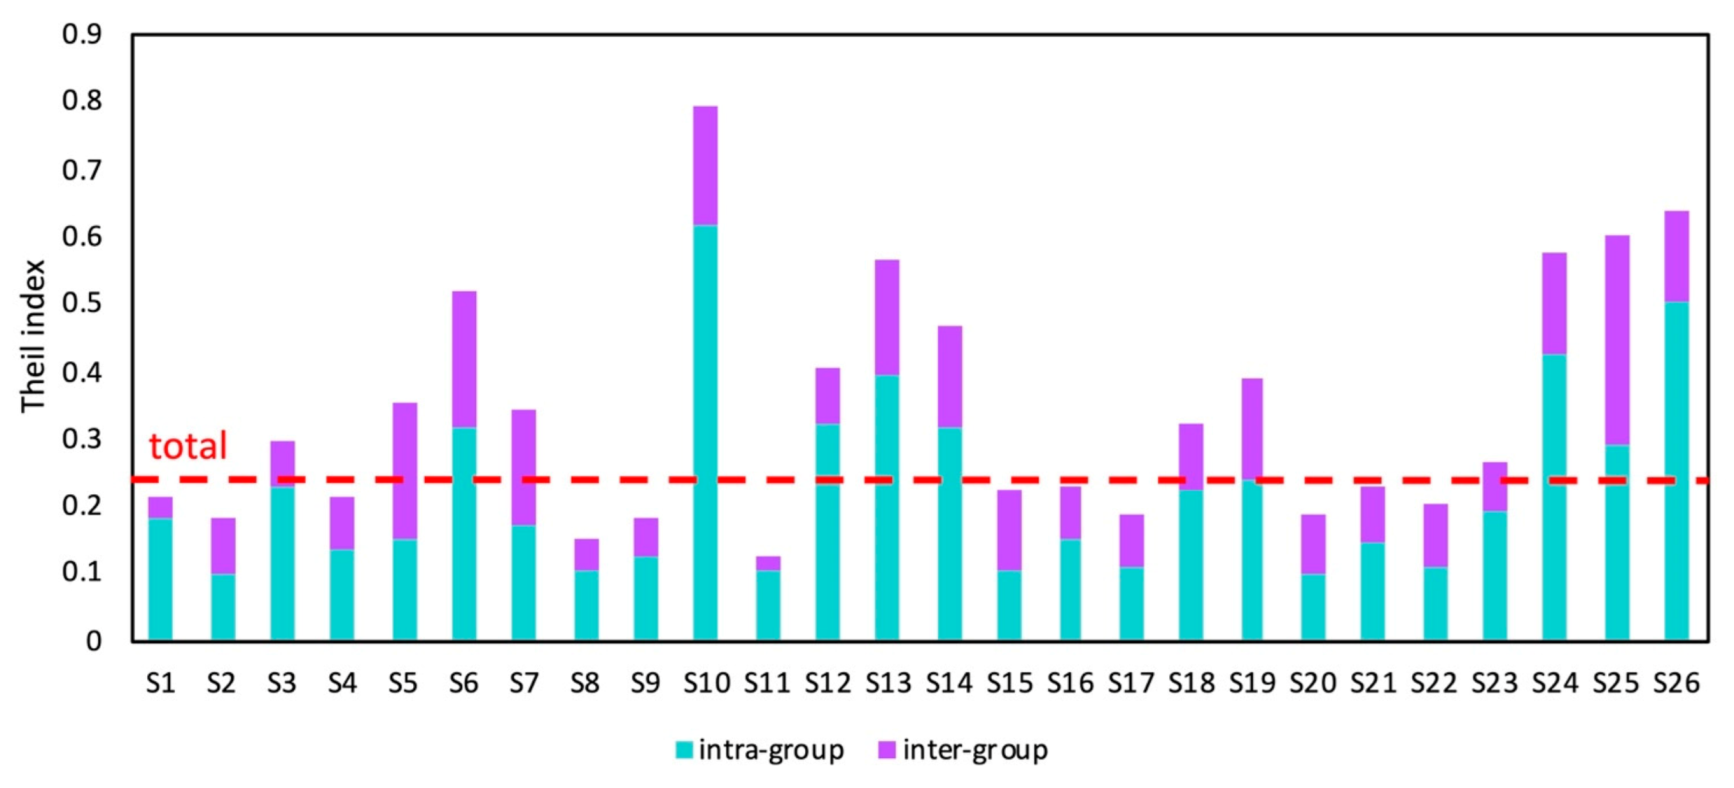
From the background of addressing global warming, improving carbon emission efficiency and narrow regional differences is very important for green development in BRI regions with developing countries as the main body. This paper adopts a single-factor perspective to calculate the carbon emission efficiency of Belt and Road Initiative countries which are grouped into five by geographical location. Differences in carbon emission efficiency have also been examined both between groups and within groups. Furthermore, the reasons for differences between groups and within groups have been examined based on the LMDI method. Through the above studies, the main conclusions are as follows:
(1)
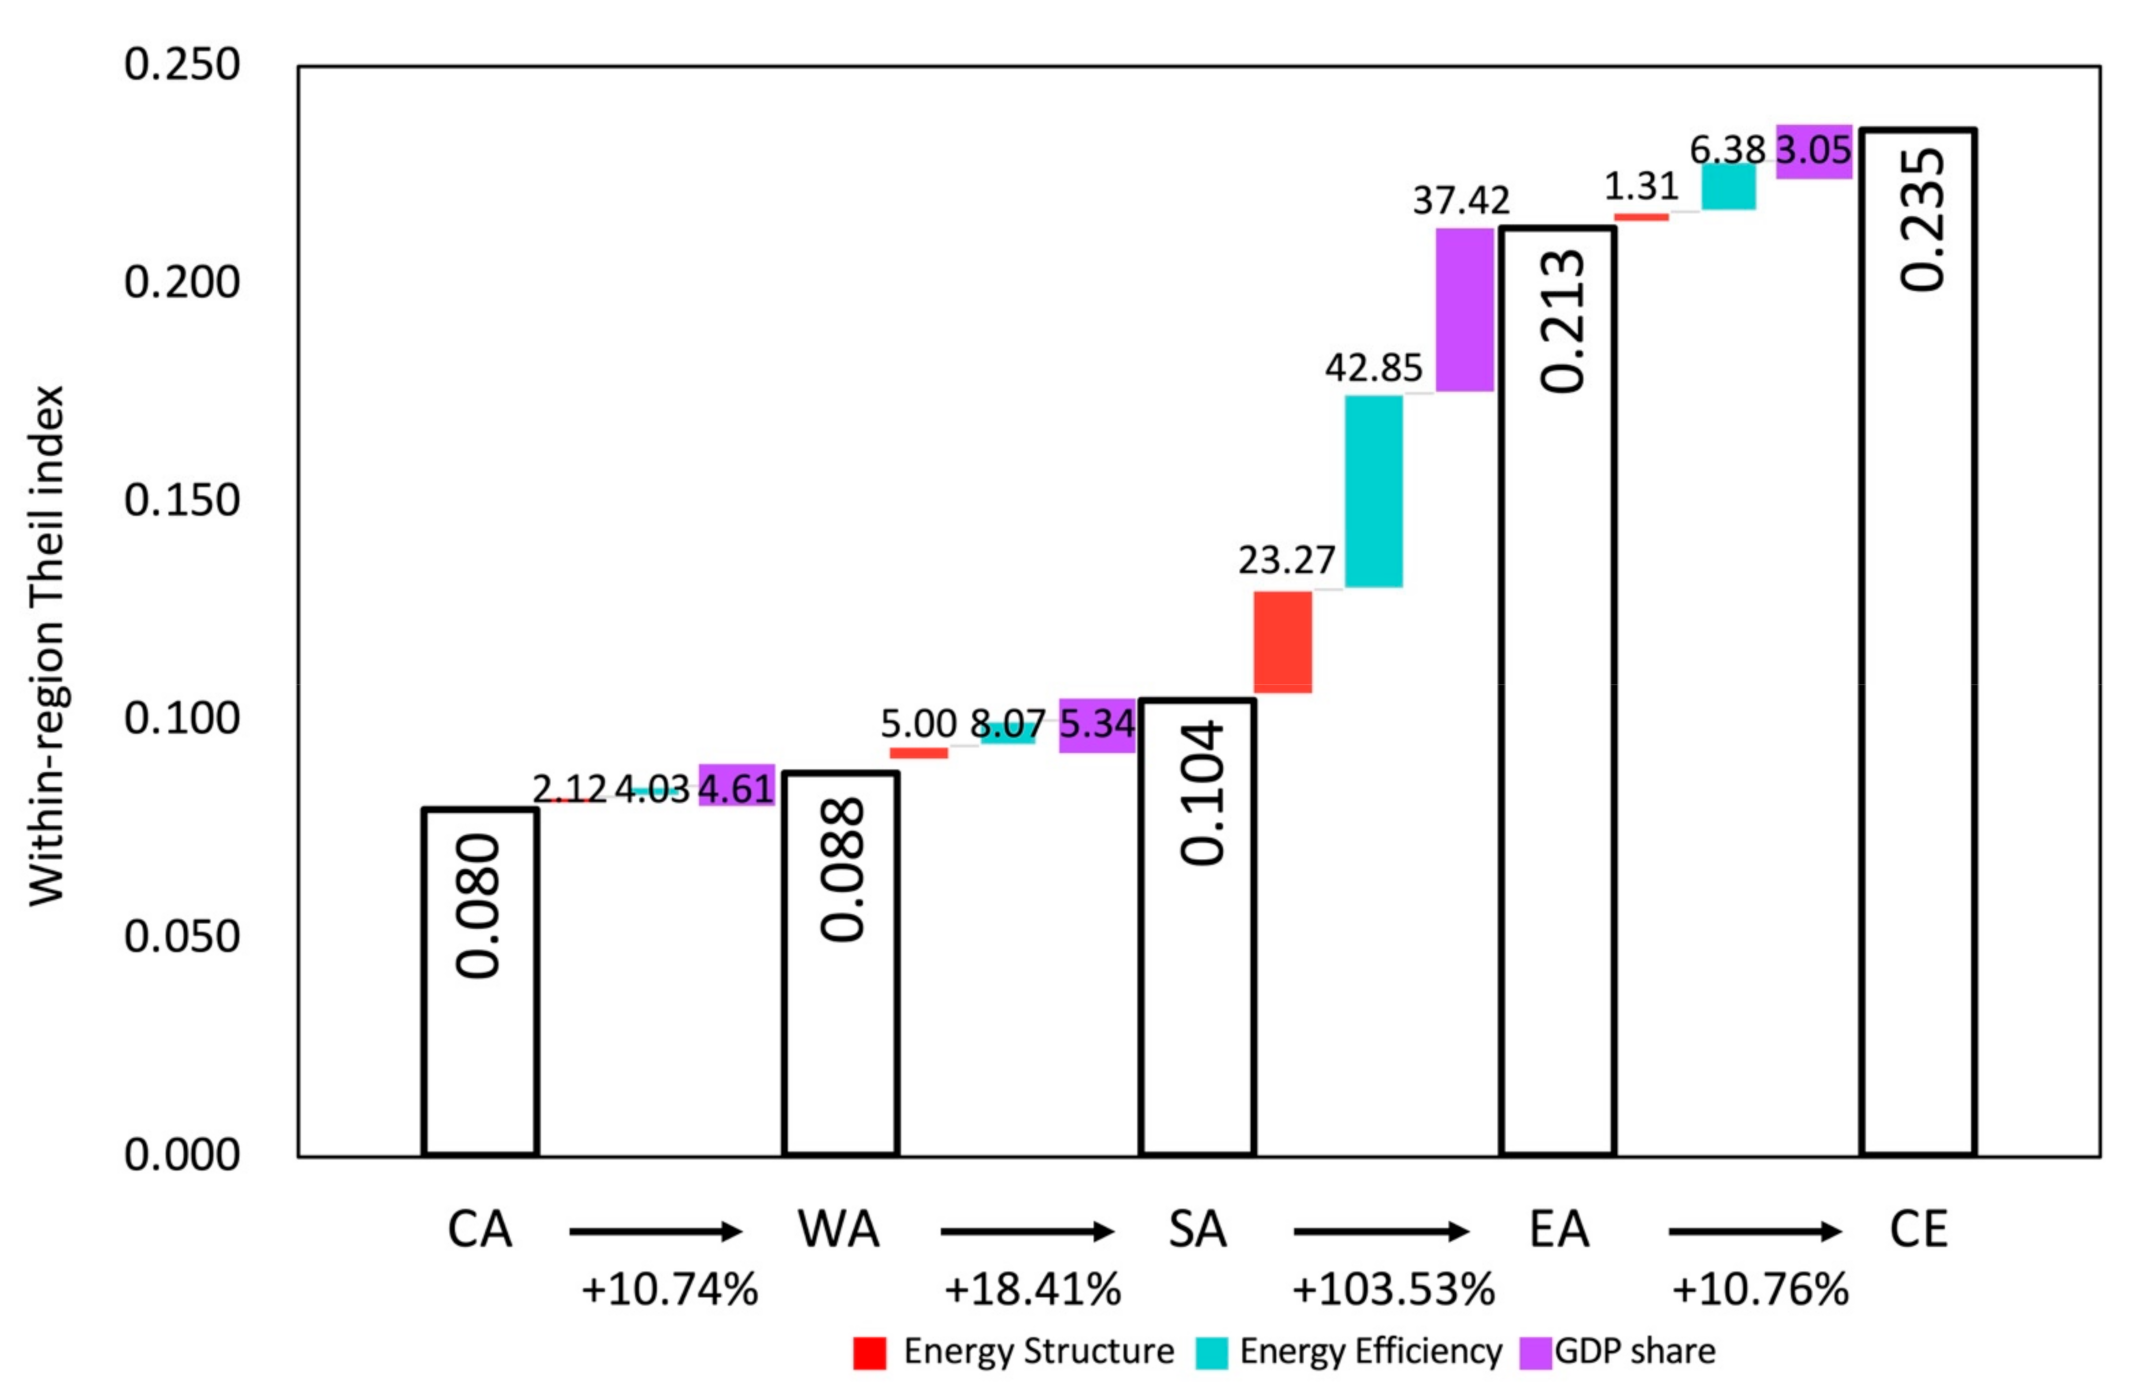
Significant differences exist in the carbon emission efficiency of the BRI countries, and more than 80% of the differences are caused by intra-group differences. The Theil index of carbon emission efficiency in BRI countries is 0.196, with an intra-group difference of 0.165 and an inter-group difference of 0.031. The degree of differences is different in each group. The Theil index is 0.235, 0.213, 0.104, 0.088 and 0.080, respectively, in Central and Eastern Europe (CE), East Asia (EA), South Asia (SA), West Asia and North Africa (WA) and Central Asia (CA). There are notable differences of carbon emission efficiency in most sectors, especially in private household (S24) and transportation equipment (S10), whose Theil index is 0.74 and 0.64, respectively. Similarly, the differences of carbon emission efficiency in most of sectors are mainly due to intra-group differences.
(2)
Between groups, energy efficiency is the dominant factor for most of the differences in carbon emission efficiency. Especially between East Asia and Central and Eastern Europe (EA–CE), South Asia and East Asia and (SA–EA), West Asia and North Africa and South Asia (WA–SA), energy efficiency resulted in increases of 6.38%, 42.85% and 8.07% in the intra-group Theil index, respectively, while energy structure only resulted in increasing contribution of 1.31%, 23.27% and 5.00%. Energy structure causes the differences in carbon emission efficiency between Central Asia and West Asia (CA–WA), which resulted in a 4.61% increase in the intra-group Theil index. The contribution of energy efficiency is more significant than that of energy structure in most sectors between groups. The effect of energy structure is bigger than that of energy efficiency only in a few sectors, such as the food sector (S4) between Central Asia and West Asia (CA–WA).
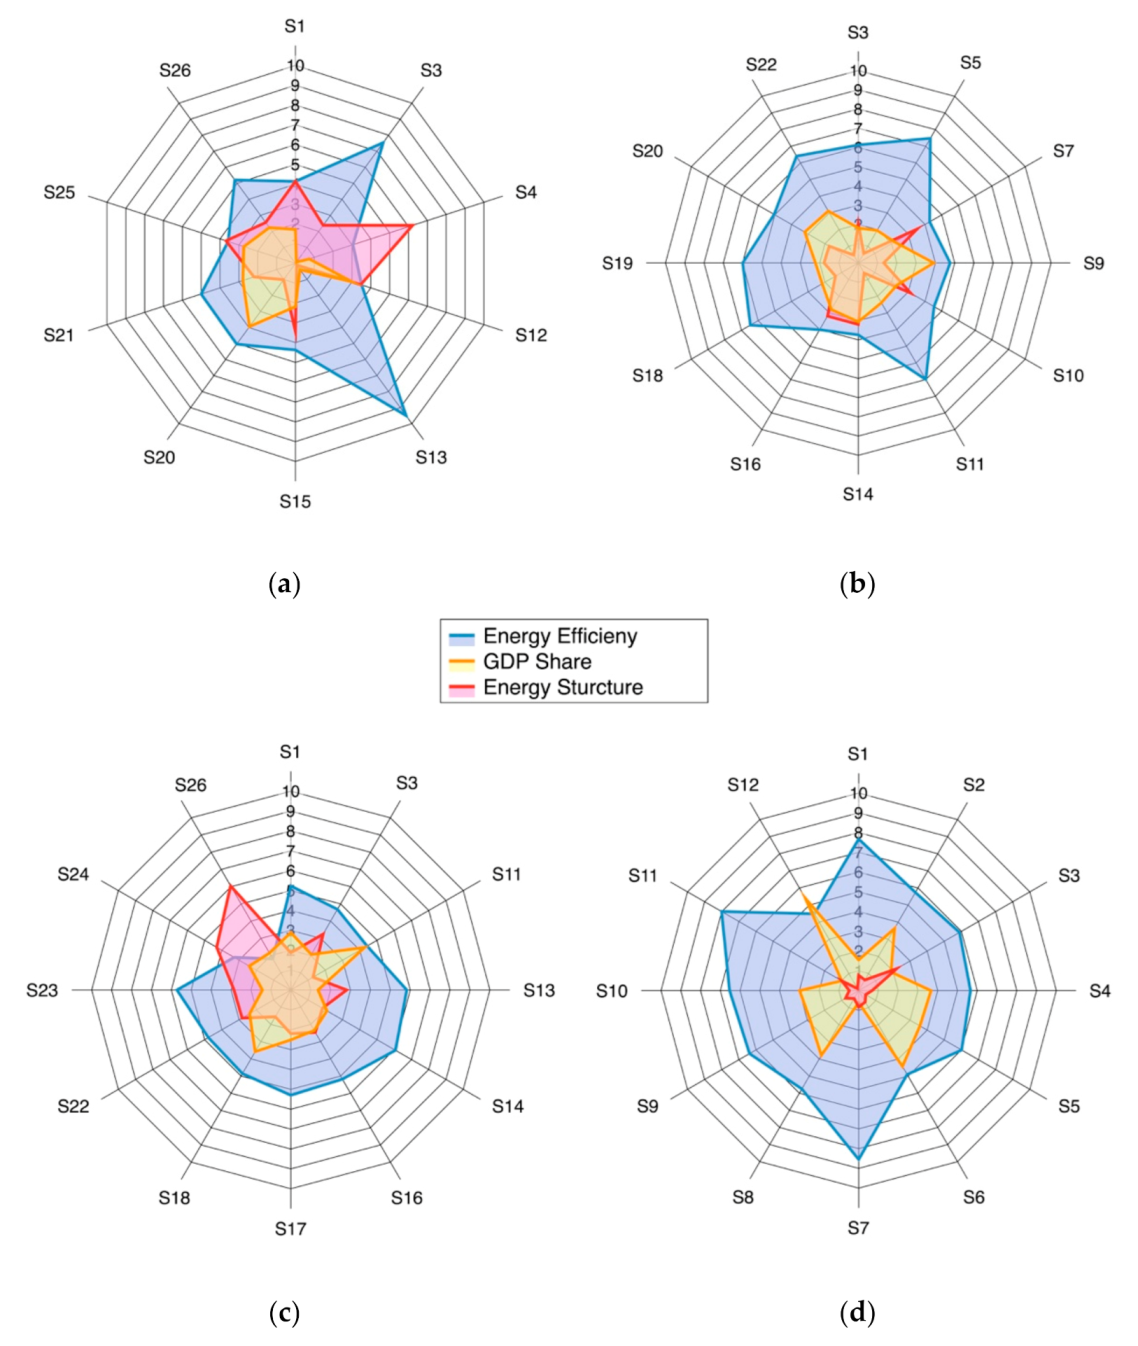
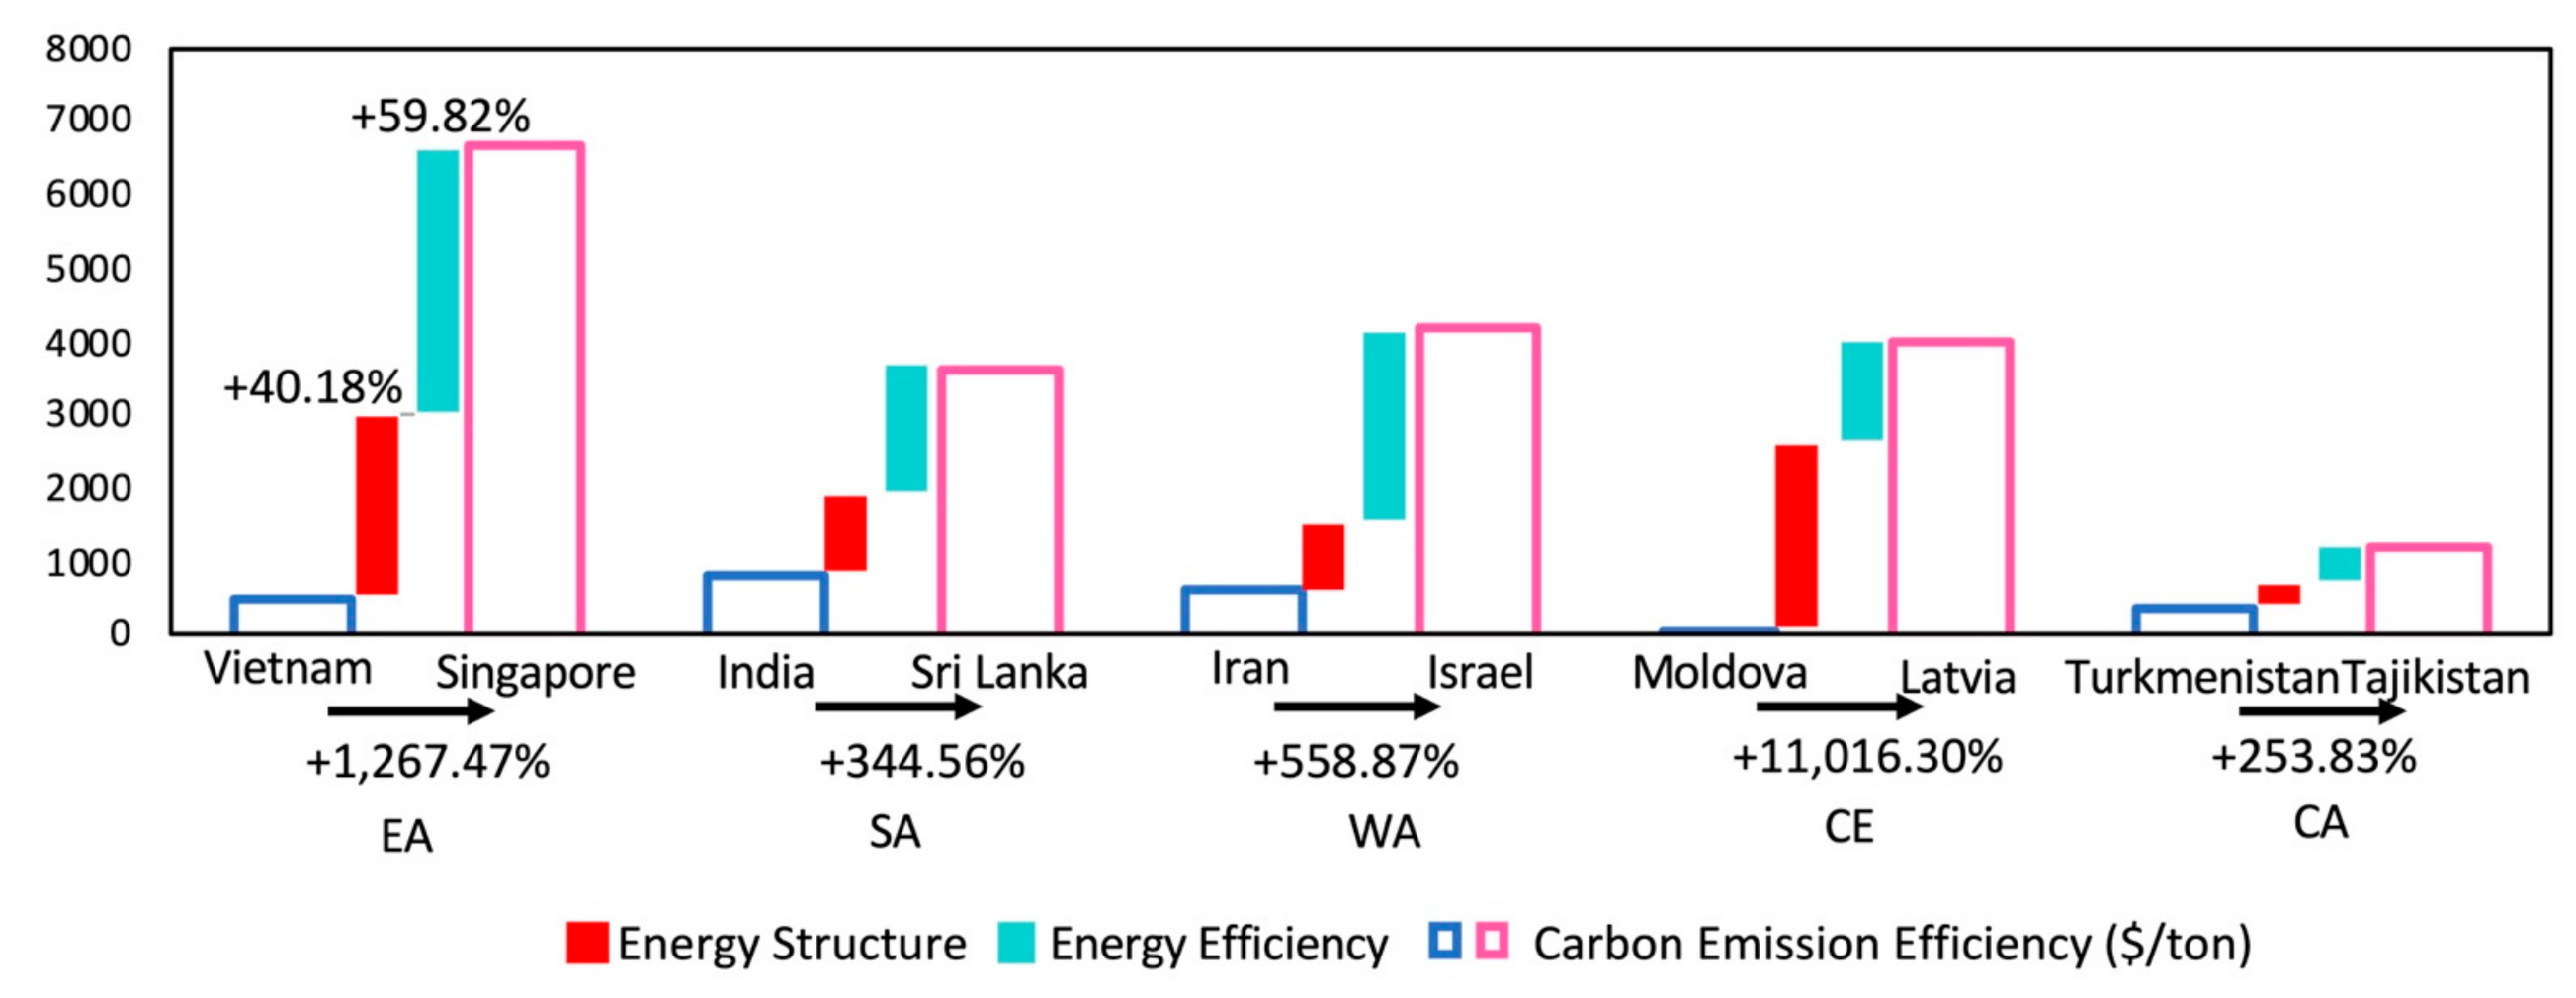
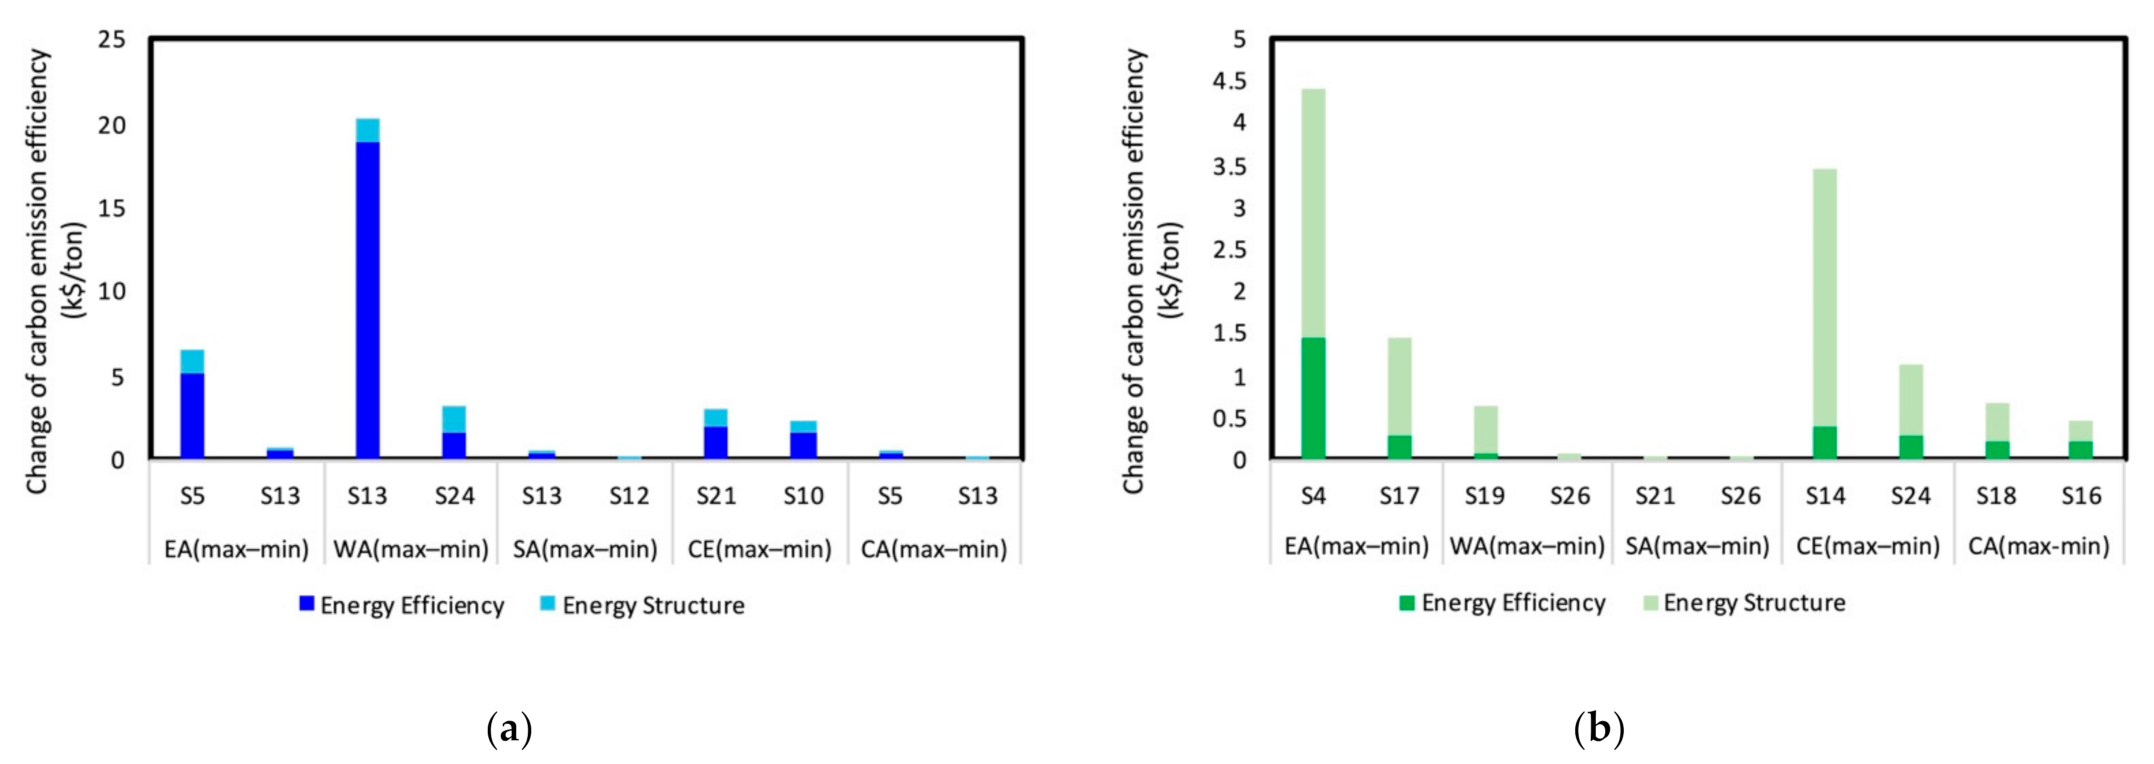
(3)
Between most of the countries with the highest and lowest carbon emission efficiency in the same group, energy efficiency is still the primary factor affecting the differences, such as Singapore and Vietnam (EAmax–min), Israel and Iran (WAmax–min), Sri Lanka and India (SAmax–min), Latvia and Moldova (CEmax–min), especially in the textiles and clothing (S5), and electricity, natural gas and water (S13) sectors. Only few countries and sectors have differences in carbon emission efficiency, mainly due to different energy structures, for example, the construction sector (S14) between Latvia and Moldova (CEmax–min).
Based on the analysis results, this paper suggests some policy recommendations. Overall, the BRI countries have significant differences in carbon emission efficiency, and the inequality of carbon emission efficiency is obvious within each group. Central and Eastern Europe (CE) and East Asia (EA) have great differences in carbon emission efficiency. Consensus should be reached on different regional environmental conditions to narrow the differences of carbon emission efficiency within the groups. For example, countries with high carbon emission efficiency in East Asia, such as Singapore, should promote international cooperation. In regions with low carbon emission efficiency, such as Vietnam, accelerating the introduction of new and high-tech technologies, increasing the added value of products, and deepening tourism development is effective. In addition, this study found that most of the sectors, including the private household and the transportation equipment, have a higher Theil index than the overall. Additionally, the differences of carbon emission efficiency among sectors are mainly caused by intra-group differences. BRI countries need a more balanced development of the private household and transport equipment sectors.
Furthermore, energy efficiency synergies between groups also deserve attention. Energy efficiency needs to be focused on narrowing the carbon efficiency gap between different groups, such as between East Asia and Central and Eastern Europe (EA–CE), South Asia and East Asia and (SA–EA), and West Asia and North Africa and South Asia (WA–SA). For example, policies can focus on industrial transformation, such as developing industrial heritage tourism and developing information-based manufacturing in West Asia and North Africa (WA), which have similar natural conditions and resource endowment structures. The results of this article indicate that policymakers should encourage the reasonable transfer of industry, such as recycling (S12), between East Asia and Central and Eastern Europe (EA–CE), and private household (S24) and re-export (S26) between South Asia and East Asia and (SA–EA). For the food sector (S4) between Central Asia and West Asia (CA–WA), energy structure needs to be optimized.
Finally, by analyzing the carbon emission efficiency differences within groups, this study finds that differences in energy efficiency are the main reason. Therefore, five groups should speed up the upgrading of traditional industries and promote the adjustment of industrial structure to reduce the imbalance of energy efficiency. Governments can promote the integration of informatization and industrialization to increase economic output per unit of energy. For instance, it is necessary to promote cleaner production technology improvements in sectors such as textiles and clothing, and electricity, gas and water within East Asia (EA), and it is suggested to reduce the dependence on primary energy in private households and transportation in Moldova and Iran.
The results of the analysis in this paper point out that moving away from dependence on primary energy sources can be an effective policy measure to improve equilibrium. In addition, the establishment of inter-state and inter-industry compensation mechanisms is also an efficacious instrument. Indeed, even though these measures have not been widely adopted in the BRI, the benefits gained through the implementation of this policy have been fruitful in other countries. How to effectively accelerate the sustainable economic, social and ecological development is still an urgent global decision. In this sense, BRI could become a unique opportunity to consolidate the idea of sustainable development and to shape the green community. We hope that this paper will contribute to policy-making in other economic cooperation organizations such as the European Union and the North Atlantic Treaty Organization. In this way, the balanced development of each organization can effectively stimulate the global active response to climate change.

Author Contributions

Conceptualization, Y.L. and X.S.; methodology, X.S. and X.B.; software, X.S. and X.B.; validation, Y.L., X.S. and X.B.; formal analysis, X.S.; investigation, X.S.; resources, X.S.; data curation, X.S.; writing—original draft preparation, X.S.; writing—review and editing, Y.L. and X.S.; visualization, X.S.; supervision, X.S.; project administration, X.S.; funding acquisition, Y.L. All authors have read and agreed to the published version of the manuscript.

Funding

This research was funded by the National Natural Science Foundation of China (No. 41871201).

Institutional Review Board Statement

Not applicable.

Informed Consent Statement

Not applicable.

Data Availability Statement

Not applicable.

Acknowledgments

The authors are grateful to anonymous reviewers whose comments have helped to improve the manuscript.

Conflicts of Interest

The authors declare no conflict of interest.

References

  1. Adekoya, O.B.; Oliyide, J.A.; Noman, A. The Volatility Connectedness of the EU Carbon Market with Commodity and Financial Markets in Time- and Frequency-Domain: The Role of the U.S. Economic Policy Uncertainty. Resour. Policy 2021, 74, 102252. [Google Scholar] [CrossRef]
  2. Daigneault, A.J.; Sohngen, B.L.; Sedjo, R. Carbon and Market Effects of U.S. Forest Taxation Policy. Ecol. Econ. 2020, 178, 106803. [Google Scholar] [CrossRef]
  3. European Commission. Report on the Functioning of the European Carbon Market. 2020. Available online: https://eur-lex.europa.eu/legal-content/EN/TXT/PDF/?uri=CELEX:52019DC0557R(01)&from=EN (accessed on 8 February 2022).
  4. Anke, C.-P.; Hobbie, H.; Schreiber, S.; Möst, D. Coal Phase-Outs and Carbon Prices: Interactions between EU Emission Trading and National Carbon Mitigation Policies. Energy Policy 2020, 144, 111647. [Google Scholar] [CrossRef]
  5. NDRC. National Development and Reform Commission. Vision and Actions on Jointly Building Silk Road Economic Belt and 21-Century Maritime Silk Road. 2015. Available online: http://en.drc.gov.cn/2015-10/13/content_22174539.htm (accessed on 8 February 2022).
  6. Huang, Y. Understanding China’s Belt & Road Initiative: Motivation, Framework and Assessment. China Econ. Rev. 2016, 40, 314–321. [Google Scholar] [CrossRef]
  7. Han, M.; Lao, J.; Yao, Q.; Zhang, B.; Meng, J. Carbon Inequality and Economic Development across the Belt and Road Regions. J. Environ. Manag. 2020, 262, 110250. [Google Scholar] [CrossRef]
  8. Wang, X.; Yang, J.; Zhou, Q.; Liu, M.; Bi, J. Mapping the Exchange between Embodied Economic Benefits and CO2 Emissions among Belt and Road Initiative Countries. Appl. Energy 2022, 307, 118206. [Google Scholar] [CrossRef]
  9. Li, J.; Ma, J.; Wei, W. Analysis and Evaluation of the Regional Characteristics of Carbon Emission Efficiency for China. Sustainability 2020, 12, 3138. [Google Scholar] [CrossRef] [Green Version]
  10. Zeng, L.; Lu, H.; Liu, Y.; Zhou, Y.; Hu, H. Analysis of Regional Differences and Influencing Factors on China’s Carbon Emission Efficiency in 2005–2015. Energies 2019, 12, 3081. [Google Scholar] [CrossRef] [Green Version]
  11. Tian, Z.; Ren, F.-R.; Xiao, Q.-W.; Chiu, Y.-H.; Lin, T.-Y. Cross-Regional Comparative Study on Carbon Emission Efficiency of China’s Yangtze River Economic Belt Based on the Meta-Frontier. Int. J. Environ. Res. Public Health 2019, 16, 619. [Google Scholar] [CrossRef] [Green Version]
  12. Zeng, S.; Xu, Y.; Wang, L.; Chen, J.; Li, Q. Forecasting the Allocative Efficiency of Carbon Emission Allowance Financial Assets in China at the Provincial Level in 2020. Energies 2016, 9, 329. [Google Scholar] [CrossRef] [Green Version]
  13. Razzaq, A.; Sharif, A.; Najmi, A.; Tseng, M.-L.; Lim, M.K. Dynamic and Causality Interrelationships from Municipal Solid Waste Recycling to Economic Growth, Carbon Emissions and Energy Efficiency Using a Novel Bootstrapping Autoregressive Distributed Lag. Resour. Conserv. Recycl. 2021, 166, 105372. [Google Scholar] [CrossRef]
  14. Zhou, Y.; Liu, W.; Lv, X.; Chen, X.; Shen, M. Investigating Interior Driving Factors and Cross-Industrial Linkages of Carbon Emission Efficiency in China’s Construction Industry: Based on Super-SBM DEA and GVAR Model. J. Clean. Prod. 2019, 241, 118322. [Google Scholar] [CrossRef]
  15. Li, J.; Cheng, Z. Study on Total-Factor Carbon Emission Efficiency of China’s Manufacturing Industry When Considering Technology Heterogeneity. J. Clean. Prod. 2020, 260, 121021. [Google Scholar] [CrossRef]
  16. He, Y.; Xing, Y.; Zeng, X.; Ji, Y.; Hou, H.; Zhang, Y.; Zhu, Z. Factors Influencing Carbon Emissions from China’s Electricity Industry: Analysis Using the Combination of LMDI and K-Means Clustering. Environ. Impact Assess. Rev. 2022, 93, 106724. [Google Scholar] [CrossRef]
  17. Dong, F.; Li, Y.; Gao, Y.; Zhu, J.; Qin, C.; Zhang, X. Energy Transition and Carbon Neutrality: Exploring the Non-Linear Impact of Renewable Energy Development on Carbon Emission Efficiency in Developed Countries. Resour. Conserv. Recycl. 2022, 177, 106002. [Google Scholar] [CrossRef]
  18. Sheng, P.; Li, J.; Zhai, M.; Huang, S. Coupling of Economic Growth and Reduction in Carbon Emissions at the Efficiency Level: Evidence from China. Energy 2020, 213, 118747. [Google Scholar] [CrossRef]
  19. Cheng, Y.; Wang, C.; Fan, T. Forecast of the Time Lag Effect of Carbon Emissions Based on a Temporal Input-Output Approach. J. Clean. Prod. 2021, 293, 126131. [Google Scholar] [CrossRef]
  20. Liñán-Abanto, R.N.; Salcedo, D.; Arnott, P.; Paredes-Miranda, G.; Grutter, M.; Peralta, O.; Carabali, G.; Serrano-Silva, N.; Ruiz-Suárez, L.G.; Castro, T. Temporal Variations of Black Carbon, Carbon Monoxide, and Carbon Dioxide in Mexico City: Mutual Correlations and Evaluation of Emissions Inventories. Urban Clim. 2021, 37, 100855. [Google Scholar] [CrossRef]
  21. Sun, L.; Liu, W.; Li, Z.; Cai, B.; Fujii, M.; Luo, X.; Chen, W.; Geng, Y.; Fujita, T.; Le, Y. Spatial and Structural Characteristics of CO2 Emissions in East Asian Megacities and Its Indication for Low-Carbon City Development. Appl. Energy 2021, 284, 116400. [Google Scholar] [CrossRef]
  22. Goldstein, B.; Reames, T.G.; Newell, J.P. Racial Inequity in Household Energy Efficiency and Carbon Emissions in the United States: An Emissions Paradox. Energy Res. Soc. Sci. 2022, 84, 102365. [Google Scholar] [CrossRef]
  23. Zhu, X.-H.; Lu, K.-F.; Peng, Z.-R.; He, H.-D.; Xu, S.-Q. Spatiotemporal Variations of Carbon Dioxide (CO2) at Urban Neighborhood Scale: Characterization of Distribution Patterns and Contributions of Emission Sources. Sustain. Cities Soc. 2022, 78, 103646. [Google Scholar] [CrossRef]
  24. Wang, R.; Wang, Q.; Yao, S. Evaluation and Difference Analysis of Regional Energy Efficiency in China under the Carbon Neutrality Targets: Insights from DEA and Theil Models. J. Environ. Manag. 2021, 293, 112958. [Google Scholar] [CrossRef] [PubMed]
  25. Gong, J.W.; Li, Y.P.; Lv, J.; Huang, G.H.; Suo, C.; Gao, P.P. Development of an Integrated Bi-Level Model for China’s Multi-Regional Energy System Planning under Uncertainty. Appl. Energy 2022, 308, 118299. [Google Scholar] [CrossRef]
  26. Zhang, N.; Wang, B.; Liu, Z. Carbon Emissions Dynamics, Efficiency Gains, and Technological Innovation in China’s Industrial Sectors. Energy 2016, 99, 10–19. [Google Scholar] [CrossRef]
  27. Lara Allende, A.; Stephan, A. Life Cycle Embodied, Operational and Mobility-Related Energy and Greenhouse Gas Emissions Analysis of a Green Development in Melbourne, Australia. Appl. Energy 2022, 305, 117886. [Google Scholar] [CrossRef]
  28. Nam, E.; Jin, T. Mitigating Carbon Emissions by Energy Transition, Energy Efficiency, and Electrification: Difference between Regulation Indicators and Empirical Data. J. Clean. Prod. 2021, 300, 126962. [Google Scholar] [CrossRef]
  29. Zhang, Y.-J.; Sun, Y.-F.; Huang, J. Energy Efficiency, Carbon Emission Performance, and Technology Gaps: Evidence from CDM Project Investment. Energy Policy 2018, 115, 119–130. [Google Scholar] [CrossRef]
  30. Wang, C.; Zhang, Y.-J. Does environmental regulation policy help improve green production performance? Evidence from China’s industry. Corp. Soc. Responsib. Environ. Manag. 2020, 27, 937–951. [Google Scholar] [CrossRef]
  31. Mostafavi, F.; Tahsildoost, M.; Zomorodian, Z. Energy Efficiency and Carbon Emission in High-Rise Buildings: A Review (2005–2020). Build. Environ. 2021, 206, 108329. [Google Scholar] [CrossRef]
  32. Tan, X.; Sun, Q.; Wang, M.; Se Cheong, T.; Yan Shum, W.; Huang, J. Assessing the Effects of Emissions Trading Systems on Energy Consumption and Energy Mix. Appl. Energy 2022, 310, 118583. [Google Scholar] [CrossRef]
  33. Du, Q.; Lu, C.; Zou, P.X.W.; Li, Y.; Li, J.; Cui, X. Estimating Transportation Carbon Efficiency (TCE) across the Belt and Road Initiative Countries: An Integrated Approach of Modified Three-Stage Epsilon-Based Measurement Model. Environ. Impact Assess. Rev. 2021, 90, 106634. [Google Scholar] [CrossRef]
  34. Jijian, Z.; Twum, A.K.; Agyemang, A.O.; Edziah, B.K.; Ayamba, E.C. Empirical Study on the Impact of International Trade and Foreign Direct Investment on Carbon Emission for Belt and Road Countries. Energy Rep. 2021, 7, 7591–7600. [Google Scholar] [CrossRef]
  35. De Oliveira-De Jesus, P.M. Effect of Generation Capacity Factors on Carbon Emission Intensity of Electricity of Latin America & the Caribbean, a Temporal IDA-LMDI Analysis. Renew. Sustain. Energy Rev. 2019, 101, 516–526. [Google Scholar] [CrossRef]
  36. Liu, M.; Zhang, X.; Zhang, M.; Feng, Y.; Liu, Y.; Wen, J.; Liu, L. Influencing Factors of Carbon Emissions in Transportation Industry Based on CD Function and LMDI Decomposition Model: China as an Example. Environ. Impact Assess. Rev. 2021, 90, 106623. [Google Scholar] [CrossRef]
  37. Li, J.; Chen, Y.; Li, Z.; Huang, X. Low-Carbon Economic Development in Central Asia Based on LMDI Decomposition and Comparative Decoupling Analyses. J. Arid Land 2019, 11, 513–524. [Google Scholar] [CrossRef] [Green Version]
  38. Alajmi, R.G. Factors That Impact Greenhouse Gas Emissions in Saudi Arabia: Decomposition Analysis Using LMDI. Energy Policy 2021, 156, 112454. [Google Scholar] [CrossRef]
  39. Gnidchenko, A.A. Structural Transformation and Quality Ladders: Evidence from the New Theil’s Decomposition. Struct. Change Econ. Dyn. 2021, 59, 281–291. [Google Scholar] [CrossRef]
  40. Tian, Q.; Zhao, T.; Yuan, R. An Overview of the Inequality in China’s Carbon Intensity 1997–2016: A Theil Index Decomposition Analysis. Clean Technol. Environ. Policy 2021, 23, 1581–1601. [Google Scholar] [CrossRef]
  41. Yang, B.; Swe, T.; Chen, Y.; Zeng, C.; Shu, H.; Li, X.; Yu, T.; Zhang, X.; Sun, L. Energy Cooperation between Myanmar and China under One Belt One Road: Current State, Challenges and Perspectives. Energy 2021, 215, 119130. [Google Scholar] [CrossRef]
  42. Bompard, E.F.; Corgnati, S.P.; Grosso, D.; Huang, T.; Mietti, G.; Profumo, F. Multidimensional Assessment of the Energy Sustainability and Carbon Pricing Impacts along the Belt and Road Initiative. Renew. Sustain. Energy Rev. 2022, 154, 111741. [Google Scholar] [CrossRef]
  43. Khan, Y.; Bin, Q. The Environmental Kuznets Curve for Carbon Dioxide Emissions and Trade on Belt and Road Initiative Countries: A Spatial Panel Data Approach. Singap. Econ. Rev. 2020, 65, 1099–1126. [Google Scholar] [CrossRef]
  44. Hussain, J.; Zhou, K.; Muhammad, F.; Khan, D.; Khan, A.; Ali, N.; Akhtar, R. Renewable Energy Investment and Governance in Countries along the Belt & Road Initiative: Does Trade Openness Matter? Renew. Energy 2021, 180, 1278–1289. [Google Scholar] [CrossRef]
  45. Liu, J.; Li, S.; Ji, Q. Regional Differences and Driving Factors Analysis of Carbon Emission Intensity from Transport Sector in China. Energy 2021, 224, 120178. [Google Scholar] [CrossRef]
  46. Feng, T.; Gong, X.; Guo, Y.; Yang, Y.; Pan, B.; Li, S.; Dong, J. Electricity Cooperation Strategy between China and ASEAN Countries under ‘The Belt and Road. ’ Energy Strategy Rev. 2020, 30, 100512. [Google Scholar] [CrossRef]
  47. Tao, Y.; Liang, H.; Celia, M.A. Electric Power Development Associated with the Belt and Road Initiative and Its Carbon Emissions Implications. Appl. Energy 2020, 267, 114784. [Google Scholar] [CrossRef]
  48. Gao, P.; Yue, S.; Chen, H. Carbon Emission Efficiency of China’s Industry Sectors: From the Perspective of Embodied Carbon Emissions. J. Clean. Prod. 2021, 283, 124655. [Google Scholar] [CrossRef]
  49. Ding, L.; Yang, Y.; Wang, W.; Calin, A.C. Regional Carbon Emission Efficiency and Its Dynamic Evolution in China: A Novel Cross Efficiency-Malmquist Productivity Index. J. Clean. Prod. 2019, 241, 118260. [Google Scholar] [CrossRef]
  50. Teng, F.; He, J.; Pan, X.; Zhang, C. Metric of Carbon Equity: Carbon Gini Index Based on Historical Cumulative Emission per Capita. Adv. Clim. Change Res. 2011, 2, 134–140. [Google Scholar] [CrossRef]
  51. Semieniuk, G.; Yakovenko, V.M. Historical Evolution of Global Inequality in Carbon Emissions and Footprints versus Redistributive Scenarios. J. Clean. Prod. 2020, 264, 121420. [Google Scholar] [CrossRef] [Green Version]
  52. Sueyoshi, T.; Qu, J.; Li, A.; Liu, X. A New Approach for Evaluating Technology Inequality and Diffusion Barriers: The Concept of Efficiency Gini Coefficient and Its Application in Chinese Provinces. Energy 2021, 235, 121256. [Google Scholar] [CrossRef]
  53. He, W.; Zhang, B. A Comparative Analysis of Chinese Provincial Carbon Dioxide Emissions Allowances Allocation Schemes in 2030: An Egalitarian Perspective. Sci. Total Environ. 2021, 765, 142705. [Google Scholar] [CrossRef] [PubMed]
  54. Liu, W.; Tian, J.; Ou, X. Research on the “Belt and Road” Strategy; The Commercial Press: Beijing, China, 2017; p. 149. [Google Scholar]
  55. Crippa, M.; Guizzardi, D.; Solazzo, E.; Muntean, M.; Schaaf, E.; Monforti-Ferrario, F.; Banja, M.; Olivier, J.G.J.; Grassi, G.; Rossi, S.; et al. GHG Emissions of All World Countries—2021 Report EUR 30831 EN; Publications Office of the European Union: Luxembourg, 2021; ISBN 978-92-76-41547-3. [Google Scholar] [CrossRef]
Figure 1. The technical framework.
Energies 15 01576 g001
Figure 2. The Theil index of carbon emission efficiency differences in BRI countries.
Energies 15 01576 g002
Figure 3. Decomposition of the Theil index between groups.
Energies 15 01576 g003
Figure 4. Decomposition of the carbon emission efficiency between groups in typical sectors. (a) Between Central Asia and West Asia (CA–WA); (b) between West Asia and North Africa and South Asia (WA–SA); (c) between South Asia and East Asia and (SA–EA); (d) between East Asia and Central and Eastern Europe (EA–CE).
Energies 15 01576 g004
Figure 5. Decomposition of the carbon emission efficiency within groups.
Energies 15 01576 g005
Figure 6. Decomposition of the carbon emission efficiency within groups in typical sectors. (a) Typical sectors in which energy efficiency causes more carbon efficiency differences; (b) typical sectors in which energy structure causes more carbon efficiency differences.
Energies 15 01576 g006
Table 1. Typical literature on carbon emission efficiency.
DefinitionCalculated IndicatorLiterature
the effect of carbon emissions generated in economic activitiescarbon dioxide emissions per capita of GDP[9,10,11]
higher economic growth with lower carbon dioxide emissionscarbon dioxide emissions per unit of energy[23]
energy consumption in economic activitiesenergy consumption per unit of GDP[24]
Table 2. Typical literature on energy efficiency.
DefinitionDefinitionLiterature
Broad senseassess the production of the same amount of output with less energy[29,30]
Narrow sensethe GDP per unit of energy consumed[24,28,40]
Table 3. The classification of BRI countries.
GroupsCountries
East Asia (EA)Brunei, Cambodia, East Timor, Indonesia, Laos, Malaysia, Myanmar, Philippines, Singapore, Thailand, Vietnam, Mongolia
South Asia (SA)Bangladesh, Bhutan, India, Maldives, Nepal, Pakistan, Sri Lanka
West Asia and North Africa (WA)Afghanistan, Armenia, Azerbaijan, Bahrain, Egypt, Georgia, Iran, Iraq, Israel, Jordan, Kuwait, Lebanon, Oman, Palestine, Qatar, Saudi Arabia, Syria, Turkey, United Arab Emirates, Yemen
Central and Eastern Europe (CE)Russia, Albania, Belarus, Bosnia and Herzegovina, Bulgaria, Croatia, Czech Republic, Estonia, Hungary, Latvia, Lithuania, Moldova, Montenegro, Northern Macedonia, Poland, Romania, Serbia, Slovakia, Slovenia, Ukraine
Central Asia (CA)Kazakhstan, Kyrgyzstan, Tajikistan, Turkmenistan, Uzbekistan
Table 4. The average and the extremes of carbon emission efficiency in the five groups.
Average ($/ton)Maximum ($/ton)Minimum ($/ton)Ratio of Extreme
CE (0.235)Carbon emission efficiency2020.24016.336.1111.2
Carbon emissions165,806.201,694,992.804713.4359.6
GDP208,259,928.62,005,749,345.11,502,553.801334.9
EA (0.213)Carbon emission efficiency2348.46669487.713.7
Carbon emissions132,685.30489,551.00217,735.402.2
GDP244,120,407.2924,379,410.29,322,927.6099.2
SA (0.104)Carbon emission efficiency2238.236238154.4
Carbon emissions367,173.902,291,677.10841.52723.5
GDP338,903,457.91,867,633,144.71,855,132.401006.7
WA (0.088)Carbon emission efficiency1725.44203.56386.6
Carbon emissions143,937.40624,096.105016.7124.4
GDP197,100,920.3731,848,414.110,086,569.472.6
CA (0.080)Carbon emission efficiency683.91164.13293.5
Carbon emissions91,031.20259,151.105403.948
GDP57,921,854.8194,032,154.76,290,684.7030.8
Publisher’s Note: MDPI stays neutral with regard to jurisdictional claims in published maps and institutional affiliations.

