
Low-Carbon Transformation of Electric System against Power Shortage in China: Policy Optimization


Abstract
:1. Introduction
2. Background of Power Shortage in China
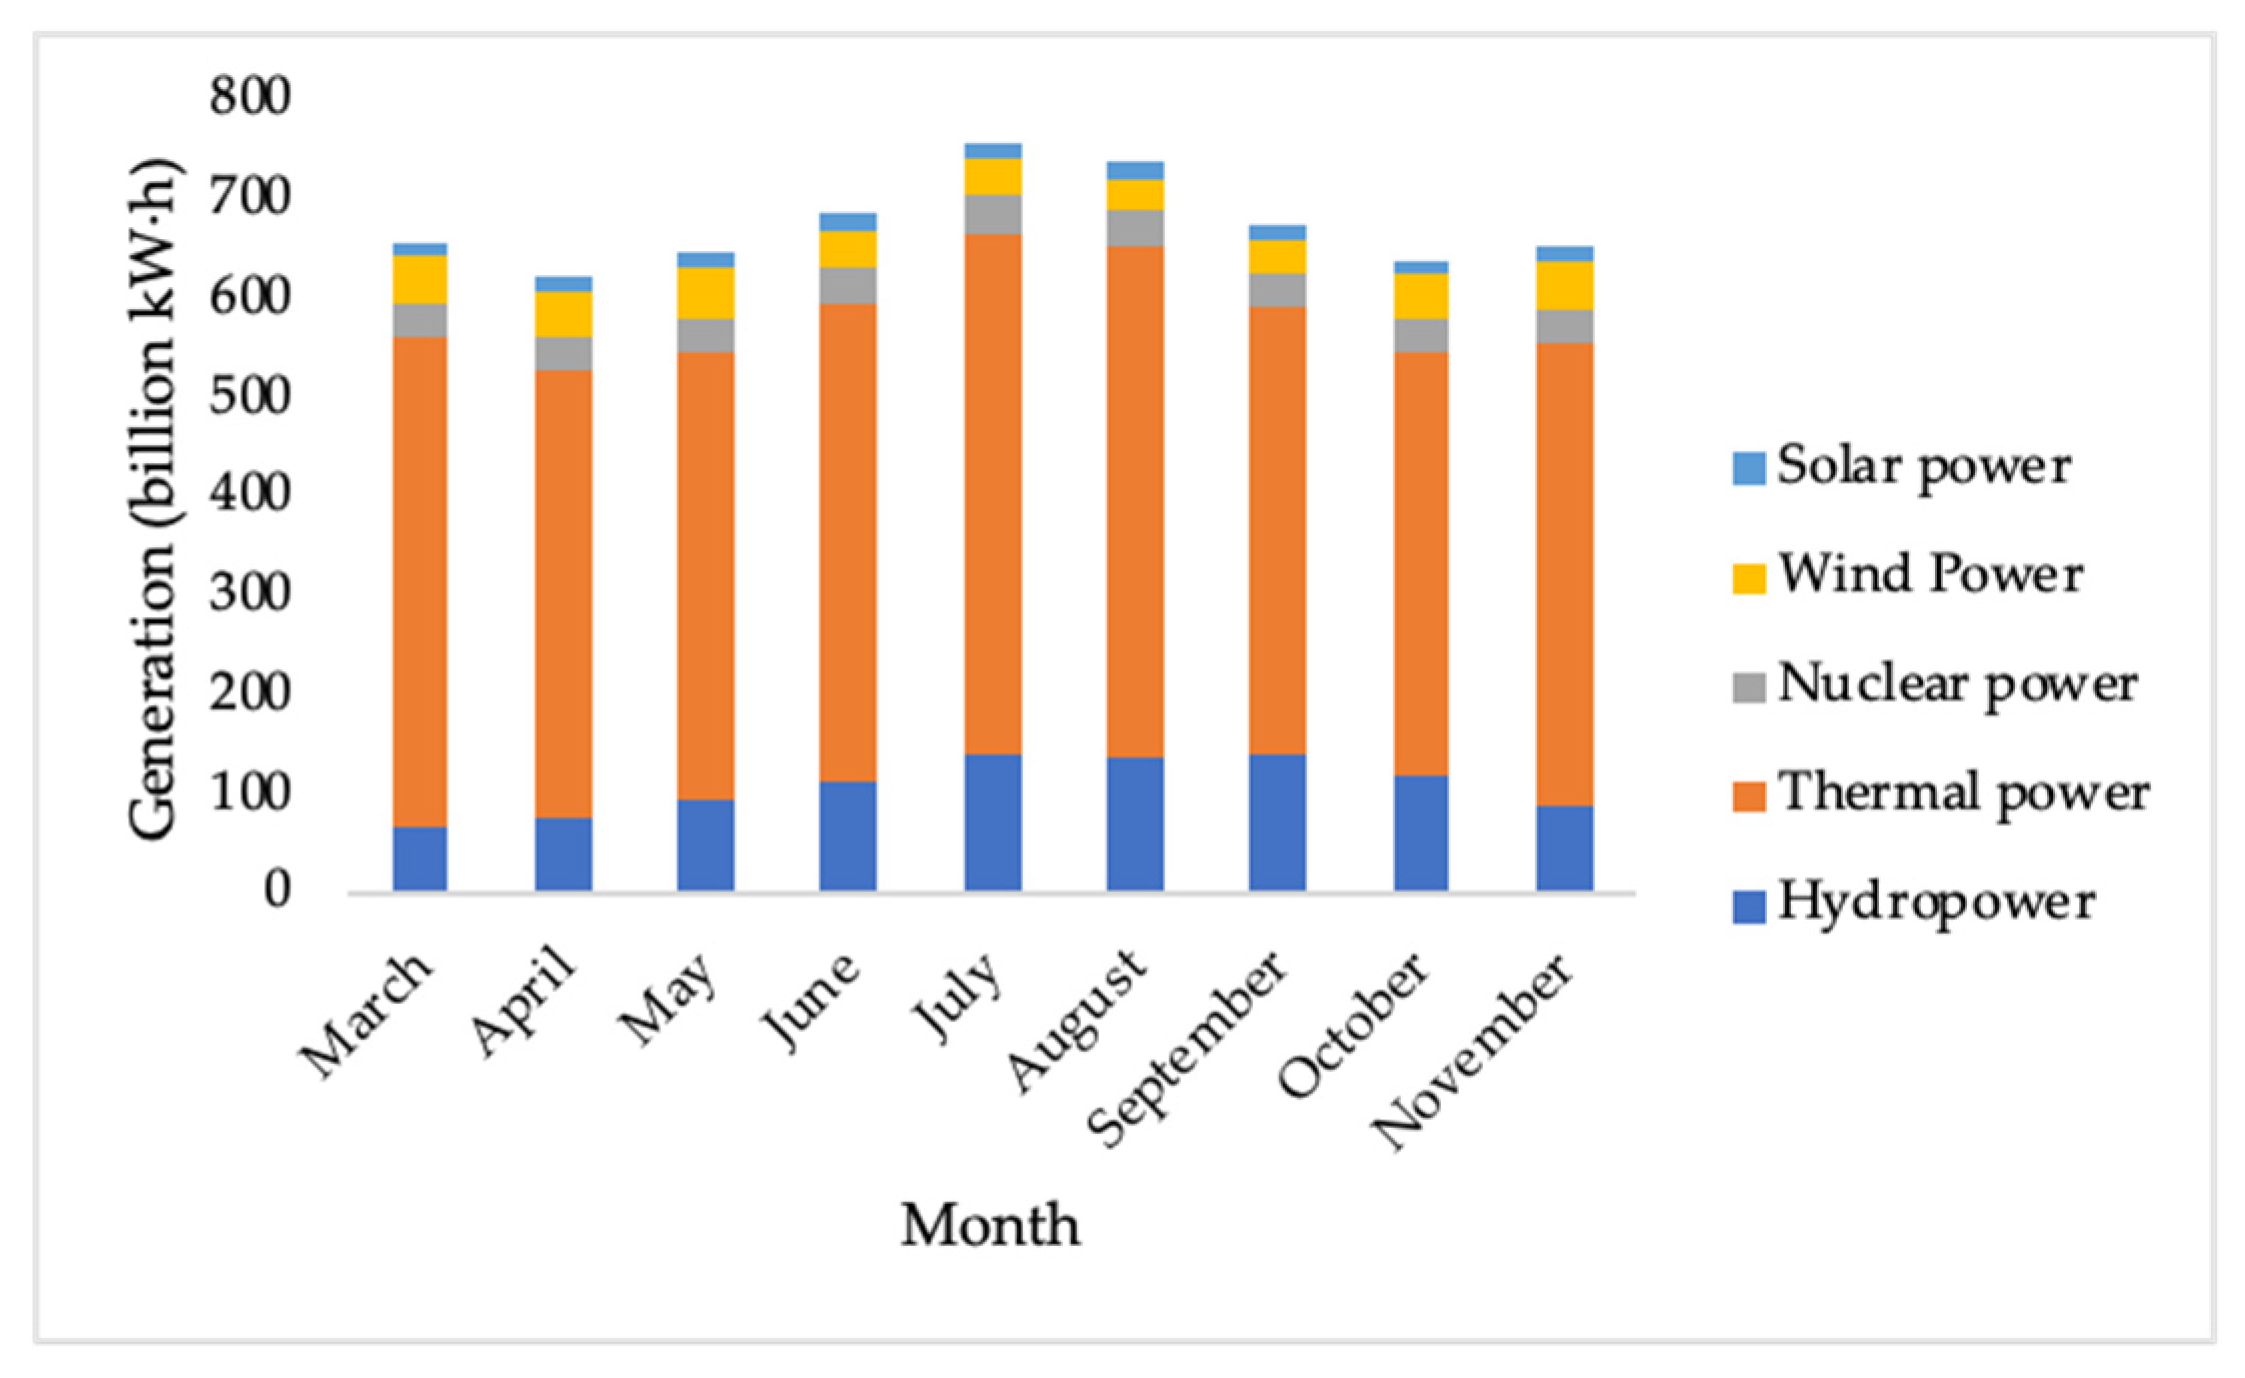
2.1. The Balance between Power Demand and Supply in China in 2021
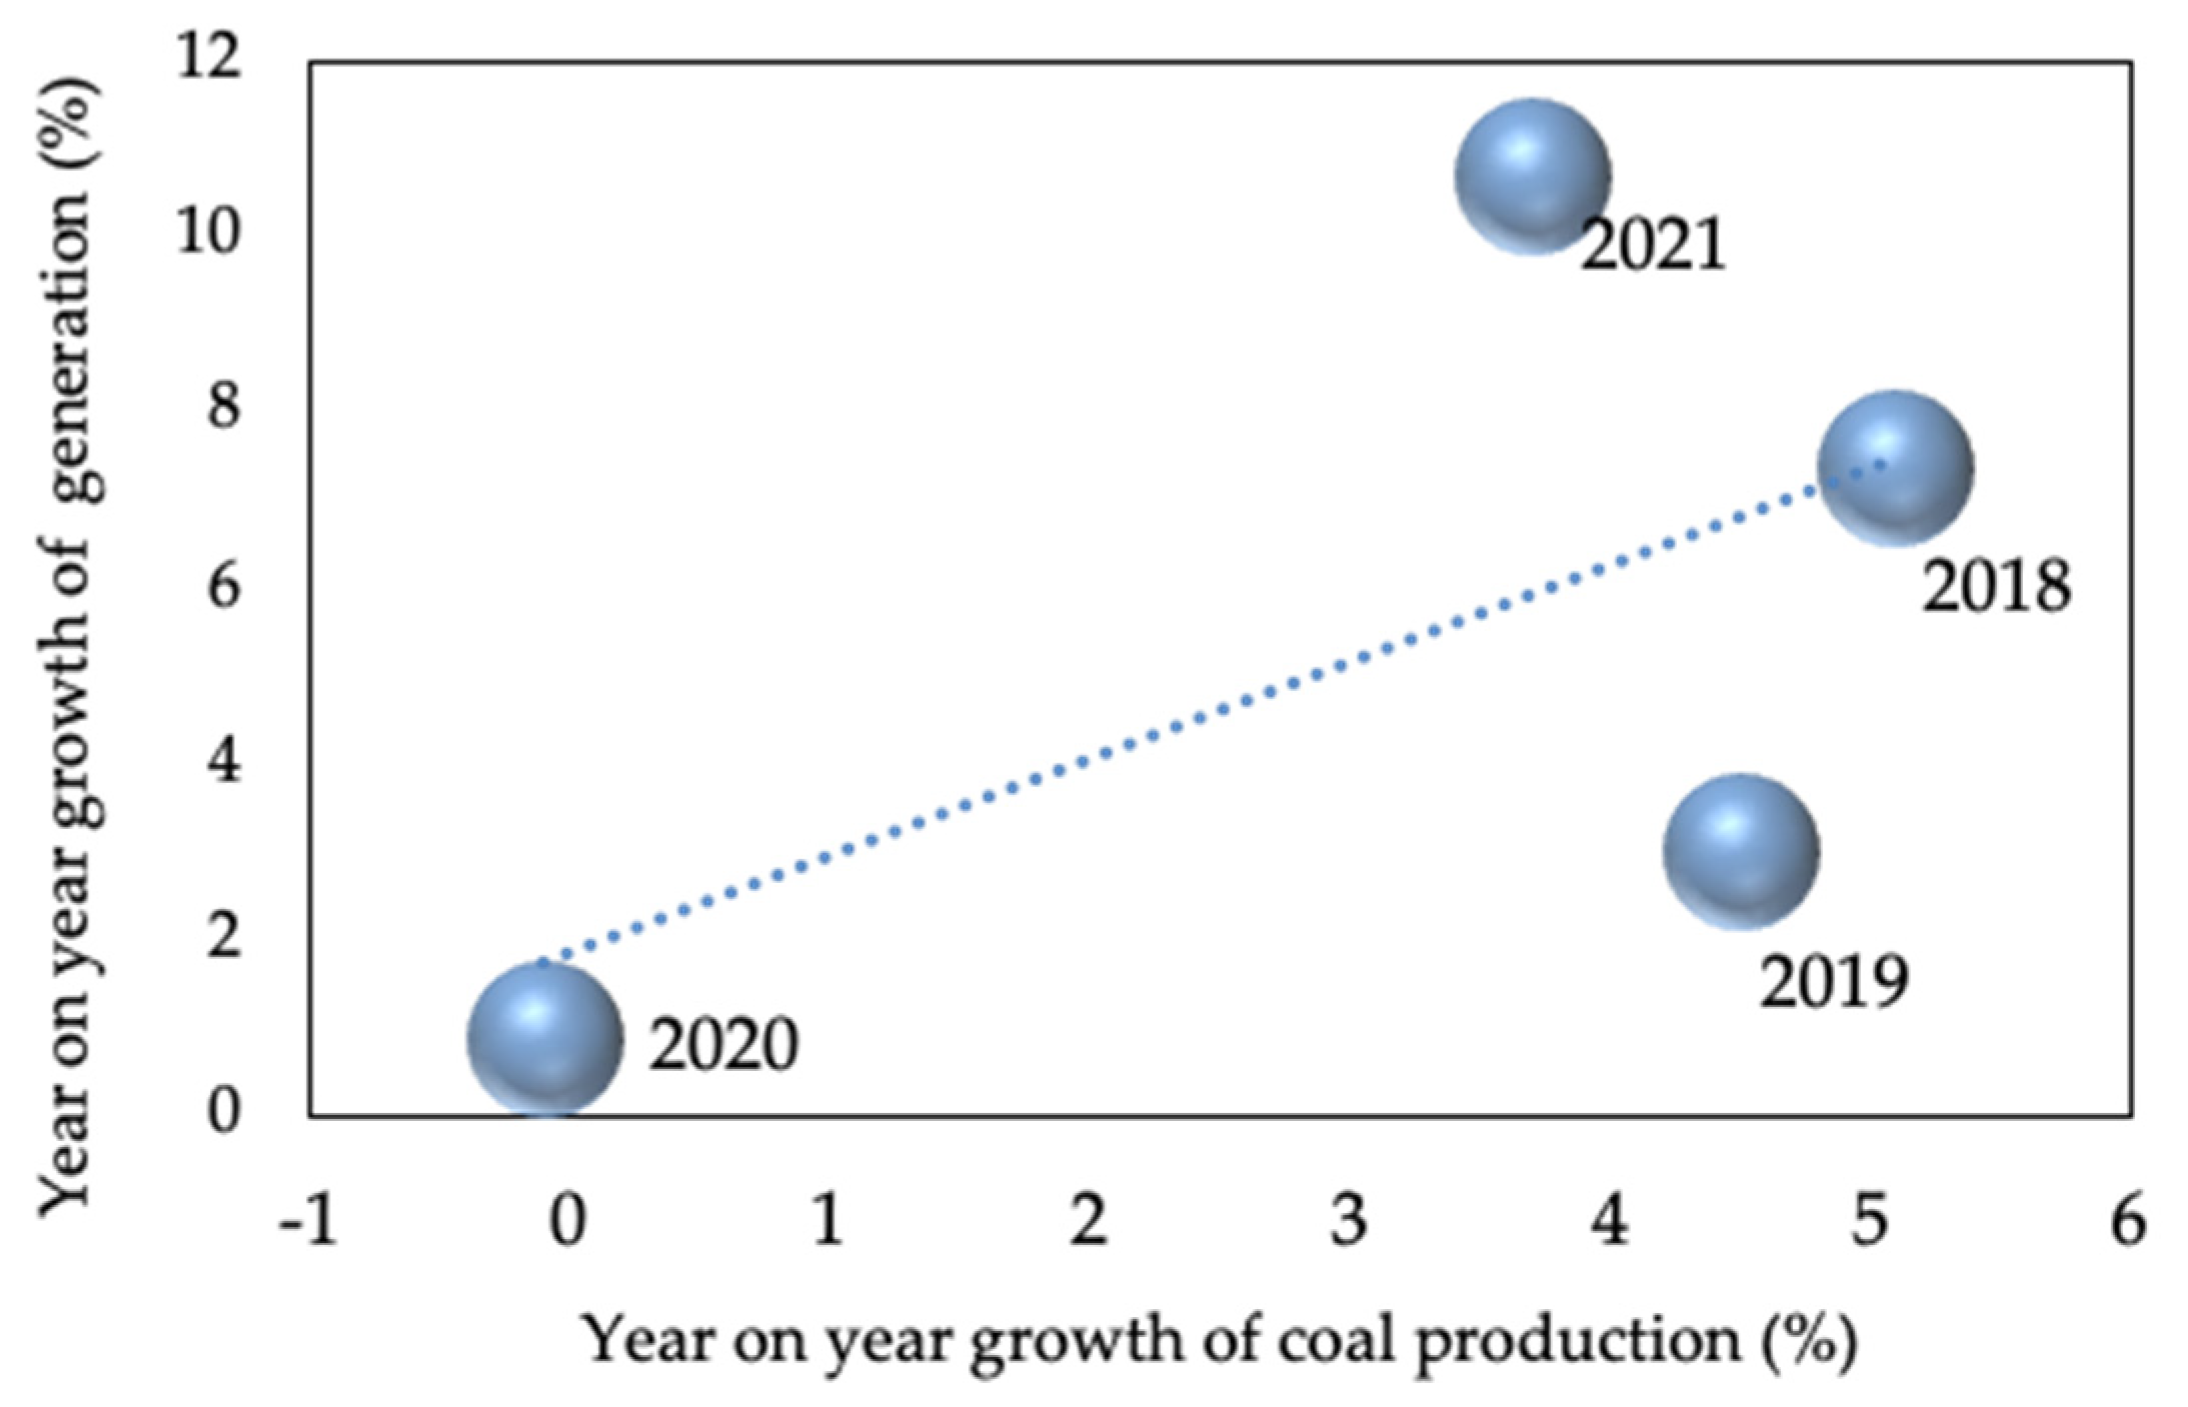
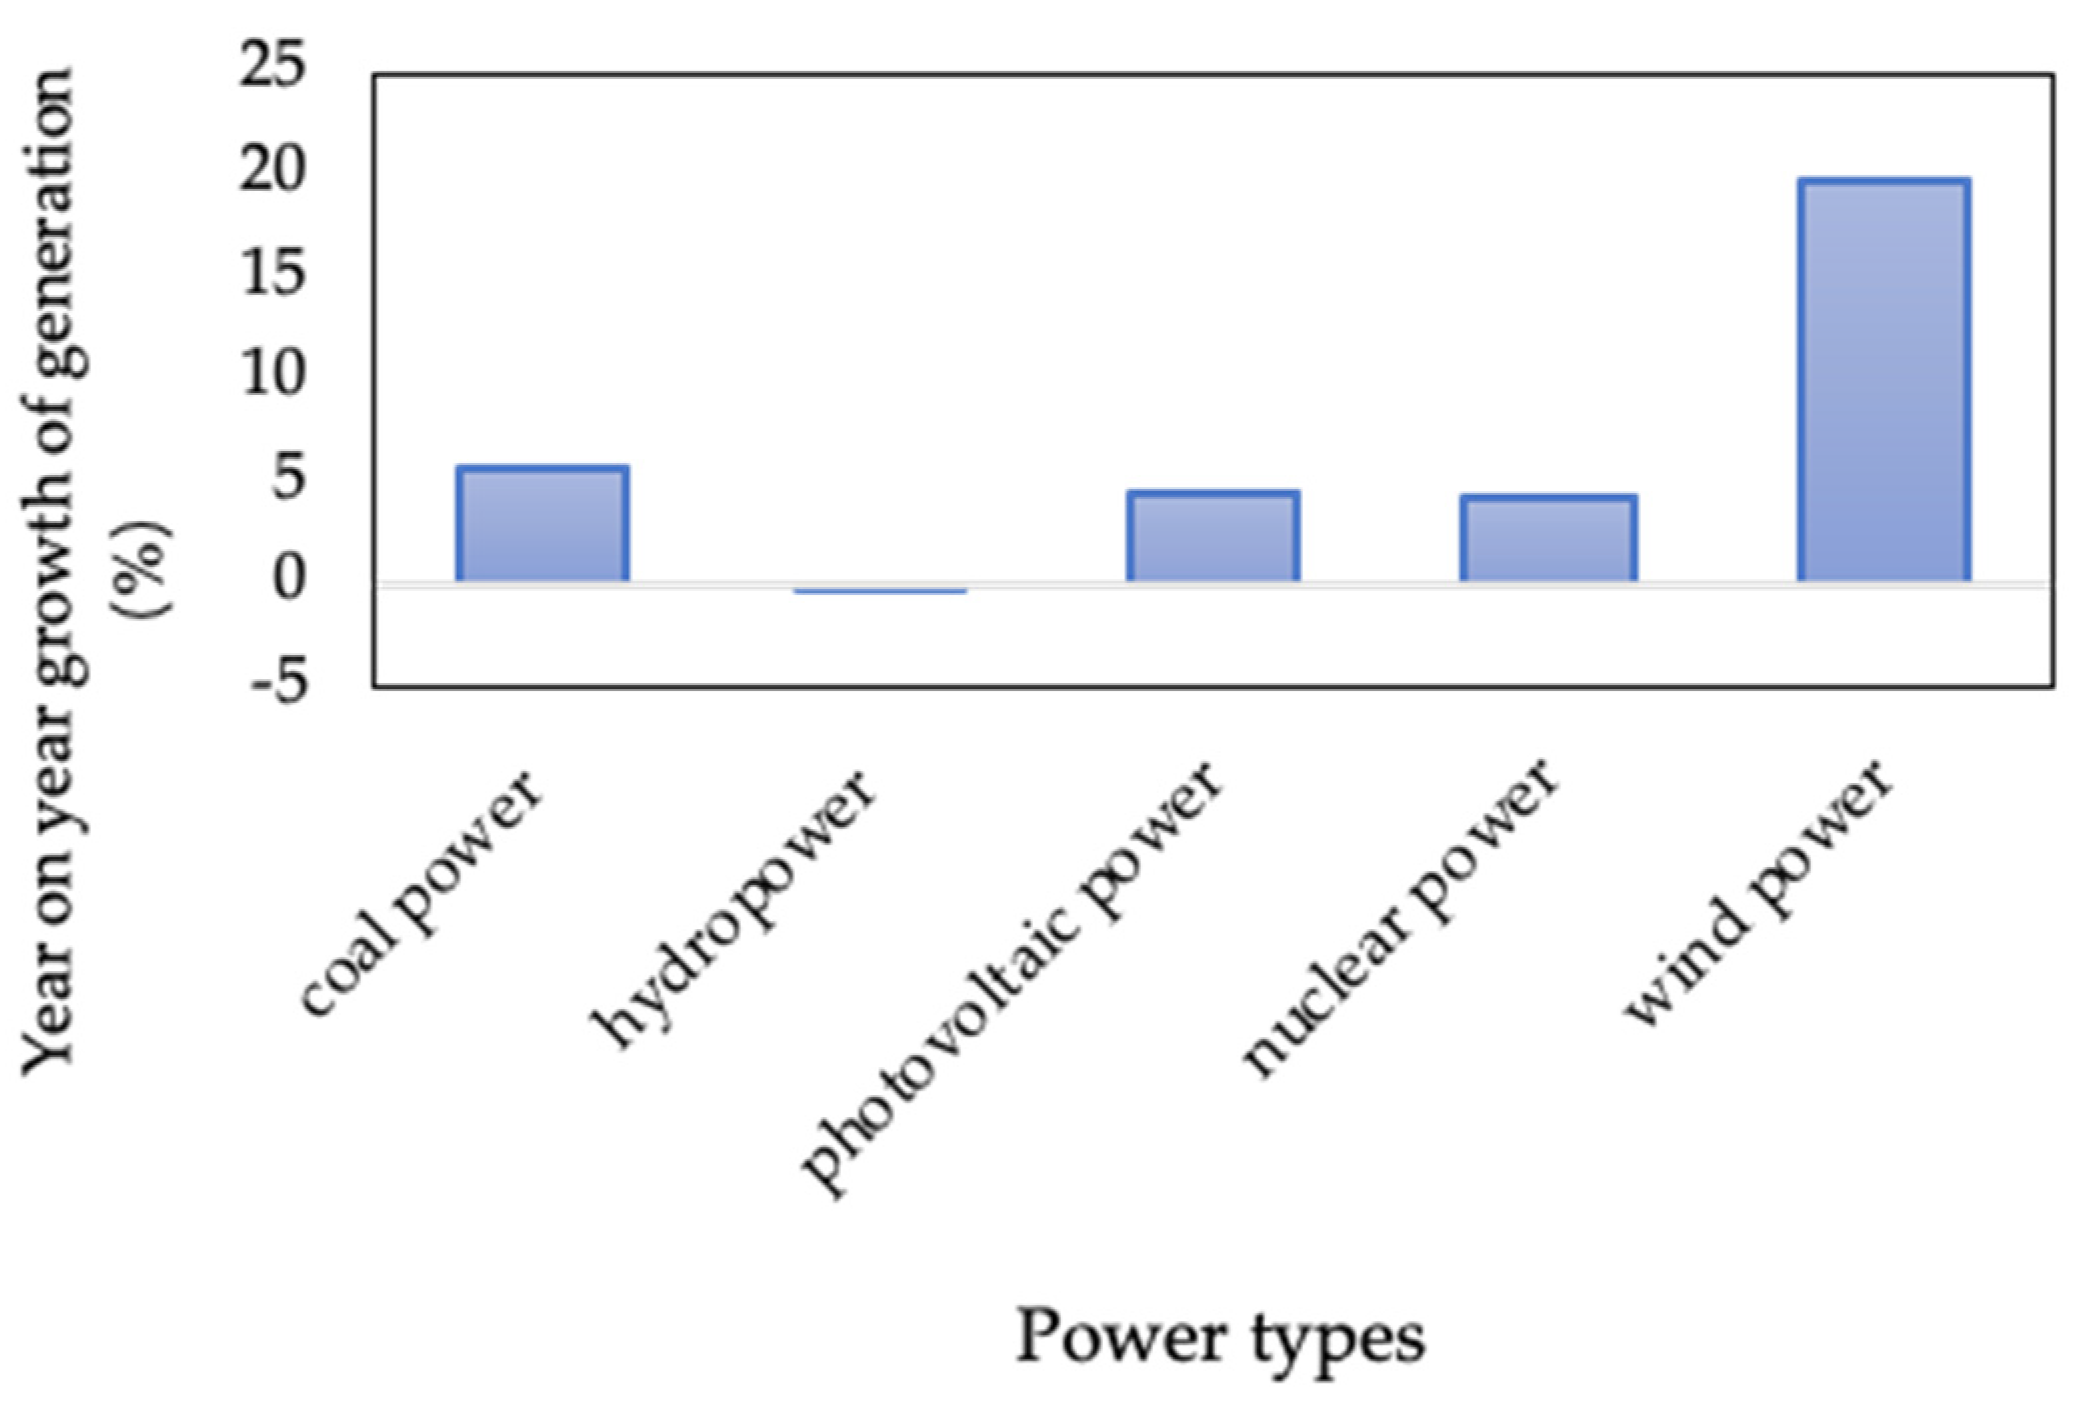
2.2. Driving Factors
3. Methods and Data
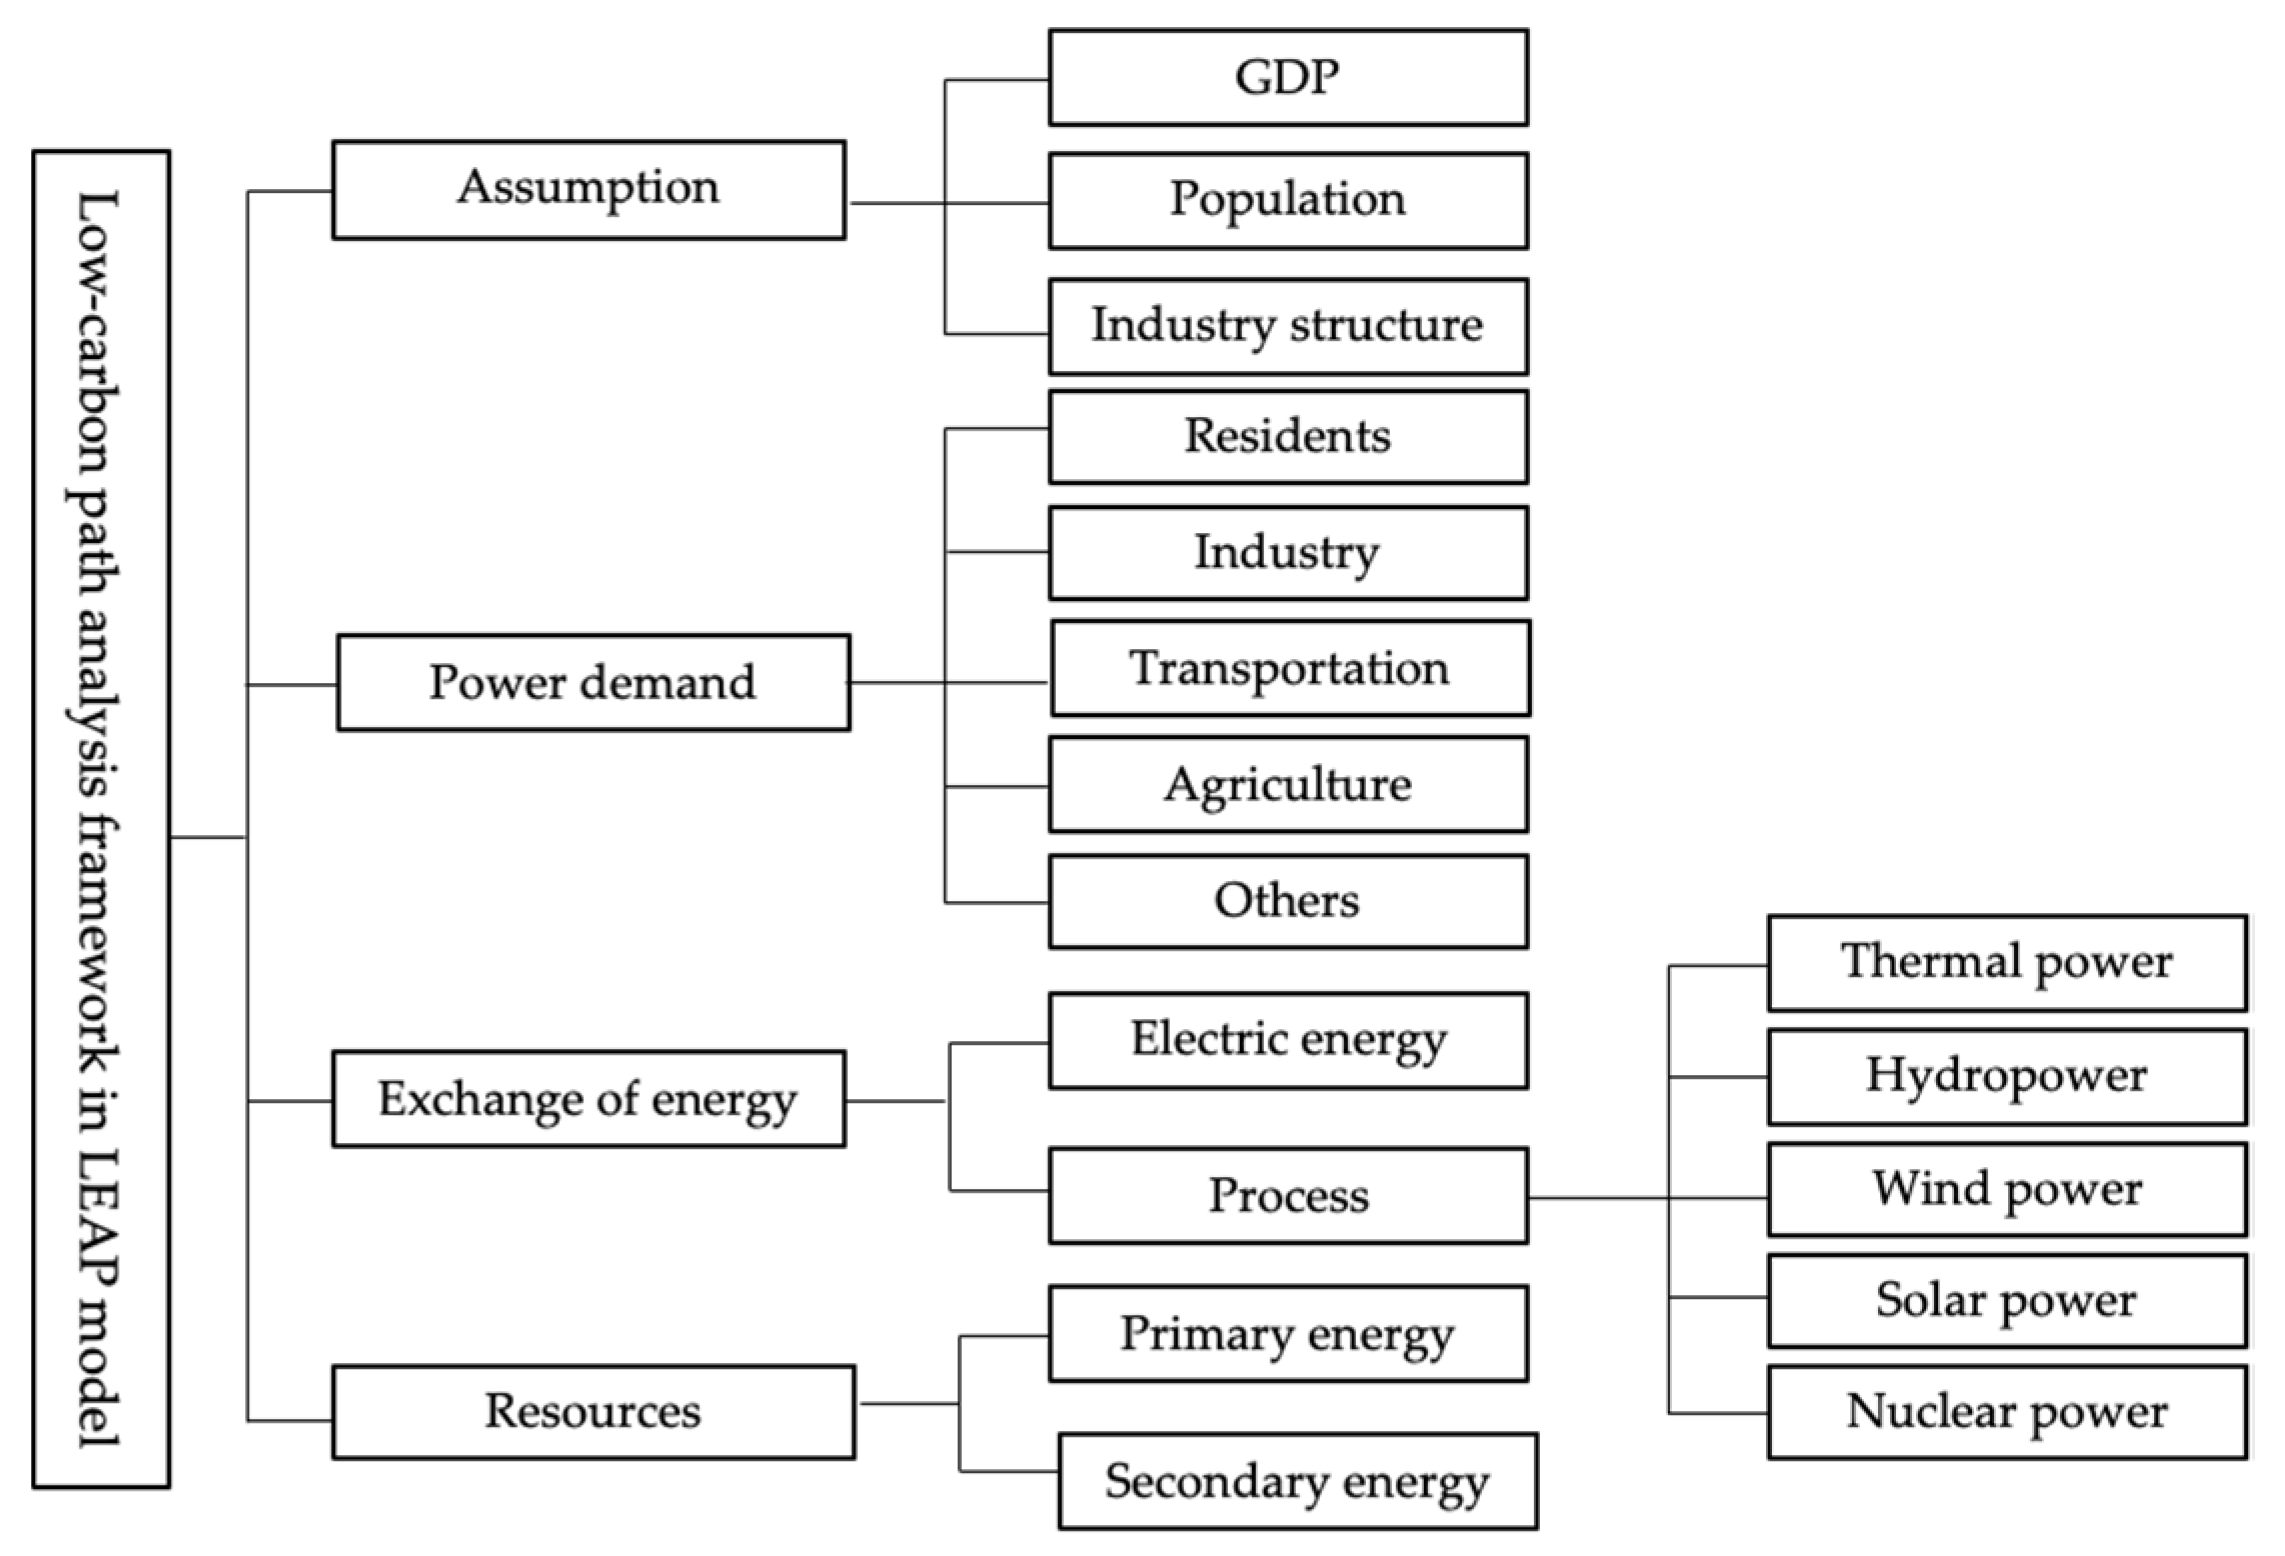
3.1. LEAP Model with Modification
3.2. Key Assumptions and Demand Module Data Setting
- GDP growth rate
- 2.
- Population
3.3. Number of Utilization Hours of Power Generation Equipment by Type
3.4. Scenario Settings
- Normal scenario
- 2.
- Extreme weather scenario
4. Results
4.1. Installed Capacity of Thermal Power under Normal Conditions
4.2. Installed Capacity of Thermal Power under the Condition of Extreme Weather
4.3. Policy Optimization of Low-Carbon Transition of Power System Based on the Power Demand Assurance
5. Discussion
6. Conclusions and Policy Recommendation
- Controlling the total energy consumption and energy intensity led to power shortage in China in 2021. The gap between power demand and supply was from 5.2 billion kW·h–24.6 billion kW·h. In the first three quarters of 2021, China’s power generation grew by 10.7% year-on-year and coal production grew by 3.7% year-on-year, while coal imports grew by −3.6%. The growth rate of imported coal, coal generation and power generation show a big difference.
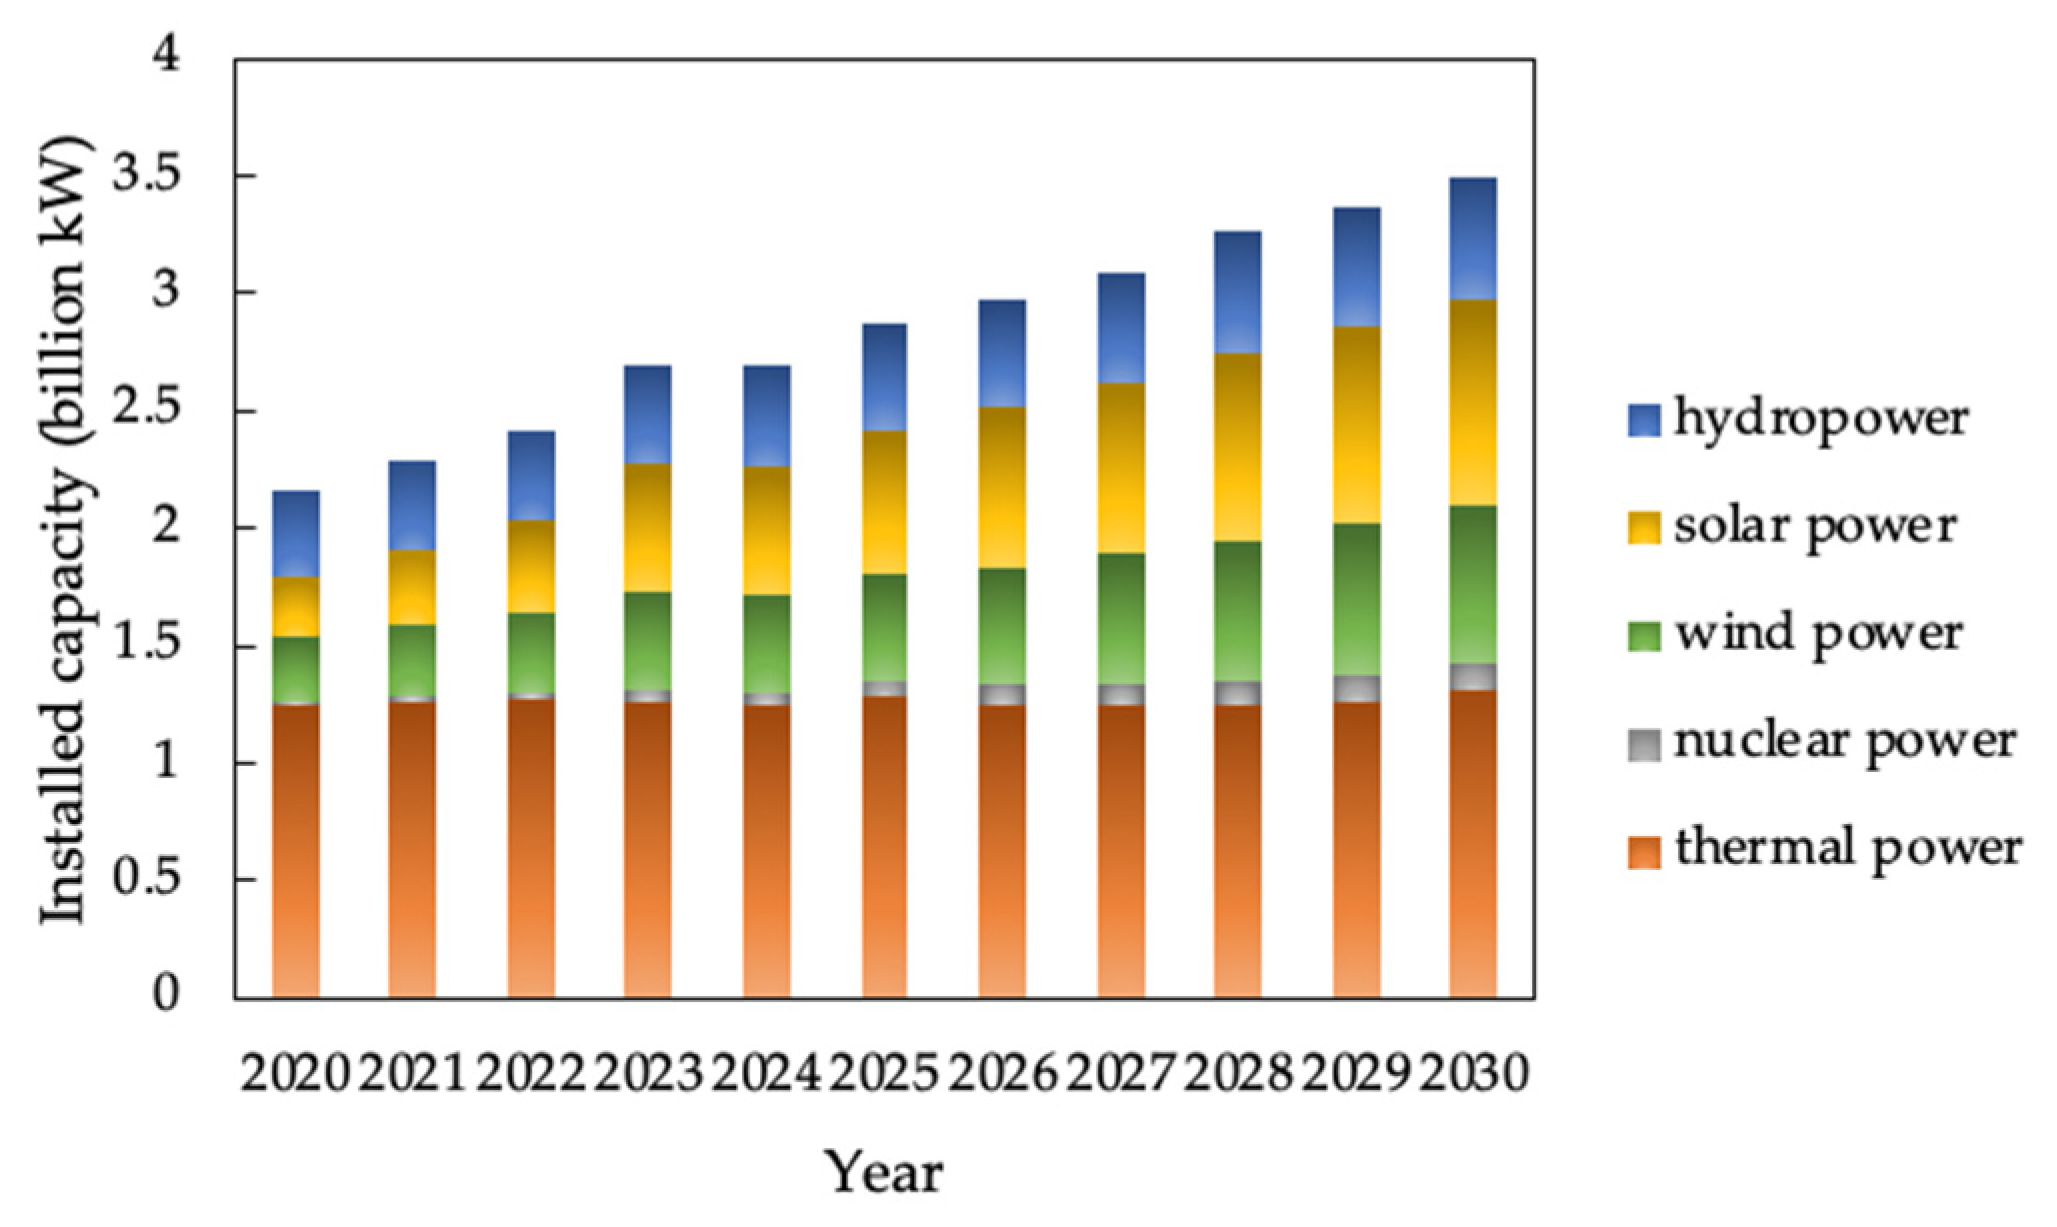
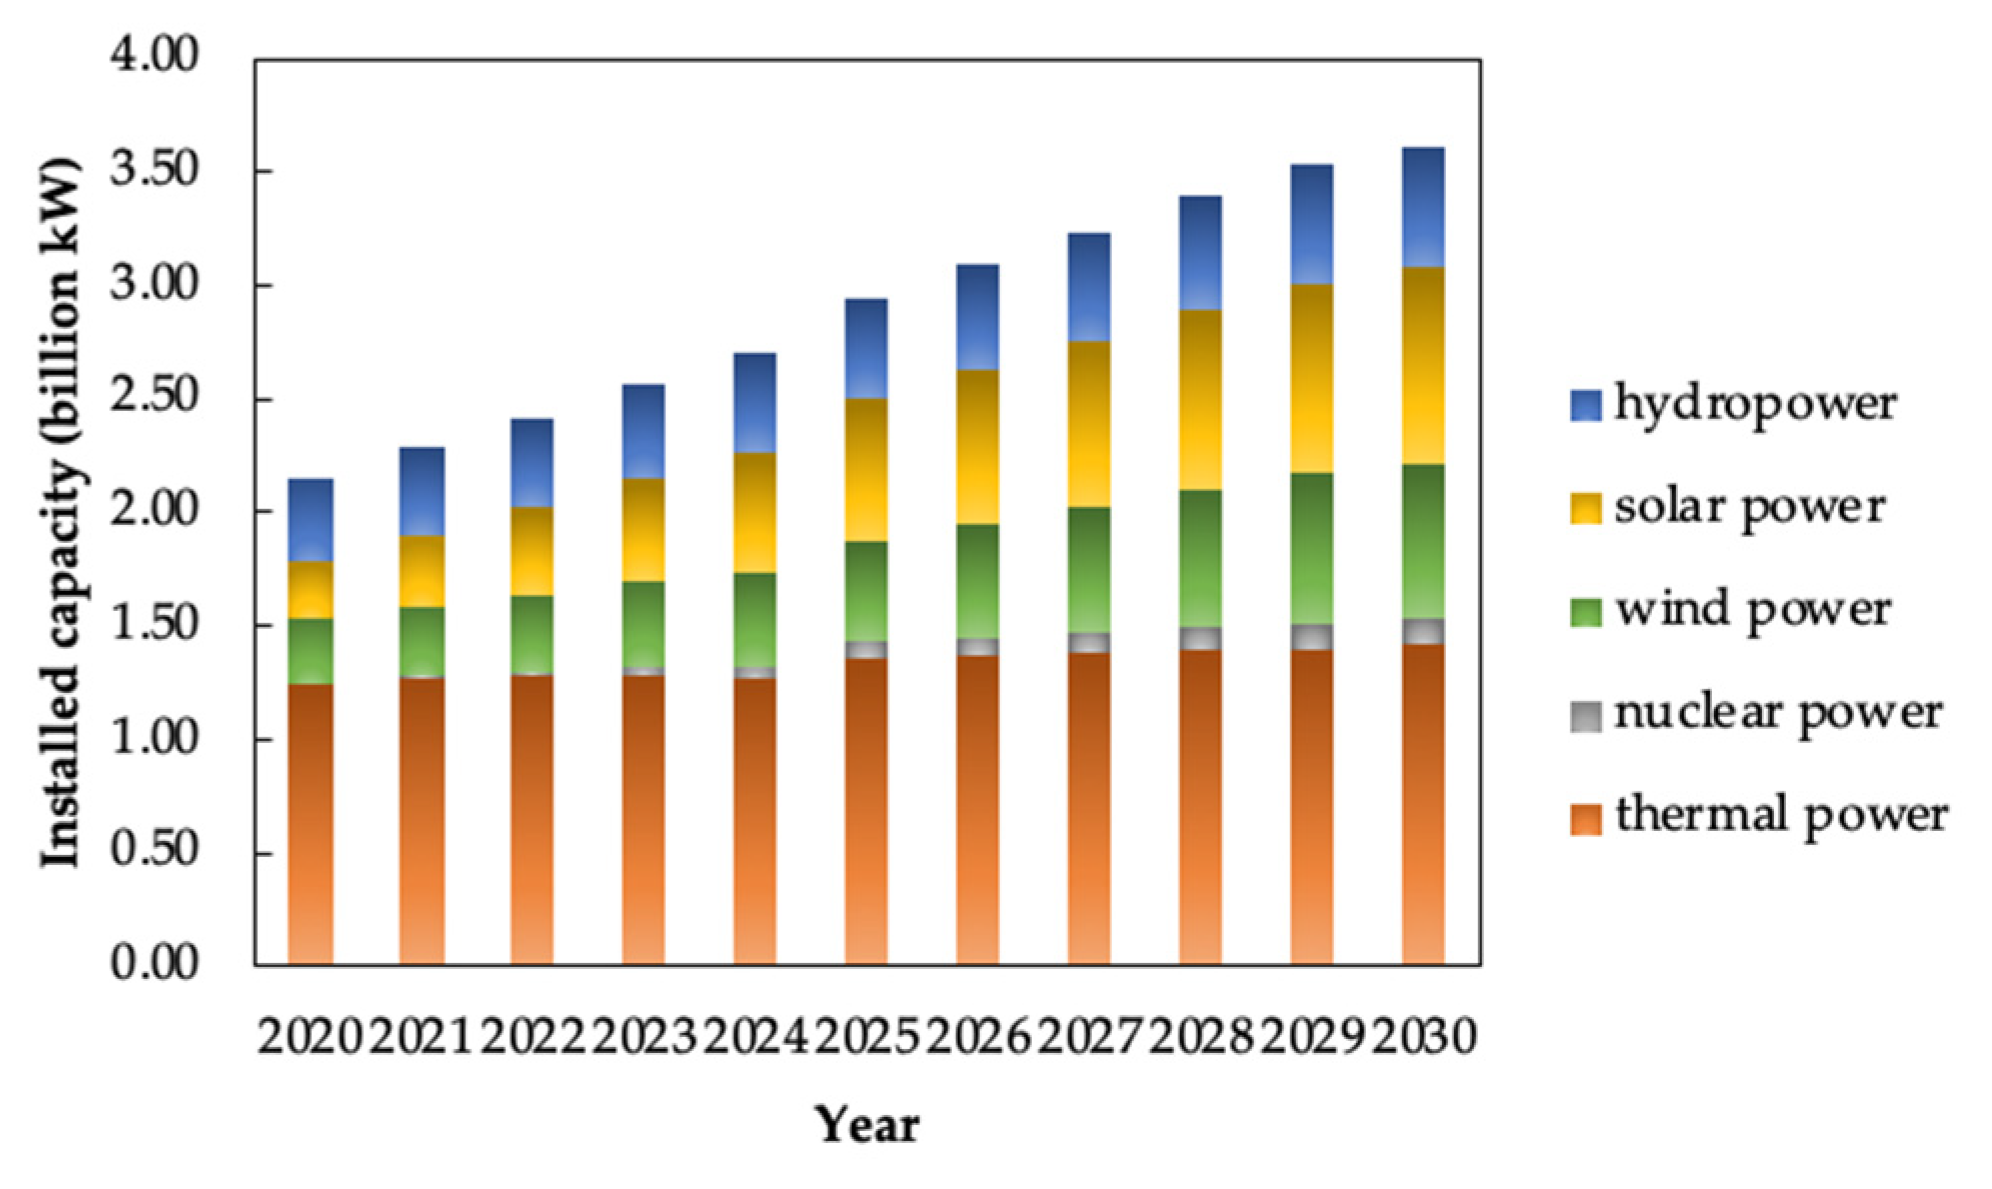
- Generation and installed capacity of thermal power in 2025 and 2030 were predicted in two scenarios. Under normal circumstance, the installed capacity of thermal power would be 1.28 billion kW in 2025 and 1.31 billion kW in 2030. Under the extreme weather circumstance, where the utilization of wind and solar power generation is extremely low, the installed capacity of thermal power would be 1.36 billion kW in 2025 and 1.42 billion kW in 2030.
- Coal power supply must be guaranteed to ensure energy security. It is necessary to balance coal production, supply, stock, and consumption. Since wind power, solar power, and other renewable energy power are unstable and volatile, when the proportion of renewable energy increases to a high ratio in the electric system, the balance between power demand and supply could be broken. Policies should pay more concern for thermal power to avoid power shortage. Under the constraints of the carbon neutrality target, the development of thermal power needs to involve increase in the installed capacity while decreasing generation. Although the installed capacity of thermal power would keep increasing, the generating capacity could be controlled.
- Energy consumption should be further reduced with progress in technology, and energy efficiency should be improved. The application of carbon dioxide capture, utilization and storage (CCUS) technology is currently at an exploratory stage. Energy consumption reduction requires national policy support, such as carbon pricing mechanisms or other forms of subsidy.
- China needs to pursue the development of diversified energy sources and enhanced power supply security capability while strengthening the development and utilization of renewable energy. For renewable energy, the accommodation and storage capacity need to be enhanced. China should follow a more stable pathway with a gradually increasing proportion of renewable energy, and promotion of the large-scale, high proportion, market-based and high-quality development of renewable energy.
- Continuous improvement in the energy emergency management coordination system is needed, with respect to emergency support measures, such as the construction of the national energy reserve base, and improved emergency plans to deal with large-scale power emergencies.
Author Contributions
Funding
Institutional Review Board Statement
Informed Consent Statement
Data Availability Statement
Acknowledgments
Conflicts of Interest
References
- Power Rationing. Available online: https://news.cctv.com/2021/09/29/ARTIUF1TOyuNwWF60opfIqbM210929.shtml (accessed on 29 September 2021).
- He, J.K. China’s INDC and non-fossil energy development. Adv. Clim. Chang. Res. 2015, 6, 210–215. [Google Scholar] [CrossRef]
- Gallagher, K.S.; Zhang, F.; Orvis, R.; Rissman, J.; Liu, Q. Assessing the Policy gaps for achieving China’s climate targets in the Paris Agreement. Nat. Commun. 2019, 10, 1256. [Google Scholar] [CrossRef] [PubMed] [Green Version]
- Soest, H.; Elzen, M.; Vuuren, D. Net-zero emission targets for major emitting countries consistent with the Paris Agreement. Nat. Commun. 2021, 12, 2140. [Google Scholar] [CrossRef]
- Hoag, H. Low-carbon electricity for 2030. Nat. Clim. Chang. 2011, 1, 233–235. [Google Scholar] [CrossRef]
- Zou, C.; Xiong, B.; Xue, H.; Zheng, D.W.; Ge, Z.X.; Wang, Y.; Jiang, L.Y.; Pan, S.Q.; Wu, S.T. The role of new energy in carbon neutral. Pet. Explor. Dev. 2021, 48, 480–491. [Google Scholar] [CrossRef]
- Deangelo, J.; Azevedo, I.; Bistline, J.; Clarke, L.; Luderer, G.; Byers, E.; Davis, S.J. Energy systems in scenarios at net-zero CO2 emissions. Nat Commun. 2021, 12, 6096. [Google Scholar] [CrossRef]
- Arbabzadeh, M.; Sioshansi, R.; Johnson, J.X.; Keoleian, G.A. The role of energy storage in deep decarbonization of electricity production. Nat Commun. 2019, 10, 1. [Google Scholar] [CrossRef] [Green Version]
- Cherp, A.; Vinichenko, V.; Tosun, J.; Gordon, J.A.; Jewell, J. National growth dynamics of wind and solar power compared to the growth required for global climate targets. Nat. Energy 2021, 6, 742–754. [Google Scholar] [CrossRef]
- Grubert, E. Fossil electricity retirement deadlines for a just transition. Science 2020, 370, 1171–1173. [Google Scholar] [CrossRef]
- Drechsler, M.; Egerer, J.; Lange, M.; Masurowski, F.; Meyerhoff, J.; Oehlmann, M. Efficient and equitable spatial allocation of renewable power plants at the country scale. Nat. Energy 2017, 6, 17124. [Google Scholar] [CrossRef]
- Sixth Energy Plan in Japan. Available online: https://baijiahao.baidu.com/s?id=1714329320132461177&wfr=spider&for=pc (accessed on 22 October 2021).
- Fang, K.; Tang, Y.Q.; Zhang, Q.F.; Song, J.N.; Wen, Q.; Sun, H.P.; Ji, C.Y.; Xu, A.Q. Will China peak its energy-related carbon emissions by 2030? Lessons from 30 Chinese provinces. Appl. Energy 2019, 255, 113852. [Google Scholar] [CrossRef]
- Tong, D.; Farnham, D.J.; Duan, L.; Zhang, Q.; Lewis, N.S.; Caldeora, K.; Davis, S.J. Geophysical constraints on the reliability of solar and wind power worldwide. Nat. Commun. 2021, 12, 6146. [Google Scholar] [CrossRef] [PubMed]
- Veers, P.; Dykes, K.; Lantz, E.; Barth, S.; Bottasso, C.L.; Carlson, O.; Clifton, A.; Green, J.; Green, P.; Holttinen, H.; et al. Grand challenges in the science of wind energy. Science 2019, 366, 443. [Google Scholar] [CrossRef] [PubMed] [Green Version]
- Wang, Z.; Zhu, Y.; Zhu, Y.; Shi, Y. Energy structure change and carbon emission trends in China. Energy 2016, 115, 369–377. [Google Scholar] [CrossRef]
- Wu, J.; Wang, Z.; Zhu, Q.T.; Gong, Y. Forecast on china’s energy consumption and carbon emissions driven by micro innovation. Complex Syst. Complex. Sci. 2016, 13, 68–79. [Google Scholar]
- Xu, G.; Schwarz, P.; Yang, H. Adjusting energy consumption structure to achieve China’s CO2 emissions peak. Renew. Sustain. Energy Rev. 2020, 122, 109737. [Google Scholar] [CrossRef]
- Cui, R.Y.; Hultman, N.; Cui, D.Y.; McJeon, H.; Yu, S.; Edwards, M.R.; Sen, A.; Song, K.H.; Bowman, C.; Clarke, L.; et al. A plant-by-plant strategy for high-ambition coal power phaseout in China. Nat. Commun. 2021, 12, 1. [Google Scholar] [CrossRef] [PubMed]
- Zeng, M.; Song, X.; Li, L.Y.; Wang, Y.J.; Yang, W.; Li, Y. China’s large-scale power shortages of 2004 and 2011 after the electricity market reforms of 2002: Explanations and differences. Energy Policy 2013, 61, 610–618. [Google Scholar]
- Ou, P.; Huang, R.T.; Yao, X. Economic Impacts of Power Shortage. Sustainability 2016, 8, 687. [Google Scholar] [CrossRef] [Green Version]
- Thomson, E. Power Shortages in China: Why? China Int. J. 2011, 3, 1. [Google Scholar]
- Shi, X.P.; Sun, Y.P.; Shen, Y.F. China’s ambitious energy transition plans. Science 2021, 373, 170. [Google Scholar] [CrossRef] [PubMed]
- Michal, M.; Philip, A.S. China’s power crisis: Long-term goals meet short-term realities. Oies Energy Comment 2021, 39, 1330–1337. [Google Scholar]
- Wu, J. From the formation mechanism of power shortage to analyze the long-term treatment of energy security. China Power Enterp. Manag. 2021, 28, 16–23. [Google Scholar]
- Motlagh, S.S.; Panahi, M.; Hemmasi, A.H.; Ghoddousi, J.; Kani, A.R.H.M. A techno-economic and environmental assessment of low-carbon development policies in Iran’s thermal power generation sector. Int. J. Environ. Sci. Technol. 2021, 1–16. [Google Scholar] [CrossRef]
- Mirjat, N.H.; Uqaili, M.A.; Harijan, K.; Walasai, G.D.; Mondal, M.A.H.; Sahin, H. Long-Term Electricity Demand Forecast and Supply Side Scenarios for Pakistan (2015–2050): A LEAP Model Application for Policy Analysis. Energy 2018, 165, 512–526. [Google Scholar] [CrossRef]
- Luis, R.G.; David, B.; Luis, F.M.; Robert, V.C. Long-Term Electricity Supply and Demand Forecast (2018–2040): A LEAP Model Application towards a Sustainable Power Generation System in Ecuador. Sustainability 2019, 11, 5316. [Google Scholar]
- Windarta, J.; Purwanggono, B.; Hidayanto, F.; Purwanggono, B.; Fudholi, D.H. Application of LEAP model on long-term electricity demand forecasting in Indonesia, period 2010–2025. In Proceedings of the SHS Web of Conferences, Gdańsk, Poland, 18–20 September 2018; p. 49. [Google Scholar] [CrossRef] [Green Version]
- Chen, R.; Rao, Z.H.; Liu, J.X.; Chen, Y.Y.; Liao, S.M. Prediction of energy demand and policy analysis of Changsha based on LEAP Model. Resour. Sci. 2017, 39, 482–489. [Google Scholar]
- Guang, F.T. Multi-Dimensional Analysis of the Characteristics and Demand Prediction of China’s Electricity Consumption; North China Electric Power University: Baoding, China, 2020. [Google Scholar]
- Ma, X.M.; Duan, Y.; Zhou, J.P.; Ji, J.P. Research on the Carbon Mitigation Path of Power Sector in Shenzhen. Ecol. Econ. 2018, 34, 24–29. [Google Scholar]
- Huang, J. Scenario analysis of Chinese power demands and uncertainty assessment based on the LEAP Model. Resour. Sci. 2012, 34, 2124–2132. [Google Scholar]
- Emergency Warning Notice on Orderly Power Use. Available online: http://fgw.rizhao.gov.cn (accessed on 1 September 2021).
- State Grid Jilinsheng Power Supply Company. Available online: https://www.bjnews.com.cn/detail/163264136514232.html (accessed on 23 September 2021).
- Emergency Notice on Orderly Power Utilization. Available online: https://baijiahao.baidu.com/s?id=1711670018296440938&wfr=spider&for=pc (accessed on 23 September 2021).
- Reasons for Power Rationing in Northeast China. Available online: https://www.thepaper.cn/newsDetail_forward_14688865 (accessed on 27 September 2021).
- Power Shortage in 2021. Available online: https://shoudian.bjx.com.cn/html/20211125/1190068.shtml (accessed on 25 November 2021).
- Great Changes in China’s Energy in the Throes of “Power Shortage”. Available online: https://shupeidian.bjx.com.cn/html/20211229/1196403.shtml (accessed on 29 December 2021).
- Opinions on Fully, Accurately and Comprehensively Implementing the New Development Philosophy to Achieve Carbon Peak and Carbon Neutrality. Available online: http://www.gov.cn/xinwen/2021-10/25/content_5644687.htm (accessed on 25 October 2021).
- Li, M.J.; Chen, G.P.; Dong, C.; Liang, Z.F.; Wang, W.S.; Fan, G.F. Research on Power Balance of High Proportion Renewable Energy System. Power Syst. Technol. 2019, 43, 3979–3986. [Google Scholar]
- Xie, X.R.; He, Z.B.; Mao, H.Y.; Li, H.Z. New issues and classification of power system stability with high shares of renewables and power electronics. Proc. CSEE 2021, 41, 461–475. [Google Scholar]
- Li, Q.H.; Wang, C.X. Study on the Major Issues of Renewable Energy Development. Electr. Power 2015, 48, 33–36. [Google Scholar]
- Nema, P.; Nema, R.K.; Rangnekar, S. A current and future state of art development of hybrid energy system using wind and PV-solar: A review. Renew. Sustain. Energy Rev. 2009, 13, 2096–2103. [Google Scholar] [CrossRef]
- Khare, V.; Nema, S.; Baredar, P. Solar–wind hybrid renewable energy system: A review. Renew. Sustain. Energy Rev. 2006, 58, 23–33. [Google Scholar] [CrossRef]
- Xie, S.; Jia, Y.L.; Bai, X.T.; Zhang, Z.H.; Wang, S.Y.; Zheng, X.Y.; Zhao, Y.R. A Review of Tools for Urban Energy Systems Planning and Energy Consumption Analysis. J. Glob. Energy Interconnect 2021, 4, 163–177. [Google Scholar]
- LEAP. User Guide of Long Range Energy Alternative Planning System; Stockholm Environment Institute: Boston, MA, USA, 2011. [Google Scholar]
- Rahman, M.M.; Paatero, J.V.; Lahdelma, R.; Wahid, M.A. Multicriteria-based decision aiding technique for assessing energy policy elements-demonstration to a case in Bangladesh. Appl. Energy 2016, 164, 237–244. [Google Scholar] [CrossRef]
- Perwez, U.; Sohail, A.; Hassan, S.F.; Zia, U. The long-term forecast of Pakistan’s electricity supply and demand: An application of long range energy alternatives planning. Energy 2015, 93, 2423–2435. [Google Scholar] [CrossRef]
- China’s Economy Growth Would Be 5.5% by 2022. Available online: https://baijiahao.baidu.com/s?id=1722273833748214779&wfr=spider&for=pc (accessed on 18 January 2022).
- Chinese Academy of Social Sciences. Economic Blue Book: Analysis and Forecast of China’s Economic Development in 2022; Chinese Academy of Social Sciences: Beijing, China, 2021. [Google Scholar]
- Chinese Academy of Social Sciences. Green Paper on Population and Labor: No.19 Report on China’s Population and Labor Issues; Chinese Academy of Social Sciences: Beijing, China, 2019. [Google Scholar]
- Chinese Academy of Social Sciences. Green Paper on Population and Labor: No.22 Report on China’s Population and Labor Issues; Chinese Academy of Social Sciences: Beijing, China, 2022. [Google Scholar]
- National Energy Administration. Notice on the Monitoring and Evaluation Results of National Renewable Energy Power Development in 2020; National Energy Administration: Beijing, China, 2021.
- Yan, R.; Masood, N.A.; Saha TK Bai, F.F.; Gu, H.J. The anatomy of the 2016 South Australia blackout:a catastrophic event in a high renewable network. IEEE Trans. Power Syst. 2018, 33, 5374–5388. [Google Scholar] [CrossRef]
- Wang, W.S.; Lin, W.F.; He, G.Q.; Shi, W.H.; Feng, S.L. Enlightenment of 2021 Texas blackout to the renewable energy development in China. Proc. CSEE 2021, 41, 4033–4042. [Google Scholar]
- Peter, B.; Alan, T.; Gilbert, B. The quiet revolution of numerical weather prediction. Nature 2015, 525, 47–55. [Google Scholar]
- Zhang, Y.Z.; Zhang, N.; Dai, H.C.; Zhang, S.Y.; Wu, X.Y.; Xue, M.M. Model Construction and Pathways of Low-Carbon Transition of China’s Power System. Electr. Power 2021, 54, 1–11. [Google Scholar]
- Shu, Y.B.; Zhang, L.Y.; Zhang, Y.Z.; Wang, Y.H.; Lu, G.; Yuan, B.; Xia, P. Carbon Peak and Carbon Neutrality Path for China’s Power Industry. Strateg. Study CAE 2021, 23, 1–14. [Google Scholar] [CrossRef]
- Zhang, X.L.; Liu, J.L.; Wang, K.; Cui, X.Q.; Zou, J. Study on medium and long-term low-carbon development pathway of China’s power sector. China Popul. Resour. Environ. 2018, 28, 68–77. [Google Scholar]
- Knopf, B.; Kejun, J. Germany and China take the lead. Science 2017, 358, 569. [Google Scholar] [CrossRef] [PubMed]
- Shan, B.G. Analysis on the causes of global energy and power shortage in 2021 and its enlightenment to China. China Energy News 2022, 2, 12. [Google Scholar]
- Bruninx, K.; Delarue, E. A Statistical Description of the Error on Wind Power Forecasts for Probabilistic Reserve Sizing. IEEE Trans. Sustain. Energy 2014, 5, 995–1002. [Google Scholar] [CrossRef]
- Xue, C.; Ren, J.; Ma, X.W.; Cui, W.; Liu, Y.B.; Wang, X.D. Mechanism of peak regulation auxiliary electricity market in the presence of high-penetration renewable energy and its practice in northwest China. Electr. Power 2020, 54, 19–28. [Google Scholar]
- Wang, J.; Redondo, N.E.; Galiana, F.D. Demand-side reserve offers in joint energy/reserve electricity markets. IEEE Trans. Power Syst. 2003, 18, 1300–1306. [Google Scholar] [CrossRef]
- Liu, Z.; Deng, Z.; He, G.; Wang, H.L.; Zhang, X.; Lin, J.; Qi, Y.; Liang, X. Challenges and opportunities for carbon neutrality in China. Nat. Rev. Earth Environ 2021, 3, 141–155. [Google Scholar] [CrossRef]
- Wood Mackenzie. Sprint or marathon? China Provincial Renewable Power, Competitiveness Report; Wood Mackenzie Consulting Co., Ltd.: Beijing, China, 2019. [Google Scholar]
- Li, J.F.; Jiang, S.Y. Analysis on energy security in the Transition Era and China’s plan. Energy China 2020, 42, 4–10. [Google Scholar]
- National Development and Reform Commission. The National Development and Reform Commission in China; National Development and Reform Commission: Beijing, China, 2021.
- NDRC Energy Research Institute. China’s Photovoltaic Development Outlook in 2050; NDRC Energy Research Institute: Beijing, China, 2019.
- Wang, X.C.; Jin, Y.M.; Zhang, J.F.; Yang, B. A Comprehensive Evaluation Model for Power System with Large-Scale New Energy Considering Regional Differences. Electr. Power 2018, 51, 178–184. [Google Scholar]
- Shu, Y.B.; Zhang, Z.G.; Guo, J.B.; Zhang, Z.L. Study on Key Factors and Solution of Renewable Energy Accommodation. Proc. CSEE 2017, 37, 1–8. [Google Scholar]
- Ren, J.; Xue, C.; Ma, X.W.; Liu, Y.B.; Wang, X.D. Two-stage Model of Peak Regulation Ancillary Service Market with Source-Load Interaction. Autom. Electr. Power Syst. 2021, 45, 94–102. [Google Scholar]
- Shu, Y.B.; Chen, G.P.; He, J.B.; Zhang, F. Building a New Electric Power System based on New Energy Sources. Strateg. Study CAE 2021, 23, 61–69. [Google Scholar] [CrossRef]
- China Electricity Council. Research on Flexible Operation Policy of Coal Motor Unit; China Electricity Council: Beijing, China, 2019.
- Xin, H.; Liu, Y.; Wang, Z.; Gan, D.Q.; Yang, T.C. A New Frequency Regulation Strategy for Photovoltaic Systems without Energy Storage. IEEE Trans. Sustain. Energy 2013, 4, 985–993. [Google Scholar] [CrossRef]
- Delille, G.; Francois, B.; Malarange, G. Dynamic frequency control support by energy storage to reduce the impact of wind and solar generation on isolated power system’s inertia. IEEE Trans. Sustain. Energy 2012, 3, 931–939. [Google Scholar] [CrossRef]
- Li, H.; Liu, D.; Yao, D.Y. Analysis and Reflection on the Development of Power System towards the Goal of Carbon Emission Peak and Carbon Neutrality. Proc. CSEE 2021, 41, 6245–6259. [Google Scholar]


| Month | Power Demand (Billion kW·h) | Power Supply (Billion kW·h) | Power Demand-Power Supply (Billion kW·h) |
|---|---|---|---|
| March | 663.1 | 657.9 | 5.2 |
| April | 636.1 | 623.0 | 13.1 |
| May | 672.4 | 647.8 | 24.6 |
| June | 703.3 | 686.1 | 17.2 |
| July | 775.8 | 758.6 | 17.2 |
| August | 760.7 | 738.4 | 22.3 |
| September | 694.7 | 675.1 | 19.6 |
| October | 660.3 | 639.4 | 20.9 |
| November | 671.8 | 654.0 | 17.8 |
| Period | Year-on-Year Growth Rate of Power Generation | GDP Year-on-Year Growth Rate | Year-on-Year Growth Rate of Coal Production | Year-on-Year Growth Rate of Imported Coal |
|---|---|---|---|---|
| The first three quarters of 2018 | 7.4 | 6.7 | 5.1 | 11.8 |
| The first three quarters of 2019 | 3.0 | 6.2 | 4.5 | 9.5 |
| The first three quarters of 2020 | 0.9 | 0.7 | −0.1 | −4.4 |
| The first three quarters of 2021 | 10.7 | 9.8 | 3.7 | −3.6 |
| Year | GDP Growth (%) | Proportion of Added Value of Primary Industry in GDP (%) | Proportion of Added Value of Secondary Industry in GDP (%) | Proportion of Added Value of Tertiary Industry in GDP (%) |
|---|---|---|---|---|
| 2020 | 5.1 | 7.7 | 37.8 | 54.5 |
| 2025 | 5.5 | 7.3 | 34.5 | 58.2 |
| 2030 | 5.0 | 6.0 | 32.1 | 61.9 |
| Year | Population (Billion) | Urban Population (Billion) | Rural Population (Billion) | Urbanization Rate (%) |
|---|---|---|---|---|
| 2020 | 1.412 | 0.902 | 0.510 | 63.89 |
| 2025 | 1.435 | 1.004 | 0.431 | 70.00 |
| 2030 | 1.442 | 1.081 | 0.361 | 75.00 |
| Type of Generation | Installed Capacity in 2020 (MW) | Unavailable Installed Capacity (MW) | Available Installed Capacity (MW) | The Proportion of Available Installed Capacity (%) |
|---|---|---|---|---|
| Total | 2,200,580 | 828,090 | 1,372,090 | 62.5 |
| Thermal power | 1,245,170 | 121,280 | 1,123,890 | 90.3 |
| Hydropower | 370,160 | 200,000 | 170,160 | 46.0 |
| Wind power | 281,530 | 253,380 | 28,150 | 10.0 |
| Solar power | 253,430 | 253,430 | 0 | 0.0 |
| Nuclear power | 49,890 | 0 | 49,890 | 100.0 |
| Type of Generation | 2025 | 2030 | ||
|---|---|---|---|---|
| Installed Capacity (Billion kW) | Proportion (%) | Installed Capacity (Billion kW) | Proportion (%) | |
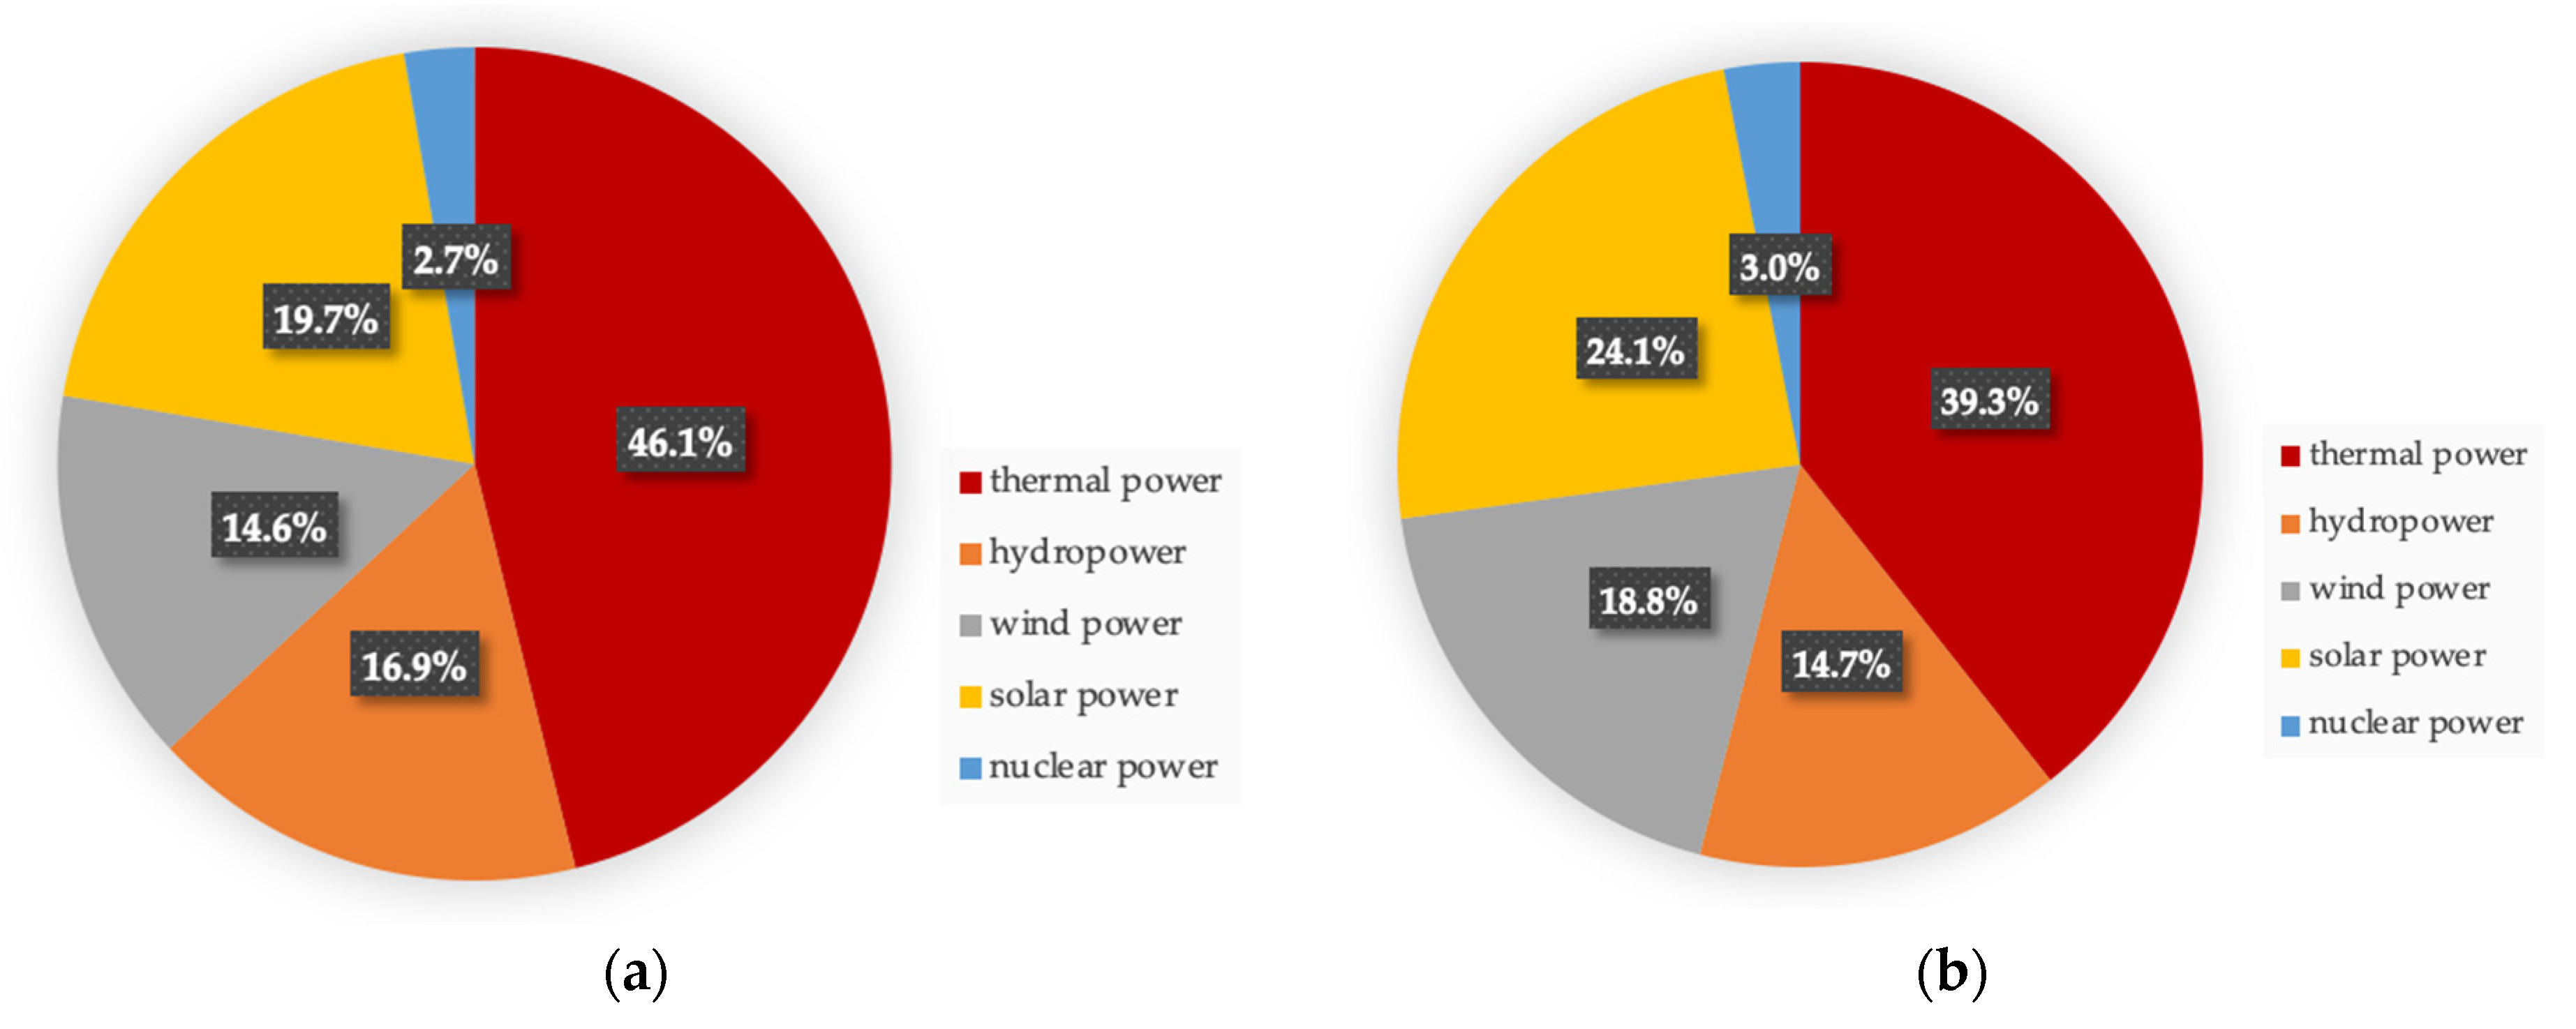
| Thermal power | 1.36 | 46.1 | 1.42 | 39.3 |
| Hydropower | 0.50 | 16.9 | 0.53 | 14.7 |
| Wind power | 0.43 | 14.6 | 0.68 | 18.8 |
| Solar power | 0.58 | 19.7 | 0.87 | 24.1 |
| Nuclear power | 0.08 | 2.7 | 0.11 | 3.0 |
Publisher’s Note: MDPI stays neutral with regard to jurisdictional claims in published maps and institutional affiliations. |
© 2022 by the authors. Licensee MDPI, Basel, Switzerland. This article is an open access article distributed under the terms and conditions of the Creative Commons Attribution (CC BY) license (https://creativecommons.org/licenses/by/4.0/).
Share and Cite
Wang, B.; Wang, L.; Zhong, S.; Xiang, N.; Qu, Q. Low-Carbon Transformation of Electric System against Power Shortage in China: Policy Optimization. Energies 2022, 15, 1574. https://doi.org/10.3390/en15041574
Wang B, Wang L, Zhong S, Xiang N, Qu Q. Low-Carbon Transformation of Electric System against Power Shortage in China: Policy Optimization. Energies. 2022; 15(4):1574. https://doi.org/10.3390/en15041574
Chicago/Turabian StyleWang, Bo, Limao Wang, Shuai Zhong, Ning Xiang, and Qiushi Qu. 2022. "Low-Carbon Transformation of Electric System against Power Shortage in China: Policy Optimization" Energies 15, no. 4: 1574. https://doi.org/10.3390/en15041574