1. Introduction
Coal gasification wastewater is the wastewater produced in the process of producing coal gas or replacing natural gas in a gasifier, and it mainly comes from washing, condensation, and fractionation sections [
1]. The characteristics of this wastewater are high levels of toxicity and high concentration of pollutants, mainly containing phenols, ammonia, carbon dioxide, etc. It is difficult to achieve complete degradation of organic pollutants in the biochemical treatment process [
2].
The combined technical route of chemical separation, biochemical treatment, and depth treatment is commonly used to treat highly concentrated organic wastewater containing phenols from coal gasification in industry [
3,
4,
5]. The coal gasification wastewater contains concentrations of phenolic substances which will poison and inactivate the working flora in the biochemical treatment section. So, the phenols and ammonia recovery section of coal gasification wastewater before the biochemical treatment section has a non-negligible status. Its primary purpose is to recover most of the acidic substances, phenols, and ammonia in the coal gasification wastewater [
6].
Two categories of the phenols and ammonia recovery process are roughly divided according to the order of phenols and ammonia removal, the two-column process based on the Lurgi coal gasification wastewater treatment process, and the single-column process based on the South China University of Technology wastewater treatment process. The former is not deaminated before phenols removal, resulting in alkaline wastewater, which reduces the efficiency of polyphenol removal [
7]. The latter can remove the crude phenols from the wastewater better but requires a large amount of medium- and high-pressure steam [
8].
In order to meet the requirements of green chemistry and zero pollution emission, there is a need to develop a heat integration process that can save energy and accomplish the wastewater purification index at the same time. Many optimal processes have been proposed by researchers from the perspective of energy conservation, which indicates that the existing processes have great potential to reduce energy consumption through further process optimization and heat integration. Gai et al. [
9] proposed two options for heat integration between solvent distillation column and solvent stripper based on the wastewater treatment process of South China University of Technology, among which the depressurized heat integration process and the pressure-swing heat integration process can save 18.6% and 18.2% of energy consumption, respectively. Cui et al. [
10] obtained a new heat integration process by thermally integrating the sour water stripper column and solvent recovery system, saving 30.9% of energy consumption. In addition, the application of heat pumps has been extensively studied in the heat integration of phenols and ammonia recovery process. Chen et al. [
11] analyzed the feasibility of steam recompression process using Grand Composite Curve and designed a new integration process. The final process saves USD 1.095 million in total annual utility consumption. Zahid [
12] used Aspen Hysys to design the vapor recompression scheme of a sour water stripping unit in a refinery. Compared with the traditional design, the proposed vapor recompression design can reduce the demand for cooling and heating facilities by 90% and 22%, respectively. Gai et al. [
13] used the flashing mechanical vapor recompression heat pump to reduce the energy consumption of sulfur-containing wastewater.
The above research demonstrated the feasibility and effectiveness of heat integration. However, the process can still be further improved. Jin et al. [
14] pointed out that the traditional heat integration design program needs to start with a good process design; that is, to optimize the design parameters of the process first, and then conduct the heat integration design. This may lead to the omission of some more competitive solutions. Therefore, the simultaneous optimization of process parameters and heat integration has attracted more and more attention from scholars [
15,
16,
17,
18]. There have been many studies applying this method to actual processes. Huang et al. [
19] used an extended Duran–Grossmann model to optimize the heat exchanger network of the coal-to-SNG process. By optimizing the operating parameters, the exergy efficiency of the coal-to-SNG plant increased by 1.28% compared to the original industrial plant. Khor et al. [
20] addressed the flowsheet optimization of the synthesis of a petroleum refinery to attain an optimal heat-integrated configuration or topology.
Despite the successful application of some processes of the simultaneous optimization of process parameters and heat integration, the use of simultaneous optimization methods in the process of phenols and ammonia recovery is practically not described in the literature. Therefore, in this study, considering the high energy consumption and high cost of the wastewater treatment process of a coal chemical company, the process technology is improved. The whole process simulation of the phenols and ammonia recovery process is completed by Aspen Plus according to the specific data of the coal chemical company. A heat exchanger network synthesis program that can simultaneously optimize process parameters and heat integration schemes is constructed. The total annual cost (TAC) is used as the objective function, then the influence of some operating parameters on the heat exchanger network is analyzed. This paper is presented in the following order: the second section describes and simulates the process of phenols and ammonia recovery; the third section provides the mathematical model of heat integration; the fourth section presents the results; the last section summarizes the conclusions.
2. Process Description and Simulation
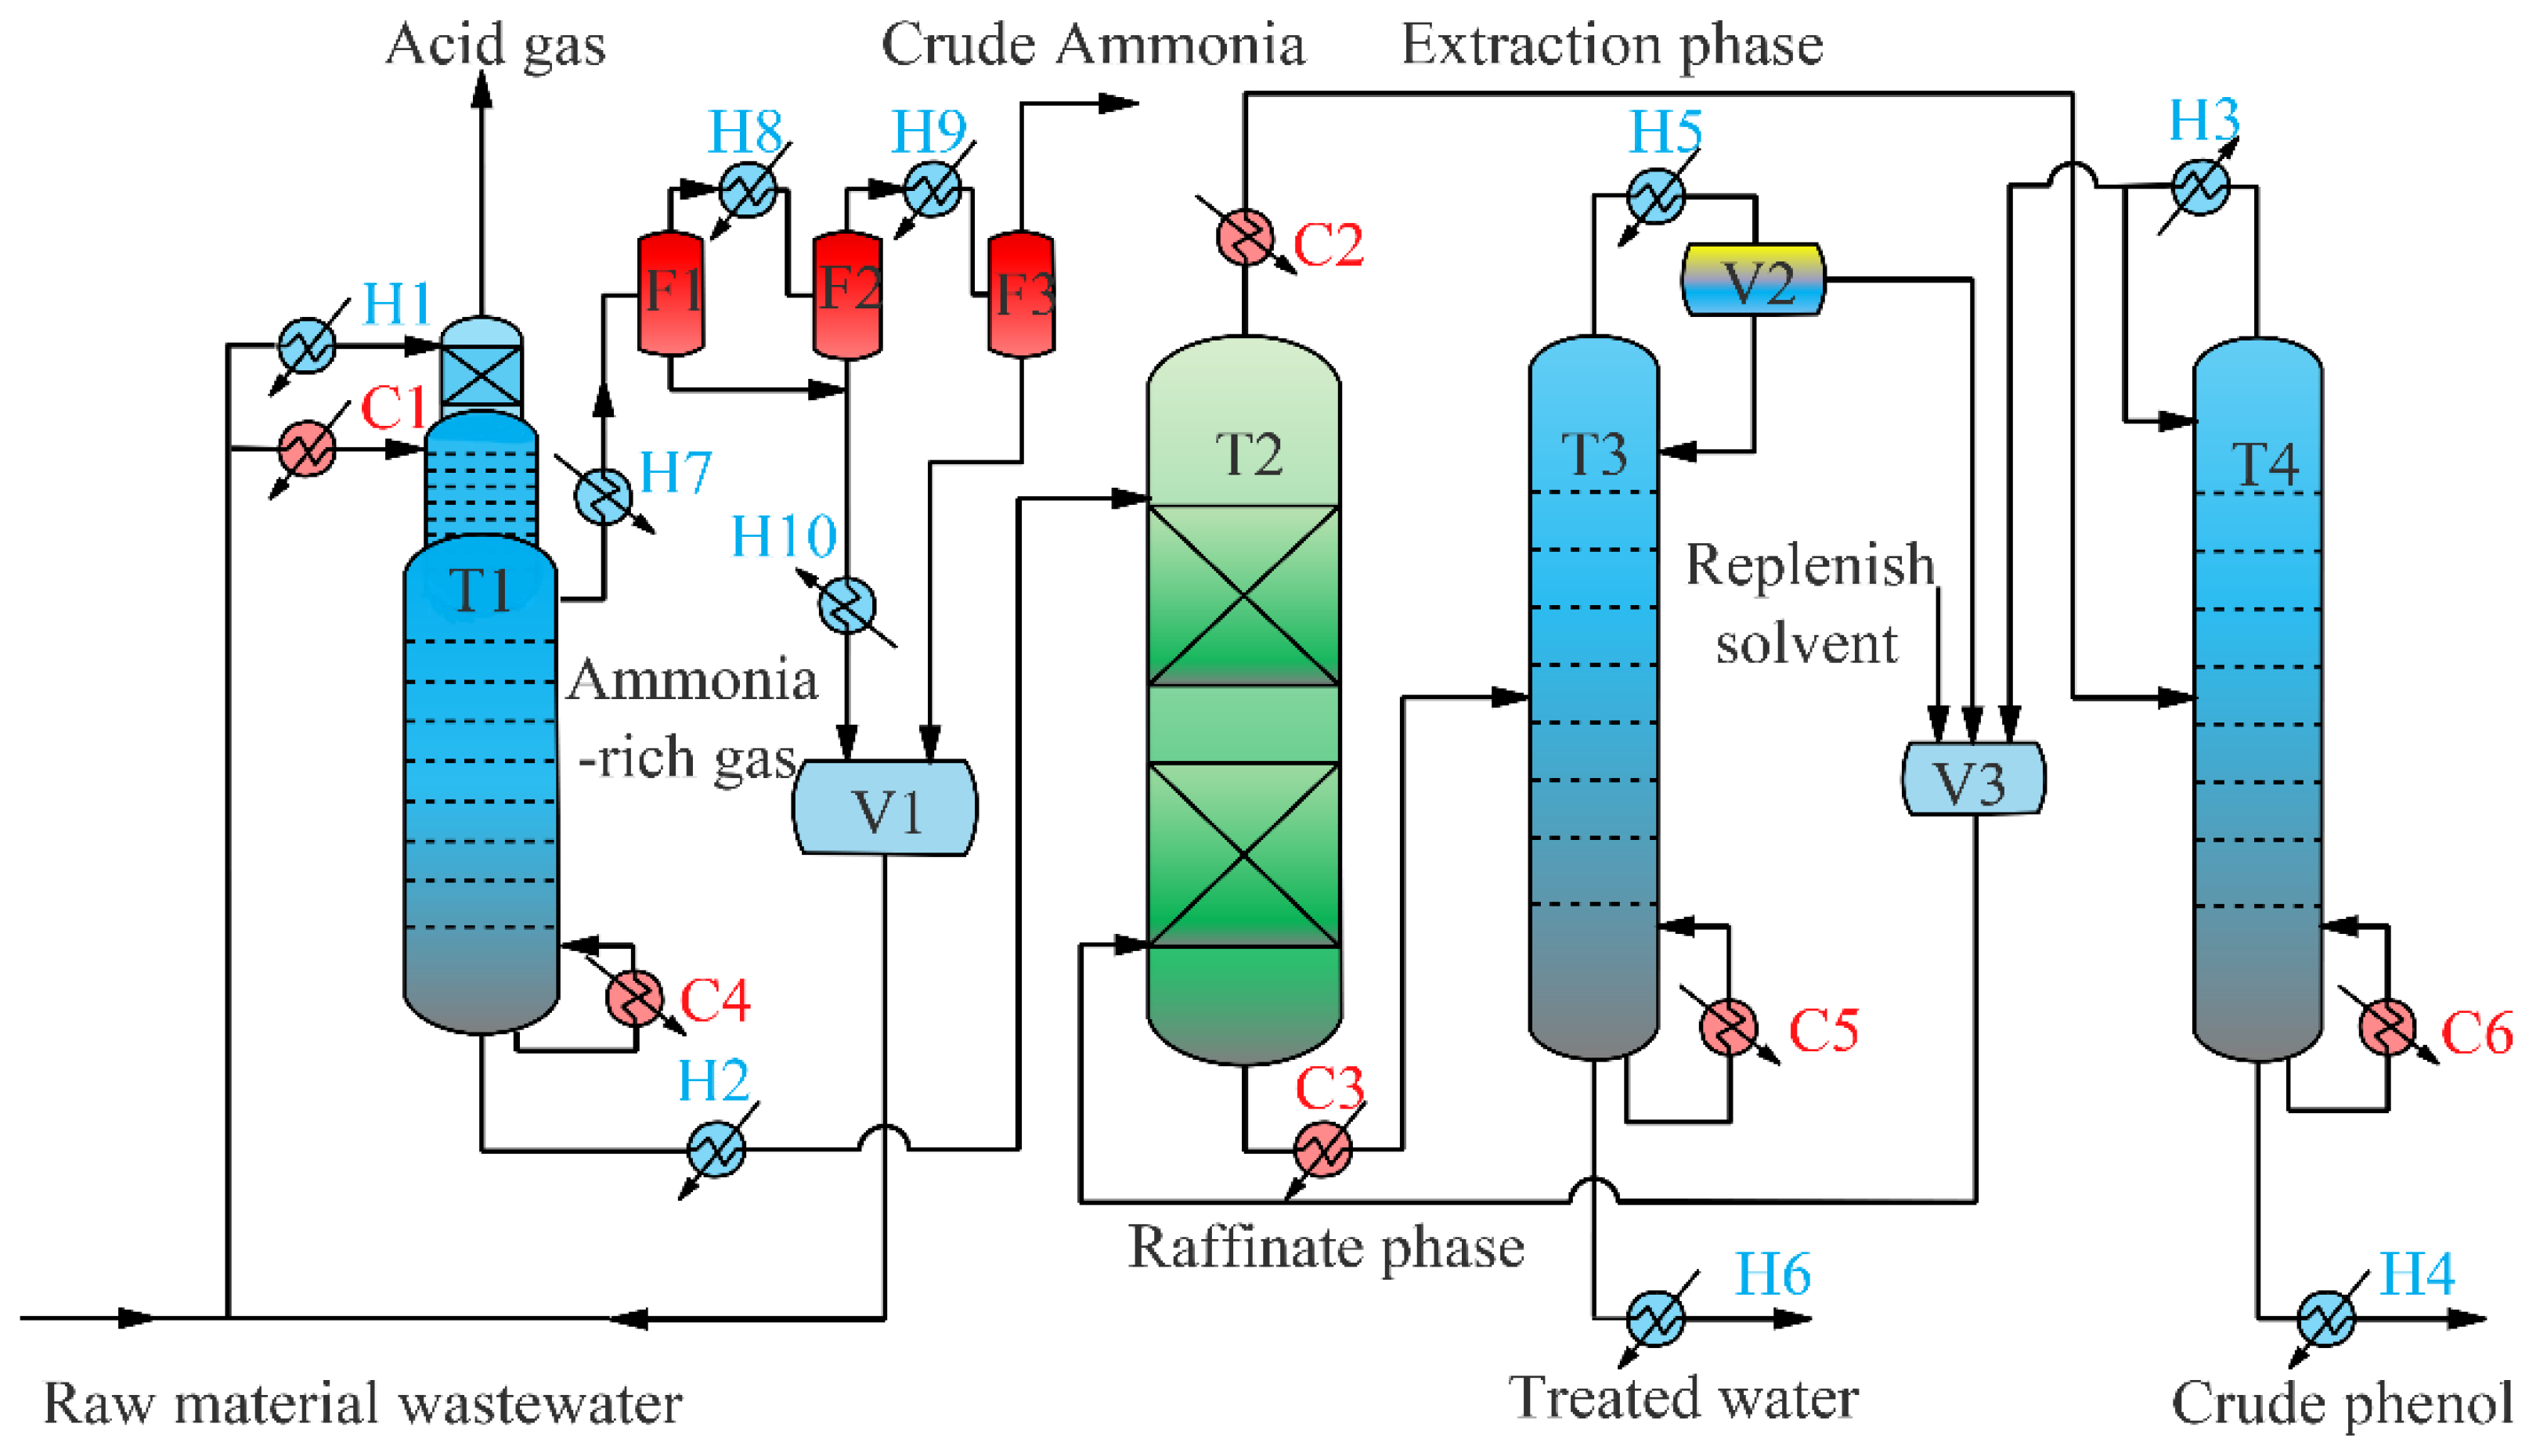
The process flow of phenols and ammonia recovery in the coal chemical plant is shown in
Figure 1. This process contains a single pressurized column to achieve simultaneous acid stripping from the column top and deamination from the side line. The phenols-containing wastewater, after deacidification and deamination, enters the top of an extraction column, and the methyl isobutyl ketone (MIBK) extractant enters the extraction column from the bottom. MIBK and the wastewater are in continuous counter-current contact, and the phenols-containing MIBK comes out from the top of the extraction column, while the dephenolsized wastewater is discharged from the bottom. The extraction solution from the top of the extraction column is pumped into a solvent distillation column equipped with reboiler, and the raffinate is pumped into a solvent stripper.
The ELECNRTL thermodynamics models in Aspen Plus are used to provide properties database [
21]. Based on industrial data, the feed composition is shown in
Table 1.
To meet the biochemical treatment requirements [
10,
22], the design specifications of each output product are stipulated as follows.
- (1)
In order to avoid pipeline blockage, the compositions of water and ammonia in the acid gas at the top of the sour water stripper should be less than 3 wt% and 1.5 wt%, respectively.
- (2)
The purity of crude ammonia product should reach 98 wt% after the three-step partial condensation system.
- (3)
After the treatment of phenols and ammonia removal, the concentrations of total phenols, ammonia, and hydrogen sulfide in the wastewater are reduced to below 500, 150, and 50 mg/L, respectively.
- (4)
MIBK should be reduced to 5 mg/L in the bottom discharge of solvent stripper.
- (5)
The MIBK in the crude phenols product at the bottom of solvent distillation column should be less than 0.2 wt%.
- (6)
In order to recover and utilize the solvent MIBK, the concentration of MIBK in the recovered stream at the top of solvent stripper and solvent distillation column should be greater than 97 wt%.
In order to match stream data with factory data and regulations as much as possible, the operating parameters of stripper and distillation columns are shown in
Table 2.
After the simulation of the whole process is completed, the simulation results are compared with the actual industrial data, as shown in
Table 3. The results show that the simulated outlet temperature and pressure of each column are consistent with the actual operating conditions, which verifies the reliability of the simulation results.
The heat exchanger information obtained from the simulation is organized as shown in
Table 4. The parameters of each heat exchanger consist of three parts: initial temperature, target temperature, and required heat load. They will be imported into the heat exchanger network design model as input variables for the program programmed by Matlab.
4. Results and Discussions
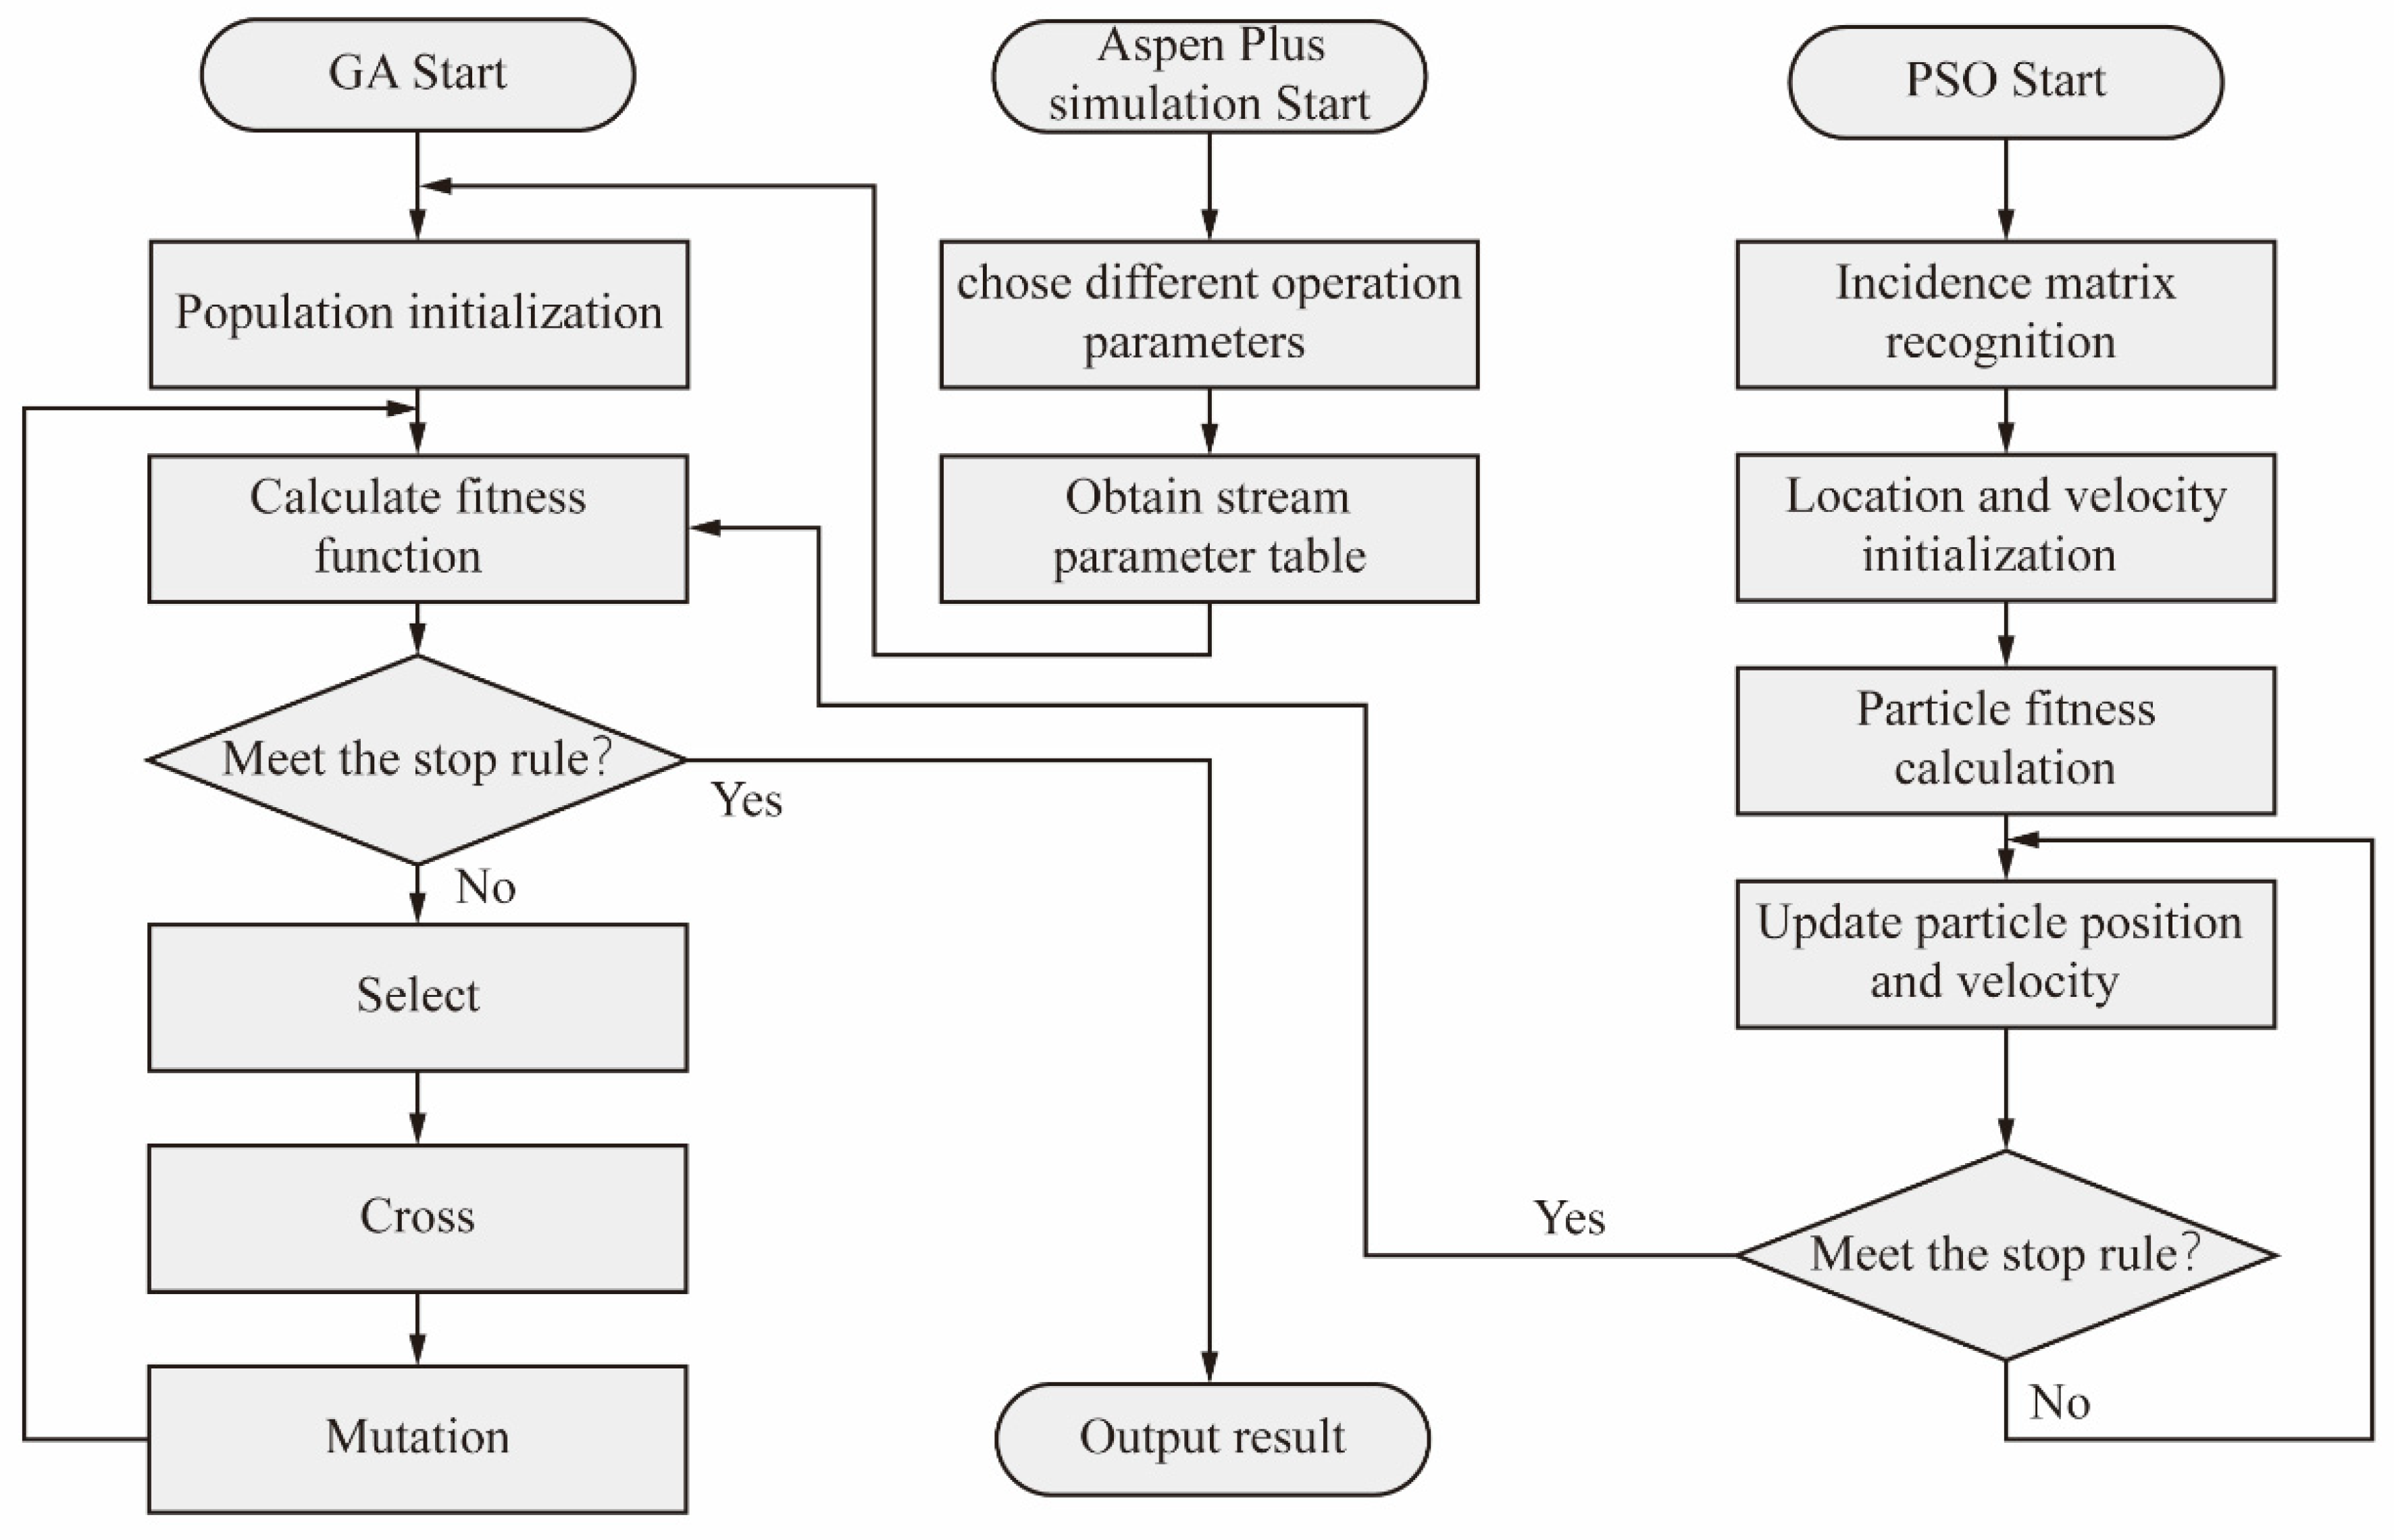
The algorithm’s operation process is shown in
Figure 4.
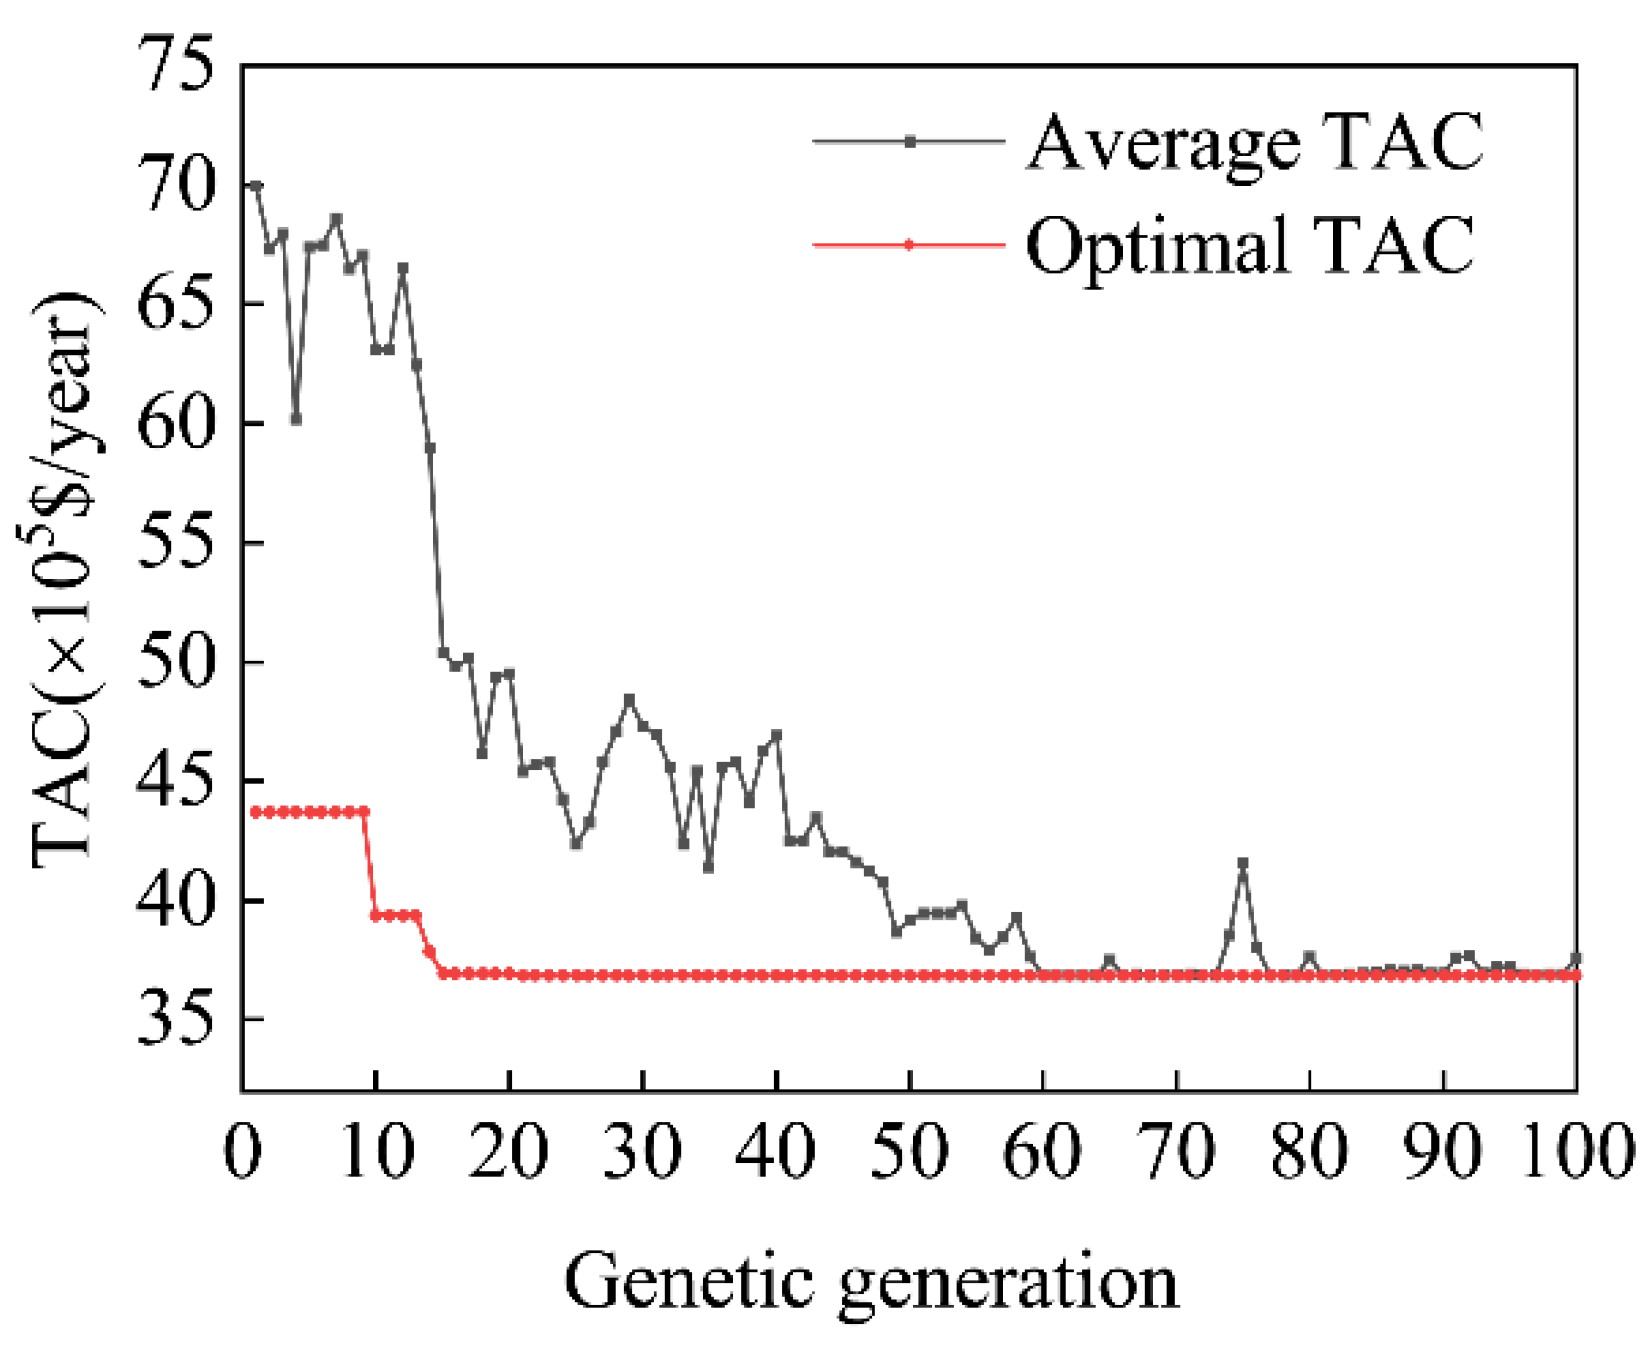
As can be seen from
Figure 4, after 15 generations of genetic inheritance, the individuals with optimal TAC are reproduced in the population. These individuals continue to develop and grow in the subsequent evolution, so that the average TAC of the population reaches the optimal TAC level after 60 generations of genetic inheritance and remains unchanged afterward. It indicates that the established hybrid genetic algorithm has a strong convergence ability. Herein, the effects of some process parameters on the total annual cost of heat integrated process are analyzed.
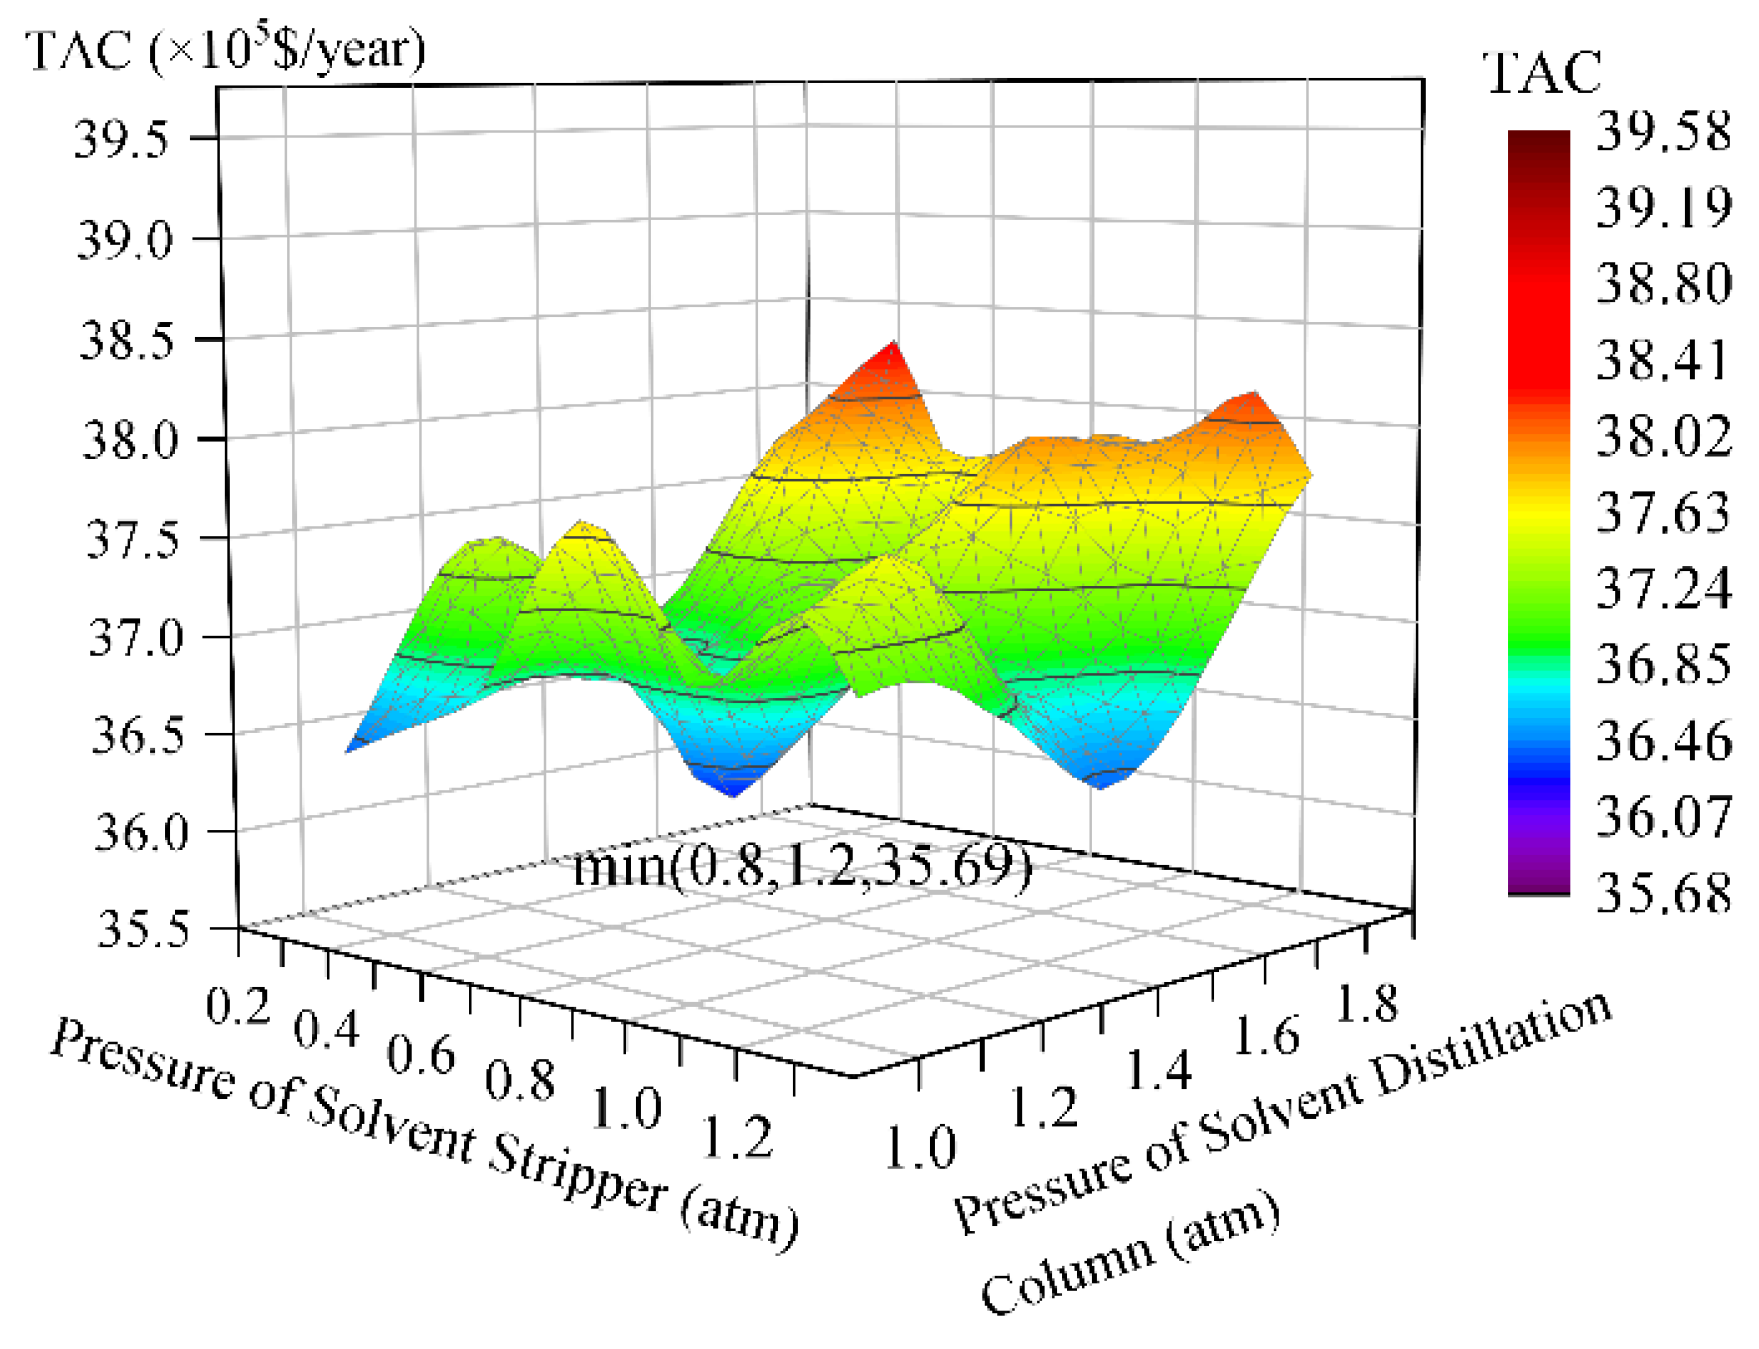
4.1. Effects of Column Pressure in Solvent Distillation Column and Solvent Stripper
Cui et al. mentioned that the heat integration between these two columns could be accomplished by adjusting the pressure of the solvent distillation column and the solvent stripper [
9]. In this paper, the effect of two column pressures on the optimization of the heat exchanger network is discussed. The process simulation under changing pressure conditions of the two columns was first completed using Aspen Plus, and the simulated data were imported by separate operations. The final optimization results are shown in
Figure 5.
Changing the pressure of solvent distillation column and solvent stripper will affect initial temperature, target temperature, and required heat load of some heat exchangers, thus forcing the hybrid genetic algorithm to seek a new optimal heat exchanger network structure. From
Figure 5, it can be seen that when the pressures of solvent stripper and solvent distillation column are set to 0.8/1.2 atm, respectively, the total annual cost of the optimal heat exchanger network reaches the lowest.
The total annual cost of the heat integration process, on the other hand, is only slightly affected by adjusting the pressure of the twin columns, as shown in
Figure 5, which is consistent with Cui et al.’s findings [
9] in the literature. Therefore, this shows that there is a limit to the heat distribution and temperature distribution in the process section by adjusting the parameters in the column.
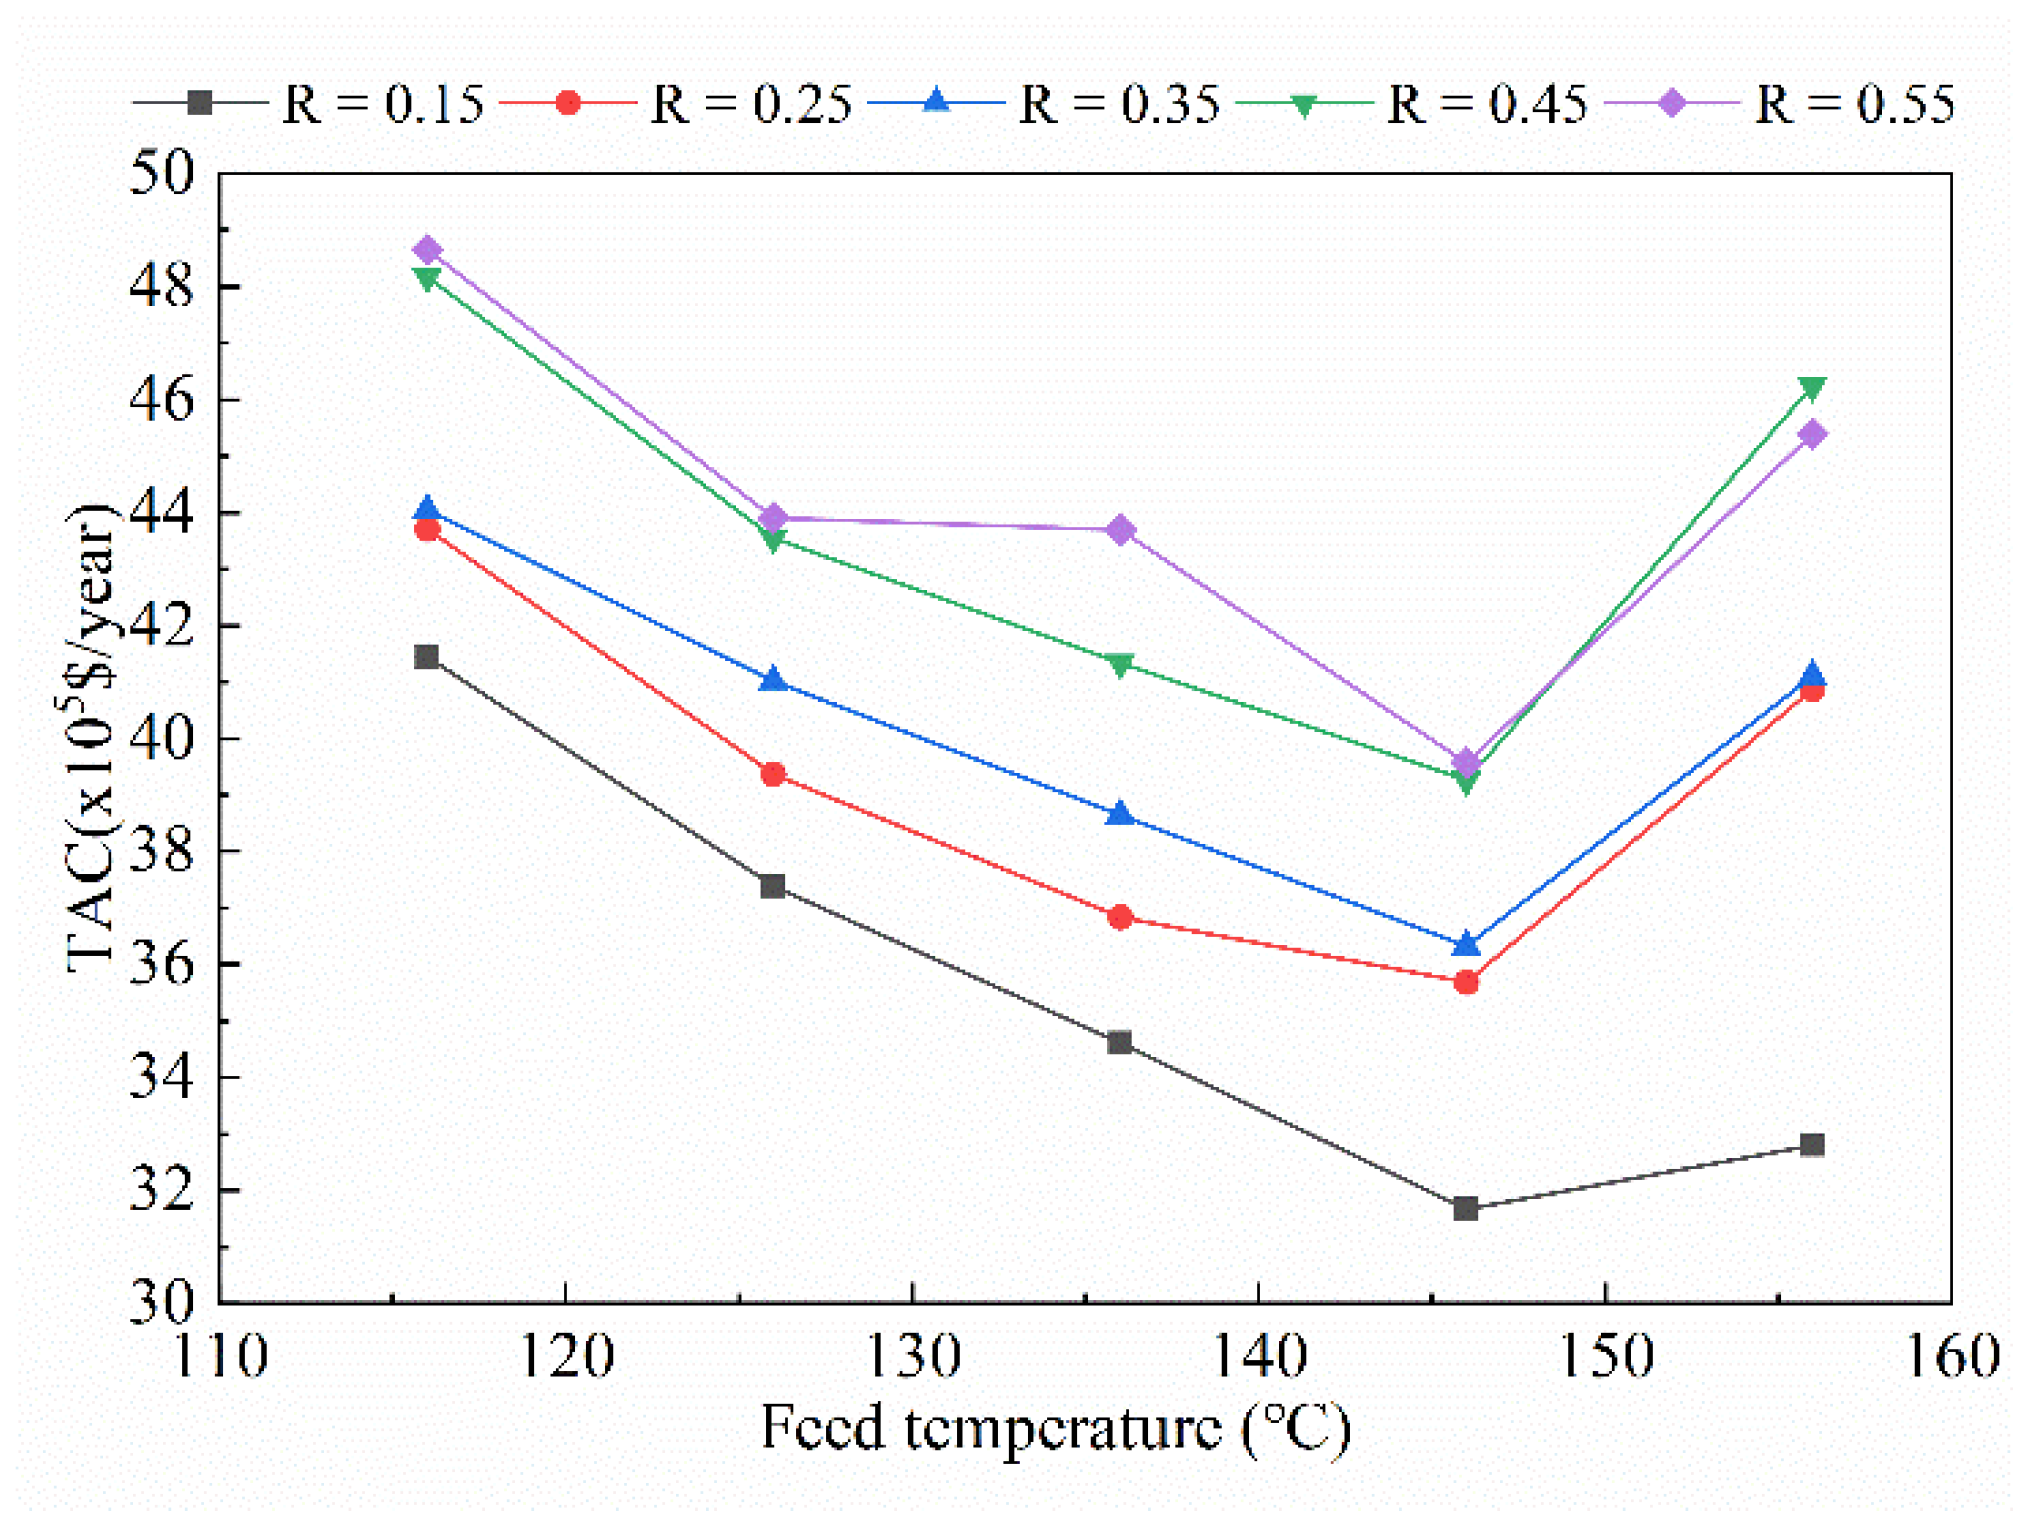
4.2. Effect of Cold-to-Hot Feed Ratio and Hot Feed Temperature
The raw material is divided into two streams before entering the sour water stripper. One stream enters the top of the column as a cold stream and the other stream is heated and enters the middle section of the column. The cold-to-hot feed ratio and the hot feed temperature affect the reboiler heat load of the sour water stripper. If the cold-to-hot feed ratio increases or the hot feed temperature decreases, the reboiler heat load required to complete the product indicators will increase. Usually, hot feed is preheated by matching with other streams, so the changes in cold-to-hot feed ratio and hot feed temperature on the total annual cost after heat exchanger network structure optimization were analyzed, as shown in
Figure 6.
It can be obviously seen from
Figure 6 that the total annual cost after heat integration gradually increases as the cold-to-hot feed ratio continues to increase. As the hot feed temperature increases, the total annual cost after heat integration decreases and then increases. At a hot-to-cold feed ratio of 0.15 and a hot feed temperature of 146 °C, the total annual cost after heat integration is the lowest.
Sufficient heat exchange needs to be provided to drive the separation of the products, which includes the reboiler heat load and the feed heat load. The feed heat load is better integrated by the heat exchanger network than the reboiler heat load. In other words, the more heat required to separate the product that is provided by the heat exchange outside the column, the more easily the heat can be used in the heat exchanger network. It can also be seen from the analysis in
Section 4.1 that stripping the required heat from the column is actually a means of avoiding reforming the heat distribution and temperature distribution by adjusting the parameters in the column.
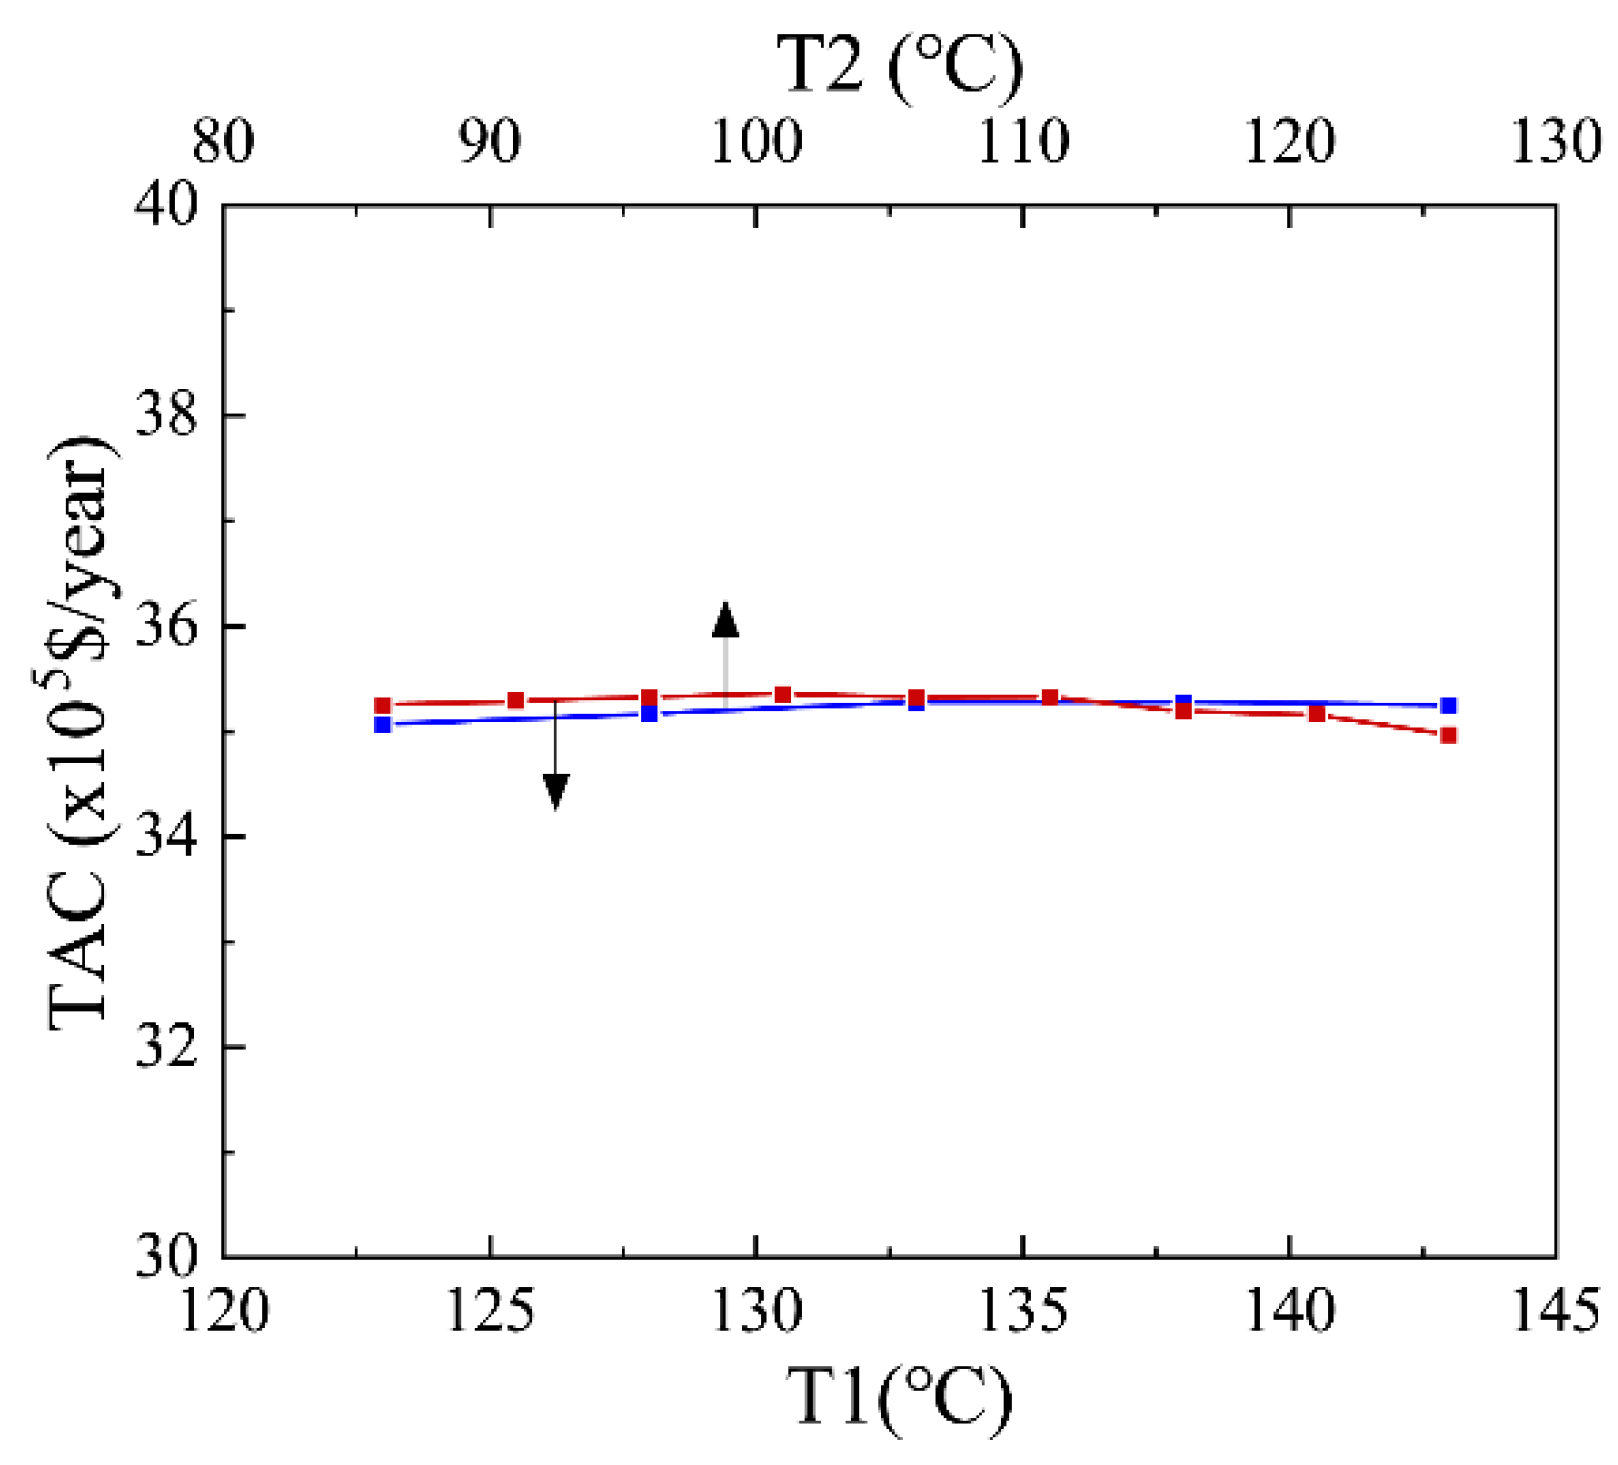
4.3. Effect of the Temperature of the Three-Step Partial Condensation System
According to the literature, the temperature of three condensers affects not only the purity of crude ammonia gas, but also the energy consumption of the sour water stripper [
8]. Among them, the first and second condensers together affect the heat load of the sour water stripper, and the third condenser mainly affects the purity of the extracted crude ammonia gas. The temperature of the third stage condenser must be set at about 40 °C to ensure that the purity of crude ammonia is greater than 98 wt%. The effect of the temperature of the first and second stage condensers on total annual cost is shown in
Figure 7.
As shown in
Figure 7, although the temperature of the first and second condensers affect the heat load of the sour water stripper, the effect on the overall phenols and ammonia recovery process is negligible. Such an observation may be due to the amount of ammonia extracted from the side lines being smaller compared to the amount of wastewater extracted from the bottom of the column (mass ratio of about 1:10). The heat load required by the three subsequent condensers is much smaller than the heat load of the heat exchangers on the other main roads, so the impact on the overall heat exchanger network is negligible.
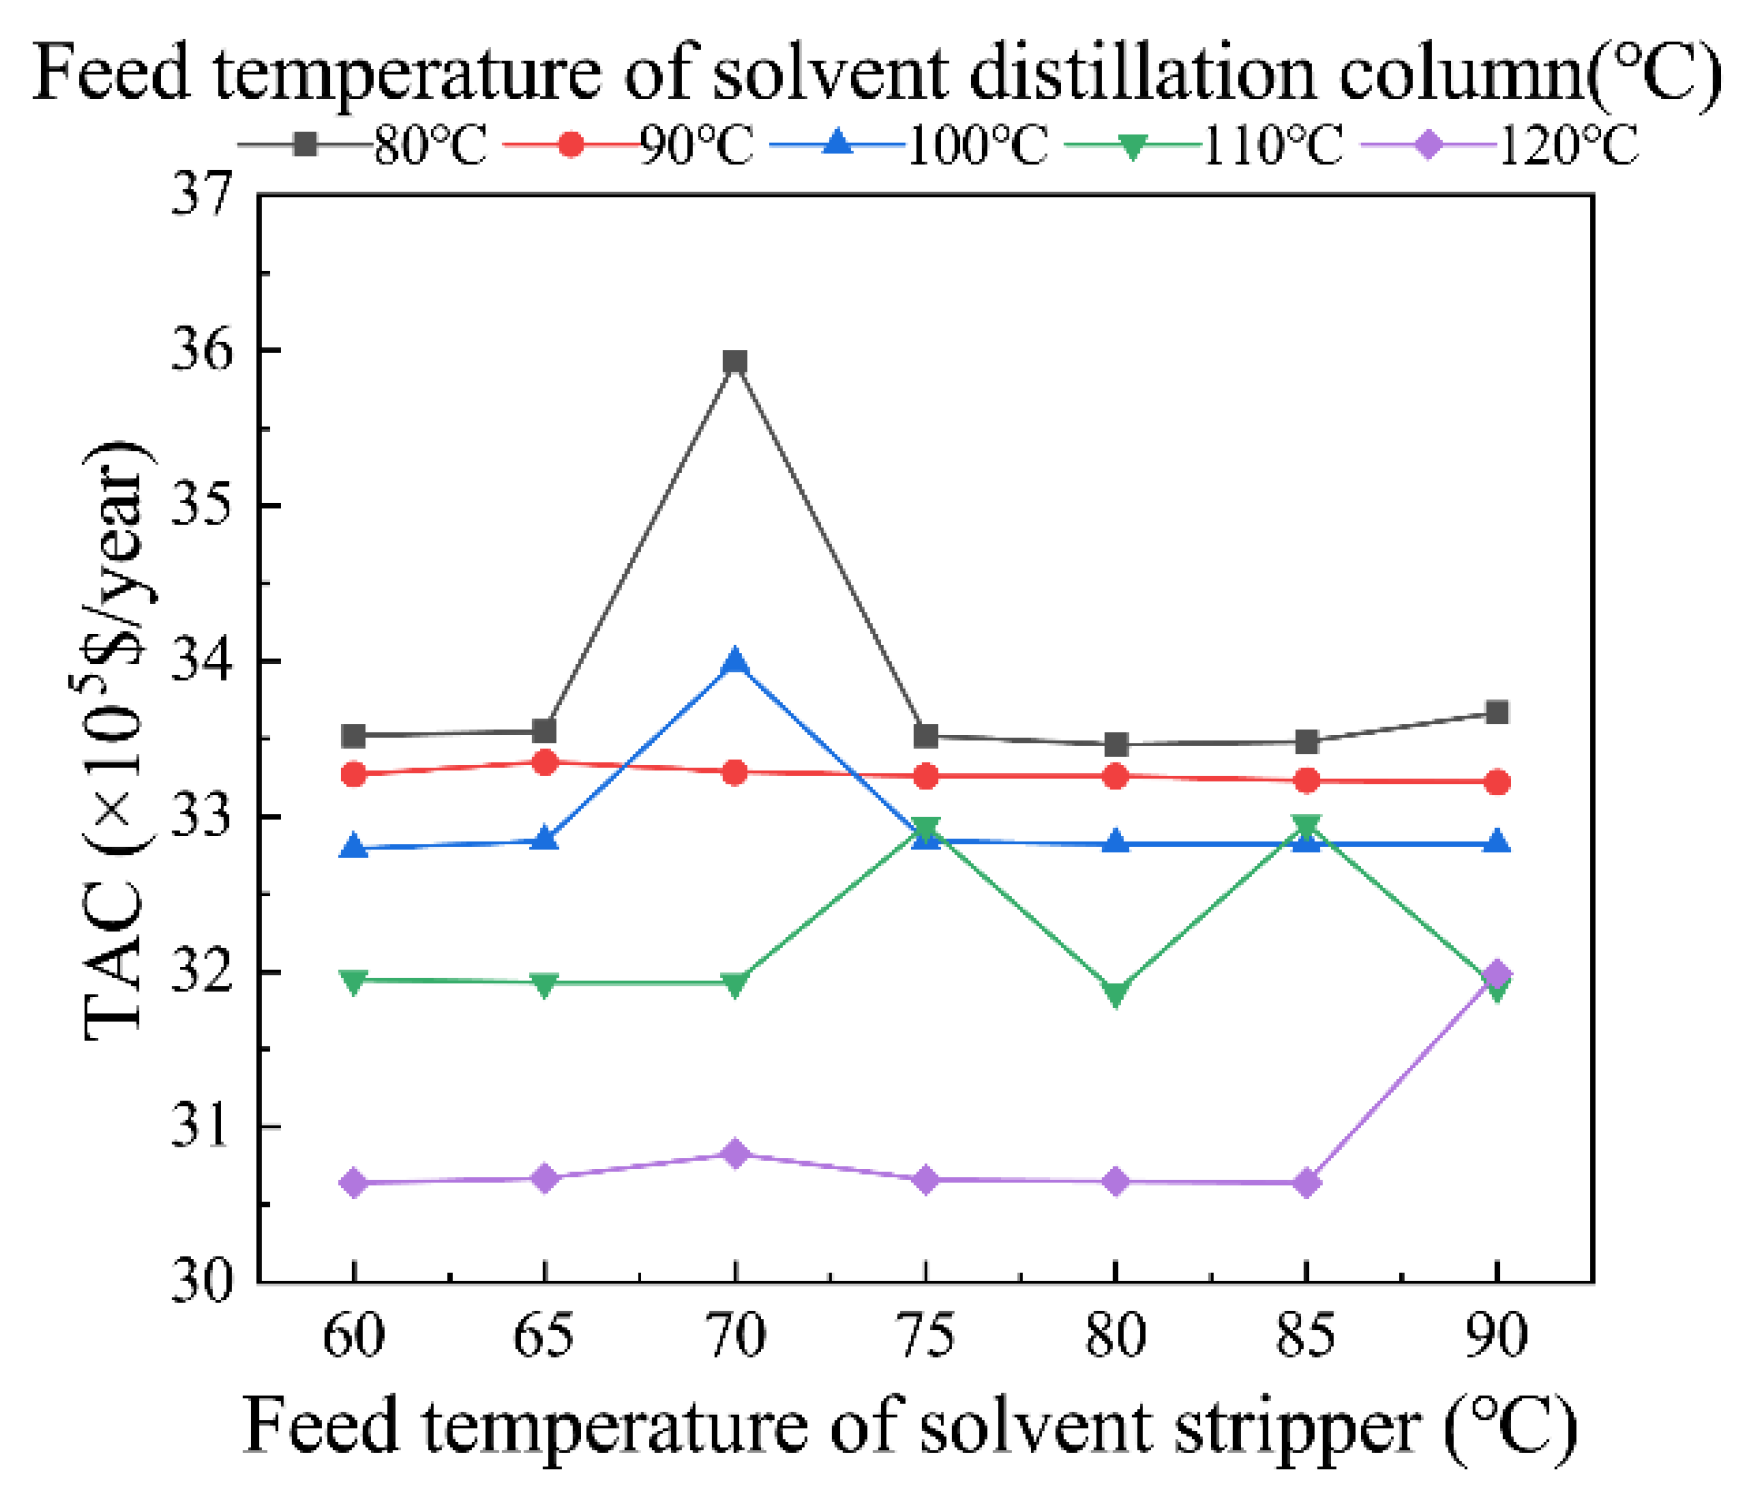
4.4. Effect of the Feed Temperature in Solvent Stripper and Solvent Distillation Column
The effect of feed temperature of solvent stripper and solvent distillation column on the total annual cost of phenols and ammonia recovery process for coal gasification wastewater after heat integration was investigated, and the results are shown in
Figure 8.
Figure 8 presents that the feed temperature of the solvent stripper has little effect on the total annual cost, while the total annual cost gradually decreases as the feed temperature of the solvent distillation column increases. When the feed temperatures of the solvent stripper column and thr solvent distillation column are set to 85/120 °C, respectively, the total annual cost of the phenols ammonia recovery process after heat integration is the lowest.
From the perspective of the whole process, the material flow rate that is required to be treated by the solvent distillation column is larger than the solvent stripper, and more heat needs to be provided, so the total annual cost after heat integration is more sensitive to the heat distribution of the solvent distillation column.
4.5. Summary
Through the previous analysis, it can be seen that the process parameters that can significantly affect the total annual cost of heat integration process are cold to hot feed ratio and hot feed temperature of the sour water stripper, column pressure, feed temperature of solvent distillation column, and column pressure of the solvent stripper.
Two ideas for implementing heat integration and simultaneous process parameter optimization for chemical processes using column equipment may be obtained from the analysis of the impact of the aforementioned factors on the annual total cost:
- (1)
Optimize the heat distribution and temperature distribution in the process by optimizing the conditions outside the tower as far as possible;
- (2)
Optimize the heat exchange equipment on the main material flow with large flow rate as far as possible.
In this phenols and ammonia recovery process, the optimal parameters at the lowest total annual cost were obtained as shown in
Table 6.
At this point the incidence matrix is:
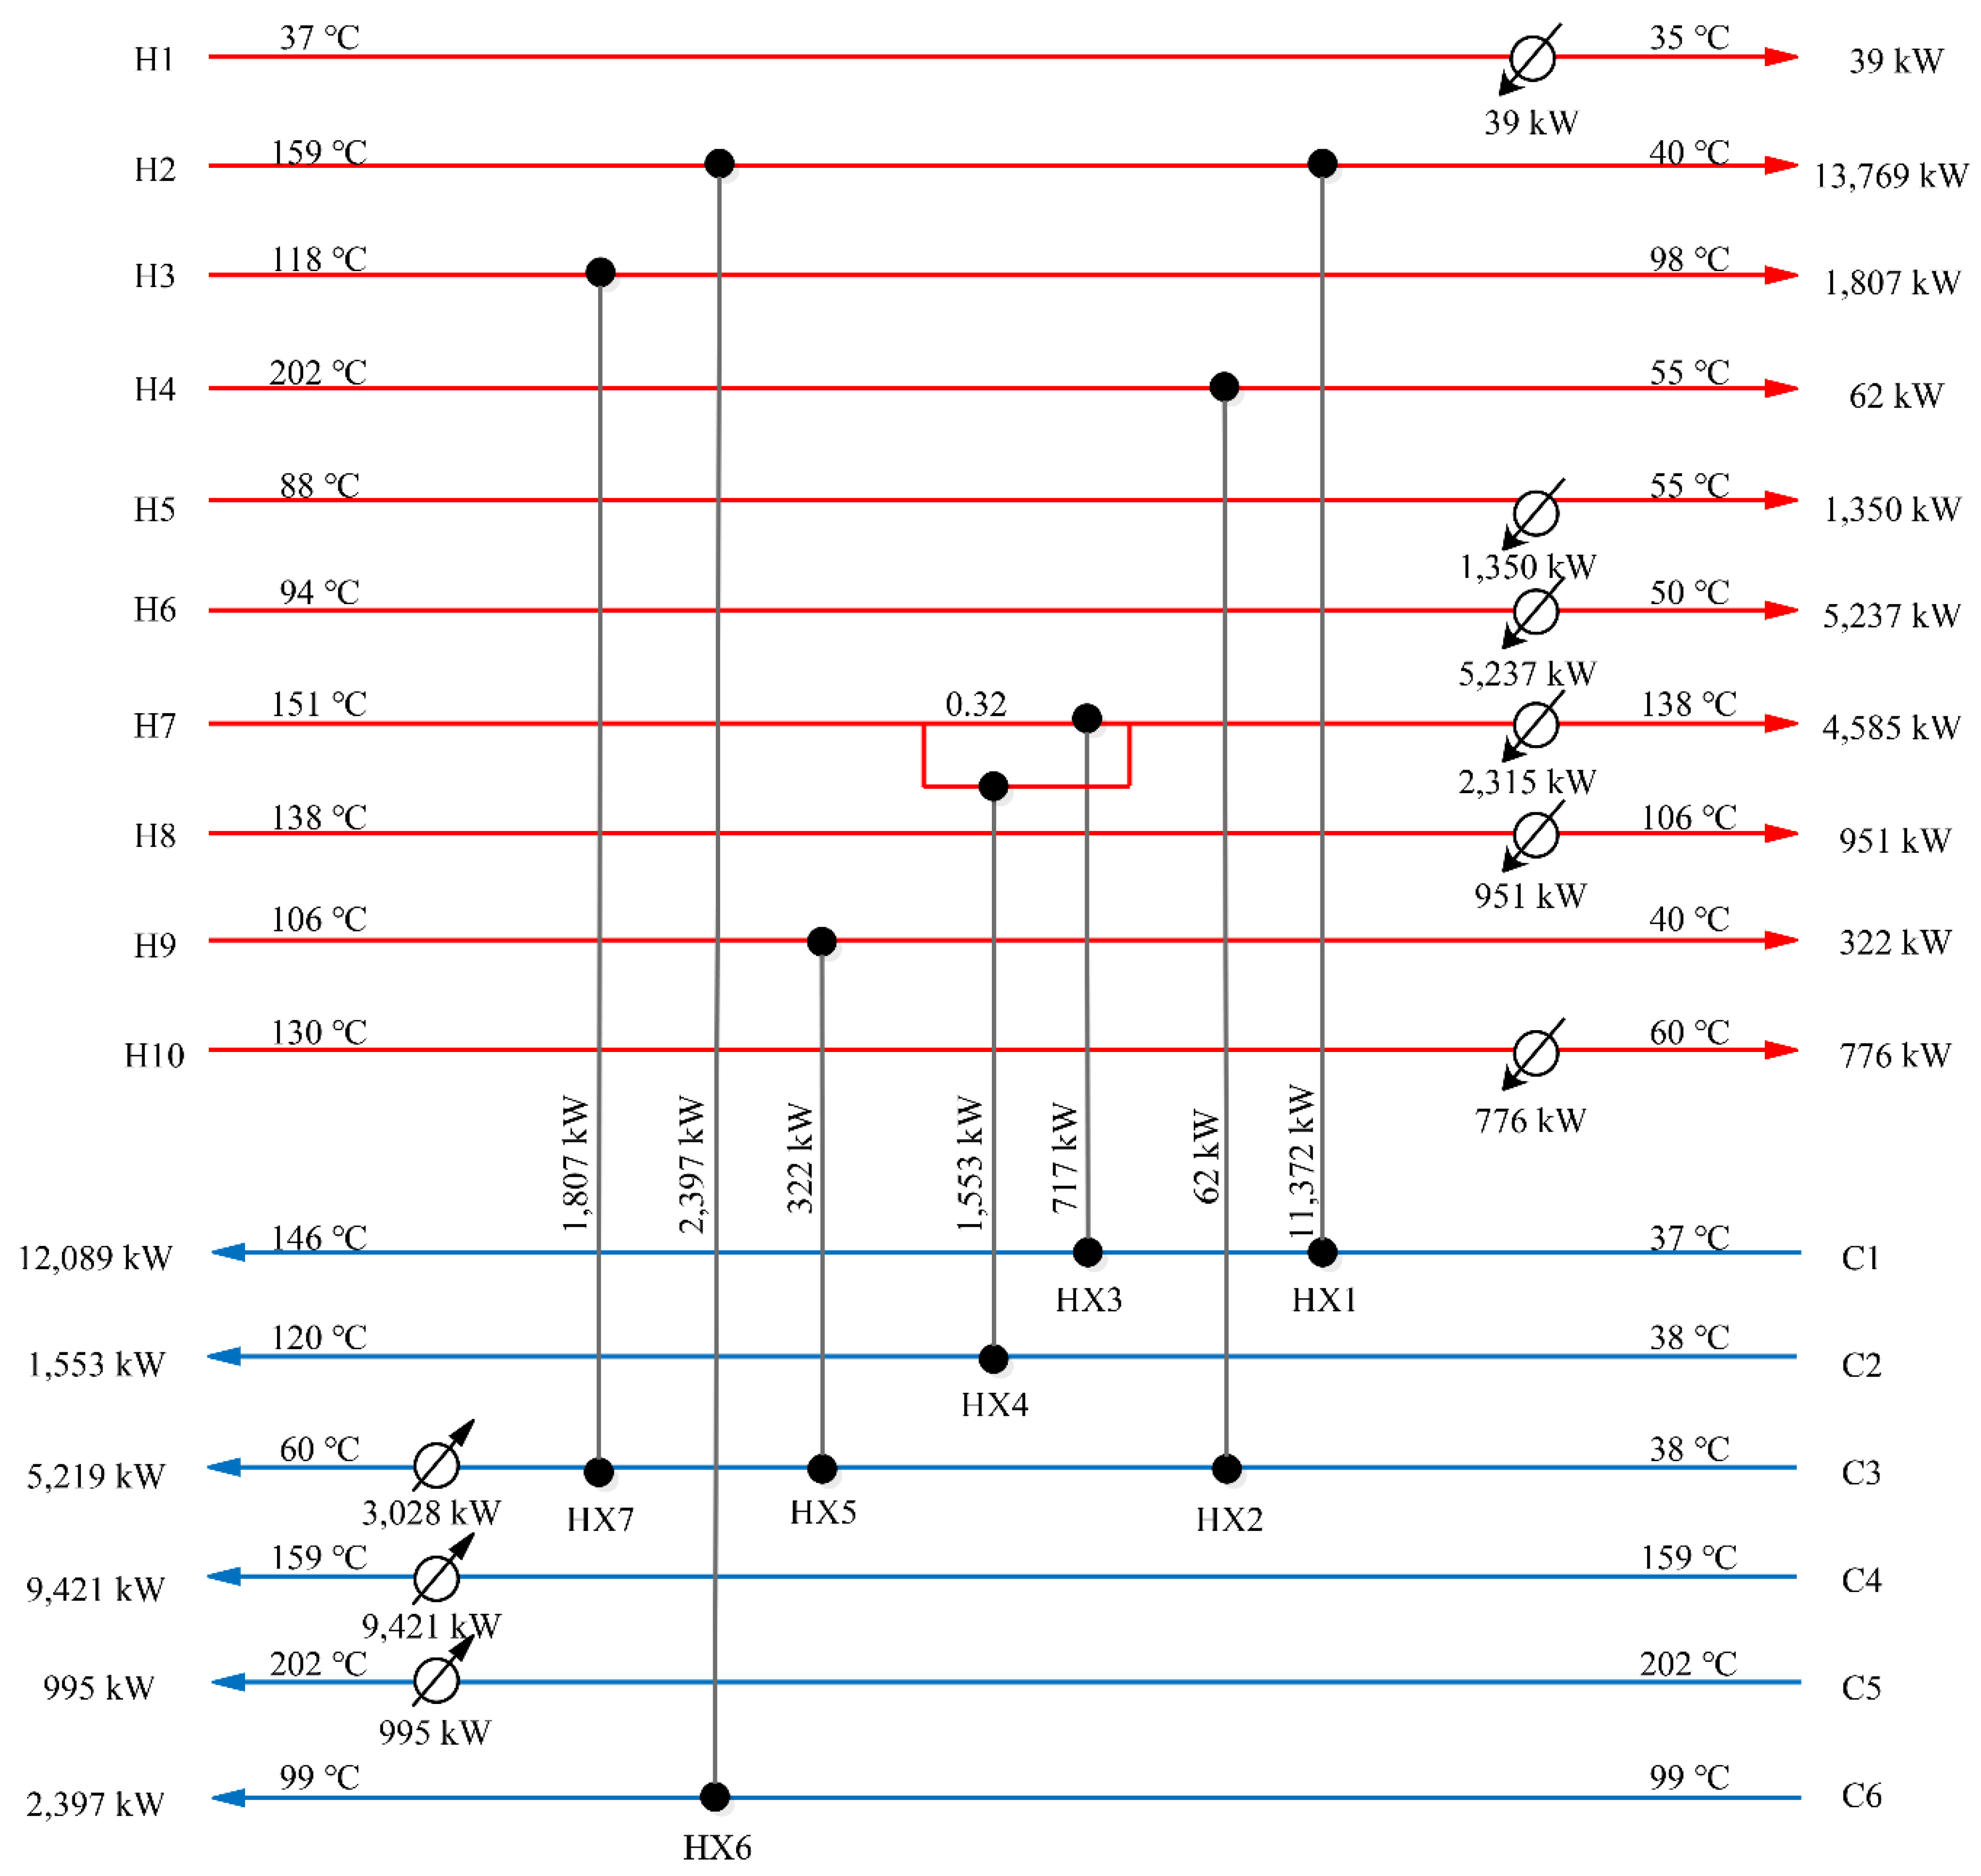
The corresponding heat exchanger network structure is shown in
Figure 9, containing seven heat exchangers, six coolers, and three heaters, consuming 10,668 kW of cold utilities and 13,444 kW of heat utilities, with a total annual cost of 306,400 USD/year.
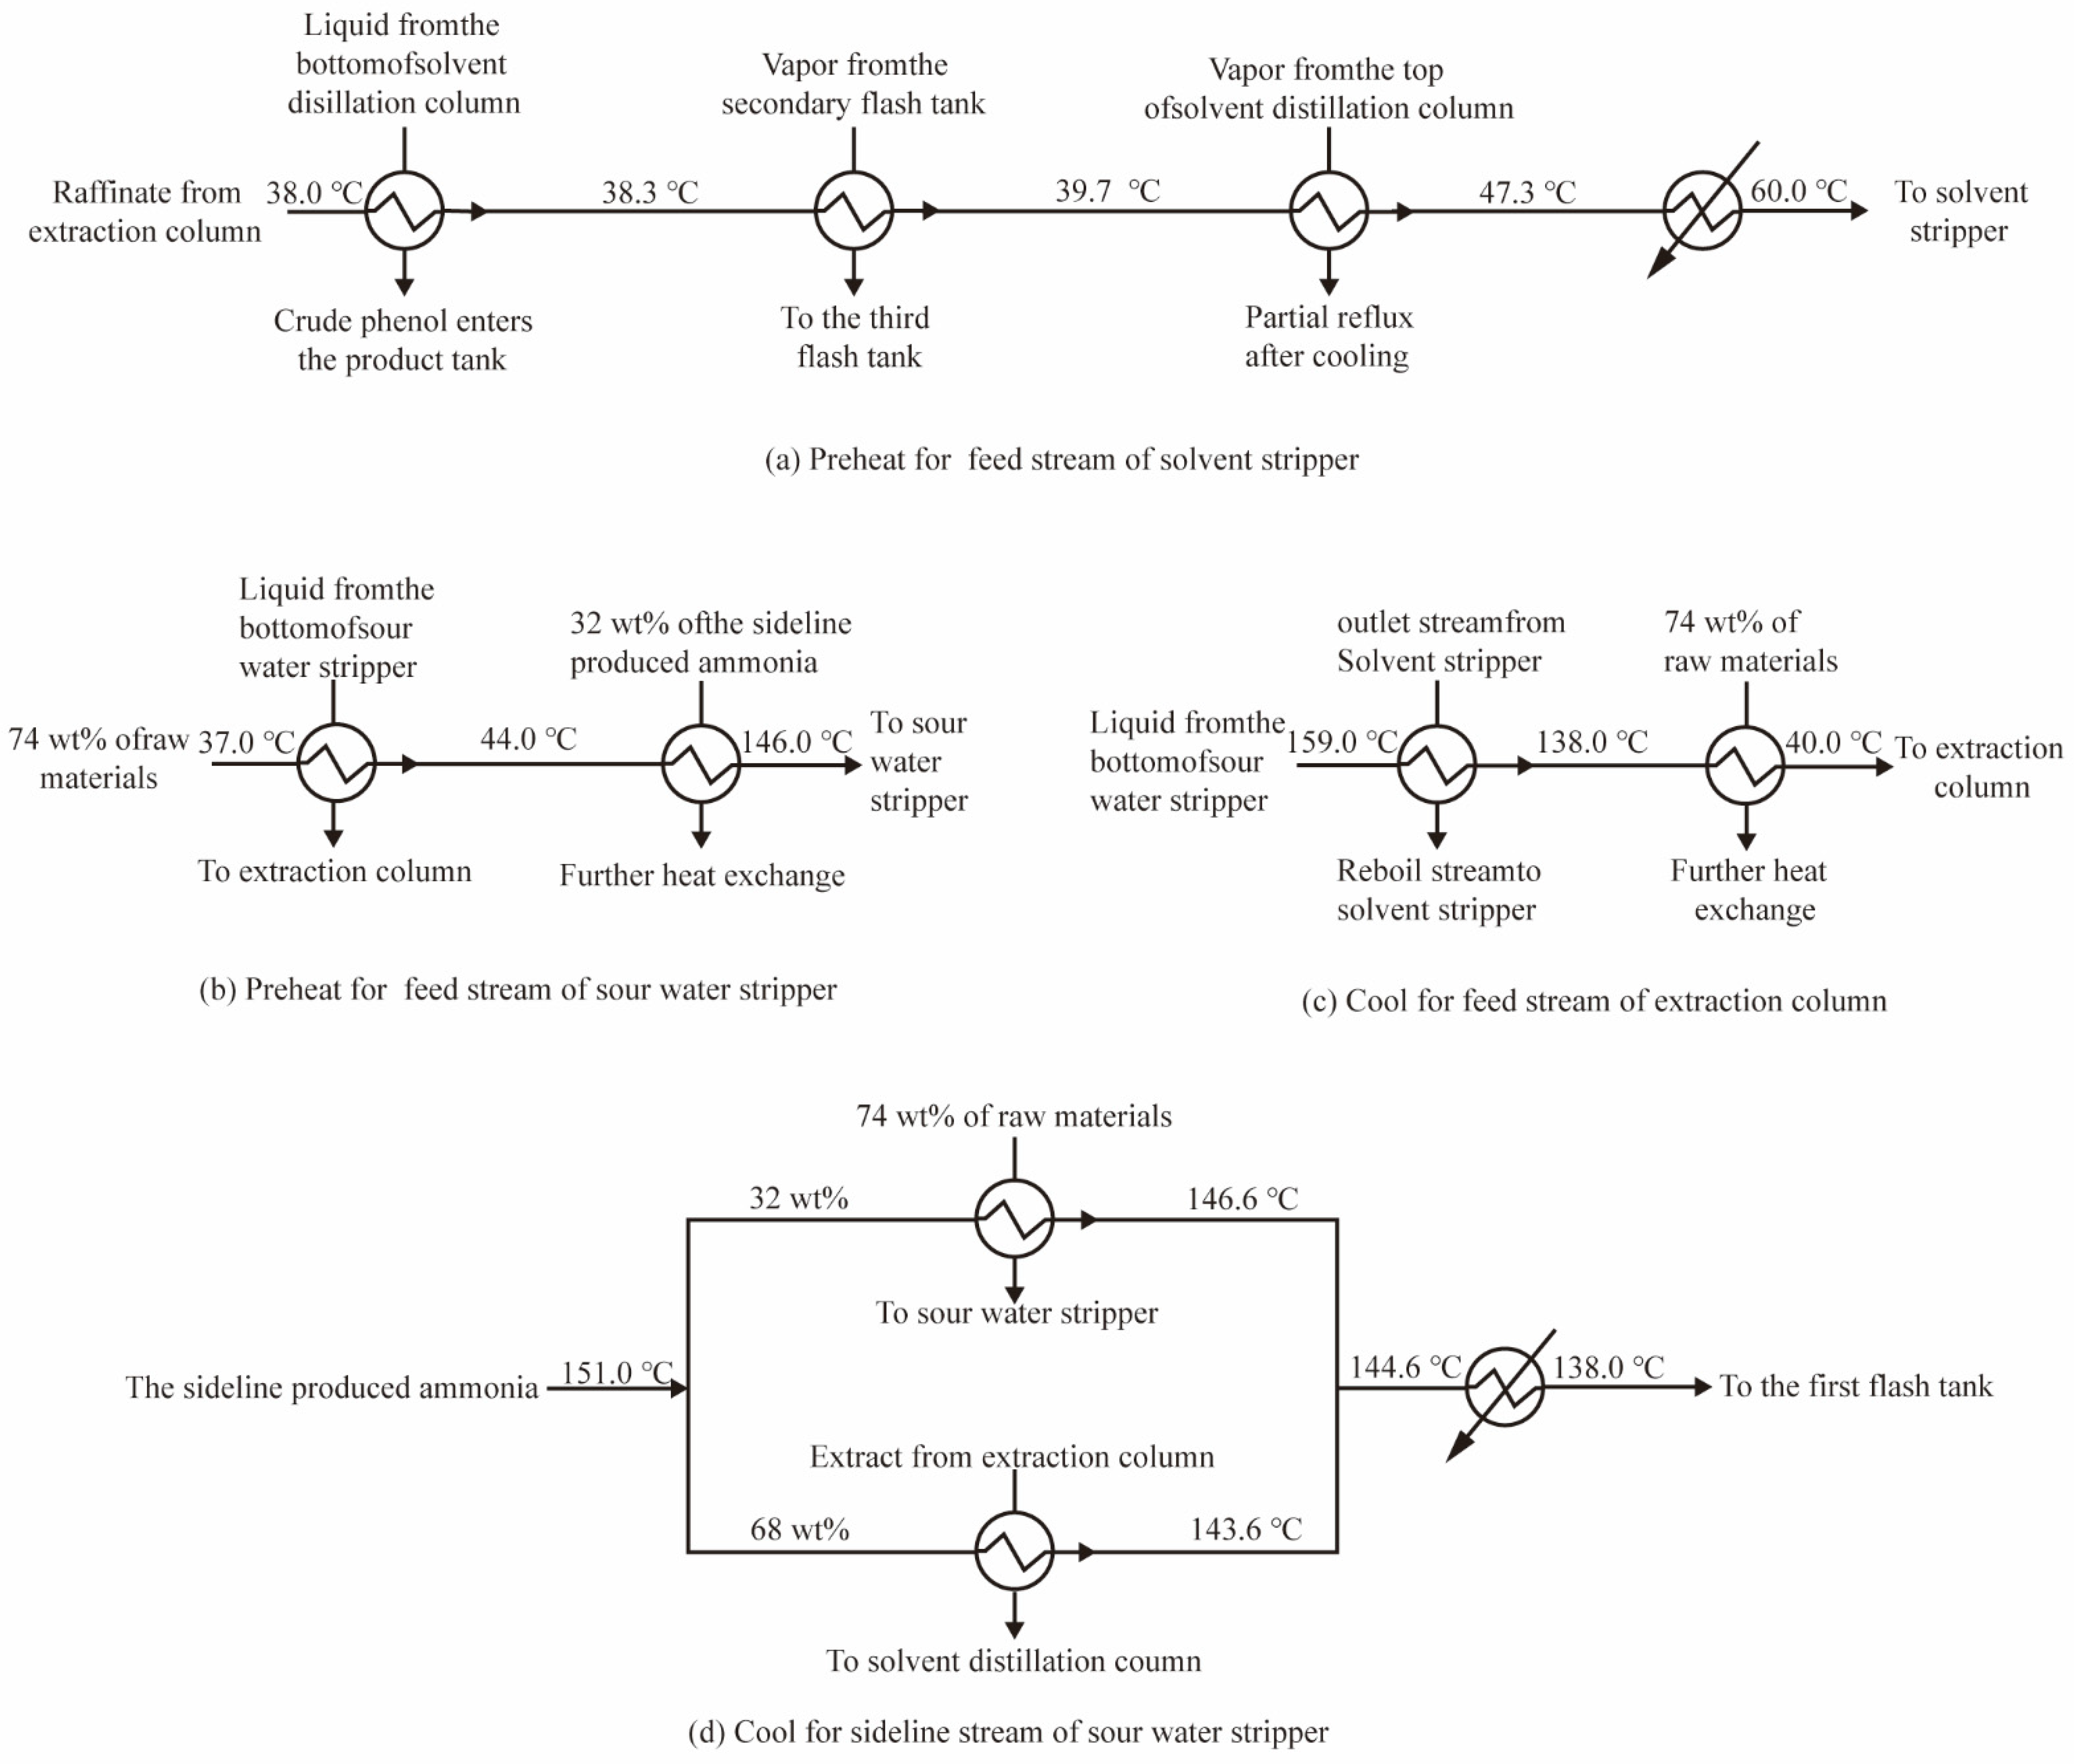
According to the obtained heat exchanger network structure, the process simulation of phenols ammonia recovery process of coal gasification wastewater with heat exchanger network structure was completed on Aspen Plus. The schematic diagram of the heat exchanger network streams direction is shown in
Figure 10.
The main streams of the heat exchanger network are divided into four routes.
- (a)
The extracted residue from the extraction column was heat exchanged with the bottom discharge of the solvent distillation column, the gas phase from the second flash tank, and the gas phase discharge from the top of the solvent distillation column, and then heated to 60 °C by the auxiliary heater and fed into the solvent stripper.
- (b)
The raw material is divided into 74 wt% and heated to 146 °C by heat transferring with the bottom discharge of the sour water stripper and the ammonia-containing gas extracted from the side line, and then fed into the sour water stripper as hot feed.
- (c)
The bottom wastewater discharge from the sour water stripper provides heat for the reboiling flow of the solvent stripper, and then cools down to 40 °C through the hot feed stream.
- (d)
The ammonia-containing gas extracted from the side line is divided into two streams through the splitter, one of which is heat exchanged with the raw material hot stream, and the other is heat exchanged with the extract of the extraction column. Two streams are combined after the heat exchange is completed and enter the first flash tank.
The parameter optimization and unoptimized heat integration process comparison is shown in
Table 7.
On the premise of considering the optimization of process parameters, the heat integration of the phenols and ammonia recovery process of coal gasification wastewater can further obtain greater room for improvement on the basis of conventional heat integration. The new heat integration process not only saves 18.2% of equipment costs, but also greatly improves the heat transfer matching between streams, which reduces the total utility consumption by 14.3%. In general, the new heat integration solution can further save 15.1% of the total annual cost compared with the conventional heat integration solution. The heat integration scheme has provided guidance for the optimization of the phenols and ammonia recovery process.
5. Conclusions
In conclusion, the present work explored the heat integration of the phenols and ammonia recovery process from coal gasification wastewater considering the changes in process parameters. The simulation and optimization of this process were carried out using Aspen Plus. A programming method for heat exchanger network synthesis based on hybrid genetic algorithm was established by Matlab, which can optimize process parameters and heat integration simultaneously.
Based on the stream information obtained from Aspen Plus simulation, the heat integration process of phenols and ammonia recovery process is designed and optimized by combining it with the heat exchanger network optimization. Taking the total annual cost after heat integration as the objective function, the following process parameters are optimized: the hot feed temperature and cold/hot feed ratio of the sour water stripper, the set temperature of the three-step partial condensation system, the feed temperature and column pressure of the solvent distillation column and the solvent stripper. The results show that the total annual cost after heat integration is the lowest when the cold-to-hot feed ratio is set to 0.15, the hot feed temperature of sour water stripper is set to 146 °C, the temperature of the three-step partial condensation system is set to 138/106/40 °C, the feed temperatures of the solvent stripper and solvent distillation column are 85/120 °C, and the column pressures are 0.8/1.2 atm. Compared with the conventional heat integration process, the total energy consumption is reduced by 14.3%, and the equipment cost is reduced by 18.2% in the new heat integration process. In a comprehensive analysis, its total annual cost was reduced by 15.1% compared with the original heat integration process.
Two principles of simultaneously optimizing heat integration and process parameters for chemical processes with column equipment are summarized by the proposed heat integration optimization method. According to these two principles, it is expected to further optimize the large-scale chemical processes with preliminary heat integration, thereby providing theoretical guidance for the economic and environmental development of large-scale chemical processes.


