

CVT for a Small Electric Vehicle Using Centrifugal Belt Pulley
Department of Mechanical Engineering, Chung-Ang University, Seoul 06974, Republic of Korea
*
Author to whom correspondence should be addressed.
Energies 2022, 15(23), 8800; https://doi.org/10.3390/en15238800
Submission received: 19 September 2022
/
Revised: 14 November 2022
/
Accepted: 16 November 2022
/
Published: 22 November 2022
(This article belongs to the Topic Designs and Drive Control of Electromechanical Machines)
Abstract
:In a conventional continuously variable transmission (CVT), the belt slides up and down along the slope of the pulley to shift gears. Efficiency is reduced because of slippage from the shifting of the belt. In this study, the centrifugal belt pulley for CVT were investigated. Instead of applying the belt slip method, a rail groove was machined on the side of the pulley, and a push piece pushed the belt up by centrifugal force along the rail groove. The CVT was designed and manufactured using this mechanism. A CVT tester was manufactured to validate the performance of the proposed transmission. The suitability of the CVT was verified through structural analysis.
1. Introduction
A transmission is a device that modifies the speed and output of a vehicle by changing the number of revolutions of the power source [1,2]. They are usually classified into manual, automatic, and continuously variable transmissions (CVT) based on the operation method. A manual transmission is a device that allows the driver to shift gears based on the driving conditions to provide the necessary driving force and speed [3,4]. An automatic transmission is a device that automatically shifts gears in the transmission control unit (TCU) by determining the shift stage according to driving conditions [5,6,7]. Rubber belt CVT is used in a variety of off-road and on-road recreational vehicles [8,9]. Hybrid electric vehicles (HEVs) are equipped with CVTs [10,11]. In manual and automatic transmissions, shift shocks occur when the gears do not mesh during the shift process, resulting in a drop or sharp increase in output [12,13]. A CVT is a device that can shift to a different gear ratio without changing gears, unlike in a manual or automatic transmission. Because the CVT changes gears smoothly, there is no shift shock or power reduction during the shifting process [14,15,16].
A CVT with a belt pulley system is used in automobiles. Metal and rubber belts are usually used in light vehicles. In the wet method, oil is sprayed between the transmission and belt to resolve belt slippage and heat problems [17,18,19]. As described above, the CVT shifts gears by sliding the belt and the shift pulley, which causes power loss during the shifting process and generates severe heat in the belt and the shift pulley. Therefore, in contrast to the sliding transmission method of the belt and pulley during the shifting process, this study developed a CVT in which the outer diameter of the pulley was changed.
In a conventional CVT with a belt pulley, the pulley moves along the axial direction, and the belt slides up and down to change its speed. However, in the variable-diameter pulley of the CVT, rail grooves corresponding to the rotational direction were machined on both sides of the pulley, and a push piece generated centrifugal force along the rail grooves to change the outer diameter and speed of the pulley. Therefore, the shifting performance was determined by the angle and shape of the rail groove machined on the pulley plate.
In this study, Fortran and basic programs were used to analyze the movement of the push piece in the rail groove of the plate, and to design the rail groove. The shape and angle of the rail were selected to calculate the rail curve. A performance test of the CVT using the optimized centrifugal belt pulley method was conducted. In addition to the actual vehicle installation test, the CVT housing was fabricated such that the CVT could be installed without interfering with the differential gear and the motor in the actual vehicle. Finally, a driving tester was manufactured, and the durability was tested under uphill and unpaved road conditions to verify driving durability.
2. Principle of Shift Motion of a Centrifugal Belt Pulley
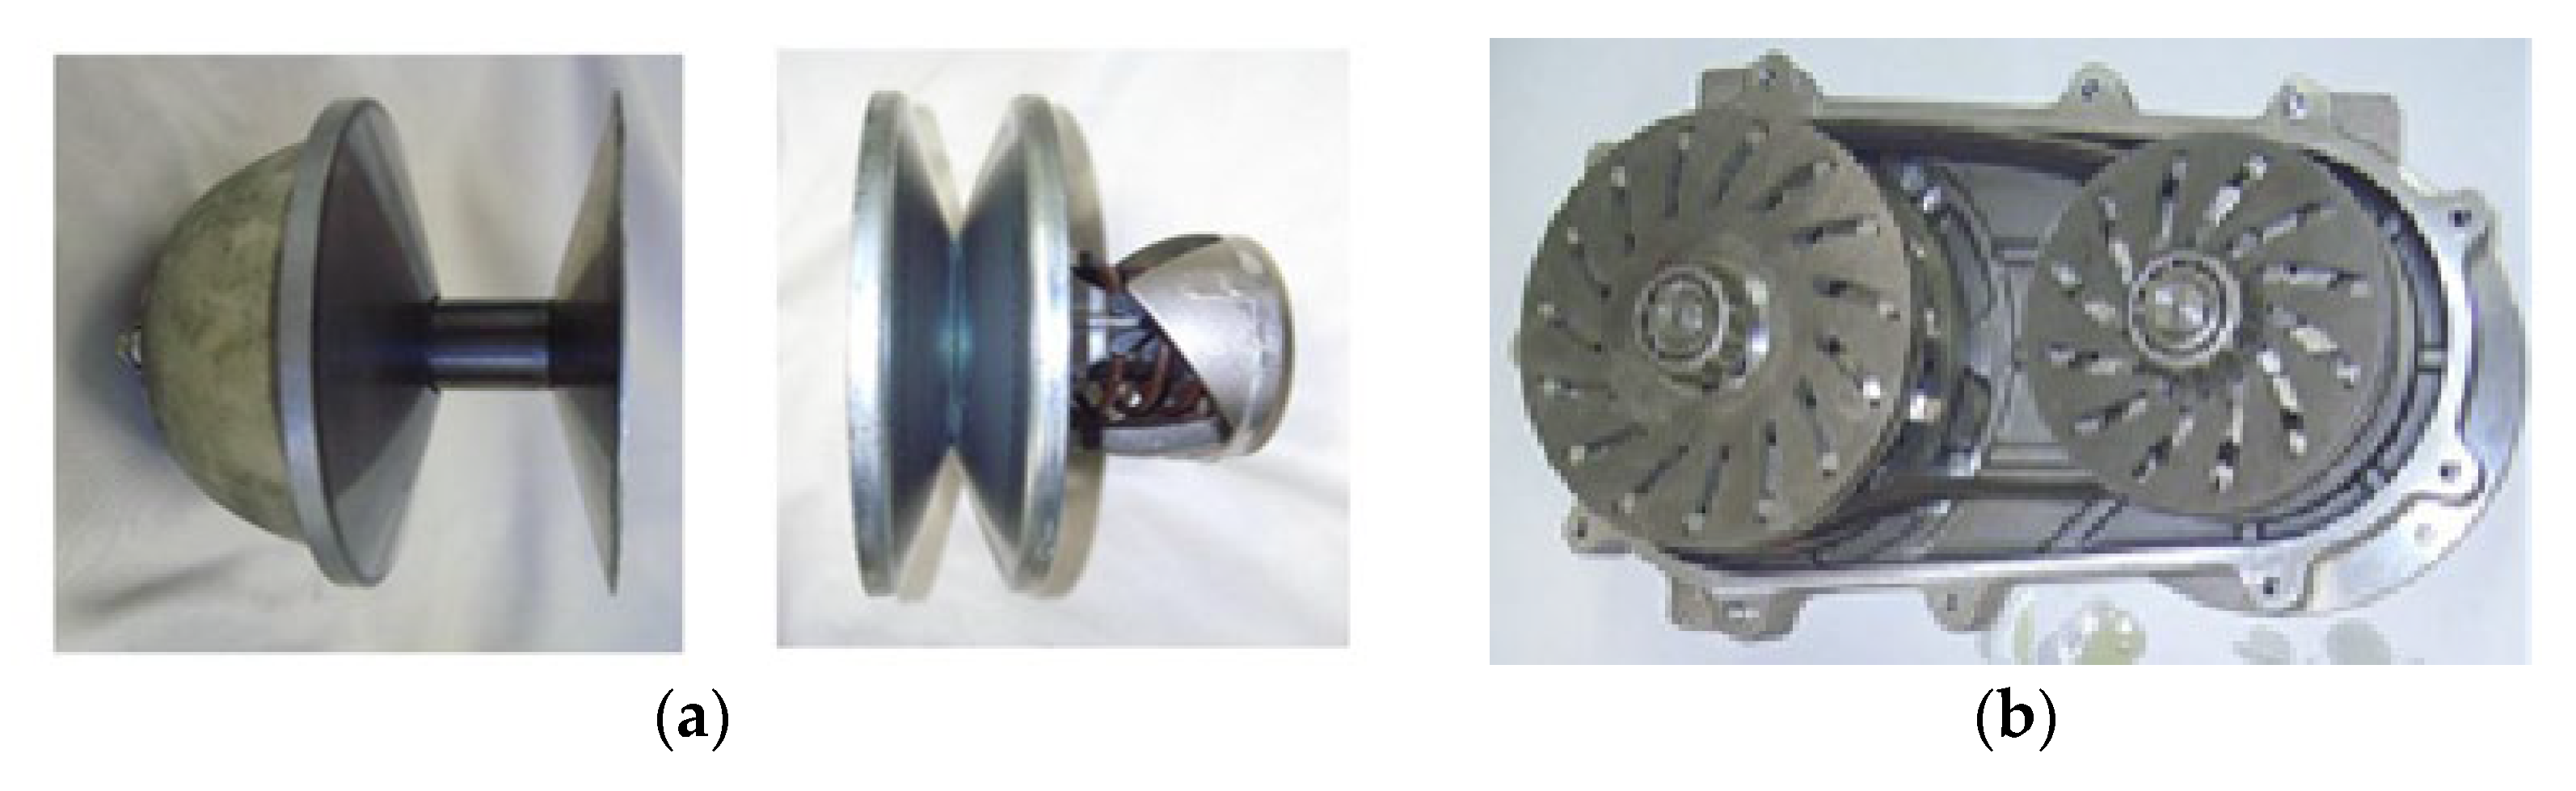
Figure 1 shows a manufactured pulley for ease of explanation and understanding.
The pulley in Figure 1a shows the CVT commonly used in micro-mini vehicles. This CVT is primarily used in vehicles with internal combustion engines. The belt slides up and down along the slope of the pulley to change the radius of the circle and speed.
The pulley in Figure 1b contains multiple parts. The belt is placed on the components. The speed is varied using centrifugal force to expand and contract these components.
Figure 1a shows that the belt slides along the slope of the pulley to shift gears in a conventional electric vehicle. Frictional heat is generated, and the efficiency decreases owing to slip shifting. In this study, a centrifugal belt-type CVT without belt slippage was designed and manufactured, as shown in Figure 1b.
2.1. Principle of the Centrifugal Belt-Type CVT
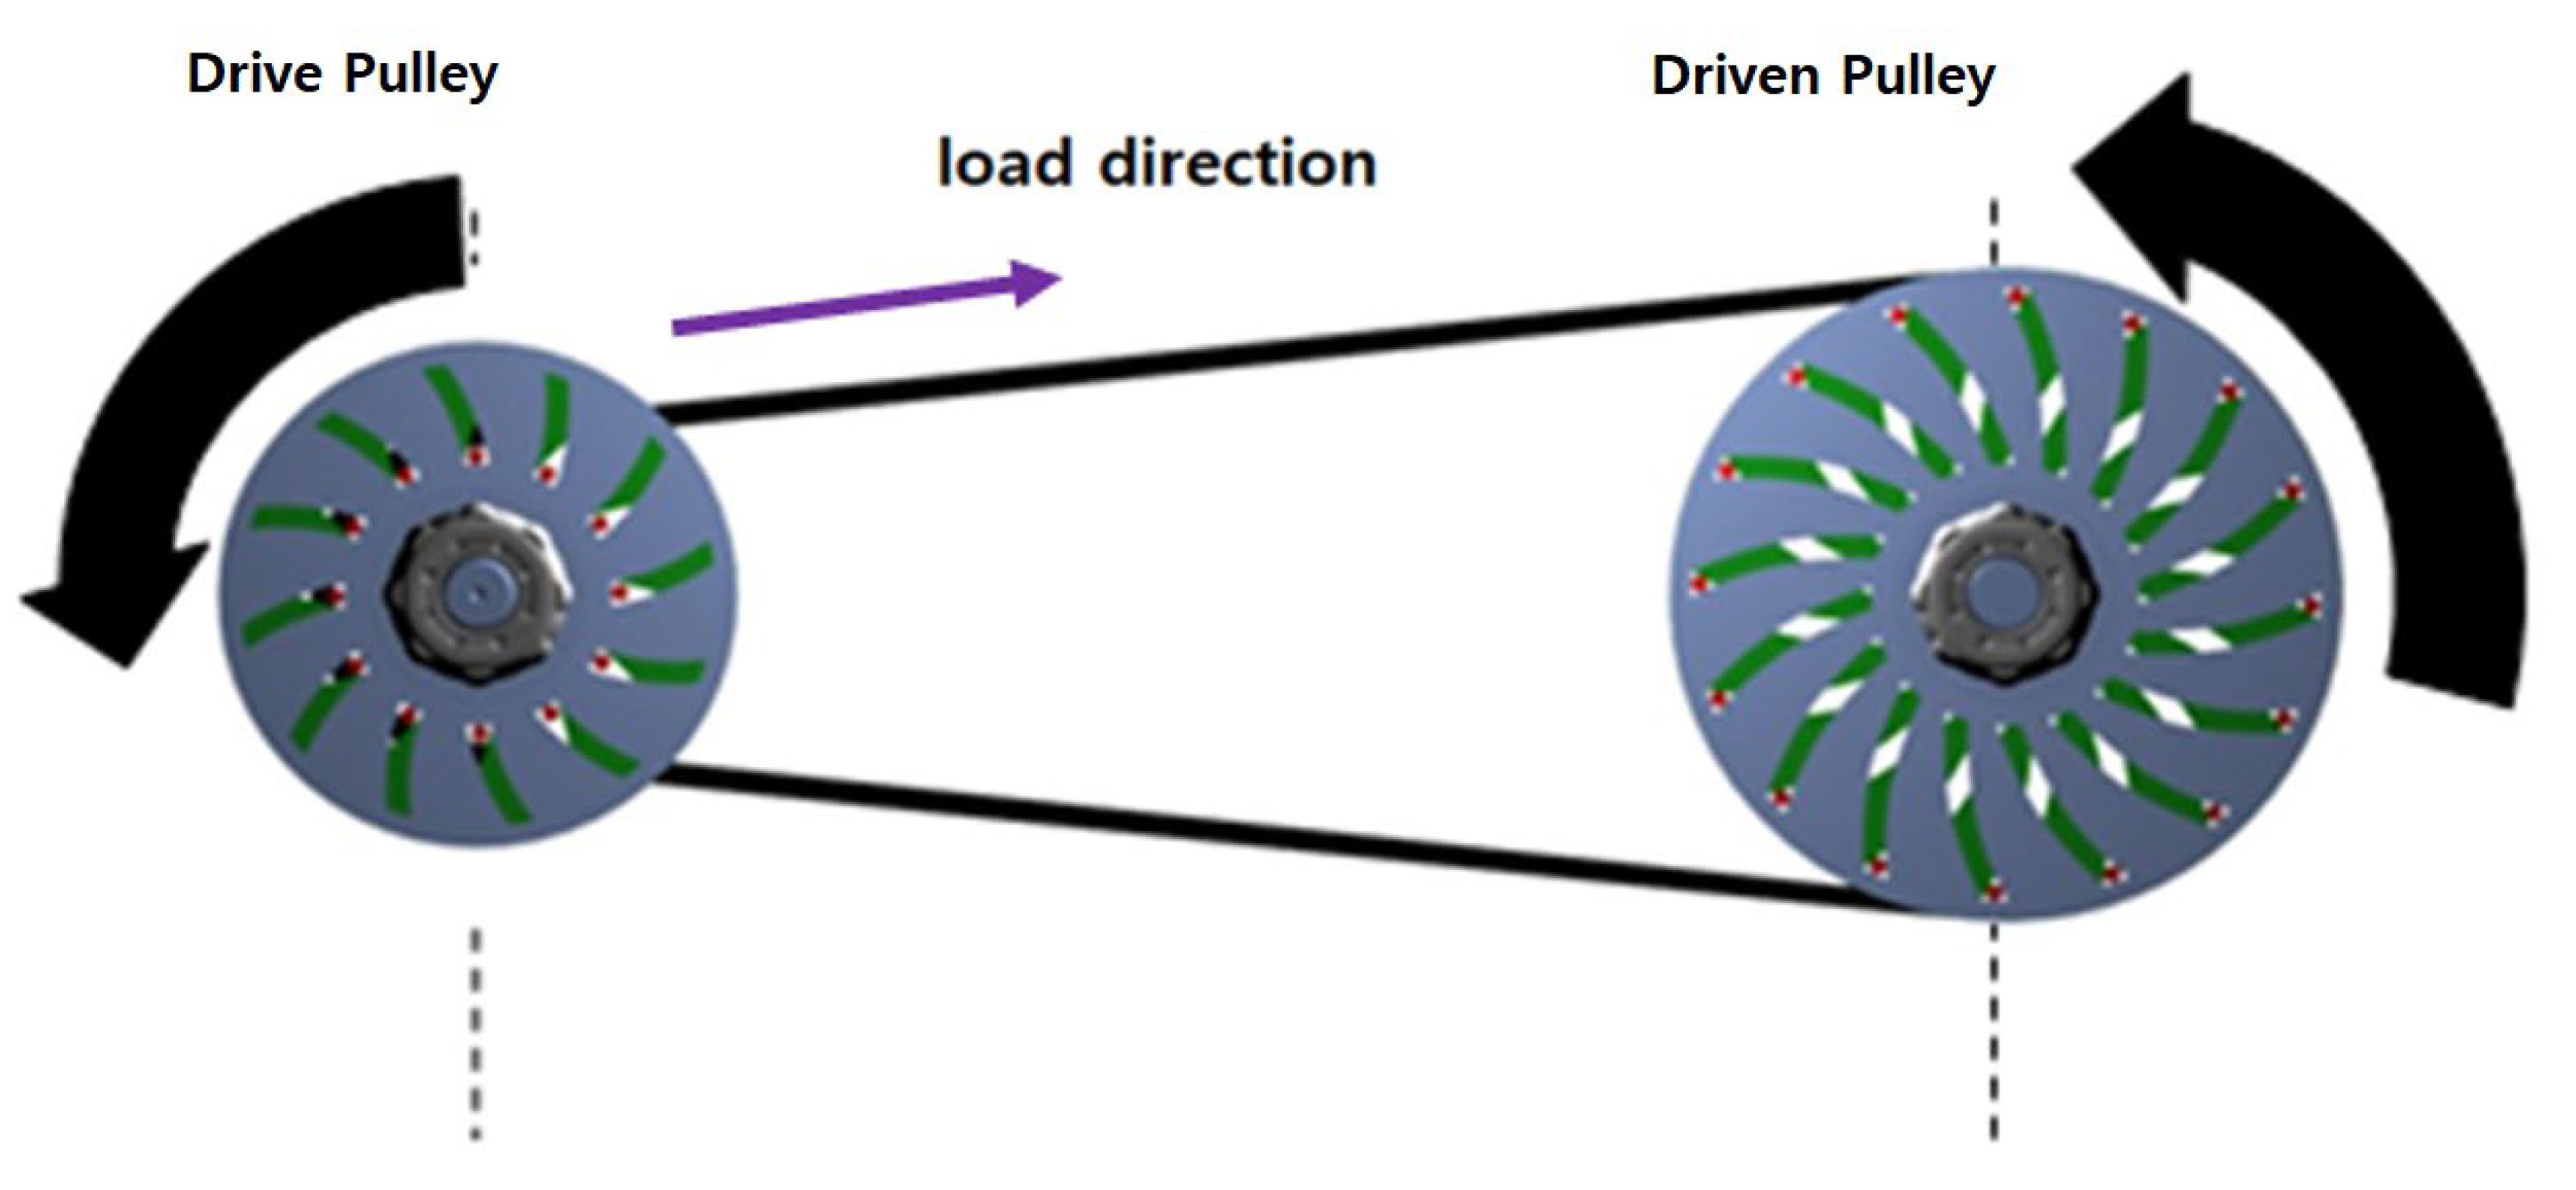
Figure 2 shows the slide plate coupled to the drive shaft rotates when the drive pulley rotates in the stationary state. As it rotates slowly, the push piece expands gradually, owing to the centrifugal force.
When there is a “load” on the wheel, the “load” generates a pulling force on the belt in a direction opposite to the direction of rotation of the drive pulley. The pressing piece was contracted (moved downward) in the direction of the slide plate’s rail.
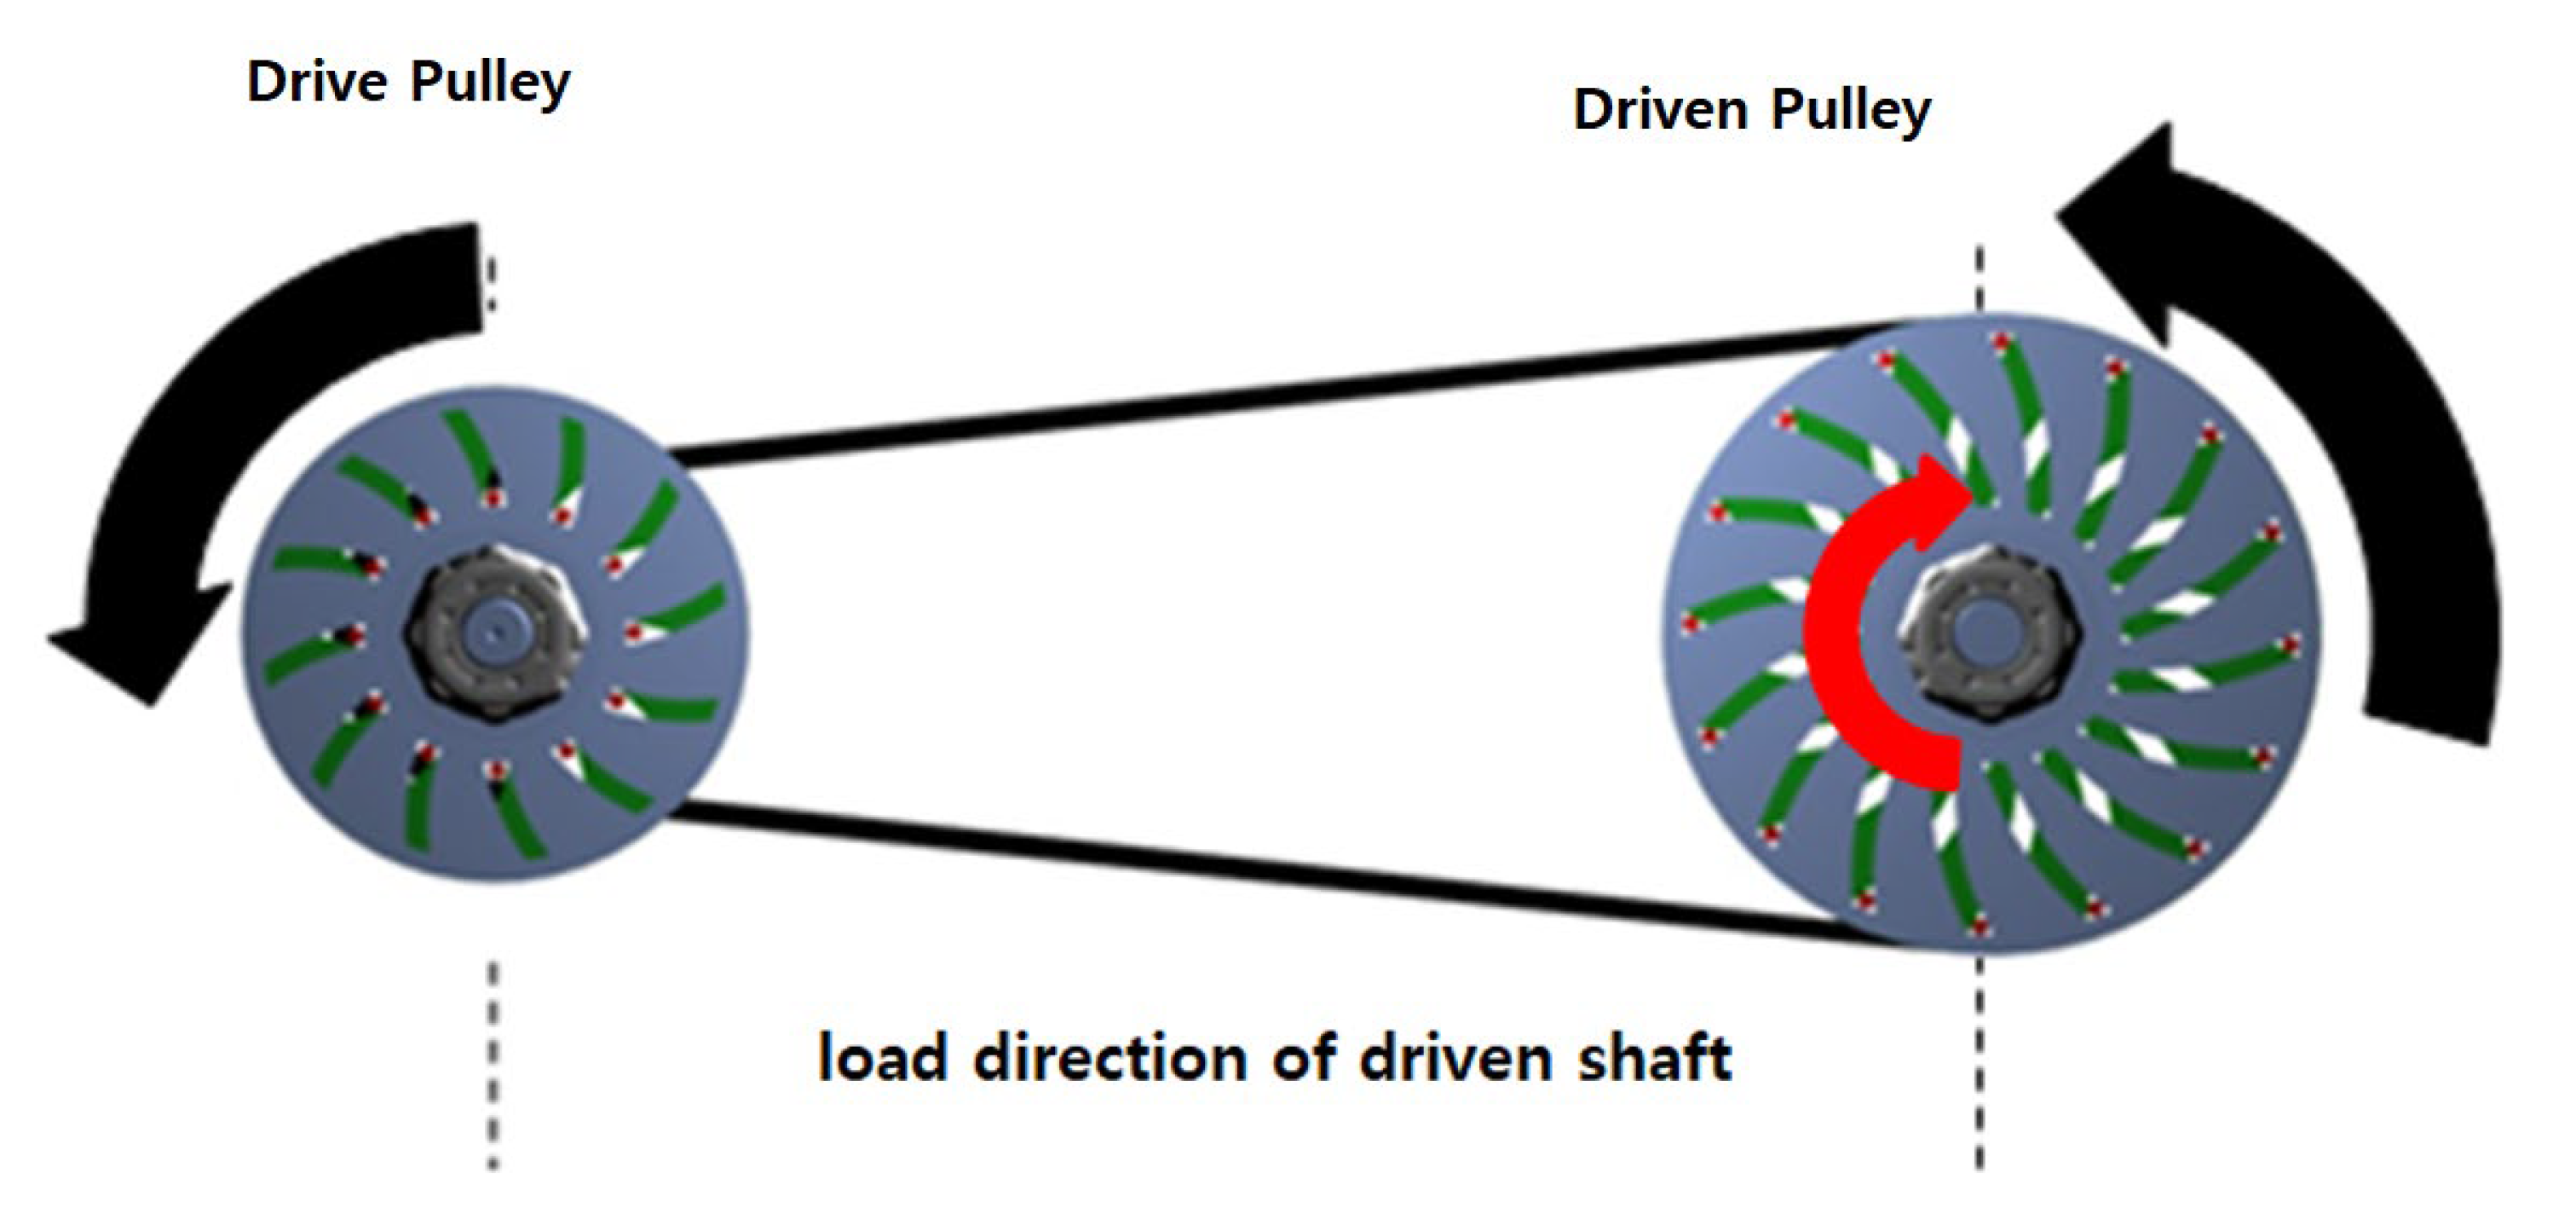
Figure 3 shows in the driven pulley, when the push piece rotates in the expanded state, the slide plate rotates along with the push piece. The slide plate was coupled to the driven shaft to reduce the output. Then, if a load is applied to the wheel and the driven shaft does not rotate in a direction opposite to the rotational direction, the slide plate expands according to the rail direction. The expansion range of the push piece expands to the same extent as that of the driven load.
Design Condition of Centrifugal Belt-Type CVT
The centrifugal force at the maximum rotational speed of the drive pulley (maximum expansion state) must be greater than or equal to the magnitude of the centrifugal force and spring tension at the maximum rotational speed of the driven pulley (minimum contraction state):
drive pulley F ≧ driven pulley F + spring tension.
3. Centrifugal Belt Slide Plate Design Simulation
In a CVT with a centrifugal belt pulley, the gear ratio is selected based on the size of the outer diameter during the contraction and expansion of the pulley. The length of the rubber belt is selected based on the distance between the gear ratio and the shaft of the pulley. Similar to the principle of the sliding belt CVT, the shape of the rail plate is critical, because the speed change is based on the shape of the slide plate and guide plate. Therefore, two types of rails were designed and compared to determine the optimal deceleration efficiency according to the plate shape.
In this study, the movement of the push piece was calculated based on a 4 kW electric vehicle’s CVT design. The driving force for the electric vehicle was supplied to the rear wheel via a 10:1 reducer and differential gear.
However, an excessive load on the battery and inverter initially occurred when driving uphill or at high speeds.
Therefore, to reduce the load on the motor during the initial operation, the belt length was calculated by setting the reduction ratio to 3:1 when the diameter of the drive pulley was extended from the minimum contracted state to the maximum state of the driven pulley.
The minimum diameter of the driven pulley was determined by calculating its belt length and the diameter of the drive pulley. The outer diameter of the driving plate was Ø122 mm, the diameter when contracted was Ø52 mm, the diameter when expanded was Ø109 mm, and the number of rail grooves was set at 12. The diameter of the driven plate was set at Ø167 mm, the diameter when expanded was Ø156 mm, and the diameter when contracted was Ø109 mm for contraction, with 16 rail grooves to form a smooth circle.
The final gear ratio was 3:1, and an initial driving force with a reduction ratio of 30:1 was provided.
Center distance: 175 mm
Belt length:
Spring constant: 0.498
Drive piece gross weight:
0.0314 kg × 12 = 0.3768 kg
Driven piece gross weight:
0.0108 kg × 16 = 0.1728 kg
The Excel sheet listed in Table 1 below contains the formulas given above as the primary design data. The initial design value was entered in the Excel sheet to calculate the remaining values. The design was carried out based on these values.
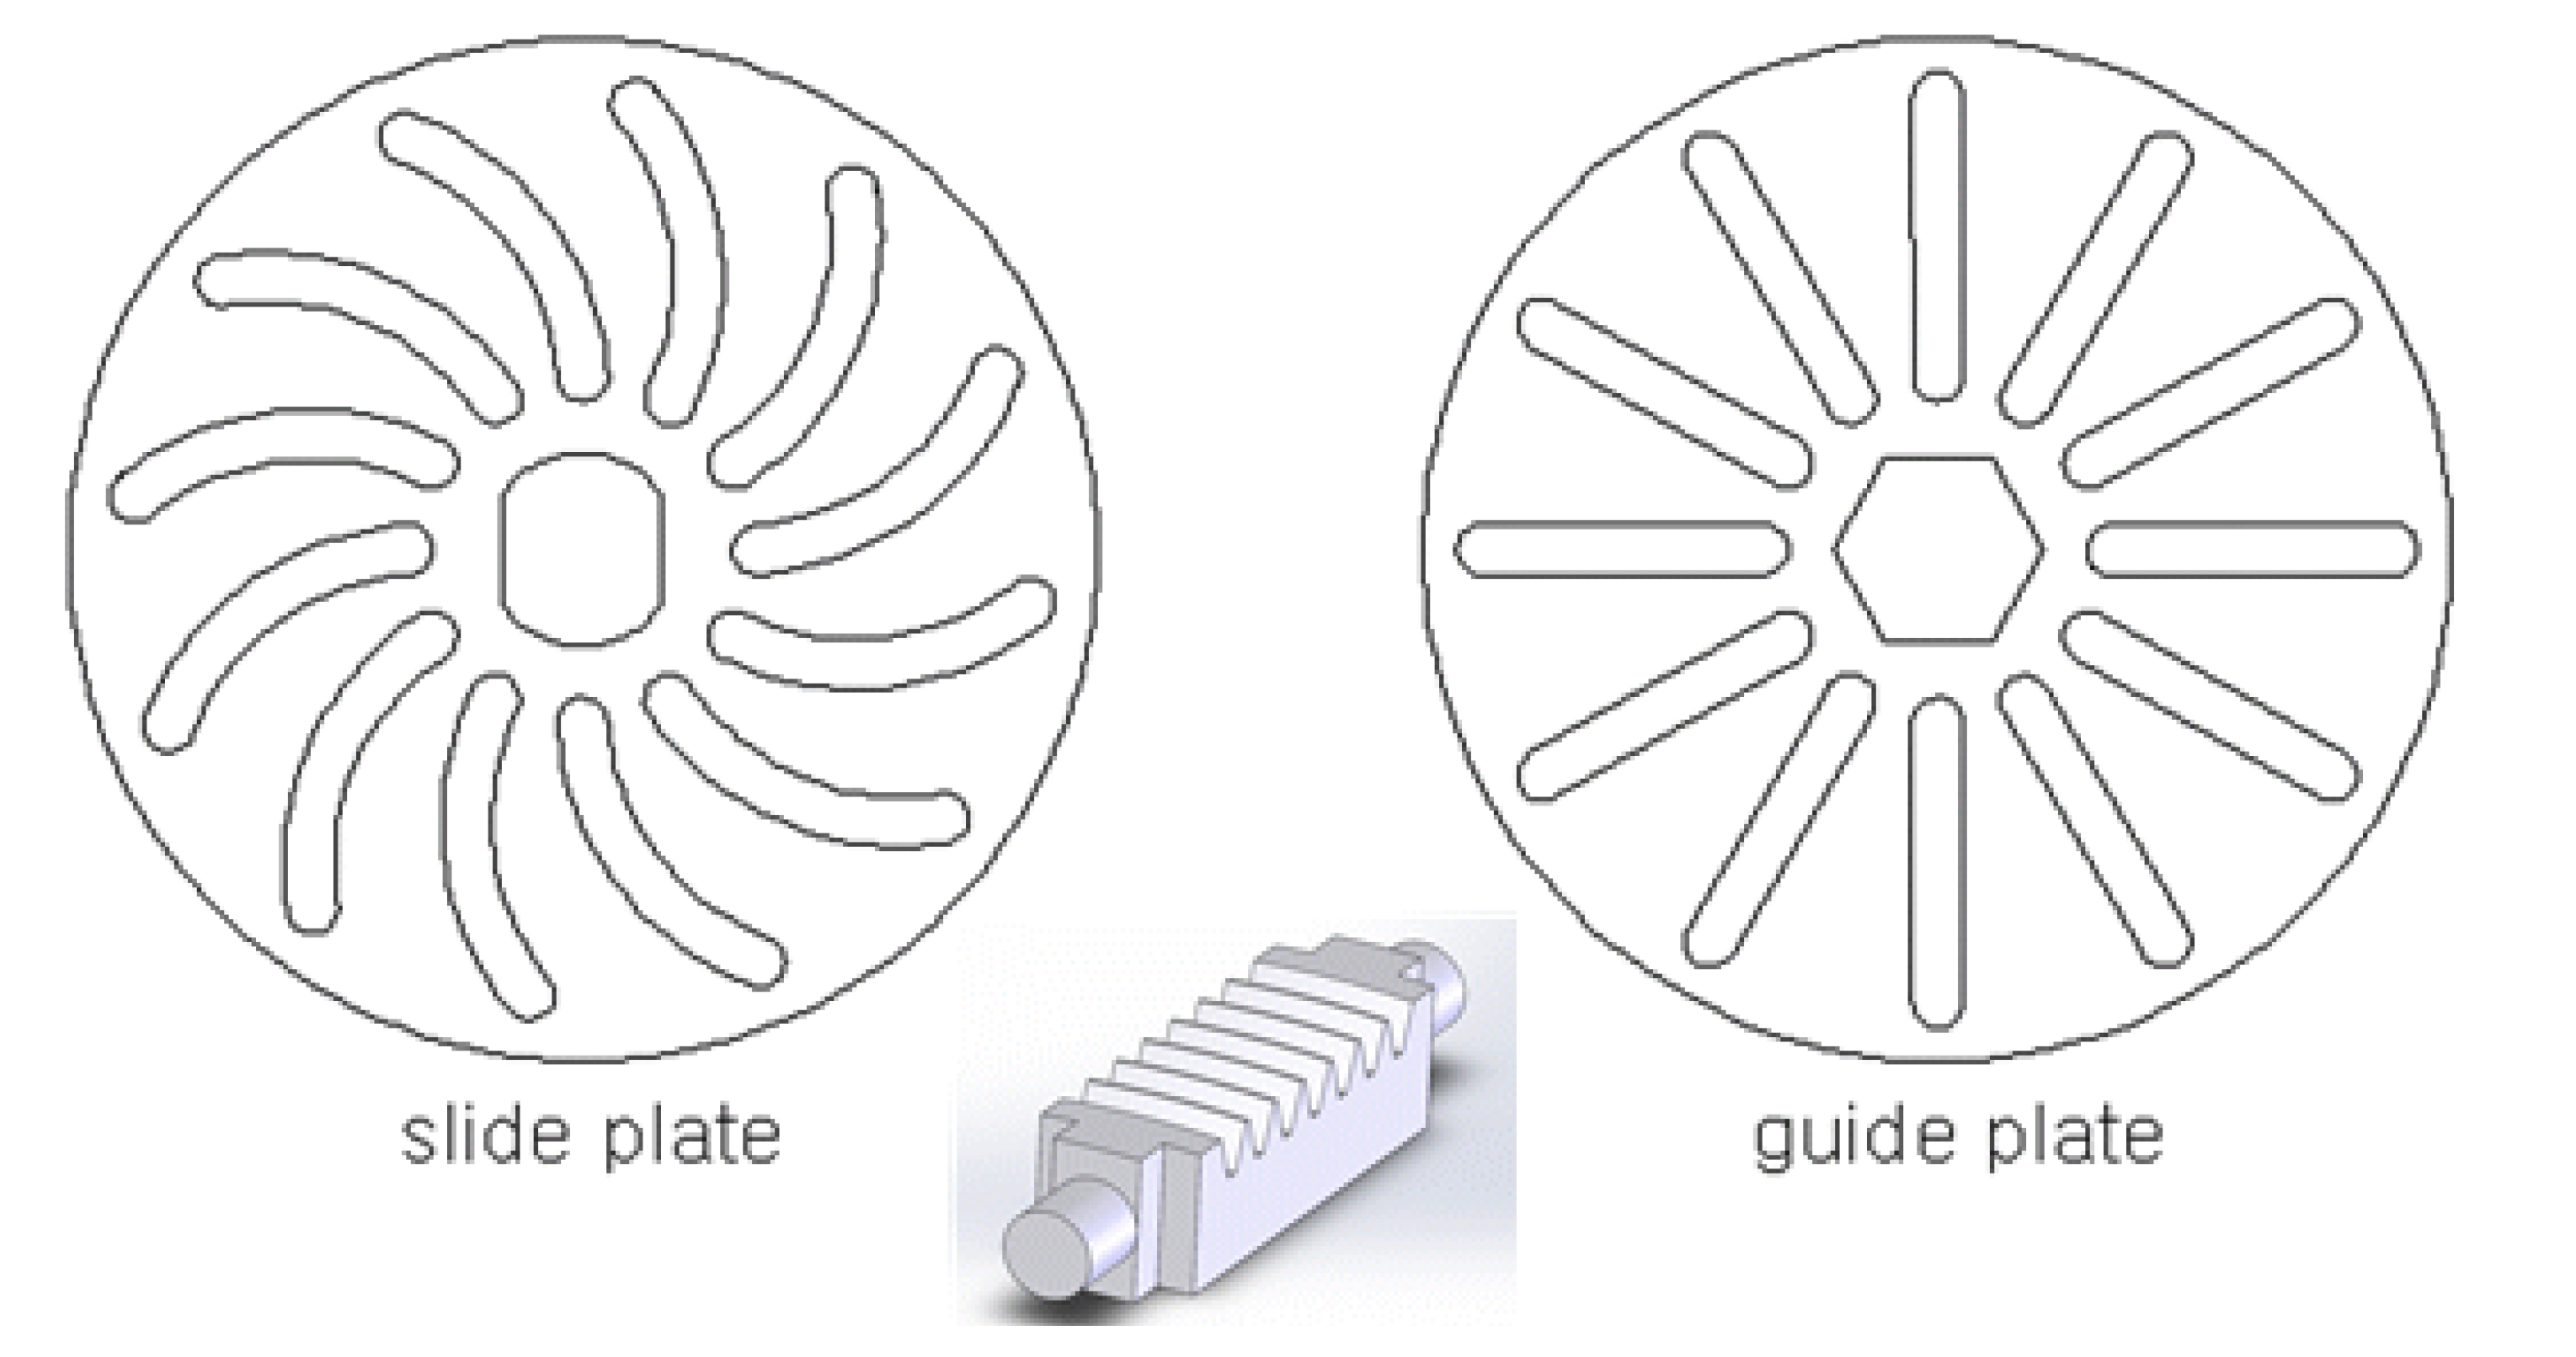
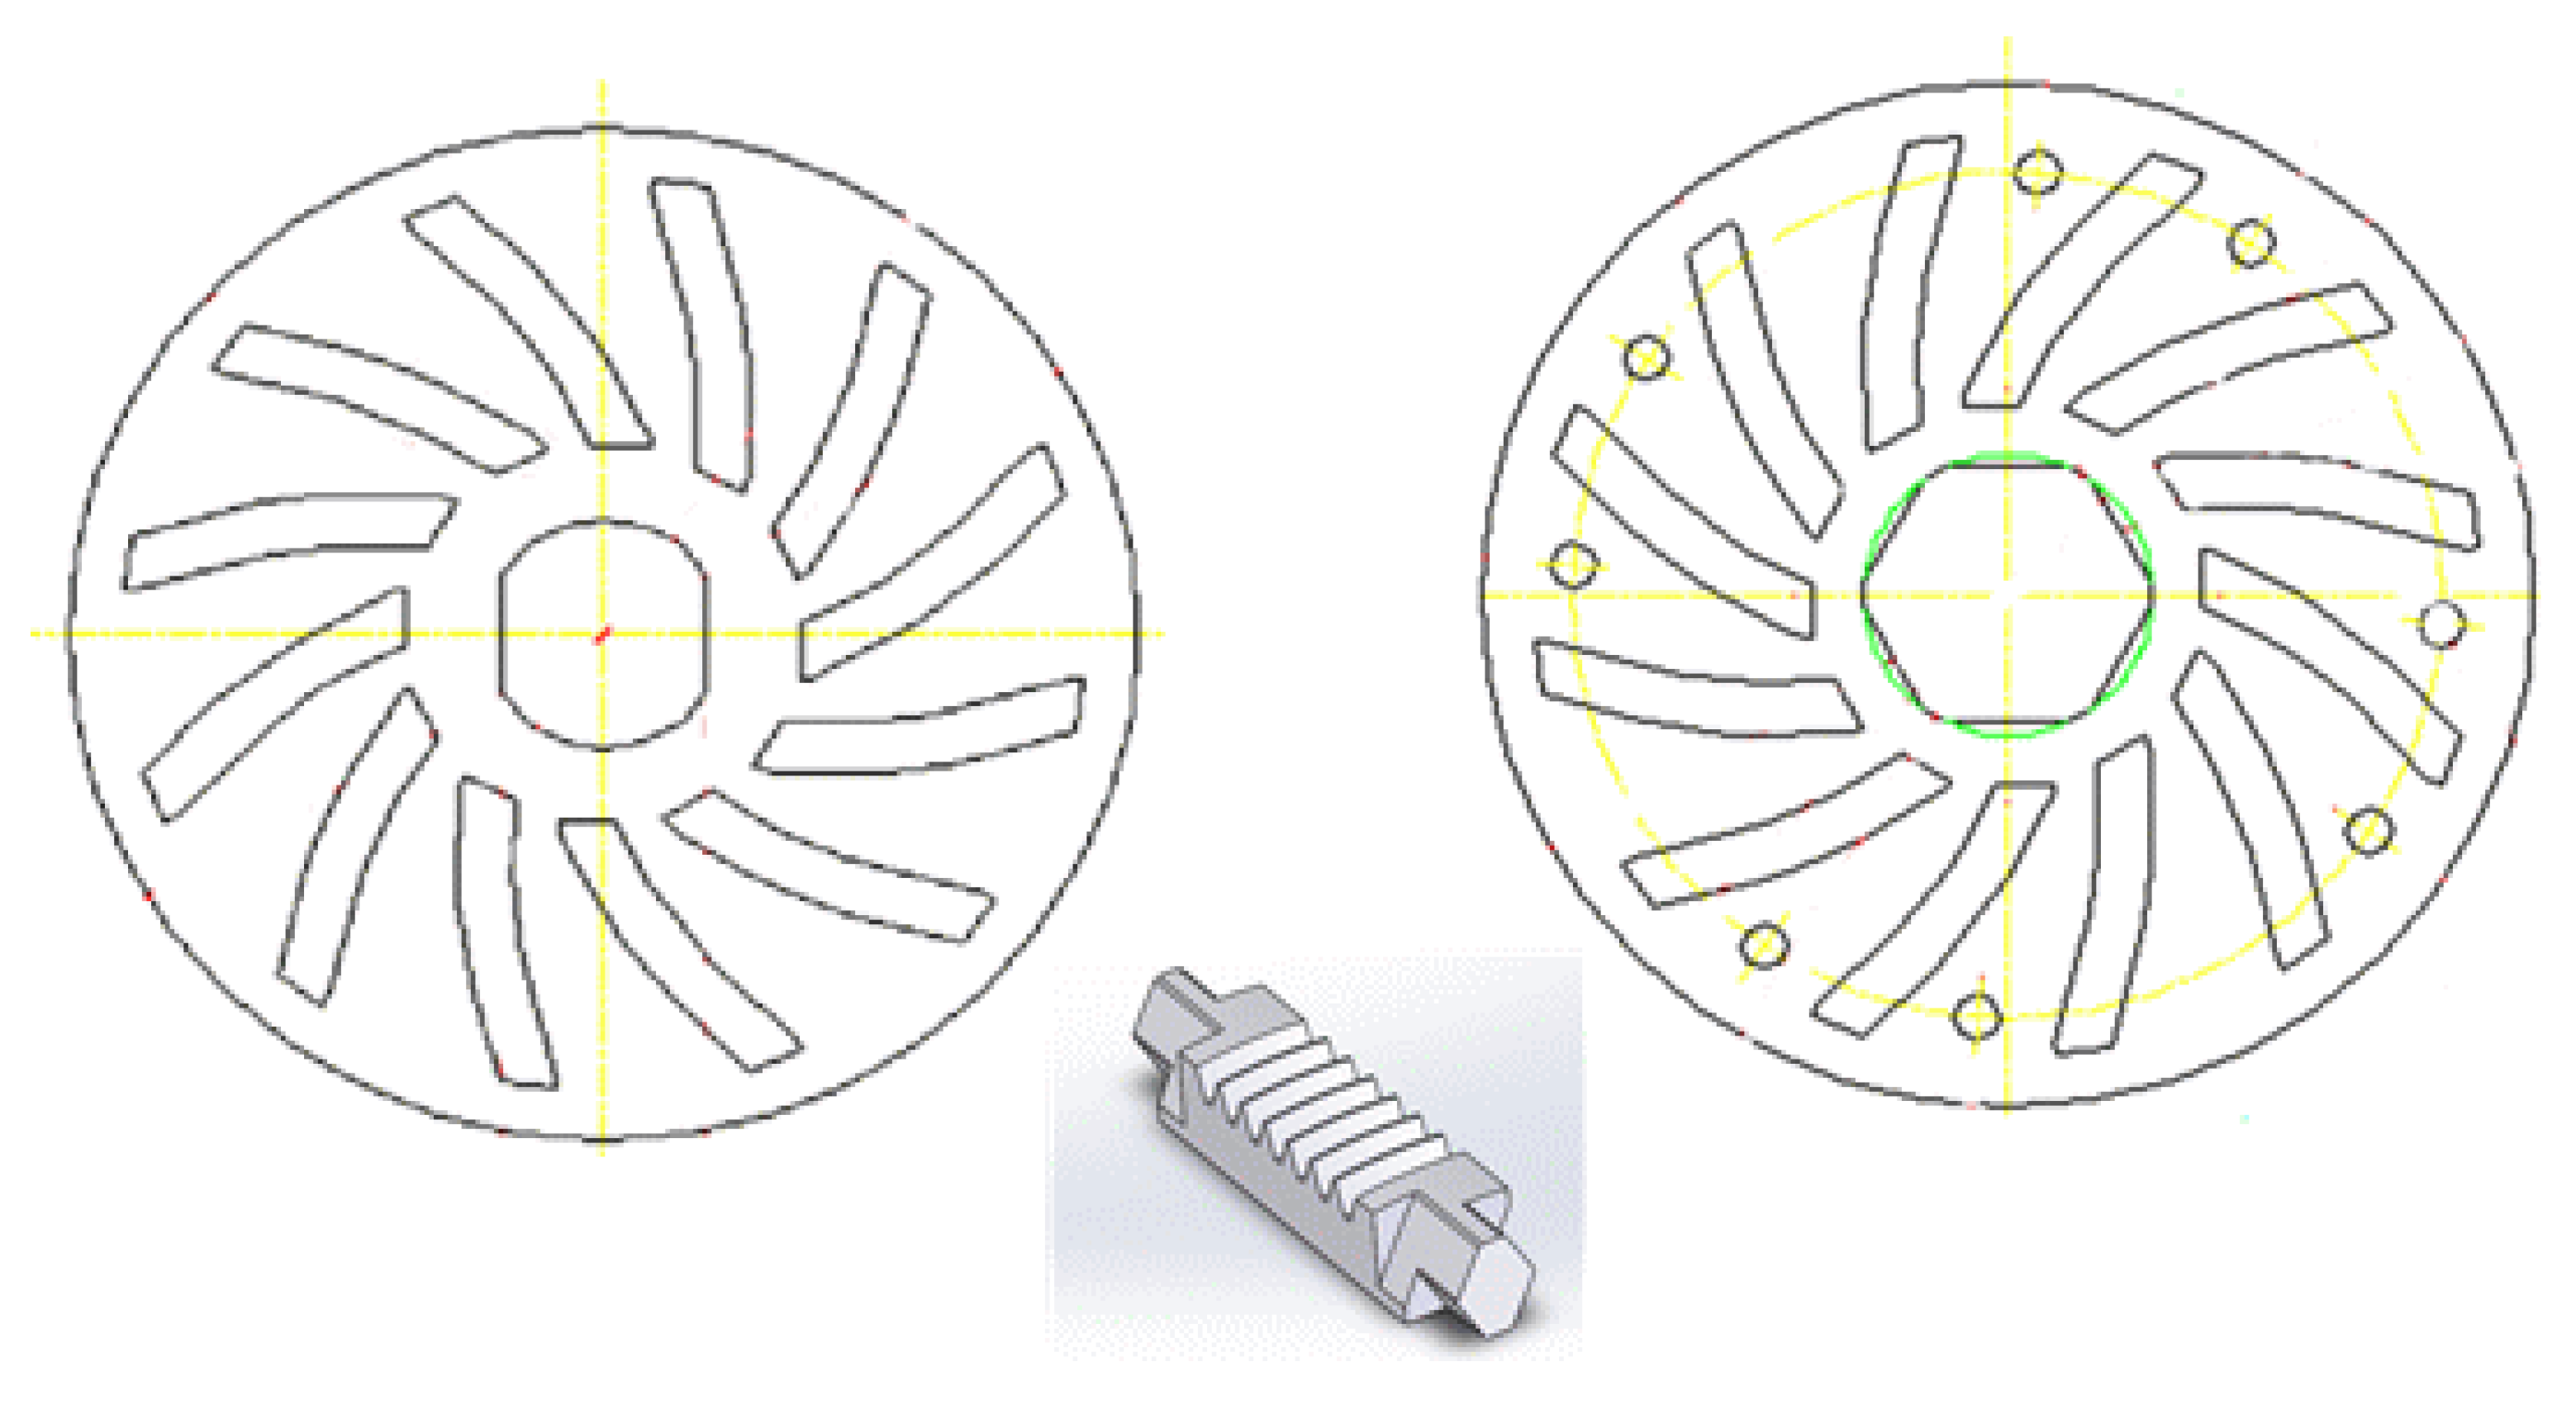
Two types of slide and guide plates were designed to compare the shift characteristics according to the shape of the plates.
The conventional design method is to design the rail groove of the guide plate as a straight line and the curves of the slide plate as a regular curve.
Another approach is to design the rail grooves of the slide plate and guide plate as a spline curve such that the part where the belt of the push piece is caught always faces upward.
Figure 4 shows that the spline curve is designed as a curve with normal “R” values.
When designed as a regular curve, a push piece moves along the rail and lies down. Therefore, the rail of the guide plate was designed as a straight line for multiple pieces to move simultaneously.
Figure 5 shows the slide plate and guide plate rail curves designed as spline curves. A spline curve is designed so that a piece moving along the rail can always move to the same position. The added benefit is that the guide plate and the slide plate can be processed simultaneously, even when processing the plate rail.
Analysis of the Behavior of Push Piece
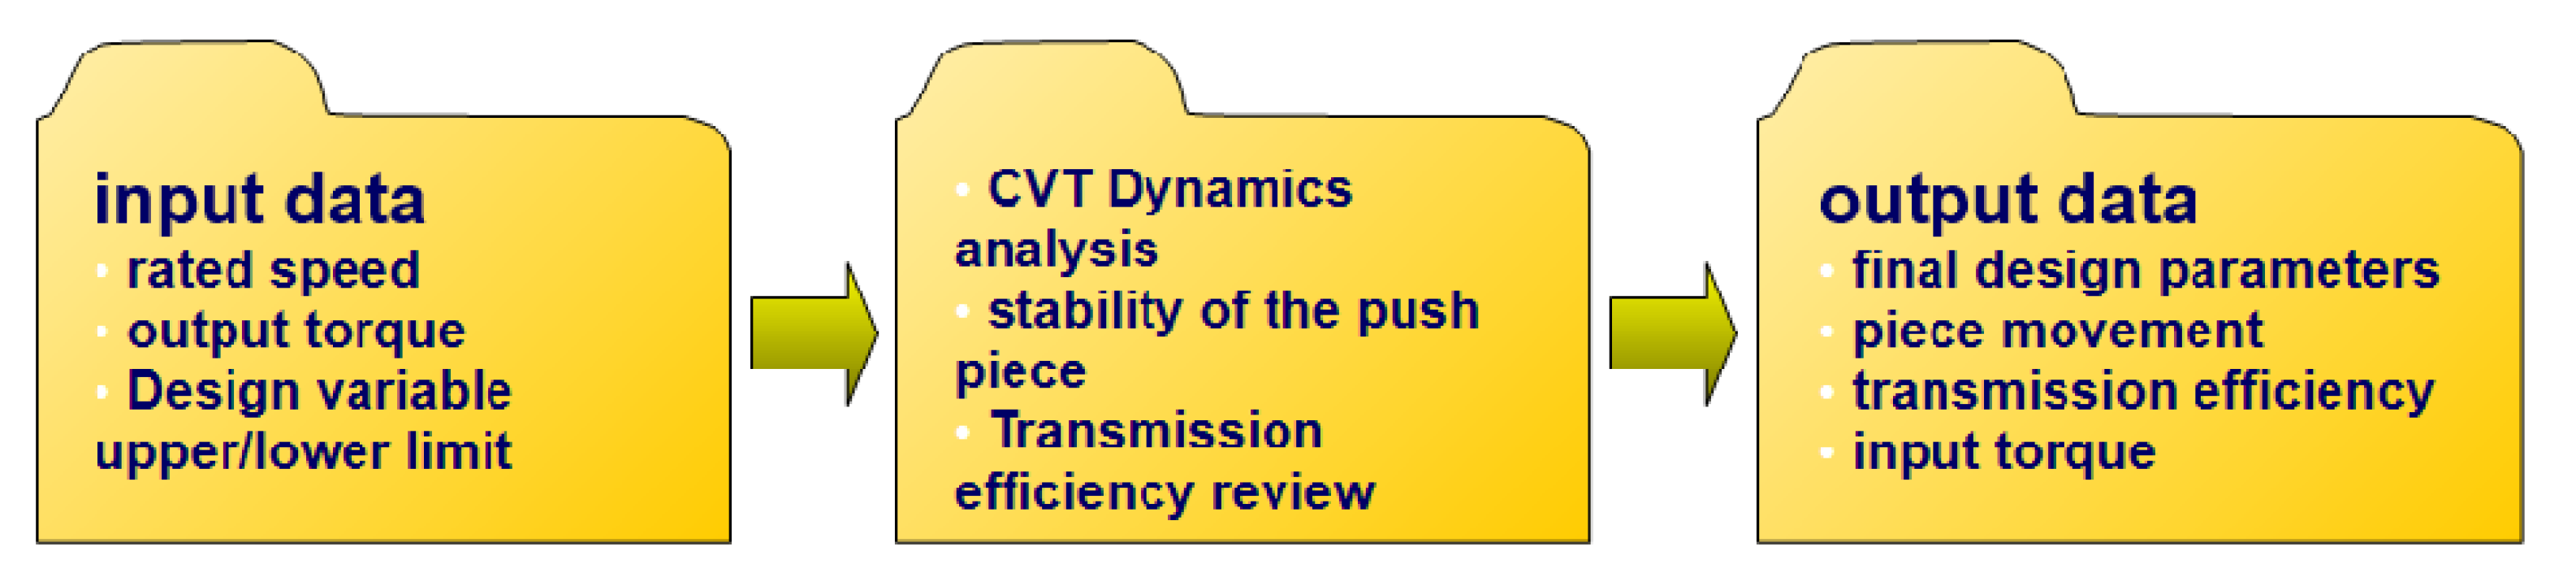
A Fortran program was written to perform the numerical motion analysis of the push piece. When input data is input as shown in Figure 6, the Fortran program sends the output data by investigating the stability and delivery efficiency of the push piece through dynamic analysis.
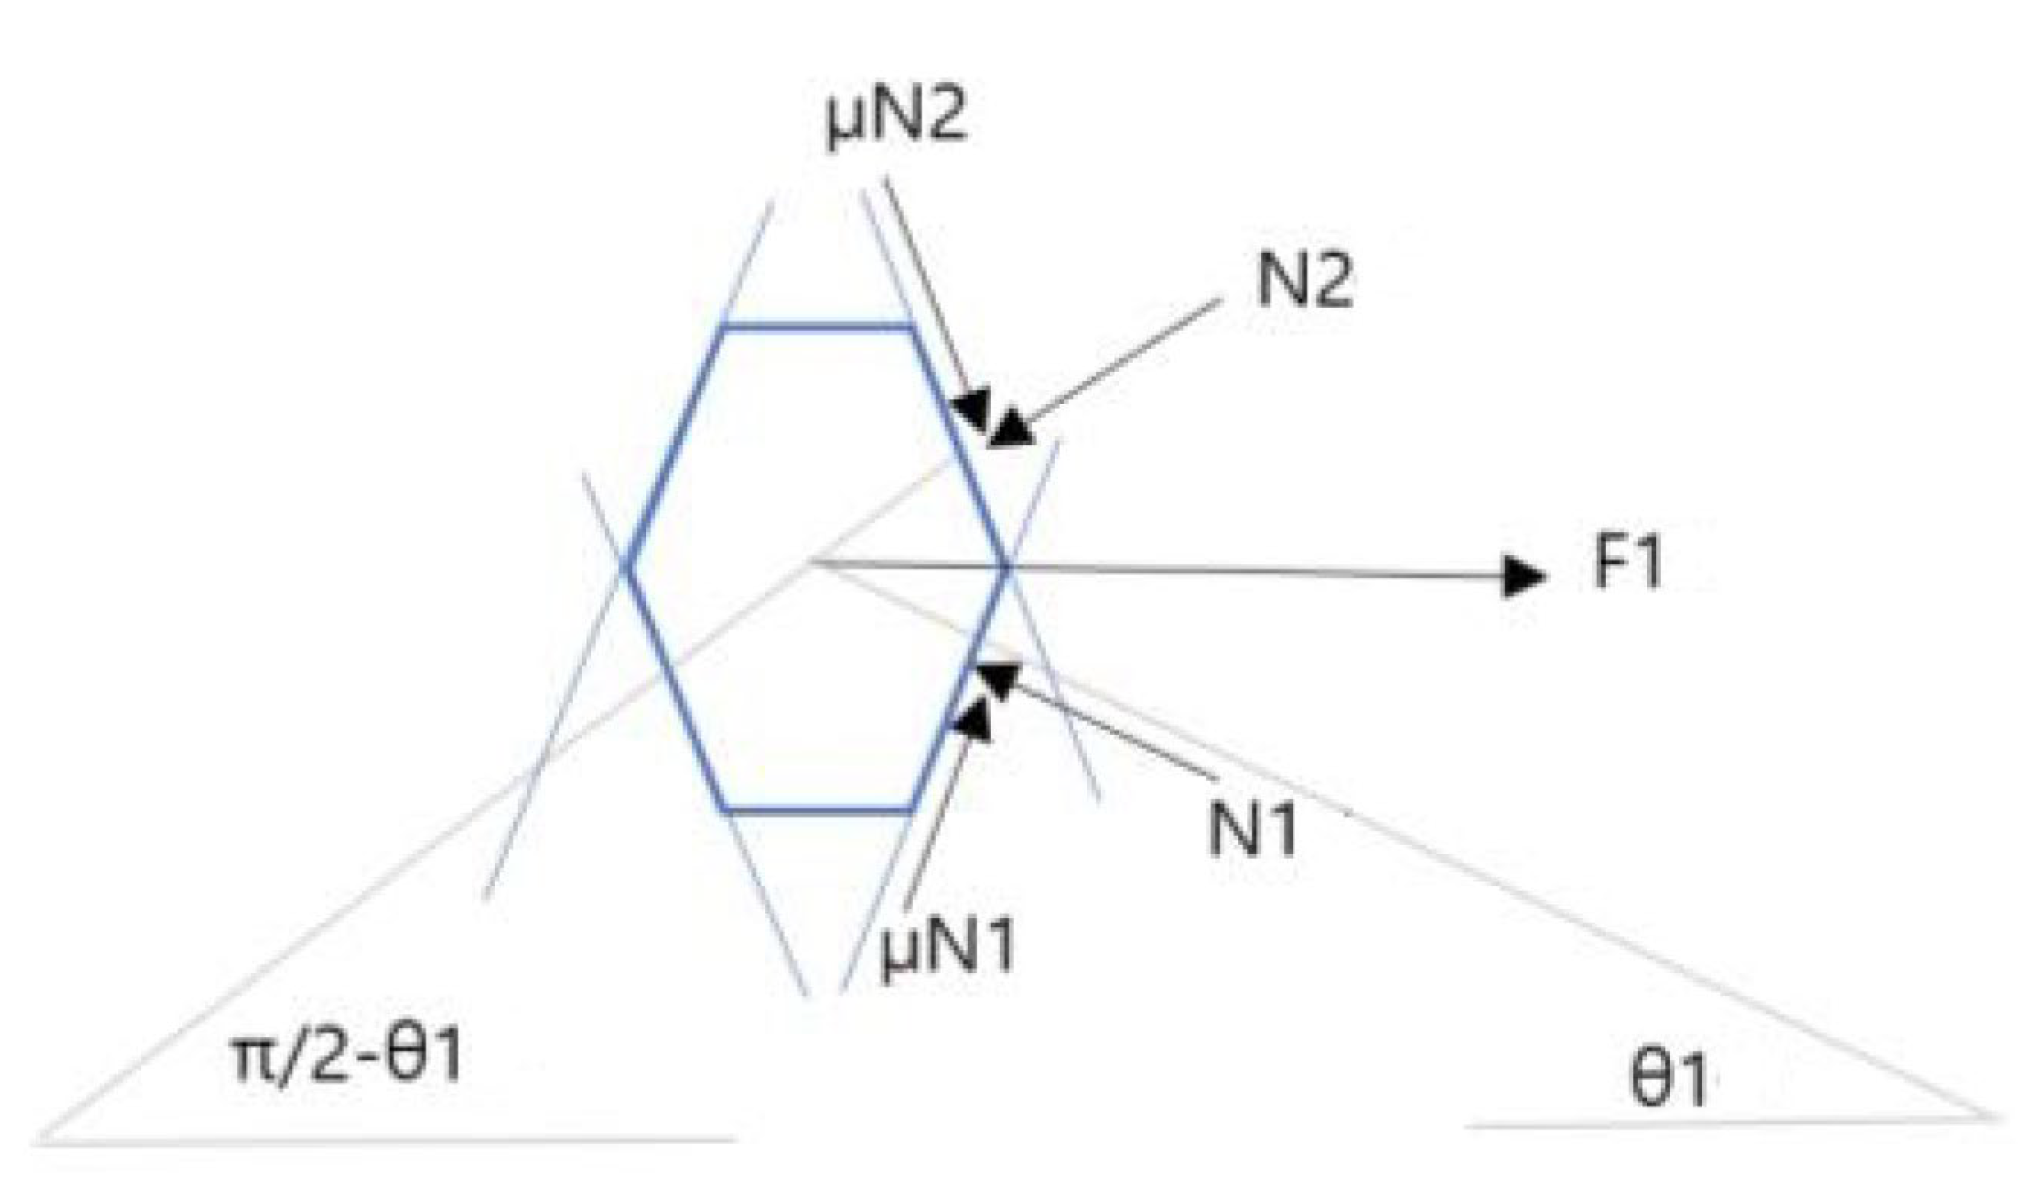
∑Fx = 0
∑F1 − N2cosx + μN2sinx − N1cosθ1+ μN1sinθ1 = 0
∑Fy = 0
N1sinθ1 + μN1cosθ1 − N2cosx − μN2sinx = 0
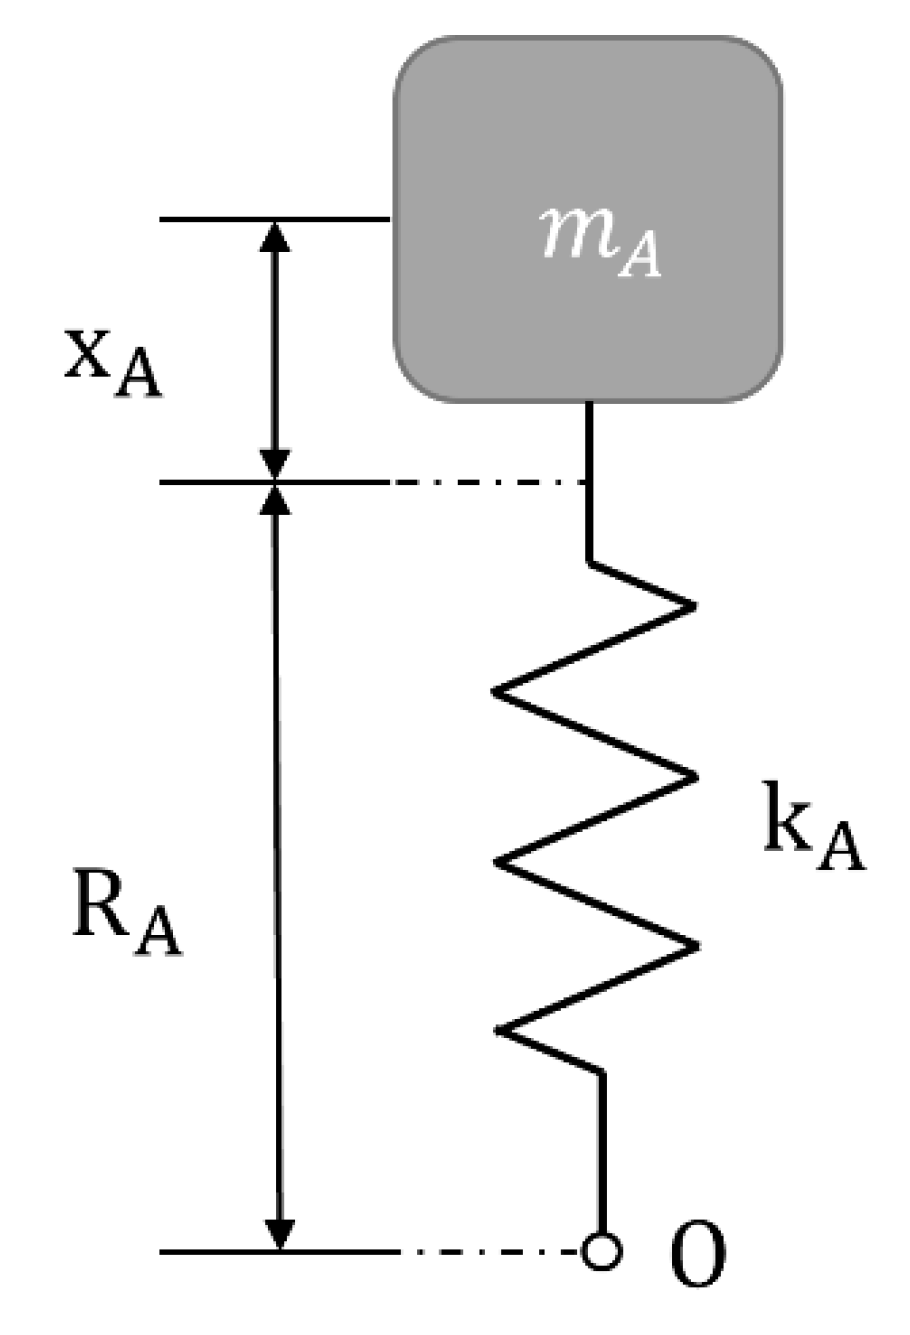
A denotes the driving part, and the driven part is denoted by B.
Figure 8 shows O is the center of the rotary pulley and when centrifugal force is not applied, and the position of the spring is marked as .
Subsequently, when it acts at angular velocity , the centrifugal force is as follows:
Resilience in the spring will be as follows:
At this time, if the tension caused by the belt is ignored, the driving unit will be = , and the displacement will be:
If the same principle is applied to the driven part, then it is defined by the following equation:
The deceleration ratio is defined as follows (In this explanation of the principle, the effect on B is ignored):
If is less than one, it slows down, and if is more than one, it increases speed. Thus, increasing means an increase in the velocity.
If the angular velocity is , the deceleration ratio is as follows:
The length of the belt is constant and can be simplified as follows. Of course, changes in the diameter ratio were omitted for a brief explanation:
If differentiated here, it can be written as follows:
= can be rewritten as:
The velocity increases as the deceleration ratio increases.
The deceleration ratio has the smallest value because the angular velocity is zero at the start, which is a desirable characteristic in an electric vehicle. The centrifugal force, the length of the spring, and the angular speed of the driven part increase when the driving speed increases. When a load is applied to the driven part, the torque increases, and the driving part increases the engine torque, thus reducing the speed.
The spring and mass ratio at point B were ignored, but were considered in the actual design. To implement this principle, a spiral curve was added, and an auxiliary plate was used to extend it to a certain radius.
In this dynamical equation, the following variables were input and analyzed
According to the given spline angle α:
r1 = f1 (m1, m2, N1, N2, ω1, T, K, α, μ1, μ2)
r2 = f2 (m1, m2, N1, N2, ω1, T, K, α, μ1, μ2)
…
η = fk (m1, m2, N1, N2, ω1, T, K, α, μ1, μ2)
Here, the input variables are as follows:
r1: Pin position radius of the input slot
r2: Pin position radius of the output slot
η: Power-transmission efficiency
m1: Weight of input piece
m2: Weight of output piece
N1: Number of input pieces
N2: Number of output pieces.
ω1: Input rpm of motor
T: Output load torque
K: Tension spring factor of the output piece
μ1: Input plate slot, pin, and coefficient of friction
μ2: Output plate slot, pin, and coefficient of friction
The following functions are not explicit functions; therefore, they are difficult to solve mathematically. A trial-and-error approach using a computer dynamics program was used to generate a solution, which the provided graphs show below.
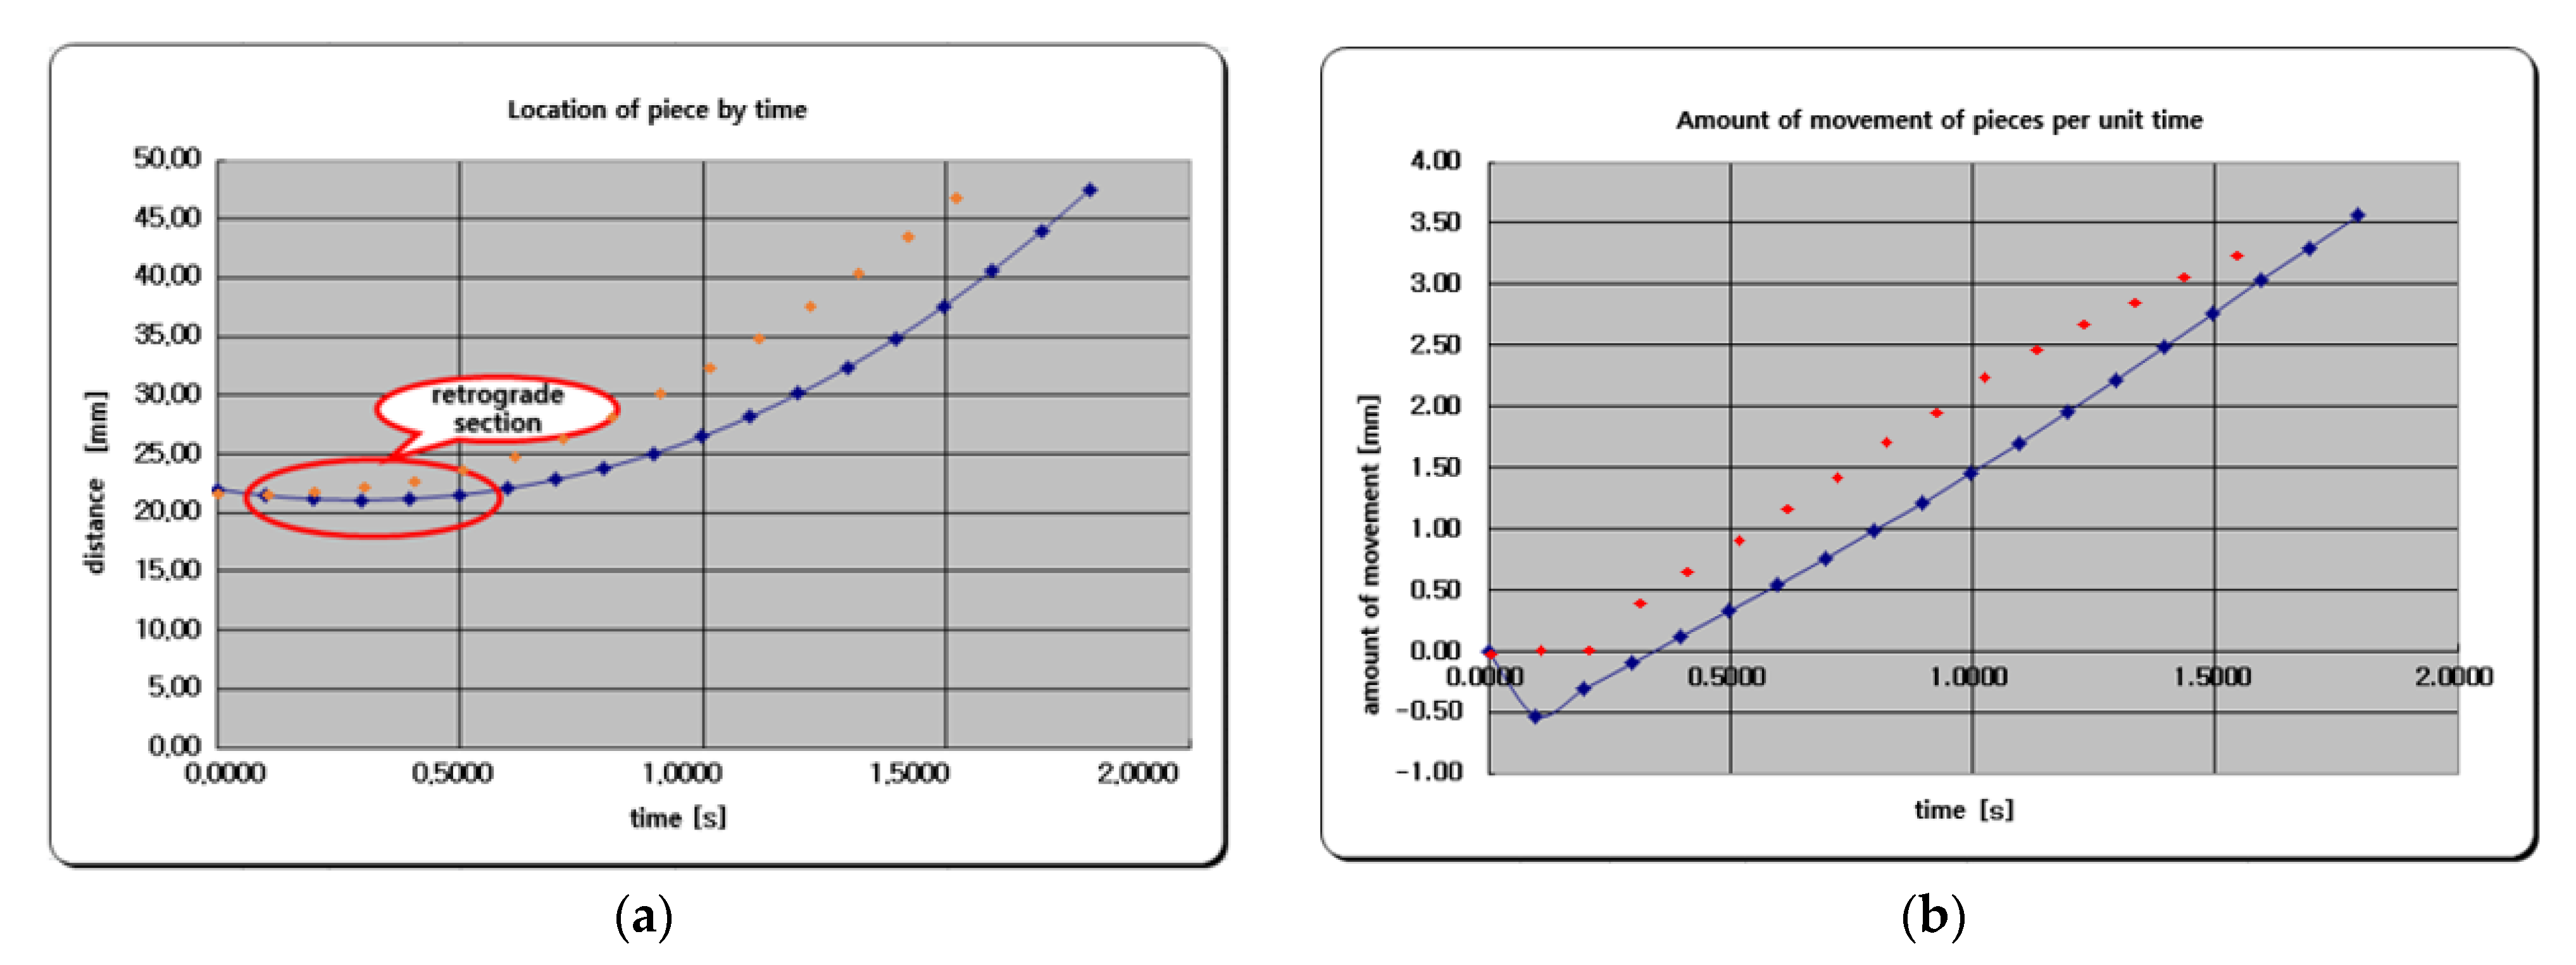
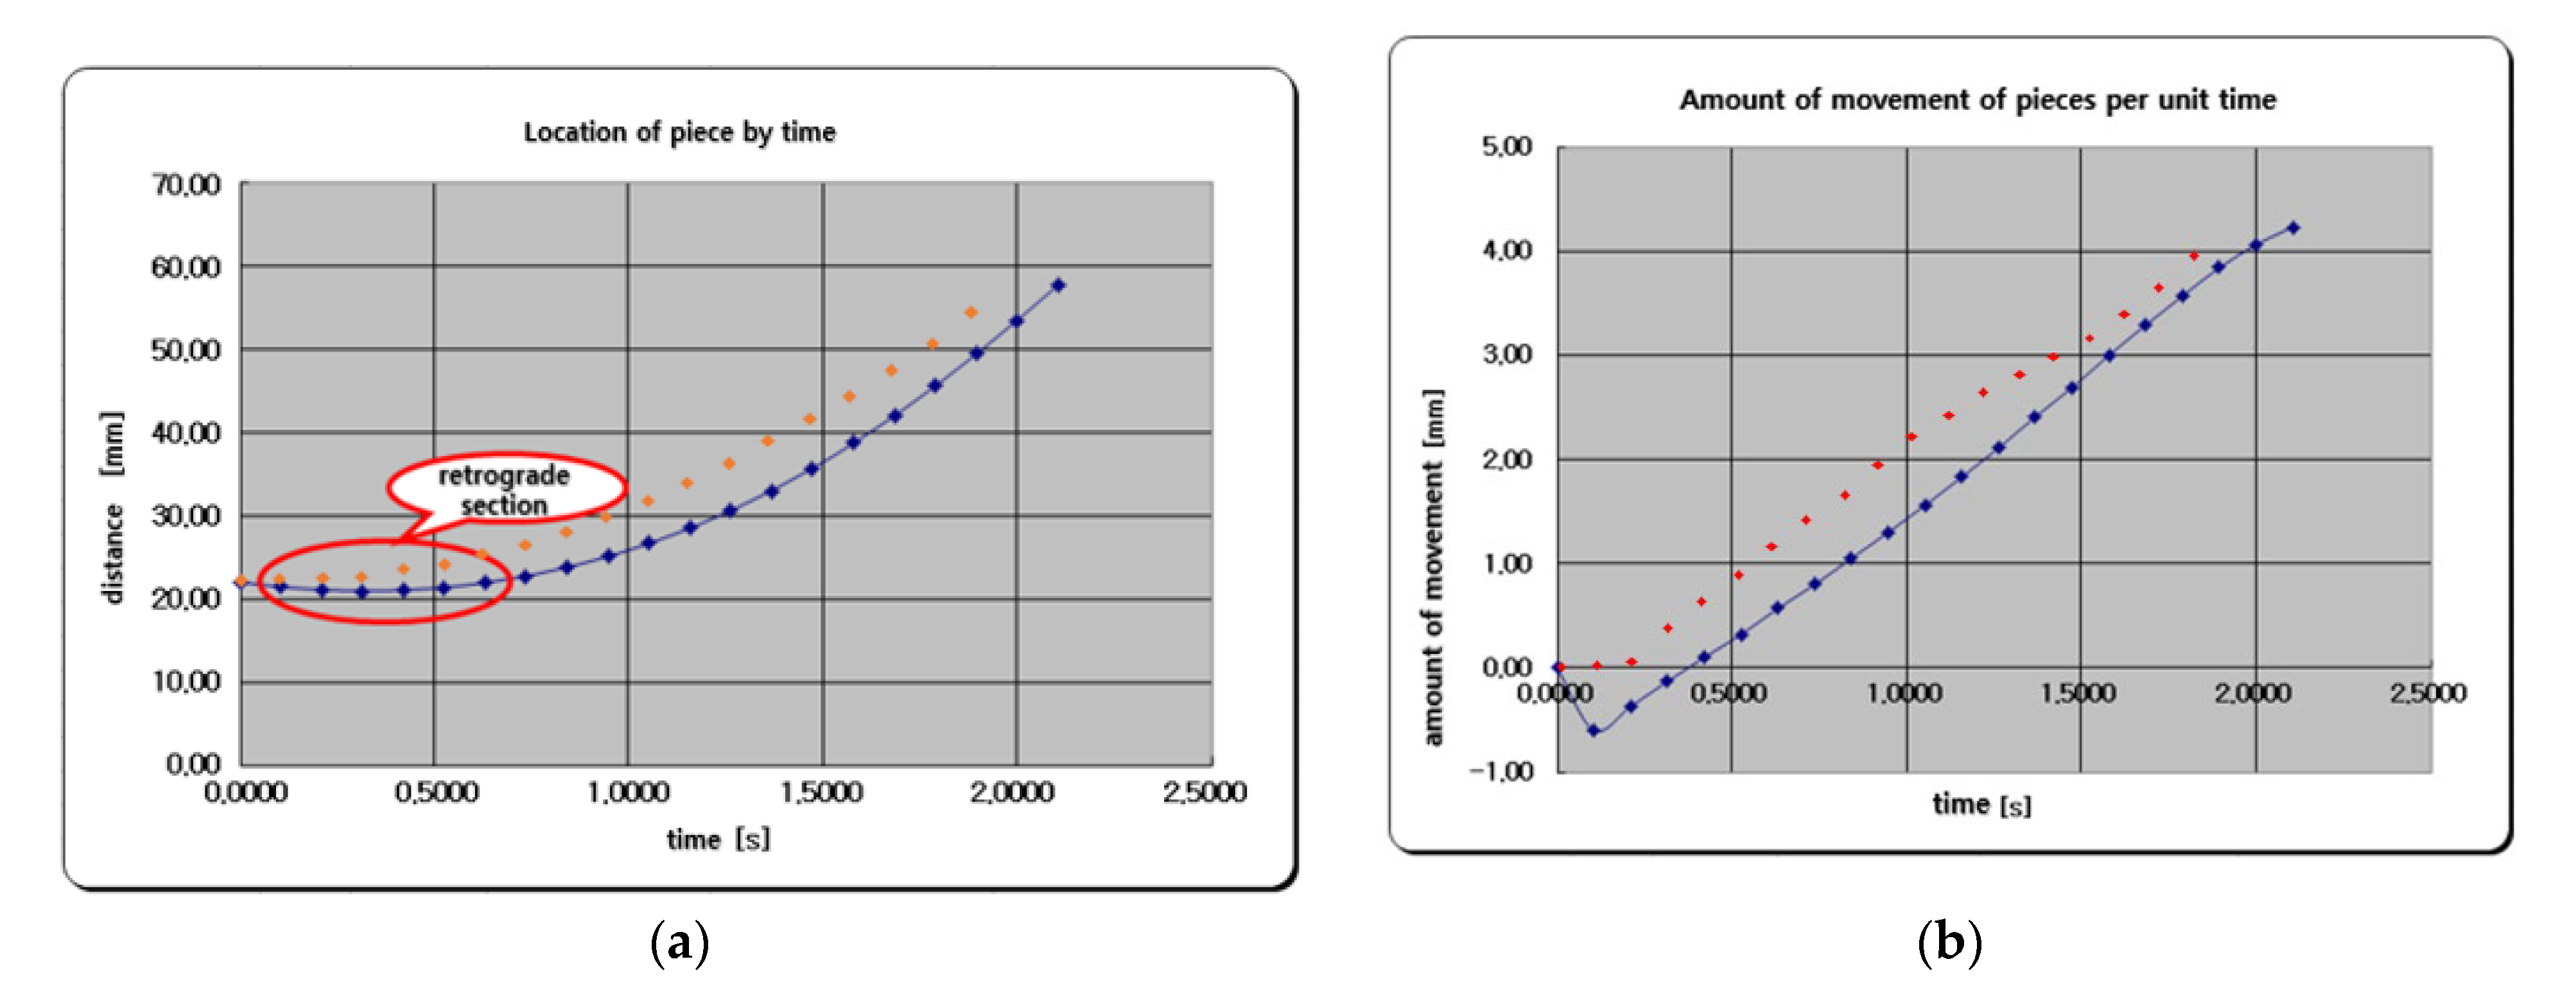
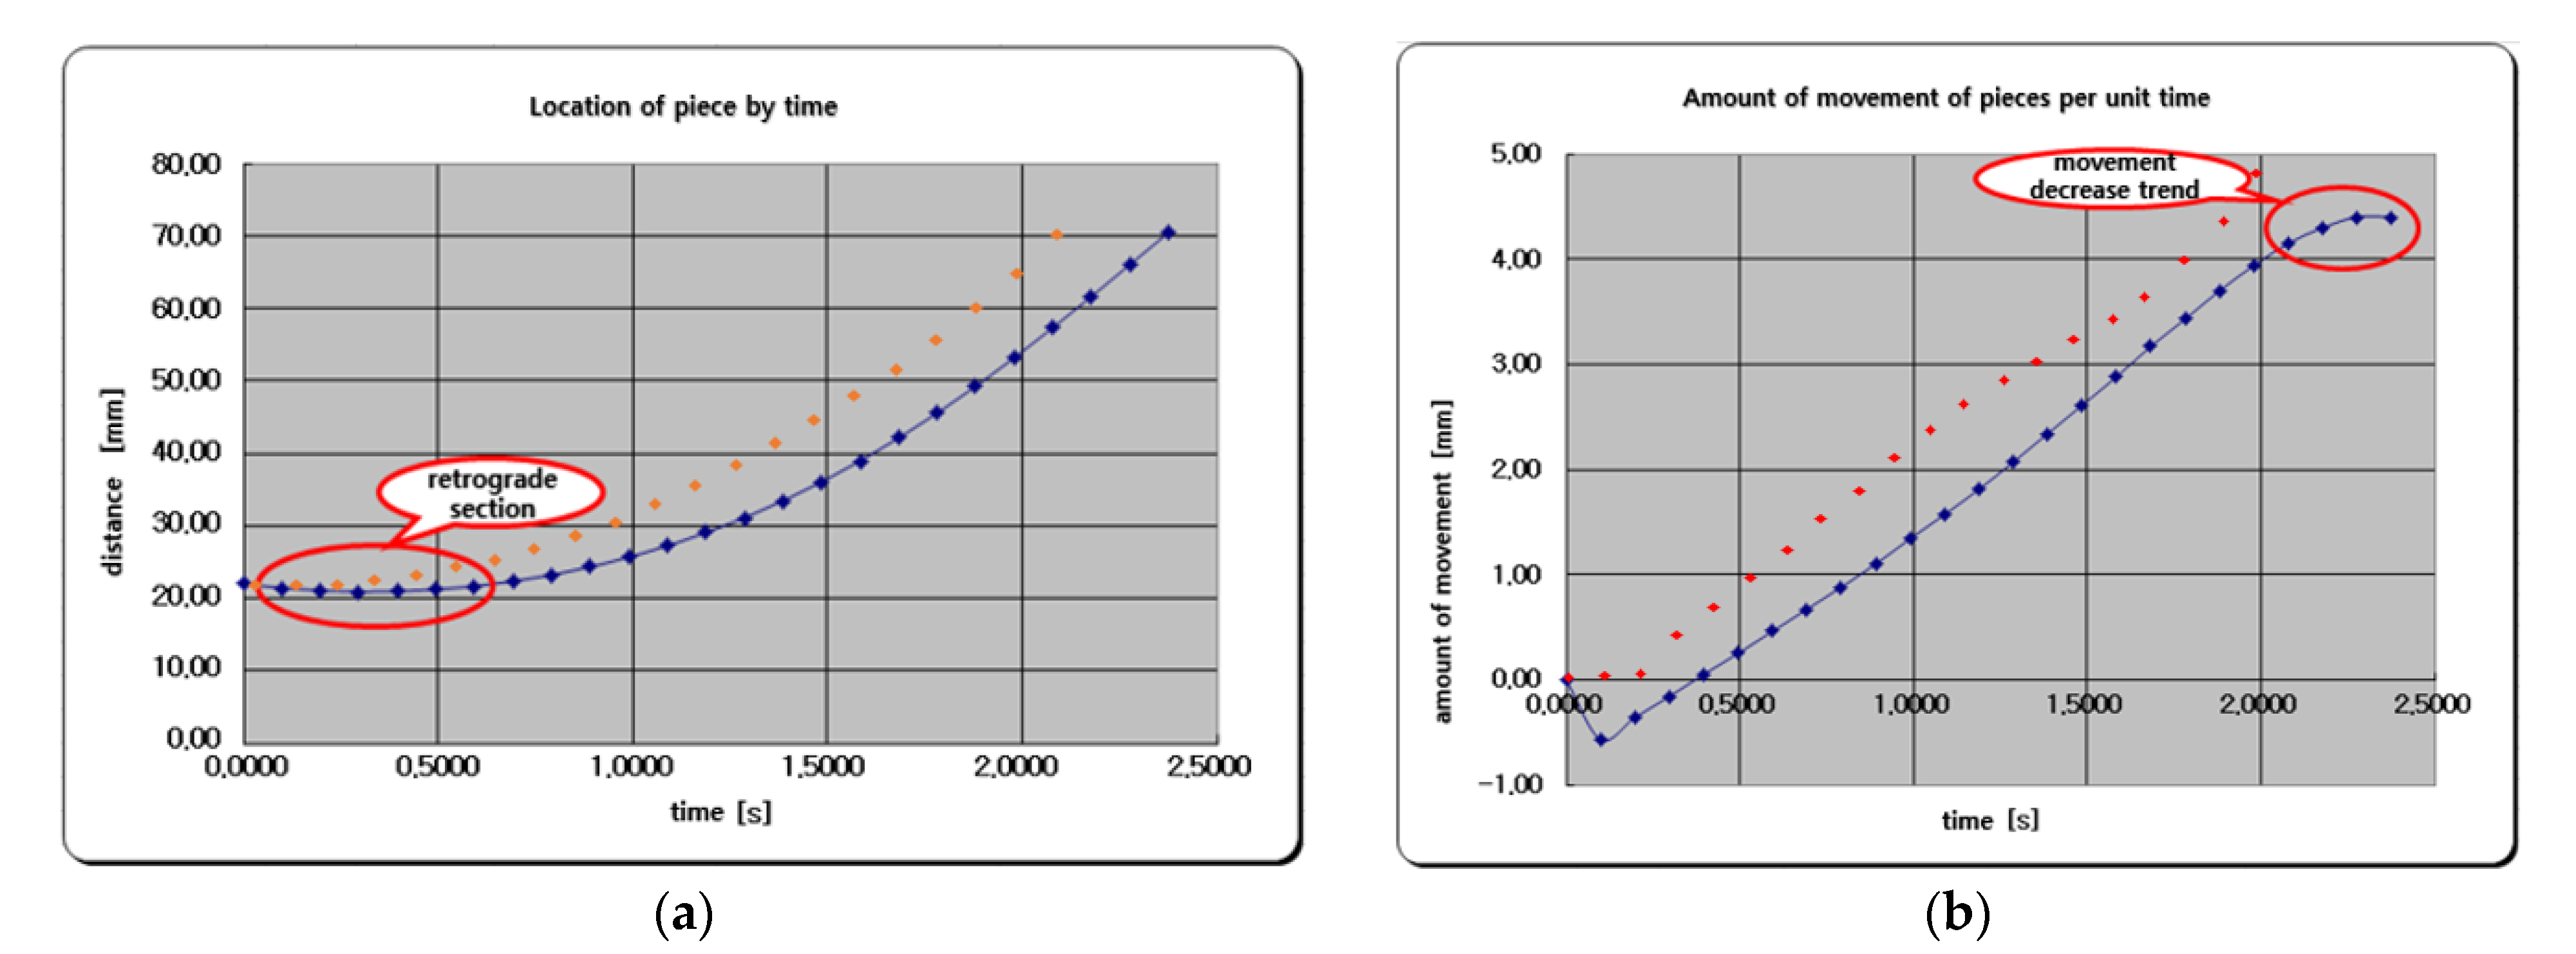
Figure 9, Figure 10 and Figure 11 show a graph was drawn to compare the rail curvature angle and behavior of the push piece in each case of the normal curve and spline curve of the slide plate based on the ratio output value.
Figure 9 and Figure 10 show the analysis was performed at an actual 1° interval at 20°, and there was no significant difference in the change in the spline curve between 20° and 30°.
The behavior of the push piece in the normal and spline curves at each angle was analyzed.
Figure 11a show Retrograde was observed at the beginning of the normal curve when analyz-ing the behavior of the fragments by angle.
Figure 11b there was a section where it did not ex-pand even after maximum expansion and was stagnant at 40°. It was established from the spline curve that the expansion time gradually increased as the angle increased.
It stopped, due to interference, and then moved along the trajectory.
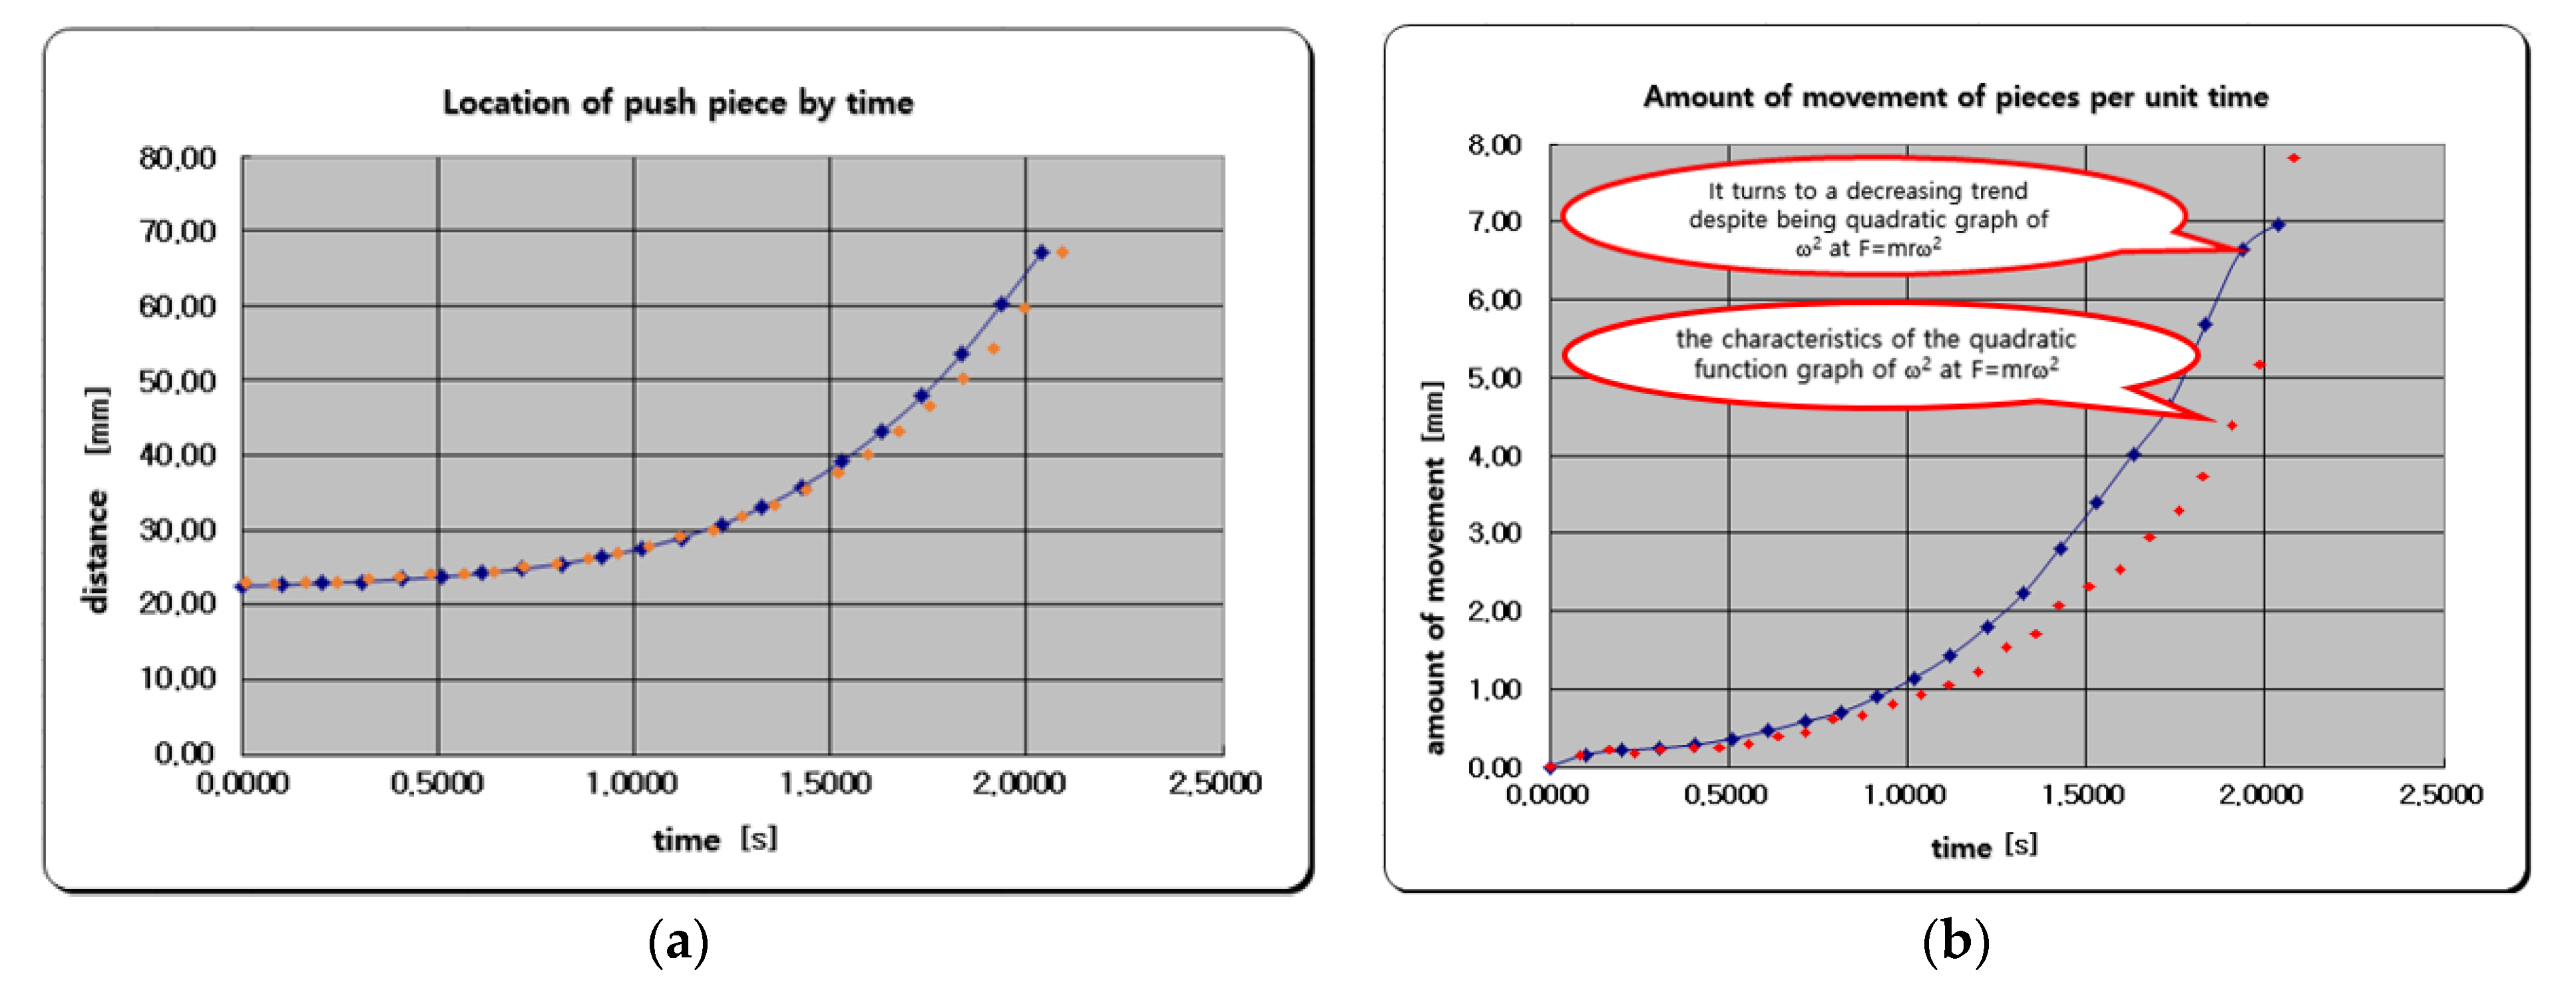
However, Figure 12 shows that the rail-grooved slide plate was designed using a spline curve. Therefore, the push piece moved immediately at the initial start without interference from the centrifugal force.
The movement amount was increased using a linear function method.
A guide plate can be designed and manufactured using splines when a rail groove is designed using a spline curve with centrifugal force F.
The slide-plate-like curve ensures the stability of the push piece during the design phase.
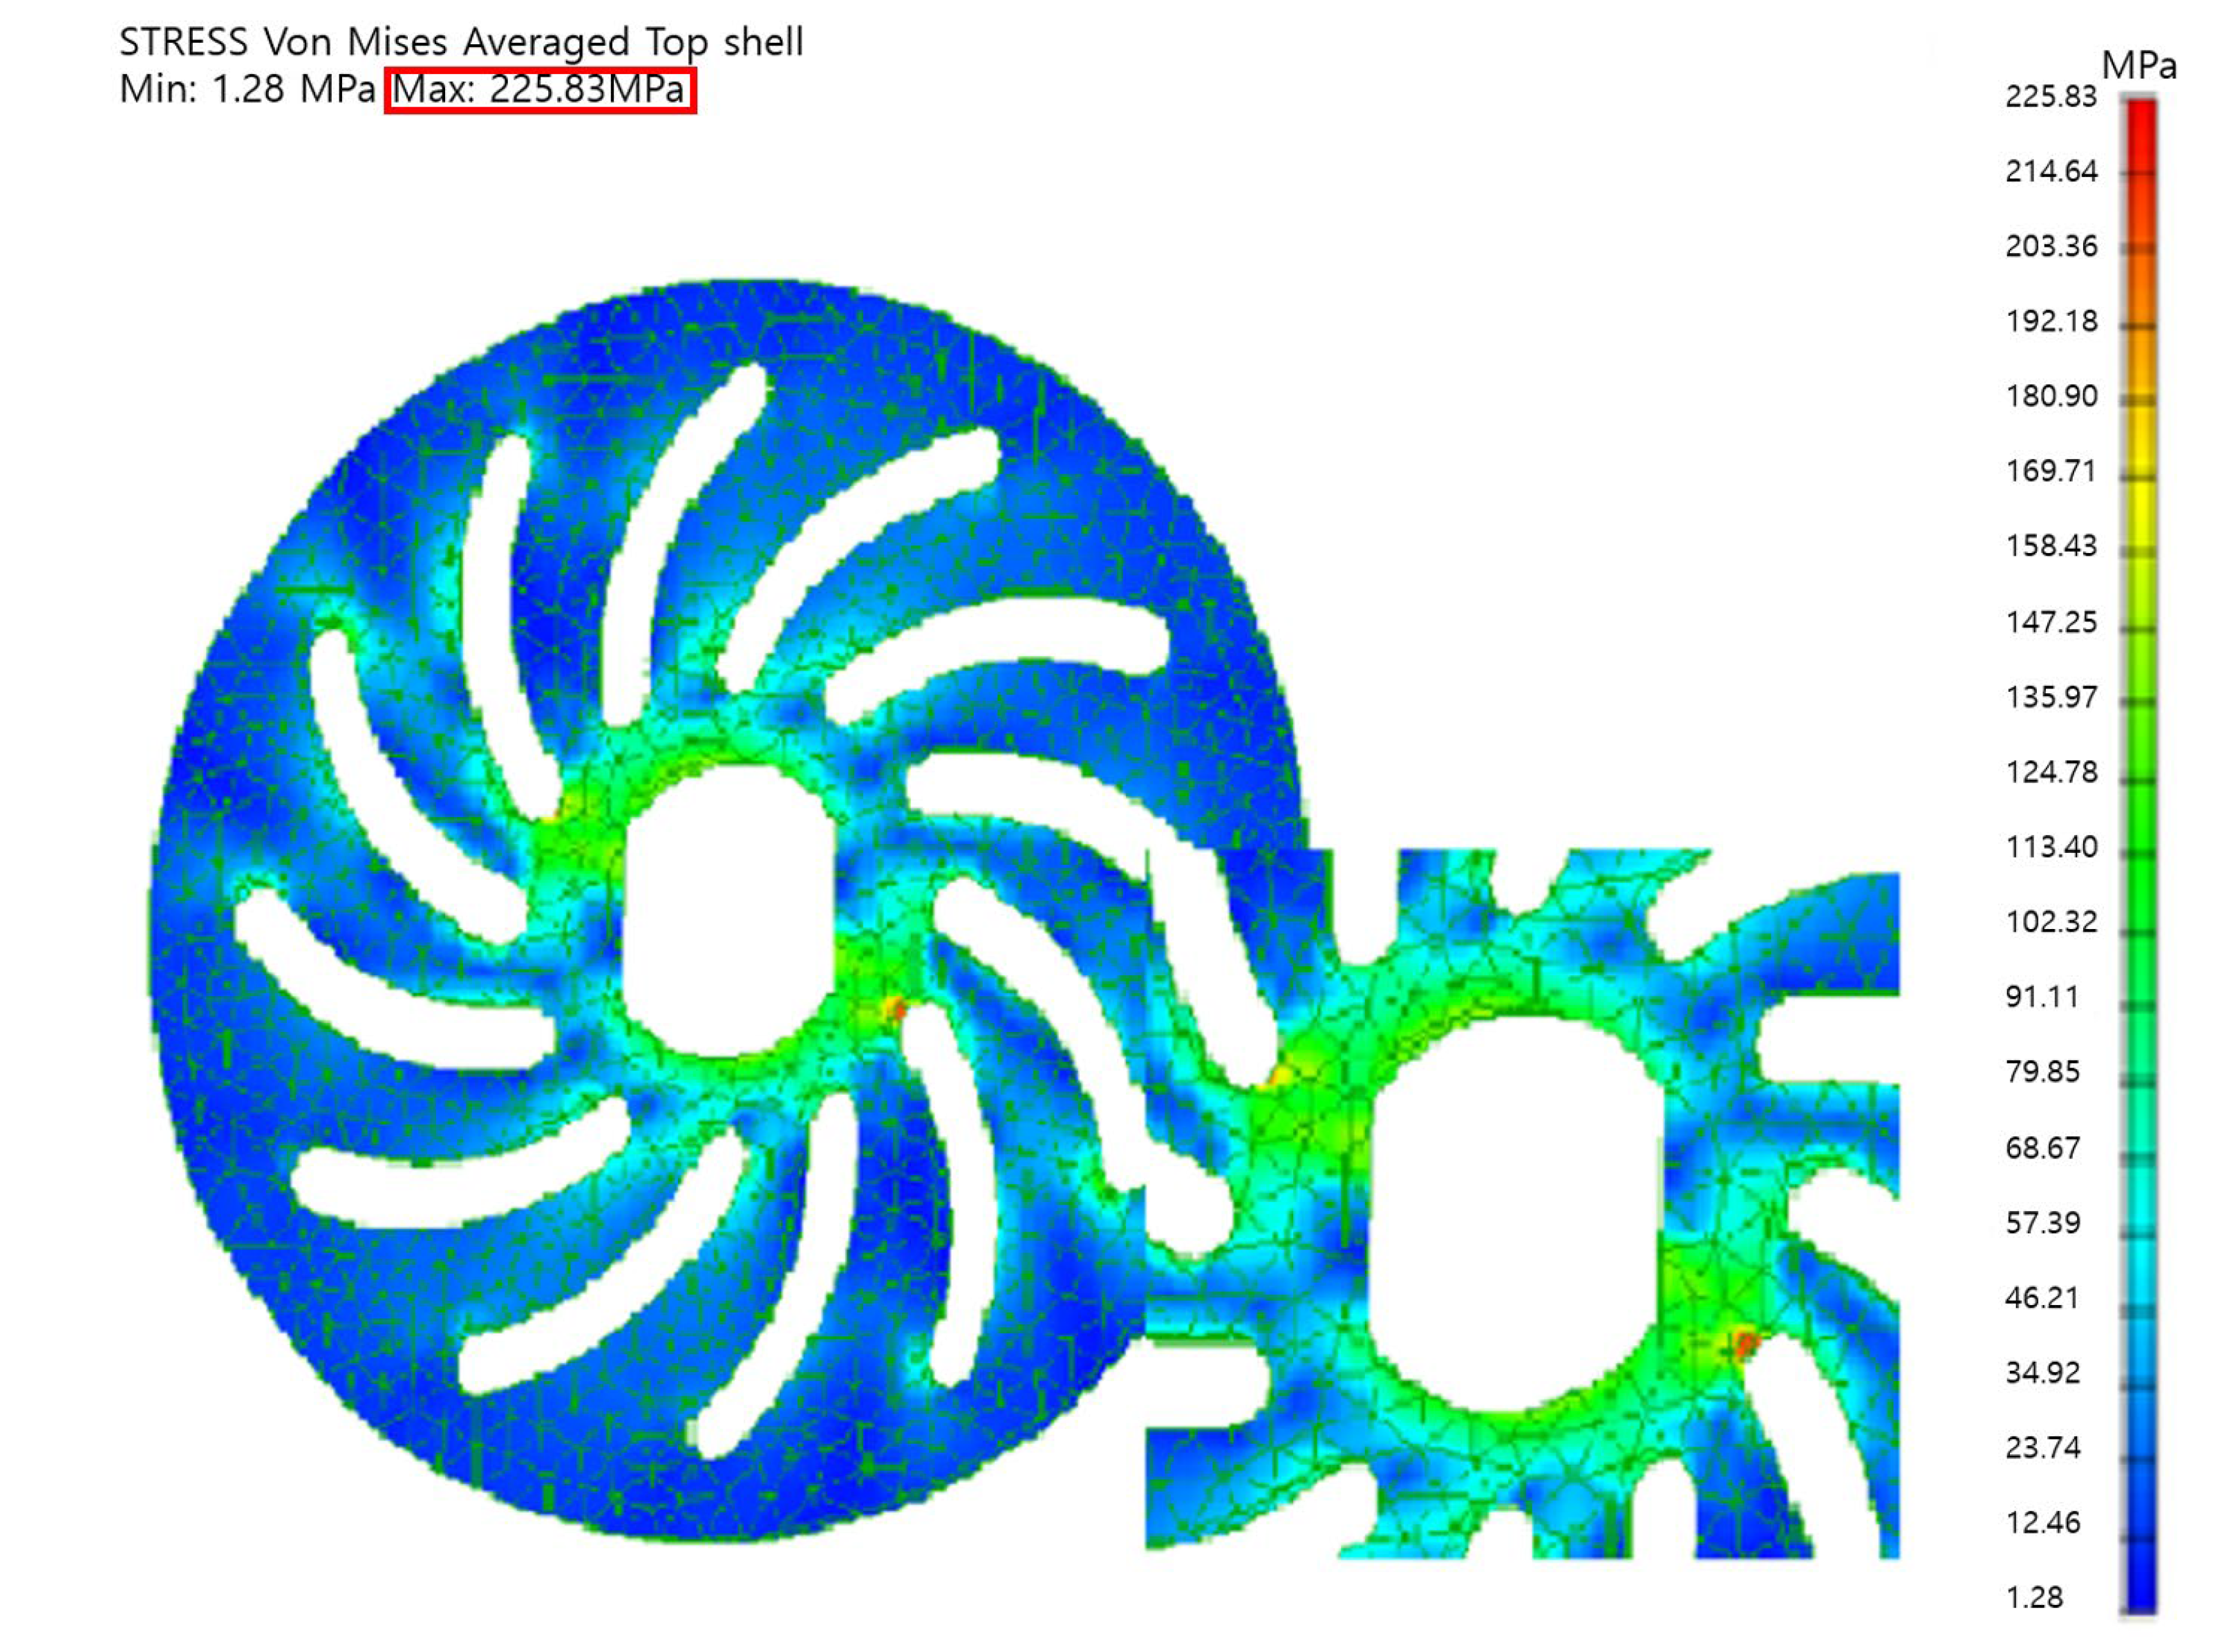
The plate structure was analyzed for its application to centrifugal pulley belt-type continuously variable transmission using the Abaqus program. Since the shaft was inserted in the plate hub, constraints were set on the plate hub, and carbon steel was used as material because SM45C was used in preparation.
As a result, it was found that the stress was the highest at the hub part where the load was generated when the shaft rotated, and the part where the distance between the hub part and the rail groove was the shortest, as shown in Figure 13. However, the maximum stress was , indicating that the yield strength of the SM45C selected as the plate material was about , and the tensile strength was above . Therefore, it was deemed that there would be no problem in using it.
4. Centrifugal Belt Pulley
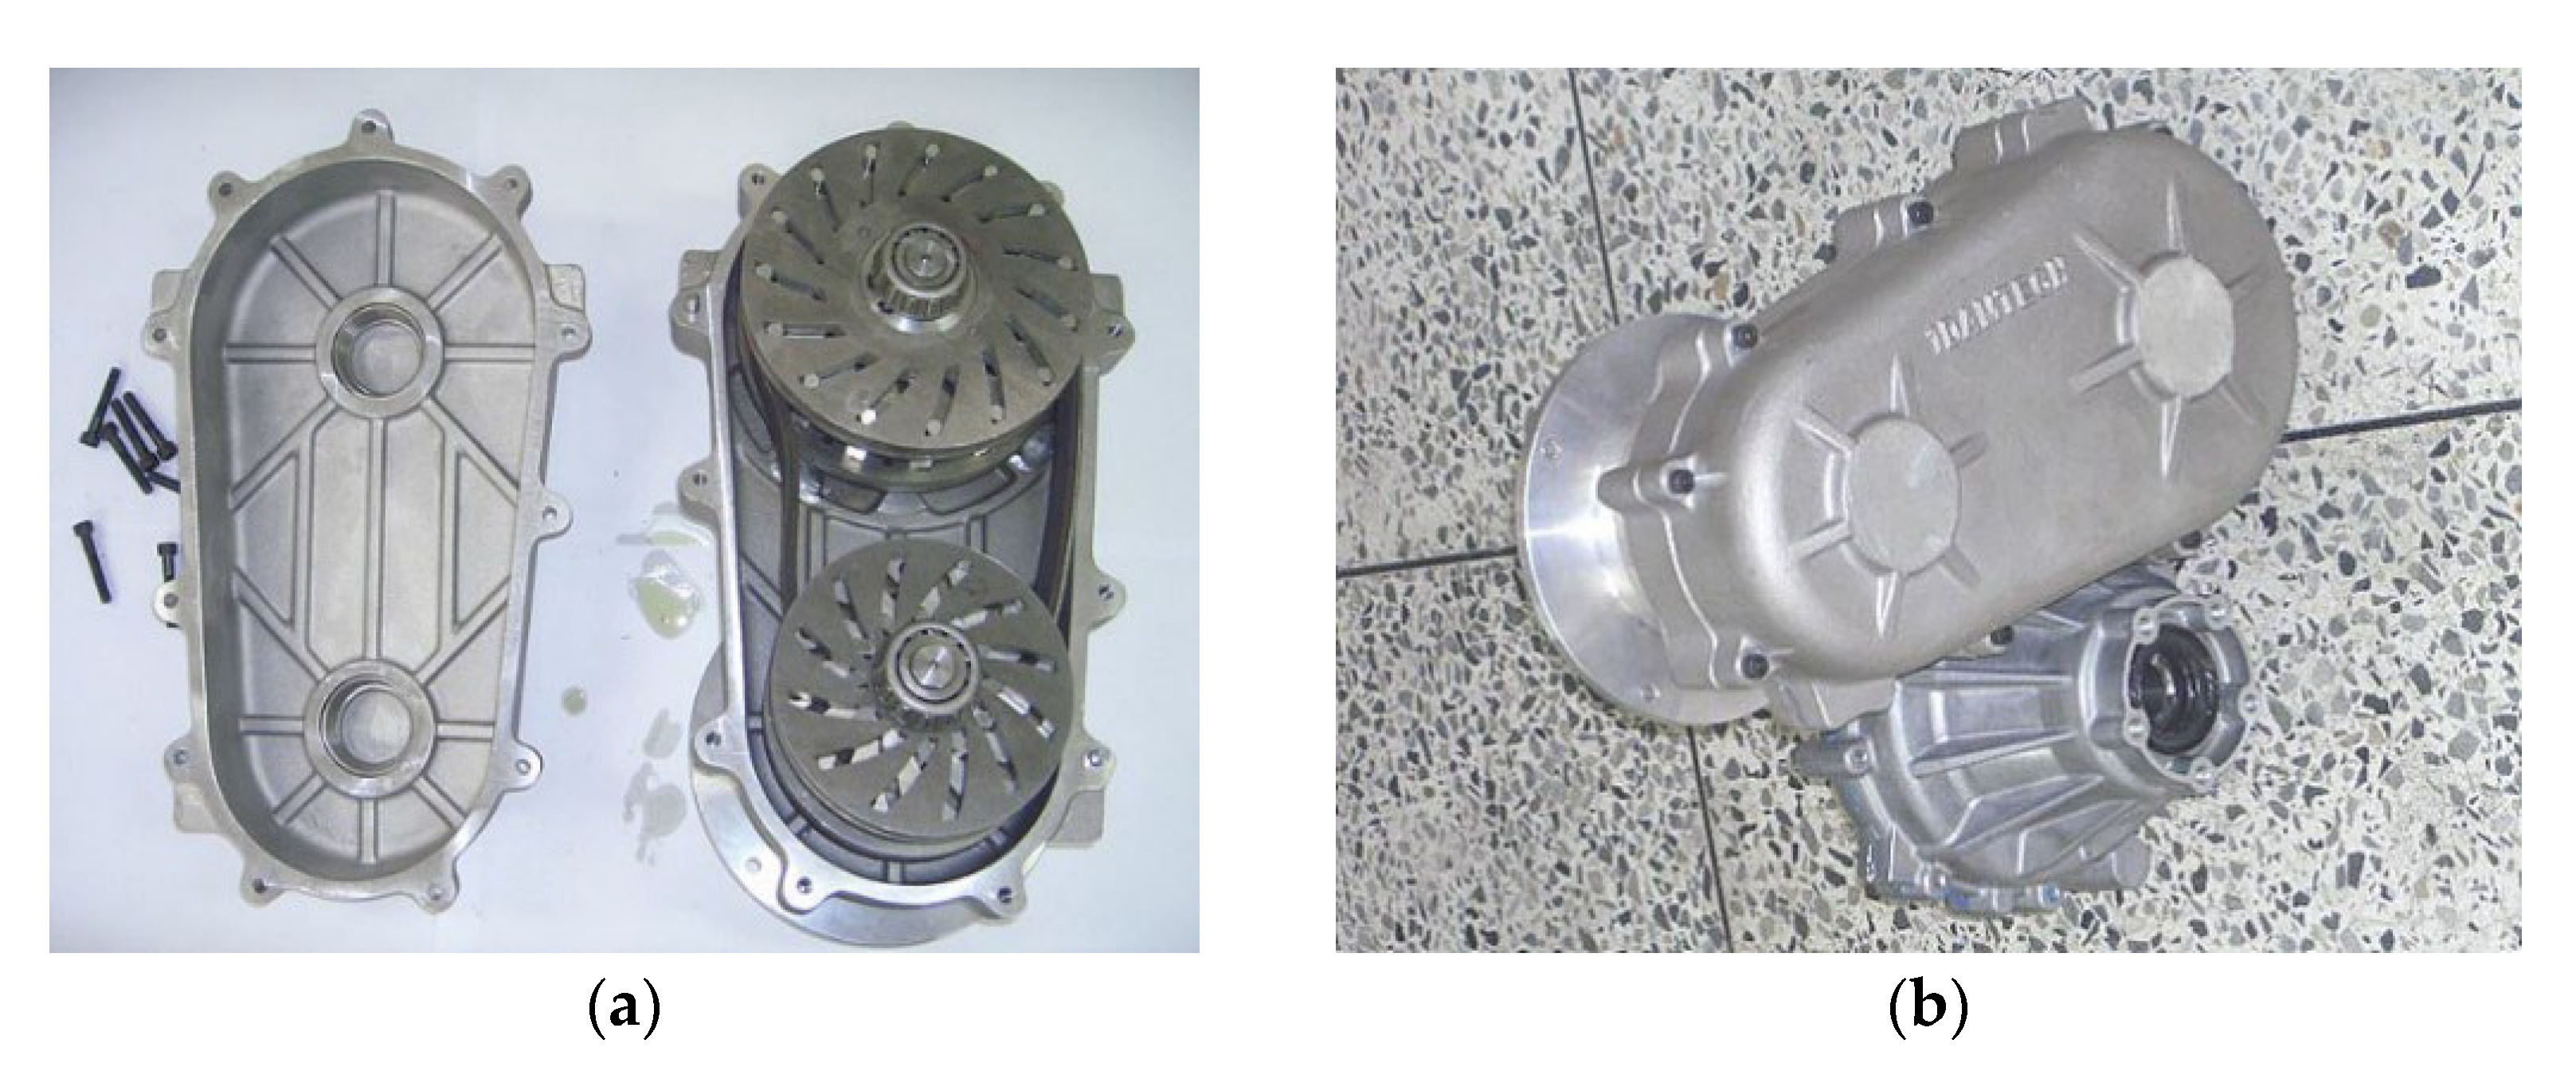
A CVT housing was designed for an electric vehicle with a 4-kW motor. It was manufactured so that the centrifugal belt pulley CVT could be attached to the speed reducer.
Although the power of existing electric vehicles is transferred from the motor to the speed reducer, the centrifugal belt pulley-type CVT was installed between the motor and the speed reducer by reinforcing the ribs inside the housing.
The motor was placed above the axle to reduce weight interference between the motor and vehicle components.
The distance between the axle of the driving pulley and driven pulley was set at 175 mm, and the belt length was set at 672 mm to calculate the contracted state of the driving pulley and the expanded state of the driven pulley.
The differential gear and L-shape were fixed, as shown in Figure 14b, so that the shaft could support the load of the motor and CVT.
5. Centrifugal Belt Pulley CVT Performance Tester
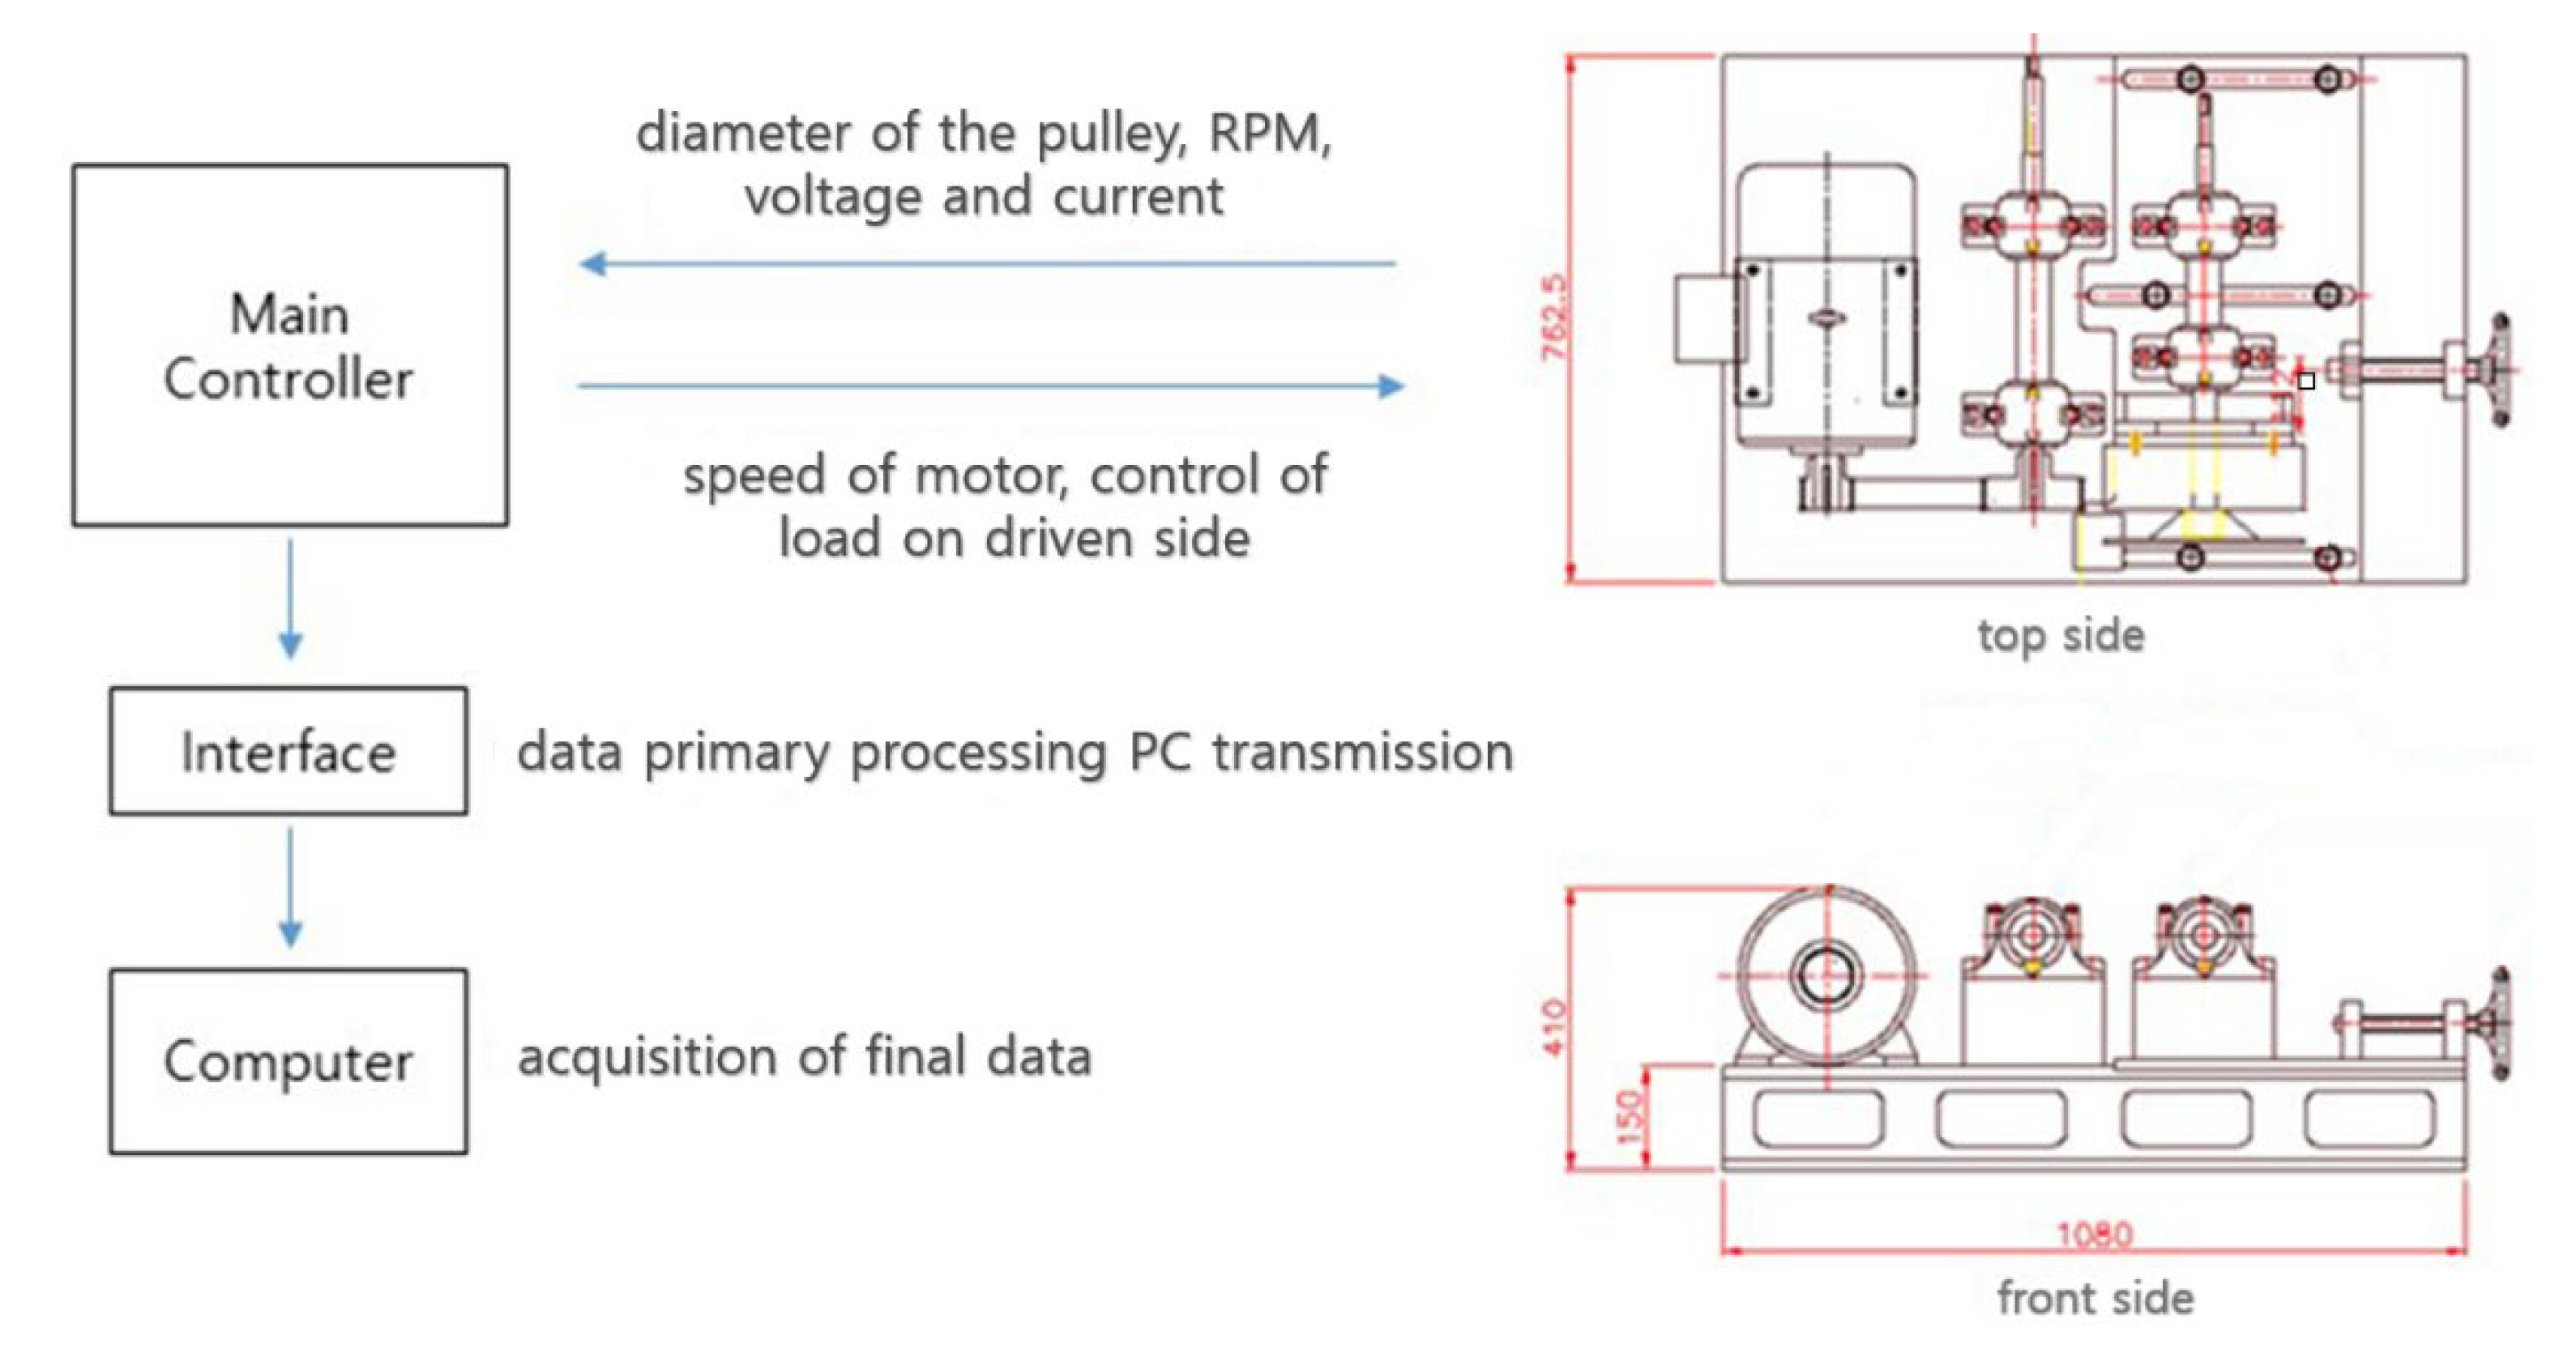
A performance tester was manufactured, as shown in Figure 15, to validate the performance of the centrifugal belt pulley CVT.
The testbed of the performance tester was equipped with a motor that could rotate the transmission, and a brake that transmitted the load to the CVT.
In addition, a noncontact sensor was installed to measure the outer diameter of the pulley.
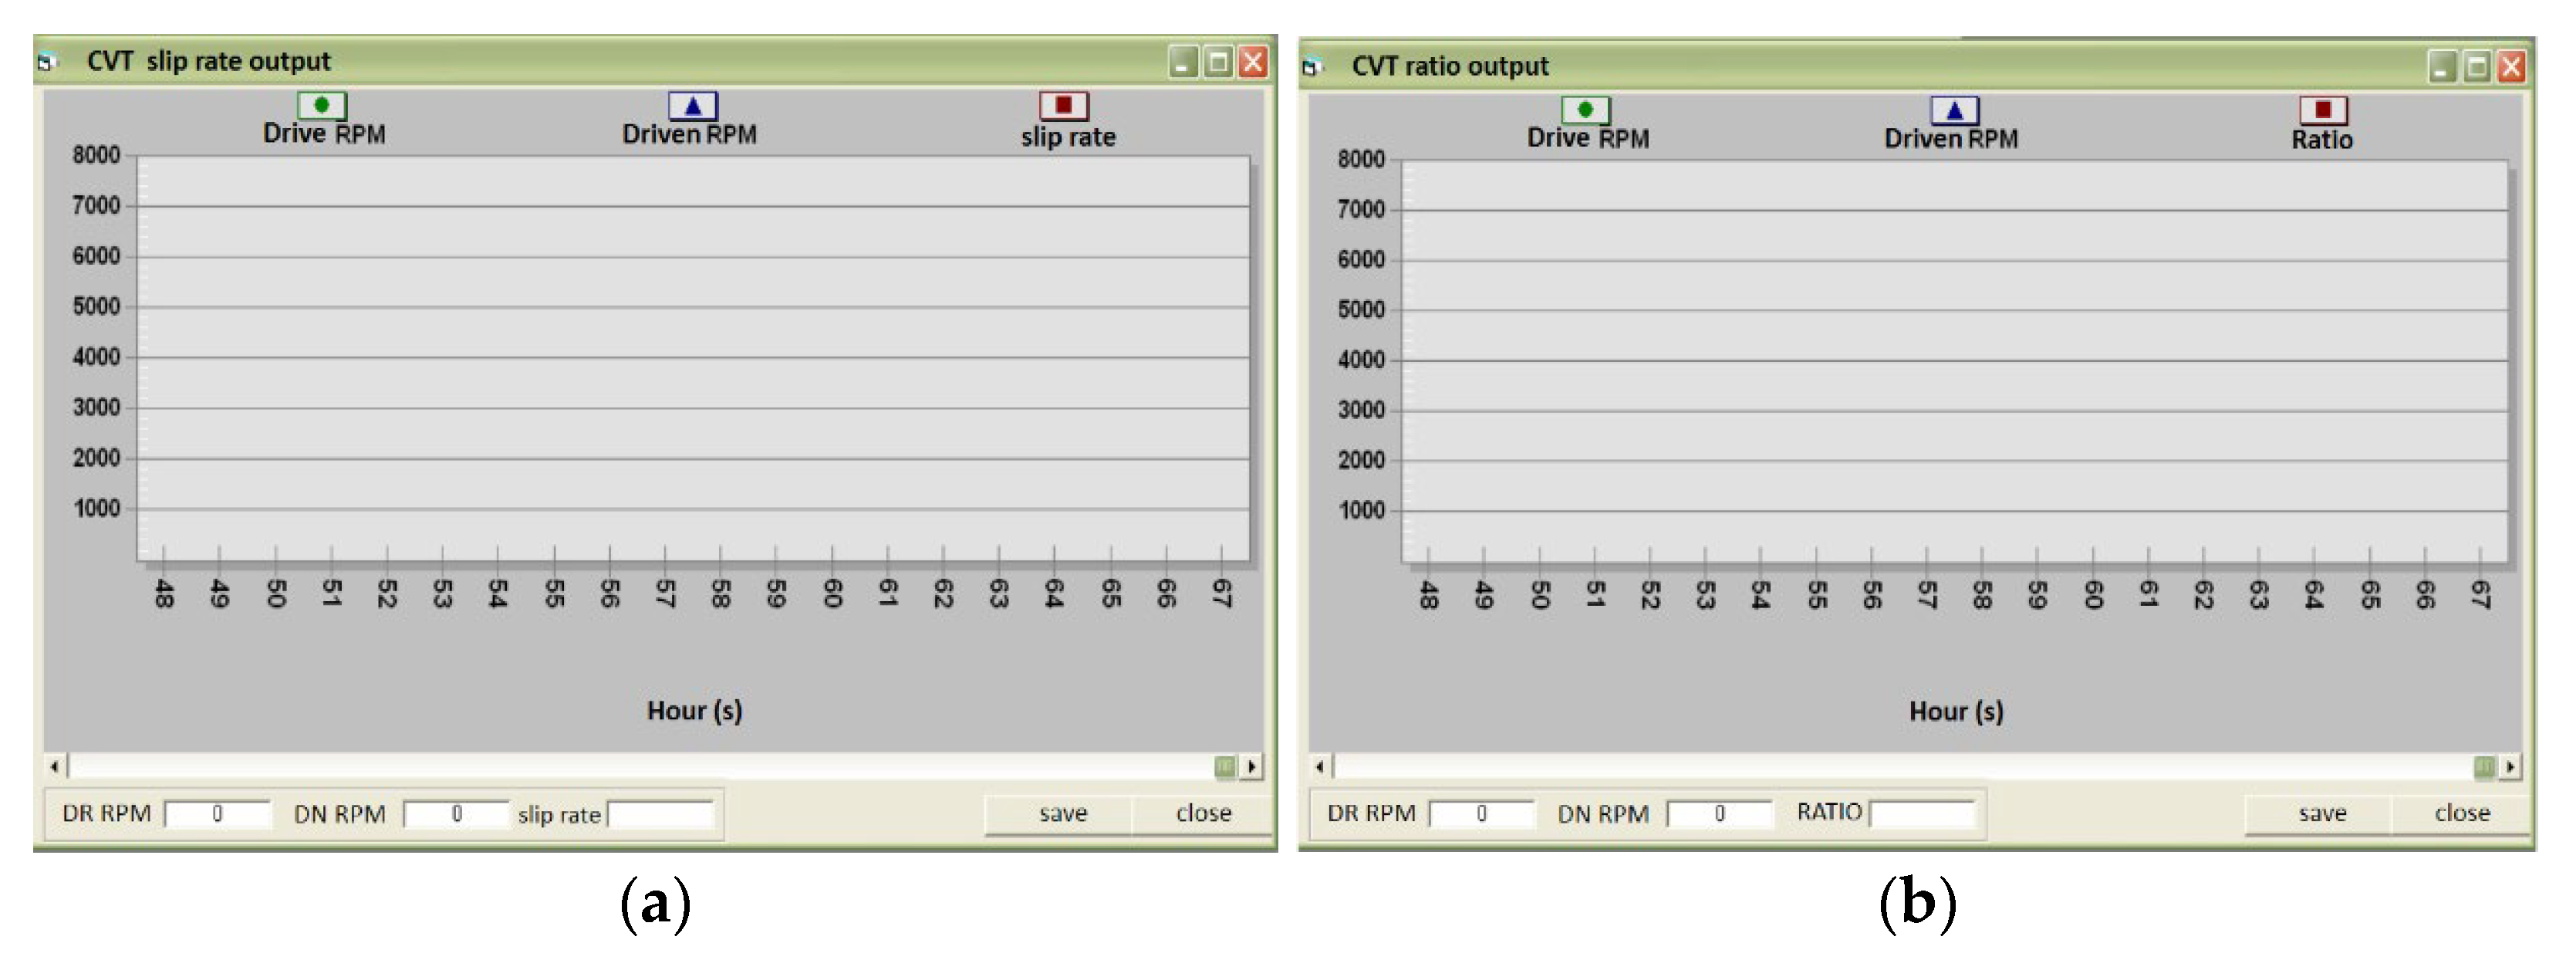
As shown in Figure 15, the main controller controlled the speed of the motor and the load on the driven side to determine the speed ratio of the pulley, the number of revolutions between the drive and driven plate, and the voltage and current. The measured values were processed at the interface and verified in the final calculation.
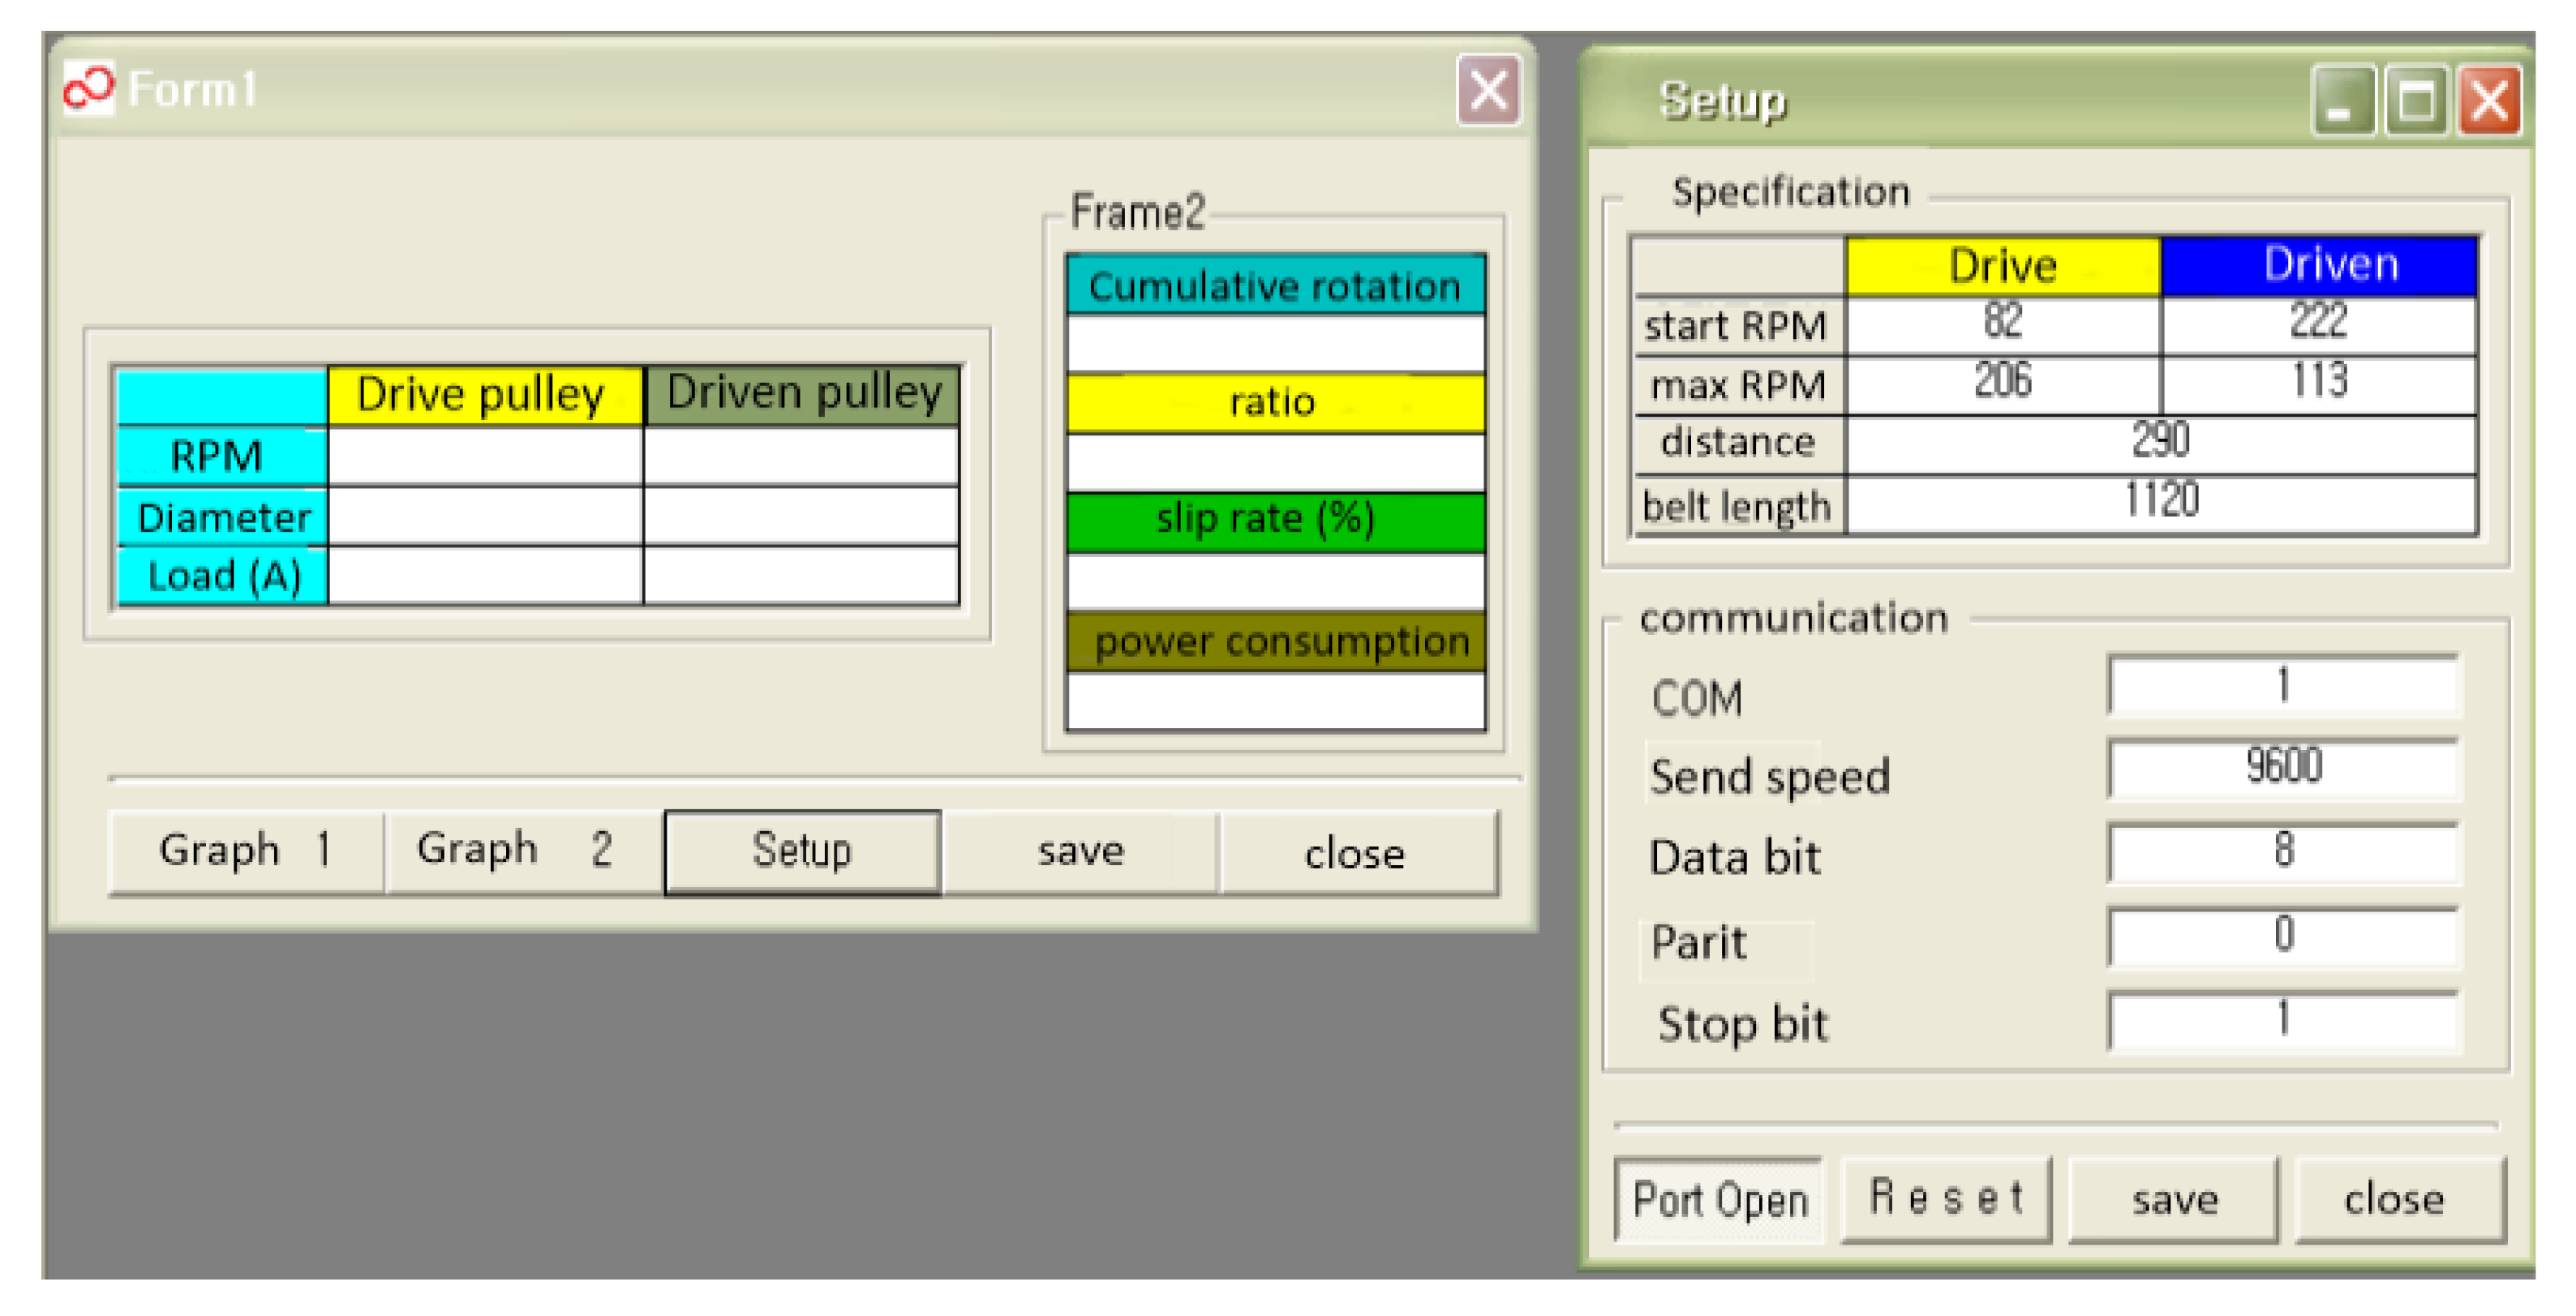
The software interface was configured such that the initial input values could be set and the final data could be generated and saved.
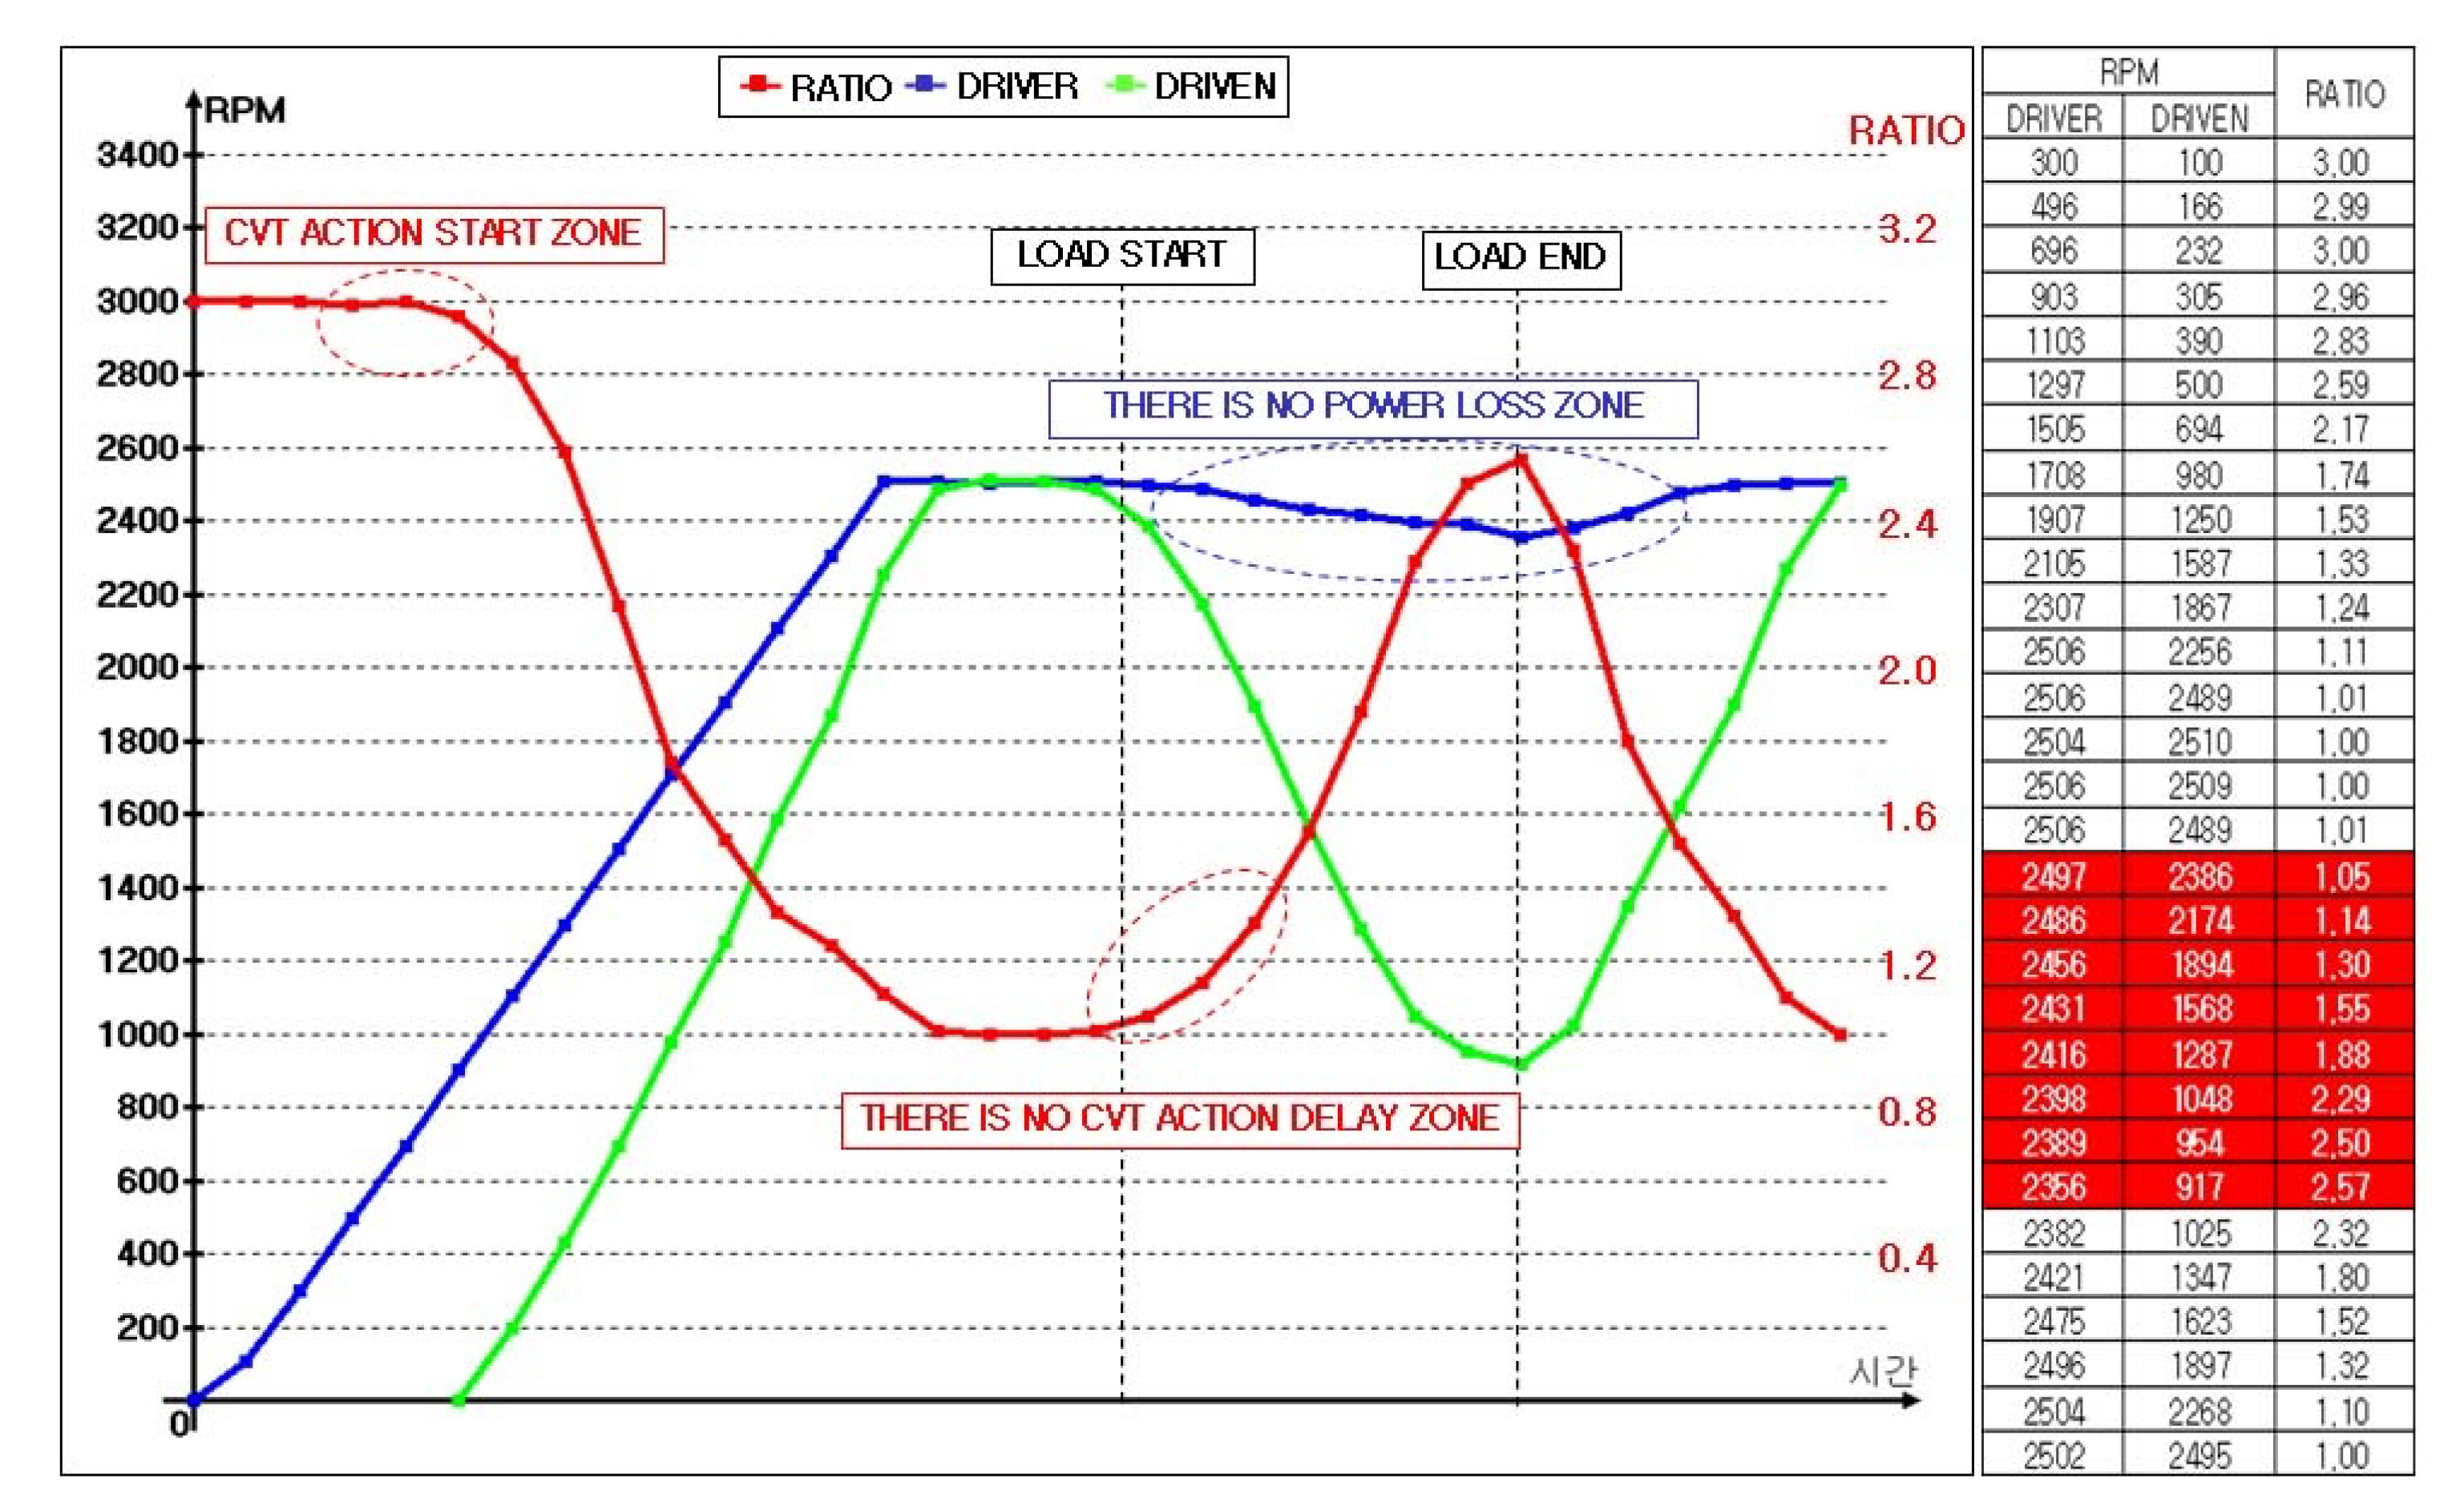
The driving speed was measured, and the driven plate, slip ratio, and transmission ratio are shown in Figure 17.
Figure 15 shows a performance test of the centrifugal belt pulley CVT was performed using a CVT tester. For the test method, Figure 16 shows the default value was entered on the main screen of the CVT tester, and the drive pulley was rotated by 2500 degrees. Figure 17 shows During the test, the change in the driven pulley and reduction ratio during acceleration were examined. In addition, after maximum acceleration, the change in the diameter and reduction ratio of the centrifugal belt pulley was confirmed when a load was applied to the driven shaft by braking.
As shown in Figure 18, when the drive pulley started to rotate, the driven pulley started to rotate as well. When the drive pulley was running at maximum speed, the rotational speed of the driven pulley was approximately equal to the rotational speed of the drive pulley. When a load was applied, at this point, the speed of the driven pulley dropped sharply and the reduction ratio rose to nearly 3:1; however, no significant change in the speed of the drive pulley was observed.
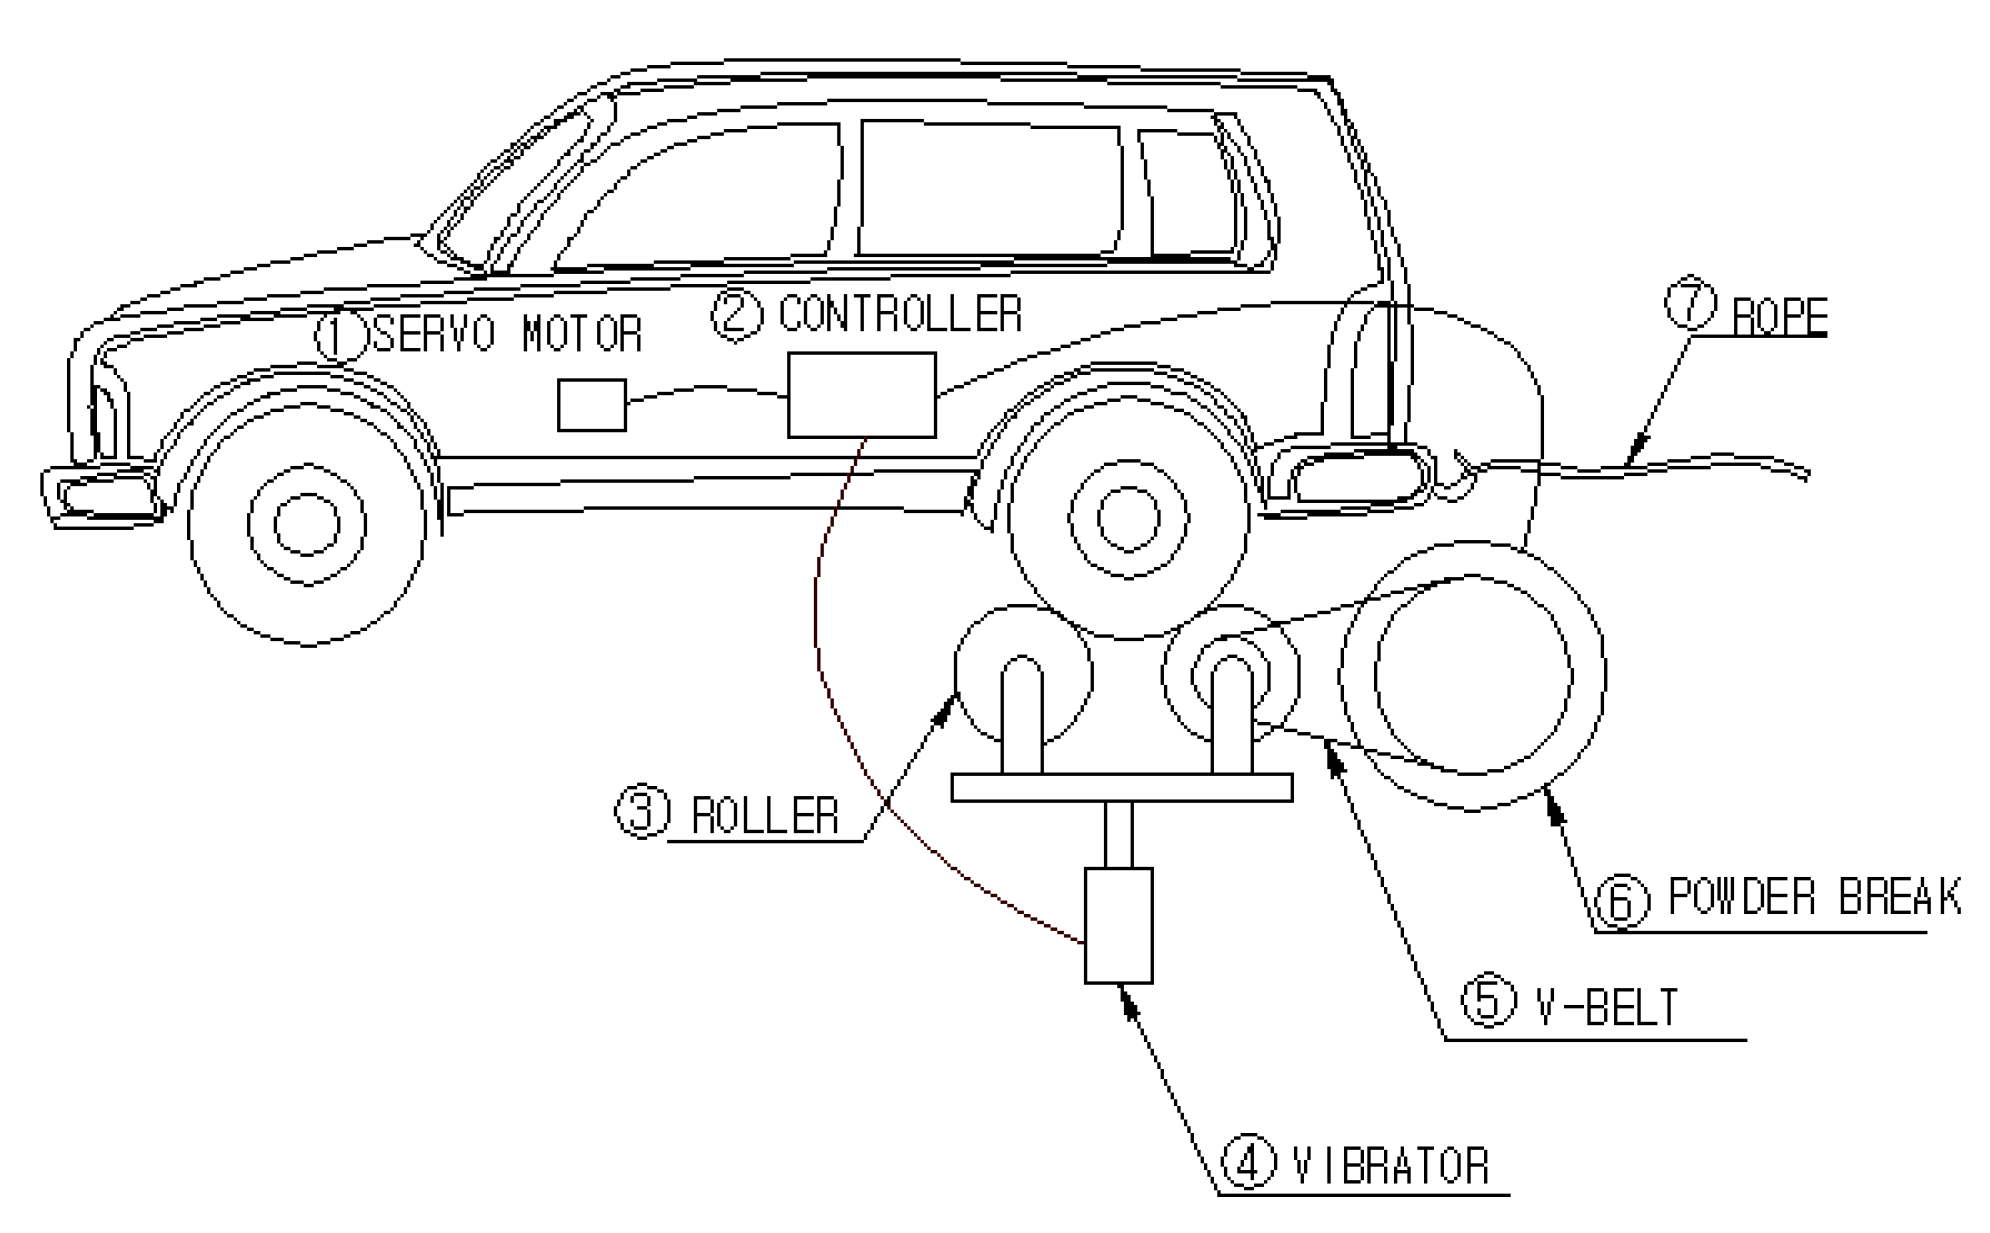
Driving durability tester
Figure 19 shows the driving tester manufactured to test the durability of the centrifugal belt.
The vehicle was equipped with a servomotor to control the accelerator. Additionally, a large roller that transmits rotation and load to the rear wheels, a power brake that delivers a load similar to that experienced when driving uphill, and a vibrator that simulates a road surface in poor conditions were configured to test durability. The vehicle was tied with a rope to prevent it from slipping off the rollers during testing.
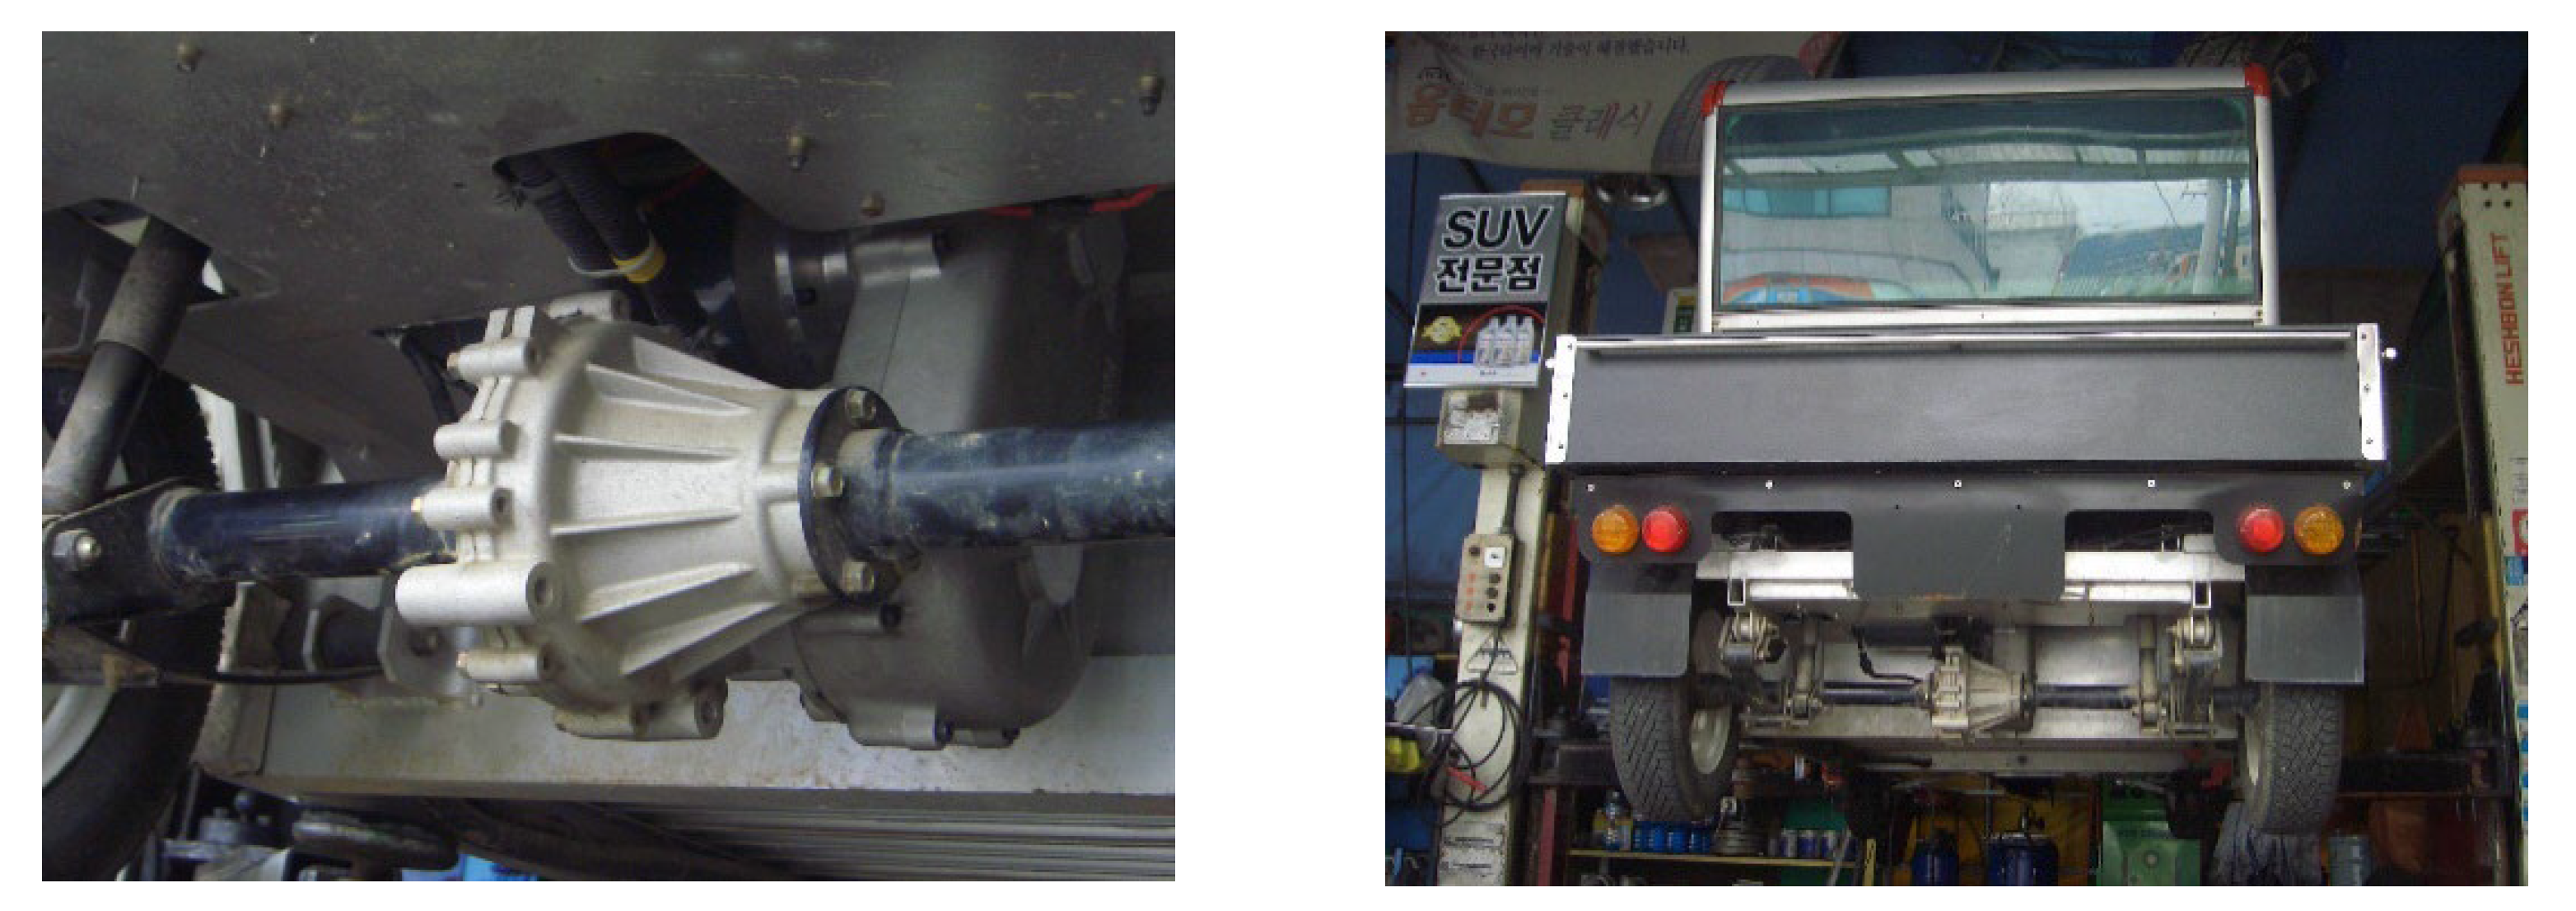
As shown in Figure 20, a driving test and durability test were conducted, in which a centrifugal belt pulley was installed in a 4 kW electric vehicle with a CVT.
6. Conclusions
In this study, experiments were conducted to demonstrate the acceleration, efficiency, and durability of a centrifugal belt-type CVT.
Section 1 is the introduction, and Section 2 described the differences between the existing CVT and the CVT developed in this study. The shifting principle of the new CVT was discussed as well. Section 3 detailed the design variables used to design the CVT and the reason for finding and designing the optimal rail curve. These curves were used to analyze the behavior of the push piece during shifting, and the strength of the CVT plate was examined using Abaqus software. Section 4 discussed photographs of the design and manufacturing of the transmission housing based on the above process. Section 5 detailed the tester that was manufactured for testing the CVT. In addition, the reasons and explanations for the manufactured parts were described.
In addition, a CVT performance tester was manufactured to test the performance of the proposed CVT. The housing for mounting the transmission in a vehicle was designed and manufactured. A driving tester was manufactured for the driving durability test, and driving and durability tests were performed. The findings of this study are summarized as follows:
- (1)
- The reduction ratio was set at 3:1 to provide the initial driving force of a small electric vehicle equipped with a 10:1 reducer.
- (2)
- Two types of plate rail grooves were designed so that multiple push pieces could rotate simultaneously. The behavior of the push part of a rail groove with a normal curve and a spline curve was analyzed using a Fortran program.
- (3)
- It was verified that the rail groove using the spline curve showed excellent acceleration and responsiveness.
- (4)
- The push piece’s spline curve structure was designed for durability and safety.
- (5)
- The shape and structure of the plate were designed to be compact and lightweight, considering the mileage of the vehicle. The housing, which protects against external shocks, was designed and manufactured for small CVTs with centrifugal belt pulleys, considering the distance between the axles.
- (6)
- A performance tester equipped with a drive motor was manufactured, and a control circuit was configured in the main controller to measure the rotational speed and output values. The power-transmission efficiency of the final centrifugal belt pulley CVT was verified using this tester.
- (7)
- Once the performance of the CVT was confirmed by the performance tester, the efficiency was confirmed by evaluating the rotation speed of the output versus the input and the corresponding gear ratio.
- (8)
- The durability of the developed transmission was confirmed using a driving tester manufactured to simulate bad road conditions.
- (9)
- A sudden belt slip occurred due to the regenerative braking operation, due to the characteristics of the traction motor in a downhill or elastic driving condition.
- (10)
- If regenerative braking is required, then it should be possible to stop the motor without using a CVT.
Author Contributions
All authors contributed to this study. All authors designed the new method and conducted the experiments. S.-h.O. and H.-j.D. performed experiments and wrote the manuscript. All authors have read and agreed to the published version of the manuscript.
Funding
This work supported by the Technology Innovation Program (20001184, Development of ultrathin and short precision reducers and high torquetoweight ratio precision reducers for HRC robots) funded By the Ministry of Trade, Industry & Energy (MOTIE, Korea).
Conflicts of Interest
The authors declare no conflict of interest.
Abbreviations
| CVT | Continuously variable transmission |
| TCU | Transmission control unit |
| HEV | Hybrid electric vehicle |
References
- Shin, Y.I.; Shin, S.H.; Oh, T.I.; Suh, J.S.; Song, C.K. Mass Reduction of Transmission Gears for Commercial Vehicles. J. Korean Soc. Precis. Eng. 2012, 29, 319–323. [Google Scholar] [CrossRef]
- Youm, K.W.; Ham, S.H.; Oh, S.H. A Study on the Shift Motor Driving System Optimization of 4-WD Power Transformation Device. J. Korean Soc. Precis. Eng. 2013, 30, 1187–1192. [Google Scholar] [CrossRef] [Green Version]
- Lee, I.K.; Moon, H.H.; Kim, J.J. Study for Examples of Fire Including Friction with Automotive Clutch, Manual Transmission and Tire System. J. Korean Inst. Gas 2015, 19, 49–53. [Google Scholar] [CrossRef] [Green Version]
- Youm, K.W.; Ham, S.H. Study on Shift characteristic of Small reducer using Eccentric arm. J. Korea Acad. Ind. Coop. Soc. 2017, 18, 609–614. [Google Scholar] [CrossRef]
- Park, K.H.; Jung, S.H.; Wee, H.; Lee, G.S.; Cho, S.H. A Study on the Fault Detection of Auto-transmission Using the Vibrational Characteristics of Roller Bearings. J. Korean Soc. Noise Vib. Eng. 2009, 19, 268–2736. [Google Scholar]
- Kim, J.Y.; Yim, C.Y.; Lim, W.S. Development of Shift-By-Wire System for an Automatic Transmission Equipped Vehicle. J. Korean Soc. Automot. Eng. 2005, 15, 41–46. [Google Scholar]
- Kwon, H.S. Assemblability Analysis of the Kinematic Configurations of Ravigneaux-Type Automatic Transmissions. J. Korean Soc. Manuf. Process Eng. 2019, 18, 49–58. [Google Scholar] [CrossRef]
- Julió, G.; Plante, J.S. An experimentally-validated model of rubber-belt CVT mechanics. Mech. Mach. Theory 2011, 46, 1037–1053. [Google Scholar] [CrossRef]
- Kim, S.M.; Zheng, C.; Lim, W.S.; Cha, S.W. Performance Analysis of the Rubber Belt type CVT System. J. Korean Soc. Manuf. Technol. Eng. 2011, 20, 376–381. [Google Scholar]
- Kim, G.S.; Kwon, Y.W. The Development of Gradient Response CVT for a Small Size Electric Vehicle. J. Korean Soc. Power Syst. Eng. 2015, 19, 33–38. [Google Scholar] [CrossRef]
- Yang, Y.; He, X.; Zhang, Y.; Qin, D. Regenerative Braking Compensatory Control Strategy Considering CVT Power Loss for Hybrid Electric Vehicles. Energies 2018, 11, 497. [Google Scholar] [CrossRef] [Green Version]
- Luo, Y.; Baddour, N.; Liang, M. Dynamical Modeling of Gear Transmission Considering Gearbox Casing. Conf. Mech. Vib. Noise 2018, 8, 24–30. [Google Scholar] [CrossRef]
- Karhula, H.; Nicolai, M.; Desmet, W. Exhaustive Synthesis and Analysis of Automotive 2-Stage Planetary Transmission Designs. Int. Power Transm. Gearing Conf. 2019, 10, 37–48. [Google Scholar] [CrossRef]
- Manring, N.D.; Al-Ghrairi, T.S.; Vermillion, S.D. Designing a Hydraulic Continously Variable-Transmission (CVT) for Retrofitting a Rear-Wheel Drive Automobile. J. Mech. Des. 2013, 135, 3–13. [Google Scholar] [CrossRef]
- Ryu, W.; Kim, H. Ratio Control of CVT by Considering the CVT System Efficiency. J. Korean Soc. Automot. Eng. 2006, 14, 157–163. [Google Scholar]
- Zhu, H.; Zhang, Y.; Wang, Y. Study on the Slip Rate of CVT in Un-steady States. IFAC-PapersOnLine 2018, 51, 343–346. [Google Scholar] [CrossRef]
- Dwivedula, R.V.; Pagilla, P.R. Effect of Compliance and Backlash on the Output Speed of a Mechanical Transmission System. J. Dyn. Syst. Meas. Control 2012, 134, 10–18. [Google Scholar] [CrossRef]
- Xiang, C.L.; Huang, Y.; Liu, H. Response Sensitivity and the Assessment of Nonlinear Vibration Using a Nonlinear Lateral–Torsional Coupling Model of Vehicle Transmission System. J. Vib. Acoust. 2015, 137, 13–23. [Google Scholar] [CrossRef]
- Moriwaki, I.; Nishiyama, M. Gear Noise Diagnosis System for Automobile Transmission Using Artificial Intelligence: Improvement of Judgement Performance. Int. Power Transm. Gearing Conf. 2000, 6, 695–700. [Google Scholar] [CrossRef]
Figure 1.
(a) CVT structure; (b) Centrifugal belt pulley CVT structure.

Figure 2.
Principle of centrifugal belt CVT acceleration.

Figure 3.
Deceleration principle of the centrifugal belt pulley CVT.

Figure 4.
Slide plate designed with a normal curve and a guide plate designed with a straight line.

Figure 5.
Slide plate and guide plate design with a spline curve.

Figure 6.
The principle of the design program for improving CVT performance.

Figure 7.
The force on the push piece.

Figure 8.
The force on the CVT for numerical analysis.

Figure 9.
When the normal (orange) and spline (blue) curve of the slide plate rail was 20 degrees at a constant speed: (a) Location of piece over time; (b) Amount of movement of pieces per unit time.
Figure 9.
When the normal (orange) and spline (blue) curve of the slide plate rail was 20 degrees at a constant speed: (a) Location of piece over time; (b) Amount of movement of pieces per unit time.

Figure 10.
When the normal (orange) and spline (blue) curve of the slide plate rail was 30 degrees at a constant speed: (a) Location of piece over time; (b) Amount of movement of pieces per unit time.
Figure 10.
When the normal (orange) and spline (blue) curve of the slide plate rail was 30 degrees at a constant speed: (a) Location of piece over time; (b) Amount of movement of pieces per unit time.

Figure 11.
When the normal (orange) and spline (blue) curve of the slide plate rail was 40 degrees at a constant speed; (a) Location of piece over time; (b) Amount of movement of pieces per unit time.
Figure 11.
When the normal (orange) and spline (blue) curve of the slide plate rail was 40 degrees at a constant speed; (a) Location of piece over time; (b) Amount of movement of pieces per unit time.

Figure 12.
Behavior analysis when the normal (orange) and spline (blue) of the plate rail was 28 degrees during acceleration; (a) Location of piece over time; (b) Amount of movement of pieces per unit time.
Figure 12.
Behavior analysis when the normal (orange) and spline (blue) of the plate rail was 28 degrees during acceleration; (a) Location of piece over time; (b) Amount of movement of pieces per unit time.

Figure 13.
Analysis of plate.

Figure 14.
Prototype production: (a) inside of housing; (b) assembly of reducer and housing.

Figure 15.
CVT tester.

Figure 16.
Main screen of computer output.

Figure 17.
Screenshot: (a) slip ratio; (b) transmission ratio.

Figure 18.
CVT data.

Figure 19.
Driving tester concept.

Figure 20.
Actual vehicle installation.


Table 1.
Design datasheet.
| Belt Length [mm] | Center Distance [mm] | [DR] Pulley Diameter [mm] | [DR] RPM | [DR] Centrifugal Force [N.m] | [DR] Pulley Diameter [mm] | [DR] Centrifugal Force [N.m] |
|---|---|---|---|---|---|---|
| 692 | 175 | 52 | 1000 | 157.8 | 156.0 | 47.6 |
| 692 | 175 | 58 | 1100 | 212.9 | 151.8 | 73.7 |
| 692 | 175 | 64 | 1200 | 279.6 | 147.5 | 109.9 |
| 692 | 175 | 70 | 1300 | 359.0 | 143. | 159.1 |
| 692 | 175 | 76 | 1400 | 452.0 | 138.3 | 224.9 |
| 692 | 175 | 82 | 1500 | 559.8 | 133.4 | 311.5 |
| 692 | 175 | 88 | 1600 | 683.6 | 128.4 | 424.4 |
| 692 | 175 | 94 | 1700 | 824.3 | 123.1 | 570.1 |
| 692 | 175 | 100 | 1800 | 983.1 | 117.6 | 757.3 |
| 692 | 175 | 109 | 1900 | 1193.9 | 108.8 | 1082.7 |
Publisher’s Note: MDPI stays neutral with regard to jurisdictional claims in published maps and institutional affiliations. |
© 2022 by the authors. Licensee MDPI, Basel, Switzerland. This article is an open access article distributed under the terms and conditions of the Creative Commons Attribution (CC BY) license (https://creativecommons.org/licenses/by/4.0/).
Share and Cite
MDPI and ACS Style
Do, H.-j.; Oh, S.-h. CVT for a Small Electric Vehicle Using Centrifugal Belt Pulley. Energies 2022, 15, 8800. https://doi.org/10.3390/en15238800
AMA Style
Do H-j, Oh S-h. CVT for a Small Electric Vehicle Using Centrifugal Belt Pulley. Energies. 2022; 15(23):8800. https://doi.org/10.3390/en15238800
Chicago/Turabian StyleDo, Hyung-jin, and Se-hoon Oh. 2022. "CVT for a Small Electric Vehicle Using Centrifugal Belt Pulley" Energies 15, no. 23: 8800. https://doi.org/10.3390/en15238800
Note that from the first issue of 2016, this journal uses article numbers instead of page numbers. See further details here.