Article

Experimental Investigation of Overdischarge Effects on Commercial Li-Ion Cells

1
National Agency for New Technologies, Energy and Sustainable Economic Development (ENEA), Via Anguillarese 301, 00123 Rome, Italy
2
Department of Chemical, Materials and Environmental Engineering, “Sapienza” University of Rome, Via Eudossiana 18, 00184 Rome, Italy
*
Authors to whom correspondence should be addressed.
Energies 2022, 15(22), 8440; https://doi.org/10.3390/en15228440
Submission received: 11 October 2022 / Revised: 31 October 2022 / Accepted: 9 November 2022 / Published: 11 November 2022
(This article belongs to the Special Issue Stability and Safety of Lithium-Ion Batteries)

Abstract

:
Due to their attractive properties, such as high energy and power density, Lithium-ion batteries are currently the most suitable energy storage system for powering portable electronic equipment, electric vehicles, etc. However, they are still affected by safety and stability problems that need to be solved to allow a wider range of applications, especially for critical areas such as power networks and aeronautics. In this paper, the issue of overdischarge abuse has been addressed on Lithium-ion cells with different anode materials: a graphite-based anode and a Lithium Titanate Oxide (LTO)-based anode model. Tests were carried out at different depths of discharge (DOD%) in order to determine the effect of DOD% on cell performance and the critical conditions that often make the cell fail irreversibly. Tests on graphite anode cells have shown that at DOD% higher than 110% the cell is damaged irreversibly; while at DOD% lower than 110% electrolyte deposits form on the anodic surface and structural damage affects the cathode during cycling after the overdischarge. Furthermore, at any DOD%, copper deposits are found on the anode. In contrast with the graphite anode, it was always possible to recharge the LTO-based anode cells and restore their operation, though in the case of DOD% of 140% a drastic reduction in the recovered capacity was observed. In no case was there any venting of the cell, or any explosive event.

1. Introduction

Li-ion batteries are used in an increasing number of applications, from portable devices, such as laptops and smartphones, to electric mobility, and even in more complex systems such as aeronautic applications and power networks. However, it is widely recognized that they are still affected by a number of problems connected to reliability and safety, mainly due to their thermal instability [1,2,3,4,5,6,7,8,9,10,11]. During normal operation, they produce a variable amount of heat, which is usually adequately dissipated toward the external environment; however, under some conditions, the heat generated is so large that the internal temperature of the cell will dramatically increase initiating additional exothermic reactions that can finally lead to the failure of the cell, sometimes with harmful consequences, such as fires and/or an explosion (thermal runaway).
These dangerous conditions are usually named abuse conditions, and they are commonly divided into electrical abuse, mechanical abuse, thermal abuse and so on, depending on the specific cause at the origin of the failure. In order to avoid these hazardous conditions, the cells must operate within specific voltage, temperature, current, etc., limits, which are specific for each type of cell. To this end, most cells are commonly provided with a specifically designed control system, the so-called Battery Management System (BMS), to keep the cell within safe limits and thus prevent thermal runaway. Nonetheless, because of a BMS failure or of other external events (mechanical impact, object intrusion, extreme environmental conditions, etc.) an abuse condition may still happen.
Because of the importance of Li-ion batteries, besides a continuous search for new materials to increase the electrochemical and safety performance of the batteries, especially for high-rate applications [12,13], several studies in the literature have addressed some abuse conditions, such as overheating, high temperature, short circuits and overcharge, while less attention has been devoted to overdischarge. Significantly, fewer accidents are reported as a consequence of overdischarge, and this is probably because of the intrinsic characteristics of that condition: a discharged cell is characterized by a relatively low State Of Charge (SOC), i.e., contains less energy than under other conditions, and consequently, a thermal runaway is less frequent in this case, or, would an accident occur, more moderate consequences might be expected [14,15,16]. After tests on commercial LCO/graphite cells, Maleki and Howard [17] found out that, though overdischarging can lead to permanent capacity loss and adversely affect the cycle-life of the cells, even deep overdischarge (between 2.0 and 0.0 V) had no impact on their thermal stability and no harmful consequences were registered, except for gas generation and cell swelling. Hendricks et al. [18] detected no short circuits, nor any metallic copper deposition, even after several cycles of normal operation, for nickel cobalt aluminum (NCA) oxide and graphite cells that underwent a single overdischarge event, but capacity fade was observed for cells overdischarged to 0 V; despite their results, they nonetheless warn that “some residual risk may remain” and that even a simple capacity degradation “may not be acceptable for all applications, and ultimately the tradeoffs need to be weighed against the operational requirements”.
The occurrence of more or less damaging internal shorts and other minor consequences, such as power loss and accelerated decay, have been reported by several authors [19,20,21,22,23,24,25]. Based on tests on NMC cells, Lai et al. [23] observed that at an increasing degree of overdischarge, stronger internal shorts would occur, until it became impossible to recharge the cells, with the critical point being between 110–120% DOD. In particular, even partially damaged cells could be restored after a long rest, but not for DOD larger than the critical point, suggesting that an irreversible Internal Short Circuit (ISC) had occurred after that point. It is worth noting that, although Juarez-Robles et al. [24] have recently defined the reverse potential point (i.e., when E = 0 V) as the distinguishing condition for slight and deep overdischarge, in many cases different assumptions have been adopted, so that an immediate comparison among the results reported in the literature cannot always be carried out. After analyzing Li-ion cells with different compositions, Brand et al. [25] reported no hazardous temperature increase after overdischarge, but they detected some electrolyte leakage from the battery case, indicating that some pressure increase, with a subsequent release, had occurred. They also found that among the various cathode materials adopted, LFP proved to be more stable, as also confirmed by subsequent studies for different abuse conditions [26]. Different from [25], Wang et al. [27] registered temperature peaks well above 90–110 °C, depending on the discharge rate, after deep overdischarge of commercial NCM811 (Li(Ni0.8Co0.1Mn0.1)O2) 18,650 cells, though no fire/explosion or thermal runaway were detected. From a different perspective, Jeevarajan et al. [28] showed that a single unbalanced cell in either a series or parallel pack can result in high temperatures throughout the pack with possible catastrophic events.
In addition to the above-reported studies, it can be observed that overdischarge can frequently happen, more frequently than other abuse conditions and even under seemingly ordinary conditions: for example, when several cells are connected in a series configuration, such as when high voltages are required (e.g., electric vehicles), an imbalance among the cells can lead to overdischarge of some of them; slight manufacturing or capacity differences between them can lead to the same result; and a well-operated, or even resting, cell can reach an overdischarge condition because of parasitic currents and/or internal losses. In addition, when a cell can be recharged and operated after an overdischarge event, it might still fail sometime later during operation, even after several cycles of operation, when the SOC is high or at full capacity and the energy content is not negligible as for low SOC states. For cells in a module or pack, an overdischarged cell, or group of cells, can cause overcharging of other cells during the successive charge phases with their possible failure; this event would be more hazardous than the overdischarged cell failure, due to the corresponding larger amount of stored energy. Lastly, even neglecting the direct safety issues, the failure of a battery system can represent a serious reliability problem that can give rise to heavy or catastrophic consequences due to indirect effects, such as power loss.
Based on the above considerations, it is clear that a deeper knowledge of Li-ion cell overdischarge mechanisms and modalities of occurrence is required to prevent dangerous events such as thermal runaways or power failures from occurring and to provide guidance for proper operation and control of the battery packs by effective BMS design.
In several studies, it was confirmed that varying levels of damage can be generated by different levels of overdischarge [23,29,30]; however, the main mechanism of failure is largely always due to the dissolution of the copper current collector and the subsequent deposition of copper on the electrodes, in particular on the anode, during the subsequent charge phases [14,15,17,31,32,33,34,35,36,37]; although some differences were observed among the various materials [17,38] in terms of structural and thermal stability, copper deposition was almost always detected, independently of the electrodes materials. LFP and LMO cathodes usually show better performance than other materials [24], at least for limited overdischarge [19]. The deposited copper gives rise to the formation of copper dendrites within the cell and subsequent short circuits which will finally cause its failure or self-discharge [14,39]. Hendricks et al. [18] state that the deposition of copper happens only when polarity reversal has occurred [33].
In addition to copper dissolution, according to Fear et al. [15], the delayed failure of an abused cell occurs because of the large amount of heat produced by internal shorts during the cell recharge attempts. Ouyang et al. [29] claim that the increased heat generation, and its associated temperature rise, are due to the markedly enhanced internal resistance caused by an excessive increase of the cathode electrolyte interface and the simultaneous deposition of inactive lithium. Juarez-Robles et al. [24] report that the internal resistance depends both on the state of charge (SOC) and the extent of the cutoff voltage; moreover, the temperature increase during discharge is always greater than during charge.
Zhang et al. [40] reported that the capacity loss of an LCO/mesocarbon microbeads cell depends on the degree of overdischarge: a slight overdischarge produced little or no effect on the battery capacity, while larger overdischarges (in that case, above 115% DOD) seriously reduced the cell capacity and increased its polarization during long-term cycling. The effect also depended on the material affected, with the LCO cathode less affected than the MCMB anode, where a larger increase of the SEI film was observed [35,40,41], thus suggesting that the increase of the SEI layer might be the main reason for the capacity degradation of an overdischarged battery. Lui et al. [42] also detected a more significant increase of the SEI layer on the anode rather than on the cathode, and their results were also confirmed by the more recent experiments by Zhang et al. [35], who also highlighted the influence of repeated overdischarges over a single event. Maleki and Howard [17] claimed that the gas build-up and swelling of the cell they observed was caused by the destruction and subsequent regeneration of the SEI, especially at elevated temperatures; this aggravating effect of a higher temperature is also reported by Ouyang et al. [29].
Based on the above discussion, it is apparent that overdischarge is an abuse condition that deserves further attention: an overdischarged cell is susceptible to significant degradation or, though more rarely, catastrophic failure, especially when submitted to multiple charge/discharge phases; it can also impact adjacent cells, when integrated into a module or pack, with a possible threat to the system operability or operator/user health. Juarez-Robles et al. [24] clearly stated that although overdischarge can be often considered a benign abuse condition, it can nonetheless “turn into a problematic hazard cause when combined with a subsequent charging”. In addition, according to Maleki and Howard [17]: “Behavior of this Li-ion cell is unpredictable when overdischarged to 0.0 V”
Despite some recent investigations, some aspects of the phenomenon are not clear yet, and, above all, most of the previous works are often focused on a limited range of cell materials and discharge conditions. In the present work, two types of Lithium-ion cells, both with an LCO cathode but with different anodic chemistries, have been adopted and compared: a graphite-based anode cell (NCR18650B) and a Lithium Titanate Oxide (LTO)-based anode cell (LTO40120). The cells underwent different overdischarge levels, almost all of them with polarity inversion. This allowed us to assess the effects of a varying depth of discharge (DOD%) on the life and performance of a given type of cell, and, at the same time, to compare the influence of the anode material at the same percentage level of electrical abuse.
The tests were performed in a climatic chamber for abuse tests in order to work under controlled ambient conditions. Some of the graphite-based anode cells have also been analyzed using Scanning Electron Microscopy (SEM) in order to highlight any morphological changes following the abuse event.

2. Materials and Methods

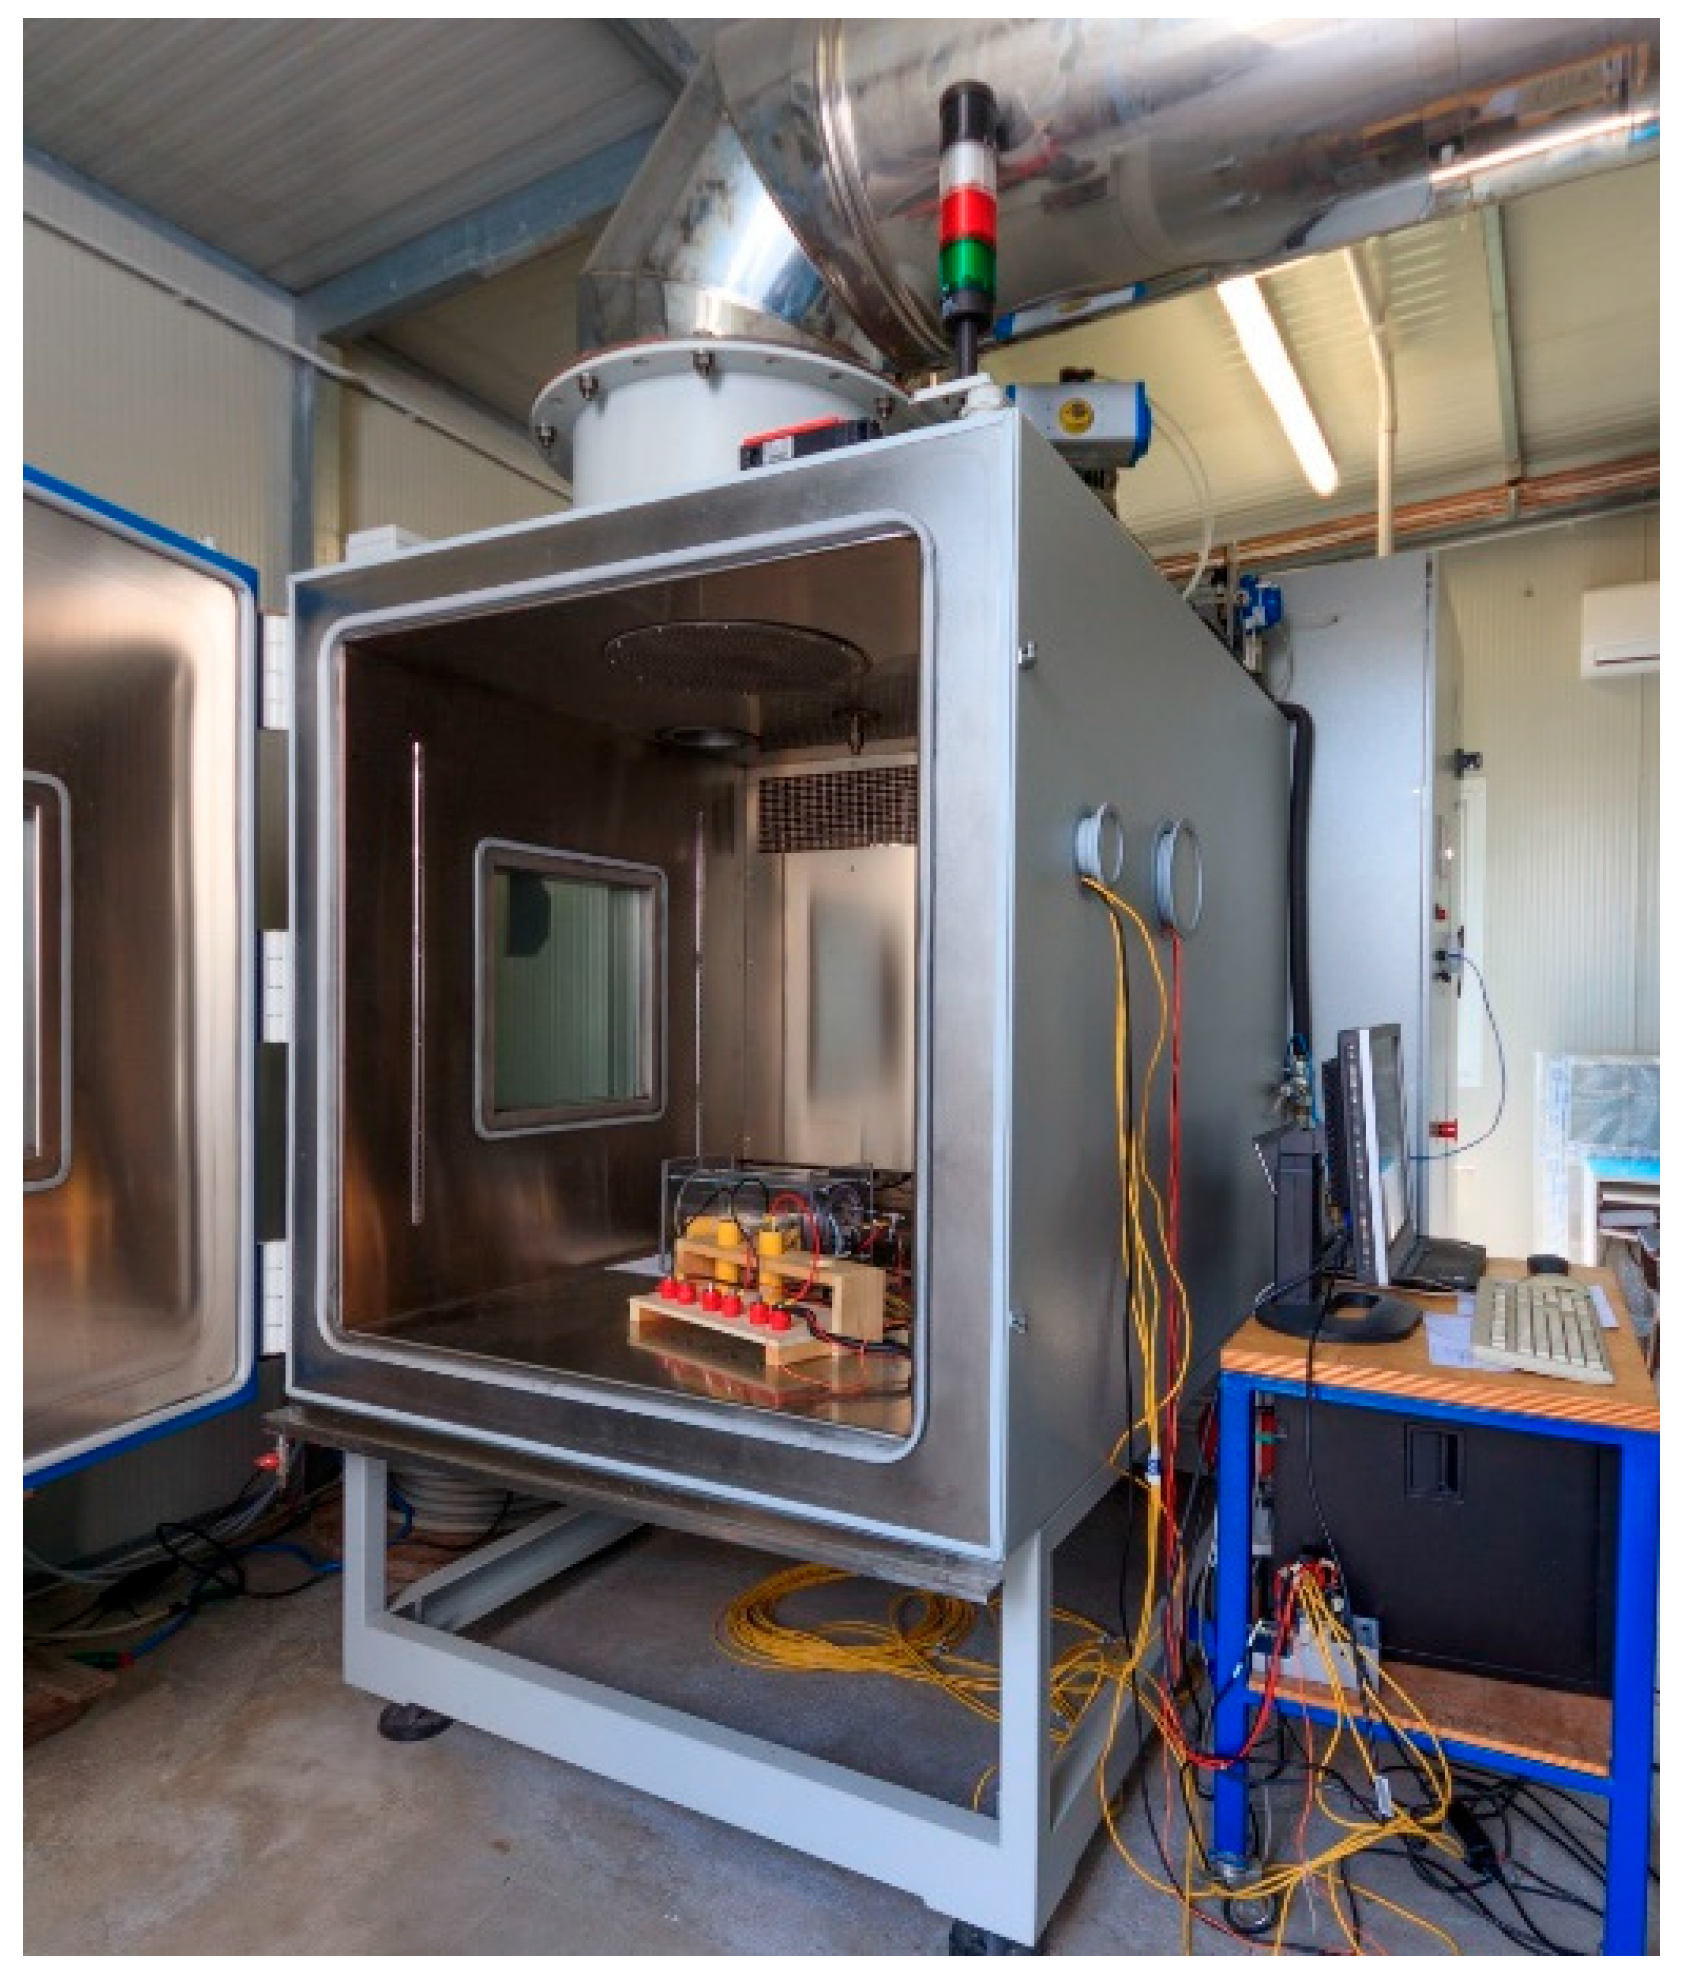
2.1. Experimental Set-Up

The overdischarge tests have been performed in a climatic chamber specifically designed for abuse tests on batteries (Figure 1). The load-bearing structure of the chamber is made up of carbon steel panels and profiles protected by powder coating based on polyester resins properly selected for their excellent resistance to atmospheric agents and abrasion. The treatment compartment of the chamber is made of fully vapor-tight welded stainless-steel sheet (AISI 304). Thermal insulation is obtained by the use of polyurethane panels and glass wool in panels treated with a special binder based on thermosetting resins.
The tested cell is placed inside an instrumented box (Figure 2) to monitor the necessary parameters and to avoid the dispersion of mechanical parts following a possible explosion.
Monitoring of the abused cell is performed by:
  • A pressure transmitter (PTX 610-I: range 0–10 barg, output current: 4–20 mA dc nom): a pressure increase in the box, would indicate that the cell has released gas (venting) or has failed, in the form of a relatively moderate rupture or an explosion.
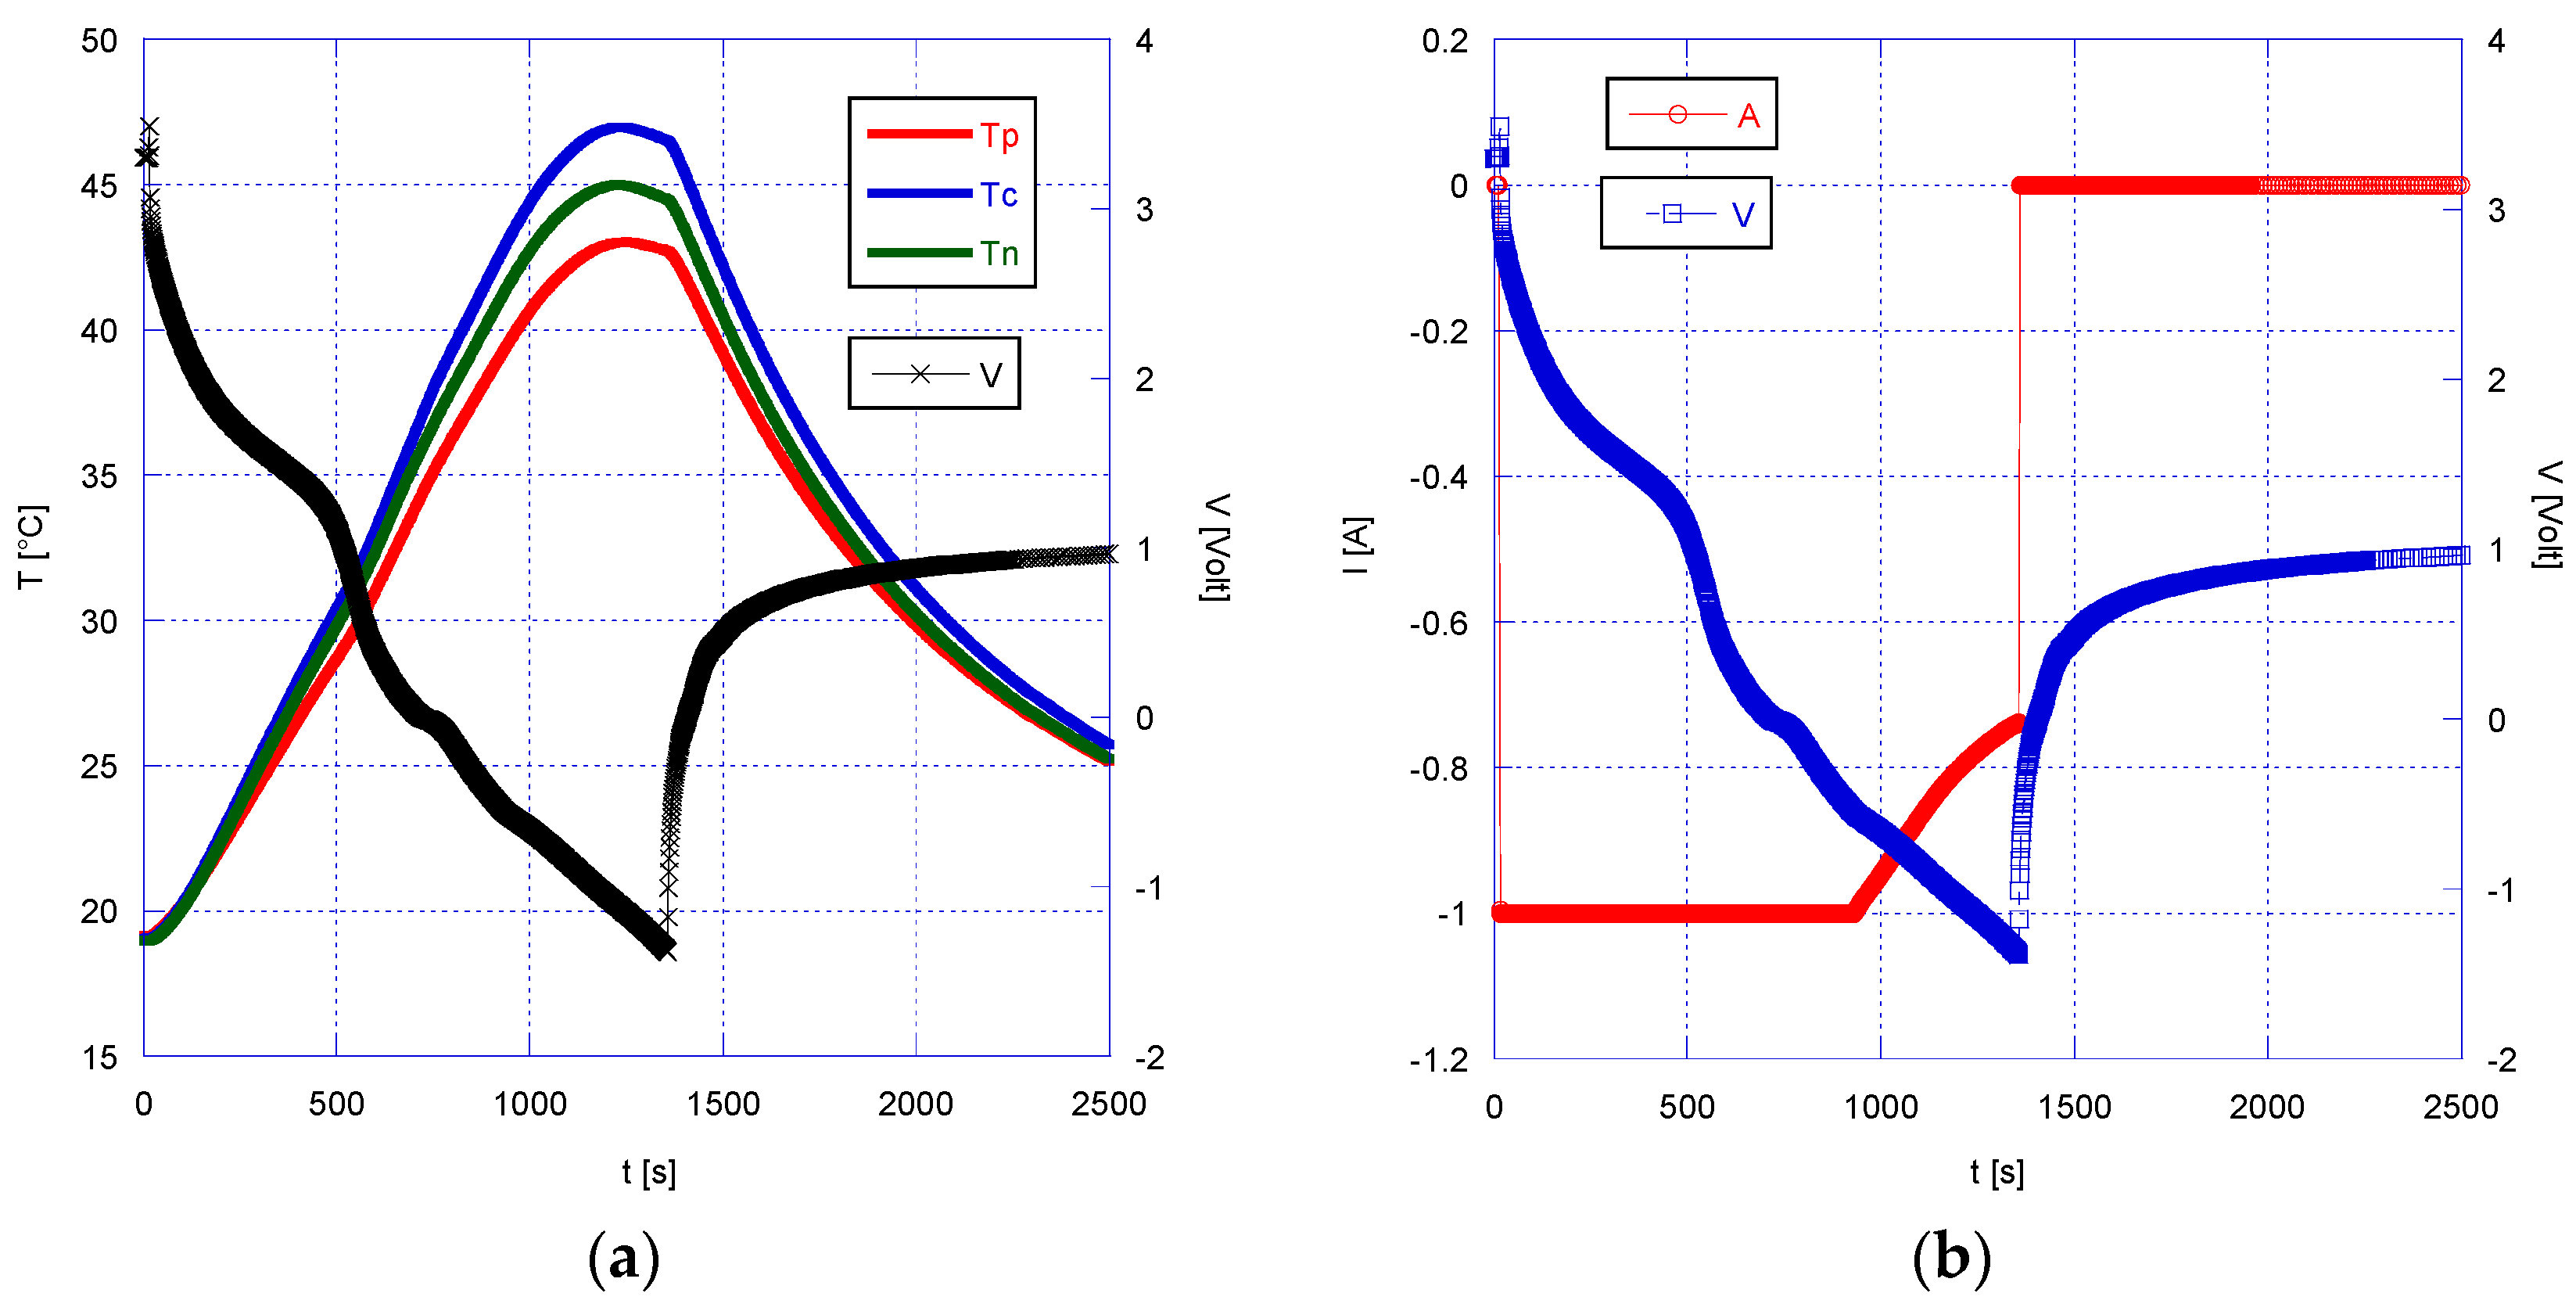
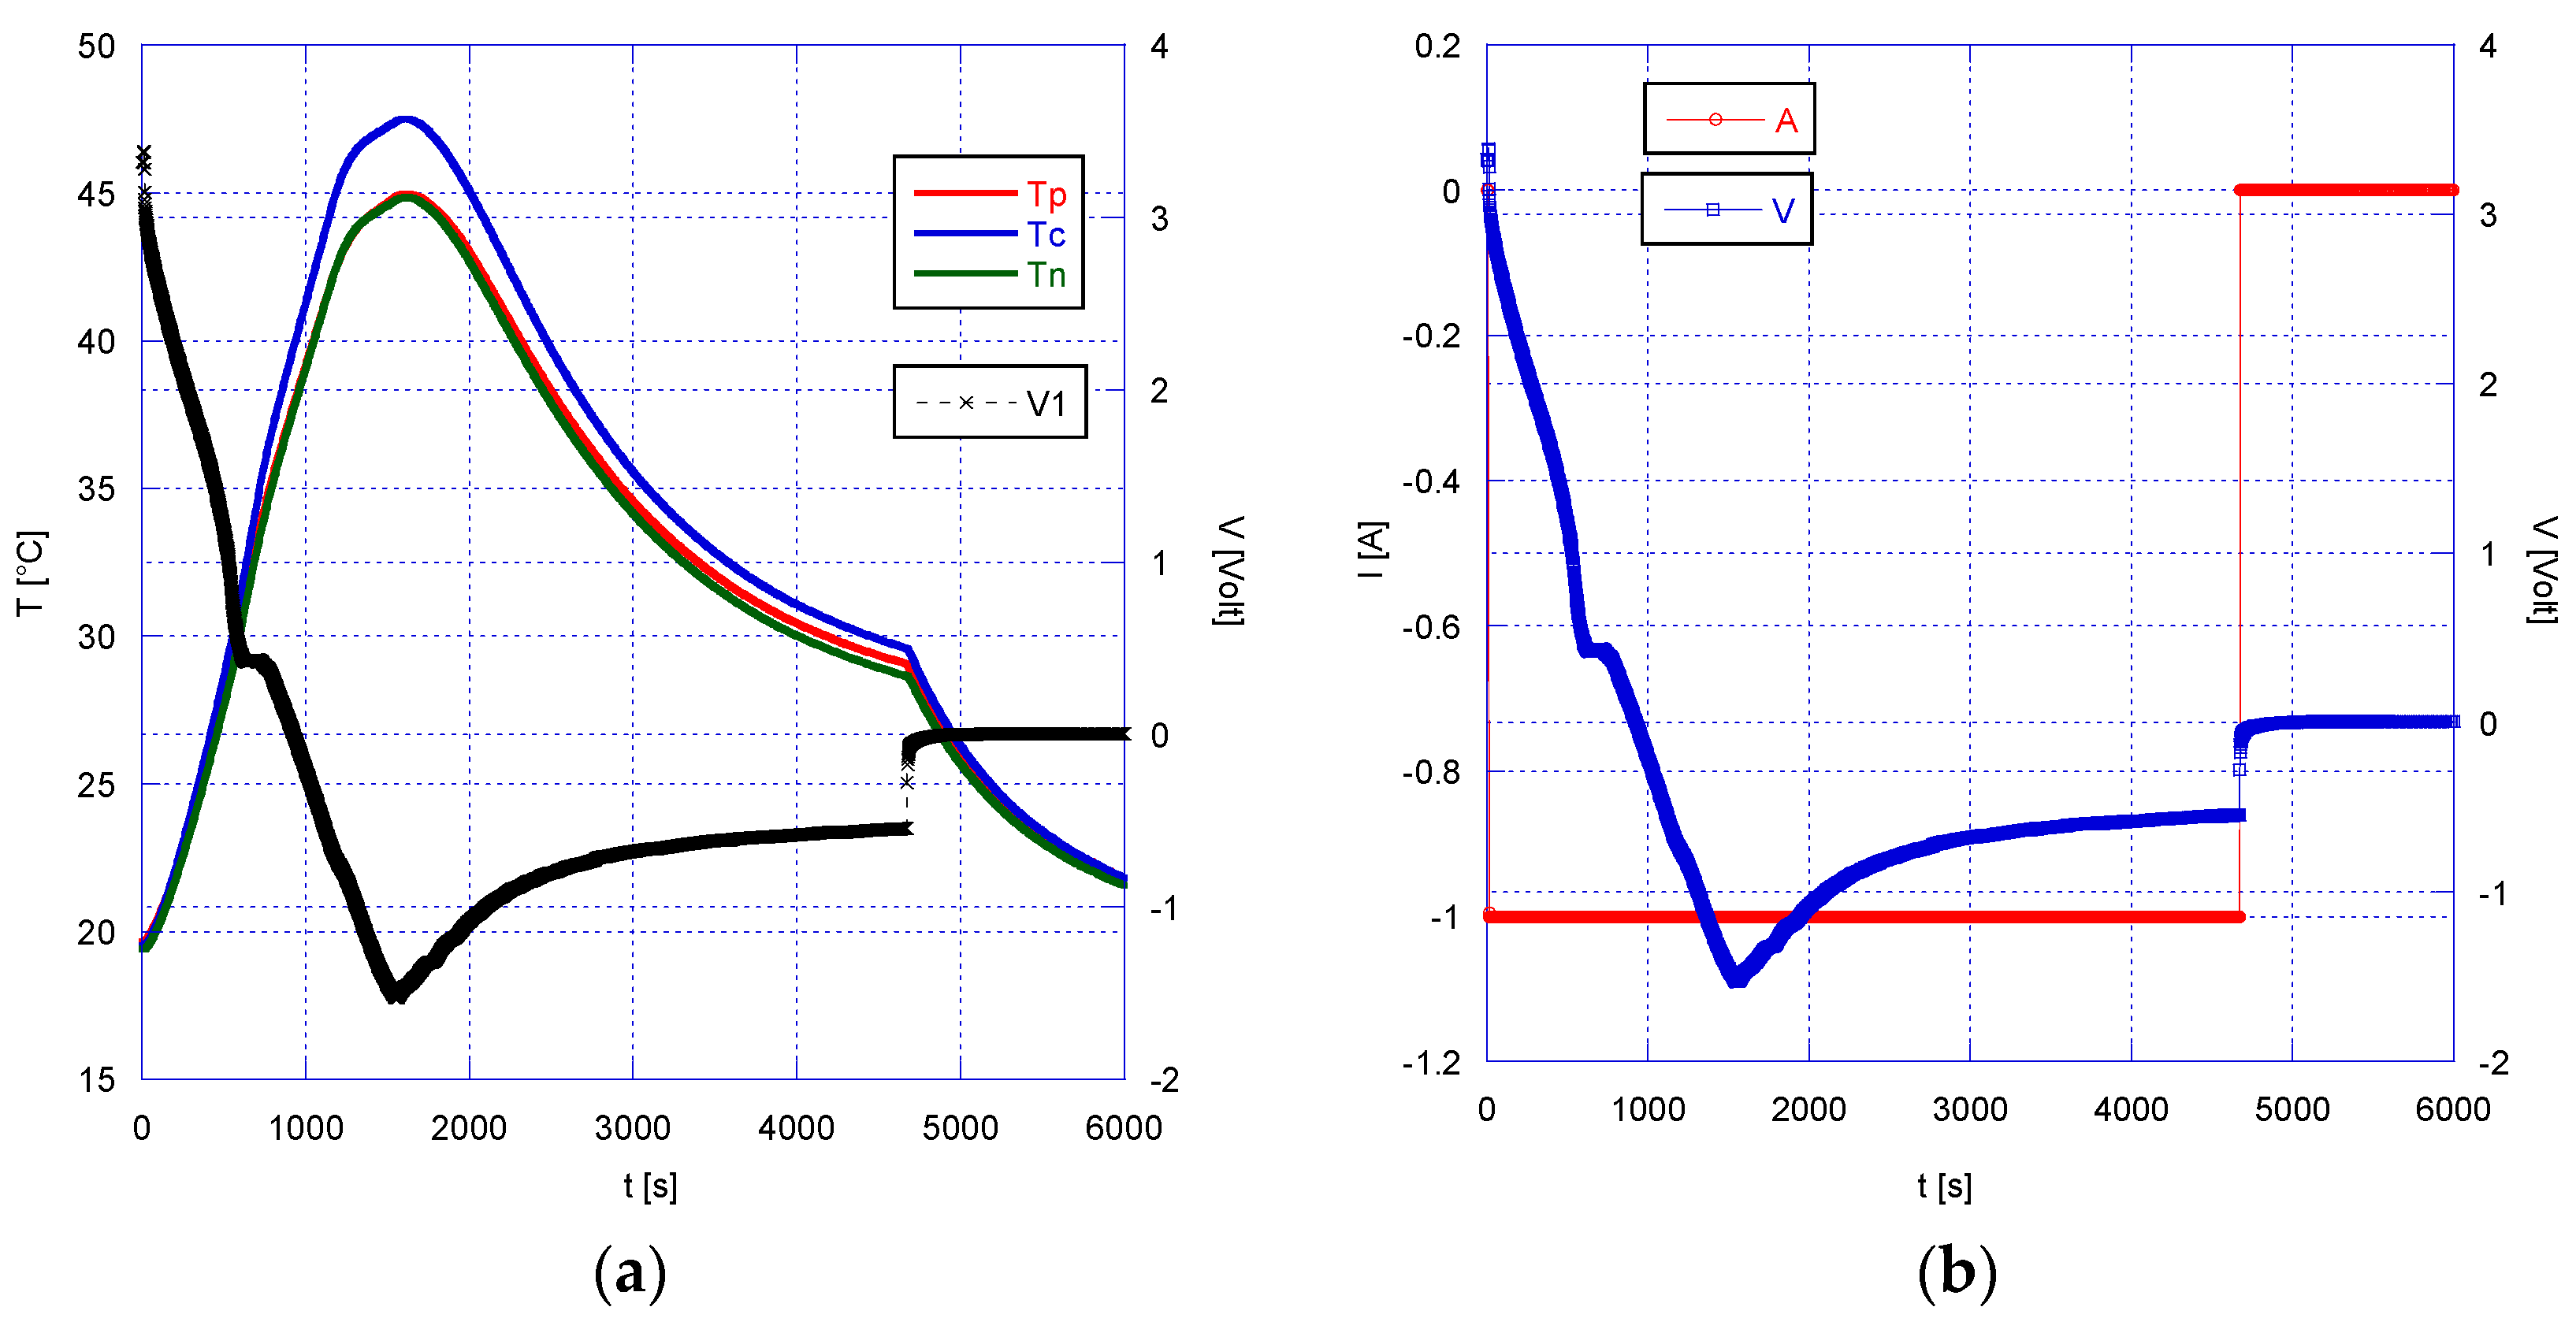
  • 3 calibrated thermocouples, type K (accuracy of ±0.1 °C) located in three different points of the cell: in the upper part (Tp), in the central part (Tc) and the lower part (Tn);
  • A National Instruments “CompactDAQ” chassis with a thermocouple module (24-bit ADC, 16 channels) and one voltage input module (16-bit ADC, 32 channels);
  • A data acquisition system specifically designed using LabVIEW.
A pressure relief valve has also been installed in case the maximum allowable pressure of the system was exceeded (SS-RL3S4).
The tests on the cells with a graphite anode have been performed by cycling the batteries with the bidirectional power supply ITECH Model IT6005C-80-120 5 KW with the dedicated data acquisition software ITS5300.
The tests on the cells with a Li4Ti5O12 (LTO) anode have been, instead, performed with a portable cycler Eltra E-8325 (voltage 0 ÷ 18 V, maximum charge current 80 A and maximum discharge current 150 A).
The main characteristics of the tested cells are shown in Table 1.

2.2. Experimental Procedure

The test procedure included:
(1)
A preliminary test of the initial capacity. The cell was placed in the climatic chamber for 3 h at controlled room temperature. After that, the following cycle was repeated three times, with a rest of 60 min between consecutive cycles:
  • Discharge at 1/3 C up to a minimum voltage of 2.5 V for graphite-based anode cells and 1.6 V for Lithium Titanate Oxide (LTO)-based anode cells;
  • 1 h rest;
  • Charge at 1/3 C with the CC-CV method.
(2)
Overdischarge at 1/3 C until different depths of discharge. The depth of discharge has been defined here as the amount of charge removed from the battery at the given state versus the total amount of charge that can be stored in the battery [43], i.e.:
D o D   % = r e m o v e d   a m o u n t   o f   c h a r g e m a x i m u m   a v a i l a b l e   c h a r g e × 100   .
During the overdischarge tests, two, three, or four cells are used in series taking into account the depth of discharge that must be achieved (Figure 3): at the beginning of the test, one, two, or three cells are fully charged with a State Of Charge (SOC%) equal to 100%, while the cell to be abused is completely discharged (SOC = 0%). This configuration, with several cells in series, allows the cycler to discharge the cell subjected to electrical abuse, below the minimum operating voltage of the instrument; the bidirectional power supply reads the overall voltage, while, with the LabVIEW acquisition system, it is possible to monitor the single cell voltages.
(3)
Re-charge of the abused cell. The overdischarged cells, when possible, are then recharged up to the maximum voltage value (SOC% = 100%) using a CC-CV method.
(4)
Final capacity test. The capacity test, as performed in the preliminary phase (i.e., before the overdischarge, with three full cycles), was repeated. The results are then compared with those obtained with the initial capacity test in order to verify the capacity decay of the cell due to the overdischarge abuse.
In addition to measuring the mentioned parameters, some physical observation of the tested cells was also carried out. Some of the overdischarged cells were disassembled (Figure 4) and the electrodes were analyzed with a Scanning Electron Microscope (SEM), model Tescan Vega 3 (LaB6), which, through a non-destructive technique, allows morphological investigations of the surfaces. By identifying the chemical elements present on the material surface, it was also possible to derive multiple indications about the modifications suffered by those materials. First, the cap at the positive terminal, where the protection devices (CID and PTC) are located, was removed; then, the metal case was removed using a Dremel mini rotary saw; finally, the cell was unrolled and the single components were isolated: the anode layered on the copper collector, the cathode layered on the aluminum collector and the separator soaked with the electrolyte (Figure 4).

3. Results and Discussion

Two types of Li-ion cells, with different anodic chemistries, have been studied: graphite-based anode cells and Lithium Titanate Oxide (LTO)-based anode cells. They were subjected to abuse at different depths of discharge (DOD%) as reported in Table 2 and Table 3. The tests have been performed by continuously monitoring temperature, cell voltage and pressure in the instrumented box.

3.1. Graphite-Based Anode Li-Ion Batteries

Table 2 summarizes the results obtained after the overdischarge tests performed on NCR18650B cells. Specifically, the following data are reported:
  • The depth of discharge values (DOD%) achieved for each tested cell, calculated according to the definition given above;
  • Whether or not it was possible to recharge the cell after the electrical abuse;
  • The depth of discharge at which the inversion of the cell voltage trend occurs (this issue will be discussed more fully in the following analysis of results);
  • The depth of discharge at which cell polarity inversion occurs (V = 0);
  • The ratio between the final and initial average capacities both during charge and discharge.
The cell overdischarged with a DOD% = 110% (Figure 5) didn’t suffer permanent damage and could be recharged at almost full capacity. The cell reached a minimum voltage value of −1.38 V. During the test, a gradual increase in the temperature was recorded, with a maximum peak of 47 °C (Tc), corresponding to a temperature increase of about 27 °C in 1400 s; a small difference of about 2–3 °C was observed among the different points on the cell surface, indicating a small thermal gradient within the cell. The capacity of the cell after the abuse test was reduced by 2% during the charge and 3% during the discharge (see Table 2). During the capacity tests after the overdischarge abuse, the temperature increased, during both the charge and the discharge, by about 2–3 °C and 4–6 °C, respectively (see Figure 6b); a similar behavior in the temperature increase during charge and discharge has already been mentioned by Juarez-Robles et al. [24].
For a depth of discharge higher than 110%, the cells suffered irreversible damage and it was not possible to restore their operation. Based on tests on commercial prismatic-pouch cells with an NMC cathode, Lai et al. [23] found out that for DOD higher than 110%, it was difficult to recover the original cell voltage, and more specifically “The greater the degree of overdischarge, the smaller is the degree of voltage recovery… the greater the internal damage and the more serious is the ISC.” Similarly, Guo et al. [33] submitted NCM cells to extreme overdischarge of a varying degree and found that for cells whose discharge was terminated before 112% DOD, full recharge was possible with minor effects, while cells discharged beyond 114.5% DOD could not be fully recharged.
In Figure 7, the temperature, voltage and current trends are shown for a cell overdischarged at a DOD% of 140%. The cell reached a minimum voltage, of about −1.53 V for a DOD% equal to 113%. During the test, a gradual increase in the temperature was recorded with a peak of 47.5 °C, i.e., a temperature increase of about 27.5 °C in 1550 s, again with a small variation of 2–3 °C on the cell surface. After reaching the minimum voltage value and the temperature peak, the voltage started to rise again to a value of −0.5 V (despite the bi-directional power supply continuing to draw current at a constant value of −1 A) and the temperature gradually decreased, reaching a value of 29 °C at the end of the overdischarge test. An unexpected result, a sort of “self-restoring” of the cell, was observed by Erol et al. [44], who reported that, if a LIR2032 coin cell (LCO cathode) was allowed to rest for two days at an open-circuit condition after overdischarge to 2.2 V (minimum nominal voltage = 3 V), it was able to return to a voltage value within the nominal range (3–4.2 V). They also showed the reversibility of the impedance behavior of an overdischarged cell.
In all the tests performed on the cells with a graphite anode, including the DOD = 110% case, the phenomenon of polarity inversion (i.e., the cell voltage reaches values lower than 0 V) was always observed, at a DOD% of about 106%: therefore, this phenomenon seems not directly associated to the irreversible cell failure. Conversely, the cells failed, with permanent damage, in all those tests where an inversion of the cell voltage trend during overdischarge did occur: the failure, therefore, might be actually associated with the phenomenon of this voltage profile inversion. Given the recognized variability in the performance of different samples of the same Li-ion cell type, and based on the results reported in Table 2, it can be derived that this phenomenon occurs at a depth of discharge of between 110–113%. As seen above, in the tests where the inversion of the voltage trend was observed, a simultaneous inversion in the temperature trend was also registered (see for example Figure 7a): after a rapid increase, the temperature tends to stabilize and then to markedly decrease. In common with the voltage, in all cases a constant increase of about 27–28 °C with respect to the initial temperature, was observed, corresponding to a maximum temperature of 48 °C, seemingly independent of the final DOD%.
The abused cells were disassembled and the electrodes were observed under a Scanning Electron Microscope in order to identify any morphological changes. The comparison was carried out on three graphite-based anode cells, specifically: a new cell and two overdischarged cells with a DOD% of 110% and 140%, respectively. The SEM images of the anode and the cathode of the three cells are shown in Figure 8 and Figure 9 respectively, at a 5000× magnification.
In the cell overdischarged with a DOD% of 110% and subsequently operated for different cycles after the abuse, the SEM analysis revealed electrolyte deposits clearly visible on the anode (see Figure 8b), while apparent damage is found on the cathode, with significant loss of material and the generation of “holes” in the coating, which reveal the substrate (Figure 9b). This loss of material could be either direct damage after operating or might be due to the mechanical stress on a weakened and distressed cathode layer during the opening of the battery. In contrast, the cell overdischarged with a DOD% equal to 140%, does not show significant morphological changes. Based on these results, it seems that the damage to the electrodes in an overdischarged cell is unlikely to be related to the final DOD%, but rather to the cycles following the overdischarge abuse. An EDX detector was also used to analyze the elemental composition of the solid surfaces. The composition of the cathode of the cell overdischarged with a DOD% of 110% differs from the new cell in terms of the high percentage of aluminum and low percentage of fluorine (Figure 10). Based on the composition analysis of the anode (Figure 11), on both abused cells, it emerged that there was a high percentage of copper present compared to the new cell, indicating the partial dissolution of the current collector during overdischarge.
These results are in agreement with the findings of Maleki and Howard [17] who noticed the significant deposition of copper on the anode-side of the separator; smaller amounts of copper were also found on the cathode, highlighting the possibility of copper-ion migration through the separator itself and the probability of internal shorts due to copper dendrites. It is worth highlighting that these results were actually found on only one cell out of three, but, as previously stated, most cells can present unpredictable behavior under the same conditions. After multiple overdischarges and successive cycling of LCO-MCMB cells, Zhang et al. [35] observed no significant changes in the structure of the anode, which was, however, covered with dissolved copper; under the same overdischarge conditions (115% DOD), the LCO cathode underwent a phase transition with significant microstructure damage. However, even though the structural integrity of the anode was better preserved than that of the cathode, the performance decay of the cells was charged to the considerable increase in the SEI film on the anode. Partly in contrast with the above results, Fear et al. [15] observed deposition of copper on both electrodes as well as on the separator; the cathode (NCA, LiNi0.8Co0.15Al0.05O2 i.e., nickel cobalt aluminum oxide) in some locations showed some structural damage with some detachment of the active material from the electrode, but was essentially free of cracks, while the anode (graphite) presented large gaps in the roll. Wang et al. [27] also reported the deposition of Cu ions on both electrodes and the collapse of the graphite anode, while Ouyang et al. [29], analyzed the changes on LCO cathodes after slight overdischarge (0.5–0.2 V), and found that an extended transfer of lithium ions from the anode to the cathode causes an excessive increase in the CEI passivation layer and, at the same time, the formation of many holes on its surface, due to the impact of the ions, with the creation of a corroded layer.

3.2. Lithium Titanate Oxide (LTO)-Based Anode Li-Ion Batteries

In order to check the influence of the cell materials, overdischarge tests have been carried out on cells with an LTO anode; given the lack of available data in the literature, the results obtained, and shown in Table 3, are compared with those for the graphite cells.
The cell overdischarged with a DOD% = 110% reached a minimum voltage of 1.07 V, and this is the only test where polarity inversion was not observed (Figure 12, Table 3). In contrast to the graphite cells, during the overdischarge test, a small temperature increase of about 2 °C in 1200 s was recorded.
After a long break, the cell was recharged: during the charge the cell didn’t show any anomalies and drew current with no problems, reaching a voltage value of 2.4 V after about 1200 s. A negligible temperature increase, this time of about 1.5 °C, was again recorded, and the cell capacity didn’t show any reduction after the abuse (see Table 3). Furthermore, no significant temperature variations were recorded during the cycles following the overdischarge.
The cell overdischarged with a DOD% = 140% (Figure 13) reached a minimum voltage of −4.5 V. The temperature peak was 62.5 °C at the center of the cell (Tc in Figure 12a), with an increase of 42.5 °C from the beginning of the test. In contrast to the graphite cell type, in this case, and under the tested conditions, the cell showed a non-uniform temperature distribution on its surface, with a difference of 12.5 °C between the central (Tc) and lower part of the battery (Tn), away from the current collectors. Despite the high depth of discharge adopted, the cell after the abuse test could be charged again at the initial voltage, reaching 2.4 V in 4700 s (Figure 14a). However, the cell capacity underwent a significant reduction after the overdischarge abuse (see Table 3, during both charge (34% reduction) and discharge (38%); in both cases, a C-rate of 1/3 C was adopted. During the first recharge of the abused cell, the temperature increased about 10 °C with a peak of 28.5 °C (Figure 14b), again with a gradient along its surface, though much smaller than during overdischarge, with a difference of 3 °C between the temperature recorded at the center of the cell (Tc) and Tn.
In the subsequent cycles following the overdischarge abuse, an increase in the cell temperature of 1.5 °C (from 22.5 °C to 24 °C) was recorded.
Overall, after an overdischarge abuse, the LTO-based anode cells showed a significantly better performance than the graphite-based anode cells. Contrary to what happened with the graphite cells, it was always possible to recharge the LTO cells: in most of the tested DOD%, it was possible to restore their operation at the full initial capacity, but even after an overdischarge with a DOD% of 140%, despite a drastic reduction in its capacity after abuse, it was still possible to recharge the cell for successive use. As far as the temperature is concerned, some variations were detected, with the maximum temperature reached during the overdischarge markedly increasing with the depth of discharge (DOD%). In none of the tested conditions did an inversion in the voltage trend occur during the overdischarge phase, thus reinforcing the hypothesis that the irreversible failure of the cell might be associated with this effect rather than with the generic overdischarge condition, no matter its depth. The performance of the LTO-based anode cells could be also explained by considering the higher average potential against Li/Li+ of the LTO compared to graphite. The graphite average potential against Li/Li+ is close to 0 V, while lithium titanate presents a wide potential plateau between lithiated and delithiated states at a value of about 1.5 V [45,46].
Finally, in no case there was any venting of the cell, nor did any explosive event occur.

4. Conclusions

In this work, a comparison has been made between Li-ion cells with different anode materials (graphite and LTO) subjected to deep overdischarge abuse tests.
For both anode chemistries, no thermal runaway and no venting phenomena were observed during or after the abuse. LTO-based anode cells showed greater stability than the graphite cells, as it was always possible to recharge them, regardless of the DOD%; however, a significant capacity reduction at extreme overdischarge was observed (34% after charge and 38% after discharge, for a C-rate equal to 1/3 C). Conversely, except for a DOD% of 110%, graphite-based cells always suffered irreversible damage which impeded their recharge. Under these conditions an inversion of the cell voltage trend was observed, at a DOD% of about 112%, suggesting the hypothesis that the permanent damage might be more likely associated with this phenomenon, rather than with the generic overdischarge condition. Significantly, in none of the tests with LTO cells was voltage trend inversion observed. This hypothesis seems in agreement with other results from the literature. On the contrary, since inversion of cell polarity always occurred during the tests, this phenomenon seems not linked to irreversible damage.
The electrodes of the graphite abused cells have been analyzed with a Scanning Electron Microscope to assess the presence of morphological variations, possibly due to the overdischarge abuse. The results showed damage to the electrodes of the cell overdischarged with a DOD% of 110%, while the cell overdischarged at 140% DOD, did not show significant morphological changes. Consequently, the damage to the electrodes seems to be related to the charge/discharge cycles that follow the electrical abuse. Therefore, they don’t explain the failure behavior, which is more likely due to the copper deposition detected on the anode. This issue requires further study
Finally, as far as the temperature variations are concerned, LTO cells showed a marked dependence of the temperature increase with DOD%, with a maximum increase of 42.5 °C at DOD% = 140%. In contrast, graphite cells presented a smaller and constant temperature rise and a more uniform temperature distribution on the cell surface.

Author Contributions

Conceptualization, C.M.; methodology, C.M. and V.S.; investigation, C.M., V.S., S.C., L.D.S.; data curation, C.M., L.D.S.; writing—original draft preparation, C.M., R.B.; writing—review and editing, R.B., C.M.; supervision, R.B., V.S., L.D.S., S.C. All authors have read and agreed to the published version of the manuscript.

Funding

This research was funded by Italian Ministry of Economic Development and ENEA.

Conflicts of Interest

The authors declare no conflict of interest.

References

  1. Feng, X.; Ouyang, M.; Liu, X.; Lu, L.; Xia, Y.; He, X. Thermal runaway mechanism of lithium ion battery for electric vehicles: A review. Energy Storage Mater. 2018, 10, 246–267. [Google Scholar] [CrossRef]
  2. Wen, J.; Yu, Y.; Chen, C. A Review on Lithium-Ion Batteries Safety Issues: Existing Problems and Possible Solutions. Mater. Express 2012, 2, 197–212. [Google Scholar] [CrossRef]
  3. Wang, Q.; Ping, P.; Zhao, X.; Chu, G.; Sun, J.; Chen, C. Thermal runaway caused fire and explosion of lithium ion battery. J. Power Sources 2012, 208, 210–224. [Google Scholar] [CrossRef]
  4. Hendricks, C.; Williard, N.; Mathew, S.; Pecht, M. A failure modes, mechanisms, and effects analysis (FMMEA) of lithium-ion batteries. J. Power Sources 2015, 297, 113–120. [Google Scholar] [CrossRef] [Green Version]
  5. Soares, F.J.; Carvalho, L.; Costa, I.C.; Iria, J.P.; Bodet, J.M.; Jacinto, G.; Lecocq, A.; Roessner, J.; Caillard, B.; Salvi, O. The STABALID project: Risk analysis of stationary Li-ion batteries for power system applications. Reliab. Eng. Syst. Saf. 2015, 140, 142–175. [Google Scholar] [CrossRef] [Green Version]
  6. Bubbico, R.; Greco, V.; Menale, C. Hazardous scenarios identification for Li-ion secondary batteries. Saf. Sci. 2018, 108, 72–88. [Google Scholar] [CrossRef]
  7. Kim, G.H.; Pesaran, A.; Spotnitz, R. A three-dimensional thermal abuse model for lithium-ion cells. J. Power Sources 2007, 170, 476–489. [Google Scholar] [CrossRef]
  8. Chen, Y.J.W. Evans. J. Electrochem. Soc. 1996, 143, 2708–2712. [Google Scholar] [CrossRef]
  9. Balakrishnan, P.G.; Ramesh, R.; Prem Kumar, T. Safety mechanisms in lithium-ion batteries. J. Power Sources 2006, 155, 401–414. [Google Scholar] [CrossRef]
  10. Chen, S.C.; Wan, C.C.; Wang, Y.Y. Thermal analysis of lithium-ion batteries. J. Power Sources 2005, 140, 111–124. [Google Scholar] [CrossRef]
  11. Menale, C.; D’Annibale, F.; Mazzarotta, B.; Bubbico, R. Thermal management of lithium-ion batteries: An experimental investigation. Energy 2019, 182, 57–71. [Google Scholar] [CrossRef]
  12. Ahmed, S.I.; Sanad, M.M.S. Maghemite-based anode materials for Li-Ion batteries: The role of intentionally incorporated vacancies and cation distribution in electrochemical energy storage. J. Alloys Compd. 2021, 861, 157962. [Google Scholar] [CrossRef]
  13. Zhao, D.; Zhang, Z.; Ren, J.; Xu, Y.; Xu, X.; Zhou, J.; Gao, F.; Tang, H.; Liu, S.; Wang, Z.; et al. Fe2VO4 nanoparticles on rGO as anode material for high-rate and durable lithium and sodium ion batteries. Chem. Eng. J. 2023, 451, 138882. [Google Scholar] [CrossRef]
  14. Ouyang, D.; Chen, M.; Liu, J.; Wei, R.; Weng, J.; Wang, J. Investigation of a commercial lithium-ion battery under overcharge/over-discharge failure conditions. RSC Adv. 2018, 8, 33414–33424. [Google Scholar] [CrossRef] [PubMed] [Green Version]
  15. Fear, C.; Juarez-Robles, D.; Jeevarajan, J.A.; Mukherjee, P.P. Elucidating copper dissolution phenomenon in Li-ion cells under overdischarge extremes. J. Electrochem. Soc. 2018, 165, A1639–A1647. [Google Scholar] [CrossRef]
  16. Nemanick, E.J.; Wang, D.; Matsumoto, J.; Ives, N. Effects of Cell Reversal on Li-Ion Batteries. In Proceedings of the 230th ECS Meeting, Honolulu, HI, USA, 2–7 October 2016. [Google Scholar]
  17. Maleki, H.; Howard, J.N. Effects of overdischarge on performance and thermal stability of a Li-ion cell. J. Power Sources 2006, 160, 1395–1402. [Google Scholar] [CrossRef]
  18. Hendricks, C.E.; Mansour, A.N.; Fuentevill, D.A.; Waller, G.H.; Ko, J.K.; Pecht, M.G. Copper dissolution in overdischarged lithium-ion cells: X-ray photoelectron spectroscopy and X-ray absorption fine structure analysis. J. Electrochem. Soc. 2020, 167, 90501. [Google Scholar] [CrossRef]
  19. Shu, J.; Shui, M.; Xu, D.; Wang, D.J.; Ren, Y.L.; Gao, S. A comparative study of overdischarge behaviors of cathode materials for lithium-ion batteries. J. Solid State Electrochem. 2012, 16, 819–824. [Google Scholar] [CrossRef]
  20. Feng, X.N.; Weng, C.H.; Ouyang, M.G.; Sun, J. Online internal short circuit detection for a large format lithium ion battery. Appl. Energy 2016, 161, 168–180. [Google Scholar] [CrossRef] [Green Version]
  21. Santhanagopalan, S.; Ramadass, P.; Zhang, J.J. Analysis of internal short-circuit in a lithium ion cell. Power Sources 2009, 194, 550–557. [Google Scholar] [CrossRef]
  22. Wang, M.; Shi, Y.; Noelle, D.J.; Le, A.V.; Yoon, H.; Chung, H.; Zhang, M.H.; Meng, Y.S.; Qiao, Y. Internal short circuit mitigation of high-voltage lithium-ion batteries with functional current collectors. RSC Adv. 2017, 7, 45662–45667. [Google Scholar] [CrossRef] [Green Version]
  23. Lai, X.; Zheng, Y.; Zhou, L.; Gao, W. Electrical behavior of over-discharge induced internal short circuit in lithium-ion cells. Electrochim. Acta 2018, 278, 245–254. [Google Scholar] [CrossRef]
  24. Juarez-Robles, D.; Vyas, A.A.; Fear, C.; Jeevarajan, J.A.; Mukherjee, P.P. Overdischarge and Aging Analytics of Li-Ion Cells. J. Electrochem. Soc. 2020, 167, 090558. [Google Scholar] [CrossRef]
  25. Brand, M.; Gläser, S.; Geder, J.; Menacher, S.; Obpacher, S.; Jossen, A.; Quinger, D. Electrical safety of commercial Li-ion cells based on NMC and NCA technology compared to LFP technology. World Electr. Veh. J. 2013, 6, 572. [Google Scholar] [CrossRef]
  26. Cianciullo, M.; Vilardi, G.; Mazzarotta, B.; Bubbico, R. Simulation of the Thermal Runaway Onset in Li-Ion Cells—Influence of Cathode Materials and Operating Conditions. Energies 2022, 15, 4169. [Google Scholar] [CrossRef]
  27. Wang, D.; Zheng, L.; Li, X.; Du, G.; Zhang, Z.; Feng, Y.; Jia, L.; Dai, Z. Effects of Overdischarge Rate on Thermal Runaway of NCM811 Li-Ion Batteries. Energies 2020, 13, 3885. [Google Scholar] [CrossRef]
  28. Jeevarajan, J.A.; Strangways, B.; Nelson, T.J. Hazards due to Overdischarge in Lithium-Ion Cylindrical 18650 Cells in Multi-Cell Configurations; National Aeronautics and Space Administration: Las Vegas, NV, USA, 2010. [Google Scholar]
  29. Ouyang, D.X.; Weng, J.W.; Chen, M.Y.; Liu, J.H.; Wang, J. Experimental analysis on the degradation behavior of overdischarged lithium-ion battery combined with the effect of high-temperature environment. Int. J. Energy Res. 2020, 44, 229–241. [Google Scholar] [CrossRef]
  30. Doughty, D.; Roth, E.P. A general discussion of Li ion battery safety. Electrochem. Soc. Interface 2012, 21, 37–44. [Google Scholar]
  31. Zhao, M.; Kariuki, S.; Dewald, H.D.; Lemke, F.R.; Staniewicz, R.J.; Phichita, E.J.; Marsh, R.A. Electrochemical Stability of Copper in Lithium-Ion Battery Electrolytes. J. Electrochem. Soc. 2000, 147, 2874–2879. [Google Scholar] [CrossRef]
  32. Zheng, Y.; Qian, K.; Luo, D.; Li, Y.; Lu, Q.; Li, B.; He, Y.-B.; Wang, X.; Li, J.; Kang, F. Influence of over-discharge on the lifetime and performance of LiFePO4/graphite batteries. RSC Adv. 2016, 6, 30474–30483. [Google Scholar] [CrossRef]
  33. Guo, R.; Lu, L.; Ouyang, M.; Feng, X. Mechanism of the entire overdischarge process and overdischarge-induced internal short circuit in lithium-ion batteries. Sci. Rep. 2016, 6, 30248. [Google Scholar] [CrossRef] [PubMed]
  34. Kishiyama, C.; Nagata, M.; Piao, T.; Dodd, J.; Lam, P.-N.; Tsukamoto, H. Abs. 245. In Proceedings of the 204th Electrochemistry Society Conference, Orlando, FL, USA, 12–16 October 2003. [Google Scholar]
  35. Zhang, L.; Liu, J.; Du, L.; Xu, X.; Ma, Y.; Qu, B.; Fan, P.; Yin, G.; Yang, F.; Zhu, L. Identifying the aging mechanism in multiple overdischarged LiCoO2/mesocarbon microbeads batteries. Ceram. Int. 2021, 47, 21253–21262. [Google Scholar] [CrossRef]
  36. Li, H.F.; Gao, J.K.; Zhang, S.L. Effect of overdischarge on swelling and recharge performance of lithium ion cells. Chin. J. Chem. 2008, 26, 1585–1588. [Google Scholar] [CrossRef]
  37. Tang, Z.Y.; Ruan, Y.L. Progress in capacity fade mechanism of lithium ion battery. Prog. Chem. 2005, 17, 1–7. [Google Scholar]
  38. Kirillov, S.A.; Potapenko, A.V.; Potapenko, A.V. Effect of overdischarge (overlithiation) on electrochemical properties of LiNi0.5Mn1.5O4 samples of different origin. J. Solid State Electrochem. 2020, 24, 1113–1121. [Google Scholar] [CrossRef]
  39. He, H.; Liu, Y.; Liu, Q.; Li, Z.; Xu, F.; Dun, C.; Ren, Y.; Wang, M.-x.; Xie, J. Failure Investigation of LiFePO4 Cells in Over-Discharge Conditions. J. Electrochem. Soc. 2013, 160, A793–A798. [Google Scholar] [CrossRef]
  40. Zhang, L.; Ma, Y.; Cheng, X.; Du, C.; Guan, T.; Cui, Y.; Sun, S.; Zuo, P.; Gao, Y.; Yin, G. Capacity fading mechanism during long-term cycling of over-discharged LiCoO2/mesocarbon microbeads battery. J. Power Sources 2015, 293, 1006–1015. [Google Scholar] [CrossRef]
  41. Mao, Z. Abs. 304. In Proceedings of the 206th Electrochemistry Society Conference, Honolulu, HI, USA, 3–8 October 2004. [Google Scholar]
  42. Liu, Y.; Liu, Q.; Li, Z.; Ren, Y.; Xie, J.; He, H.; Xu, F. Failure study of commercial LiFePO4 cells in over-discharge conditions using electrochemical impedance spectroscopy. J. Electrochem. Soc. 2014, 161, A620–A632. [Google Scholar] [CrossRef]
  43. Waag, W.; Sauer, D.U. Secondary batteries-lead-acid systems|state-of-Charge/Health. Encycl. Electrochem. Power Sources 2009, 793–804. [Google Scholar] [CrossRef]
  44. Erol, S.; Orazem, M.E.; Muller, R.P. Influence of overcharge and over-discharge on the impedance response of LiCoO2|C batteries. J. Power Sources 2014, 270, 92–100. [Google Scholar] [CrossRef] [Green Version]
  45. Roscher, M.A.; Bohlen, O.; Vetter, J. OCV Hysteresis in Li-Ion Batteries in-cluding Two-Phase Transition Materials. Int. J. Electrochem. 2011, 2011, 984320. [Google Scholar] [CrossRef] [Green Version]
  46. Fu, R.; Zhou, X.; Fan, H.; Blaisdell, D.; Jagadale, A.; Zhang, X.; Xiong, R. Comparison of Lithium-Ion Anode Materials Using an Experimentally Verified Physics-Based, Electrochemical Model. Energies 2017, 10, 2174. [Google Scholar] [CrossRef]
Figure 1. Climatic chamber for abuse test.
Energies 15 08440 g001
Figure 2. Pictures of the instrumented box: (a) front view, (b) side view.
Energies 15 08440 g002
Figure 3. Configuration with four cells in series.
Energies 15 08440 g003
Figure 4. Disassembling of an abused cell: (a) protection systems removal, (b) electrodes and separator disassembling.
Energies 15 08440 g004
Figure 5. Graphite anode cells. Overdischarge test, DOD% = 110%: (a) temperature and voltage trend of the abused cell, (b) current and voltage trends of the abused cell.
Energies 15 08440 g005
Figure 6. Graphite anode cells; DOD% = 110%. Temperature trend during the capacity test: (a) before and (b) after the overdischarge abuse.
Energies 15 08440 g006
Figure 7. Graphite anode cells. Overdischarge test, DOD% = 140%: (a) temperature and voltage trend of the abused cell, (b) current and voltage trends of the abused cell.
Energies 15 08440 g007
Figure 8. SEM images with a 5000x magnification of the anode of the graphite-based anode cell: (a) new, (b) overdischarged with a DOD% = 110%, (c) overdischarged with a DOD% = 140%.
Energies 15 08440 g008
Figure 9. SEM images with a 5000x magnification of the cathode of the graphite-based anode cell: (a) new, (b) overdischarged with a DOD% = 110%, (c) overdischarged with a DOD% = 140%.
Energies 15 08440 g009aEnergies 15 08440 g009b
Figure 10. Composition % of the cathode of the cell (EDX analysis): (a) new, (b) overdischarged with a DOD% = 110%, (c) over-discharged with a DOD% = 140%.
Energies 15 08440 g010
Figure 11. Composition % of the anode of the cell (EDX analysis): (a) new, (b) overdischarged with a DOD% = 110%, (c) overdischarged with a DOD% = 140%.
Energies 15 08440 g011
Figure 12. LTO cell. Overdischarge test, DOD% = 110%: (a) temperature and voltage trend of the abused cell, (b) current and voltage trends of the abused cell.
Energies 15 08440 g012
Figure 13. LTO cell. Overdischarge test, DOD% = 140%: (a) temperature and voltage trend of the abused cell, (b) current and voltage trend of the abused cell.
Energies 15 08440 g013
Figure 14. LTO cell. Recharge of the cell after overdischarge (DOD% = 140%): (a) voltage vs. time; (b) temperature and current vs. time.
Energies 15 08440 g014
Table 1. Main parameters of the tested cells.
LTO40120NCR18650B
Rated Capacity10,000 mAh3200 mAh
Nominal Voltage2.4V3.6 V
Max. Charge Voltage2.8 V 4.2 V
Standard Charge5000 mA (0.5C)1625 mA (0.5C)
Charge Temp. Range−20 °C to +50℃0 °C to +45 °C
Dimensions (DxH)40 mm × 120 mm18.5 mm × 65.3 mm
Weight280 ± 10 g46.5 g
Table 2. Summary of the results obtained from the overdischarge tests on graphite-based anode cells.
Overdischarge DOD%Is It Possible to Re-Charge the Cell?Actual Initial Capacity [Ah]Maximum Temperature [°C]DOD% at the VminDOD% for V = 0Ahfin/Ahin
Charge
Ahfin/Ahin Discharge
110%YES2.8547-1060.980.97
113%NO2.7848112106--
125%NO2.9147111n.a.--
140%NO2.7947.5113108--
Table 3. Summary of the results obtained from the overdischarge tests on LTO-based anode cells.
Overdischarge DOD%Is Possible to Re-Charge the Cell?Actual Initial Capacity [Ah]Maximum Temperature [°C]Vmin [Volt]DOD% for V = 0Ahfin/Ahin
Charge
Ahfin/Ahin Discharge
110%YES8.8211.07-11
120%YES8.4928.6−311311
140%YES8.6762.5−4.51130.70.6
Publisher’s Note: MDPI stays neutral with regard to jurisdictional claims in published maps and institutional affiliations.

