Article

Detection of Load-Altering Cyberattacks Targeting Peak Shaving Using Residential Electric Water Heaters

by
El-Nasser S. Youssef
1,2,*,
Fabrice Labeau
1 and
Marthe Kassouf
2
1
Department of Electrical and Computer Engineering, McGill University, Montreal, QC H3A 0G4, Canada
2
System Resiliency Unit, Hydro-Québec’s Research Institute, Varennes, QC J3X 1S1, Canada
*
Author to whom correspondence should be addressed.
Energies 2022, 15(20), 7807; https://doi.org/10.3390/en15207807
Submission received: 20 September 2022 / Revised: 13 October 2022 / Accepted: 19 October 2022 / Published: 21 October 2022
(This article belongs to the Special Issue Smart Grid Cybersecurity: Challenges, Threats and Solutions)

Abstract

:
The rapid adoption of the smart grid’s nascent load-management capabilities, such as demand-side management and smart home systems, and the emergence of new classes of controllable high-wattage loads, such as energy storage systems and electric vehicles, magnify the smart grid’s exposure to load-altering cyberattacks. These attacks aim at disrupting power grid services by staging a synchronized activation/deactivation of numerous customers’ high-wattage appliances. A proper defense plan is needed to respond to such attacks and maintain the stability of the grid, and would include prevention, detection, mitigation, incident response, and/or recovery strategies. In this paper, we propose a solution to detect load-altering cyberattacks using a time-delay neural network that monitors the grid’s load profile. As a case study, we consider a cyberattack scenario against demand-side management programs that control the loads of residential electrical water heaters in order to perform peak shaving. The proposed solution can be adapted to other load-altering attacks involving different demand-side management programs or other classes of loads. Experiments verify the proposed solution’s efficacy in detecting load-altering attacks with high precision and low false alarm and latency.

1. Introduction

Using demand-side management (DSM), utilities can improve the power grid efficiency by eliminating power demand peaks and valleys [1]. DSM programs interact with customers’ appliances to read measurements and possibly send control commands using information and communication technologies (ICT) such as the Internet in internet-of-things (IoT)–enabled smart home systems and the advanced metering infrastructure (AMI) in indirect and direct load control [2,3]. The fact that DSM runs on ICT makes it inherently exposed to cyberattacks, including load-altering attacks (LAAs), whereby attackers engage customers’ high-wattage appliances in a manner that leads to negative and potentially catastrophic consequences to the power grid [2,3,4,5,6].
LAAs against smart home systems via IoT have recently come into the spotlight [4,5,6,7] due to the proliferation of Wi-Fi connected household appliances and the literature discussing their vulnerability to cyberattacks [8,9]. Other potential targets of LAAs are indirect and direct load control programs [2,3], wherein utilities, through the AMI, control participating customers’ loads either directly through remote commands or indirectly using energy pricing signals. The serious impacts of LAAs have been repeatedly demonstrated in the literature [3,4,5,6,10,11]. With just 1% increase in power demand, attackers might be able to bring down the majority of a grid of roughly the same size as Canada—by attacking just a few tens of thousands of residential electric water heaters [6,7]. Power systems’ protection equipment and operational responses to sudden load changes can impede LAAs, yet they cannot eliminate the risk of bulk power system partitioning and forced load shedding [10].
The existing literature on LAAs focuses on mitigation and resilience strategies developed using control-theoretic approaches which develop a model for the power grid response to LAAs, and then formulate an optimization problem to identify vulnerable appliances [2,3,12], robust operating points [13], placement of protective equipment [14], or optimal load shedding [15]. Alternatively, one can mitigate LAAs using the cybersecurity-by-design concept, wherein the mitigation mechanism is embedded in the appliance controller [16].
Stabilizing load fluctuations—caused by faults or LAAs—is crucial to avoid adverse consequences, such as frequency and voltage instability, load shedding, equipment damage, line failures, and blackouts. An appropriate response plan should consist of a series of mitigative actions involving the grid’s operating reserve and autonomous protection systems [10,17,18]. Actions, such as engaging spinning reserves or shedding responsive loads, aim at maintaining power system stability and power service reliability. A key ingredient in any such plan is the speedy detection of malicious activity; the timely detection and localization of LAAs enhance the grid operator’s situational awareness and increase the defensive actions’ success probability, thus contributing to better attack response outcome. Despite its importance, the literature on detection of LAAs remains limited [19,20], in contrast to the more mature areas of modeling, risk assessment and mitigation.

Related Work and Contributions

Cyberattack detection techniques can be classified as signature based or anomaly based [21]. Signature-based methods rely on detecting the impact (or signature) of a specific attack on a grid application’s normal state. Thus, they are more effective against known attacks with predefined signatures [22]. In contrast, anomaly-based methods model a grid application’s normal state and then monitor it for deviations caused by suspected, and possibly unknown, attacks.
An anomaly detection technique has been proposed to address LAAs in [19] based on a cross-correlation approach using load and frequency measurements. Semi-supervised, machine-learning-based anomaly-detection techniques were considered in [20], using high-resolution phasor measurement unit (PMU) data of the phase angle and frequency at every bus in the system. Defining the threshold—at which deviations of grid measurements are considered anomalous—is a major challenge for anomaly-based detectors, as this threshold controls the trade-off between the detector’s sensitivity to unknown attacks and the false alarms triggered by normal grid behavior fluctuations. This challenge is exacerbated in the detectors of [19,20] because they exclude any offline training and so any opportunity to incorporate historical patterns in the current decisions made by the detectors.
Both anomaly and signature-based detection techniques have their strengths and drawbacks. Selecting one approach over the other depends on the nature of the input data, type of anomaly, and availability of expert-labeled training data [23]. These three factors are determined by the cyberattack scenario and the targeted power grid environment. Hence, while one can draw from certain aspects of prior art on LAA detection, every distinct scenario presents a unique detection challenge where one approach might prevail over the rest.
In this paper, we consider a LAA scenario wherein threat agents employ malware to successfully infiltrate a DSM program—particularly a peak shaving program—involving the load of residential electric water heaters (EWHs). Exploiting existing, legitimate, remote-control channels to the EWHs, the attackers effect a simultaneous activation of numerous EWHs during peak shaving, thus triggering a massive load surge that could disrupt power services [16]. We also consider the case where attackers activate a smaller subset of EWHs, thus causing a smaller power demand fluctuation, aiming at exhausting grid resources. A real-life example of successful malware cyberattacks is the one that targeted the Ukrainian power grid in December 2015, where the BlackEnergy 3 malware was used to infiltrate the power utility’s data network and send malicious commands to power switches and circuit breakers, leading to massive power outages affecting about 230,000 customers for several hours [24].
The synchronized activation of EWHs carries a distinct signature on the load profile—especially during peak shaving, thus motivating us to employ supervised machine learning to detect such signature. The simulation environment, developed in [16], facilitates creating comprehensive training/testing datasets comprising both normal and attacked load profiles. Both the distinct attack signature and availability of labeled data motivate us to harness the power of supervised-learning algorithms over known attacks [25]. In particular, we propose a signature-based detector using a time-delay neural network (TDNN) to monitor the grid’s power demand profile. The TDNN learns temporal patterns in the grid’s demand profile in normal conditions as well as under LAAs. The contributions of this article can be summarized as follows:
  • A signature-based detector using TDNN for LAAs targeting residential EWHs participating in a peak shaving program. The detector monitors smart meter data.
  • Extension of the LAA model to include smaller attacks that are harder to detect.
  • Extensive analysis of the proposed detector using load profiles that represent diverse normal consumption and attack patterns—including the presence of mitigation strategies. The detector is shown to successfully detect these attacks with very high sensitivity and precision, and very low false alarm rate and detection delay.
The existing works on LAA detection consider customer loads as black boxes that the attacker can manipulate, and so they do not take into account the electrodynamics of a particular class of loads or the impact of client behavior on LAA detection—especially in EWHs, where hot water withdrawal patterns significantly shape the EWHs’ energy consumption. This article tries to fill in this knowledge gap by studying the LAA detection problem over a simulation environment that accurately models the load profiles of residential EWHs and accounts for changes in client consumption patterns. This approach allows for the accurate assessment of the impact of a potential LAA targeting EWHs, and for designing a precise detection method, using a TDNN that is capable of learning the signatures made by maliciously activated EWHs. Leveraging a signature-based approach leads to the elimination of false alarms, which constitute the main ailment of anomaly detection methods.
Using a similar machine-learning-based detection technique, [26] considered a different variant of EWH LAAs, labeled as the wear-down attack, which aims at causing small load fluctuations that force more frequent tap changes by the distribution grid transformers, thus shortening their lifespan and increasing both operational costs and equipment failure probability. In addition to the smaller LAAs, such as those studied in [26], we consider catastrophic, destabilizing ones. Unlike [26], where the detector uses transformer control and operational data (e.g., tap settings, voltage, current, and power measurements), we rely on smart meter data for detection. Furthermore, while [26] employs a deterministic simulation with fixed household demand, our simulation environment models real consumption behavior and embeds a peak shaving program that controls the EWHs’ set points. Finally, unlike the decision-tree-based detector of [26] that operates on instantaneous snapshots of the grid state variables and neglects any time-series dependencies, we leverage the ability of TDNN to capture temporal patterns to effectively distinguish malicious activities from normal load fluctuations.
The rest of this article is organized as follows. In Section 2, we describe the peak shaving program involving EWH load and the supporting ICT infrastructure. We present the LAA scenario and assess its potential impacts in Section 3. Section 4 details the proposed detector. In Section 5, we discuss a mitigation strategy using the cybersecurity-by-design principle. We provide the details of our experimental analysis in Section 6, and report and discuss the results of this analysis in Section 7. Section 8 concludes the article and outlines future research.

2. Peak Shaving Using Smart Electric Water Heaters

Peak shaving is a DSM application aiming at reducing peaks in a grid’s power demand profile by shifting parts of the load to off-peak hours. The load of domestic EWHs is a natural candidate for peak shaving because it tracks the grid’s demand profile and contributes a significant percentage to the peak residential demand [27,28]. In addition, their ability to store energy in the form of hot water allows shifting their load away from peak-demand hours. Smart EWHs occupy a growing share of the market. Besides, affordable solutions are available that retrofit legacy EWHs to make them ‘smart’ by enabling them to send measurements to and receive commands from the owners, the utility, or both. Furthermore, more utilities are offering incentive programs for customers to adopt these solutions and subscribe to the utility’s DSM programs.

2.1. Peak Shaving Using Direct Load Control

Controlling EWHs for peak shaving can be done either directly via commands or indirectly using energy pricing signals. We focus on direct load control (DLC) since it represents the highest cybersecurity risk due to the direct link to customer high-wattage appliances. If such direct access were to be infiltrated in a cyberattack, threat agents would be able to synchronously engage numerous appliances to the grid’s detriment. Peak shaving using DLC of EWHs entails sending commands to participating customers’ EWHs to curb their consumption during peak demand hours—either by lowering their supply voltages [28,29,30] or thermostat set points [16,31,32], or by completely deactivating them [33,34,35].
In this article, we consider the peak shaving algorithm employed in [27] wherein the utility controls the thermostat set points of a population of EWHs during two peak-demand periods—from 6:00 to 10:00 a.m., and between 4:00 and 9:00 p.m. The algorithm is constrained by two conditions: the water temperature must be maintained above 45 o C for health reasons, and the reactivation of interrupted EWHs after peak shaving must be spaced out to reduce the rebound magnitude [27].

2.2. Internet of Things for Demand-Side Management

Utilities can communicate with customer appliances through an IoT architecture as in Figure 1 (adapted from [36,37]). Each participating appliance reports measurements and receives commands from the energy service interface (ESI) over the home area network (HAN). The ESI is connected to the Internet and the smart meter, and acts as a gateway to customer appliances within the HAN—connecting them to cloud servers that provide DSM capabilities to utilities. The cloud servers can also provide personal energy management and other services to consumers through smart phone applications. They can be located in the utility’s data center and/or in the cloud of an IoT-system vendor/manufacturer or a third-party cloud service provider. The AMI provides an alternative way for the utility to communicate with customer appliances through smart meters [16].

2.3. Diversified Load Profile of Electric Water Heaters

A diversified load profile (DLP) of a group of EWHs represents the time evolution of their average power consumption. Let P = [ p 1 , p 2 , , , p j , , p N dlp ] denote the vector of DLP measurements over a window of width N dlp , then p j can be expressed as
p j = 1 N ewh k = 1 N ewh Q j , k
where N ewh is the number of EWHs in the DLP and Q j , k is the thermostatically controlled power demand of the k th EWH at time j—given by
Q j , k = E k , T j 1 , k T lb ( k ) 0 , T j 1 , k T ub ( k ) Q j 1 , k , otherwise
where, for the k th EWH, E k is the heating element’s power rating, T j , k is the water temperature at time j, and T lb ( k ) and T ub ( k ) are the lower and upper bounds of the thermostat’s deadband. These bounds are controlled during peak shaving by the grid operator who sends out DLC commands instructing the EWHs to lower/restore their set points. The vast majority of commercial EWHs come with two interlocking (mutually-exclusive) heating elements. Therefore, the consumption Q j , k in (2) corresponds to the active element at time j.
In [16], we present a model of residential EWH loads that is driven by realistic hot water draw profiles generated using the Building America Benchmark [38], and adapted to Québec’s climate and population. The complete modeling method is described in detail and all of its assumptions discussed and validated by references, experiments, or both in Chapter 2 of [39]. We employ this method to simulate the EWH loads in normal conditions, under peak shaving, and in case of LAAs.

3. Cyberattack Scenario

We consider a LAA scenario wherein threat agents infiltrate the ICT infrastructure that supports a peak shaving program involving residential EWHs. In case of IoT-enabled peak shaving (Figure 1), the attackers may target the utility’s IoT platform, the vendor (or third party) cloud, or the end-user mobile application. We consider LAA points of entry for AMI-enabled peak shaving in [16]. The infiltration can be accomplished using malware delivered through an infected email attachment. Once installed, the malware creates a backdoor to the infected device, thus enabling the attackers to perform reconnaissance to learn how to communicate with the EWHs participating in peak shaving. Then, the attackers inject malicious commands to numerous EWHs during the peak shaving period, instructing them to raise their set points, thus effectively pulling them out of interruption.

3.1. Attack Impact Analysis

Simultaneously activating numerous EWHs would create a surge in demand that requires suitable response by the grid in order to contain it and avoid possible complications, such as power quality degradation, voltage problems, damage to the customers- and utility equipment, and blackouts [2,6]. The impact of such a demand surge on benchmark power systems is evaluated with simulations in [6]; a LAA can cause line failures with a demand increase of only 4–10 kW per 1 MW of total grid capacity [6]. Line failures, which, depending on the grid operational state at the time of the LAA, can trigger a cascade of failures, in turn would force load shedding and even a system-wide blackout [6]. Our simulations show that a well-timed LAA can generate more than 2 kW of demand for every attacked EWH [16]. Hence, threat agents would need to target 2–5 EWHs per 1 MW of total grid capacity to trigger the consequences anticipated by [6]. Extrapolating the findings of [6] merely provides a sense of the potential consequences of our LAA scenario; an exact evaluation of these consequences requires detailed modeling of the power system under study—taking into account the grid’s operational state as well as available protection equipment and operational responses to sudden load changes.

3.2. Attack Model Extension

In [16], we assume that the LAA activates all EWHs participating in peak shaving. Observing the attack instance depicted therein, the resulting demand surge can be easily detected by monitoring the DLP. Therefore, we extend here the threat model to include LAAs that activate only a subset of the EWHs, expecting to cause a smaller change in the DLP that might evade cyberattack detection. In this LAA scenario, attackers first acquire information about the ICT infrastructure, described in Section 2, over which the peak shaving application is running. Aiming to masquerade their attack, threat agents use this information to target subsets of EWHs that belong to different neighborhood area networks (NANs) and whose measurements are being aggregated in different DLPs, thus resulting in multiple partially-attacked DLPs. We show that this attack model can result in important demand surges that necessitate an intervention by the grid automated protection systems and possibly by the grid operators themselves. Therefore, it is crucial and time sensitive to inform the operators of the attacker’s presence in their systems. We consequently propose a solution that triggers alarms with high accuracy and low latency; it involves a detector that is powered by machine learning and monitors the DLP of a population of EWHs to detect LAAs.

4. Proposed Cyberattack Detection Method

We propose to employ a TDNN [40] which belongs to a class of neural networks capable of learning temporal patterns in time series. TDNNs gain such capability by modifying the basic building unit of neural networks, the neuron, to include a tap delay line at its input which enables each neuron in the TDNN to process both current and previous inputs at each time step.

4.1. Why TDNN?

TDNNs are shift invariant, i.e., capable of learning and detecting temporal patterns regardless of where they occur in the time series [40]. They acquire this property by adjusting the conventional backpropagation learning algorithm to train—simultaneously—on all time-shifted copies of the training patterns. This learning is accomplished by first creating time-shifted replicas of the TDNN, and then running a single backpropagation iteration on each replica independently. The key adjustment in applying backpropagation for TDNN lies in the weight update step; instead of updating each replica’s weights independently using its backpropagation error gradient, the weights of all time-shifted replicas are updated with the same value: the average error gradient across all replicas. This adjustment constrains the weight matrices to be equal in all replicas, thus removing any shift dependence in the resulting TDNN. Sharing the weights along the temporal dimension makes the TDNN a one-dimensional convolutional neural network [41]. The ability of TDNNs to detect a temporal pattern with shift invariance suggests the possibility to train a single TDNN to detect the LAA, presented in Section 3, irrespective of when it is launched during the peak shaving period, thus motivating us to explore TDNN for LAA detection.

4.2. Architecture of Proposed Detector

The proposed TDNN architecture is shown in Figure 2. Input layer has a tap delay line of ( N D 1 ) delays and is fully connected to a single hidden layer of N h neurons and hyperbolic tangent activation functions (denoted by F). Output layer has a signum activation function. The parameters N D and N h are selected using cross-validation. Although the original TDNN [40] includes delays in both the network’s input and hidden layers, our preliminary experiments showed that introducing delays only at the input layer yields equal or better detection performance with lower complexity and training time.

4.3. Detector Input Features

The proposed TDNN-based detector monitors a sliding measurement window of DLP measurements. This window, denoted as x m , where m is the discrete time variable, has a fixed width N D and can be defined as a time-sliding segment of the DLP. Hence,
x m = p i s N D + m , p i s N D + m + 1 , , p i s + m 1 T ,
where p j as in (1); m = 1 , 2 , , N dlp i s + 1 ; i s points to the measurement following the earliest possible attack onset; and N dlp is the number of DLP measurements in the peak shaving period. The detector classifies x m using the function
G ^ ( x m ) = sign F ( W x m + b ) T w op + b o
where W R N h × N D and b R N h are respectively the hidden layer’s weight matrix and bias vector, w op R N h and b o R are respectively the output layer’s weight vector and bias, and F represents the hidden-layer’s hyperbolic tangent activation functions. Each activation function F : R R is applied to the sum of inputs of a corresponding hidden neuron, i.e., to a different element of the vector W x m + b , thus yielding an N h -element vector which can be expressed, using the hyperbolic tangent function [42], as
F ( W x m + b ) = 2 1 + exp ( 2 ( W x m + b ) ) 1
As long as G ^ m ( x m ) = 1 , m , the detector considers the DLP to be normal. Otherwise, if an anomalous measurement window x m is detected at any given time, i.e., G ^ m ( x m ) = 1 , the detector labels the DLP attacked.

4.4. Availability of EWH Consumption Measurements at the Utility

The EWH measurements used by the proposed detector can be collected from smart meters over the AMI [16] or from the ESI through the cloud server in Figure 1. Such granular, appliance-level data might be unavailable in certain cases; while there are available smart meter and AMI implementations that can collect such data, the vast majority of current market implementations worldwide can only collect readings of total household consumption [43]. Customer privacy laws may forbid the gathering of such granular data [44]. In such cases, wherein only total household consumption is available for LAA detection, one could use these measurements directly to retrain the TDNN. Alternatively, one might perform load extraction to disaggregate the EWH consumption from the total consumption reading [45]. This latter approach is known in the literature as nonintrusive load monitoring (NILM), where disaggregation techniques are used to separate appliance-level data from total consumption. Both approaches constitute noisy versions of the original detection problem.

4.5. Detector Implementation

The proposed detector is implemented, trained, and tested using Matlab R2019a Deep Learning Toolbox. We use the “timedelaynet” function with default settings and the default Levenberg–Marquardt backpropagation learning algorithm [46]. Given that the “timedelaynet” output layer’s activation function is linear, we feed the output to a signum function to obtain the desired binary classification behavior. Finally, in order to create time-shifted replicas of the input patterns, we utilize Matlab’s “preparets” function [47].

4.6. Leveraging ICT/OT Convergence

The proposed LAA detector is not meant to replace existing ICT cybersecurity measures, but rather complement them by adding another layer of security to the peak shaving program’s defense strategy. Such an additional layer would be critically important in case existing attack prevention and detection measures fail to stop or detect the attacker’s actions prior to broadcasting the malicious commands to the EWHs during the LAA. Another distinction can be made between the proposed detector and more traditional defense measures encountered in ICT networks; measures such as traditional security information and event management (SIEM) solutions rely on data reflecting the health and status of the ICT infrastructure, i.e., ICT data, to detect malicious activities. In contrast, the proposed detector relies on operational technology (OT) data, i.e., data associated with the monitoring and control of the power grid’s physical equipment and processes, in the form of EWHs’ power demand measurements. Hence, this article demonstrates the value of integrating OT data to enhance the cybersecurity of the smart grid, and industrial control systems (ICS) in general.

5. Cyberattack Mitigation

Detection is merely a single layer in smart grid’s multilayered cybersecurity defense strategy—preceded by attack prevention and followed by mitigation. In [16], we motivate and propose an automated, cybersecurity-by-design, mitigation mechanism to reduce the impact of LAAs targeting smart EWHs. This mechanism entails a hardwired, random, activation delay circuit embedded in the smart control unit of every EWH. It aims to stop the EWH from instantly activating following a remote activation command, and instead wait for a random time—within a preset period—before activating. It successfully restrains the post-attack power demand surge, thus reducing the operating reserve capacity needed to stabilize the grid during LAAs, as well as providing grid operators with crucial time to execute elaborate incident response plans [16]. The proposed TDNN-based detector is meant to complement this mitigation mechanism. Therefore, we analyze its performance in both cases with and without mitigation.

6. Experimental Setup

We start this section by defining a detector utilizing support vector machines (SVM)—a benchmark of supervised, machine-learning classifiers—to gauge the proposed TDNN-based detector’s performance. We then specify the dataset generation process and the performance analysis metrics.

6.1. Comparison with Benchmark

SVM classifiers [48] are supervised-learning classifiers which construct an optimal separating hyperplane that maximizes the margin between classes of training data. The maximized margin leads SVM to achieve good generalization on many problems, making SVM a benchmark for machine-learning classification [49]. SVMs are widely adopted in smart grid’s cyberattack detection research [50], thus motivating us to use them as a benchmark against which we measure the proposed TDNN-based detector’s performance. We describe next the suggested SVM-based detector to facilitate the replication of experiments and reproduction of results.

6.1.1. Architecture and Input Features of SVM-Based Detector

We utilize a set of SVMs to monitor the DLP time series. Each classifier examines a window of DLP measurements that starts at the same predefined instant, and its width grows by one measurement with each successive classifier. This measurement window—which represents the input vector (features) to the m th classifier—can be expressed as
x m = p α , p α + 1 , , p α + L m 1 T , m = 1 , , N svm
where N svm is the total number of classifiers needed to monitor a peak shaving period which can be determined by dividing the peak shaving period’s duration by smart meters’ reporting interval, α is the starting instant of all measurement windows, and L m is the m th measurement window’s width, given by
L m = L 1 + m 1 , m = 1 , , N svm
where L 1 is the minimum window width which belongs to the first classifier. We heuristically tune L 1 using preliminary experiments. Moreover, we set α such that the earliest possible attack onset coincides with the last measurement of the first window, i.e., p α + L 1 1 . Recall i s , the index of the DLP measurement following the earliest possible attack onset, then α can be calculated by
α = i s L 1 + 1
The SVM-based detector operates on expanding measurement windows in contrast to the proposed TDNN-based detector which monitors a sliding measurement window of fixed width N D . We found that a sliding window in the SVM-based detector increases false alarms without improving other detection performance criteria.

6.1.2. Implementation of SVM-Based Detector

The detector is implemented, trained, and tested using the Matlab R2019a Statistics and Machine Learning Toolbox. We use the “fitcsvm” function with default settings, the sequential minimal optimization (SMO) learning algorithm, and the automatic hyperparameter optimization option [51]. While “fitcsvm” provides additional learning algorithm choices, our preliminary experiments showed that the SMO algorithm delivers the highest accuracy for our purposes. The automatic hyperparameter optimization, by minimizing the cross-validation error rate, tunes the penalty parameter γ of the convex optimization problem that computes the SVM’s separating hyperplane, and selects and scales a kernel function [49]. Matlab offers a few algorithm choices for hyperparameter optimization. We use the default Bayesian optimization algorithm with default options, and we enable the algorithm’s parallel execution using Matlab’s Parallel Computing Toolbox. Finally, regarding the first measurement window’s width L 1 of (7), preliminary testing showed that a range around 20 min yields stable results. Thus, we set L 1 = 20 in all experiments henceforth.

6.2. Datasets

We use the same datasets to train and test both the TDNN- and SVM-based detectors. The datasets are created using the simulation environment outlined in Section 2.3 and detailed in [16]. Every example in these datasets represents a different daily DLP of 1000 individual EWHs’ profiles of one-minute resolution. In addition, half of the examples in each dataset represent normal peak shaving control and, half are attacked.

6.2.1. Normal and Attacked Patterns

For normal-class DLPs, we implement the peak shaving strategy described in Section 2.1 which includes two peak shaving periods. As for the attacked class, each example is formed by sending malicious commands to EWHs at a specific instant during peak shaving. The command instructs EWHs to restore their set points to their normal, pre-peak-shaving settings. We assume that LAAs could occur at any time from 30 min after peak-shaving’s onset to 10 min before its end, i.e., [6:30, 9:50] a.m. and [4:30, 8:50] p.m. for the morning and evening periods, respectively. Plugging this detail into (3) yields i s = 31 . Delaying the earliest possible LAA launch instant by 30 min ensures a large demand surge; by allowing the EWHs to stay deactivated for a while, their water temperature will drop and, hence, a larger number will activate when they receive the malicious command. Moreover, by terminating the LAA launch window 10 min before the end of peak shaving, we ensure that the LAA aftermath occurs during peak shaving when the utility is expecting a reduced EWH load.

6.2.2. Training Datasets

The attacked-class training patterns include LAAs that simultaneously activate 100% of EWHs launched at specific times: at seconds 0, 15, 30, or 45 of every minute within the launch interval, thus leading to 800 and 1040 attacked training patterns for morning and evening peak shaving periods, respectively. Since malicious activation signals can be broadcast to EWHs at any second during the smart meters’ one-minute reporting interval, including the LAA patterns that cover the four quarters of every minute prepares the detector for all such variations. Including the normal-class training DLPs yields a total of 1600 and 2080 training examples for morning and evening periods, respectively.

6.2.3. Testing Datasets

In order to maintain the standard 2:1 train/test ratio, we generate for each experiment a total of 800 and 1040 test examples for morning and evening peak shaving periods, respectively. These numbers include both normal and attacked examples. Attacked patterns are formed by sending malicious activation signals at random instants within the launch window. The first testing dataset has LAAs that activate 100% of the EWHs. As for the remaining datasets, in each new example therein, a random percentage of EWHs are attacked. These random percentages are uniformly sampled from a limited range. Every dataset considers a different range, specifically, 80–100%, 60–80%, 40–60%, 20–40%, 10–20%, and 5–10% of EWHs. Finally, each LAA is launched at a random instant within the launch window. Figure 3 illustrates four attacked DLPs from these datasets as well as two DLPs reflecting normal operation with and without peak shaving.

6.2.4. Mitigation Delay

For each training/testing dataset, there are equivalent ones realizing the mitigation delay proposed in [16] and briefly described in Section 5. Different delay durations are considered, specifically, 15, 30, and 45 min.

6.3. Performance Metrics

The proposed detector monitors an EWH DLP over time by continuously examining and classifying segments of it. The classification performance on individual segments does not accurately reflect the overall performance on the DLP. For example, misdetecting a single attacked segment does not necessarily mean that the LAA has gone completely undetected; in fact, it could be detected in a following segment, i.e., misdetecting segments might delay LAA detection rather than completely missing it. Therefore, in order to fully gauge the proposed detector’s performance, we use two different levels of granularity: metrics that gauge pattern- or segment-level performance and ones that analyze profile-level performance.
For pattern-level performance, we use the standard metrics of binary hypothesis testing [52], namely, accuracy, true positive (TP) rate, false positive (FP) rate, and precision. As for profile-level performance, we define three metrics, namely, detection rate, false alarm rate, and average detection delay. The detection rate is the profile-level version of segment-level TP rate. It is the ratio of the number of detected LAAs to the total number of attacked DLPs, thus representing the probability of detecting a LAA by monitoring the whole DLP. Similarly, the false alarm rate is the profile-level version of FP rate. It is the ratio of number of false alarms to the total number of DLPs, thus representing the probability of triggering a false alarm by monitoring the whole DLP. Note that the denominator in false alarm rate includes both normal and attacked DLPs since it is possible for an attacked profile to trigger a false alarm before the actual attack onset. The third profile-level metric, the average detection delay, represents how quickly—on average—the detector can detect LAAs. This metric is crucial since early detection allows more time to utilities to respond and prevent the worst of consequences [16].

7. Results and Discussion

7.1. Model Tuning

We use cross-validation to perform hyperparameter tuning using the training dataset wherein 100% of EWHs are simultaneously activated by the LAAs.

7.1.1. TDNN

We perform 4-fold cross-validation over a grid of TDNN parameters, namely, number of input layer delays N D and number of hidden layer neurons N h . We form this grid with N D = { 5 , 10 , 15 , 20 , 25 , 30 , 35 , 40 } and N h = { 5 , 10 , 15 , 20 , 25 , 30 } . All considered { N D , N h } pairs have 100% detection rate. However, low values of { N D , N h } have higher false alarm rates. Among the pairs with 0% false alarm rate, the { N D = 30 , N h = 25 } pair has the smallest detection delay. It also scores the best in pattern-level metrics. This pair’s performance on the testing dataset is listed in Table 1. We omit the detailed performance results of all { N D , N h } pairs due to space limitations. Moving forward, we employ this TDNN configuration { N D = 30 , N h = 25 } in all experiments.

7.1.2. SVM

We compare three variations to select and tune the SVM classifiers’ parameters. In the first, we utilize Matlab’s automatic hyperparameter optimization “fitcsvm” [51] and set the “OptimizeHyperparameters” option to ‘all.’ Such settings instruct Matlab to optimize the penalty parameter γ , the kernel function and scale, and whether to standardize input data. The default kernel function choices are linear, Gaussian, and second- and fourth-order polynomials. The second tuning variation sets the “OptimizeHyperparameters” option to ‘auto,’ which limits the optimization to γ and the linear kernel’s scale (a scalar multiplier of the Gram matrix). The third variation avoids automatic hyperparameter optimization and instead performs 4-fold cross-validation over a log-scale of the penalty parameter γ = [ 0.01 , 100 ] , and a linear kernel without scaling. These settings are uniform across the set of SVM classifiers in the detector. A penalty parameter of γ = 40 produces the smallest cross-validation error. Table 1 reports the SVM-based detector’s performance produced by these three tuning settings. Among them, the detector with single-fixed γ = 40 and unscaled linear kernel delivers the best performance on the testing dataset. Moving forward, we adopt this configuration.

7.1.3. TDNN vs. SVM—Initial Comparison

Table 1 shows that both TDNN and SVM perform almost perfectly on the testing dataset containing LAAs that activate 100% of EWHs. These attacks lead to massive load increases that are easily detected. Between the two, the proposed TDNN detector performs as well as or better than the SVM-based one in all criteria.

7.2. LAA Detection Performance Analysis

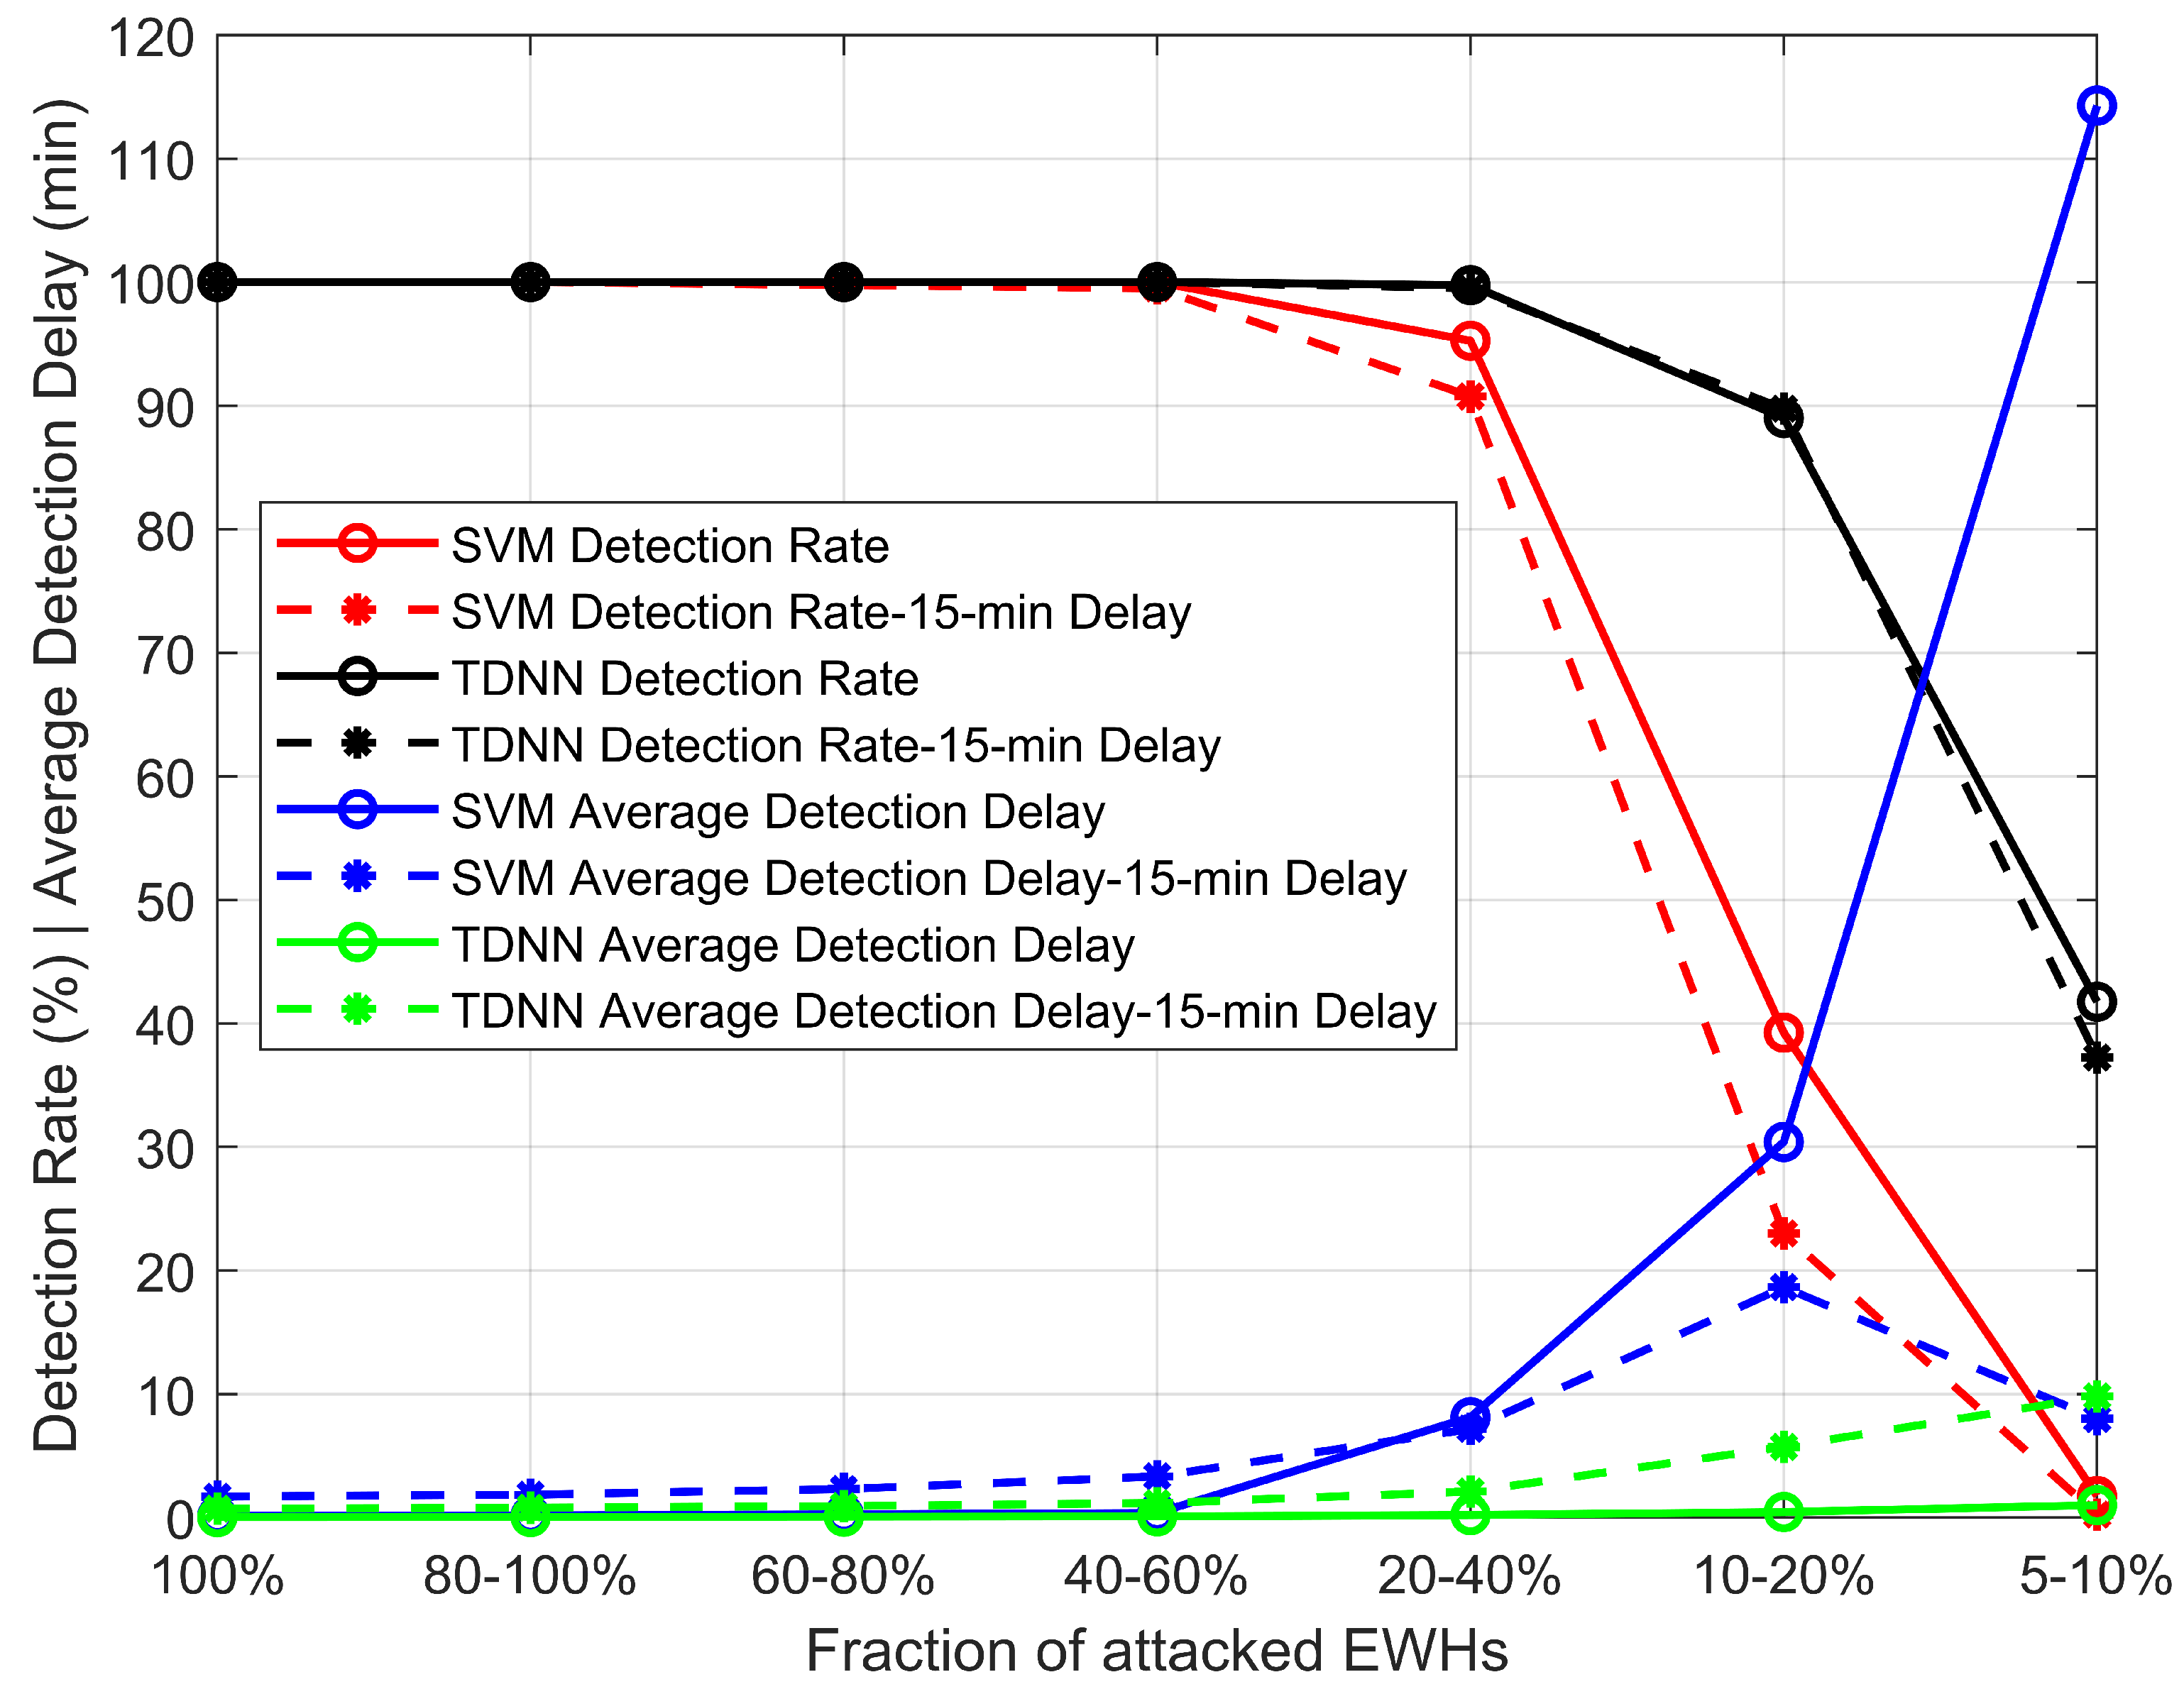
7.2.1. Attacking a Subset of EWHs

We consider now the LAA scenario described in Section 3.2 wherein attackers activate only a subset of EWHs. In order to evaluate whether this strategy could evade detection and—if it could—to what extent it could harm the grid, we designed a set of experiments in which we feed new test examples to the proposed TDNN-based LAA detector, with and without the 15 min mitigation delay. In each new example, a random percentage of EWHs are attacked. In every experiment, these random percentages are uniformly sampled from a different range, respectively, 80–100%, 60–80%, 40–60%, 20–40%, 10–20%, and 5–10% of EWHs. Every LAA in every DLP is launched at a random instant during morning peak shaving, in the window [6:30, 9:50] a.m. We do not retrain the detectors of Table 1 on the new datasets, but rather test them with new examples.

7.2.2. Detection Performance

Figure 4 plots the LAA detection performance results for both the TDNN- and SVM-based detectors, with and without mitigation. It shows, in the case without mitigation, that detection rate only starts to drop at the 20–40% range—specifically when the number of attacked EWHs drops below 25%. In addition, detection becomes very challenging for less than 10% attacked EWHs as the changes to the DLP become less noticeable. The effect of subtler changes is also reflected in detection delay which generally grows with lower numbers of attacked EWHs. As for the case with mitigation, Figure 4 shows that the SVM-based detector’s performance starts to struggle much earlier, with a completely undetected attack at the 60–80% range and two at 40–60%. Missing LAAs at these ranges is significant, as activating such numbers of EWHs is expected to generate substantial demand surges. On the contrary, the proposed TDNN-based detector maintains its detection rate and delay performance. Overall, Figure 4 highlights the superiority of the TDNN-based detector over the SVM-based one against this variation of the LAA model; superiority, reflected in both the detection rate and delay, is evident in both cases with and without mitigation. (One should disregard the decrease in average detection delay at the 5–10% range in “SVM with mitigation” curve in Figure 4. This value belongs to the only detected LAA in that range and, thus, does not reflect a real trend.)
As for false alarm rates, both detectors achieve 0% in all cases, except for the TDNN detector with mitigation, where the rates are below 2%. However, there is no obvious trend linking the false alarm rate to the number of attacked EWHs.

7.2.3. Cyberattack Impact Assessment

From the moment a LAA is launched until its threat is completely neutralized, grid operators must rely on the grid’s operating reserve to manage the generated excess demand to avoid its cascading damaging effects. The operating reserve is a diversified collection of supply/consumption capacity that is available to grid operators to respond to the expected and unexpected changes in the power system in order to maintain its reliability. Elements of this reserve may be additional generation capacity that can be engaged or responsive loads that can be shed depending on the grid’s needs. They could operate autonomously or under operator control. Each of these reserves has a unique combination of response speed and duration, and frequency of use, thus making each suitable for specific change events [17].
Pre-detection, the excess post-attack demand must be managed by the autonomous protection systems responsible for under-frequency contingencies and sudden load changes in power grids, e.g., [18]. It is, therefore, crucial to asses this excess demand so that the grid operator can plan the required operating reserve capacity, speed, and duration to respond to LAAs in order to avoid load shedding. Therefore, Figure 5 and Figure 6 plot the pre-detection excess power demand per EWH generated by both detected and undetected attacks of this LAA model. Figure 5 compares the SVM- and TDNN-based detectors without mitigation, whereas Figure 6 does the same but with the 15 min mitigation delay.
In both Figure 5 and Figure 6, the red, black, green, and purple boxes represent maximum pre-detection excess demand generated by LAAs over the period extending from attack launch until detection—or until the end of peak shaving for undetected attacks. The blue and purple boxes are, respectively, the detected and undetected LAAs in the case of the proposed TDNN detector. Similarly, the red and green boxes belong to the SVM detector. To put this pre-detection surge in context, we compare demand levels added by the LAAs to those removed by peak shaving. Thus, in both figures, the blue box represents the minimum power demand levels that would have been removed from the grid by peak shaving in normal operating conditions over the same period as in attacked cases.
Figure 5 shows that the TDNN detector succeeds in reducing the number and generated power demand of undetected attacks compared to SVM. In addition, the TDNN detector’s faster detection results in lower excess demand. However, for LAAs that activate more than 60%, the demand grows to important levels that approach or exceed—significantly, at times—the peak demand of EWHs in normal conditions before peak shaving. Although detection delay is very low in these cases, such surge in demand occurs instantaneously such that by the time the very first measurement reaches the data center following a LAA, the power demand is already far higher than what the power grid is used to supplying, thus significantly increasing the probability of outages, equipment damage, cascaded failures, and even large-scale blackouts. This observation highlights the motivation behind the mitigation mechanism in Section 5, which serves as an additional layer of protection that complements the proposed LAA detector.
Figure 6 illustrates the crucial impact of the mitigation mechanism in allowing LAA detection while the demand is still below normal levels before peak shaving, thus reducing the autonomous operating reserves needed to stabilize the grid in a LAA event, and providing utilities with crucial time to mount a response. Because the mitigation delay spreads out the demand surge, it leads to a more challenging classification problem as reflected in the increased misdetections in Figure 6. Among the SVM detector’s misdetections, the undetected LAA, at the 60–80% range, generates demand that exceeds normal demand levels before peak shaving, thus revealing a major vulnerability in that detector. In contrast, Figure 6 shows that, for the proposed TDNN detector, none of the undetected LAAs can generate demand that approaches normal levels before peak shaving, thus providing evidence that the proposed detector can be successfully paired with the 15 min mitigation delay to secure the grid against this LAA model.

8. Conclusions

In this article, we study a LAA scenario against peak shaving programs involving the loads of residential EWHs. The scenario entails threat agents, targeting the power grid, infiltrating the ICT infrastructure over which the DSM application is running. The attackers then manage to inject malicious commands to activate numerous interrupted EWHs during peak shaving, thus triggering a surge in power demand during peak-demand hours. We extend this attack model by including stealthier LAAs that activate only a subset of EWHs—aiming to create a less noticeable demand increase while exhausting the grid operating reserve capacity, thus reducing the grid’s readiness to respond to other contingencies. We then propose a signature-based cyberattack detector powered by a TDNN. The detector operates on consumption data that can be collected using smart meters, thus demonstrating the potential of integrating OT data to better defend the smart grid. The proposed detector is shown to be very effective and to outperform another that employs a series of SVM classifiers. In addition, we demonstrate the detector’s ability to detect different variations of LAAs which were not encountered during training including weaker, subtler, attacks. Furthermore, the proposed detector is shown to maintain its detection performance even in the presence of attack mitigation measures that impact the shape of the load profile. The combined detection and mitigation solution is effective in detecting LAAs accurately and early—before power demand, generated by the LAA, approaches demand levels before peak shaving.
For future work, we aim to explore adversarial machine learning techniques to design undetectable LAAs that can evade detection while maximizing harm to the grid. In addition, we shall extend the simulation environment to include a detailed model of the power system under study, taking into account the grid’s operational state as well as available protection equipment and operational responses to sudden load changes. Such an extended environment shall provide precise evaluation of the potential consequences of LAAs on the power system under various operating conditions and in the presence of innovative smart grid technologies, such as distributed energy resources (DERs), energy storage systems, grid-connected microgrids, etc. Furthermore, we intend to generalize the work presented in this article to include other smart home high-wattage appliances and other IoT use cases.

Author Contributions

Conceptualization, E.-N.S.Y., F.L. and M.K.; methodology, E.-N.S.Y. and F.L.; software, E.-N.S.Y.; validation, E.-N.S.Y., F.L. and M.K.; formal analysis, E.-N.S.Y.; investigation, E.-N.S.Y.; resources, E.-N.S.Y., F.L. and M.K.; data curation, E.-N.S.Y.; writing—original draft preparation, E.-N.S.Y.; writing—review and editing, E.-N.S.Y., F.L. and M.K.; visualization, E.-N.S.Y.; supervision, F.L. and M.K.; project administration, F.L. and M.K.; funding acquisition, F.L. and M.K. All authors have read and agreed to the published version of the manuscript.

Funding

This work was supported by Hydro-Québec, the Natural Sciences and Engineering Research Council of Canada, and McGill University in the framework of the NSERC/Hydro-Québec Industrial Research Chair in Interactive Information Infrastructure for the Power Grid (IRCPJ406021-14).

Data Availability Statement

Not applicable.

Conflicts of Interest

The authors declare no conflict of interest.

Abbreviations

The following abbreviations are used in this manuscript:
AMIAdvanced Metering Infrastructure
DERDistributed Energy Resource
DLCDirect Load Control
DLPDiversified Load Profile
DSMDemand-Side Management
ESIEnergy Service Interface
EWHElectric Water Heater
FPFalse Positive
HANHome Area Network
ICSIndustrial Control System
ICTInformation and Communication Technology
IoTInternet-of-Things
kWKilowatt
LAALoad-altering Attack
MWMegawatt
NANNeighborhood Area Network
NILMNonintrusive Load Monitoring
OTOperational Technology
PMUPhasor Measurement Unit
SIEMSecurity Information and Event Management
SMOSequential Minimal Optimization
SVMSupport Vector Machine
TDNNTime Delay Neural Network
TPTrue Positive

References

  1. Lu, N.; Katipamula, S. Control strategies of thermostatically controlled appliances in a competitive electricity market. In Proceedings of the IEEE Power Engineering Society General Meeting, San Francisco, CA, USA, 12–16 June 2005; pp. 202–207. [Google Scholar]
  2. Mohsenian-Rad, A.H.; Leon-Garcia, A. Distributed internet-based load altering attacks against smart power grids. IEEE Trans. Smart Grid 2011, 2, 667–674. [Google Scholar] [CrossRef]
  3. Amini, S.; Pasqualetti, F.; Mohsenian-Rad, H. Dynamic load altering attacks against power system stability: Attack models and protection schemes. IEEE Trans. Smart Grid 2018, 9, 2862–2872. [Google Scholar] [CrossRef]
  4. Dabrowski, A.; Ullrich, J.; Weippl, E.R. Grid shock: Coordinated load-changing attacks on power grids: The non-smart power grid is vulnerable to cyber attacks as well. In Proceedings of the 33rd Annual Computer Security Applications Conference (ACSAC 2017), Orlando, FL, USA, 4–8 December 2017; pp. 303–314. [Google Scholar]
  5. Dvorkin, Y.; Garg, S. IoT-enabled distributed cyber-attacks on transmission and distribution grids. In Proceedings of the 2017 North Amer. Power Symp. (NAPS), Morgantown, WV, USA, 17–19 September 2017; pp. 1–6. [Google Scholar]
  6. Soltan, S.; Mittal, P.; Poor, H.V. BlackIoT: IoT botnet of high wattage devices can disrupt the power grid. In Proceedings of the 27th USENIX Security Symposium, Baltimore, MD, USA, 15–17 August 2018; pp. 15–32. [Google Scholar]
  7. Greenberg, A. How Hacked Water Heaters Could Trigger Mass Blackouts. Wired, 13 August 2018. Available online: https://www.wired.com/story/water-heaters-power-grid-hack-blackout/ (accessed on 16 December 2019).
  8. Mosenia, A.; Jha, N.K. A comprehensive study of security of Internet-of-Things. IEEE Trans. Emerg. Top. Comput. 2017, 5, 586–602. [Google Scholar] [CrossRef]
  9. Yu, T.; Sekar, V.; Seshan, S.; Agarwal, Y.; Xu, C. Handling a trillion (unfixable) flaws on a billion devices: Rethinking network security for the Internet-of-Things. In Proceedings of the 14th ACM Workshop on Hot Topics in Networks (HotNets-XIV), Philadelphia, PA, USA, 16–17 November 2015; pp. 1–7. [Google Scholar]
  10. Huang, B.; Cardenas, A.A.; Baldick, R. Not everything is dark and gloomy: Power grid protections against IoT demand attacks. In Proceedings of the 28th USENIX Security Symposium (USENIX Security 19), Santa Clara, CA, USA, 14–16 August 2019; pp. 1115–1132. [Google Scholar]
  11. Ospina, J.; Liu, X.; Konstantinou, C.; Dvorkin, Y. On the feasibility of load-changing attacks in power systems during the COVID-19 pandemic. IEEE Access 2021, 9, 2545–2563. [Google Scholar] [CrossRef] [PubMed]
  12. Lakshminarayana, S.; Adhikari, S.; Maple, C. Analysis of IoT-based load altering attacks against power grids using the theory of second-order dynamical systems. IEEE Trans. Smart Grid 2021, 12, 4415–4425. [Google Scholar] [CrossRef]
  13. Soltan, S.; Mittal, P.; Poor, V. Protecting the grid against MAD attacks. IEEE Trans. Netw. Sci. Eng. 2020, 7, 1310–1326. [Google Scholar] [CrossRef]
  14. Giorgio, A.D.; Giuseppi, A.; Liberali, F.; Ornatelli, A.; Rabezzano, A.; Celsi, L.R. On the optimization of energy storage system placement for protecting power transmission grids against dynamic load altering attacks. In Proceedings of the 2017 25th Mediterranean Conference on Control and Automation (MED), Valletta, Malta, 3–6 July 2017; pp. 986–992. [Google Scholar]
  15. Guo, Y.; Wang, L.; Liu, Z.; Shen, Y. Reinforcement-learning-based dynamic defense strategy of multistage game against dynamic load altering attack. Int. J. Elect. Power Energy Syst. 2021, 131, 107–113. [Google Scholar] [CrossRef]
  16. Youssef, E.S.; Labeau, F.; Kassouf, M.; Alarie, S. Cyberattacks against direct load control of residential electric water heaters in smart grids. In Proceedings of the 13th Conference on Innovative Smart Grid Technologies (ISGT), New Orleans, LA, USA, 24–28 April 2022; pp. 1–5. [Google Scholar]
  17. Ela, E.; Milligan, M.; Kirby, B. Operating Reserves and Variable Generation: A Comprehensive Review of Current Strategies, Studies, and Fundamental Research on The Impact That Increased Penetration of Variable Renewable Generation Has on Power System Operating Reserves; Technical Report NREL/TP-5500-51978; National Renewable Energy Laboratory: Golden, CO, USA, 2011.
  18. Trudel, G.; Bernard, S.; Scott, G. Hydro-Quebec’s defence plan against extreme contingencies. IEEE Trans. Power Syst. 1999, 14, 958–965. [Google Scholar] [CrossRef]
  19. Amini, S.; Pasqualetti, F.; Mohsenian-Rad, H. Detecting dynamic load altering attacks: A data-driven time-frequency analysis. In Proceedings of the 2015 IEEE International Conference on Smart Grid Communications (SmartGridComm), Miami, FL, USA, 2–5 November 2015; pp. 503–508. [Google Scholar]
  20. Lakshminarayana, S.; Sthapit, S.; Jahangir, H.; Maple, C.; Poor, H.V. Data-driven detection and identification of IoT-enabled load-altering attacks in power grids. IET Smart Grid 2022, 1, 1–16. [Google Scholar] [CrossRef]
  21. Khan, S.; Kifayat, K.; Bashir, A.K.; Gurtov, A.; Hassan, M. Intelligent intrusion detection system in smart grid using computational intelligence and machine learning. Trans. Emerg. Telecommun. Technol. 2020, 32, e4062. [Google Scholar] [CrossRef]
  22. Almseidin, M.; Alzubi, M.; Kovacs, S.; Alkasassbeh, M. Evaluation of machine learning algorithms for intrusion detection system. In Proceedings of the 2017 IEEE 15th International Symposium on Intelligent Systems and Informatics (SISY), Subotica, Serbia, 14–16 September 2017; pp. 277–282. [Google Scholar]
  23. Chandola, V.; Banerjee, A.; Kumar, V. Anomaly detection: A survey. ACM Comput. Surv. 2009, 41, 1–58. [Google Scholar] [CrossRef]
  24. Lee, R.M.; Assante, M.J.; Conway, T. Analysis of the Cyber Attack on the Ukrainian Power Grid; Electricity Information Sharing and Analysis Centre (E-ISAC): Washington, DC, USA, 2016. [Google Scholar]
  25. Laskov, P.; Düssel, P.; Schäfer, C.; Rieck, K. Learning intrusion detection: Supervised or unsupervised? In Proceedings of the International Conference on Image Analysis and Processing (ICIAP 2005), Cagliari, Italy, 6–8 September 2005; pp. 50–57. [Google Scholar]
  26. Pepin, L.; Wang, L.; Wang, J.; Han, S.; Pishawikar, P.; Herzberg, A.; Zhang, P.; Miao, F. Botnets breaking transformers: Localization of power botnet attacks against the distribution grid. arXiv 2022, arXiv:2203.10158. [Google Scholar]
  27. Moreau, A. Control strategy for domestic water heaters during peak periods and its impact on the demand for electricity. Energy Procedia 2011, 12, 1074–1082. [Google Scholar] [CrossRef] [Green Version]
  28. Nehrir, M.H.; LaMeres, B.J.; Gerez, V. A customer-interactive electric water heater demand-side management strategy using fuzzy logic. In Proceedings of the IEEE Power Engineering Society. 1999 Winter Meeting, New York City, NY, USA, 31 January–4 February 1999; Volume 1, pp. 433–436. [Google Scholar]
  29. Atwa, Y.; El-Saadany, E.; Salama, M. DSM approach for water heater control strategy utilizing Elman neural network. In Proceedings of the 2007 IEEE Canada Electrical Power Conference, Montréal, QC, Canada, 14–17 October 2007; pp. 382–386. [Google Scholar]
  30. Jia, R.; Nehrir, M.H.; Pierre, D.A. Voltage control of aggregate electric water heater load for distribution system peak load shaving using field data. In Proceedings of the 2007 39th North American Power Symposium, Las Cruces, NM, USA, 30 September–2 October 2007; pp. 492–497. [Google Scholar]
  31. Pourmousavi, S.A.; Patrick, S.N.; H, M. Nehrir. Real-time demand response through aggregate electric water heaters for load shifting and balancing wind generation. IEEE Trans. Smart Grid 2014, 5, 769–778. [Google Scholar] [CrossRef]
  32. Elgazzar, K.; Li, H.; Chang, L. A centralized fuzzy controller for aggregated control of domestic water heaters. In Proceedings of the 2009 Canadian Conference on Electrical and Computer Engineering, St. John’s, NL, Canada, 3–6 May 2009; pp. 1141–1146. [Google Scholar]
  33. Sepulveda, A.; Paull, L.; Morsi, W.G.; Li, H.; Diduch, C.; Chang, L. A novel demand side management program using water heaters and particle swarm optimization. In Proceedings of the 2010 IEEE Electrical Power and Energy Conference, Halifax, NS, Canada, 25–27 August 2010; pp. 1–5. [Google Scholar]
  34. Wong, K.; Negnevitsky, M. Development of an evaluation tool for demand side management of domestic hot water load. In Proceedings of the 2013 IEEE Power & Energy Society General Meeting, Vancouver, BC, Canada, 21–25 July 2013; pp. 1–5. [Google Scholar]
  35. Negnevitsky, M.; Wong, K. Demand-side management evaluation tool. IEEE Trans. Power Syst. 2015, 30, 212–222. [Google Scholar] [CrossRef]
  36. Viswanath, S.K.; Yuen, C.; Tushar, W.; Li, W.-T.; Wen, C.-K.; Hu, K.; Chen, C.; Liu, X. System design of the Internet of Things for residential smart grid. IEEE Wirel. Commun. 2016, 23, 90–98. [Google Scholar] [CrossRef] [Green Version]
  37. IEEE Std 2030-2011; IEEE Guide for Smart Grid Interoperability of Energy Technology and Information Technology Operation with the Electric Power System (EPS), End-Use Applications, and Loads. IEEE Standards Coordinating Committee 21: Piscataway, NJ, USA, 2011.
  38. Hendron, B.; Burch, J.; Barker, G. Tool for generating realistic residential hot water event schedules. In Proceedings of the SimBuild 2010: Fourth National Conference of Internet Building Performance Simulation Assoc. (IBPSA-USA), New York City, NY, USA, 15–19 August 2010; pp. 328–335. [Google Scholar]
  39. Youssef Abdelhafez, E.S. Cyberattack Detection and Mitigation for Direct Load Control of Electric Water Heaters. Ph.D. Dissertation, McGill University, Montréal, QC, Canada, 2021. Available online: https://escholarship.mcgill.ca/concern/theses/tt44ps689 (accessed on 10 September 2022).
  40. Waibel, A.; Hanazawa, T.; Hinton, G.; Shikano, K.; Lang, K.J. Phoneme recognition using time-delay neural networks. IEEE Trans. Acoust., Speech, Signal Process. 1989, 37, 328–339. [Google Scholar] [CrossRef]
  41. Lecun, Y.; Bengio, Y. Convolutional Networks for Images, Speech, and Time-Series; MIT Press: Cambridge, MA, USA, 1995. [Google Scholar]
  42. MathWorks Help Center. tansig: Hyperbolic Tangent Sigmoid Transfer Function. Available online: https://www.mathworks.com/help/deeplearning/ref/tansig.html. (accessed on 18 August 2020).
  43. Leidos, Inc. Assessment of Residential Submeter Data for Residential Energy Consumption Survey (Recs)—Volume 1: Findings, Insights and Recommendations; U.S. Energy Information Administration: Washington, DC, USA, 2014.
  44. Erkin, Z.; Tsudik, G. Private computation of spatial and temporal power consumption with smart meters. In Proceedings of the International Conference on Applied Cryptography and Network Security, Singapore, Singapore, 26–29 June 2012; pp. 561–577. [Google Scholar]
  45. Paull, L.; Li, H.; Chang, L. A novel domestic electric water heater model for a multi-objective demand side management program. Elect. Power Syst. Res. 2010, 80, 1446–1451. [Google Scholar] [CrossRef]
  46. MathWorks Help Center. timedelaynet: Time Delay Neural Network. Available online: https://www.mathworks.com/help/deeplearning/ref/timedelaynet.html (accessed on 18 August 2020).
  47. MathWorks Help Center. preparets: Prepare Input and Target Time Series Data for Network Simulation or Training. Available online: https://www.mathworks.com/help/deeplearning/ref/preparets.html (accessed on 18 August 2020).
  48. Cortes, C.; Vapnik, V. Support-vector networks. Mach. Learn. 1995, 20, 273–297. [Google Scholar] [CrossRef]
  49. Hastie, T.; Tibshirani, R.; Friedman, J. The Elements of Statistical Learning: Data Mining, Inference, and Prediction; Springer: New York, NY, USA, 2013. [Google Scholar]
  50. Ozay, M.; Esnaola, I.; Yarman Vural, F.T.; Kulkarni, S.R.; Poor, H.V. Machine learning methods for attack detection in the smart grid. IEEE Trans. Neural Netw. Learn. Syst. 2016, 27, 1773–1786. [Google Scholar] [CrossRef]
  51. MathWorks Help Center. fitcsvm: Train Support Vector Machine (SVM) Classifier for One-Class and Binary Classification. Available online: https://www.mathworks.com/help/stats/fitcsvm.html (accessed on 23 June 2020).
  52. Fawcett, T. ROC graphs: Notes and practical considerations for researchers. Mach. Learn. 2004, 31, 1–38. [Google Scholar]
Figure 1. IoT-enabled DSM and smart home architecture.
Energies 15 07807 g001
Figure 2. Proposed TDNN architecture for LAA detection.
Energies 15 07807 g002
Figure 3. DLPs of 1000 EWHs in six cases. In the order they appear in the legend: (1) typical normal operation without peak shaving, (2) normal operation with peak shaving, and (3)–(6) peak shaving under LAAs launched at random times activating a subset of EWHs.
Energies 15 07807 g003
Figure 4. Impact of attacking subsets of EWHs on the detection rate and average detection delay of the proposed LAA detector with and without mitigation.
Energies 15 07807 g004
Figure 5. Excess power demand generated by DLC attacks activating a subset of EWHs in the absence of mitigation—winter mornings.
Energies 15 07807 g005
Figure 6. Excess power demand generated by DLC attacks activating a subset of EWHs with the mitigation delay of 15 min—winter mornings.
Energies 15 07807 g006
Table 1. Performance of tuned detectors on winter morning peak shaving.
DetectorTDNNSVMSVMSVM
Training Configuration { N D = 30 , N h = 25 } fitcsvm ‘all’fitcsvm ‘auto’ γ = 40
Profile
Level
Detection Rate (%)100100100100
False Alarm Rate (%)010.3750
Detection Delay (s)2.114.8516.809.30
Accuracy (%)99.9999.9399.9399.96
PatternTP Rate (%)99.9499.7399.7199.84
LevelFP Rate (%)0 6.29 × 10 3 2.36 × 10 3 0
Precision (%)10099.9899.99100
Publisher’s Note: MDPI stays neutral with regard to jurisdictional claims in published maps and institutional affiliations.

