Article

Numerical Evaluation of Biochar Production Performance of Downdraft Gasifier by Thermodynamic Model

by
Donghoon Shin
1,
Akhil Francis
2,
Purushothaman Vellayani Aravind
3,4,
Theo Woudstra
4,
Wiebren de Jong
3 and
Dirk Roekaerts
3,*
1
School of Mechanical Engineering, Kookmin University, Seoul 02707, Korea
2
St. Joseph’s College of Engineering and Technology Palai, Kerala 686579, India
3
Process & Energy Department, Delft University of Technology, 2628 CN Delft, The Netherlands
4
Faculty of Science and Engineering, University of Groningen, 9701 BA Groningen, The Netherlands
*
Author to whom correspondence should be addressed.
Energies 2022, 15(20), 7650; https://doi.org/10.3390/en15207650
Submission received: 13 September 2022 / Revised: 5 October 2022 / Accepted: 11 October 2022 / Published: 17 October 2022

Abstract

:
A theoretical evaluation of the biochar production process using a biomass gasifier has been carried out herein. Being distinguished from the previous research trend examining the use of a biomass gasifier, which has been focused on energy efficiency, the present study tries to figure out the effect of biochar production rate on the overall process performance because biochar itself has now been given a spotlight as the main product. Biochar can be utilized for agricultural and industrial purposes, along with the benefit of climate change mitigation. A thermodynamic model based on chemical equilibrium analysis is utilized to demonstrate the effect of biochar production rate on the producer gas characteristics such as gas composition, LHV (lower heating value) and cold gas efficiency. Three gasifier models using chemical equilibrium model are reconstructed to simulate biochar-producing gasifiers, and seven kinds of biomass are considered as feed material. Depending on the assumptions applied to the models as well as the biomass types, the results of the simulation show a large variance, whereas the biochar yield rate increases. Through regression analysis with a generalized reduced gradient optimization method, simplified equations to estimate the cold gas efficiency (CGE) and LHV of producer gas of the biochar production process were derived as having six parameters of biomass LHV, fractions of ash, carbon and water, reduction zone temperature, and biochar yield rate. The correlation factors between the thermodynamic model and the regression model are 96.54% and 98.73% for the LHV of producer gas and CGE, respectively. These equations can supply the pre-estimation of the theoretical maximum performance of a planning biochar plant.

1. Introduction

Due to recent severe climate events, activities searching for a solution to mitigate climate change are globally overwhelming. In this context, ‘negative emissions’ denoting technologies leading to a net decrease in CO2 has been proposed as a way to overcome the too-slow pace of in the reduction in CO2 (or other greenhouse gases)-emitting technologies. The negative emission technology examines the storage of carbon absorbed by biomass in the form of biochar and its possible utilization for industrial purposes [1]. As long as the biochar is not burned, the carbon is captured and stored in a stable condition through the negative emission process. Compared with the well-known CCS (carbon capture and storage) concept [2], the negative emission via biochar process has received positive prospects because of the absence of the risk of storage of CO2, and the potential economic profit [3]. The biochar has different industrial characteristics depending on the process environment. Fast pyrolysis at high temperature of biomass can be a way to produce high-quality biochar close to activated carbon [4]. Additionally, it is well known that high-temperature biochar produced above 800 °C behaves similar to a catalyst, enabling tar cracking and sequestration of carbon from various hydrocarbons to generate hydrogen [5,6,7,8]. The biochar is also a soil amendment agent with high moisture and fertilizer-holding ability, as well as fertilizer properties [9].
In spite of the potential of biochar for climate change mitigation, little research has been carried out focusing on the biochar production rate in a biomass gasifier. Most of the previous research on biomass gasification was focused on energy of the produced gas [10,11,12,13]. A fluidized bed reactor is a popular reactor for small-scale solid particle reaction [10]. Using a fluidized bed as a biomass gasifier provides a good efficiency of gasification reaction but is not suitable for biochar production due to difficulties of separation of biochar from the fluidizing media. On the other hand, using an entrained flow gasifier, which is popular in IGCC (Integrated Gasification Combined Cycle), it is not possible to sequestrate carbon from the molten ash [14]. Therefore, the up- or downdraft fixed-bed gasifier is known to be the best possible facility to produce biochar on a relatively small scale. In particular, the downdraft gasifier has strength of lower tar content in the producer gas (PG) than the updraft type [11]. Most of these biomass gasifiers utilize partial oxidation of biomass to supply heat for pyrolysis and reduction in biomass: approximately 30~40% of stoichiometric air is used to partially oxidize the biomass. However, this oxidation easily generates the problem of slagging of ash blocking the facility if air is not spread well into the bed because the biomass bed is burning fast to result in ash melting, whereas the other part is too cool to react due to lack of oxygen [15,16]. Furthermore, maintaining the uniformity of the partial oxidation reaction in a fixed bed is more difficult as the scale of the gasifier is bigger. Until now, the 2MWth Parma (Italy) downdraft gasifier has been reported as the biggest commercial plant [17], and these gasifiers have been developed with focus on syngas production rather than biochar production [18,19]. So far, most of the biochar-focused production was carried out at a low temperature. For example, the torrefaction process transforms biomass at 200~400 °C into biochar still containing a high volatile content, and the main usage of the biochar is as a fuel source leading to CO2 emission [20].
The present study uses thermodynamic process simulation by Cycle-Tempo, a commercial software based on chemical equilibrium calculation and suitable for the simulation of various energy plant designs. Altafini et al.’s downdraft gasifier model is one of the earliest of the thermodynamic model to simulate the biomass gasifier. They divide the gasification process into three sub processes, including pyrolysis, oxidation and re-duction [21]. The char production ratio was fixed to 5%, and the focus was on PG properties such as composition and calorific value, depending on the moisture content of the biomass. They also compared other process models composed with two or three gasifier modules and several separators to match the measured PG composition. In a more recent study by Vera et al., two sub gasifier modules were used in series to simulate a 110 kWth gasifier using olive oil farm residues [22]. The first gasifier is for pyrolysis process and the second is for oxidation and the reduction process. Fortunato et al. compared Altafini’s and Vera’s models to derive an improved version based on Altafini’s model [23]. These research results are identified into two major types of biomass downdraft gasification model for application on biochar production. The first one uses two gasifier modules to simulate pyrolysis and oxidation combined reduction, and the second extends the first type by putting the oxidation process between pyrolysis and reduction. By controlling operation parameters such as gasifier temperature, those models showed good similarity in the composition of PG and CGE with the measured data. However, their different configurations could lead to different levels of accuracy.
In the present study, thermodynamic models of a downdraft fixed-bed biomass gasifier were set up based on the literature and utilized to produce simulation data focusing on production rate of biochar. The seven biomasses were considered as the target fuels to find out the operation performance of the biochar production process. Additionally, simple correlation models derived by regression analysis are proposed to estimate the LHV of PG and CGE. Coefficients of the correlation model are determined through regression analysis and error minimization. These regression models can be used for evaluation of biochar plant performance in a relatively simple way when knowing biomass quality and basic operation conditions, which can be useful to make a first estimate of the economic feasibility.

2. Biomass Resource

Table 1 shows the ultimate and proximate analysis of the biomass listed from India [24,25,26,27,28,29]. The average LHV of woody biomass is reported to be 15,435 kJ/kg at dry condition. Water and ash contents are important variables affecting LHV of biomass and biochar characteristics. It is obvious that high water content will decrease LHV but increase the levels of hydrogen in PG. The ash also decreases the LHV of PG but increases biochar yield rate because ash tends to remain in the biochar. However, if pure carbon from biochar is preferred, then ash is an unwanted material. Depending on the biochar application, the operation of biochar plant should use an appropriate biomass resource as well as reaction process.
The H composition ratio of biomass is relatively constant, but C and O composition vary and have a clear negative correlation against each other as shown in Figure 1. From this analysis, carbon or oxygen composition ratio can well represent the overall composition of biomass at DAF (dry ash free condition).

3. Thermodynamic Models of Downdraft Biomass Gasifier

Previous studies have shown that the chemical equilibrium model is reasonable in spite of having some limitations due to the heterogeneous kinetic reaction in the downdraft biomass gasifier [12,21,22,23]. Heat and mass transfer in biomass fixed beds are slow phenomena taking from several minutes to an hour, depending on the biomass granule size, as well as the reacting environment. The pyrolysis reaction generating multiple hydrocarbon species, called volatiles, is dependent on the reaction environment of oxidant supply and temperature. Furthermore, a non-uniform reaction environment in the gasifier is unavoidable for several reasons: (1) Penetration and uniform dispersion of oxidant gas into solid bed is difficult because of strong drag of porous bed. (2) Mixing between oxidant and fuels is difficult due to laminar flow characteristics in bed. (3) Local temperature and chemical composition also are non-uniform in gas media as well as solid media due to reasons (1) and (2). Therefore, the biomass gasifier is, in essence, a heterogeneous reactor in which thermodynamic and fluid dynamics are the governing phenomena, and challenging to simulate with a chemical equilibrium model assuming complete mixing. However, a thermodynamic model has the advantage that it can be based on accurately known property data and is a direct and flexible tool to describe steps in energy conversion. Some aspects of incomplete reaction can be implemented in an equilibrium approach by imposing the bypass stream. Previous studies on the downdraft gasifier have shown that the application of the thermodynamic model has been reasonably chosen as method of approach. The selected two models in this research each have two and three coupled gasification reactors, respectively.

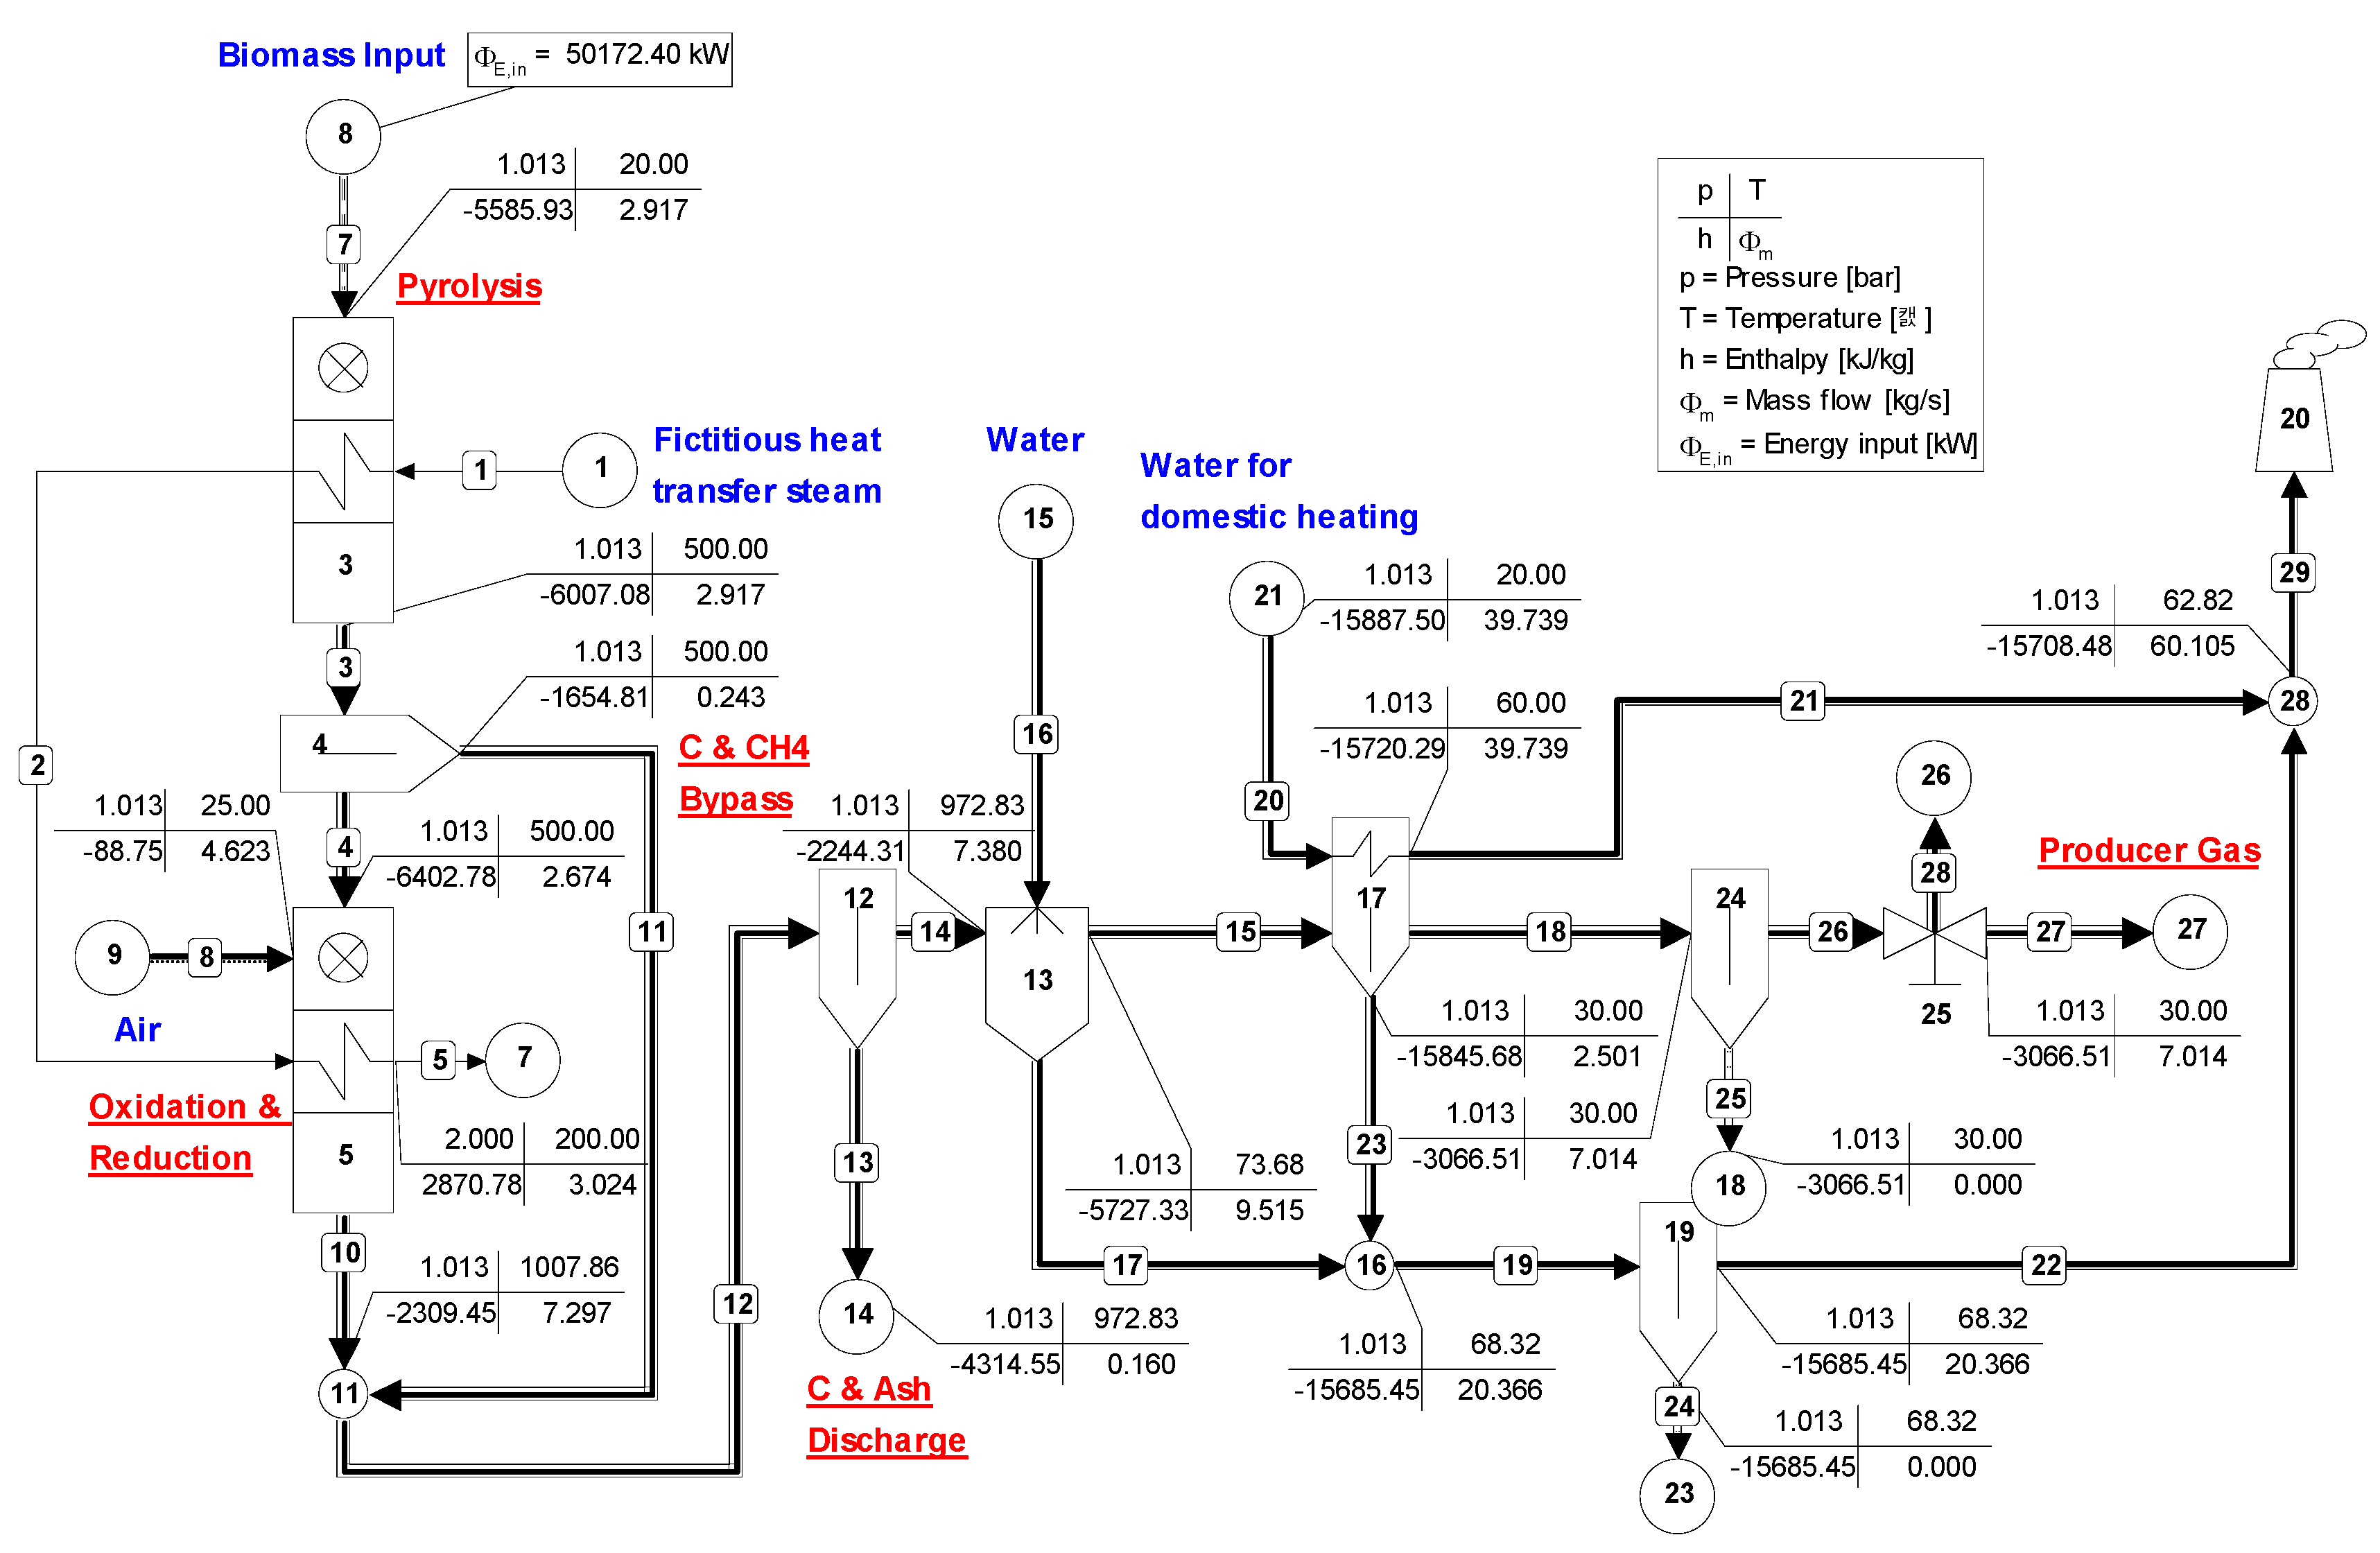
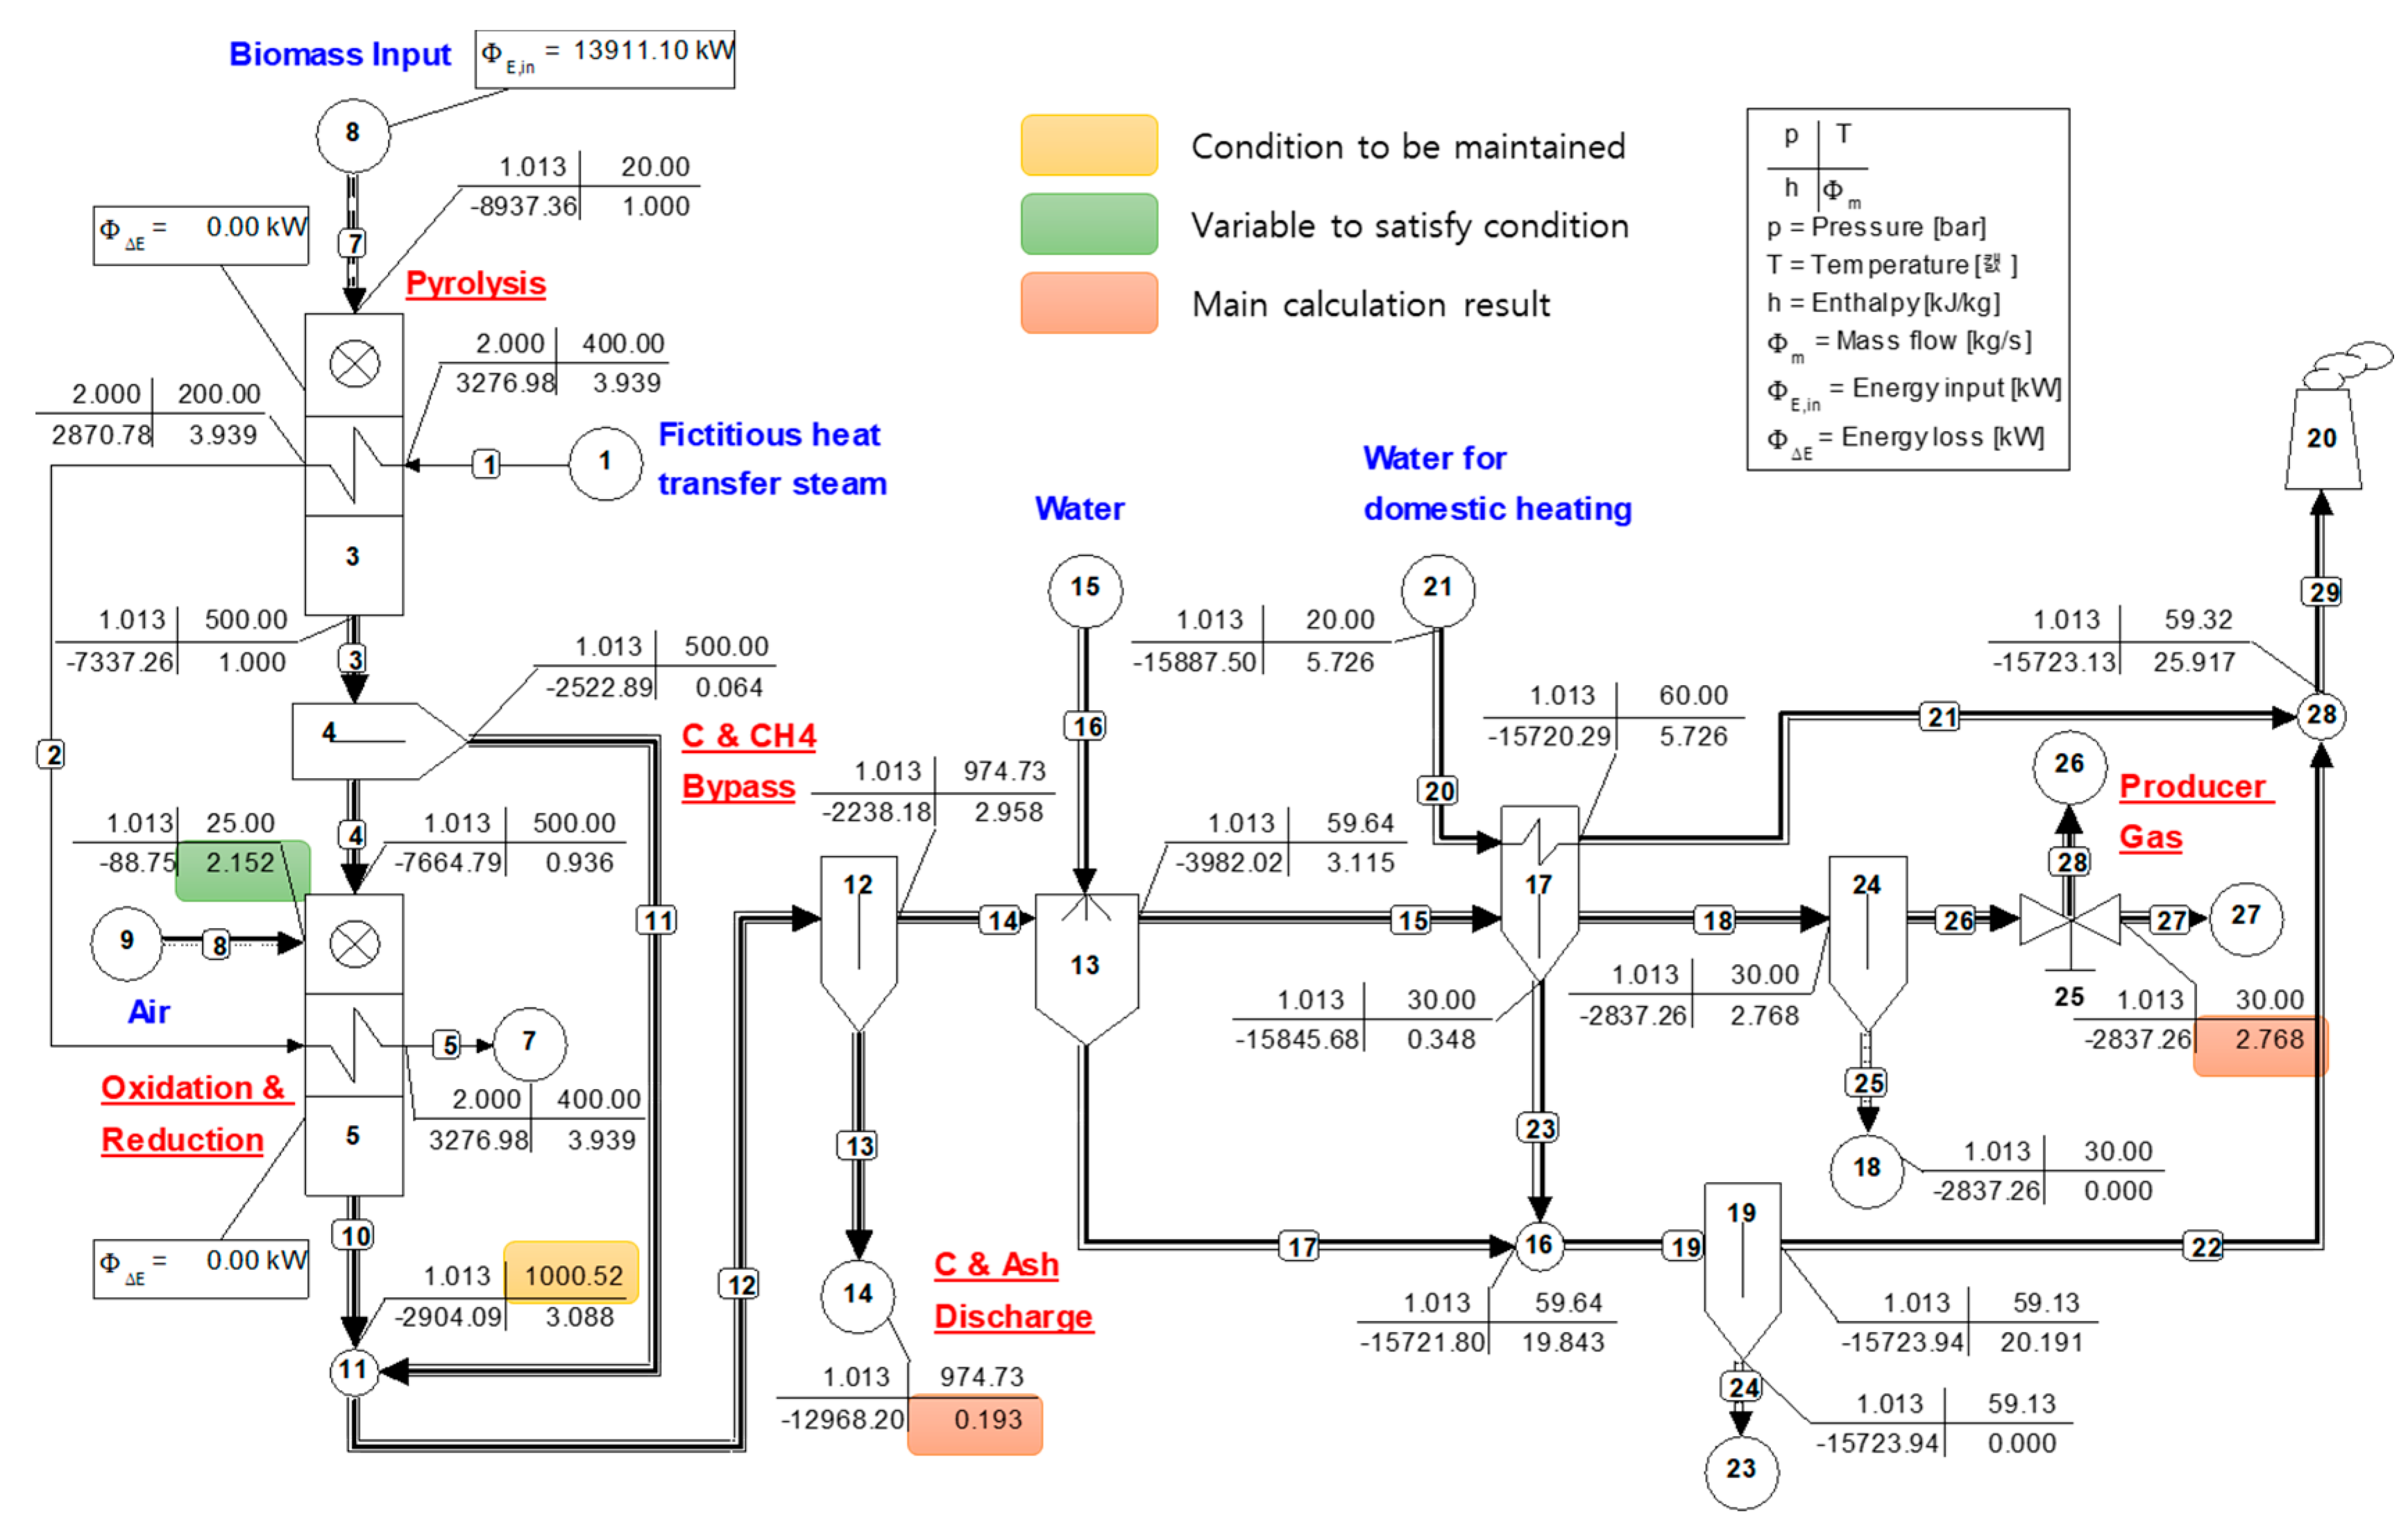
3.1. Two-Reactor Model (Vera)

The reconstructed model of Vera et al. is shown in Figure 2 [22]. It is the simplest method to simulate the downdraft gasifier with high levels of accuracy. In the general biomass gasifier, moisture evaporation, pyrolysis, and char reaction in the solid phase take place sequentially, whereas partial oxidation at pyrolysis zone and reduction at the char reaction zone occur in the gas phase. In Vera’s gasifier model, the first reactor (gasifier 3) simulates moisture evaporation and pyrolysis, and the second reactor (gasifier 5) simulates the remaining processes (oxidation and char reaction). The pyrolysis temperature of the first reactor is fixed to be 500 °C, and a bypass (stream 11) is introduced to simulate unconverted carbon (5%) and methane (3%) due to an uneven reaction in the bed, according to the literature [22]. At the second reactor, the oxidant is added to heat up the reduction zone to higher than 1000 °C using an oxidant/fuel ratio. The bypassed carbon and methane join at the exit of the second gasifier module and the biochar is separated afterwards (separator 12). Heat loss to the environment is fixed to be 5% of the biomass energy. The backward heat transfer from the reduction zone to the pyrolysis zone via conduction and radiation heat transfer is implemented by a fictitious steam flow (source 1 to sink 7) to maintain the first gasifier exit temperature at 500 °C. After transferring heat at the first gasification reactor, the steam continues to the second gasification reactor to return to the start condition; thus, the net heat transfer to the environment is zero.

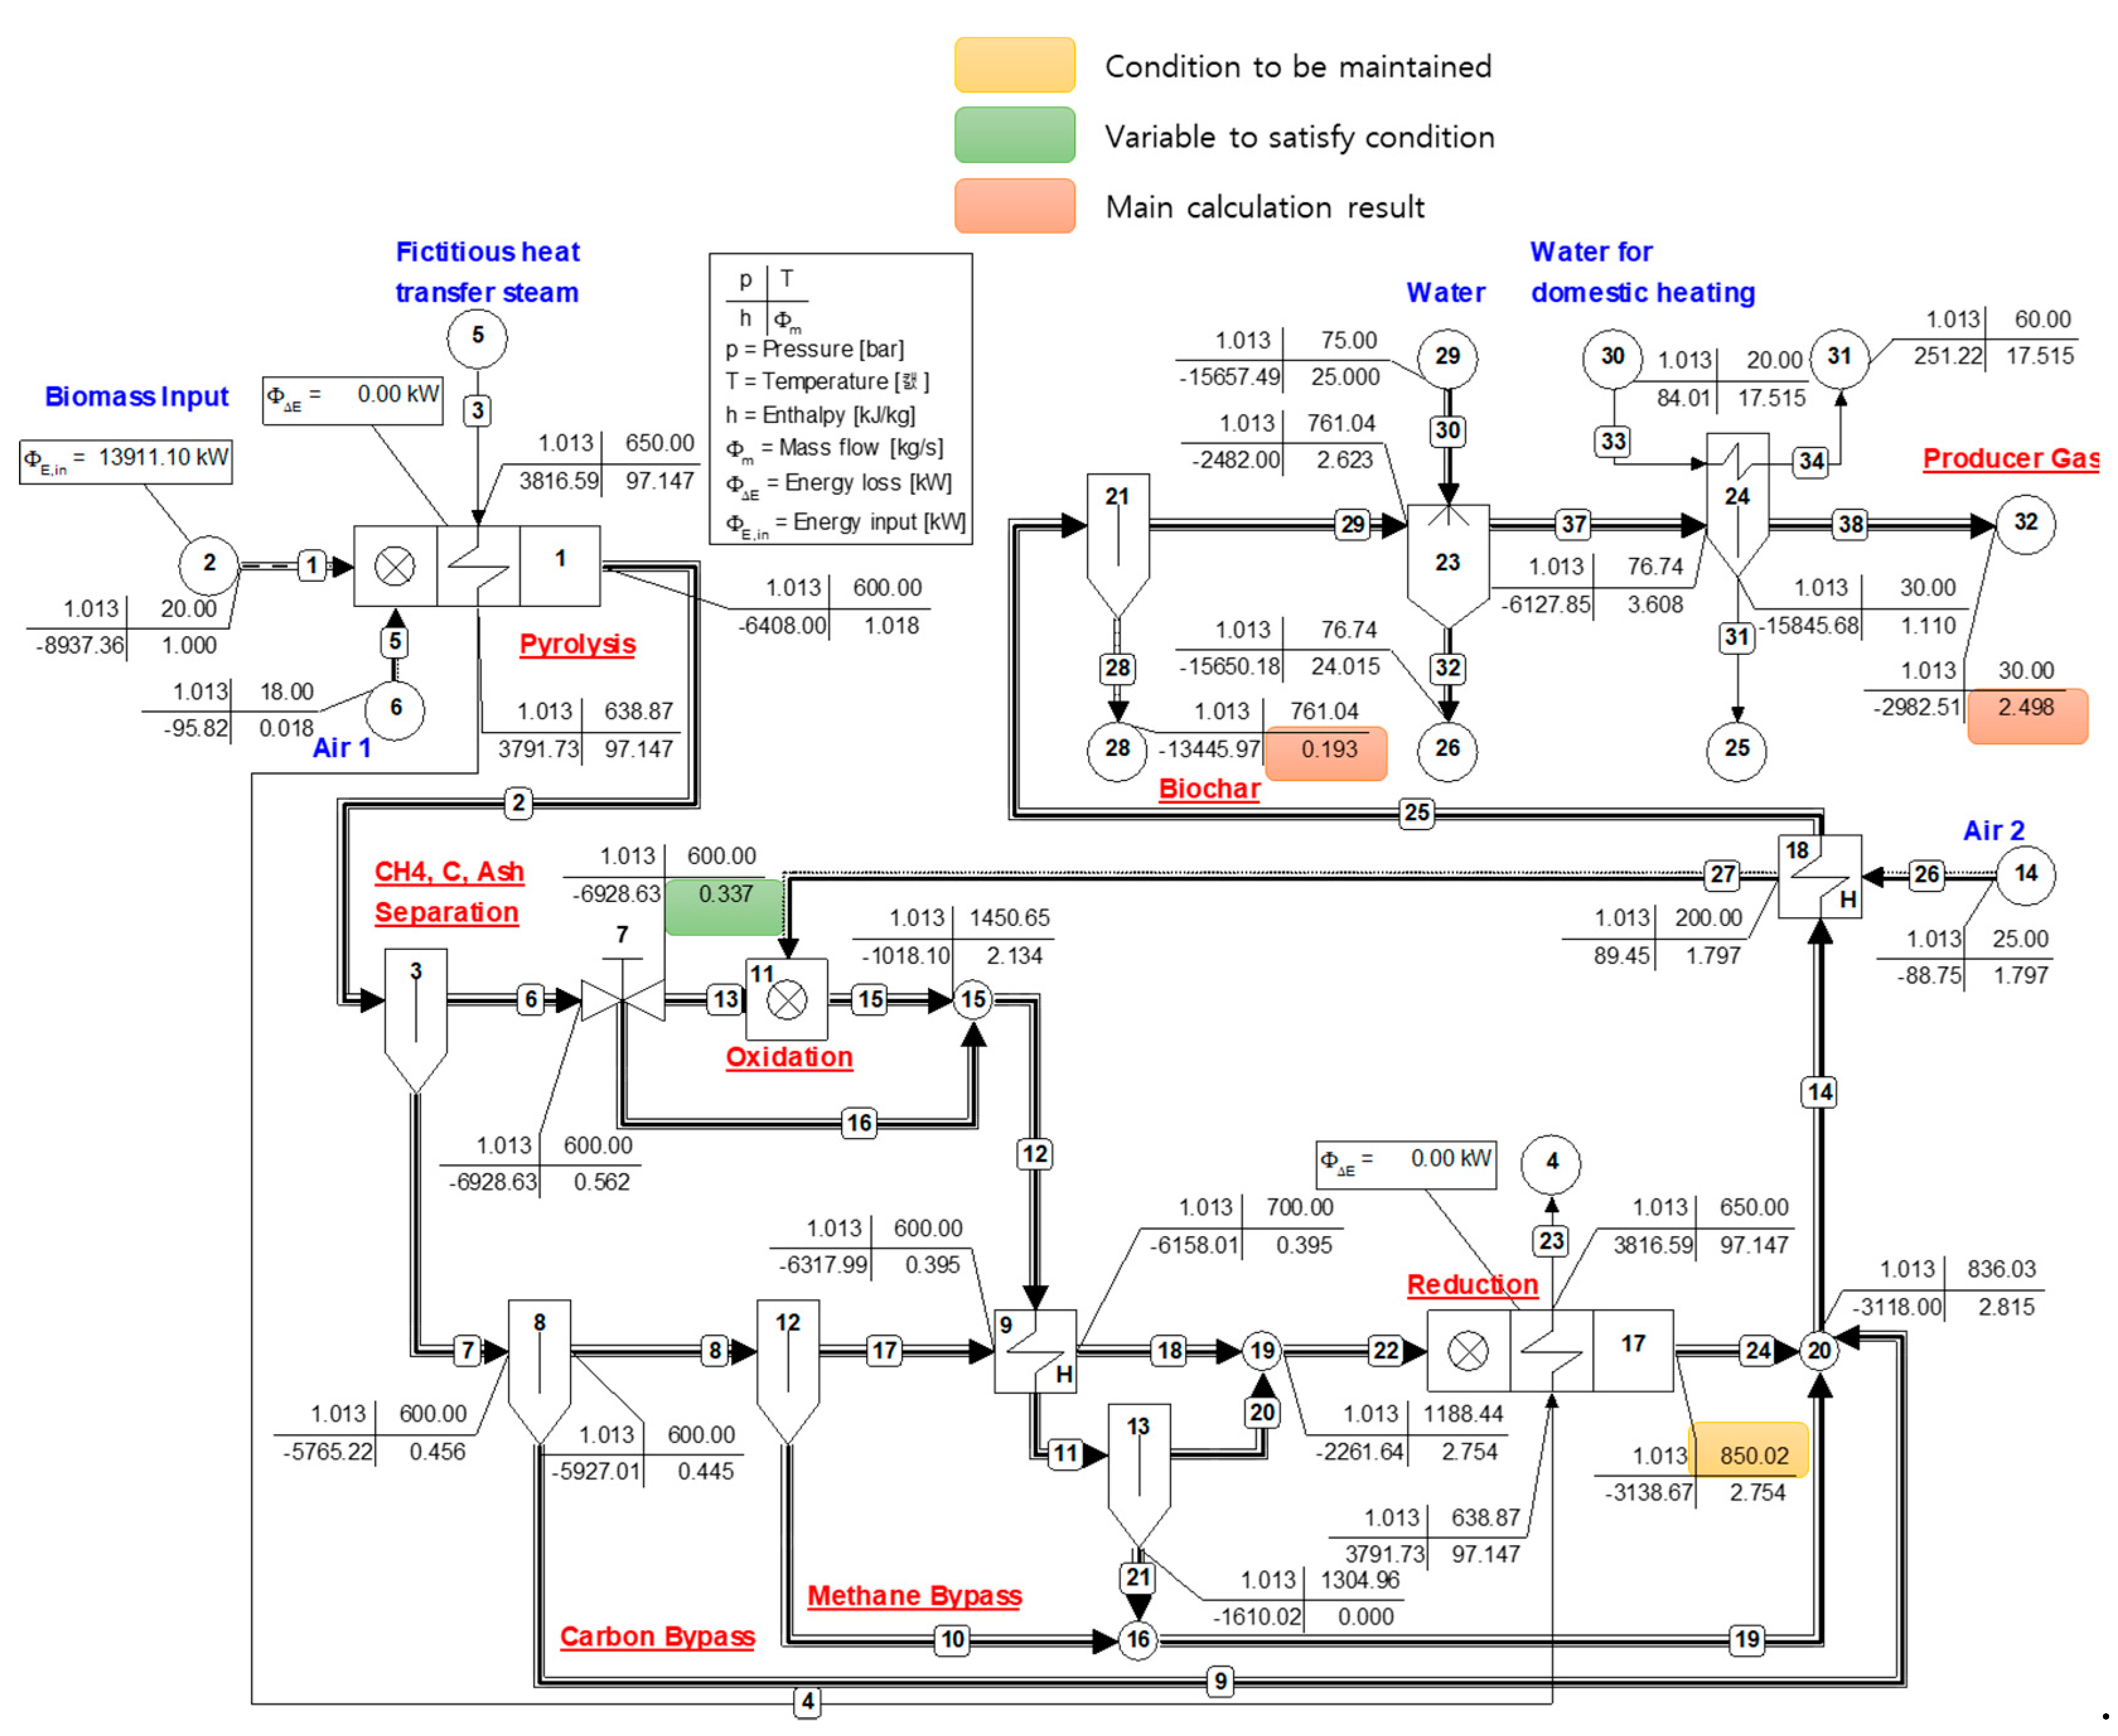
3.2. Three-Reactor Model (Fortunato)

Fortunato et al. upgraded the earlier model by Altafini et al. for better flexibility and accuracy, as shown in Figure 3 [23]. This model includes pyrolysis (gasifier 1), combustion (combustor 11) and reduction (gasifier 17) processes. In the pyrolysis reactor, the theoretical air ratio (air factor) is 0.018 and the pyrolysis temperature is 600 °C. Some amount of heat is transferred from the reduction process by fictitious water flow (source 5 to sink 4) to simulate upstream conduction and radiant heat transfer to satisfy the pyrolysis temperature. The combustion furnace receives most of the processed air, and no air is supplied to the reduction furnace, which is the major difference compared with Altafini’s model. This change improves the flexibility of the model by decreasing the number of air injection points, which means the elimination of an unknown variable from the model. The air factor of the oxidation furnace (combustor 11) is fixed at 2. The reduction process is carried out at 850 °C. Afterwards, the separated methane at separator 12 joins at junction 20 to compose the final PG. The fictitious heat exchanger 18 acts combustion air heating to 200 °C by heat exchange with the gasification reactor bed before participating in the oxidation process in combustor 11. Separator 8 separates 5% of non-useful carbon, and separator 21 separates ash and the remaining carbon in the process. The heat loss of the gasifier to the environment is assumed to be 0.5% of the biomass energy, which is 1/10 of the heat loss assumed in Vera et al.’s study.
To summarize, the first reactor (gasifier 1) includes moisture evaporation and pyrolysis with limited air supply, the second reactor (combustion 11) simulates partial oxidation of PG, and the third reactor (gasifier 17) simulates the reduction process without air supply.

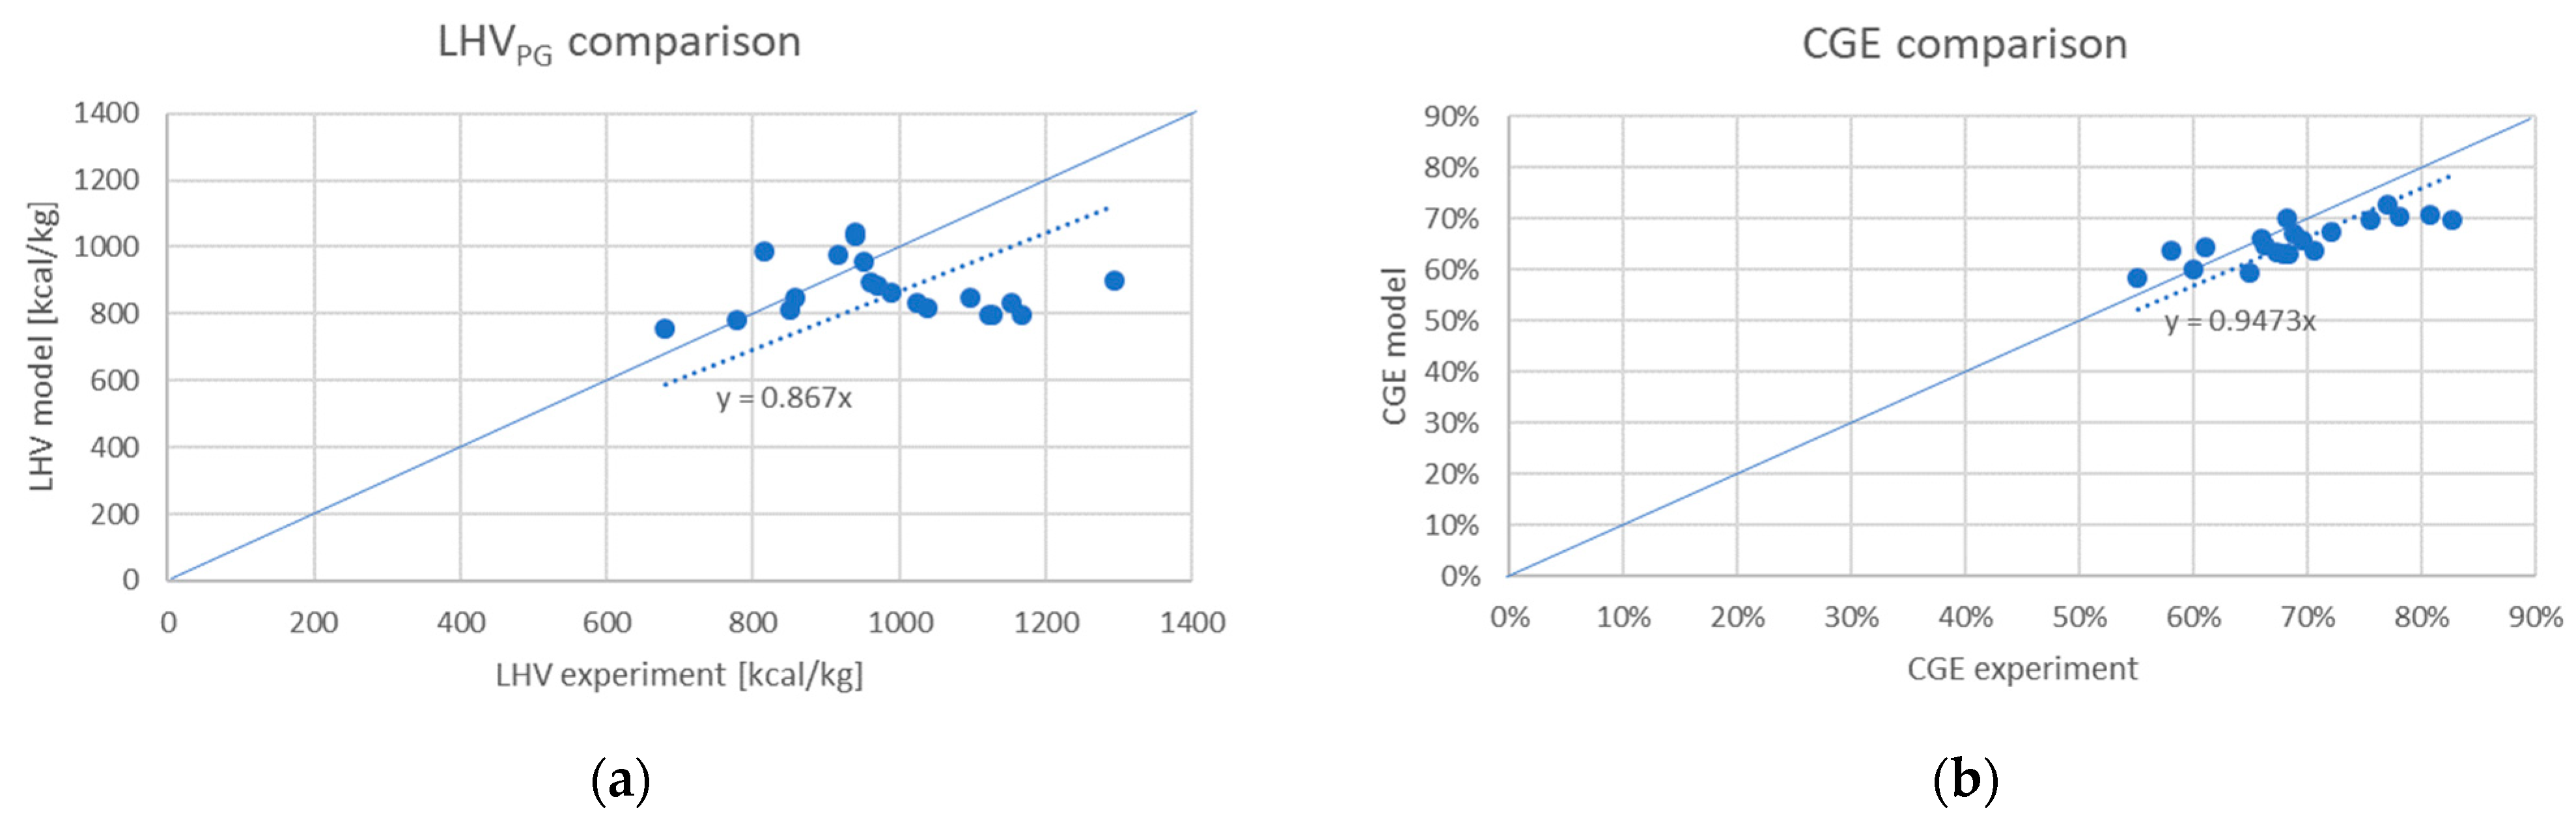
3.3. Validation of Reconstructed Models and Application for Biochar Production

Table 2 shows the result of comparison between the original models and the reconstructed models of the present study. All the composition data of PG show that the re-constructed models are close to the original models. In particular, LHV of PG and CGE show under 5% error.
Differently from the previous research, this study focuses on understanding and maximizing biochar production rate. Using the reconstructed models, biochar production condition is simulated by bypassing more carbon after the pyrolysis process. Meanwhile, the reaction temperature and the reduction gas temperature are kept the same with each original model by adjusting the oxidant flow rate. By this measure, the thermodynamic condition of each reactor is remained the same, whereas the carbon discharge rate in the form of biochar varies.
The maximum carbon separation rate is set by the pyrolysis process. The two and three gasification reactors models have different pyrolysis temperature and oxidant injection rate (air factor), which results in different available carbon discharge rate. The carbon discharge ratio (CDR) is defined as the percent of pure carbon separation after the pyrolysis process. Meanwhile the biochar yield rate is combination of carbon and ash discharge rate as ash is included in biochar. Biochar yield ratio (Ybiochar), which is the main process performance parameter in this study, is defined by the following equation:
Y biochar = Biochar   Yield   Rate   [ kg s ] Carbon   and   Ash   Input   Rate   at   Dry   Condition [ kg s ]  
The cold gas efficiency is defined as Equation (2), which is based on the LHV of biomass and producer gas.
CGE = LHV PG *   m ˙ PG LHV biomass *   m ˙ biomass
where   m ˙ i is the mass flow rate of i material.

3.4. Regression Model of Biochar Production Performance

The results of thermodynamic simulations are used to determine correlation model for relevant performance parameters. The main products of biomass plant are PG and biochar. The quality of PG is evaluated with LHV of PG (LHVPG) and the cold gas efficiency (CGE), which are the two performance parameters. Ybiochar is selected as the main variable of the biochar process as LHVPG and CGE strongly related. The other variables that affect the performance were assumed to be LHV of biomass (LHVbiomass, [kcal/kg]), carbon mass fraction (Cf), moisture mass fraction (Wf), ash mass fraction (Af) in biomass and temperature of the reduction process (Tr, [K]). The functional relationship between the performance parameters and the variables are assumed in the form of the following equations:
LHV PG = a 1 LHV biomass ( a 2 Y biochar 2 + a 3 C f + a 4 W f + a 5 A f + a 6 T r + a 7 ( A f W f ) 2 + a 0 )
CGE = b 1 Y biochar + b 2 C f + b 3 W f + b 4 A f + b 5 T r + b 6 ( A f W f ) 2 + b 0
where ai and bi are the coefficients determined by the GRG (generalized reduced gradient) nonlinear solver minimizing the difference between the proposed correlation equations and the full set of simulation results by the thermodynamic model.

4. Results and Discussion

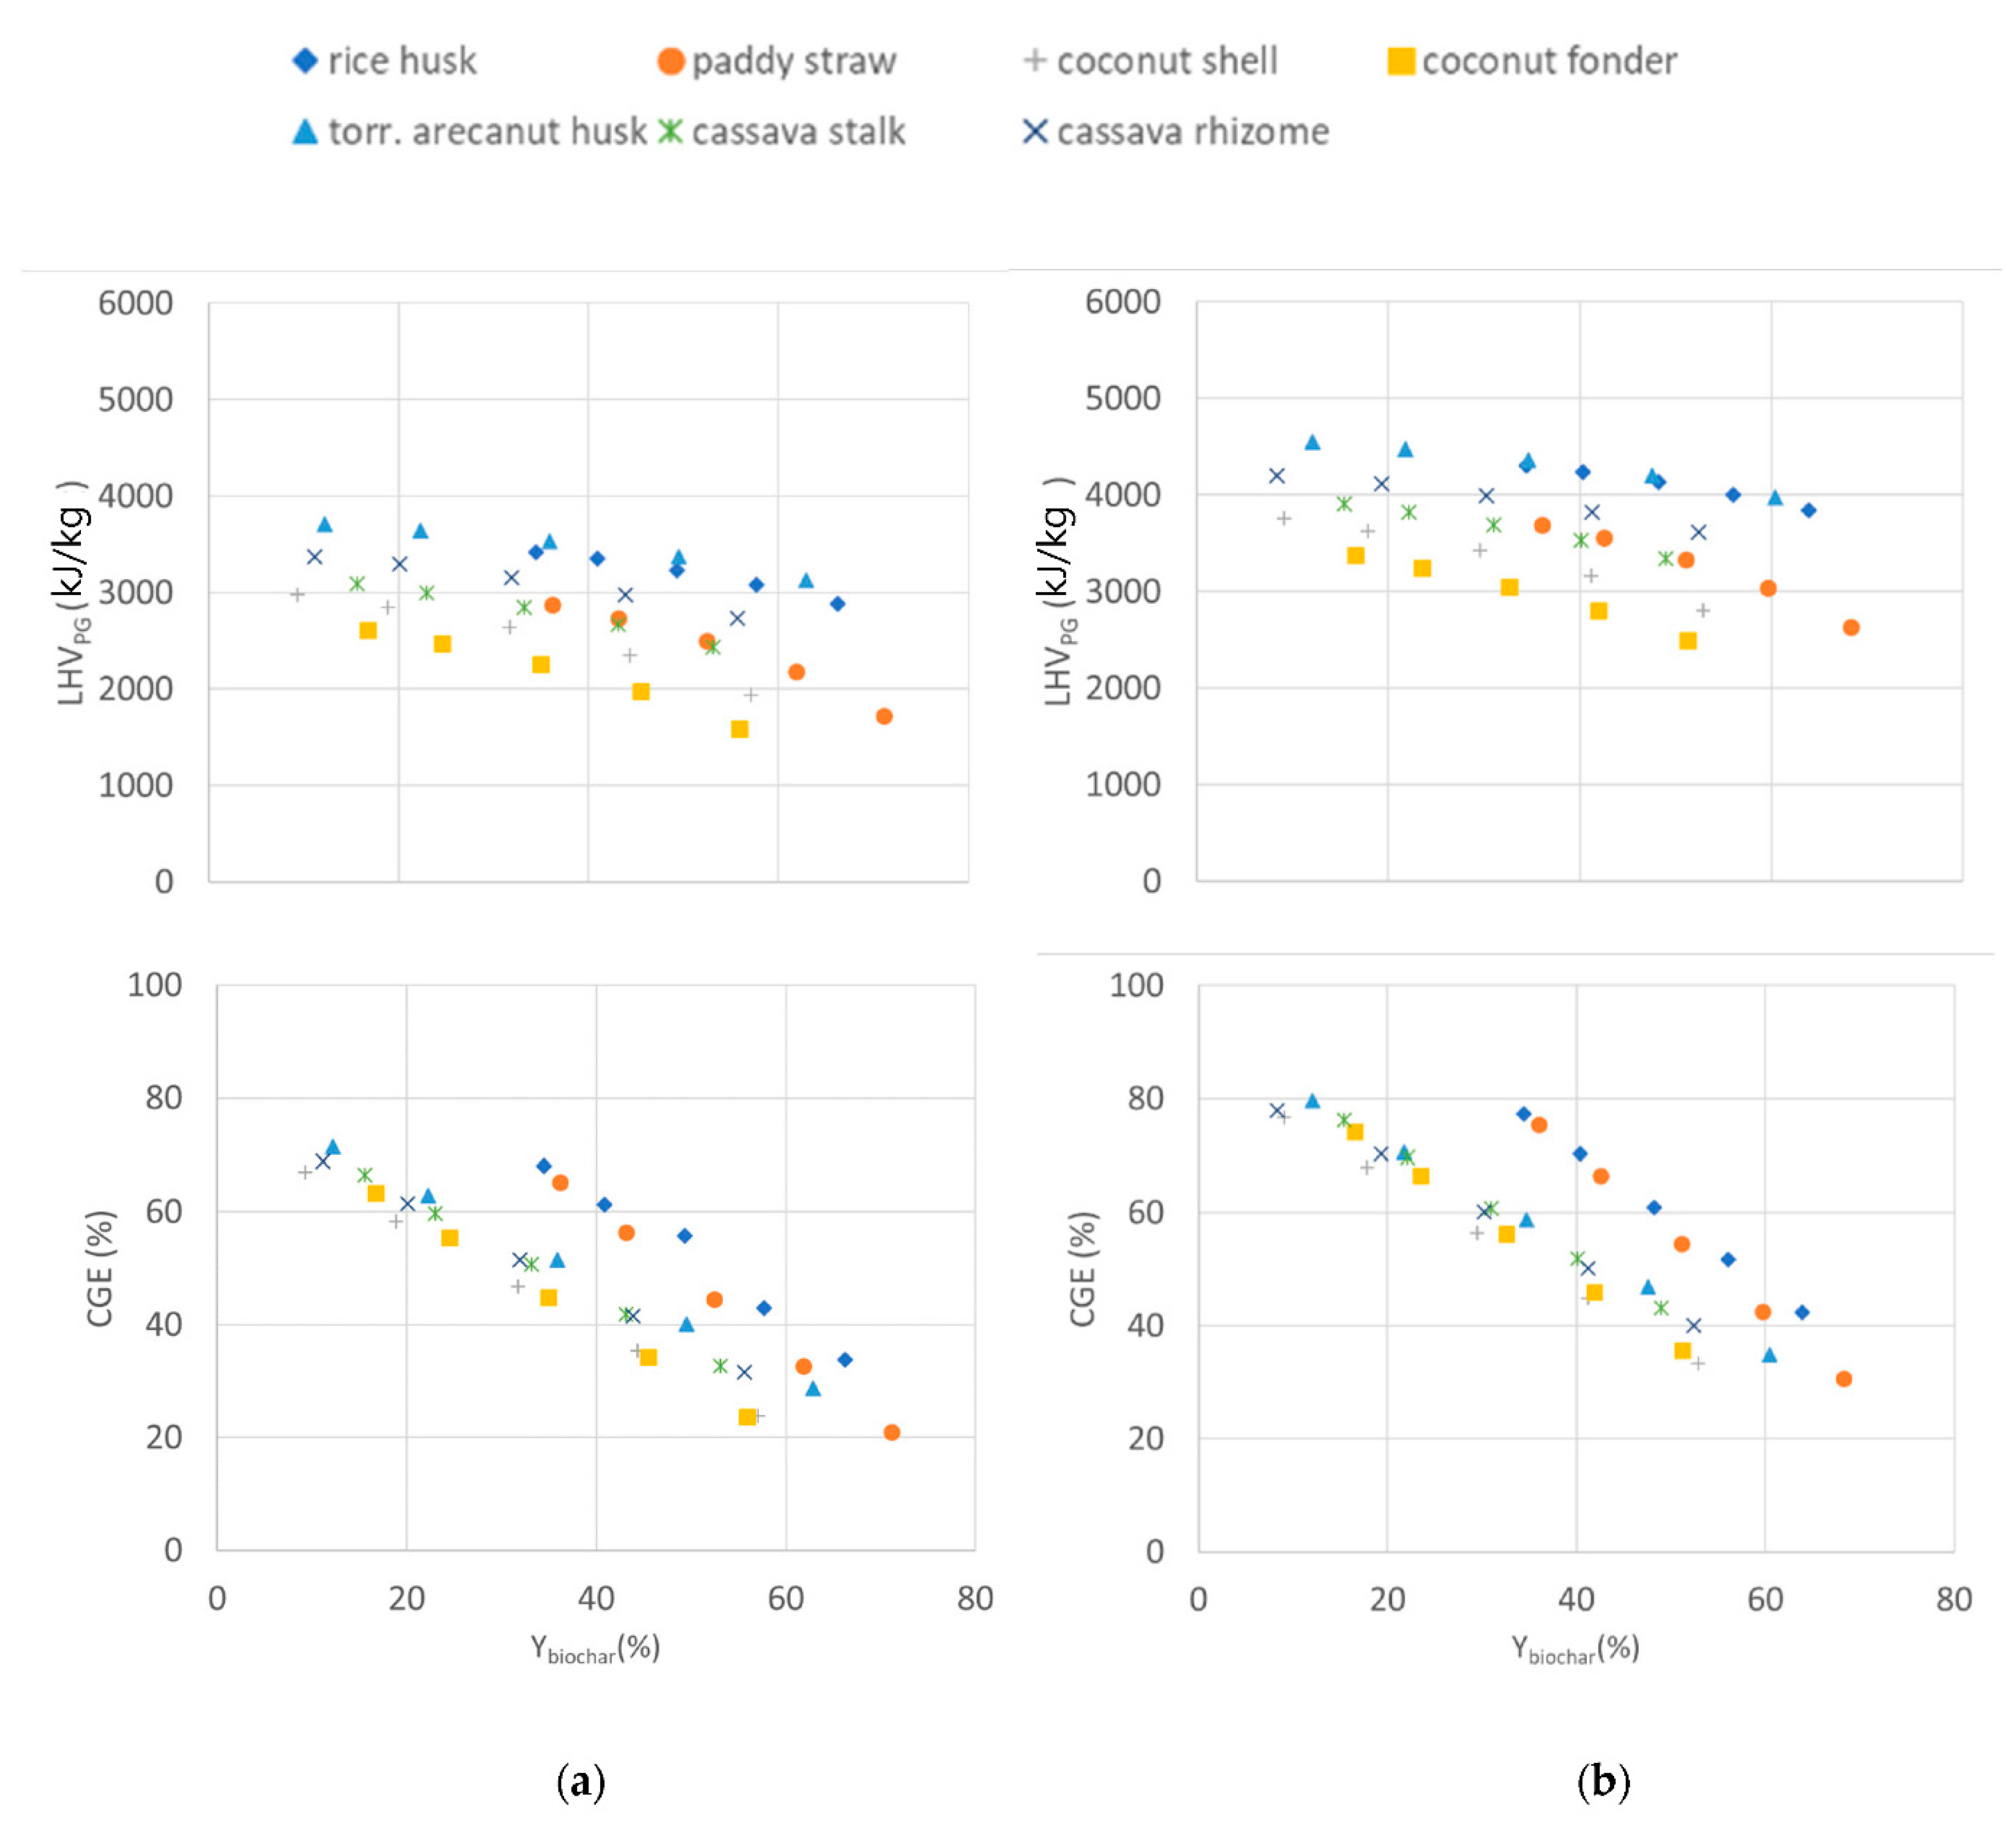
4.1. Process Calculation Results

Figure 4 shows a sample result of the two-reactor model using rice husk as the feed. The heat loss to the environment is a key parameter of the plant performance; however, Vera’s model uses 5% of heat loss, whereas Fortunato’s model uses 0.5%. Meanwhile, increased heat loss decreases CGE due to increased combustion air supply to maintain the reduction zone temperature. Hence, in this parametric study, the heat loss is assumed to be zero to find out maximum theoretical efficiency. Additionally, the mass flow rate of biomass is fixed to be 1 kg/s, which is from the fact that the thermodynamic efficiency is not the function of scale in an ideal simulation such as this study. As CDR increases at separator 4, the air flow rate (source 9) decreases, and the biochar yield increases (sink 14) accordingly as shown in Table 3. Process simulations for each biomass in Table 1 using two models were carried out by varying CDR in the range of 5% to 100% at separator 4.
Figure 5 shows the sample results of the three-reactor models using rice husks. While the CDR changes, the reduction furnace temperatures of all the simulation remain 850 °C by adjusting pyrolysis gas flow rate at valve 7. Because the stoichiometric equivalence factor (air factor) is fixed at 2, the fuel gas flow rate at valve 7 is directly related with air flow rate at combustor 11. The trends of the results of parametric study in Table 4 is similar between both models. However, overall LHVPG and CGE of three-reactor model is higher than the two-reactor model, which is mainly due to the lower reduction furnace temperature.

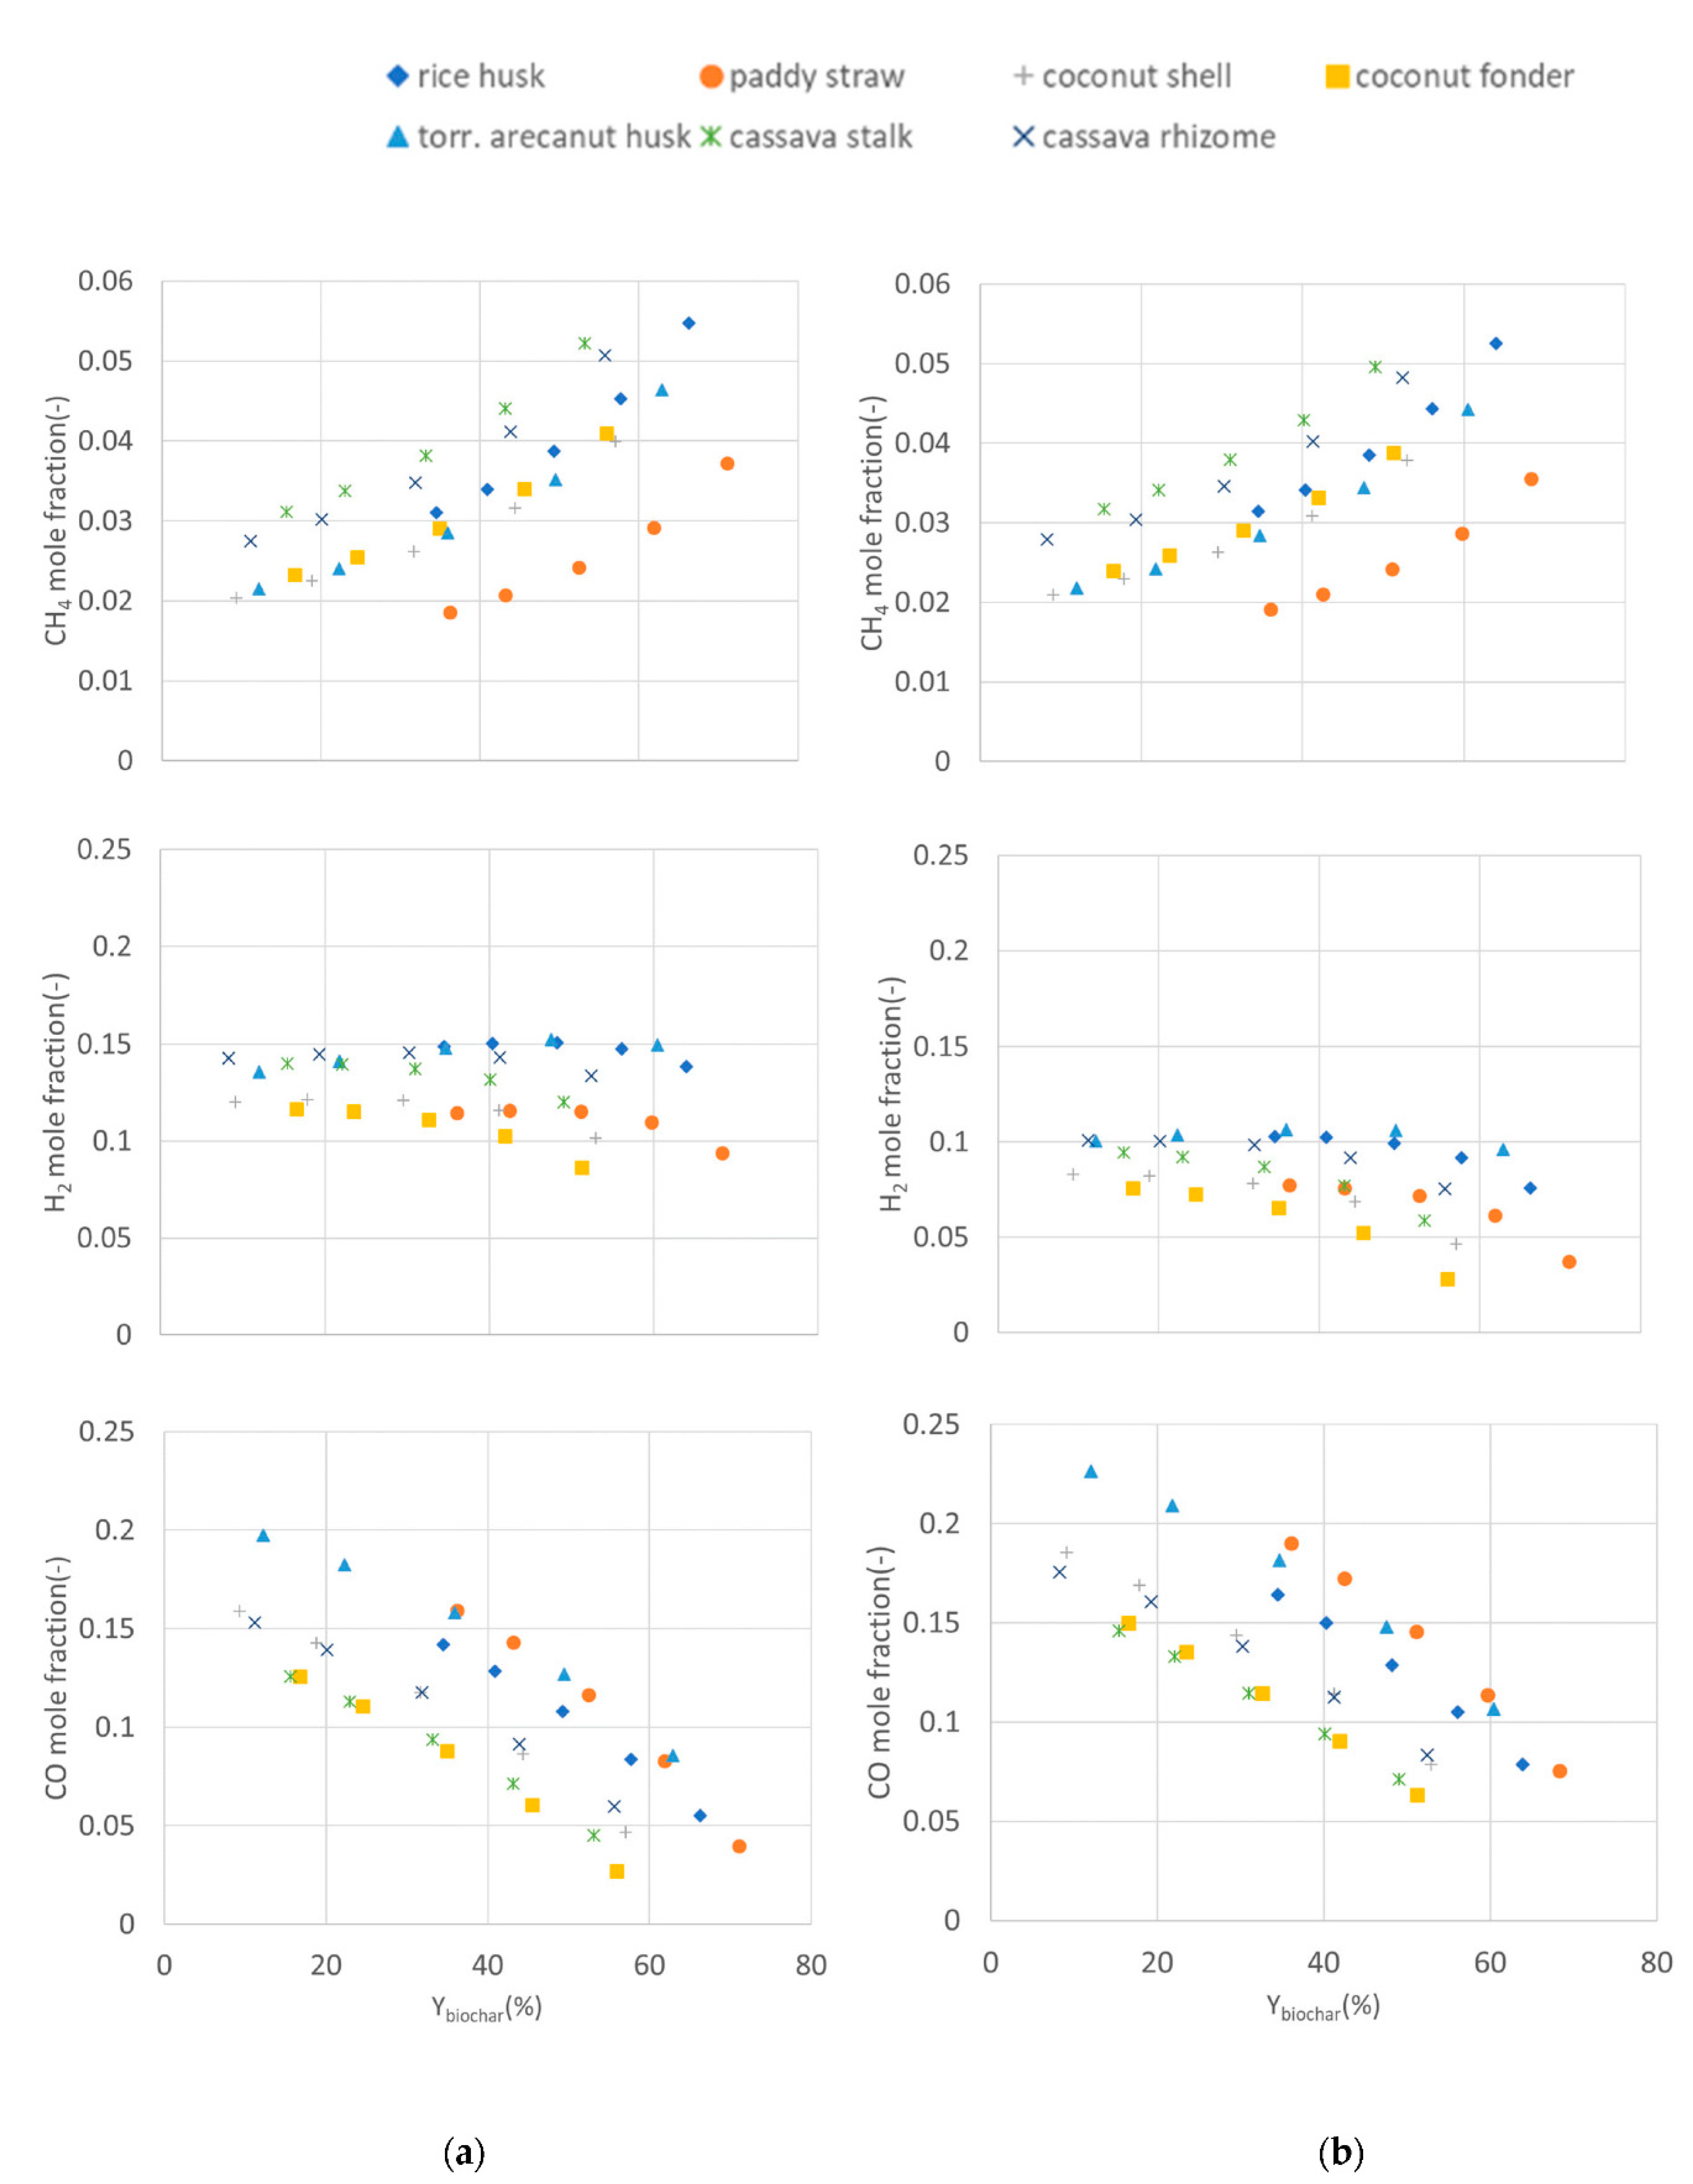
4.2. Producer Gas Characteristics

The species composition result of PG is summarized at Figure 6 depending on Ybiochar and feeding biomass. The biomass type has a strong effect on Ybiochar’s range owing to ash content. Bigger ash content means bigger biochar production rate at the same CDR because ash joins in biochar. The methane fraction of PG is not strongly dependent on the simulation model because methane bypasses the reduction reactor. The mole fraction of methane increases as Ybiochar increases due to decreased PG flow rate, whereas the bypassing flow of methane remains the same. The difference in pyrolysis temperature between the models makes the methane composition slightly varying for the same biomass. However, the overall trend depending on Ybiochar remains similar. Meanwhile, H2 and CO mole fraction shows a difference between the simulation models. Even though the trend depending on Ybiochar and feed material seems similar, the two-reactor model shows lower concentration of H2 and CO than the three-reactor model due to a higher reduction zone temperature, which consumes more PG to increase the reduction zone temperature. Additionally, as Ybiochar increases, the concentrations of H2 and CO decrease and they do so more rapidly at higher Ybiochar. This shows that more volatiles have to be burned to support the reduction zone temperature in the two-reactor models. H2 and CO concentration in the PG of the two-reactor models is approximately 5% and 3% lower than the three-reactor models, respectively. H2 concentration shows relatively constant values at varying Ybiochar comparing to CO concentration because there is high enough H2O content in the PG to act as the source of H2. Meanwhile, the source of CO is carbon which decreases as Ybiochar increases; thus, CO concentration declines as Ybiochar increases.
Figure 7 shows LHVPG and CGE depending on Ybiochar and feeding biomass. LHVPG shows an obvious trend; as Ybiochar increases or LHV0 decreases, LHVPG decreases. Additionally, the two-reactor model has lower LHVPG than the three-reactor model due to higher air supply to maintain the reduction zone temperature. A difference of around 800~1000 kJ/kg in LHVPG is observed between the two simulation models. CGE, which is the main performance parameter of the plant, has a difference of approximately 10% between the two simulation models. It seems that the two biomass groups appear in the CGE chart; rice husk and paddy straw have higher CGE then other biomasses at the same levels of Ybiochar due to high ash content in the raw biomass.

4.3. Regression Models

The performance of the biochar production plant depends on various variables, which makes the prediction difficult. A simplified model to estimate the performance with limited data will decrease the effort to build and simulate all the design and operation conditions of the biomass plant to find out the performance data. Therefore, model equations of LHVPG and CGE model were introduced of the form given in Equations (3) and (4), and the best values of coefficients are derived to be as given in Table 5 by the GRG nonlinear solver. Figure 8 shows the comparison between the simulation results and the regression model equation about LHVPG and CGE. The equations, for LHVPG and CGE give results in good agreement regardless of gasifier models and biomasses with correlations of 98.73% and 96.54%, respectively. However, careful observation on the results of LHVPG shows slightly different trends for each biomass. Torrefied areca nut and coconut fonder, which have the highest and lowest LHV0, respectively, have the steepest and the slowest change in the figure of LHVPG. Therefore, bigger errors are expected at the higher and lower zone of LHVPG. Other intermediate LHV biomasses show relatively good agreement obtained with the model equation. Meanwhile, the CGE result shows better linear correlation than the LHVPG.
Research on biochar production facilities starts with the gasifier, and until now, focuses on the production yield of fuel gas and liquid, as well as the part on biochar production, has been treated as ancillary. As the importance of biochar in response to climate change has recently been highlighted, research on biochar production methods is being actively conducted. However, most of the studies are at the lab scale in the laboratory, and the studies on the advancement of biochar production in commercial scale are insignificant. The downdraft gasifier is also conducted mainly for lab-scale research, usually batch-type reactors, and the research results of continuous medium-to-large facilities are not common. In Table 6, among the downdraft gasifier studies that have been published so far, the experimental results in continuous facilities including the data of biochar yield were used and the regression model was applied to compare with the actual measurement results [30,31,32,33,34,35,36]. A total of 20 measured results were selected, and some data without CGE data or LHVPG were also used for CGE and LHVPG calculations using the provided PG concentration and flow rate. Unfortunately, most of the research results focused on PG production; thus, the ER (equivalence ratio, or air factor) was operated with a focus on stable facility operation in the range of 0.2~0.5. Accordingly, the results of upgrading Ybiochar could not be included. In addition, when the measurement of Tr was not accurate, the measurement result of the highest temperature in the gasification reactor was selected as Tr and applied to the regression model.
Figure 9 shows the comparison results about LHVPG and CGE. As expected from Figure 8, CGE shows relatively good agreement between the experiments and the regression model in spite of various biomass, wide scale range and operation condition, whereas the error of LHVPG shows relatively bigger mismatch at above 1000 kcal/kg. However, the regression model based on thermodynamic model with assumption of no heat loss can provide theoretical design and operational information of the advanced biochar production system.

5. Conclusions

In the present study, two different biomass gasifier models using thermodynamic software were evaluated for application to biochar production process. The two simulation models were rebuilt, the implementation verified and subsequently a parametric study on biochar production has been carried out. Furthermore, correlations for LHVPG and CGE were formulated based on the thermodynamic simulation to supply simplified prediction correlations.
The two-reactor model and the three-reactor model were reconstructed and showed the same methane concentration trend, depending on Ybiochar and biomass characteristics. However, H2 and CO concentration as well as LHVPG show differences due to the difference in reduction zone temperature. The two-reactor model has a higher reduction zone temperature which requires more combustion heat from PG. However, their trends depending on Ybiochar for each biomass show a similar pattern. Hence, these two different models are expected to generate similar results.
Examining the thermodynamic simulation model results, the performance parameters include multiple independent variables, which makes the estimation process difficult and requires professional knowledge on the simulation. Based on a selection of independent variables including biochar yield (Ybiochar), LHVbiomass, reduction zone temperature (Tr), biomass contents of ash (Af), water (Wf) and carbon (Cf), the correlation equations from regression analysis show a good match with the simulation results, which show 96.54% and 98.73% correlations for LHVPG and CGE, respectively. In spite of variations in biomass, scale and operation conditions, the correlation equations are supposed to supply a useful information for design, operation and feasibility evaluation of a biochar production system. However, because the results are based on no heat loss assumption of the thermodynamic simulation, it should be considered as theoretical information.

Author Contributions

Conceptualization, D.S.; methodology, D.S.; resources, A.F.; data curation, A.F.; writing—original draft preparation, A.F.; writing—review and editing, D.R.; visualization, T.W.; supervision, W.d.J.; project administration, P.V.A.; funding acquisition, D.S. All authors have read and agreed to the published version of the manuscript.

Funding

This research was funded by KETEP (Korea Institute of Energy Technology Evaluation and Planning) No. 202003040030090 and KEIT (Korea Evaluation Institute of Industrial Technology) No. 20213030040550.

Institutional Review Board Statement

Not applicable.

Informed Consent Statement

Not applicable.

Data Availability Statement

Not applicable.

Conflicts of Interest

The authors declare no conflict of interest.

References

  1. Li, L.; Yao, Z.; You, S.; Wang, C.-H.; Chong, C.; Wang, X. Optimal design of negative emission hybrid renewable energy systems with biochar production. Appl. Energy 2019, 243, 233–249. [Google Scholar] [CrossRef] [Green Version]
  2. Mendiara, T.; García-Labiano, F.; Aba, A.; Gayán, P.; de Diego, L.F.; Izquierdo, M.T.; Adánez, J. Negative CO2 emissions through the use of biofuels in chemical looping technology: A review. Appl. Energy 2018, 242, 657–684. [Google Scholar] [CrossRef]
  3. Rubin, E.S.; Davison, J.E.; Herzog, H.J. The cost of CO2 capture and storage. Int. J. Greenh. Gas Control 2015, 40, 378–400. [Google Scholar] [CrossRef]
  4. Volperts, A.; Plavniece, A.; Dobele, G.; Zhurinsh, A.; Kruusenberg, I.; Kaare, K.; Locs, J.; Tamasauskaite-Tamasiunaite, L.; Norkus, E. Biomass based activated carbons for fuel cells. Renew. Energy 2019, 141, 40–45. [Google Scholar] [CrossRef]
  5. Liua, Y.; Paskeviciusa, M.; Wanga, H.; Parkinsona, G.; Vederb, J.; Huc, X.; Lia, C.Z. Role of O-containing functional groups in biochar during the catalytic steam reforming of tar using the biochar as a catalyst. Fuel 2019, 253, 441–448. [Google Scholar] [CrossRef]
  6. Zhang, Z.; Zhu, Z.; Shen, B.; Liu, L. Insights into biochar and hydrochar production and applications: A review. Energy 2019, 171, 581–598. [Google Scholar] [CrossRef]
  7. Guo, F.; Peng, K.; Liang, S.; Jia, X.; Jiang, X.; Qian, L. Evaluation of the catalytic performance of different activated biochar catalysts for removal of tar from biomass pyrolysis. Fuel 2019, 258, 116–204. [Google Scholar] [CrossRef]
  8. Lee, J.; Kim, K.H.; Kwon, E.E. Biochar as a Catalyst. Renew. Sustain. Energy Rev. 2017, 77, 70–79. [Google Scholar] [CrossRef]
  9. Wang, J.; Wang, S. Preparation, modification and environmental application of biochar: A review. J. Clean. Prod. 2019, 227, 1002–1022. [Google Scholar] [CrossRef]
  10. Motta, I.L.; Miranda, N.T.; Filho, R.M.; Maciel, M.R.W. Biomass gasification in fluidized beds: A review of biomass moisture content and operating pressure effects. Renew. Sustain. Energy Rev. 2018, 94, 998–1023. [Google Scholar] [CrossRef]
  11. Susastriawan, A.A.P.; Saptoadi, H.; Purnomo. Small-scale downdraft gasifiers for biomass gasification: A review. Renew. Sustain. Energy Rev. 2017, 76, 989–1003. [Google Scholar] [CrossRef]
  12. Safarian, S.; Unnþorsson, R.; Richter, C. A review of biomass gasification modelling. Renew. Sustain. Energy Rev. 2019, 110, 378–391. [Google Scholar] [CrossRef]
  13. Cha, J.S.; Park, S.H.; Jung, S.-C.; Ryu, C.; Jeon, J.; Shin, M.; Park, Y.-K. Production and utilization of biochar: A review. J. Ind. Eng. Chem. 2016, 40, 1–15. [Google Scholar] [CrossRef]
  14. Molino, A.; Chianese, S.; Musmarrab, D. Biomass gasification technology:The state of the art overview. J. Energy Chem. 2016, 25, 10–25. [Google Scholar] [CrossRef]
  15. Bunchan, S.; Poowadin, T.; Trairatanasirichai, K. A Study of Throat Size Effect on Downdraft Biomass Gasifier Efficiency. Energy Procedia 2017, 138, 745–750. [Google Scholar] [CrossRef]
  16. Siddiqui, H.; Thengane, S.K.; Sharma, S.; Mahajani, S.M. Revamping downdraft gasifier to minimize clinker formation for high-ash garden waste as feedstock. Bioresour. Technol. 2018, 266, 220–231. [Google Scholar] [CrossRef]
  17. Bhoi, P.R.; Huhnke, R.L.; Kumar, A.; Thapa, S.; Indrawan, N. Scale-up of a downdraft gasifier system for commercial scale mobile power generation. Renew. Energy 2018, 118, 25–33. [Google Scholar] [CrossRef]
  18. Hrbek, J. Status Report on Thermal Biomass Gasification in Countries Participating in IEA Bioenergy Task 33; Vienna University of Technology: Vienna, Austria, 2016; p. 69. [Google Scholar]
  19. Situmorang, Y.A.; Zhao, Z.; Yoshida, A.; Abudula, A.; Guan, G. Small-Scale Biomass Gasification Systems for Power Generation (<200 kW Class): A Review. Renew. Sustain. Energy Rev. 2020, 117, 109486. [Google Scholar] [CrossRef]
  20. Niu, Y.; Lv, Y.; Lei, Y.; Liu, S.; Liang, Y.; Wang, D.; Hui, S. Biomass torrefaction: Properties, applications, challenges, and economy. Renew. Sustain. Energy Rev. 2019, 115, 109395. [Google Scholar] [CrossRef]
  21. Altafini, C.R.; Wander, P.R.; Barreto, R.M. Prediction of the working parameters of a wood waste gasifier through an equilibrium model. Energy Convers. Manag. 2003, 44, 2763–2777. [Google Scholar] [CrossRef]
  22. Vera, D.; Mena, B.; Jurad, F.; Schories, G. Study of a downdraft gasifier and gas engine fueled with olive oil industry wastes. Appl. Therm. Eng. 2013, 51, 119–129. [Google Scholar] [CrossRef]
  23. Fortunato, B.; Brunetti, G.; Camporeale, S.M.; Torresi, M.; Fornarelli, F. Thermodynamic model of a downdraft gasifier. Energy Convers. Manag. 2017, 140, 281–294. [Google Scholar] [CrossRef]
  24. Makwana, J.P.; Pandey, J.; Mishra, G. Improving the properties of producer gas using high temperature gasification of rice husk in a pilot scale fluidized bed gasifier (FBG). Renew. Energy 2019, 130, 943–951. [Google Scholar] [CrossRef]
  25. Grover, S.; Kathuria, R.S.; Kaur, M. Energy Values and Technologies for Non woody Biomass: As a clean source of Energy. IOSR J. Electr. Electron. Eng. 2012, 1, 10–14. [Google Scholar] [CrossRef]
  26. Werther, J.; Saenger, M.; Hartge, E.-U.; Ogada, T.; Siagi, Z. Combustion of agricultural residues. Prog. Energy Combust. Sci. 2000, 26, 1–27. [Google Scholar] [CrossRef]
  27. Sadig, H.; Sulaiman, S.A.; Moni, M.N.Z.; Anbealagan, L.D. Characterization of date palm frond as a fuel for thermal conversion processes. UTP-UMP Symp. Energy Syst. 2017, 137, 01002. [Google Scholar] [CrossRef] [Green Version]
  28. Gogoi, D.; Bordoloi, N.; Goswami, R.; Narzari, R.; Kataki, R. Effect of torrefaction on yield and quality of pyrolytic products of arecanut husk: An agro-processing wastes. Bioresour. Technol. 2017, 242, 36–44. [Google Scholar] [CrossRef]
  29. Pattiya, A.; Titiloye, J.O.; Bridgwater, A.V. Fast Pyrolysis of Agricultural Residues from Cassava Plantation for Bio-oil Production. In Proceedings of the 2nd Joint International Conference on “Sustainable Energy and Environment (SEE 2006)”, Bangkok, Thailand, 21–23 November 2006; C-007(P). 2006. Available online: https://www.researchgate.net/profile/Tony-Bridgwater-2/publication/242696651_Fast_Pyrolysis_of_Agricultural_Residues_from_Cassava_Plantation_for_Bio-oil_Production/links/551a6a200cf2f51a6fea438e/Fast-Pyrolysis-of-Agricultural-Residues-from-Cassava-Plantation-for-Bio-oil-Production.pdf (accessed on 1 October 2022).
  30. Mazhkoo, S.; Dadfar, H.; Sina, M.; Hashemi, H.; Pourali, O. A comprehensive experimental and modeling investigation of walnut shell gasification process in a pilot-scale downdraft gasifier integrated with an internal combustion engine. Energy Convers. Manag. 2021, 231, 113836. [Google Scholar] [CrossRef]
  31. Li, C.Y.; Shen, Y.; Wu, J.Y.; Dai, Y.J.; Wang, C. Experimental and modeling investigation of an integrated biomass gasifier–engine–generator system for power generation and waste heat recovery. Energy Convers. Manag. 2019, 199, 112023. [Google Scholar] [CrossRef]
  32. Jayah, T.H.; Aye, L.; Fuller, R.J.; Stewart, D.F. Computer simulation of a downdraft wood gasifier for tea drying. Biomass Bioenergy 2003, 25, 459–469. [Google Scholar] [CrossRef]
  33. Biagini, E.; Barontini, F.; Tognotti, L. Development of a bi-equilibrium model for biomass gasification in a downdraft bed reactor. Bioresour. Technol. 2016, 201, 156–165. [Google Scholar] [CrossRef] [PubMed]
  34. Son, Y.; Yoon, S.J.; Kim, Y.K.; Lee, J. Gasification and power generation characteristics of woody biomass utilizing a downdraft gasifier. Biomass Bioenergy 2011, 35, 4215–4220. [Google Scholar] [CrossRef]
  35. Striūgas, N.; Zakarauskas, K.; Džiugys, A.; Navakas, R.; Paulauskas, R. An evaluation of performance of automatically operated multi-fuel downdraft gasifier for energy production. Appl. Therm. Eng. 2014, 73, 1151–1159. [Google Scholar] [CrossRef]
  36. Pedroso, D.T.; Aiello, R.C.; Conti, L.; Mascia, S. Biomass Gasification on a New Really Tar Free Downdraft Gasifier, University of Sassari, Department of Chemistry, Thermal Process of Biomass Research Group 2015. Available online: https://periodicos.unitau.br/ojs/index.php/exatas/article/view/345/497 (accessed on 1 October 2022).
Figure 1. Relation between carbon and oxygen content in biomasses at dry ash free condition.
Energies 15 07650 g001
Figure 2. Two-reactor model of biomass downdraft gasifier.
Energies 15 07650 g002
Figure 3. Three-reactor model of biomass downdraft gasifier.
Energies 15 07650 g003
Figure 4. A sample of parametric study of increasing CDR at two-reactor model using rice husk as fuel and CDR 5%.
Energies 15 07650 g004
Figure 5. A sample of parametric study of increasing CDR at three-reactor models using rice husk as fuel and CDR 5%.
Energies 15 07650 g005
Figure 6. Producer gas composition of each model depending on Ybiochar: (a) two-reactor model, (b) three-reactor model.
Energies 15 07650 g006
Figure 7. LHVPG and CGE depending on Ybiochar: (a) two-reactor model, (b) three-reactor model.
Energies 15 07650 g007
Figure 8. Scatter plot of results for LHVPG and CGE: correlation versus thermodynamic model: (a) two-reactor model, (b) three-reactor model.
Energies 15 07650 g008
Figure 9. Comparison between experimental results with regression model (a) LHVPG, (b) CGE.
Energies 15 07650 g009
Table 1. Ultimate and proximate analysis of biomass resources [24,25,26,27,28,29].
CompositionRice Husk [24]Paddy Straw [25]Coconut Shell [26]Coconut Frond [27]Torrefied Arecanut Husk [28]Cassava Stalk [28]Cassava Rhizome [29]AverageStandard Deviation
Ca52.9753.1751.2145.5157.6751.1351.5551.893.61
Oa38.7040.2343.1047.6035.6241.3340.4541.003.73
Ha7.285.285.606.025.876.826.696.220.72
Sa0.850.270.100.090.000.060.050.200.30
Na0.201.050.000.770.840.661.270.680.45
water10.44.34.44.23.5615.548.31
ash18.1520.493.16.75.196.014.05
LHV
(kJ/kg)b
13,91112,80215,02012,48918,34013,83015,794
a: Dry ash free condition. b: Calculated by Dulong equation.
Table 2. Comparison results of the reconstruction model and the original literature.
Model2 Reactors Model (Vera) [22]3 Reactors Model (Fortunato) [23]
Biomass NameOlive PitsDepleted Pomace
Biomass Composition(wt.%)
C44.9843.22
H5.305.39
O36.8629.49
S0.0181.68
N0.570.22
Water10.25
Ash2.0615
Total (wt.%)100100
LHV (kJ/kg)17,20016,836
Comparison resultsOriginalReconstructedOriginalReconstructed
Biomass flow rate (kg/s)0.029170.029170.150.15
Biomass energy (kW)501.72501.722525.42525.4
PG composition (mole fraction)
H20.1630.1580.17190.1713
H2O0.0420.0419 0.0419
N20.43820.43890.4870.4548
ArNR0.00520.00570.0053
CO2NR0.09360.1110.1053
CH40.0310.02960.03150.0325
CO0.2140.23280.19230.1883
H2SNR0.00010.00060.0006
LHV of PG (kJ/kg)5100516148604941
PG flow rate (kg/s)0.0690.070NR0.385
PG energy (kW)351.9362.02NR1901
Cold gas efficiency (%)71.272.167675.27
NR: not reported.
Table 3. Parametric study result for two-reactor models.
BiomassInput VariableBiochar ResultProducer Gas Result
CDR m ˙ A i r   ( kg / s ) Biochar Rate (kg/s)Ybiochar
(%)
PG Rate
(kg/s)
(mole %)LHVPG(kJ/kg)CGE
(%)
H2CH4CO
Rice husk5%2.1520.19334.462.76810.33.114.2342168
20%1.9850.22940.892.54210.23.412.8335061
40%1.7640.27649.292.4009.93.910.8323456
60%1.5460.32357.681.9379.24.58.4308543
80%1.3330.37166.251.6307.65.55.5288434
Paddy straw5%22310.21936.212.9007.81.915.9287965
20%2.0310.26143.152.6347.62.114.3273956
40%1.7650.31752.412.2777.22.411.7250545
60%1.5030.37461.841.9196.22.98.3218433
80%1.2450.43071.101.5573.73.74.0172021
Coconut shell5%2.5770.0479.313.3758.32.015.9297867
20%2.3480.09518.833.0718.22.314.3285158
40%2.0440.16031.712.6637.82.611.8263947
60%1.7450.22444.392.2536.93.28.7235335
80%1.4510.28857.071.8384.74.04.7194224
Coconut frond5%2.3250.07916.723.0327.62.312.6260963
20%21510.11624.562.7987.32.611.1247355
40%1.9210.16534.932.4836.52.98.8225545
60%1.6950.21545.512.1685.23.46.0197134
80%1.4730.26455.881.8492.84.12.7159524
Torrefied arecanut husk5%2.6920.07012.193.53410.12.219.8370771
20%2.4110.12822.303.16710.42.418.3364363
40%2.0410.20635.882.67710.62.915.8353052
60%1.6760.28449.472.18410.63.512.7336940
80%1.3160.36162.881.6859.64.68.6312729
Cassava stalk5%2.3050.07215.612.9799.43.112.6308766
20%2.1430.10622.992.7589.23.411.3299660
40%1.9280.15333.182.4628.73.89.4285151
60%1.7160.19943.162.1647.74.47.1267042
80%1.5080.24553.131.8635.95.24.5243233
Cassava rhizome5%2.4730.05511.173.22710.12.815.3337469
20%2.2650.09920.112.94910.13.013.9329462
40%1.9920.15731.902.5779.83.511.8315952
60%1.7210.21643.882.2029.24.19.2298342
80%1.4560.27455.671.8257.55.16.0273732
Table 4. Parametric study result for three-reactor models.
BiomassInput VariableBio Char ResultProducer Gas Result
CDR m ˙ A i r   ( kg / s ) Biochar Rate (kg/s)Ybiochar
(%)
PG Rate
(kg/s)
(mole %)LHVPG
(kJ/kg)
CGE
(%)
H2CH4CO
Rice husk5%1.8150.19334.52.49814.93.116.4430377
20%1.6820.22640.42.30815.03.415.0423670
40%1.5050.27048.22.05315.13.912.9413261
60%1.3310.31456.11.79514.84.410.5400352
80%1.1610.35863.91.53513.85.37.9383942
100%0.9960.40271.81.27011.66.54.9361933
Paddy straw5%1.8930.21836.02.61511.51.919.0369575
20%1.7320.25742.52.39311.62.117.3355766
40%1.5200.30951.12.09511.52.414.6333255
60%1.3100.36159.71.79411.02.911.4303843
80%1.1060.41368.31.4899.43.67.5263231
100%0.9090.46677.11.1775.14.72.9202919
Coconut shell5%2.2010.0469.13.06512.02.118.5375577
20%2.0190.09017.842.81212.12.316.9362968
40%1.7790.14929.532.47312.12.614.4342656
60%1.5420.20841.222.13011.63.111.4316145
80%1.3110.26752.911.78410.13.87.9280133
100%1.0870.32764.801.4316.54.93.6227922
Coconut frond5%1.9740.07816.512.74711.72.415.0337674
20%1.8420.11123.502.55811.52.613.6324967
40%1.6670.15432.602.30511.12.911.4304956
60%1.4960.19841.912.05110.33.39.0280146
80%1.3270.24251.231.7938.63.96.3248936
100%1.1630.28560.331.5315.64.73.2207825
Torrefied arecanut husk5%2.3050.06912.023.21013.62.222.7454780
20%2.0730.12521.772.89514.12.420.9447671
40%1.7670.19934.662.47314.82.818.2435759
60%1.4660.27347.552.04615.23.414.8419847
80%1.1710.34760.441.61415.04.410.7397235
100%0.8880.42273.511.17212.26.35.5360623
Cassava stalk5%1.9520.07115.402.69914.03.214.6390676
20%1.8280.10222.122.51914.03.413.3382270
40%1.6630.14331.012.27713.73.811.5369161
60%1.5000.18540.122.03313.24.39.4353452
80%1.3400.22649.011.78612.05.07.1333943
100%1.1840.26858.121.5379.85.94.6308534
Cassava rhizome5%2.1040.0418.332.93014.32.817.6419878
20%1.9390.09519.302.69814.53.016.1411670
40%1.7200.14930.272.38414.63.513.8398960
60%1.5050.20341.242.06814.34.011.3382650
80%1.2940.25852.421.74913.44.88.3361340
100%1.0890.31263.391.42310.96.15.0331830
Table 5. Coefficients of correlation equation for LHVPG and CGE.
Performance Parameters
LHVPGCGE
Model coefficientsa0−1.418 × 10²b0−1.882 × 10⁻¹
a12.491 × 10−3b1−9.809 × 10⁻¹
a2−7.358 × 101b27.979 × 10−1
a37.742 × 101b35.197 × 10−1
a41.030 × 102b41.866
a52.363 × 102b54.626 × 10−4
a61.533 × 10−1b6−4.206 × 10⁻³
a7−6.738 × 10⁻¹
Correlation96.54%98.73%
Maximum difference betweensimulationandequation model520 kJ/kg8.68%
Standard deviation of difference124 kJ/kg1.87%
Table 6. Comparison between experimental results and regression model. ( ) parameters of regression model.
Case 1234567891011121314151617181920
Reference [30][30][30][30][30][31][31][32][33][33][33][33][33][34][35][35][35][36][36][36]
Biomass feed Wallnut shellWallnut shellWallnut shellWallnut shellWallnut shellRedwood pelletWood
chips
Rubber wood chipCorn cobsCorn cobsCorn cobsWood pelletsVine pruningWood chipmixed wood chipPoultry litterSS/SPPeach branchOlive branchPine branch
Elementary Analysis
C46.90%46.90%46.90%46.90%46.90%47.11%46.50%50.60%47.60%47.60%47.60%48.91%50.84%46.50%48.77%43.98%41.08%48.06%46.43%48.18%
H5.96%5.96%5.96%5.96%5.96%5.47%6.30%6.50%6.10%6.10%6.10%5.80%5.82%5.80%5.85%5.16%5.51%5.83%5.63%5.71%
N0.06%0.06%0.06%0.06%0.06%000.20%0.52%0.52%0.52%0.18%0.88%0.20%0.05%4.63%3.77%0.55%0.55%0.15%
O46.62%46.62%46.62%46.62%46.62%45.00%44.21%42.00%45.78%45.78%45.78%45.11%42.46%43.50%44.52%31.98%26.90%44.03%44.91%43.89%
S0.46%0.46%0.46%0.46%0.46%000000000.10%0.01%0.75%0.94%000
Proximate Analysis
Ash(dry)3.65%3.65%3.65%3.65%3.65%1.40%0.80%0.70%2.12%2.12%2.12%2.10%2.62%3.90%0.80%13.5%21.8%1.53%2.48%2.07%
(W_f)Moisture6.56%6.56%6.56%6.56%6.56%9.30%10.1%14.7%10.1%10.1%10.1%9.50%12.5%21.7%10.6%7.60%4.40%9.80%10.6%9.00%
(LHV_0)[kcal/kg] 4319 4319 4319 4319 4319 4099 4141 4297 3658 3658 3658 3924 3712 3755 3789 3712 3943 4141 4141 4141
biomass feed [kg/hr]8.110.212.112.412.9121118.665.6 81.2 81.2 64.1 50.3 556330283.33.052.5
biochar yield[kg/hr]0.440.510.60.730.890.80.40.84.65.85.86.35.35.332.540.160.0850.128
(Y_biochar) 11.90%10.96%10.87%12.90%15.12%15.00%8.37%9.83%16.01%16.31%16.31%21.73%23.11%24.42%10.75%15.69%23.76%10.84%6.37%11.2%
(C_f) 42.22%42.22%42.22%42.22%42.22%42.13%41.47%42.86%41.89%41.89%41.89%43.33%43.32%34.99%43.25%35.15%30.71%42.69%40.48%42.94%
(A_f) 3.41%3.41%3.41%3.41%3.41%1.27%0.72%0.60%1.91%1.91%1.91%1.90%2.29%3.05%0.72%12.47%20.84%1.38%2.22%1.88%
(Tr)[K]11181128114511611169130013001200120012001200120012001250125011001200112311531103
CGE_exp 66.19%65.96%68.82%69.51%70.57%72.00%77.00%68.11%67.20%68.35%67.83%55.08%64.83%60.00%82.70%80.70%75.40%61.00%78.00%58.00%
CGE_model 64.6%66.0%66.8%65.6%63.8%67.4%72.8%70.0%63.2%62.9%62.9%58.4%59.4%59.9%69.8%70.8%69.6%64.2%70.2%63.7%
Error 2.4%0.0%2.9%5.6%9.6%6.4%5.5%2.8%5.9%8.0%7.3%6.1%8.5%0.1%15.6%12.2%7.7%5.3%10.0%9.7%
Syngas Vol %
H215.4215.3315.0614.8614.78141415.515.8317.5616.616.3517.061616.414.551413.21512.1
CO17.3117.2417.0216.9716.87181819.122.4622.6122.5521.2921.741922.617.4216.417.417.716
CO26.936.997.157.237.299911.412.3312.0211.7812.3913.021711.0513.519.212.413.511.4
CH4(+HCs)3.413.282.982.812.772.52.51.12.922.562.482.723.1125.051.431.180.81.20.2
N2(+O2)56.9357.1657.7958.1358.2956.556.552.946.4645.2546.5947.2545.074644.953.0959.2256.252.660.3
sum100100100100100100100100100100100100100100100100100100100100
Syngas yield[m3/hr] 51.9118148150105871301309087000
LHV_PG_exp[kcal/kg]1039 1025 989970 962 939 939 916 1123 1166 1128 1097 1153 952 1293 851 815 778 858 680
LHV_PG_model[kcal/kg]816834863885 893 1032 1044976 798 797 797 845 833 955 897 811 987783 847 756
Error025.8%23.1%17.2%14.8%13.9%7.5%11.1%6.6%28.9%31.6%29.3%22.9%27.8%0.3%30.6%4.7%21.1%0.6%1.3%11.2%
Publisher’s Note: MDPI stays neutral with regard to jurisdictional claims in published maps and institutional affiliations.

