Article

Verification and Validation of Model-Scale Turbine Performance and Control Strategies for the IEA Wind 15 MW Reference Wind Turbine

1
National Wind Technology Center, National Renewable Energy Laboratory, Golden, CO 80401, USA
2
Mechanical & Aerospace Engineering Department, University of Central Florida, Orlando, FL 32816, USA
3
Energy Systems, DNV Services UK Limited, Bristol BS2 0PS, UK
4
Advanced Structures and Composites Center, University of Maine, Orono, ME 04469, USA
*
Author to whom correspondence should be addressed.
Energies 2022, 15(20), 7649; https://doi.org/10.3390/en15207649
Submission received: 24 August 2022 / Revised: 8 October 2022 / Accepted: 9 October 2022 / Published: 17 October 2022

Abstract

:
To enable the fast growth of the floating offshore wind industry, simulation models must be validated with experimental data. Floating wind model-scale experiments in wind–wave facilities have been performed over the last two decades with varying levels of fidelity and limitations. However, the turbine controls in these experiments have considered only limited control strategies and implementations. To allow for control co-design, this research focuses on implementing and experimentally validating more advanced turbine control actions and strategies in a wind–wave basin for a 1:70-scale model of the International Energy Agency’s wind 15 MW reference wind turbine. The control strategies analyzed include torque control, collective pitch control, and transition region control (setpoint smoothing). Our experimental and numerical results include the effects of varying rotor speeds, blade pitches, and wind environments on the turbine thrust and torque. Numerical models from three different software tools are presented and compared to the experimental results. Their ability to effectively represent the aero-dynamic response of the wind turbine to the control actions is successfully validated. Finally, turbine controller tuning parameters based on the derivatives of thrust and torque are derived to allow for improved offshore wind turbine dynamics and to validate the ability of modeling tools to model the dynamics of floating offshore wind turbines with control co-design.

1. Introduction

Offshore wind energy is an increasingly global industry, with over 50 GW currently installed (https://www.energy.gov/eere/wind/articles/offshore-wind-market-report-2022-edition, accessed on 9 September 2022). Nearly all the installed turbines are fixed-bottom, and have benefited from existing technology learning curves, established supply chains, and cost reductions. Few commercial floating offshore wind turbines (FOWTs) exist primarily because of their relatively nascent status and their increased cost compared to fixed-bottom offshore systems. However, there are significant opportunities to optimize FOWT systems and reduce costs to increase deployment. In particular, control co-design—integrating controls directly into the design process of the FOWT system—is a key enabling technology for reducing the levelized cost of energy for FOWTs. Wind turbine controls can reduce the loading and dynamic motions of the systems, and they can provide mechanisms to facilitate system light-weighting and cost reductions. To enable these benefits, the ARPA-E Aero-Dynamic Turbines, Lighter and Afloat, with Nautical Technologies and Integrated Servo-Control (ATLANTIS) program has funded multiple partners and collaborators (introduced in Section 3) to explore higher-fidelity control co-design. The Floating Offshore-wind and Controls Advanced Laboratory (FOCAL) experimental program targets the experimental validation of control co-design tools and concepts developed within the ARPA-E ATLANTIS program. The four FOCAL experimental campaigns validate turbine controls, hull design and controls, hull member flexibility, and fully coupled wind–wave system dynamics, respectively.
Control co-design can be enabled through an improved understanding of the system dynamics via numerical simulations and scaled experiments. Several offshore wind model-scale experimental validation data sets have been published in the last few decades. The DeepCwind consortium published several experimental validation data sets between 2010 and 2014 for a 1:50-scale model of a 5 MW reference wind turbine (RWT) on three different floating platforms (tension-leg platform, spar-buoy, and semi-submersible) for a wide variety of met-ocean and wave conditions [1]. For the DeepCwind tests, the turbine blades were rigid, the tower was flexible, and both the pitch and rotor speed were fixed to a constant value (due to limited active turbine control [2]). One major difference from the current experimental campaign is that DeepCwind is a coupled wind–wave floating test without turbine controls, and the present study is a wind-only test with active turbine controls (as a first step to including turbine controls in coupled wind–wave tests in upcoming FOCAL campaigns). Robertson et al. proposed multiple suggestions for future test campaigns, such as using a blade designed for a low Reynolds number (Re), mitigating all impacts of instrumentation cabling, applying appropriate wind loading, and independently validating the turbine behavior [1]. These issues were addressed in the current FOCAL experimental test campaign.
In 2014, Bottasso, Campagnolo, and Petrovic expanded the scaled wind tunnel testing beyond aero-dynamics into areas such as (i) the aero-servo-elasticity of wind turbines in extreme operating conditions and environments and (ii) the effects of upstream turbines on downstream turbines on a wind farm [3]. Their experimental campaign studied a 3 MW turbine based on the Vestas V90 at 1:45 scale. They employed individual blade pitch control and torque control to enable the testing of modern control strategies. To account for Re scaling effects (two orders of magnitude difference), they used special low Re airfoils (AH79-100C and WM006). They were able to match thrust, although at reduced power [3]. Please note that they used individual pitch control, whereas collective pitch control is used in the present study. In addition, they employed an onshore turbine, whereas the current study uses a significantly larger offshore turbine as the design reference on a fixed base. Finally, their study included aero-elastic effects, whereas the present work does not.
In 2017, Bayati et al. performed an experimental validation of a 1:75-scale model of the Danish Technical University (DTU) 10 MW RWT [4]. They focused on the aero-dynamic characteristics and behavior of the system, and they performed their experiments in a wind tunnel. They also experienced a Re discrepancy of more than two orders of magnitude, and, therefore, used a dedicated low Re airfoil (SD7032) to achieve the target thrust level (power was not matched). Their turbine had individual pitch control, and they had relatively high velocity scale factors (~2–3). They did not use Froude scaling [4]. Bayati et al. and the present study both emphasize the turbine aero-dynamic performance with some level of controls, but the present study is performed in a wind–wave basin (different boundary conditions) with a significantly larger Froude-scaled turbine.
Yu et al. (2017) experimentally tested a real-time collective blade pitch control system in a wind–wave basin using an active controller on a 1:60-scale model of the DTU 10 MW RWT [5]. The triple spar floating platform was a concrete hybrid between a spar and a semi-submersible developed by INNWIND. The authors used low Re airfoils to account for the effects of Re scaling, which were designed to match only the thrust (not the power). They investigated the influence of different gain scheduling methodologies of the pitch controller on the system dynamic behavior. They showed that with the low Re rotor, it was possible to control the rotor speed by actuating the blade pitch, which had been demonstrated previously in [2], using a gain-scheduled proportional–integral blade pitch controller in a wind–wave basin. They used two different controller methodologies: (i) a retuned version of the National Renewable Energy Laboratory (NREL) 5 MW baseline controller (a gain-scheduled proportional–integral controller) and (ii) a controller based on a coupled gain-scheduling and design method, which accounted for the rigid-body motion of the whole floating system [5]. The present work uses higher-fidelity numerical tools and validates an additional controller feature (setpoint smoothing in the transition region) on a larger turbine.
A review of available floating wind turbine controllers is presented in Namik and Stol’s work, 2013 [6]. They largely focused on numerical and simulation work, including the offshore code comparison collaboration projects. They reviewed individual and collective blade pitch control schemes, single-input–single-output (SISO), and multi-input–multi-output (MIMO) controllers, and multiple control algorithms.
In 2016, Fleming, Peiffer, and Schlipf performed some control design work to optimize a wind turbine (NREL 5 MW RWT) controller atop the WindFloat semi-submersible platform [7]. They employed a controller designed for fixed-bottom offshore wind turbines, and they upscaled the NREL 5 MW RWT to 8 MW. Their numerical results included an efficient platform heel resonance mitigation scheme and controller upgrades, as well as a reduction in fatigue loads and blade pitch travel.
The recent body of work (2018–2021) by Frank Lemmer and team [8,9,10,11] examined controller characteristics and behaviors using simplified, reduced-order numerical models. Their extensive controller design work (they performed controller tuning in an optimization framework) is important context for controls co-design and the controller features discussed herein. They examined controller design with a pitch stabilization loop, control methodologies for SISO and MIMO controllers, and aero-elastic effects on controller behavior and performance on 10 MW floating offshore reference turbines. All this work included appropriate gain scheduling and controller tuning for the chosen applications, and it was entirely numerical in nature. The authors compared the lower-order simpler codes to the higher-order NREL OpenFAST tool suite. This team published an extensive body of works on controller design for FOWTs; an exhaustive list is not presented here.
In 2020, Lenfest et al. discussed more accurate controller tuning strategies and gain scheduling methods for collective blade pitch controllers for FOWTs using OpenFAST [12]. They found that the proposed tuning method exhibited power regulation performance comparable to a standard turbine proportional–integral controller with a minimal increase in blade pitching activity. These results could aid in calibrating NREL’s reference open source controller (ROSCO).
Han and Nagamune [13] numerically studied employing standard turbine controls (generator torque, blade pitch, and yaw controls) to control the position (in surge and sway) of a FOWT using OpenFAST. Their goal was to minimize the wake effect in order to maximize the power production of a floating offshore wind farm. Though this was a different problem than the one examined here, their results included directly providing the controller tuning and gain scheduling parameters for a proportional–integral–derivative controller. These controller parameters and algorithms can support a better understanding of our results.
In 2022, Stockhouse et al. [14] numerically explored control strategies and actuators for the 10 MW ultra-flexible smart floating offshore wind turbine (USFLOWT) on the SpiderFLOAT platform using OpenFAST. They improved their baseline controller through detuning and parallel compensation with blade pitch and generator torque. They also analyzed the effects of two actuators for active platform control on system performance. They demonstrated that control co-design offers promise for yielding a more optimal solution [14].
The ROSCO [15] is an upgraded open-source sequel to the NREL controller referenced in [6]. It has significantly upgraded features and capabilities developed by the NREL team over the last decade, including (but not limited to) a reference controller with industry-baseline functionality and a complementary toolbox for generic tuning and verification.
The current study expands on this previous work by employing a significantly larger floating offshore wind turbine (the IEA wind 15 MW RWT) than all previous studies. In addition, these experiments represent, for the first time, the ROSCO [15] being validated experimentally in a wave basin and providing valuable quantitative data for controller tuning and gain scheduling. Finally, this research introduces and validates a new controller feature—setpoint smoothing in the transition region—than used in previously published work. All these new results aim to enable control co-design, which is an important pathway for reducing the levelized cost of energy of FOWTs.

2. Experimental Campaign

The FOCAL experimental test campaign was performed in the Harold Alfond Wind–Wave Ocean Engineering Laboratory (W2) in the Advanced Structures and Composites Center at the University of Maine. This unique facility is equipped with a high-performance rotatable wind machine over a multi-directional wave basin, and it can accurately simulate towing tests, variable water depths, and scaled wind and wave conditions. The facility can produce wind speeds of 0–12 m/s (model scale) with less than 5% freestream turbulence, less than 10% non-uniformity, and directionality changes of up to 180°. The test area is 7 m wide by 3.5 m high. The global coordinate system is as follows: +X is upwind to downwind, +Z is up, and +Y follows the right-hand rule.

2.1. Experimental Setup

To perform the experimental campaigns, FOCAL used a performance-matched, 1:70-scale model wind turbine based on the newly developed IEA wind 15 MW RWT [16]. A description of the model turbine design, blade and mass properties, and performance characteristics is provided by Kimball et al. [17]. The scaled model can simulate collective blade pitch control strategies in the high-quality wind fields generated in the W2, and the model was fully instrumented to record a variety of parameters in real time, including structural loads and dynamics. The turbine was mounted (clamped) to a rigid/fixed platform in the wave basin. Both the blades and the tower were fixed (caused to be rigid) for this test campaign. The data acquisition rate was 2 ms.
The scaled model turbine was equipped with the instrumentation listed in Table 1, which was used to generate data for comparison with the numerical results. The wind environment was also calibrated using several different sensors, some focusing on the mean wind characteristics and others specializing in accurate turbulence measurements and characterization. In particular, the physical location of both the torque cell and the six degree-of-freedom (DOF) load cell had important implications on the results: the rotor thrust measurements were pure aero-dynamic loads (the measurement was zeroed to remove the initial weight contribution), whereas the rotor torque measurements included the mass/inertia terms (due to the location of the torque cell in the drivetrain) (see Figure 1).
It is important to note that the experimental setup experienced a strong 1P rotor imbalance. Significant effort was contributed (via mass balancing) to reduce this effect to the greatest extent possible, but it was impossible to completely eliminate it. To remove this effect from the results, all experimental and numerical results were low-pass filtered at a cut-off frequency of 0.08 Hz at full scale. The 0.08 Hz was specifically chosen to be lower than the 1P frequency in order to filter out the 1P and any higher frequencies. A zero-lag 10th-order Butterworth filter was used.

2.2. Scaling Methods

As is commonly the case with offshore and marine systems, the Froude scaling approach was the dominant scaling methodology employed [17], considering the coupled wind–wave test plans for the FOCAL campaign four. However, three noteworthy modifications to this scaling approach were conducted.
First, Robertson et al. [1] discussed the limitations of the Froude scaling approach, and recommended modifications to account for Reynolds number (Re) scaling, which dominates the aero-dynamic loading. To address this, a low Re airfoil (SD7032) was used (instead of the airfoil families used in the IEA wind 15 MW RWT) in the model-scale turbine to improve turbine performance at a low Re. In addition, the blade chord distribution was increased to permit the use of lower section lift coefficients. The resulting blade design was designed to performance match the full-scale turbine and was not a perfect geometric match to the full-scale rotor.
Second, the wave basin contained freshwater, but the floating IEA wind 15 MW RWT was designed on a semi-submersible platform in saltwater [16]. Thus, the reference turbine properties had to be modified from saltwater to freshwater, which resulted in a 2.5% decrease in the maximum thrust in order to maintain the balance between wind and wave forces (hydrodynamic loads were not investigated here but planned to be in subsequent FOCAL test campaigns).
Third, to ensure the proper aero-dynamic loading on the turbine, the model-scale turbine was performance-matched to the modified IEA 15 MW RWT. Using a combination of increased wind speed and blade pitch adjustments, the rotor thrust was matched to achieve rated thrust and improve torque to be closer to matching. To match the target maximum thrust, the wind speed was unilaterally increased by 20% in the wave basin. A complete description of the scaling methodology is presented in [17].

2.3. Controller Methodologies

Most large commercial onshore and offshore wind turbines employ two methods of actuation for turbine control. A variable speed generator torque controller was used to optimize power capture in the operation of below-rated wind speed (region two), with the blade pitch held constant. In above-rated wind speed conditions (region three), the blade collective pitch (the pitch of all blades was identical) was used to control the turbine rotor speed to a required setpoint (rated rotor-speed), while the generator torque was held constant (at rated torque). The blade pitch controller is usually based on proportional–integral control (PI control) methods, and various methods have been used to tune the PI controller gains. To transition between below-rated torque control and above-rated pitch control, special methods were used to combine the pitch and torque in order to transition smoothly between these operating conditions (setpoint smoothing). Both the blade pitch and generator torque were used to transition between these two operating regions. Additionally, for floating wind turbines, an additional feedback loop, based on measured tower top sensor data (accelerations), actuated the blade collective pitch to stabilize platform motions. These features and further control options were included in the ROSCO [15].
Both the experimental-scale model in the wave basin and the full-scale simulations were used in the ROSCO to control the functions of the wind turbine system (e.g., pitch control in rated and above-rated regimes) [15]. Information on the ROSCO formulation, compilation, and installation, as well as the ROSCO toolbox, is available via GitHub (ROSCO: https://github.com/NREL/ROSCO; ROSCO toolbox: https://github.com/NREL/ROSCO_toolbox, accessed on 4 March 2022). The ROSCO requires two input files to operate: the primary input file with the desired settings and parameters and the turbine performance map (power and thrust coefficient, Cp and Ct, surfaces). The specific control methodologies and objectives for this test campaign are summarized in Table 2 below.
The same ROSCO that was operated in real time in full-scale mode in the wave basin was used with the numerical models. The model-scale inputs from the sensors and instrumentation were scaled up to full-scale values immediately prior to going into the ROSCO with the basin control system and, subsequently, scaled back down to model-scale upon leaving the ROSCO to instruct the hardware with the basin control system. In the real-time environment, the ROSCO received model-scale values for the current time, rotor speed, torque, and blade pitch from the sensors in order to determine the blade pitch and torque setpoints. Figure 2 shows a diagram of how the ROSCO functioned and generated its outputs (outputs were sent to numerical tools or the physical hardware). In Figure 2 below, ωg is the generator speed, τg is the generator torque, β is the blade pitch angle, Vest is the estimated wind speed, and Δω is the controller setpoint shifting term.

3. Numerical Methods

The experimental data were used to validate three different numerical tools further developed under separate ARPA-E ATLANTIS program topic areas:
  • Bladed advanced control modeling for offshore wind (BACMOW) developed by the DNV team;
  • The control-oriented, reconfigurable, and acausal floating turbine simulator (CRAFTS) developed by the University of Central Florida (UCF) team;
  • OpenFAST/wind energy with integrated servo-control (WEIS) developed by the NREL team.
Each tool suite employed its own modeling approach with various assumptions and levels of fidelity. All tools used three-dimensional numerical methods. An overview of the salient differences in modeling approaches is presented in Table 3, and detailed descriptions of each modeling tool are provided in Section 3.1, Section 3.2 and Section 3.3.

3.1. BACMOW/Bladed

The Bladed/BACMOW is a multi-body dynamics-based aero-hydro-servo-elastic software developed by DNV. The rotor aero-dynamics were modeled using the blade element momentum (BEM) theory with several engineering model adaptations, such as a different dynamic stall and dynamic wake models, Glauert skew wake correction, stall hysteresis formulations, etc. The results reported herein were generated with the incompressible version of the Beddoes–Leishman dynamic stall model in state space formulations. The required normal force gradients for the dynamic stall calculations were automatically searched for and computed using the linear fit gradient method [18], which was implemented in the latest Bladed release (Bladed 4.13). The method allowed for a more robust and accurate attached flow state reconstruction for various polar characteristics. The structural dynamics followed a multi-body dynamics approach, where flexible bodies were modeled using linear finite elements, with options for modal reductions. Blades could be composed of more than one flexible body, which allowed for the representation of non-linear dynamics. The wind turbine controller could be completely user-defined and with any degree of complexity by using an external DLL (such as the ROSCO DLL). Details can be found in the Bladed theory manual [18].

3.2. CRAFTS

CRAFTS is a causality-free modeling and simulation platform allowing for the rapid simulation of floating offshore wind turbines. It was developed by the University of Central Florida. Fundamental and relevant physical phenomena of wind turbines were modeled with the causality-free modeling approach that uses bi-directional ports for component connectivity. The ports model power transfers between components [19,20]. For each component, its governing differential–algebraic equations were modeled. Then, the computational platform automatically determined the causality at each time step in the assembled system.
CRAFTS was constructed in a library-based, modular, hierarchical model architecture that supports reconfigurability and allows for the integration of non-linear-dynamics multi-physics models to simulate multiple design variants of wind turbines and controller concepts. It facilitated control co-design ideas such as exploring hydraulic actuation for robust stability, active tether actuation for robust stability, and enhanced individual pitch control for improved performance. The aero-dynamic model used the blade element momentum theory with static polars of airfoil data. The control model simulated the controller algorithms, sensors, and actuators of the blade pitch and generator torque of the wind turbine system. The structural dynamics were modeled using a 3D multi-body dynamics approach and modal analysis theory. Coupling between all models was achieved through plug-and-play CRAFTS features, enabling co-simulation with other numerical platforms, such as the ROSCO toolbox in MATLAB or OpenFAST via a functional mock-up interface (FMI). Vice versa, an FMI kit for Simulink enabled an existing Simulink model to be compiled into an FMU, and then imported into the CRAFTS platform.

3.3. WEIS/OpenFAST

OpenFAST is a multi-physics engineering tool for simulating the coupled dynamic response of wind turbines developed by NREL [21]. OpenFAST joins aero-dynamics models, hydrodynamics models, control and electrical system (servo) dynamics models, and structural (elastic) dynamics models to allow for a coupled non-linear aero-servo-elastic simulation in the time domain. OpenFAST is constructed of several discipline-specific modules coupled with glue code in state space [21]. The aero-dynamic models used wind-inflow data and solve for the rotor wake effects and blade element aero-dynamic loads, including the dynamic stall and aero-acoustics. The control and electrical system models simulated the controller logic, sensors, and actuators of the blade pitch, generator torque, nacelle yaw, and other control devices, as well as the generator and power converter components of the electrical drive. The structural dynamics models applied the control and electrical system reactions, applied the aero-dynamic and hydro-dynamic loads, added gravitational loads, and simulated the elasticity of the rotor, drivetrain, and support structure. Coupling between all models was achieved through a modular interface and coupler. OpenFAST v3.0.0, specifically, a development branch using a newer un-steady aero-dynamics model, was used for this campaign. The chosen un-steady aero-dynamics model (UAMod = 5) is a five-state incompressible Beddoes–Leishman dynamic stall model that is similar to the approach used by Bladed/BACMOW. A structural degree of freedom (GenDOF) was enabled for load case 3.X. The ROSCO DLL (with filtering based on the blade frequencies turned off) was used with ServoDyn.

4. Load Case Definitions

For the verification and validation of the turbine dynamics, three categories of load cases (LC) were chosen to run both experimentally and numerically, including how the turbine responded to (1) varying rotor speeds (LC 1.X), (2) varying collective blade pitched (LC 2.X), and (3) varying wind environments (LC 3.X). In LC 1.X and LC 2.X, variations in turbine operational parameters were prescribed to ensure a consistent aero-dynamic response, to validate the turbine aero-dynamic performance, and to verify aero-dynamic sensitivities that were used in tuning a closed-loop controller (such as the ROSCO). LC 1.X and 2.X did not have active closed-loop pitch control. In LC 3.X, the ability to integrate active closed-loop control was verified and the aero-dynamic response to the controller actions was validated. Table 4 below summarizes the inputs and conditions for both experiments and simulations. There were 4 load cases within LC 1.X, 5 within LC 2.X, and 6 within LC 3.X, for a total of 15 load cases.
LC 1.X focused on two wind speeds (one around the maximum thrust setpoint and the other above the rated condition), and the pitch was fixed at two different values, each with varying rotor speeds. The Cp-Ct surface required for controller operation was generated from this data set, as were the controller gains and other parameters. LC 2.X studied the system response to varying pitches with fixed wind speeds and rotor speeds. Three stepped pitch cases and two ramped pitch cases in different pitch regimes were used to examine the system behavior about the setpoints. Controller sensitivities to pitch were derived from these results, which could be directly incorporated into the controller design, gain scheduling, and tuning. LC 3.X investigated the controller behavior (active pitch and torque control) during various wind environments. Five wind environments were analyzed: steady wind, stepped wind, wind gust, sinusoidal wind, and spectral wind. Controller sensitivities and parameters were calculated, and the damped system response was measured and characterized. Each of these load cases was described in detail in Section 5 below. Numerical outputs were chosen to match the available experimental outputs. All participants provided results for each load case in the following format (see Table 5).
It should be noted that for LC 3.1–3.5, the setpoint smoother in the ROSCO was switched on (SS_mode = 1) and the peak shaver/pitch saturation was off (PS_mode = 0). For LC 3.6, both the setpoint smoother and peak shaver were turned off (SS_mode = 0 and PS_mode = 0). This controller setting was the only difference between LC 3.5 and LC 3.6. In addition, output channels 13 and 14 were not measured experimentally. All results were compared as full-scale equivalent values.

5. Results and Discussion

In this section, experimental and numerical results were presented in the context of control co-design; that is, how they could be employed in controller tuning and settings to enable controls to be embedded in the overall system design. All results were presented in full-scale values and were low-pass filtered at 0.08 Hz (just below the 1P frequency). The 0.08 Hz value was specifically chosen to be lower than the 1P frequency in order to filter out the 1P and any higher frequencies. Because the airfoil polars were generated from experimental data near the rated condition [9] (and, thus, were the most accurate) and most of the LC 3.X results were near the rated condition, it was collectively decided to focus on the transition region (wind speed = 12.83 m/s) results.

5.1. Load Case 1.X: Varying Rotor Speed

For these load cases, steady-state results at eight prescribed/fixed rotor speed values (3–10 rpm) were shown. The turbine static offsets were removed from the tower top forces and moments. For these load cases, the controller was not active, and the rotor speed and pitch were fixed.
Figure 3 presents the rotor thrust and torque as functions of rotor speed for a fixed blade pitch angle and wind speed. As expected, the torque peaked roughly around the rated rotor speed (7.56 rpm) and the thrust roughly matched the peak thrust of the IEA wind 15 MW RWT (~2.75–2.8 MN) at the rated rotor speed. Figure 3 also shows that all numerical results compared quite well and had similar trends to the experimental data. Note that some experimental data were missing at the higher rotor speeds due to loading and limitations in the wave basin. The numerical results were within 2–30% of the experimental results for the thrust, and the torque numerical results had errors of up to 50%, with respect to the experimental results. The largest errors were observed at the lowest rpm value (three), which was the result of small values of approximately zero being scaled to full-scale.
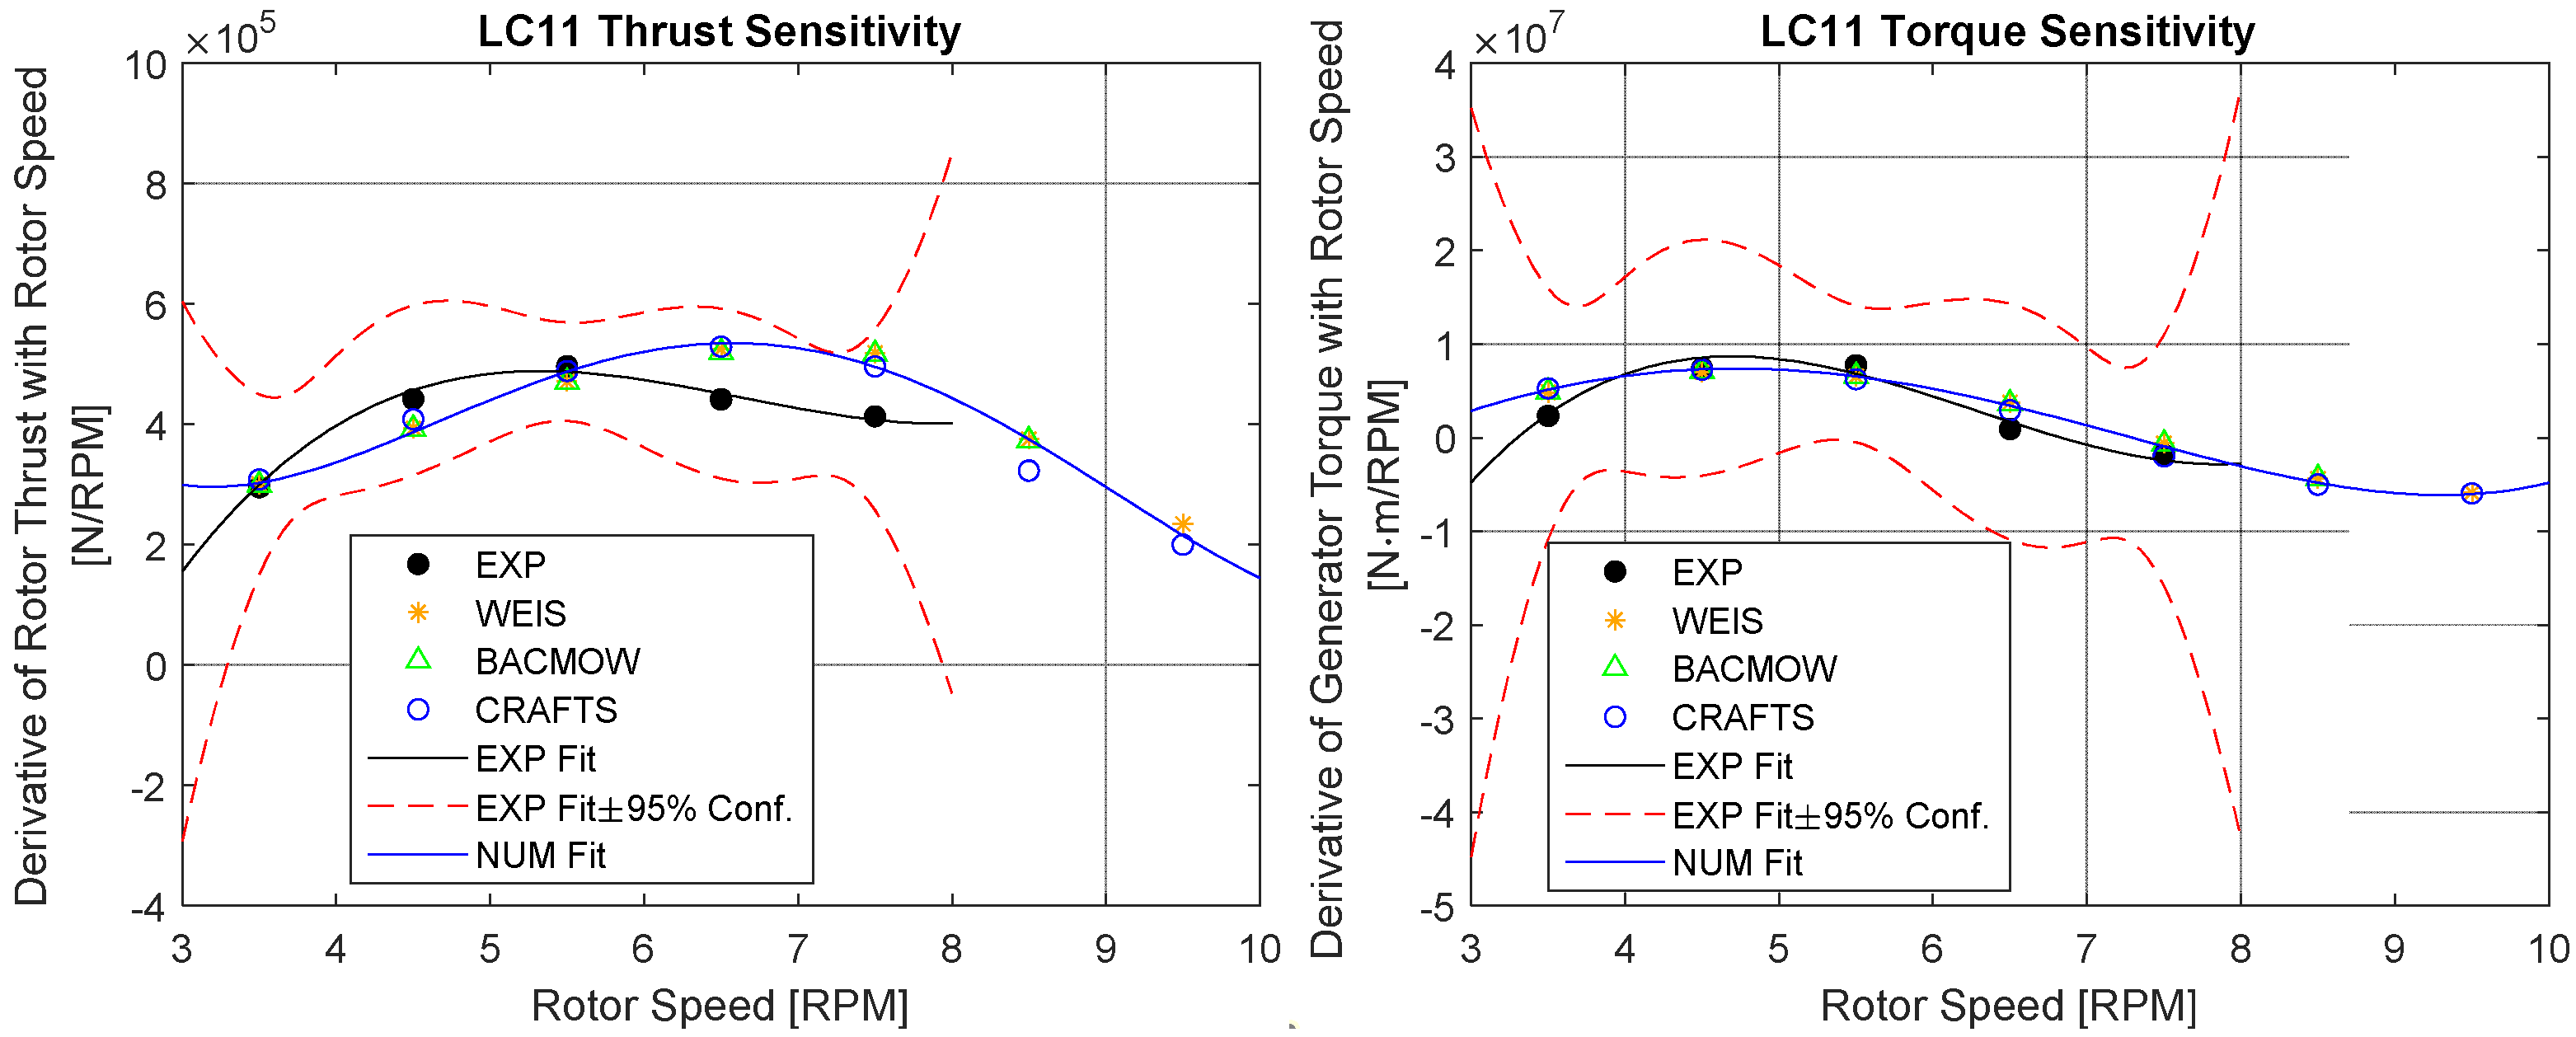
For controller tuning, the derivatives (or sensitivities) of the rotor thrust and torque with respect to rotor speed were required. For example, the sensitivity of the torque with respect to the rotor speed (∂Q/∂Ω) was used in the calculation of the proportional controller gain in the ROSCO via Equation (1) [15]:
K P = 1 B | v ( 2 ζ D E S ω D E S + Q Ω | v )
where KP is the controller proportional gain and B|v is the sensitivity of the torque with respect to the blade pitch angle (∂Q/∂θ) at a particular wind speed. The calculation of this gain was based on the assumption that the closed-loop system was a second-order system and that the desired values of the closed-loop natural frequency ωDES and damping ζDES were specified, as described in [15].
Figure 4 shows these sensitivities to rotor speed for torque and thrust. Polynomial fits of the data points from Figure 3 were analytically differentiated to estimate the derivative shown as continuous curves. Numerical derivatives based on the central differencing of the data points in Figure 3 were included for reference (data points). Because of there being fewer available data points, the experimental thrust and torque data were fitted with a fourth-order polynomial, whereas the numerical results were fitted with a fifth-order polynomial to better describe the trend. The blue line represents the polynomial fit with all modeling results. The black line is the polynomial fit with the experimental results. The red dashed lines show the 95% confidence interval of the true experimental thrust–speed and torque–speed sensitivity relations. Please note that this uncertainty estimate considered only the random error in the experimental data points in Figure 3 and not the systematic bias, if any. A single polynomial fit was performed with all numerical results to avoid selection bias and favoritism. The polynomial coefficients for these experimental and numerical sensitivities are available on request, to be used as indicated in Equation (1) for the controller gains.
Results for the tower top forces and moments for LC 1.1 are presented in Figure 5 below. The numerical results correlated with the experiment quite well, with similar trends and magnitudes. Experimental flap-wise and edge-wise blade root bending moments were not available, but verification between numerical codes could be performed. The numerical blade root bending moments matched each other well, and the tower top FY and MZ loads were near zero, as expected. The small values in the experiment were due to miniscule force and moment sensor readings scaled to full-scale values.
The results for LC 1.2, which was similar to LC 1.1, but with a pitch of 10°, were discussed here, but no summary plots were shown. The overall trends and magnitudes between the numerical and experimental results for the thrust, torque, and tower top forces and moments matched well. Similarly, the numerical results for the flap-wise and edge-wise blade root bending moments were quite close; most of the differences ranged between ~0–20% and ~0–40%, respectively. The primary difference in the post-processing of the LC 1.2 results was that a second-order polynomial was used to fit the limited experimental data (note that experimental results were limited to rpm = 3–6) and, subsequently, differentiated to yield the derivatives of thrust and torque with respect to the rotor speed. The numerical polynomial coefficients for the two sensitivities were computed in the same manner as described above. To enable and improve control co-design, the coefficients can be provided on request.

5.2. Load Case 2.X: Varying Pitch

In LC 2.X, the rotor speed was fixed at the rated speed (7.56 rpm) and the pitch was varied with both stepped and ramped profiles. Continuing to focus on those load cases around the transition region, Figure 6 illustrates the prescribed pitch schedules for LC 2.2 and LC 2.4. The ramped cases were executed in the wave basin as tiny steps that approximated a ramp. Though setting pitch setpoints in the wave tank was fairly straightforward, the numerical tools could have difficulties with the discontinuities (step changes), such as the step change in the pitch at t = 0. As a result, pre-simulation time was added to the simulations during run-time and, subsequently, removed during post-processing to remove initial transients or artifacts from the numerical results. Carrying this out allowed the simulations to behave well during the initial pitch step. In addition, the WEIS team smoothed the pitch steps throughout the time history to enable OpenFAST to better handle the discontinuities (using the OpenFAST SimuLink interface).
One point of interest was the possible difference between the prescribed (input) pitch (as described by the pitch setpoints) and the measured (output) pitch from the system (as the output from the pitch encoder). The WEIS team conducted a numerical study to investigate the effects of measured versus prescribed pitches on the simulations. It was determined that using one or the other had a minuscule effect on the results (i.e., it had practically no difference), so only one set of results (measured) is presented in Figure 7 and Figure 8 below for clarity.
Figure 7 shows the time histories of the thrust and torque as functions of pitch for LC 2.2 and 2.4. The overall trends matched the experimental data well, and the magnitudes were the correct orders of magnitude. There was consistent under-prediction in thrust across all numerical tools, perhaps due to inaccuracies in the blade drag, uncertainties in the angle of attack, and/or Re effects. CRAFTS predicted a lower lift than BACMOW and OpenFAST.
These histories could be broken into constant values between each pitch step and the derivative taken as the change in response to each step. The WEIS team performed an analysis of the differences between stepping up and down to each pitch setpoint for each data set. The results were remarkably consistent, and the system did not exhibit a noticeable hysteresis effect. Thus, the increasing and decreasing pitch values were grouped as one and shown below in Figure 8 for the thrust and torque, and they were used in the calculations for derivatives related to the pitch.
As was performed for LC 1.X, an analysis of the derivatives (sensitivities) of the thrust and torque with respect to pitch was performed. The integral controller gain (KI) is a function of these sensitivities, as shown in Equation (2) [15]:
K I = ω D E S 2 B | v
where B|v = ∂Q/∂θ is the derivative of torque with respect to pitch at a constant wind speed and ωDES is the desired natural frequency of the rotor rotational DOF in a closed-loop, assuming the closed-loop was modeled as a second-order system [15].
This derivative also appeared in Equation (1). To obtain these sensitivities, third-degree polynomials were fitted to all data points (both increasing and decreasing pitch values) for each data set (solid lines in Figure 8). Derivatives based directly on the data were too noisy to be meaningful as shown in Figure 8; therefore, instead, derivatives were based on differentiating the polynomial curve fits, resulting in second-order polynomials. The polynomial coefficients for the experimental and numerical derivatives of thrust and torque with respect to pitch are available on request. The red dashed lines show the uncertainty of the true relation—not of individual data points—for only the experimental data. This uncertainty estimate was based on the standard error of the estimate and only considered the random error, not the systematic bias in the experiment.

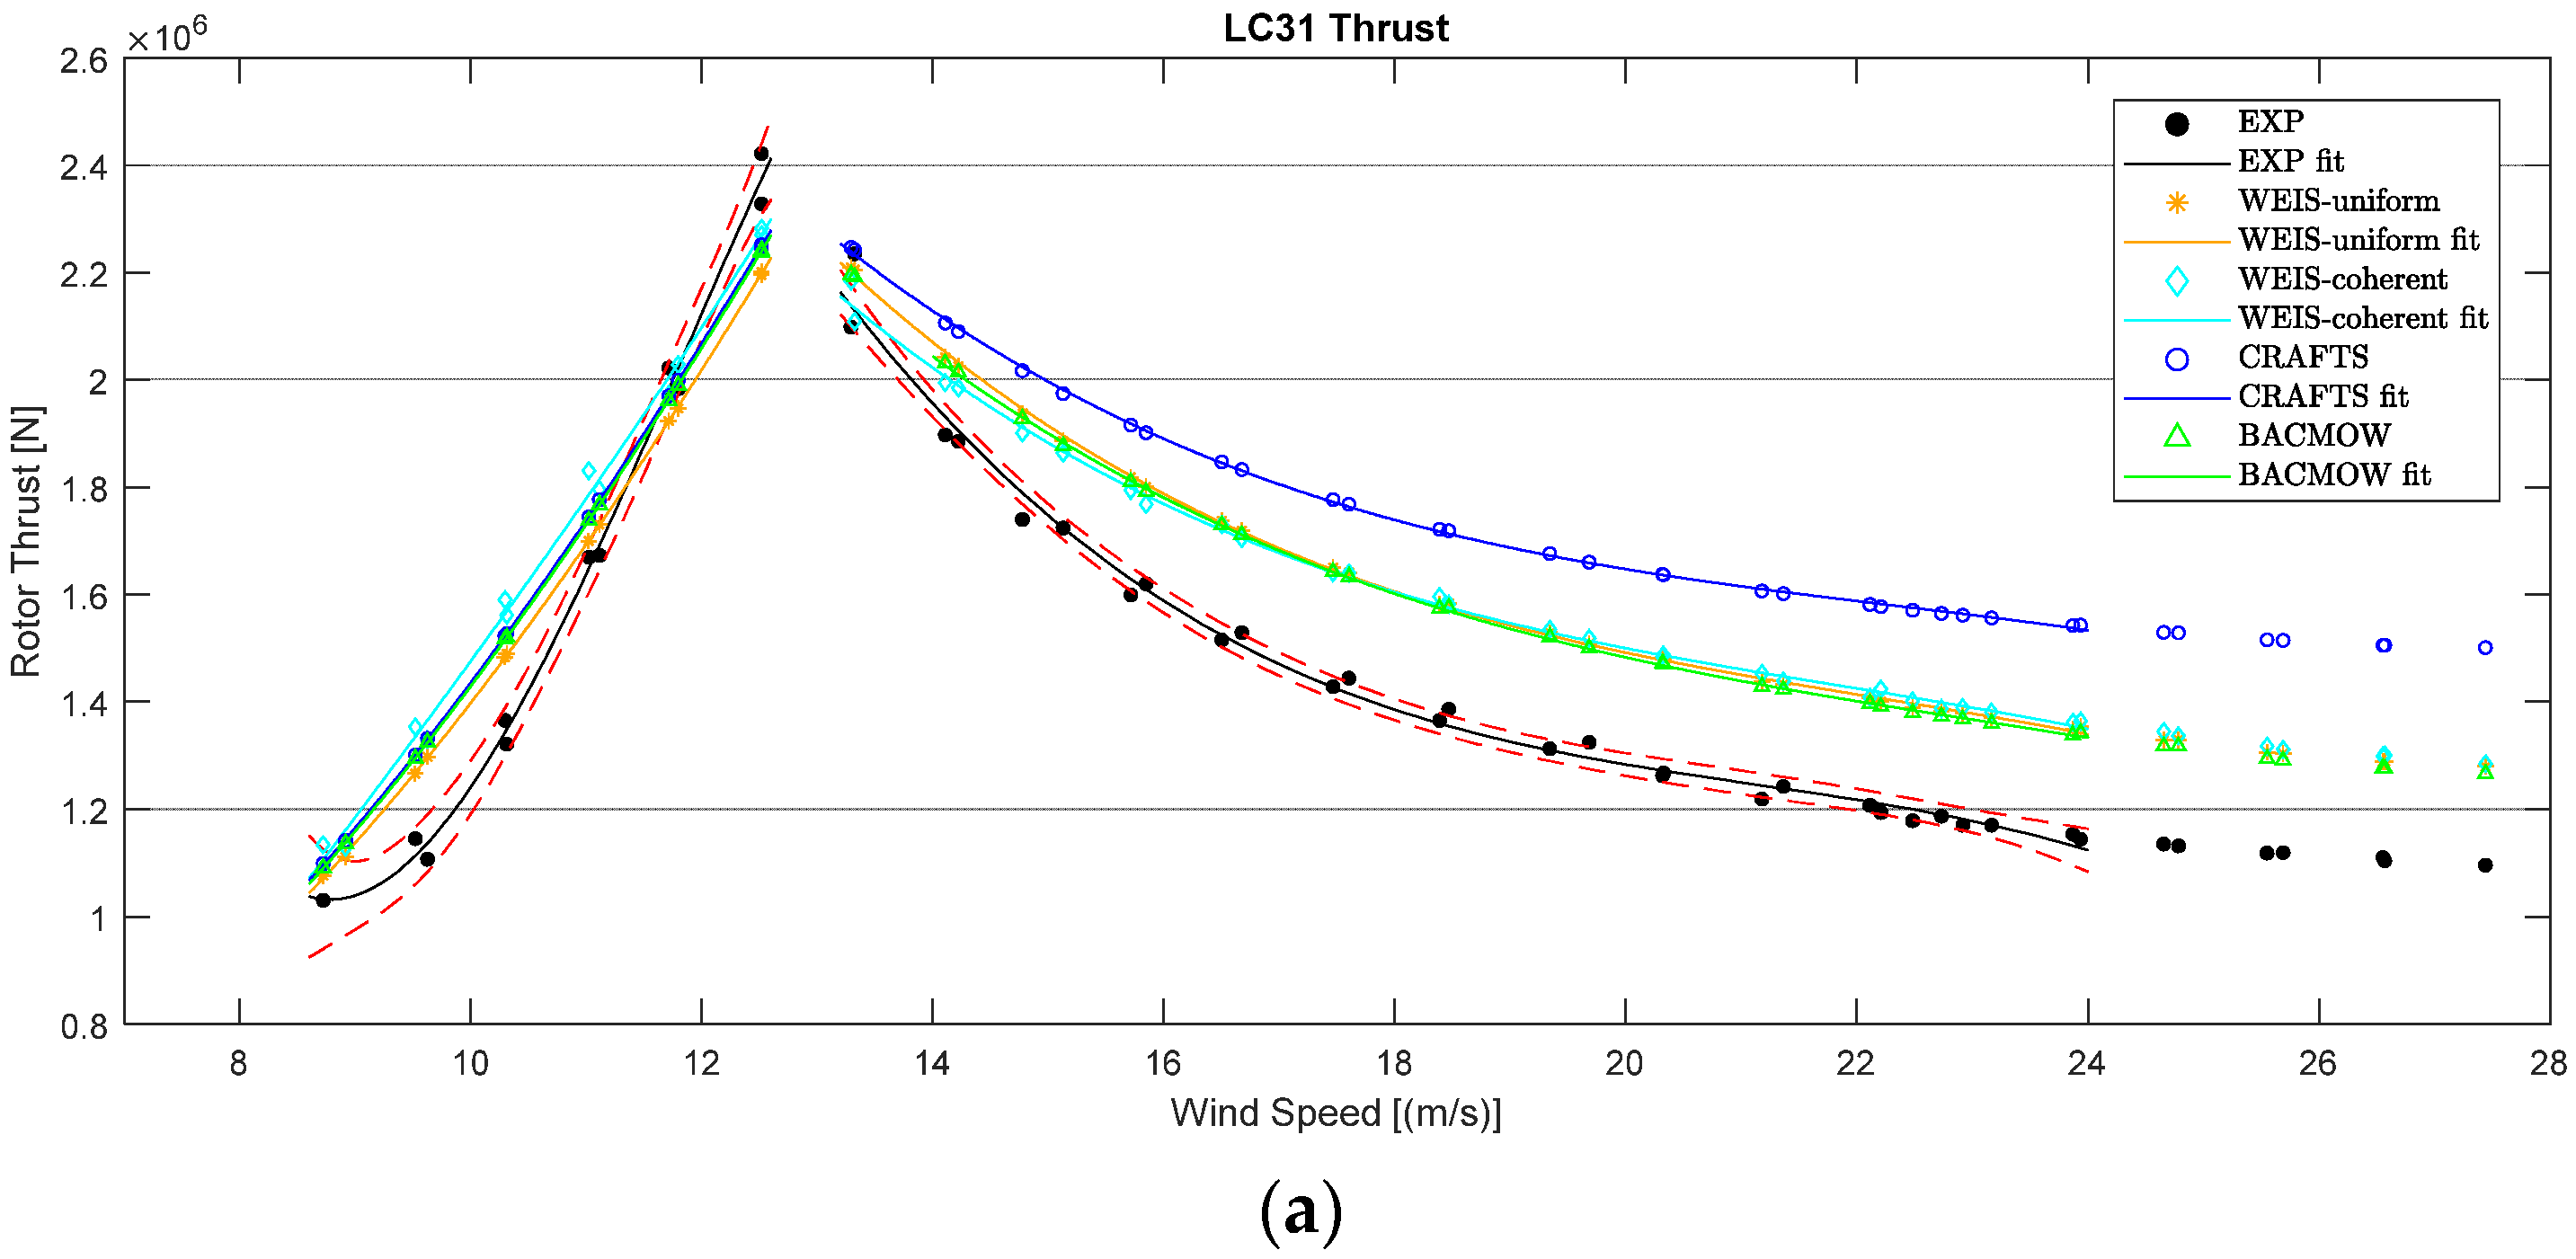
5.3. Load Case 3.X: Varying Wind Conditions

Load cases 3.X focused on tests implementing a closed-loop controller based on the ROSCO and obtaining the controller’s response to varying wind speeds. The controller actively provided real-time pitch commands based on the error between the measured rotor speed and the desired rotor speed setpoint. The load cases were post-processed differently to achieve different goals and outcomes, as described below. LC 3.1 incrementally stepped the wind speed from below-rated through the transition region into far above-rated conditions. LC 3.2 started with below rated conditions and then maintained a sustained gust well above rated conditions. LC 3.3–3.5 focused on the transition region.
Time-accurate wind speed files were generated from a combination of the experimental sensor recordings. For the three spectral cases, turbulence spectrum definitions were also provided. As was conducted with LC 2.X, pre-simulation time was added to allow for initial (artificial) simulation transients to die out and was, subsequently, removed during post-processing. Thus, all system responses/outputs were only functions of the changing wind. The four turbulence models (e.g., the uniform and coherent models) were explained in detail in Section 5.3.3.

5.3.1. LC 3.1: Stepped Wind

For load case 3.1, the wind was stepped up from ~8 m/s to ~28 m/s with a length between steps of approximately 500 s and a step height of roughly ~0.7–1.1 m/s. Figure 9 shows the time history of the wind field alongside the time histories of the blade pitch, rotor speed, and the tower top forces and moments.
Each step could be discretized into a single steady-state value by averaging over the length held between each step. Because each step (except the highest wind speed) had both a step-up and step-down, two steady-state values could be extracted per mean wind speed. These individual points could then be plotted as shown in Figure 10. The red dashed lines show the uncertainty in the experimental data only. As was performed for LC 2.X, a polynomial curve could be fit to these points (the solid lines) and derivatives of these polynomials could be taken to yield the sensitivities of the thrust and torque with respect to wind speed (∂T/∂u and ∂Q/∂u). These were also presented in Figure 10. As before, the red dashed lines show the standard error of the estimate for the experimental data only, which only considered the random error, not the systematic bias, in the experiment.

5.3.2. LC 3.2: Gust

In this load case, a steady wind (held for ~500 s) at a below-rated condition (~8 m/s) was suddenly increased to well above rated conditions (~23 m/s) and sustained at that wind speed for over 1000 s (before suddenly reducing again). The primary objective was to understand how the controller reacted to the sudden gust, specifically in terms of damped response characteristics (e.g., rise time, settling time, and overshoot/peak). Figure 11 shows how these metrics were calculated.
The rise time was defined as the time to cover, from 10% to 90%, the difference between the pre-ramp and post-ramp levels. The peak time is self-explanatory. The settling time was based on a threshold as a percentage of the post ramp value. For rotor thrust, the threshold was +/−10% of the post-ramp thrust. For torque, it was +/−5% and +/−2% for rpm. A different percentage threshold was used for each channel because of the different noise-to-signal ratios and peak values. For example, the threshold needed to be lower than the peak but higher than the noise. Figure 12 shows the real-time pitch, rotor speed, thrust, and torque. Figure 13 shows the values for the metrics for the thrust, torque, and rotor speed. In Figure 13, there was no settling time for the numerical results for torque, because the overshoot in torque from the simulations was negligible.

5.3.3. LC 3.3 and 3.5: Steady and Spectral Wind

These load cases focused on the steady wind condition around the transition region (12.83 m/s) with different turbulence characteristics. LC 3.3 examined the natural freestream turbulence characteristics (rotor-averaged turbulence intensity of 4.49%) and LC 3.5 employed a manufactured Kaimal turbulence spectrum. The Kaimal turbulence spectrum was created using TurbSim based on the IEA wind 15 MW full-scale conditions and the IEC 61400-1 third Ed. standard. The resulting time history was Froude-scaled and then upscaled by a factor of 1.2 (due to the 20% increase in wind speed; see Section 2.2). Finally, this modified time history was used to define the fan setpoints in the basin. The metrics were given in terms of mean and standard deviation, and the WEIS team explored how different turbulence modeling approaches affected the torque and thrust (see details below). For these two load cases, the experimental pitch was shown to be completely saturated.
In Figure 14, there were four sets of WEIS results, each with a different turbulence model:
  • Uniform: This model used the time history of the experimental wind speed at hub height as the wind speed across the entire simulation domain, thereby generating a uniform wind field.
  • Spatially coherent: This model used the time history of the experimental wind speed at hub height in combination with TurbSim to generate a new wind field with spatially coherent turbulence across the domain (based on the spatial coherence functions defined for the Kaimal in the IEC 61400-1 design standard). Because only one point was used to seed this turbulence field, it deviated significantly at other radial and azimuth locations in the rotor plane.
  • Spectrum: An FFT of the time history of the experimental wind speed at hub height was performed and then scaled to match the rotor-averaged turbulence intensity of 4.49%. The frequency content and power spectral density were generated and used to create a new time series using random phasing that was spatially uniform across the domain.
  • TI (turbulence intensity): This model used the experimentally measured, rotor-averaged mean wind speed (12.83 m/s) and turbulence intensity (4.49%) to generate the input wind field. A Kaimal spectrum with the same TI as the experimental data was generated and used to create a new time series using random phasing that was spatially uniform across the domain.
All other participants used the uniform turbulence model. Metrics for these load cases were computed as the mean wind speed and standard deviation (2σ) about this mean (shown in red bars, which were twice the standard deviations encompassing 95% of the temporal fluctuations), as illustrated in Figure 14. The WEIS uniform results were the most consistent with the other numerical tools and yielded the closest values to the experiment, so this approach is recommended.
Figure 14. LC 3.3 and LC 3.5 metrics for (a) pitch, (b) rotor speed, (c) thrust, and (d) torque. Red error bars indicate twice the standard deviation about the mean.
Energies 15 07649 g014

5.3.4. LC 3.4: Sinusoidal Wind

LC 3.4 employed a sinusoidally varying wind to mimic the global pitching motion of the floating system to evaluate the turbine loads and the corresponding controller response. The sinusoid that described the variation in the experimental wind speed (first harmonic) was:
v ( t ) = A × s i n   ( 2 π f t + φ )
where A = 0.68 m/s, f = 0.036 Hz, and φ is the phase shift.
The pitch was saturated for most of the run; thus, the controller responded primarily through the rotor speed. In addition, the frequency content (spectra) could be analyzed through frequency response functions (FRFs). The FRFs for the thrust, torque, and rotor speed are illustrated in Figure 15. In the figure, the amplitudes of the WEIS-coherent results were small because the variation across the rotor of the coherent turbulence was on the same level as the variation of the sinusoidal wind speed.

6. Conclusions

Floating offshore wind turbines have significant potential to open new territories and markets, but they currently suffer from a high levelized cost of energy. One approach to reducing costs is to integrate controls directly into the design process, which can contribute to minimizing system loads and can impact mass requirements, thereby reducing the cost of energy. Few scaled experimental data sets exist, and those that do have very limited turbine controls. The experimental and numerical results presented here employed an active turbine controller (load cases 3.X) and exercised control features such as collective pitch control and setpoint smoothing (transition region control). Parameters important to controller tuning and controller gain scheduling were derived. Results showed that the various numerical models could reproduce the experimental results quite well, showing similar trends and magnitudes. Salient results included the torque, thrust, and their partial derivatives, tower top forces and moments, and damped system response characteristics. With these newly derived controller parameters, the turbine controller could be used to mitigate the system dynamic response and drive down costs via control co-design. In addition, this validation showed that these numerical tools could effectively represent the aero-dynamic load response from real-time controller actions, which means these tools can be used in a control co-design process for achieving optimized designs. Future work includes the further development of the numerical tools and using the active turbine controller in upcoming FOCAL experimental campaigns.

Author Contributions

N.M.: Methodology, Formal Analysis, Investigation, Visualization, and Writing—Original Draft. A.R.: Conceptualization, Project Administration, Supervision, Funding Acquisition, and Writing—Original Draft. A.W.: Project Administration, Supervision, and Writing—Original Draft. J.J.: Project Administration, Supervision, and Writing—Original Draft. L.W.: Formal Analysis, Visualization, and Writing—Original Draft. R.B.: Formal Analysis, Methodology, and Writing—Original Draft. T.D.: Project Administration, Supervision, Funding Acquisition, and Writing—Review and Editing. T.N.: Formal Analysis, Investigation, Supervision, and Writing—Review and Editing. M.O.: Wind turbine modeling, simulation, verification, and validation. K.M.: Control implementation, simulation, verification, and validation. F.F.F.: Investigation, Formal Analysis, and Writing—Review and Editing. B.C.: Project Administration, Supervision, and Funding Acquisition. G.B.: Formal Analysis and Writing—Review and Editing. M.F.: Investigation, Formal Analysis, and Writing—Review and Editing. A.G.: Investigation, Writing—Review and Editing. R.K.: Investigation and Writing—Review and Editing. E.L.: Formal Analysis and Writing—Review and Editing. A.V.: Project Administration, Supervision, and Funding Acquisition. All authors have read and agreed to the published version of the manuscript.

Funding

This cross-collaboration task, the various prime projects under which these software tools were developed, and the FOCAL experimental campaign were supported by the ARPA-E ATLANTIS program (grant numbers: UCF DE-AR0001187 and NREL DE-FOA-0002051).

Data Availability Statement

The data sets generated for this study will be available on the Department of Energy Atmosphere to Electrons website at https://a2e.energy.gov/projects (accessed on 1 September 2022).

Acknowledgments

The authors wish to thank the various team members who contributed to software tool development and data preparation who are not in the author list. This work was authored in part by the National Renewable Energy Laboratory, operated by the Alliance for Sustainable Energy, LLC, for the U.S. Department of Energy (DOE) under contract no. DE-AC36-08GO28308. Funding was provided by the U.S. Department of Energy Advanced Research Projects Agency for Energy (ARPA-E) under the Aero-Dynamic Turbines, Lighter and Afloat, with Nautical Technologies and Integrated Servo-Control (ATLANTIS) program. The views expressed in the article do not necessarily represent the views of the DOE or the U.S. government. The U.S. government retains, and the publisher, by accepting the article for publication, acknowledges that the U.S. government retains a non-exclusive, paid-up, irrevocable, worldwide license to publish or reproduce the published form of this work, or allow others to do so, for U.S. government purposes.

Conflicts of Interest

The authors declare no conflict of interest. The funders had no role in the design of the study; in the collection, analyses, or interpretation of data; in the writing of the manuscript, or in the decision to publish the results. The authors declare that the research was conducted in the absence of any commercial or financial relationships that could be construed as a potential conflict of interest.

Nomenclature

ARPA-EAdvanced Research Projects Agency–Energy
ATLANTISAero-Dynamic Turbines, Lighter and Afloat, with Nautical Technologies and Integrated Servo-Control
BACMOWBladed advanced control modeling for offshore wind
BEMBlade element momentum theory
Cp-CtTurbine performance map of power and thrust coefficients
CRAFTSControl-oriented, reconfigurable, and acausal floating turbine simulator
DLLDynamically linked library
DOFDegree of freedom
DTUDanish Technical University
EXPExperimental data
FFTFast Fourier transform
FMIFunctional mock-up interface
FMUFunctional mock-up
FOCALFloating Offshore-wind and Controls Advanced Laboratory
FOWTFloating offshore wind turbine
FRFFrequency response function
IEAInternational Energy Agency
IECInternational Electrotechnical Commission
LCLoad case
MIMOMulti-input–multi-output
NRELNational Renewable Energy Laboratory
NUMNumerical data
PIProportional–integral
ReReynolds number
ROSCOReference open-source controller
RWTReference wind turbine
SISOSingle-input–single-output
TITurbulence intensity
UCFUniversity of Central Florida
USFLOWTUltra-flexible smart floating offshore wind turbine
WEISWind energy with integrated servo-control

References

  1. Robertson, A.N.; Jonkman, J.M.; Masciola, M.D.; Molta, P.; Goupee, A.J.; Coulling, A.J.; Prowell, I.; Browning, J. Summary of Conclusions and Recommendations Drawn from the DeepCWind Scaled Floating Offshore Wind System Test Campaign. In Proceedings of the ASME 2013 32nd International Conference on Ocean, Offshore, and Arctic Engineering, Nantes, France, 9–14 June 2013. [Google Scholar]
  2. Goupee, A.J.; Kimball, R.W.; Dagher, H.J. Experimental observations of active blade pitch and generator control influence on floating wind turbine response. Renew. Energy 2017, 104, 9–19. [Google Scholar] [CrossRef] [Green Version]
  3. Bottasso, C.L.; Campagnolo, F.; Petrovic, V. Wind tunnel testing of scaled wind turbine models: Beyond aerodynamics. Wind Eng. Ind. Aerodyn. 2014, 127, 11–28. [Google Scholar] [CrossRef]
  4. Bayati, I.; Belloli, M.; Bernini, L.; Gilberti, H.; Zasso, A. Scale model technology for floating offshore wind turbines. IET Renew. Power Gener. 2017, 11, 1120–1126. [Google Scholar] [CrossRef] [Green Version]
  5. Yu, W.; Lemmer, F.; Bredmose, H.; Borg, M.; Pegalajar, A.; Mikkelsen, R.F.; Stoklund Larsen, T.; Fjelstrup, T.; Lomholt, A.K.; Boehm, L.; et al. The triple spar campaign: Implementation and test of a blade pitch controller on a scaled floating wind turbine model. Energy Procedia 2017, 137, 323–338. [Google Scholar] [CrossRef] [Green Version]
  6. Namik, K.; Stol, K. A review of floating wind turbine controllers. In Handbook of Wind Power Systems, Energy Systems; Springer: Berlin/Heidelberg, Germany, 2013; pp. 415–441. [Google Scholar] [CrossRef]
  7. Fleming, P.A.; Peiffer, A.; Schlipf, D. Wind turbine controller to mitigate structural loads on a floating wind turbine platform. J. Offshore Mech. Arct. Eng. 2019, 141, 061901. [Google Scholar] [CrossRef]
  8. Yu, W.; Lemmer, F.; Schlipf, D.; Cheng, P.W.; Visser, B.; Links, H.; Gupta, N.; Dankemann, S.; Counago, B.; Serna, J. Evaluation of control methods for floating offshore wind turbines. J. Phys. Conf. Ser. 2018, 1104, 012033. [Google Scholar] [CrossRef]
  9. Lemmer, F.; Yu, W.; Schlipf, D.; Cheng, P.W. Robust gain scheduling baseline controller for floating offshore wind turbines. Wind Energy 2019, 23, 17–30. [Google Scholar] [CrossRef]
  10. Yu, W.; Lemmer, F.; Schlipf, D.; Cheng, P.W. Loop shaping based robust control for floating offshore wind turbines. J. Phys. Conf. Ser. 2020, 1618, 022066. [Google Scholar] [CrossRef]
  11. Lemmer, F.; Yu, W.; Steinacker, H.; Skandali, D.; Raach, S. Advances on reduced-order modeling of floating offshore wind turbines. In Proceedings of the ASME 2021 40th International Conference on Ocean, Offshore, and Arctic Engineering, Virtual, Online, 21–30 June 2021. [Google Scholar] [CrossRef]
  12. Eben, L.; Goupee, A.J.; Wright, A.; Abbas, N. Tuning of Nacelle Feedback Gains for Floating Wind Turbine Controllers Using a Two-DOF Model: Preprint; NREL/CP-5000-76558; National Renewable Energy Laboratory: Golden, CO, USA, 2020. Available online: www.nrel.gov/docs/fy20osti/77508.pdf (accessed on 1 March 2022).
  13. Han, C.; Nagamune, R. Platform position control of floating wind turbines using aerodynamic force. J. Renew. Energy 2020, 151, 896–907. [Google Scholar] [CrossRef]
  14. Stockhouse, D.; Phadnis, M.; Grant, E.; Johnson, K.; Damiani, R.; Pao, L. Control of a floating wind turbine on a novel actuated platform. In Proceedings of the 2022 American Control Conference (ACC), Atlanta, GA, USA, 8–10 June 2022. [Google Scholar] [CrossRef]
  15. Abbas, N.; Zalkind, D.; Pao, L.; Wright, A. A Reference Open-Source Controller for Fixed and Floating Offshore Wind Turbines. Wind Energ. Sci. 2022, 7, 53–73. Available online: https://wes.copernicus.org/articles/7/53/2022/ (accessed on 1 June 2022). [CrossRef]
  16. Gaertner, E.; Rinker, J.; Sethuraman, L.; Zahle, F.; Anderson, B.; Barter, G.E.; Abbas, N.J.; Meng, F.; Bortolotti, P.; Skrzypinski, W.; et al. IEA Wind TCP Task 37: Definition of the IEA 15-Megawatt Offshore Reference Wind Turbine; NREL/TP-5000-75698; National Renewable Energy Laboratory: Golden, CO, USA, 2020. Available online: https://www.nrel.gov/docs/fy20osti/75698.pdf (accessed on 1 March 2022).
  17. Kimball, R.; Robertson, A.N.; Fowler, M.; Mendoza, N.; Wright, A.; Goupee, A.J.; Lenfest, E.; Parker, A. Results from the FOCAL Experiment Campaign 1: Turbine Control Co-Design. J. Phys. Conf. Ser. 2022, 2265, 022082. [Google Scholar] [CrossRef]
  18. Bladed Theory Manual. version 4.13; DNV Services UK Limited: Bristol, UK, 2022.
  19. Tiller, M. Introduction to Physical Modeling with Modelica; Tiller, M.M., Ed.; Kluwer Academic Publishers: Norwell, MA, USA, 2001. [Google Scholar]
  20. Fritzson, P. Principles of Objected-Oriented Modeling and Simulation with Modelica 3.3—A Cyber-Physical Approach, 2nd ed.; Fritzson, P., Ed.; IEEE Press/Wiley: Piscataway, NJ, USA, 2015. [Google Scholar]
  21. Jonkman, B.; Mudafort, R.M.; Platt, A.; Branlard, E.; Sprague, M.; Jonkman, J.; Hayman, G.; Vijayakumar, G.; Buhl, M.; Ross, H.; et al. OpenFAST/openfast: OpenFAST v3.1.0. Zenodo.. 2022. Available online: https://zenodo.org/record/6324288#.Y0UAG0xBxPY (accessed on 1 June 2022).
Figure 1. Instrumentation locations.
Energies 15 07649 g001
Figure 2. ROSCO diagram.
Energies 15 07649 g002
Figure 3. LC 1.1 thrust (left) and torque (right).
Energies 15 07649 g003
Figure 4. LC 1.1 sensitivities of thrust and torque with respect to rotor speed (left and right, respectively).
Energies 15 07649 g004
Figure 5. LC 1.1 tower top forces and moments, blade root bending moments.
Energies 15 07649 g005
Figure 6. LC 2.2 (left) and LC 2.4 (right) pitch schedules.
Energies 15 07649 g006
Figure 7. Thrust and torque histories for (a) LC 2.2 and (b) LC 2.4.
Energies 15 07649 g007aEnergies 15 07649 g007b
Figure 8. LC 2.2 and LC 2.4 thrust and torque sensitivities: (a) LC 2.2 thrust; (b) LC 2.2 derivative of thrust; (c) LC 2.2 torque; (d) LC 2.2 derivative of torque; (e) LC 2.4 thrust; (f) LC 2.4 derivative of thrust; (g) LC 2.4 torque; (h) LC 2.4 derivative of torque. The red dashed lines show the uncertainty of the true relation—not of individual data points—for only the experimental data.
Energies 15 07649 g008aEnergies 15 07649 g008b
Figure 9. LC 3.1 time histories of (a) wind speed, blade pitch, and rotor speed; (b) tower top forces; (c) tower top moments.
Energies 15 07649 g009
Figure 10. LC 3.1 thrust, torque, and their sensitivities with respect to wind speed: (a) thrust; (b) thrust sensitivity; (c) torque; (d) torque sensitivity. The red dashed lines show the uncertainty in the experimental data only.
Energies 15 07649 g010aEnergies 15 07649 g010b
Figure 11. LC 3.2 metric calculation.
Energies 15 07649 g011
Figure 12. LC 3.2 time histories for (a) blade pitch, (b) rotor speed, (c) thrust, and (d) torque.
Energies 15 07649 g012
Figure 13. LC 3.2 time metrics (ac) and value metrics (df) for thrust, torque, and rotor speed.
Energies 15 07649 g013
Figure 15. LC 3.4 frequency response functions for thrust, torque, and rotor speed: frequencies (ac) and amplitudes (df).
Energies 15 07649 g015
Table 1. Instrumentation channels.
ComponentMeasurementInstrument
TurbineIndividual blade pitchPitch motor encoder 1
TurbineRotor speedRotor motor encoder 2
TurbineRotor position (azimuth)Rotor motor encoder 2
TurbineRotor thrustTower top 6DOF load cell 3
TurbineRotor torqueInline dynamic torque cell 4
TurbineNacelle accelerationTriaxial accelerometer
EnvironmentSurvey wind speed and directionUltra-sonic anemometer 5
EnvironmentSurvey and wake study wind Speed and turbulence characteristicsHotwire anemometer 6
EnvironmentAir temperature, pressure, and relative humidityVaisala PTU303 met station
EnvironmentUpstream reference wind speed, turbulence characteristicsHotwire anemometer 6
TurbineIndividual blade pitchPitch motor encoder 1
TurbineRotor speedRotor motor encoder 2
1 Harmonic drive RSF-5B-100-US050-BC with ELMO drive; 2 Wittenstein cyber-dynamic servo- motor; Copley Accelnet+ etherCAT servo drive; 3 ATI FT33326 with 9105-ECATBA signal conditioner; 4 interface N199977 5-Nm; 5 RM Young SN04053 (3D); 6 TSI-shrouded hot film anemometer.
Table 2. Controller strategies for the IEA wind 15 MW wind–wave basin experimental campaign.
FunctionOperational CaseActuation
ROSCO torque controlBelow-rated (BR)Generator torque (GT)
ROSCO pitch controlAbove-rated (AR)Collective pitch (CP)
ROSCO transition controlTransition region (TR)CP + GT
Table 3. Numerical modeling approaches.
WEIS/OpenFASTUCF/CRAFTSBladed/BACMOW
Wake/Induction ModelDynamic BEMBEMDynamic BEM
Blade/Airfoil
Model
Un-steady
Aero-dynamics
Static polarsUn-steady
Aero-dynamics
DomainSystemSystemSystem
Linear or Non-LinearNon-linearNon-linearNon-linear
Table 4. Load case definitions and descriptions.
LCWind Speed: Full-Scale (Model-Scale)Pitch Control (Degrees)Rotor Speed Control: Full-Scale (Model-Scale)Sim Time: Full-Scale (s)
1.112.83 (1.533)0Ramp from 3 to 10 (25.10 to 83.67)Steady values at 1 rpm increments
1.212.83 (1.533)10Ramp from 3 to 10 (25.10 to 83.67)Steady values at 1 rpm increments
1.318.39 (2.198)9Ramp from 3 to 10 (25.10 to 83.67)Steady values at 1 rpm increments
1.418.39 (2.198)15Ramp from 3 to 10 (25.10 to 83.67)Steady values at 1 rpm increments
2.127.68 (3.308)Step −2 to 30Locked5687.65
2.212.83 (1.533)Step +/− 2 from 07.561842.225
2.318.41 (2.820)Step 10–147.561842.05
2.412.83 (1.533)Ramp −1 to 57.561016.65
2.518.41 (2.820)Ramp 10 to 167.561014.575
3.1Stepped from 8-30-8ROSCOROSCO23,605
3.2TR1 GustROSCOROSCO1450
3.3TR1 Steady: 12.83 (1.530)ROSCOROSCO2330
3.4TR1 SinusoidROSCOROSCO1660
3.5TR1 SpectralROSCOROSCO11,090
3.6TR1 SpectralROSCO, without setpoint smootherROSCO11,090
Table 5. Output channel format.
Column NumberOutputUnits
1Times
2Wind speedm/s
3Blade pitchdeg
4Rotor speedrpm
5Rotor thrustN
6Rotor torqueN-m
7FX: Tower topN
8FY: Tower topN
9FZ: Tower topN
10MX: Tower topN-m
11MY: Tower topN-m
12MZ: Tower topN-m
13Blade-root flap-wise bending momentN-m
14Blade-root edge-wise bending momentN-m
Publisher’s Note: MDPI stays neutral with regard to jurisdictional claims in published maps and institutional affiliations.

