Article

Effect of Heave Plates on the Wave Motion of a Flexible Multicolumn FOWT

1
OSPL—Ocean Space Planning Laboratory, Department of Systems Innovation, The University of Tokyo, Tokyo 113-8657, Japan
2
Ship Structure Integrity Subarea, Department of Naval Architecture and Ocean Engineering, Osaka University, Osaka 565-0871, Japan
3
ClassNK—Nippon Kaiji Kyokai, Tokyo 102-8567, Japan
4
Technomar Engenharia Oceânica, São Paulo 05419-905, Brazil
*
Author to whom correspondence should be addressed.
Energies 2022, 15(20), 7605; https://doi.org/10.3390/en15207605
Submission received: 24 August 2022 / Revised: 6 October 2022 / Accepted: 12 October 2022 / Published: 14 October 2022

Abstract

:
Three models with different footing types were used to clarify the effect of heave plates on the hydrodynamic behavior of the elastic response of a flexible multicolumn floating offshore wind turbine (FOWT). The models were tested under regular waves, whose added mass, damping, and motion response results were compared with numerical simulations by NK-UTWind and WAMIT codes. As a whole, the attachment of heave plates was responsible for increasing the added mass and damping levels, consequently modifying the RAO of the models. Regarding the response in a sea condition, a decrease of 33% and 66% of the significant motion height (heave and pitch) was observed. Thus, the heave plate can be a good feature for the future design of FOWT.

1. Introduction

The offshore wind turbine is one of the world’s most promising power generation options. Its advantages can be emphasized as the availability of more robust and consistent winds and less noise and visual pollution than the onshore wind turbines. Offshore wind turbines can be broadly categorized into bottom-mounted and floating types. The one prevailing widely in recent years is the bottom-mounted type, whose suitable places are limited to shallow water areas. Therefore, the key to promoting the installation of offshore wind turbines in the ocean frontier is the development of technology for floating turbines, which are suitable for deep waters and have more significant potential than bottom-mounted types.
In Japan, the Agency for Natural Resources and Energy and the New Energy and Industrial Technology Development Organization (NEDO) have led the project of floating wind turbines with barge-type [1,2,3,4], semi-submersible [4,5,6,7,8], and spar-type [9,10,11]. However, one of the challenges for the widespread use of floating offshore wind turbines is cost reduction through technological development. Thus, one of the most effective ways to achieve this goal is to design compact and lightweight floating structures, such as a floater using guy wires to support the tower [12].
In the design of floating wind turbines, it is necessary to evaluate the dynamic response under environmental conditions such as wind, waves, and ocean currents, employing coupled analysis of wind turbines, floating structure, and mooring. Some of the coupled response analysis codes found in the literature are Bladed by DNV-GL [13], FAST by NREL [14], and NK-UTWind, developed by the University of Tokyo and the ClassNK [15]. The dynamic analysis methods used in these codes can be divided into two categories: those based on potential theory and those based on the Morison equation, which has different tendencies when calculating the motion and structural responses [16]. In most research, tank experiments were conducted to verify these codes, mainly focused on the behavior of a rigid floating model or a model where the effect of elastic deformation on the rigid body motion can be negligible.
Floaters based on the concept of compact and lightweight structures require durability, stability, and good motion behavior under environmental conditions. Therefore, the effect of the floater flexibility on the dynamic behavior of a FOWT was investigated in the former research, as in [17,18,19,20,21]. In that research, the NK-UTWind code based on the Morison equation was verified using an extremely flexible model with a significant elastic deformation due to external loads. On top of that, the effect of heave plates on the motion of FOWT floaters has been investigated in various research to improve the behavior of FOWT in waves [22,23,24,25,26] and currents [27,28].
From these circumstances and to complement the previous studies [18], two different heave plate configurations were designed and attached to the footings of a very flexible multicolumn model. Regular wave tests were carried out in a towing tank. This research aims to reveal heave plate effects on the dynamic behavior of the flexible FOWT, as the response in waves, added mass, and viscous damping. The applicability of the NK-UTWind and WAMIT [29] codes as design tools for such flexible models with heave plates were also compared and verified. Wind and ocean current loads were not considered in the present research.

2. Experimental Setup

2.1. Reduced Scale Model

The basic case without heave plates, denominated as a Sphere Model, is the same one used in the former experiments in [18], which was designed as a 1/50 scale of the supposed full-scale FOWT characterized by extremely low stiffness. Footings on the column bottom were designed as spheres instead of the circular cylinders used in most research cases to avoid additional damping effects derived from vortex shedding and to promote intense elastic deformation of the model. The main dimensions of the model are shown in Figure 1.
Core stainless (SUS304) beams were used to represent the model elastic similarity (provide the structural rigidity), and the urethane pieces were wrapped around the core beams to define the geometry similarity. The urethane parts were segmented to avoid additional stiffness. A picture of the reduced scale model is shown in Figure 2.
As shown in Table 1, Froude law was applied to this experiment. Moment of inertia of area, I , was decided to consider Young’s modulus, E , in model scale and full scale, which enabled the model to meet the scale factor of bending rigidity, E I . K , G , and M are defined as keel, the center of gravity, and metacenter points.
Two different heave plate configurations were designed to be easily attached to the footings of the base case Sphere Model; see Figure 3. However, the geometry of the heave plates was not intended to represent actual conditions for improving the performance of the FOWT. Instead, they were designed for fundamental purposes to affect the system’s added mass and viscous damping and, consequently, the behavior in the waves of the FOWT.
The first configuration, denominated as Plate Model, Figure 3b, was designed as a simple heave plate attached to the end of the footing of the columns of the FOWT. This geometry aimed to increase the added mass and viscous damping compared to the Sphere Model. The second configuration, named as Semi-Spheroid Model (SS-Model), Figure 3c, was designed to include a semi-spheroid at the end of the footings in the Plate Model; this geometry aimed to increase the added mass compared to the Sphere Model; however, the damping level should be lower than the Plate Model. The main properties of each model are shown in Table 2.

2.2. Wave Tank Setup

All of the experiments were carried out in a towing tank at Osaka University, Japan, with 100.0 m × 7.8 m × 4.4 m (length × width × depth). Two horizontal moorings composed of wires and springs were aligned to the wave direction and attached to the model to prevent it from drifting. Details of the experimental setup and spring properties are shown in Figure 4.
In the wave experiments, the six-degree-of-freedom (DOF) motions of the model and the incident wave were measured. The floating body’s motions were measured by the OptiTrack® Optical Motion Capture System (NaturalPoint, Inc., Corvallis, OR, USA) comprised of 4 cameras. The 6DOF rigid body motions of the model were defined as the motion at the center of gravity. Wave probes were installed at an intermediate point between the wave generator and the experimental model and beside the model.
The model was equipped with forty-six strain gauges to measure the strains of the tower, decks, and columns. The locations of the strain gauges in the global coordinates are indicated as blue markers, as shown in Figure 5. The bending strains are measured in two directions perpendicular to the member surface. In contrast, for the deck, it is measured only in the out-of-plane direction (overall coordinate Z direction). The sampling frequency during the experiments was 100 Hz.

2.3. Environmental Conditions

Experiments under regular waves were conducted under three different wave heights and wave periods from 0.9 to 3.2 s. In addition, the large wave height cases were carried out around the natural periods of heave and pitch, mainly to discuss the effect of wave heights on viscous damping. Details of the regular wave characteristics are presented in Table 3.

3. Numerical Methods

3.1. NK-UTWind Code Model

First, the full-scale FOWT was numerically modeled and analyzed using a coupled analysis code for the rotor–floater–mooring response. The code used was the NK-UTWind (an in-house code developed by UTokyo and ClassNK for coupled analysis of FOWT, see [16]); other articles that present details about the use of NK-UTWind can be found, for example, in [8,12,18,19].
The aerodynamic and inertia loads on the rotor part are integrated into the structure part. The structure is formulated using a finite element model and discretized into node and beam elements. Each node has three translational and three angular degrees of freedom. Thus, it can be formulated as given in Equation (1).
[ M ] { x ¨ } + [ C ] { x ˙ } + [ K ] { x } = [ F h y d r o + F l i n e s + F b u o y a n c y + F a e r o ]
where [ M ] is the mass matrix whose dimension is 6N for the structural model of the N nodes, [ C ] the damping matrix, [ K ]  the structural stiffness matrix, and x denotes the nodal displacement vector, and its first derivative and second derivative denote the velocity and acceleration vectors, respectively. The right-hand side vector comprises four force components: the hydrodynamic force, the forces from mooring lines, the restoring force, and the aerodynamic force. The hydrodynamic force is evaluated based on Morison’s Equation [30], as given in Equation (2). This evaluation method is applicable for slender structures that are hydrodynamically transparent.
F h y d r o   = ρ π D 2 4 v ˙ + C m ρ π D 2 4 ( v ˙ x ¨ ) + C D 1 2 ρ D ( v x ˙ ) | v x ˙ |
where ρ is the fluid density, D is the diameter of the column element, and v is the fluid particle velocity. Moreover, C m and C D denote the added mass coefficient and drag force coefficient, respectively. The mooring force can be evaluated by either quasi-static catenary calculation, lumped-mass method, or linear spring. Wheeler’s stretch method [31] estimated wave forces for the submerged domain for each time step.
The mesh and nodes considered in the NK-UTWind code analysis for each model configuration are visualized in Figure 6 for the whole system and Figure 7 for the details in the footing region. All of the beam elements were modeled as circular cylinders. As shown in Figure 7, the spheroidal footing region was approximated by three flat circular cylinders, the flat plate one was approximated by one thin circular cylinder, and the semi-spheroidal one was approximated by two flat circular cylinders using the same methodology. The footing geometries and their settings were selected to reasonably represent the exact characteristics of the experimental models as displaced mass, added mass, and drag coefficients. The hydrodynamic coefficients of each node were obtained from DNV-GL guidelines [32] as standard hydrodynamic coefficients for the structures. Later, the hydrodynamic coefficients were calibrated and updated from the experimental decay test results. The decay test results from the NK-UTWind and experimental results were validated before conducting the numerical simulation in regular waves to confirm that the geometry simplification was evaluated adequately for each heave plate geometry. In the NK-UTWind code, 6DOF motions were obtained for the motion of the center of gravity.

3.2. WAMIT Code Model

The dynamic behavior of the FOWT was also evaluated by WAMIT code, a program based on the linear potential theory to analyze submerged or floating objects under waves. It does not consider the effect of viscosity and can be applied to rigid body motions. Additionally, the WAMIT code evaluates the hydrodynamic loads in the frequency domain.
The WAMIT code simulation was performed with a high-order mesh. The mooring line characteristics were included in the software EDTools® (Technomar Engenharia Oceânica, São Paulo, SP, Brazil), which calculated the full stiffness matrix using the formulation presented in [33]. In addition, the non-diagonal terms due to the degree-of-freedom coupling were also considered in [34]. The 3D view of the EDTools® model is shown in Figure 8.
Since the viscous effect is not considered in the potential theory calculation, it was incorporated into the external damping matrix. The external damping was estimated firstly from the free decay tests and then incorporated into the numerical model. Different values of viscous damping were considered and compared to observe the sensibility of the response due to this parameter.

4. Results and Discussions

Three main results are discussed in this article: first, free decay and hammering tests; second, motion responses; and third, bending strains. Numerical analyses were conducted in full-scale models; all of the results were presented on a reduced scale of 1/50.

4.1. Free Decay and Hammering Tests

The results of natural periods and added mass coefficients obtained from free decay tests are shown in Table 4 and Table 5, respectively.
The comparison between NK-UTWind and the experiment showed differences in natural periods of less than 5% for all models and degrees of freedom. Moreover, the added mass coefficients were calculated using the corresponding restoring force for each degree of freedom. The results showed the most considerable differences for the Plate and SS models, around 20%, instead of 10% for the Sphere model. The high contrast in added mass coefficients was due to the simplifications in the geometry of the heave plates in the NK-UTWind model, as shown in Figure 7.
The comparison between the footing geometries showed an effective increase in the added mass and, consequently, natural periods when including the heave plates. The increase in the natural periods for all cases with heave plates (Plate and SS models) represented around 10% compared with the case without heave plates (Sphere case). As designed, the Plate Model increased the added mass level compared to the Sphere one, and the SS Model presented a lower added mass level than the Plate one; however higher level than the Sphere one.
The methodology to obtain the linear and quadratic damping coefficients from the decay tests time series followed the work by [35,36]. The detailed methods can be seen in the Appendix A. In addition, three different numerical simulations were performed to obtain the viscous damping coefficients.
An example of a time series of heave motion obtained from the experimental decay tests in still water and numerical simulations is represented by the solid blue line and dashed lines in Figure 9.
First, only the linear damping, ζ , was considered, as in Equation (2); see the pink dashed line. In this simulation, the natural period was very well captured; however, the linear damping was not enough to obtain the same time series of the experimental data.
A second simulation included the linear, ζ , and non-linear damping coefficients, b 2 / M , as in Equation (6); see the red dashed line. Again, it is possible to observe that both curves were almost coincident; however, the linear damping coefficient value was negative, ζ < 0 , which is not physically meaningful.
A third simulation was performed to obtain a physical value in which the linear damping term was imposed to be zero, ζ = 0 , and the non-linear damping coefficient was obtained, i.e., only the non-linear damping term was considered in Equation (6); see black dashed line. This comparison makes it possible to observe a good agreement between the experimental and numerical time series.
In summary, two methodologies were applied to obtain the damping coefficient results from decay tests. The first one is only a linear damping method, and the second is only a non-linear one, as the results can be seen in Table 6 and Table 7, respectively.
The uncertainty range of the experimental results is the standard deviation based on the results of multiple measurements (repetition of three decay tests for each condition).
The linear damping coefficient results in Table 6 showed a large discrepancy between the experimental and numerical results. It occurred because the linear method is not the most suitable for these models that present reasonable viscous effects. However, when applying the same linear methodology for different heave plate configurations, it is possible to observe that the heave plates worked as expected in terms of damping effects. The Plate Model increased the damping level compared to the Sphere one, and the SS Model presented a lower damping level than the Plate one; however higher level than the Sphere one.
The significant differences in damping levels in the surge direction between experiments and NK-UTWind simulations showed that the numerical model could improve the horizontal plane drag coefficient values. The difference was highlighted in the pitch direction due to simplifications in the footing region that had a significant impact due to its distance to the center of gravity and rotation.
The natural periods of the most energetic vibration mode are shown in Table 8, and they have good agreement. The differences between the experiment and numerical simulation results were lower than 3%, which confirmed the well-modeling structural behavior of the flexible FOWT.

4.2. Regular Wave Tests

This section presents response amplitude operator (RAO) motions for heave and pitch. Additionally, the RAO of the strains at the tower base around the Y axis and deck around the Y axis are discussed. The RAOs were calculated under regular wave tests. Two main factors were analyzed to verify their effects on the dynamic behavior in regular waves of FOWT: first, the influence of the wave height, and second, the geometry of the heave plates.
Three methodologies were used to obtain RAOs: experimental tests in a wave tank, numerical simulations using NK-UTWind code, and numerical simulations using WAMIT code. Moreover, comparisons between the methodologies were presented and compared to validate the numerical calculations.
Numerical calculations using the NK-UTWind code were evaluated using the same wave height values carried out in the tank experiments. However, the numerical calculations by the WAMIT code were calibrated using different levels of linear damping to match the same RAO peak values around the respective natural period. WAMIT code uses potential linear theory to obtain the hydrodynamic forces and the RAO.
Concerning the terminology and symbols adopted, ξ a is the wave amplitude, k is the wavenumber, and k ξ a is the maximum wave slope.   ξ 33 and ξ 55 are the amplitude of heave and pitch motion, respectively. The RAO results are presented in non-dimensional forms.

4.2.1. Influence of the Wave Height

As observed in the former research [18], a small peak before 2.0 s could be observed in the RAO results due to the elastic vibration mode observed. In this period, the swinging motion of columns due to the significant deformation of decks was observed, as shown in Figure 10.
Figure 11, Figure 12 and Figure 13 compares the RAO results between the experiments for different wave heights and numerical calculations for the Sphere, Plate, and Semi-spheroid models, for heave and pitch motions.
In general, it is possible to observe a decrease in the peak value of the RAO heave around the natural periods when increasing the wave height. This fact was related to the high damping values for high wave heights, which confirmed the pronounced quadratic (non-linear) behavior of the viscous damping, see Table 7.
The numerical results from the NK-UTWind code agreed well with the experiments, and the RAO curve and natural periods trend were similar. In the resonance region, the RAO values are very sensitive to the damping levels. The results showed that the damping level from NK-UTWind, provided mainly by the drag coefficients in the Morison equations, was higher than in the experiments. The discretization in nodes, i.e., slices of circular cylinders of the footing region, see Figure 6a, could provide more damping than the experimented case, decreasing the RAO results’ peak value. NK-UTWind code obtained the RAO peak before 2.0 s due to the elastic response mode.
The numerical results from the WAMIT code agreed well with the experiments, and the trend of RAO curves was well represented in all cases. The non-linear behavior due to the elastic modes of the FOWT was not observed as in experiments and NK-UTWind simulations. The natural periods were consistently lower than the experimental and NK-UTWind ones due to the added mass calculated by the potential theory being lower than the real one. The lower added mass may be explained due to the complex footing region geometry and the pronounced detachment of the flow in plate edges, for example, as in the Plate and Semi-spheroid model. The high viscous damping value in heave plate configurations corroborated the previous statement.
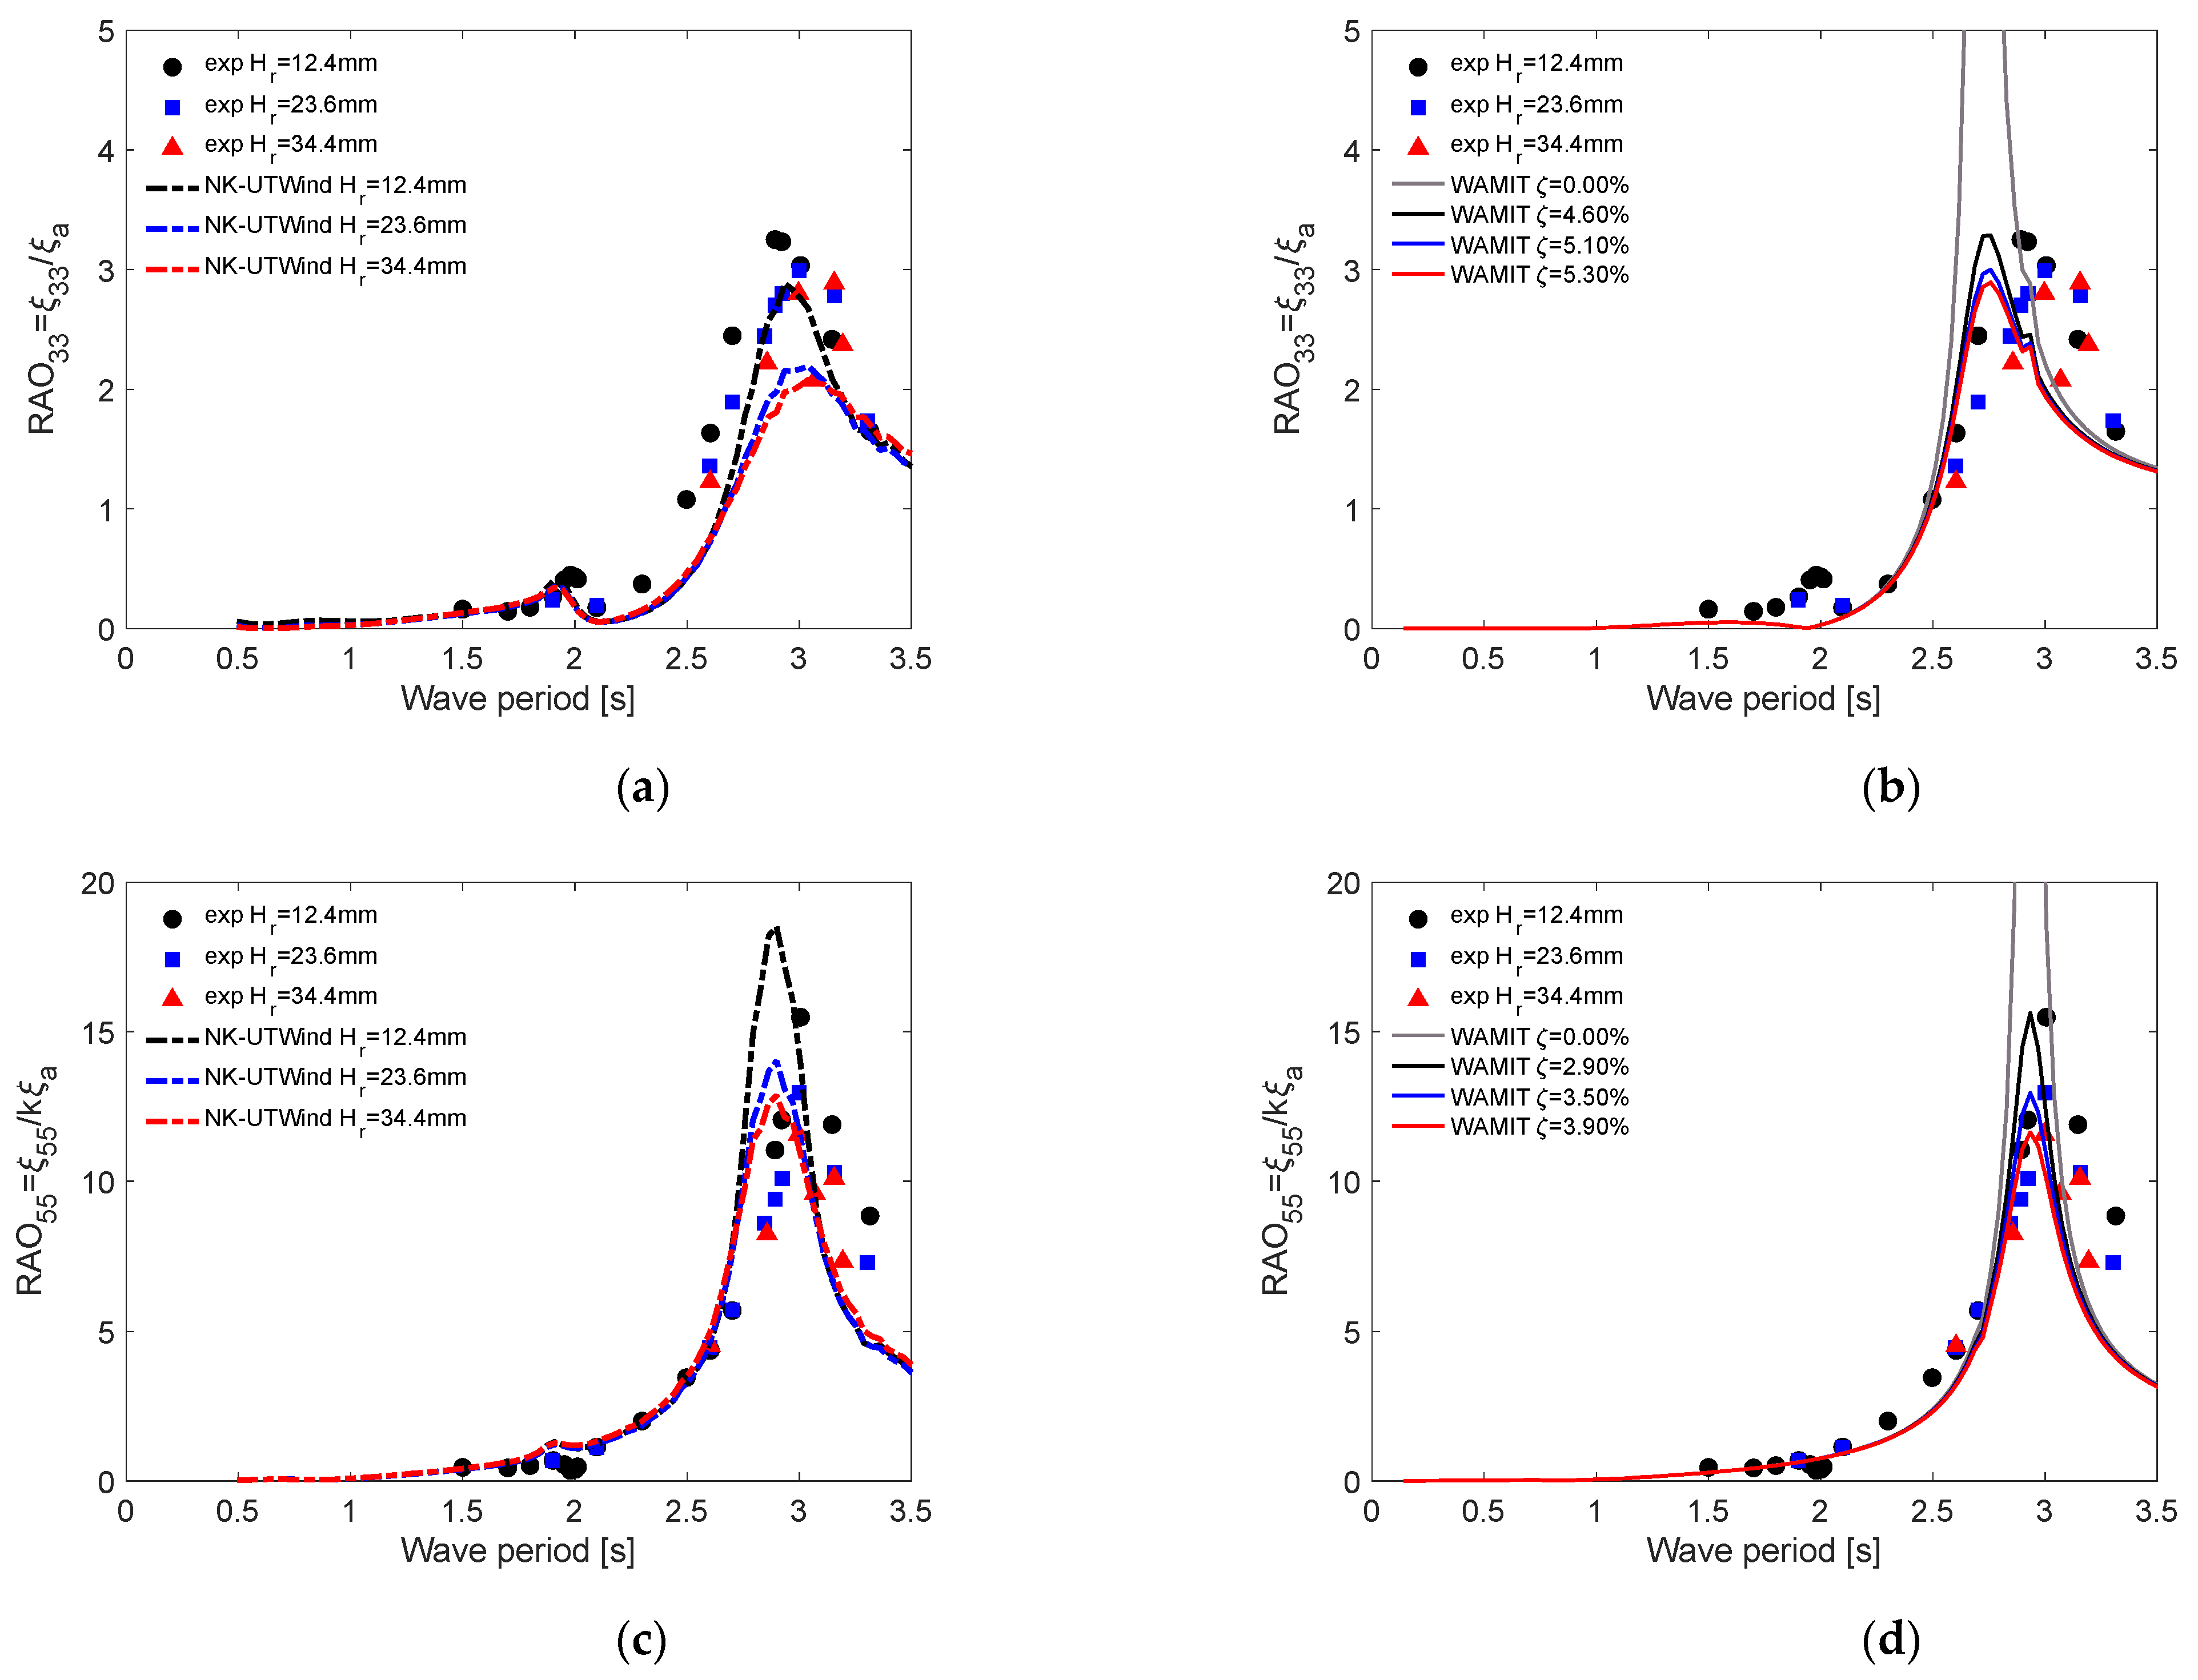
Figure 11a,c show the comparisons for the calculations using the NK-UTWind code, and Figure 11b,d show the comparative results for the numerical calculations by the WAMIT code for the Sphere model.
In the experimental RAO heave and pitch results for the Sphere model, high values of peak RAO were observed to be much larger than usual. The high values occurred because the damping level, see linear damping coefficients calibrated in WAMIT, was close to 1.0% of the critical value, thus lower than the typical values of 5% presented in offshore platforms, see [36]. The footing region as a sphere shape worked as planned and provided as less as possible damping to the system, and even in an increase of three times the wave height, the damping level ranged from 1.0% to 1.4%.
Figure 12a,c show the comparisons for the calculations using the NK-UTWind code, and Figure 12b,d show the comparative results for the numerical calculations by the WAMIT code for the Plate model.
In the experimental RAO heave and pitch results for the Plate model, lower values of peak RAO were observed than in the Sphere model. The lower values occurred because the damping level was close to 6.5% and 4.1% for heave and pitch motions, respectively. The footing region as a sphere with a plate worked as planned and provided a significant damping level of viscous damping to the system, i.e., around three times higher than the Sphere case.
Figure 13a,c show the comparisons for the calculations using the NK-UTWind code, and Figure 13b,d show the comparative results for numerical calculations by the WAMIT code for the Semi-spheroid model.
The Semi-sphere model was designed to have a larger added mass than the Sphere one; however, the damping level should be lower than the Plate one. The added mass was larger than in the Sphere model; see the larger natural periods, as expected. Moreover, lower values of damping levels, around 5.1% and 3.5% for the heave and pitch motions, respectively, than in the Plate model. The footing region as a semi-spheroid attached to the plate worked as planned and provided as much added mass as the Plate model, however, with a lower damping level.
Strain RAOs at the tower base and the deck, both around the Y axis, were presented to discuss the inner forces, as shown in Figure 14.
In Figure 14a,b, the RAO strain at the tower base and deck presented a peak around 2.5 s that corresponded to the natural period of pitch, which indicated that the bending strain due to the pitch motion of the nacelle was dominant in the bending of the tower, for the Sphere model. The NK-UTWind simulations showed a slight difference in the magnitude of the response, but it was underestimated compared to the experiment. The difference may be due to the more significant Rayleigh damping coefficients for the structural stiffness in the NK-UTWind simulations.
Figure 14c,d showed the RAO of strains for the Plate model at the tower base and deck around the Y axis, respectively.
For the RAO strain at the tower base, the peak around 2.7 s corresponded to the natural period of the pitch. The peak height was about 20% that of the Sphere model, which the lower response of pitch motion can explain. In NK-UTWind, a small peak was observed at the Eigen period of the elastic mode. However, the peak value was smaller in the experiment. At the deck, the period of the peak in the experiment corresponding to the Eigen period of the elastic mode, 1.78 s, and the NK-UTWind were in good agreement with the experiment.
Figure 14e,f show the RAO of strains for the Semi-spheroid model at the tower base and deck around the Y axis, respectively.
For strains at the tower base, the experiment had a peak around 2.95 s, the natural period of the pitch motion, which was in good agreement with the NK-UTWind simulations. As seen in the Plate model, the simulation shows a small peak at the Eigen period of the elastic mode. For the strain at the deck, the period of the peak in the experiment corresponds to the Eigen period of the elastic mode, 1.92 s, and NK-UTWind was also in good agreement with the experiment.

4.2.2. Influence of Heave Plates

This section intends to show the effects of the heave plate configurations on the hydrodynamic behavior of the FOWT; thus, the differences in added mass, damping, and RAO results will be presented. Only the results obtained from the medium regular wave height were utilized for natural periods and RAO comparisons. All the wave heights were also considered for linear damping to show the wave height effects.
Table 9 summarizes the results of natural periods obtained from the peak of the RAO results for the experiments and numerical simulations previously discussed. The difference between the experimental and numerical calculations was lower than 3% and 7% for the NK-UTWind and WAMIT codes, respectively. The increased added mass in the Plate and Semi-spheroid models for heave and pitch motions is apparent. The geometry of the heave plate added in the Plate model was responsible for the largest increase in the added mass. Moreover, a smaller increase in the added mass also occurred when adding the semi-spheroid geometry in the Semi-spheroid model.
Table 10 summarizes the results of the linear damping coefficients obtained from the WAMIT code RAO results previously discussed. Again, the linear damping for the Plate model was higher than for the Sphere one; the increase in damping was due to flow separation and vortex shedding at the edges of the plate. However, the damping for the Semi-spheroid model was lower than the Plate model and higher than the Sphere one; the attachment of the semi-spheroid geometry avoids an abrupt separation of the flow around the edges of the plate, thus decreasing the damping levels.
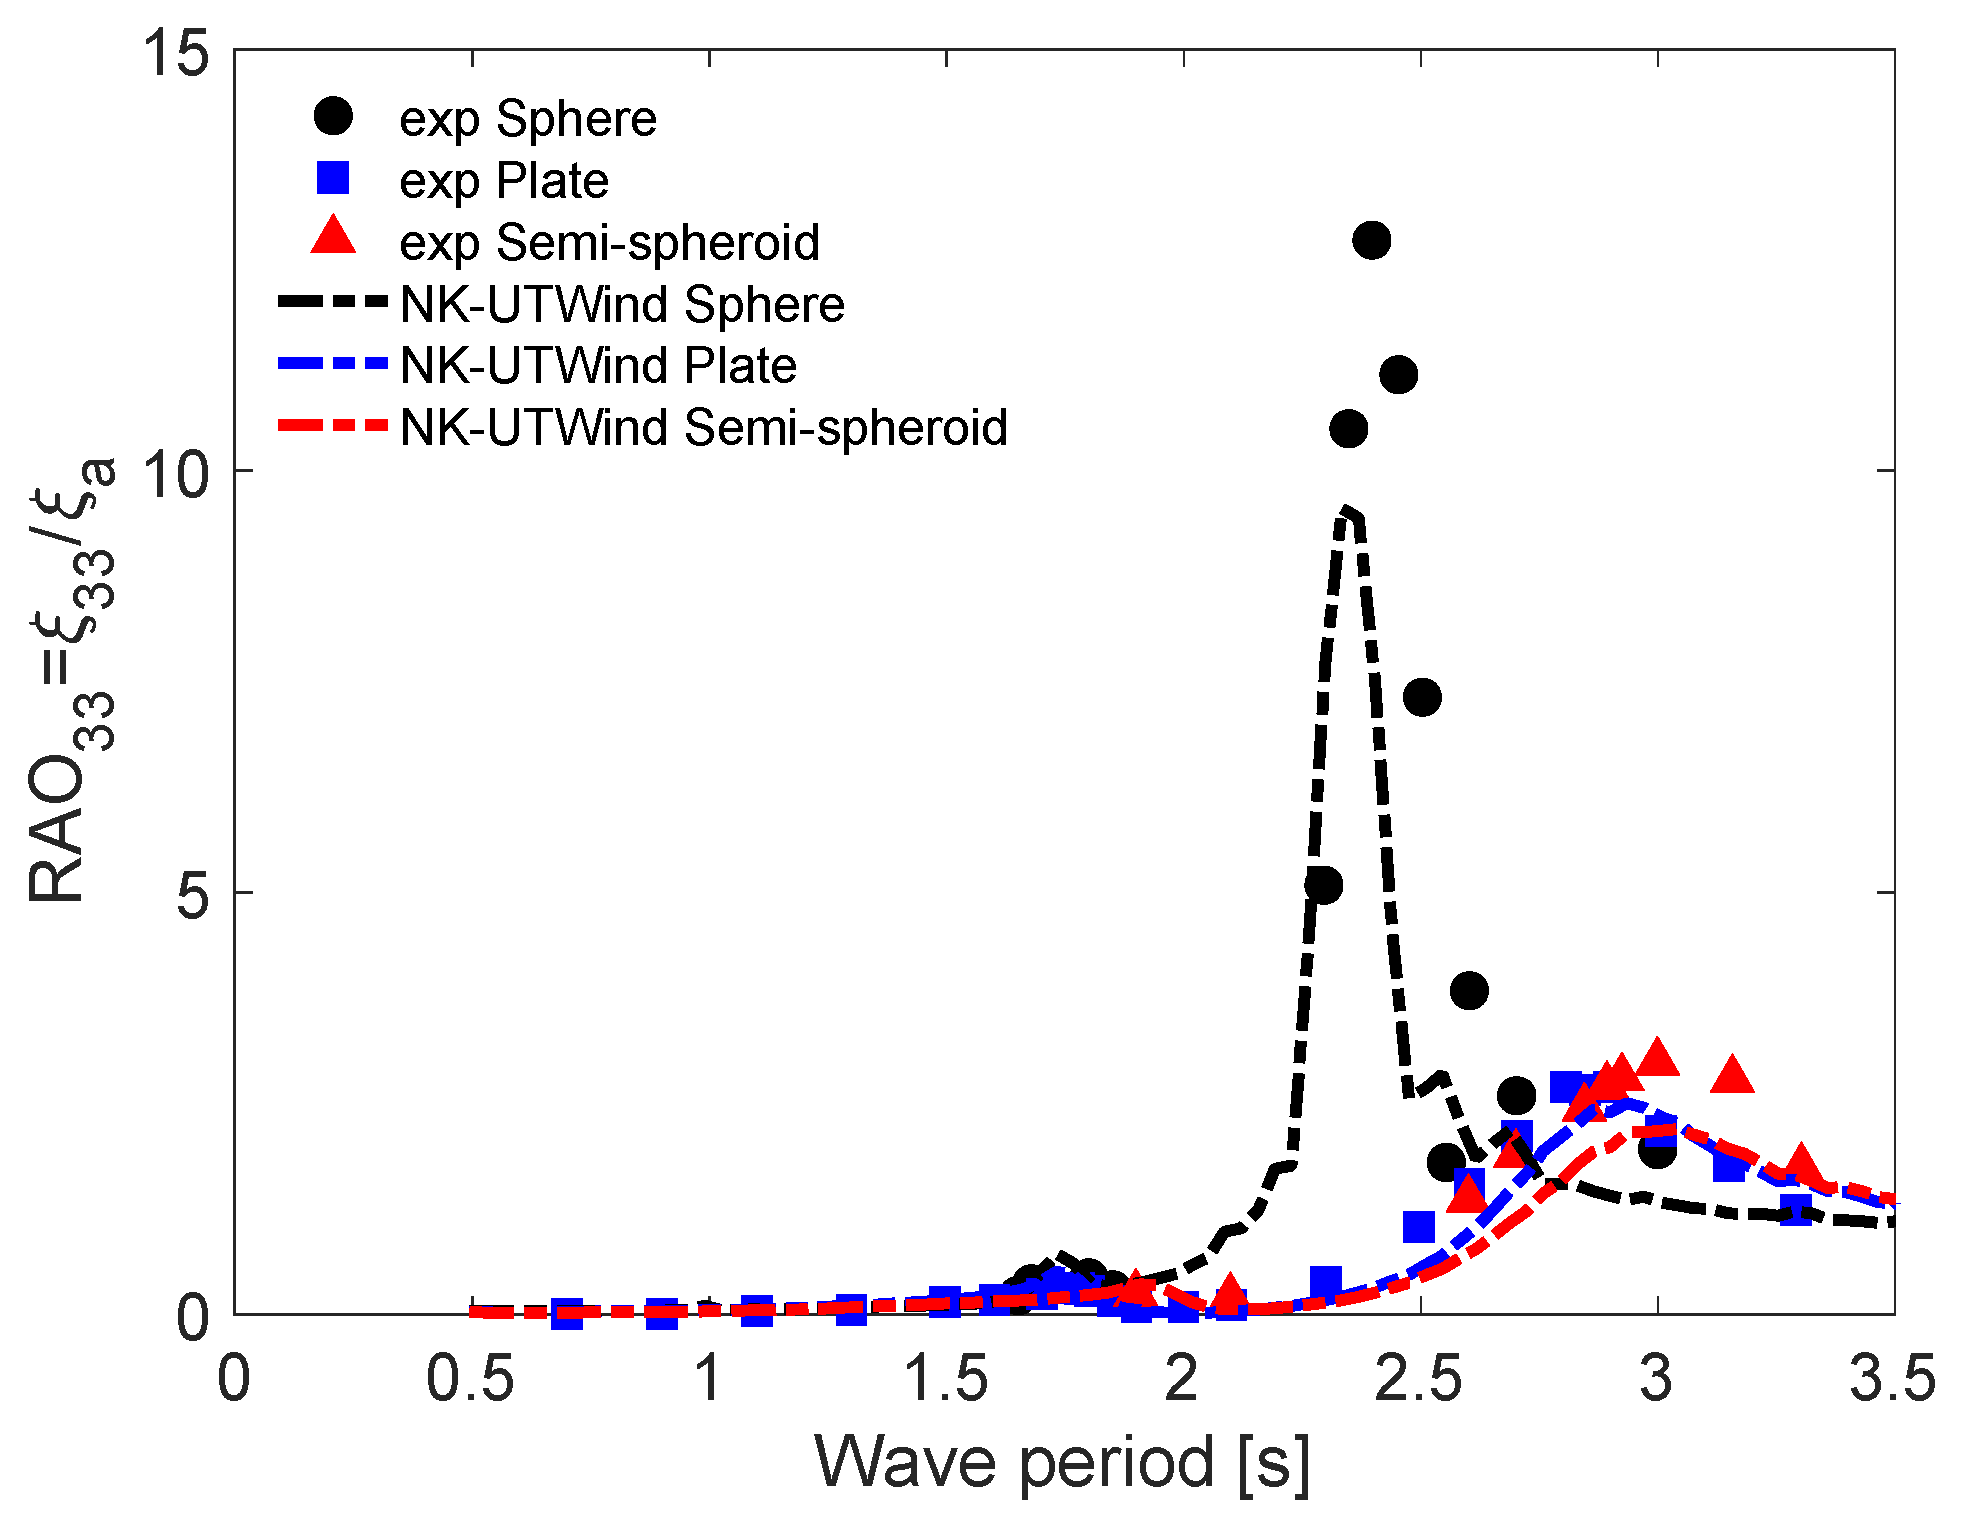
Figure 15 and Figure 16 consolidate the RAO motion results for medium wave height and different heave plate configurations for heave and pitch motions, respectively. In these results, it was possible to observe the effect of the heave plate on the response of the FOWT.
Although there were differences in the RAO results, as seen in Figure 15 and Figure 16, the heave plate configurations must be considered when designing a FOWT model. In addition, spectral analysis of the heave and pitch motions may result in significant amplitudes under an actual ocean environment. Therefore, a discussion can be undertaken to verify heave plate influence on the heave and pitch motions statistics under operational, storm, and centenary sea conditions. The three conditions were selected as the typical values encountered around the Japanese coast. The sea conditions are characterized by significant wave height, H s , and wave period of peak, T p , and are presented in Table 11.
The heave and pitch response spectrum for three different models and three different sea conditions were performed. For the wave spectrum, the ISSC spectrum, see [37], was considered as:
S w ( f ) = A f 5 e x p ( B f 4 )
where A = 0.1107 H s 2 f ¯ 4 , B = 0.4427 f ¯ 4 , f ¯ = 1.25 f p and f p is the peak frequency of the wave spectrum.
The power spectrum of heave and pitch motion response, S 33 ( f ) and S 55 ( f ) can be calculated as:
S 33 ( f ) = | R A O 33 ( f ) | 2 S w ( f )
S 55 ( f ) = | R A O 55 ( f ) | 2 S w ( f )
The variance in the heave motion in these wave conditions was estimated from the 0th moment of the heave response spectrum m 03 , and pitch response spectrum m 05   are calculated as:
m 03 =   S 33 ( f ) d f
m 05 =   S 55 ( f ) d f
Then, the significant response of heave and pitch are evaluated as 4 m 03 and 4 m 05 , respectively. These results for all the models are listed in Table 12.
In the former research [18], the flexible models showed a considerable heave response 1.8 times larger than the rigid ones. Based on this fact, assuming that the present flexible models were exposed to a real condition, as presented in Table 11, the spectral crossing results showed a significant height motion decrease of around 33% for the model with a heave plate for the operational condition. Moreover, the decline was about 66% for the storm and centenary conditions. Therefore, the spectral crossing results in Table 12 corroborate the importance of considering heave plates when designing multicolumn FOWTs.

5. Conclusions

In this research, a water tank experiment was carried out under regular waves using a flexible multicolumn FOWT model, and three different heave plate configurations were carried out. In addition, the model results of added mass, damping, and RAO were featured and compared with NK-UTWind and WAMIT code numerical calculations.
In investigating the heave plate effects on the motion response, it was possible to observe a significant impact on added mass and damping levels. For example, the attachment of the heave plate in the Sphere model footing increased the natural heave period by around 20% and the damping levels by four times. Moreover, the attachment of the semi-spheroid in the footing of the Plate model did not change the natural heave period; however, it decreased the damping level by around 15%. Similar behavior could be observed for pitch motion. Regarding the response in sea conditions, a decrease of 33% and 66% of the significant motion height (heave and pitch) was observed for operational and storm/centenary conditions, respectively.
The heave plate inclusion showed an effective way to modify the hydrodynamic coefficients (added mass and damping) of an FOWT. Moreover, the modification of the hydrodynamic coefficients was responsible for changing the response of the FOWT in waves, as summarized in the spectral crossing results. Thus, a correctly and detailed study of the design of a heave plate for FOWT is a good alternative for minimizing wave responses.
The NK-UTWind and WAMIT codes showed to be valuable tools for the preliminary design of FOWT. The NK-UTWind code can well represent the non-linearities due to the wave height, include the floater structural elastic behavior, and calculate the hydrodynamic behavior correctly for complex footing geometries. The WAMIT code can help compute the added mass coefficients and to calibrate the damping levels. Using both tools together, it is possible to obtain more reliable results than separately.
The following research must consider the construction limits of the FOWT and heave plates to propose possible geometries since the present study did not care about construction feasibility and only thought about fundamental studies in which the heave plate effects were pronounced to be better understood about other dimensions of the FOWT cases.

Author Contributions

Conceptualization, H.S., K.I. and S.O.; methodology, H.S., K.I., R.T.G. and M.T.; software, R.T.G., E.B.M. and T.T.; validation, R.T.G. and T.T.; formal analysis, R.T.G., E.B.M., M.T., K.H. and T.T.; investigation, R.T.G., M.T., K.H. and T.T.; resources, H.S. and K.I.; data curation, H.H., M.T., K.H. and T.T.; writing—original draft preparation, R.T.G. and T.T.; writing—review and editing, R.T.G., H.H. and T.T.; supervision, H.S., K.I. and R.T.G.; project administration, H.S. and M.T.; funding acquisition, H.S. and K.I. All authors have read and agreed to the published version of the manuscript.

Funding

This research is based on the results obtained from a project supported by New Energy and Industrial Technology Development Organization (NEDO), Japan.

Acknowledgments

The authors would like to thank Eng. Sakamoto, H. from Fractaly Co., Ltd., Japan, for model manufacturing and assembly, and Kato, T., the technical staff of the towing tank of UTokyo, for his technical support in conducting the experiments. The authors also would like to thank the student Marques, M. A. from the Federal University of Pernambuco (UFPE), Brazil, for his help during the image development.

Conflicts of Interest

The authors declare no conflict of interest.

Nomenclature

B center of floatation
B M metacentric radius [m]
[ C ] damping matrix
C D drag force coefficient
C m added mass coefficient
D diameter of column element [m]
E elastic modulus [Pa]
EIflexural rigidity [N·m2]
fwave frequency [Hz]
F a e r o aerodynamic force [N]
F b u o y a n c y restoring force [N]
F h y d r o hydrodynamic force [N]
F l i n e s mooring forces [N]
f p peak frequency of the wave spectrum [Hz]
f ¯ mean wave frequency [Hz]
G center of gravity
G M metacentric height [m]
H r regular wave height [m]
H s significant wave height
I moment of inertia of area [m4]
[ K ] structural stiffness matrix
K keel point
k spring constant [N/m]/wave number [1/m]
K B distance from the buoyance center to the keel point [m]
K G distance from the center of gravity to the keel point [m]
l 0 initial tension [N]
[ M ] mass matrix
M metacenter
R A O 33 ( f ) response amplitude operator of heave motion
R A O 55 ( f ) response amplitude operator of pitch motion
S 33 ( f ) power spectrum of heave motion response
S 55 ( f ) power spectrum of pitch motion response
S w ( f ) spectrum form
T 0 initial tension [N]
T ¯ mean wave period [s]
v fluid particle velocity [m/s]
v ˙ fluid particle acceleration [m/s]
x nodal displacement vector [m]
x 1 distance from the tower top [m]
x 3 distance from the tower top [m]
x ˙ nodal velocity vector [m/s]
x ¨ nodal acceleration vector [m/s2]
ζ 33 amplitude of the heave motion [m]
ζ 55 amplitude of the pitch motion [rad]
ζ a amplitude of wave [m]
λscale factor
ρfluid density [kg/m3]

Appendix A

Appendix A.1. Linear Damping

The most common way to determine viscous damping is through free decay tests. Equation of motions for the free decay tests, considering only the linear damping and no external forces, is a simplification of Equation (A1) as:
( M + A ) x ¨ + B 1 x ˙ + C x = 0
where the sum between B e x t and B P o t can be written as B 1 . This Equation is linear and can be written in a non-dimensional form as:
x ¨ + 2 ζ ω n x ˙ + ω n 2 x = 0
where ζ is a percentage of critical damping B c r i t ( ζ = B 1 / B c r i t ), and ω n is the natural frequency of the motion ( ω n = C / ( M + A ) ). Equation (A2) is linear, and its solution can be written as:
x = x 0 e ζ ω n t cos 1 ζ 2 ω n t
where x 0 is the initial condition of motion. An exponential fitted curve can be adjusted through amplitude peaks x k . Parameters a and b from exponential fit can be found as:
x = x 0 e ζ ω d t = a e b t
where ω d is the damped natural frequency obtained from the oscillations of free decay tests. Thus, natural frequency ω n can be written as:
ω n = ω d / 1 ζ 2

Appendix A.2. Quadratic Damping

The floating unit dynamic can present a non-linear behavior due to the damping forces. Studies have shown that the quadratic Equation (A6) is more appropriate to represent the viscous damping forces.
( M + A ) x ¨ + B 1 x ˙ + B 2 x ˙ | x ˙ | + C x = 0
or in another form as:
x ¨ + 2 ζ ω n x ˙ + B 2 M + A x ˙ | x ˙ | + ω n 2 x = 0
For evaluating term B 2 , first, the linearization of term x ˙ | x ˙ | is performed as follows:
x ˙ | x ˙ | = 8 3 π ω n x k ˙ x ˙ k
The linearization in Equation (A8) allows writing:
1 2 π ln x k 1 x k + 1 = ζ + 4 3 π B 2 ( M + A ) x k
Equation (A9) can be used to determine the values of ζ and B 2 . Details about this procedure can be found in [35].

References

  1. Sakamoto, N.; Yoshimura, Y. Demonstration research on NEDO offshore wind condition observation system and offshore wind power generation system offshore Kitakyushu City. Wind. Energy 2013, 37, 151–155. (In Japanese) [Google Scholar]
  2. Borisade, F.; Choisnet, T.; Cheng, P.W. Design study and full scale MBS-CFD simulation of the IDEOL floating offshore wind turbine foundation. J. Phys. Conf. Ser. 2016, 753, 092002. [Google Scholar] [CrossRef] [Green Version]
  3. Beyer, F.; Choisnet, T.; Kretschmer, M.; Cheng, P.W. Coupled MBS-CFD simulation of the IDEOL floating offshore wind turbine foundation compared to wave tank model test data. In Proceedings of the 25th International Ocean and Polar Engineering Conference (ISOPE), Kona, HI, USA, 21–26 June 2015. [Google Scholar]
  4. Kosasih, K.M.A.; Suzuki, H.; Niizato, H.; Okubo, S. Demonstration experiment and numerical simulation analysis of full-scale barge-type floating offshore wind turbine. J. Mar. Sci. Eng. 2020, 8, 880. [Google Scholar] [CrossRef]
  5. Pan, J.; Ishihara, T. Numerical prediction of hydrodynamic coefficients for a semi-submersible platform by using large eddy simulation with volume of fluid method and Richardson extrapolation. J. Phys. Conf. Ser. 2019, 1356, 012034. [Google Scholar] [CrossRef] [Green Version]
  6. Ishihara, T.; Zhang, S. Prediction of dynamic response of semi-submersible floating offshore wind turbine using augmented Morison’s Equation with frequency-dependent hydrodynamic coefficients. Renew. Energy 2019, 131, 1186–1207. [Google Scholar] [CrossRef]
  7. Ohta, M.; Komatsu, M.; Ito, H.; Kumamoto, H. Development of a V-shaped semi-submersible floating structure for 7MW offshore turbine. In Proceedings of the World NAOE Forum 2013 & International Symposium on Marine and Offshore Renewable Energy, Tokyo, Japan, 28–30 October 2013. [Google Scholar]
  8. Suzuki, H.; Shiohara, H.; Schnepf, A.; Houtani, H.; Carmo, L.H.S.; Hirabayashi, S.; Haneda, K.; Chujo, T.; Nihei, Y.; Malta, E.B.; et al. Wave and wind responses of a very-light FOWT with guy-wired-supported tower: Numerical and experimental studies. J. Mar. Sci. Eng. 2020, 8, 841. [Google Scholar] [CrossRef]
  9. Yoshimoto, H.; Natsume, T.; Sugino, J.; Kakuya, H.; Harries, R.; Alexandre, A.; McCowen, D. Validating numerical predictions of floating offshore wind turbine structural frequencies in bladed using measured data from Fukushima Hamakaze. In Proceedings of the EERA DeepWind 2019, Trondheim, Norway, 16–18 January 2019. [Google Scholar]
  10. Matsuoka, R.; Yoshimoto, H. Verification of precision concerning the design of advanced spar type structure. In Proceedings of the Japan Society of Naval Architects and Ocean Engineers 20, Kobe, Japan, 25–26 May 2015. [Google Scholar]
  11. Suzuki, H.; Sakai, Y.; Yoshimura, Y.; Houtani, H.; Carmo, L.H.S.; Yoshimoto, H.; Kamizawa, K.; Gonçalves, R.T. Non-Linear Motion Characteristics of a Shallow Draft Cylindrical Barge Type Floater for a FOWT in Waves. J. Mar. Sci. Eng. 2021, 9, 56. [Google Scholar] [CrossRef]
  12. Suzuki, H.; Xiong, J.; Carmo, L.H.S.; Vieira, D.P.; Mello, P.C.; Malta, E.B.; Simos, A.N.; Hirabayashi, S.; Gonçalves, R.T. Elastic response of a lightweight floating support structure of FOWT with guy wire supported tower. J. Mar. Sci. Technol. 2019, 24, 1015–1028. [Google Scholar] [CrossRef] [Green Version]
  13. Digital Solutions Bladed Engineering Feature Summary; DNVGL: Veritasveien, Norway, 2020.
  14. Jonkman, J.M.; Buhl, M.L., Jr. FAST User’s Guide Updated August 2005; National Renewable Energy Lab. (NREL): Golden, CO, USA, 2005. [Google Scholar]
  15. Suzuki, H.; Shibata, H.; Fujioka, H.; Hirabayashi, S.; Ishii, K.; Kikuchi, H. Development of an analysis code of rotor-floater coupled response of a floating offshore wind turbine. In Proceedings of the ASME 32nd International Conference on Ocean, Offshore and Arctic Engineering, Nantes, France, 9–14 June 2013. [Google Scholar]
  16. Chen, P.; Chen, J.; Hu, Z. Review of Experimental-Numerical Methodologies and challenges for Floating Offshore Wind Turbines. J. Mar. Sci. Appl. 2020, 19, 350–352. [Google Scholar] [CrossRef]
  17. Mohammed, K.A.; Meyer, N. Flexible multibody dynamic modeling of a floating wind turbine. Int. J. Mech. Sci. 2018, 142–143, 518–520. [Google Scholar]
  18. Takata, T.; Takaoka, M.; Gonçalves, R.T.; Houtani, H.; Yoshimura, Y.; Hara, K.; Oh, S.; Dotta, R.; Malta, E.B.; Iijima, K.; et al. Dynamic Behavior of a Flexible Multicolumn FOWT in Regular Waves. J. Mar. Sci. Eng. 2021, 9, 124. [Google Scholar] [CrossRef]
  19. Inoue, T.; Adilah, A.; Iijima, K.; Oh, S.; Suzuki, H. Discussion on coupling effect in structural load of FOWT for condensing wind and wave bins for spectral fatigue analysis. J. Mar. Sci. Eng. 2020, 8, 937. [Google Scholar] [CrossRef]
  20. Souza, C.E.S.; Bachynski, E.E. Effectis of Hull Flexibility on the Structural Dynamics of a Tension Leg Platform Floating Wind Turbine. J. Offshore Mech. Arct. Eng. 2020, 142, 011903. [Google Scholar] [CrossRef]
  21. Iwamatsu, S.; Suzuki, H.; Nihei, Y. Study on Elastic Response of Double-Roter VAWTs. J. Mar. Sci. Eng. 2022, 10, 1400. [Google Scholar] [CrossRef]
  22. Mello, P.C.; Malta, E.B.; Silva, R.O.P.; Candido, M.H.O.; Carmo, L.H.S.; Alberto, I.F.; Franzini, G.R.; Simos, A.N.; Suzuki, H.; Gonçalves, R.T. Influence of heave plates on the dynamics of a floating offshore wind turbine in waves. J. Mar. Sci. Technol. 2021, 26, 190–200. [Google Scholar] [CrossRef]
  23. Pavon, C.L.; Iglesias, S.I. Hydrodynamic coefficients and pressure loads on heave plates for semi-submersible floating offshore wind turbines: A comparative analysis using large scale models. Renew. Energy 2015, 81, 864–881. [Google Scholar] [CrossRef]
  24. Rao, M.J.; Nallayarasu, S.; Bhattacharyya, S.K. Numerical and experimental studies of heave damping and added mass of spar with heave plates using forced oscillation. Appl. Ocean. Res. 2021, 111, 19. [Google Scholar] [CrossRef]
  25. Thiagarajan, K.; Moreno, J. Wave Induced Effects on the Hydrodynamic Coefficients of an Oscillating Heave Plate in Offshore Wind Turbines. J. Mar. Sci. Eng. 2020, 8, 622. [Google Scholar] [CrossRef]
  26. Jiang, Y.; Hu, G.; Zong, Z.; Zou, L.; Jin, G. Influence of an Integral Heave Plate on the Dynamic Response of Floating Offshore Wind Turbine Under Operational and Storm Conditions. Energies 2020, 13, 6122. [Google Scholar] [CrossRef]
  27. Gonçalves, R.T.; Silva, R.O.P.; Marques, M.A.; Hirabayashi, S.; Assi, G.R.S.; Simos, A.N.; Suzuki, H. Experimental study on vortex-induced motions of floating circular single cylinders with low aspect ratio and different have plate geometries. In Proceedings of the 30th International Ocean and Polar Engineering Conference, Shanghai, China, 11–16 October 2020. [Google Scholar]
  28. Gonçalves, R.T.; Malta, E.B.; Simos, A.N.; Hirabayashi, S.; Suzuki, H. Experimental study of the effect of heave plate dimension on the flow-induced motions (FIM) of a multicolumn floating offshore wind turbine (FOWT). In Proceedings of the ASME 41st International Conference on Ocean, Offshore and Arctic Engineering, Hamburg, Germany, 5–10 June 2022. [Google Scholar]
  29. WAMIT® User Manual, version 7.3; WAMIT, Inc.: Chestnut Hill, MA, USA, 2019.
  30. Sarpkaya, T.S. Wave Forces on Offshore Structures; Cambridge University Press: Cambridge, UK, 2014. [Google Scholar]
  31. Wheeler, J.D. Method for calculating forces produced by irregular waves. J. Pet. Technol. 1970, 22, 359–367. [Google Scholar] [CrossRef]
  32. Veritas, D.N. Recommended Practice DNV-RP-C205 (Environmental Conditions and Environmental Loads); DNV: Byrum, Norway, 2010. [Google Scholar]
  33. Pesce, C.P.; Amaral, G.A.; Franzini, G.R. Mooring system stiffness: A general analytical formulation with an application to floating offshore wind turbines. In Proceedings of the ASME 1st International Offshore Wind Technical Conference, San Francisco, CA, USA, 4–7 November 2018. [Google Scholar]
  34. Amaral, G.A.; Mello, P.C.; Carmo, L.H.S.; Alberto, I.F.; Malta, E.B.; Simos, A.N.; Franzini, G.R.; Suzuki, H.; Gonçalves, R.T. Seakeeping tests of a FOWT in wind and waves: An analysis of dynamic coupling effects and their impact on the predictions of pitch motion response. J. Mar. Sci. Eng. 2021, 9, 179. [Google Scholar] [CrossRef]
  35. Chakrabarti, S.K. Offshore Structure Modeling, Advanced Series on Ocean Engineering; World Scientific: Singapore, 1994; Volume 9, pp. 445–450. [Google Scholar]
  36. Malta, E.B.; Gonçalves, R.T.; Matsumoto, F.T.; Pereira, F.R.; Fujarra, A.L.C.; Nishimoto, K. Damping coefficient analyses for floating offshore structures. In Proceedings of the ASME 2010 29th International Conference of Offshore Mechanics and Arctic engineering, Shanghai, China, 6–11 June 2010. [Google Scholar]
  37. Stansberg, C.T.; Contento, G.; Seok, W.H.; Irani, M.; Ishida, S.; Mercier, M.; Wang, Y.; Wolfram, J.; Chaplin, J.; David, K. The Specialist Committee on Waves Final Report and Recommendations to the 23rd ITTC. Proc. 23rd ITTC 2002, 2, 505–736. [Google Scholar]
Figure 1. Main dimensions of the reduced scale model, basic case Sphere Model.
Energies 15 07605 g001
Figure 2. Picture of the Sphere Model.
Energies 15 07605 g002
Figure 3. Three types of footing design (a) Sphere, (b) Plate, and (c) Semi-Spheroid models.
Energies 15 07605 g003
Figure 4. Experimental setup: (a) top view of the experimental setup in the towing tank; (b) details of the top view of the mooring line settings.
Energies 15 07605 g004
Figure 5. Location of the strain gauges on the experimental model.
Energies 15 07605 g005
Figure 6. Mesh and nodes considered for each model in the NK-UTWind code analysis: (a) Sphere, (b) Plate, and (c) Semi-Spheroid models.
Energies 15 07605 g006
Figure 7. Modeling consideration details of footings for each model in the NK-UTWind code analysis: (a) Sphere, (b) Plate, and (c) Semi-Spheroid models.
Energies 15 07605 g007
Figure 8. View of the WAMIT code models with high-order meshes and mooring setup in EDTools®: (a) Sphere, (b) Plate, and (c) Semi-Spheroid models.
Energies 15 07605 g008
Figure 9. Time series fitted by different damping coefficients for an experimental heave free decay test in still water.
Energies 15 07605 g009
Figure 10. Schematic of the elastic response mode before the 2.0 s wave period [18].
Energies 15 07605 g010
Figure 11. Response amplitude operator (RAO) result comparisons between the experiment and numerical calculations for the Sphere model and different wave heights: (a) heave, NK-UTWind, (b) heave, WAMIT, (c) pitch, NK-UTWind, and (d) pitch, WAMIT code calculations.
Energies 15 07605 g011
Figure 12. Response amplitude operator (RAO) result comparisons between the experiment and numerical calculations for the Plate model and different wave heights: (a) heave, NK-UTWind, (b) heave, WAMIT, (c) pitch, NK-UTWind, and (d) pitch, WAMIT code calculations.
Energies 15 07605 g012
Figure 13. Response amplitude operator (RAO) result comparisons between the experiment and numerical calculations for the Semi-spheroid model and different wave heights: (a) heave, NK-UTWind, (b) heave, WAMIT, (c) pitch, NK-UTWind, and (d) pitch, WAMIT code calculations.
Energies 15 07605 g013
Figure 14. Response amplitude operator (RAO) strain result comparisons between the experiment and NK-UTWind numerical calculations and different wave heights for strain around the Y-axis at the tower base: (a) Sphere, (c) Plate, and (e) Semi-spheroid models; and for strain around the Y-axis at the deck: (b) Sphere, (d) Plate, and (f) Semi-spheroid models.
Energies 15 07605 g014
Figure 15. Response amplitude operator (RAO) heave motion comparisons between the experiment and NK-UTWind numerical calculations for medium wave height and different heave plate configurations.
Energies 15 07605 g015
Figure 16. Response amplitude operator (RAO) pitch motion comparisons between the experiment and NK-UTWind numerical calculations for medium wave height and different heave plate configurations.
Energies 15 07605 g016
Table 1. Scale factors using Froude scaling.
CharacteristicScale Factor
length [m] λ
time [s] λ 1 2
force [N] λ 3
mass [kg] λ 3
flexural rigidity E I [N·m2] λ 5
Table 2. Main properties of the floater.
CharacteristicSphere ModelPlate ModelSemi-Spheroid Model
total mass [kg]109.1111.4125.3
KG [mm]308312469
GM [mm]162138154
draft [mm]9159101123
I X X = I Y Y [kg·m2]22.222.525.7
Table 3. Regular wave characteristics for the different models.
Sphere ModelPlate ModelSemi-Spheroid Model
Wave LevelWave Height [mm]Wave Period [s]Wave Height [mm]Wave Period [s]Wave Height [mm]Wave Period [s]
Small11.80.7~3.3--12.41.5~3.3
Medium21.91.6~3.018.60.7~3.323.61.9~3.3
Large31.81.6~2.429.21.7~3.134.42.6~3.2
Table 4. Natural periods, T n , were obtained from free decay tests in still water.
Degree of FreedomModelExperiment [s]NK-UTWind [s]Difference
SurgeSphere33.0033.702%
Plate33.5034.904%
Semi-spheroid35.1033.40−5%
HeaveSphere2.392.36−1%
Plate2.742.844%
Semi-spheroid2.792.873%
PitchSphere2.542.51−1%
Plate2.752.802%
Semi-spheroid2.952.87−3%
Table 5. Added mass coefficients, C a , obtained from free decay tests in still water.
Degree of FreedomModelExperimentNK-UTWindDifference
SurgeSphere0.820.9010%
Plate0.840.9919%
Semi-spheroid0.790.62−21%
HeaveSphere0.240.21−13%
Plate0.590.7120%
Semi-spheroid0.470.5618%
PitchSphere0.280.25−11%
Plate0.280.3317%
Semi-spheroid0.620.54−14%
Table 6. Linear damping coefficients obtained from free decay tests ζ [%].
Degree of FreedomModelExperimentNK-UTWindDifference
SurgeSphere6.14 ± 0.355.96−3%
Plate3.78 ± 0.409.93163%
Semi-spheroid2.52 ± 0.109.12262%
HeaveSphere0.96 ± 0.040.20−79%
Plate1.95 ± 0.091.66−15%
Semi-spheroid2.04 ± 0.192.2711%
PitchSphere1.13 ± 0.060.18−84%
Plate1.77 ± 0.191.54−13%
Semi-spheroid1.15 ± 0.081.3517%
Table 7. Quadratic damping coefficients obtained from free decay tests, b 2 / M , assuming ζ = 0 .
Degree of FreedomModelExperimentNK-UTWindDifference
SurgeSphere2.04 ± 0.191.80−12%
Plate2.62 ± 0.222.12−19%
Semi-spheroid1.42 ± 0.101.6315%
HeaveSphere0.53 ± 0.040.51−4%
Plate7.02 ± 0.176.91−2%
Semi-spheroid7.74 ± 0.277.54−3%
PitchSphere0.85 ± 0.130.20−76%
Plate3.70 ± 0.101.01−73%
Semi-spheroid3.56 ± 0.111.25−65%
Table 8. The most energetic vibration mode obtained from the hammering test.
ModelExperiment [s]NK-UTWind [s]Difference
Sphere 1.701.700%
Plate 1.781.73−3%
Semi-spheroid1.921.91−1%
Table 9. Natural periods obtained from a peak of RAO result for medium regular wave height conditions.
Degree of FreedomModelExperiment [s]NK-UTWind [s]DifferenceWAMIT [s]Difference
HeaveSphere2.412.37−2%2.30−5%
Plate2.852.933%2.67−7%
Semi-spheroid2.902.931%2.72−7%
PitchSphere2.552.51−2%2.53−1%
Plate2.812.79−1%2.800%
Semi-spheroid3.002.90−3%2.96−1%
Table 10. Linear damping coefficients obtained from WAMIT code RAO results, ζ [%].
Degree of FreedomModelSmall Wave HeightMedium Wave HeightLarge Wave Height
HeaveSphere1.041.201.35
Plate-5.906.80
Semi-spheroid4.605.103.30
PitchSphere1.051.30-
Plate-4.004.30
Semi-spheroid2.903.503.90
Table 11. Sea conditions characterized by an ISSC spectrum.
ScaleSea Condition T p   [ s ] H s
Model scaleOperational1.2750.0 mm
Storm1.91192.0 mm
Centenary2.2880.0 mm
Full scaleOperational9.02.5 m
Storm13.59.6 m
Centenary16.14.0 m
Table 12. In the model scale, the significant height of spectral crossing results in heave and pitch motions, H 33 [mm] and H 55 [degree].
Degree of FreedomModelOperationalStormCentenary
HeaveSphere6.641.623.2
Plate5.86.76.7
Semi-spheroid4.05.45.4
PitchSphere1.332.020.0
Plate0.99.67.2
Semi-spheroid0.98.56.4
Publisher’s Note: MDPI stays neutral with regard to jurisdictional claims in published maps and institutional affiliations.

