Review

Green Hydrogen Production Technologies from Ammonia Cracking

by
Hossein Ali Yousefi Rizi
1 and
Donghoon Shin
2,*
1
School of Mechanical and Automotive Engineering, Kookmin University, Seoul 02707, Korea
2
Department of Mechanical Engineering, Kookmin University, Seoul 02707, Korea
*
Author to whom correspondence should be addressed.
Energies 2022, 15(21), 8246; https://doi.org/10.3390/en15218246
Submission received: 30 September 2022 / Revised: 21 October 2022 / Accepted: 25 October 2022 / Published: 4 November 2022

Abstract

:
The rising technology of green hydrogen supply systems is expected to be on the horizon. Hydrogen is a clean and renewable energy source with the highest energy content by weight among the fuels and contains about six times more energy than ammonia. Meanwhile, ammonia is the most popular substance as a green hydrogen carrier because it does not carry carbon, and the total hydrogen content of ammonia is higher than other fuels and is thus suitable to convert to hydrogen. There are several pathways for hydrogen production. The considered aspects herein include hydrogen production technologies, pathways based on the raw material and energy sources, and different scales. Hydrogen can be produced from ammonia through several technologies, such as electrochemical, photocatalytic and thermochemical processes, that can be used at production plants and fueling stations, taking into consideration the conversion efficiency, reactors, catalysts and their related economics. The commercial process is conducted by using expensive Ru catalysts in the ammonia converting process but is considered to be replaced by other materials such as Ni, Co, La, and other perovskite catalysts, which have high commercial potential with equivalent activity for extracting hydrogen from ammonia. For successful engraftment of ammonia to hydrogen technology into industry, integration with green technologies and economic methods, as well as safety aspects, should be carried out.

1. Introduction

Hydrogen is a clean fuel and energy carrier playing an important role in a sustainable energy future. When consumed in a fuel cell, the energy content is converted with high efficiency on demand and produces water. Hydrogen can easily integrate into the existing natural gas network with minimal modification but lacks a wide infrastructure, making its storage and transport difficult and expensive [1]. Hydrogen technology for transition to a hydrogen-based economy requires supplying clean and renewable energy and capture of CO2 from current fossil hydrogen production. The ammonia and hydrogen industry has the potential to make significant contributions to global economies with the possibility of using ammonia and hydrogen as fuels [2].
This review study aims to confirm the direction of commercialization by increasing ammonia to hydrogen production systems in the future by examining the trends of the latest technologies of ammonia cracking, hydrogen separation and purification as a clean fuel and source of energy without emitting greenhouse gases. The conversion technology of ammonia to hydrogen considers the feedstock, decomposition methods, emissions, and energy efficiency, as well as reactors and catalyst materials, with a focus on ammonia cracking.
This paper provides a brief and comprehensive view of hydrogen production from ammonia and is organized as follows: In the first section, significant literature related to the hydrogen industry outlook is reviewed. In Section 2, hydrogen properties, production, sources, and pathways are defined. Then, Section 3 is a brief look at ammonia production technologies. Section 4 discusses hydrogen production technologies, thermal and thermochemical cracking, and reactor technology. Section 5 reviews catalyst characterization, activity and performance. Section 6 is a brief look at other ammonia decomposition methods and also the separation and purification systems processes.

1.1. International Hydrogen Market Size

There are diverse applications of hydrogen being recognized worldwide. Therefore, its demand and use are increasing across a wide range, with the potential for significant contribution to clean energy transitions. The demand for hydrogen has increased linearly in the past. The various applications of hydrogen as a feedstock and fuel. In the chemical industry hydrogen is used for oil refining and the production of ammonia, methanol, fertilizers, in food and pharmaceutical production, metal manufacturing, and low-carbon emission steel [2,3]. Also used as fuel to produce electricity in fuel cells, and is being adopted as a sustainable fuel for power generation in the building and transport sectors in the future [2,3].
The annual global demand for hydrogen (in megatons) as a fuel, based on sectors such as oil refining, industry, transport, power, ammonia fuel, synfuels, buildings, and electric grid injection, is represented in Table 1, and Figure 1 shows the expected hydrogen demands (%) in some sectors compared to other fuels. In the EU, expected demands will exceed more than 100 million tons by 2050 (Figure 2). Hydrogen being produced based on carbon capture, utilization and storage (CCUS) technology, is expected to reach net-zero emissions by 2050 [4]. Hydrogen demand growth in new sectors, as expected in the EU, will exceed more than 100 million tons by 2050 (Figure 2). Thus, industries are interested in research on large-scale hydrogen projects in several regions [5].
The potential global market for hydrogen technology is expected to reach USD 2.5 trillion [6]. Annual power generation from fuel cells has increased 15-fold since 2015, now exceeding 1 gigawatt (1 GW) [7]. For example, the US hydrogen economy is expected to generate approximately USD 750 billion in annual sales and 3.4 million cumulative jobs by 2050 [7]. However, there is limited information available about the economic competitiveness of hydrogen system configurations [8,9].
Figure 2. Hydrogen prospects of the different industrial sectors in the EU, (a) current usage of hydrogen, (b) expected hydrogen demand. * excluding potential of hydrogen in enabling renewable energy and in heating for build gas. Reprinted with permission [10].
Energies 15 08246 g002

1.2. Hydrogen Industry Outlook

To move toward a low-carbon economy, hydrogen as an energy vector can play a significant role in clean energy transitions, such as the release of stored chemical energy that produces power while eliminating greenhouse gas (GHG) emissions. The utilization of hydrogen in the power, building and transportation sectors for eco-friendly energy production can decrease the environmental impact of emissions. Furthermore, it can be used as a marine energy source, which is cheaper than ammonia for marine transportation [10,11].
Hydrogen technology has the technical feasibility, sufficient capacity, and potential to participate in the electric power sector, as it can be stored and used for producing several gigawatts per hour, enabling electrical grid stability to meet the varying demands of different energy sectors. It can increase the utilization of generators, including nuclear, coal, natural gas and renewables. In conjunction with fuel cells or combustion-based technologies, it enables zero or near-zero emissions in transportation, stationary or remote power, and portable power applications. There is also a growing interest in hydrogen fuel cells in the aviation industry instead of heavy batteries [4,8,12,13,14].
The energy required to provide heating, cooling, drying, power, and fresh water to buildings is mainly provided by fossil fuels and traditional power plants and is higher than the transportation sector, with significant CO2 emissions associated. Hydrogen can effectively provide the energy demand of buildings in a reliable, safe, and economical way to reduce the global warming trend [1]. Moreover, hydrogen-powered vehicles that were developed as a policy action to move toward a low-carbon economy are currently using gray hydrogen [15,16]. There are some challenges in the transition from fossil-based to renewable energy sources; for example, among carbon-free energy carriers, water, wind, and solar are limited by geographical conditions, and produced hydrogen, needs to be compressed, and liquified, then requires special delivery and storage systems [12,17].
The development of hydrogen as a major carbon-free energy source is a common goal pursued by many countries to deal with the global warming trend. Hydrogen is the most feasible energy carrier for future energy systems, as shown in Figure 3 [18,19]. The promotion of clean technologies for the production of clean hydrogen and hydrogen-based fuels reflected in the Net Zero Emissions Scenario in 2021–2050 will reduce 60 Gt of CO2 emissions, which is about 6% of the total cumulative emissions reduction [20,21]. Promoting eco-friendly hydrogen production and usage is necessary to reduce greenhouse gas (GHG) emissions [3], which needs a demand generation strategy, greater efforts for new applications, quality improvement of hydrogen production infrastructure, transitional energy process capacity, reduced associated emissions and improved cost-effectiveness of hydrogen production [22].

2. Hydrogen Source, Production Pathways, Technology, and Energy Efficiency

Hydrogen production can be considered from the view of feedstocks, energy sources, pathways, and technology.

2.1. Properties of Hydrogen

Hydrogen is a renewable, non-toxic, and carbon-free fuel that is expected to contribute significantly to air quality improvement. Its properties are compared with ammonia and other hydrocarbon fuels in Table 2 and Figure 4 [23,24].
Hydrogen can be compressed at about 350 to 700 bar, liquefied at a low boiling point of −253 °C, or stored on the surface or within a solid. However, the current storage of hydrogen is difficult, energy-intensive and expensive compared to the storage of ammonia due to its high volatility, very low density and need for high pressure [18].
Hydrogen combustion with oxygen only emits water, while ammonia combustion produces NOX, owing to the fuel NOX process. The energy required to initiate hydrogen combustion is much lower than that required for other common fuels, which makes it easy to ignite. It has a very wide flammability range (between 4% and 75% in air) compared to other fuels and a high combustion heat (3.37 MJ/kg). However, at low concentrations of hydrogen in air, the energy required to initiate combustion is similar to that of other fuels [25,26]. Low volumetric energy density, low flash point, and a large diffusion coefficient are the defects of hydrogen with regard to fuel utilization. The auto-ignition temperature of hydrogen (585 °C) is similar to natural gas, which is higher than the gasoline vapor. Its lower heating value is 9.9 (MJ/m3), which is much higher than ammonia [23,24,27,28]. Hydrogen has a faster rate of combustion and a higher level of heat generation compared to ammonia and other fuels. Thus, it can be used in conventional combustion systems with a few changes to the combustion system (engines, furnaces or gas turbines) design [18].
Hydrogen energy can be optimized through electrochemical processes such as fuel cells and hybrid renewable energy systems to obtain the most economical low cost energy [29,30,31].
Figure 4. Hydrogen properties, (a) volumetric and gravimetric density of hydrogen, (b) specific energy density compared to other fuels. Reprinted with permission [27,28].
Energies 15 08246 g004

2.2. Hydrogen Production Sources and Pathways

Hydrogen can be produced from renewable or non-renewable natural feedstocks and energy sources through several pathways of various types, as shown in Figure 5. Green hydrogen is obtained from renewable feedstocks and sustainable energy sources, such as water, wind and solar power, without any harmful gases during production processes and use. Moreover, green hydrogen can be a sustainable and secure energy, and the required power for this process is generated by clean electricity. However, this type of hydrogen is the ultimate goal of climate-promoting but yet is not practical [15,32,33]. Blue hydrogen is produced from non-renewable resources (such as fossil fuels, hydrocarbons, and nuclear sources) and renewables. It is a low-carbon hydrogen and needs a process by which carbon is captured and stored [3,15,16,22,33]. Gray hydrogen is produced from coal, heavy oil, and naphtha feedstocks with high carbon-to-hydrogen ratios by a conventional gasification process that requires pure oxygen or steam to react with the feedstocks and produce a mixture of CO and hydrogen in the ratio range of 1.6–1.8 at a high temperature [34].

2.3. Hydrogen Production Technology

Hydrogen can be produced through a variety of technologies, such as thermochemical, radiochemical, electrochemical, photochemical, and biochemical, and integrated systems, such as electrothermochemical processes. Figure 6 represents different hydrogen production technologies in terms of the energy sources [3,15,26,30,34,35].

2.3.1. Thermochemical Process

Thermochemical technologies, are the main form of commercial hydrogen production, involve high-temperature processes, including reforming (steam, partial oxidation, autothermal, plasma and water phase) and pyrolysis. They need additional hydrogen separation and purification units to provide a high purity of hydrogen [12,17]. As shown in Figure 7, the main resources of commercial hydrogen production are 48% from natural gas, 30% from petroleum reforming, 18% from coal gasification and 4% from electrolysis and renewable energy sources [36,37]. In addition to biomass gasification and solar thermochemical hydrogen production, it can be produced as a by-product of some other hydrocarbon processes, such as steam cracking of natural gas liquids to obtain light olefins and other co-products, which can produce 3.5 Mt/year of H2. However, most of them are low energy efficiency, expensive, and require carbon capture [26,38].
Thermochemical technologies for hydrogen production can be classified based on efficiency, temperature, and feedstock requirement, as shown in Table 3 [34,39,40]. The three methods of hydrogen production are including, reacting natural gas with steam at high pressure and temperature, such as steam methane reforming (SMR), reacting natural gas with oxygen and steam, such as auto-thermal reforming (ATR), and reacting natural gas with quantities of air and pure oxygen less than the stoichiometric amounts, such as partial oxidation of methane (POM) technologies. A comparison of their efficiencies and reaction temperatures shows that POM has the lowest efficiency compared to ATR, and SMR has the highest efficiency. Accordingly, SMR is the commonly accepted method of generating hydrogen [34,39,40].

2.3.2. Electrochemical and Photolytic Process

Electrochemical methods that use electricity to produce hydrogen at near-ambient temperatures and pressures without any requirement of a purification system, such as water electrolysis, have high conversion rates. Water electrolysis is one of the main technologies for generating highly pure hydrogen that can provide a sustainable clean hydrogen process. Producing 1 ton of hydrogen requires 9 tons of continuous supply of pretreated water with about 50 MWh of electric power for operation. Meanwhile, the electrolyzer, operated most often in base load mode, has significant value to add by participating in electricity markets and thus minimizing electricity costs [12,17,41,42].
The photocatalytic process of decomposition uses radiation energy for decomposition at room temperature in photo-electrolysis, photocatalysis, and photo-biological processes. However, this technology is still in the early stages of development, and material costs and practical problems have not been resolved [2,35,43,44]. The electrochemical and photolytic processes of ammonia decomposition are explained in more detail in the related part of Section 6.
Alternatively, high-purity hydrogen can be produced as a by-product of mature industrial technologies, such as alkaline and proton exchange membrane (PEM) and low-temperature electrolysis (LTE) from renewable electricity, on a large scale, with high energy efficiency (PEM electrolyzer 72%) and a fast response rate. The chlor-alkali (CA) process, which produces sodium hydroxide and chlorine through electrolysis of a sodium chloride solution, produces a by-product of high-purity hydrogen (>99.9%) on a large scale (up to 0.4 Mt/year) without additional purification processes at a price of about USD1/kg H2, which is relatively cheap. High-temperature electrolysis using a solid oxide electrolysis cell (HTSOEC) produces hydrogen with higher electrical energy efficiency than LTE due to the requirement of heat rather than electricity for processing energy [26]. Hydrogen production from renewable energy sources such as water electrolysis, the most feasible technology, is shifting from alkaline electrolysis to the more flexible PEMs and being scaled up in the EU, the US, Japan and China; however, PEMs have the lowest energy and exergy efficiencies [26,34,45].
Hydrogen, electricity, ammonia and heating energy can be produced simultaneously through the combination of a solar cell electrolyzer, solar–steam cycle and wind-powered electrolysis process. For example, the production of 10 MW of electricity, 994.5 tons/year of hydrogen and 7201 tons/year of ammonia with a maximum energy efficiency of 50% was reported in large cities in China and India [46,47,48]. Moreover, hydrogen production using nuclear power is carbon-free, but it has more environmental, health and safety issues than other fossil fuels [25].

2.3.3. Biological Technologies

One way of achieving very clean large-scale hydrogen production is by using renewable biomass sources. The process requires the preparation of feed stocks such as wood, grass, agricultural products, crop residues, plant and animal wastes, municipal solid wastes, food scraps and algae by several methods, such as gasification, pyrolysis, supercritical water gasification, liquefaction, anthropogenic extraction of hydrogen from waste materials, and biochemical processes of microorganisms, such as combined dark fermentation and anaerobic digestion. This process needs more development, and its conversion efficiencies are low [2,25,35].

2.4. Energy and Exergy Analysis of Hydrogen Production from Ammonia

Analyzing energy and exergy efficiencies is an important tool for optimization and improvement, as well as the design of hydrogen production systems through the evaluation and prediction of thermodynamic process defects. The exergy of ammonia cracking describes a measure for identifying and explaining the benefits of sustainable energy and technologies, and the exergy of ammonia cracking clearly identifies efficiency improvements and reductions in thermodynamic losses for more sustainable technology. Therefore, the exergy efficiency of an ammonia cracking system is related to its economics, environmental impact, and sustainability [49,50].
The performance of a hydrogen production system based on efficiency as the ratio of the energy or exergy content of the hydrogen to that of the material and/or energy resource is obtained from the following equations, which indicate that when the system irreversibility or the exergy loss is minimized, the exergy efficiency can improve and reach the maximum value [50].
( Energy   efficiency )   η   % =   m ˙   LHV H 2   E in ˙ = E out ˙   E in ˙
( Exergy   efficiency )   ψ =   m ˙   ex H 2 ch   Ex in ˙ = Ex out ˙   Ex in ˙
where η is the energy efficiency,   m ˙ is the mass flow rate of the produced hydrogen, LHV H 2   is the lower heating value of hydrogen (121 MJ/kg), E in ˙ is the rate of energy input to the process, and E out ˙ is the total outlet energy transfer rate. ψ is the exergy efficiency, ex H 2 ch   is the chemical exergy of hydrogen, Ex out ˙ is output or useful exergy, and Ex in ˙ is the exergy input rate supplied to the hydrogen production process [50,51].
The efficiency of different hydrogen production methods depends on their emissions, total cost, and energy and exergy efficiencies. It can be categorized in the range of 0 to 100, as shown in Table 4, where 0 means poor performance assigned to the cost and emissions, and the highest value of 100 means higher efficiencies, which indicates the ideal case with the lowest costs and zero emissions [1,50,51]. Hydrogen production by fossil fuel reforming, plasma arc decomposition, and coal gasification and biomass gasification methods have high energy and exergy efficiencies. Biomass-based hydrogen production methods have significantly low emissions, but they have low system efficiencies, significantly high acidification potential (AP), and relatively high global warming potential (GWP), social cost of carbon (SCC) and production costs, as demonstrated in Table 4. The ideal method is the production of green hydrogen as it has zero emissions, the lowest cost, and 100% efficiency [34,50,51]. Table 4 shows comparison of maximum energy and exergy efficiencies of hydrogen production methods, which has the highest energy efficiency of 83% using fossil fuel reforming (FFR), an exergy efficiency of 60% for biomass gasification (BIG), and the lowest energy and exergy efficiency (2%, 1%) for photocatalysis (PCT) methods [50,52].

2.5. The Cost and Environmental Emissions

Hydrogen production from different technologies and pathways is varied in terms of cost and environmental emissions due to economic factors, such as the cost of natural gas and electricity. The hydrogen production cost is depending on industrial scales, the availability of existing infrastructure, production technology, the variety of feedstocks, and power sources. It is conventionally generated from fossil fuels and is the most cost-effective process for large scales (above 1000 m3/h) but releases a high amount of greenhouse gas (GHG) (see Table 5). As the global demand for hydrogen rises, there is a need to decrease GHG emissions by switching to clean energy and green hydrogen generated from clean and sustainable energy sources through efficiency and industrial decarburization, but this currently comes at relatively high energy costs [2,3,4,15,16,22,26,53,54,55,56,57,58,59,60,61,62].
Around 6% of global natural gas and 2% of coal consumption is used for producing hydrogen, which generates about 830 MtCO2 of annual CO2 emissions and is a significant driver of climate change [11,54]. In 2020, 60% of the annual global hydrogen was produced from 240 billion cubic meters of natural gas, and 19% was produced from 86 billion cubic meters of coal in China [8]. According to Figure 8, a total 90 Mt of the global hydrogen demand in 2020 was derived from fossil fuels, 79% of which was obtained from dedicated hydrogen production plants, and the remaining 21% was obtained from carbon by-products. Producing 90 Mt of hydrogen can release about 900 Mt of CO2 (2.5% of global CO2 emissions) per year. However, using CCUS technology decreased the carbon emissions by 59.7% [3,36,55,56].
The hydrogen generated from green ammonia cracking demonstrates high CO2 reduction ranging from 78% to 95% in kgCO2/kgH2 compared to the hydrogen production from SMR, which is mainly gray hydrogen (96%) [48,57]. Therefore, this is regarded as the decarburization plan most likely to achieve the goal of zero carbon emissions by 2050 [6,58,59].
Hydrogen production requires additional development to be sustainable and energy efficient in production, usage and transportation for commercialization. However, hydrogen also can be produced through a large, centralized fossil fuel-based technology along with CO2 capture and storage (CCUS), which has not yet been demonstrated technically or commercially, and further research is needed on gas separation and hydrogen purification processes [10,54].
In the Net Zero Scenario, the carbon emissions of energy systems can be decreased through mitigation measures includes the direct on-site renewable energy use, improved technology performance, energy efficiency, and behavioral changes such as energy service demand changes from user decisions and technology developments. The technologies to be developed include activation of grid decarburization, replacement of technologies with electrification (heat pumps, mechanical vapor recompression), transition to renewables sources (hydropower, geothermal, solar power, wind, marine energy), and transition to hydrogen and hydrogen-based fuels by developing CCUS of relevant intensity [4,10,60].
The environmental impact of water electrolysis depends on the primary energy source that provides the electricity. It cannot be an environmentally friendly technology under the current electricity structure. It will have greater potential in the trend of power structure transformation. However, it can be solved by using power sources from wind, solar, nuclear and biomass. Table 6 and Figure 9 show the hydrogen production cost and environmental impacts of different production technologies, the variety of feedstocks, power sources and emissions [62].
The theoretical ideal hydrogen production option has zero production cost, no harmful emissions, and zero social cost of carbon. The cost of producing hydrogen is highly influenced by the scale of the installation. A techno-economic assessment showed that the cost of hydrogen (kgH2) at small scales (i.e., 10 kW) reduced from 7.03 to 3.98 USD/kgH2 compared to larger industrial scales (i.e., 10 MW), and it can be decreased up to 50% more based on sensitivity analyses [48].
The cost of hydrogen from ammonia to a commercial scale resulted in approximately 4 USD/kgH2 at 10 MW. In terms of facility costs, the PSA-adsorbent cost was 56.1%, followed by reactor catalyst cost of 21.3%, and ammonia procurement accounted for 90.5% of operating costs. The CO2 emission is the lowest, although the production cost is higher compared to the existing commercial hydrogen production system, so the price difference will be realized through the greenhouse gas emission trading system [48].
It will be critical to decrease the cost of clean hydrogen production by developing and expanding current technologies and management of CO2. This can significantly improve air quality through carbon-free methods or combining them with carbon capture, utilization and storage (CCUS). In addition, to increase the carbon tax in proportion by the amount of generated CO2 [8].
Compared to the existing diesel energy source, a fuel-cell power system using hydrogen and ammonia is sufficiently replaceable in terms of weight, volume and power but not in terms of the economy [11]. However, the electrolyzers that operate most often in base load mode can provide significant value from participating in electricity markets by minimizing electricity costs [8]. Historically, the cost of green hydrogen has been more expensive than gray hydrogen from fossil fuels. However, nowadays, the cost of gray hydrogen produced from natural gas is currently between 5.5 and 6.89 USD/kg in parts of Europe, the Middle East, India, South Korea and Africa, while the price of green hydrogen is between 4.84 and 6.68 USD/kg. The cost is also related to factors such as fuel price, and transportation which mainly varies depending on geographical and economic conditions. Policies for the use of hydrogen energy in South Korea, is shifting from current large-scale production of gray hydrogen of 220 kt/yr, and is expect increase to production of green hydrogen of 1.39 Mt/yr by 2030, and increase to 4.52 Mt/yr from renewable sources by 2040, while decrease in costs to KRW 3000 or 2.33 USD/kg by 2040 [15,54,63].
The unit cost of green hydrogen production with renewable electricity sources is in the range of 2.2~8.64 USD/kgH2; and it could decrease due to costs of renewable sources and the scaling-up of industry. However, it could compete with existing hydrogen production from fossil fuel, the oil refining and ammonia production processes.
The cost of transportation is related to factors such as fuel price, which mainly varies depending on geographical and economic conditions.
The efficiency and production volume of a hydrogen and ammonia production system can increase using a combination of a biomass gasifier with solar heat and a power generation system. A comparison of the hydrogen production costs based on feedstocks is presented in Table 7 [38,62]. For example, hydrogen produced from the renewable energy of solar heat, in a simultaneous production process of hydrogen, ammonia, urea, and power, has an energy efficiency of 66.12%. Hydrogen prices decreased (1.94 USD/kg) as the amount of solar irradiation increased (650 W/m2), and the unit cost of electricity production was calculated as 0.084 USD/kWh [38,62,64].
Thermochemical cycles based on nuclear energy are low-cost and have low environmental impact. Electrolysis and thermolysis with nuclear energy are more competitive in terms of cost than with other energy sources. It is worthwhile to examine the technological maturity and safety of nuclear energy and expect it to become the main driver for hydrogen production in the future [62].

3. Ammonia Source, Production Pathways, Technology, and Energy Efficiency

As an ideal hydrogen carrier, ammonia is an important industrial chemical and a major contributor to a carbon-free economy. It has a well-established infrastructure, a global trade and distribution network, and accounts for the largest production and market of hydrogen. There is no alternative to hydrogen in the ammonia fertilizer industry. Ammonia is being produced in huge quantities of around 200 million metric tons annually, 80% of which is used for producing fertilizers [65,66].

3.1. Ammonia Properties

Ammonia contains no greenhouse gases, consisting of hydrogen (17.8 wt%) and nitrogen, with a density of 0.769 kg/m3 and a boiling point and freezing point of −33.3 and −77.65 °C (Table 2) at standard pressure, respectively. Ammonia has a narrow flammability limit between 15 and 25% in air and a higher energy density of 22.5 MJ/kg compared to fossil fuels (see Figure 10). It easily becomes liquid at 10 bar, to easily transport and safer handling [12,17,62,63,64,65,66,67,68,69].

3.2. Ammonia Production Pathways and Technologies

Ammonia is produced from different technologies, such as thermochemical, electrochemical, and biological processes, in a variety of pathways, such as carbon-based or renewable feedstocks, as shown in Figure 11 [70,71]. The Haber–Bosch process is the most common, well-established, economic and sustainable method of ammonia production. Ammonia production consumes a high amount of energy, about 1.8% of annual global energy, to provide the high temperature and pressure required for the process. This process mainly use over 30 GJ/tNH3 and produces about 2.16 kg CO2eq/kgNH3 [39]. More than 90% of the total global ammonia (about 176 Mt/year) is produced through SMR [72], emitting more than 380 million tons of carbon dioxide per year, which is the highest greenhouse gas emissions in the chemical production system, as shown in Figure 12 [42,58].
Gray ammonia synthesized through thermochemical processes, including gasification of coal, reforming of natural gas, naphtha reforming, pyrolysis and auto-thermal reactor (ATR), has the characteristic of high carbon emissions [58,59,72]. Blue ammonia obtained from the lower-carbon process is based on SMR, such as reforming and gasification of fossil fuels combined with the CCUS process, which is an alternative source of low-carbon hydrogen [58,59,72]. The main technologies, such as electrolysis and SMR, with or without carbon capture while producing hydrogen, provide a low-cost energy source for mobile applications, industrial applications, or gas grid injection [35,57,73,74].
Green ammonia can be produced from renewable feedstocks such as air and water with sustainable energy sources using water electrolysis instead of natural gas, oil or coal, and the energy could be relatively easy to transport and handle [58,59,67,72].
Figure 13 shows the energy consumption of various ammonia production technologies compared to their CO2 emissions (tCO2/tNH3), as well as a diagram of the Haber–Bosch process [75]. The combination of water electrolysis with renewable feedstock technology can be adopted for producing ammonia from renewable sources such as low-carbon hydrogen. The price of electricity is an important factor and can be decreased by using green electricity from renewable sources. However, it requires about nine tones of continuous supply of pretreated water with high purity levels to produce 1 ton of hydrogen; thus, 233.6 Mt/year of water is required for 176 MtNH3/year [42,67].
Figure 14 shows the comparison of various ammonia production costs (different color types of gray, blue and green), as well as the relative CO2 emission reduction potentials of each technology by 2030 [76]. The cost of ammonia production varies significantly by synthesis technology as well as the regions due to price fluctuations in fuel, feedstocks and energy, and the cost of the plant. For electrochemical methods, it is mainly related to electricity costs (85%). The electricity cost for ammonia production without carbon capture is between approximately 0.01 and 4 USD/kWh, which is cheaper than electrolysis (0.015–5.0 USD/kWh) in most parts of the world, but the lowest cost regions are using renewable solar energy with high global horizontal irradiance or onshore wind [5,7,9,71].

3.3. Energy Efficiency and Exergy Efficiency of Ammonia Production

The most suitable utility systems can be defined in terms of their energy and exergy efficiency and require minimal energy and low operating costs. According to Figure 15, ammonia is produced from carbon-based and biomass-based feedstocks and energy sources in various methods. The production methods can be categorized as: conventional (SMR, at 700–800 °C and ATR, at 1000 °C); using electricity power, and the Rankine cycle, that provides the required heat and power demands without gaseous fuels (WF-RC-EE: without fuel, by Rankin cycle, and electricity); only natural gas is consumed as fuel (NG-RC-no EE: natural gas, Rankin cycle, no electricity); natural gas and a combined cycle supplies the required heat and power (NG-CC-no EE: natural gas, combined cycle, no electricity); syngas is consumed as fuel for heat and power (SG-RC-no EE: syngas fuel, Rankin cycle, no electricity); and SG-CC-no EE (syngas fuel, combined cycle, no electricity) [69].
The exergy efficiency of ammonia production from natural gas is 65.8% and from biomass plants is 41.3%, with an average overall emission range between 0.5 and 2.3 tCO2/tNH3. Biomass gasification has lower efficiency but is cheaper than natural gas, and there exists the possibility of using the produced syngas for electricity generation [69]. The exergy consumption (GJ/tNH3) for the conventional system reaches 32.34 GJ/tNH3, with environmental CO2 emissions of 1.75 t CO2/t NH3 due to the use of natural gas (Figure 16) [69]. The exergy losses of ammonia production can be reduced by improvements in the waste heat, changes in the system design of the process and improvements in the performance of the unit operations. As shown in Figure 17, the exergy losses of the gasifier unit were 38.4% for SG-RC-no EE and 46.7% for WF-RC-EE [69,77,78,79].
Sustainable ammonia production can be achieved by using renewable energy sources instead of carbon-based fuels in low-cost regions or transporting them from places where it is relatively cheap. However, the current cost of producing green ammonia is still higher than blue ammonia [5,9,12,17,42].

4. Development of Technologies for Converting Ammonia to Hydrogen

Regarding natural renewable storage, hydrogen and ammonia are both chemical energy carriers and potential fuel sources, which their energy is released with no carbon emissions when used as a fuel, providing an optimal method for sustainable energy. The energy density by weight of hydrogen is 120 MJ/kg, which is approximately six times higher than ammonia; hence, it has gained popularity as an alternative fuel. Ammonia is considered for indirect storage of hydrogen because of its energy density of 22.5 MJ/kg at HHV, approximately half of that of gasoline (46 MJ/kg) and ten times more than metal hydrides in batteries [34,62,80].
There are several technologies for converting ammonia to hydrogen, such as thermochemical, photocatalytic, and electrochemical methods [12,17,43,44,81].

4.1. Thermal and Thermo-Chemical Cracking

Thermal cracking is a typical method of hydrogen generation from ammonia. The first thermal cracking of ammonia was conducted by Burke in 1933, where liquid ammonia was heated in the temperature range of 550 to 650 °C and flowed through tubes over a suitable catalyst, and of 90% the ammonia decomposed [18,67,82,83].
Hydrogen can produce forms of ammonia using plasma electrolysis technology, that can be an alternative to thermal catalysts for instantaneous ammonia decomposition in less than a microsecond to satisfy the requirements of engines [84]. There are a variety of plasma decomposition reactors, such as thermal plasma, cold plasma, dielectric barrier discharge, micro-hollow cathode discharge, and warm plasma. The RF thermal plasma reactor of 13 kW produced hydrogen at a flow rate of 28 L/min and a conversion rate of 98% but with a low energy efficiency [84]. High-purity hydrogen was produced in cold plasma with low generation rate of 20 mL/min because of the long residence time in the discharge zone. Large-scale real-time hydrogen production using a low-temperature arc plasma had a higher energy efficiency (783.4 L/kWh (liters per kilowatt hours)) than other plasma methods and increased to 1080.0 L/kWh after adding the NiO/Al2O3 catalyst but produced low-purity hydrogen (<34.8%) [84]. Warm plasma generated by a non-thermal arc plasma can generate enough reactive species and maintain moderate gas to decompose ammonia at temperatures between 1500 and 4000 K [84].

4.2. Thermodynamic Concerns of Ammonia Cracking

Ammonia cracking is the reverse of its synthesis reaction. It requires an energy input in a mildly endothermic reaction at a relatively high temperature under standard pressure [85]. The enthalpy changes of NH3 are given with the following equation:
NH3 → 1.5 H2 + 0.5N2, ∆H298 = 46 KJ/molNH3
Practically, this conversion depends on the reaction temperature and catalyst and can be performed at higher temperatures (823 to 1023 K). Thermodynamically, the decomposition of ammonia to hydrogen is possible at temperatures of 698 K, but the decomposition reaction is very slow and using catalysts can help to reach a higher conversion of ammonia at operating temperatures lower than 723 K [85]. However, different from the equilibrium condition, ammonia does not fully decompose into hydrogen, and the conversion rate is less than 100% [35,53]. Therefore, maximum single-pass conversions require relatively high temperatures in the range of 250–700 °C, which are theoretically obtainable. Table 8 represents the equilibrium conversion values of ammonia to hydrogen at different temperatures under normal atmospheric pressure. The highest ammonia conversion (>99%) happened at temperatures above 400 °C under normal pressure, after which the reaction was considered irreversible and less dependent on temperature following first-order kinetics. Thus, it may be interpreted in terms of kinetics rather than thermodynamic limitations [85]. Hence, the conversion of ammonia faces thermodynamic limitations and kinetic barriers, which require higher temperatures [53]. Moreover, the kinetics of ammonia conversion depend on the temperature and the ammonia concentration [86].

4.3. Catalytic Reaction Kinetics of Ammonia Cracking

Ammonia with high contents of hydrogen under high temperatures in the presence of a suitable catalyst is decomposed into carbon-free hydrogen. This technology is high energy consumption (total energy efficiency 58%), requiring reactor and catalyst development, process integration, and economic development [18,67,82,83]. The catalytic ammonia conversion rate varies depending on many factors, such as the temperature, pressure and catalysts, composition and purity of the gas phase, a specific surface area, and composition of the catalyst on which the reaction proceeds. The gas phase ammonia be adsorbed by the catalyst surface, and decomposes to hydrogen and nitrogen (see Figure 18) [53,87,88,89,90,91,92].
The ammonia conversion degree ( α NH 3 ) can be defined based on the inlet and outlet composition of the gas phase of hydrogen and ammonia [90]. from the following equation:
α NH 3 = X H 2 F 0 F H 2 0 F NH 3 0 ( 1.5 X H 2 ) = r decomp F NH 3 0
where XH2 is the molar concentration of hydrogen in the reactor in mol·mol−1, and F0 is the total molar flow rate of the inlet stream in mol·s−1, FH20 and FNH30 are the hydrogen and ammonia molar flow rates in the inlet stream, respectively, in mol·s−1, and rdecomp is the reaction rate of the catalytic ammonia decomposition [90].
The rate of ammonia decomposition over the iron-based catalysts shows a very complex dependence on the temperature as well as on the partial pressures of hydrogen (pH2) and ammonia (pNH3). It can be obtained from the following relation:
    r = α ( pNH 3 2 pH 2 3 ) β       β = 0.5    
where r is the decomposition rate, α   and   β are rate parameters of the Temkin–Pyzhev equation, and pNH3 and pH2 are the partial pressures of ammonia and hydrogen, respectively [86,90].
The ammonia conversion rate enhances from 0.61 to 0.99 as the reaction temperature increases from 450 to 773 K under atmospheric pressure. High conversion of ammonia (99.85%) (see Figure 19) can be reached at temperatures higher than 700 K [80,93]. At a constant temperature, the conversion of ammonia decreases with increasing pressure, as shown in Figure 19. However, at lower temperatures, it requires a catalyst [94]. The ammonia conversion to hydrogen rates was mainly in the range of 2–10% at low temperatures and 3.5% at 523 K for similar catalyst materials [53].
The decomposition efficiency linearly increases with the reaction temperature in a certain range and under a given flow rate. The volumetric flow rate of ammonia fed into the reactor is an important factor that determines the reaction temperature and decomposition efficiency of the catalyst [94]. The slowest step in ammonia decomposition is the desorption of nitrogen. In addition to the desorption of nitrogen, the surface reaction and hydrogen separation, also can effect on the reaction conversion and hydrogen yield [95,96].

5. Process of Converting Ammonia to Hydrogen

Ammonia cracking is a process of producing hydrogen from ammonia decomposition over a catalyst at high temperatures and is preferentially performed at normal pressures. Thermal reactions start at temperatures higher than 773 K without needing a catalyst, while most of the catalytic cracking happens in the presence of a catalyst at temperatures lower than 698 K, with a higher efficiency of about 98–99% [48].
The general process flow diagram at scales between 10 kW and 10 MW represents the heat and mass balance of a system (Figure 20). The process starts by releasing pure ammonia from liquid storage at a flow rate of 221.5 kg/h (at 500 kW scale) through a feed valve (10–2.5 bar). It is first preheated in heat exchanger (HXpr) by hot output gas of reactor and then its temperature increases to 525 °C with burner combustion (HXref) at a for the reformer. The output gas is then separated under pressure by pressure swing adsorption to produce pure hydrogen and finally discharged at 20 °C [48].

5.1. Reactors Technology

Various reactor technologies can be used for the ammonia decomposition reaction, such as microwave, catalytic, plasma, membrane, multistage, continuous tubular, fixed bed, batch and flow bed (Table 9). The catalytic performance of a reactor is related to its type and size, partial pressure, pressure drop, and operating conditions, such as the feed flow rate of ammonia, reaction temperature gradient, and sweep flow rate [35,81,97,98,99,100,101,102,103,104,105,106,107,108,109].
In general, in addition to the reactor type, the flow rate of ammonia, partial pressure, dimensions of the reactor, pressure drop, temperature gradient, and sweep gas all play important roles in governing the overall catalyst performance and operating conditions (e.g., reaction temperature, NH3 feed flow rate and sweep flow rate) [35].
Reactors used in thermal processes require a high-temperature heat exchanger source in addition to the development of catalytic materials [35]. The development of reactor technology for ammonia decomposition can improve reaction kinetics by optimizing the reactor design and relevant conditions in addition to using catalysts to overcome the heat and mass transfer limitations [81]. The differences in conversion can depend on gas flow conditions, deposition methods, and precursor types [53].

5.1.1. Fixed Bed Reactor

Fixed bed reactors, as the most common catalytic reforming reactor for hydrogen production, suffer from poor heat and mass transfer behavior, high temperature gradient, catalyst sintering, coke deposition and dust jamming. The fixed bed reactor enhanced the conversion by increasing the feed temperature to the range of 600–900 °C [85,96,98,99,100,101].
The performance of the fixed-bed reactor for ammonia decomposition was improved using the cobalt-based catalyst, which obtained an ammonia conversion of 87.2% and a hydrogen production rate of 29.2 mmol H2 gcat−1 min−1 at 500 °C with a space velocity of 30,000 mL gcat−1 h−1 [102]. Furthermore, the ammonia conversion over a Ru-based catalyst (with different Cs) (Figure 21) was improved by increasing the Cs/Ru molar ratio up to 4.5 at lower temperatures of 325 °C but did not increase over a Ni-based catalyst in a fixed-bed reactor at 800 °C [89,103].
Various types of catalytic reforming reactors can be used based on their properties and their performances. The different types of reactor technologies with inter-stage heating and some differential elements can be found in [99,101,105]. The optimization of reactor parameters with a pure phase of Ni2Mo3N catalyst using a chelating method of preparation for high catalytic activity resulted in an ammonia conversion rate of 97% at 525 °C [103]. A schematic diagram of the preparation of hollow fiber reactors, the deposition of Ru-NCX on the Al2O3 substrate through sol-gel, and pyrolysis and Ru incipient wetness impregnation methods is displayed in Figure 22 [110]. The on-board hydrogen production technology uses hollow fiber converters (HFC) in compact ammonia cracking reactors due to the advantage of minimizing the weight and space of the catalyst (smaller volume of 93%, catalyst loading of 80%) while enhancing ammonia decomposition efficiency compared to general packed bed reactors (PBR). The HFC reactor represents a uniform distribution of the catalyst on the substrate and is cheaper than the PBR (Figure 23). The HFC is cheaper because it uses less precious metal-based catalyst (80 wt%). It is more efficient in mass transfer, has lower pressure drops of 99%. It can improve the residence time distribution, and improves the reaction kinetics (internal and external diffusion limitations), which results in a larger conversion rate (4 times at 773 K) than PBR. Therefore, it has the potential for economical production [110].

5.1.2. Fluidized Bed Reactor

A fluidized bed shows its advantage in the industrial-scale catalytic reforming process because the coke formed on the surface of catalysts could be separated continuously. The features such as the sweep gas effect, bubble-to-emulsion mass transfer, densified zone formation and concentration polarization are impacted by the fluidized bed membrane reactor [85,110,111,112,113]. Moreover, the membrane-assisted fluidized bed reactor has good gas–solid contact and heat and mass transfer characteristics, which can increase catalytic reforming and improve hydrogen production [85,96,98,99,100,101].
However, conventional Pd-based fluidized bed membrane reactors (FBMR) are not suitable for ammonia decomposition due to their low performance, under the same operating conditions. Also due to weight, volume, and start-up time, they are not applicable for PEM fuel cells in on-board hydrogen production [81,85,96,99,100,101,105].

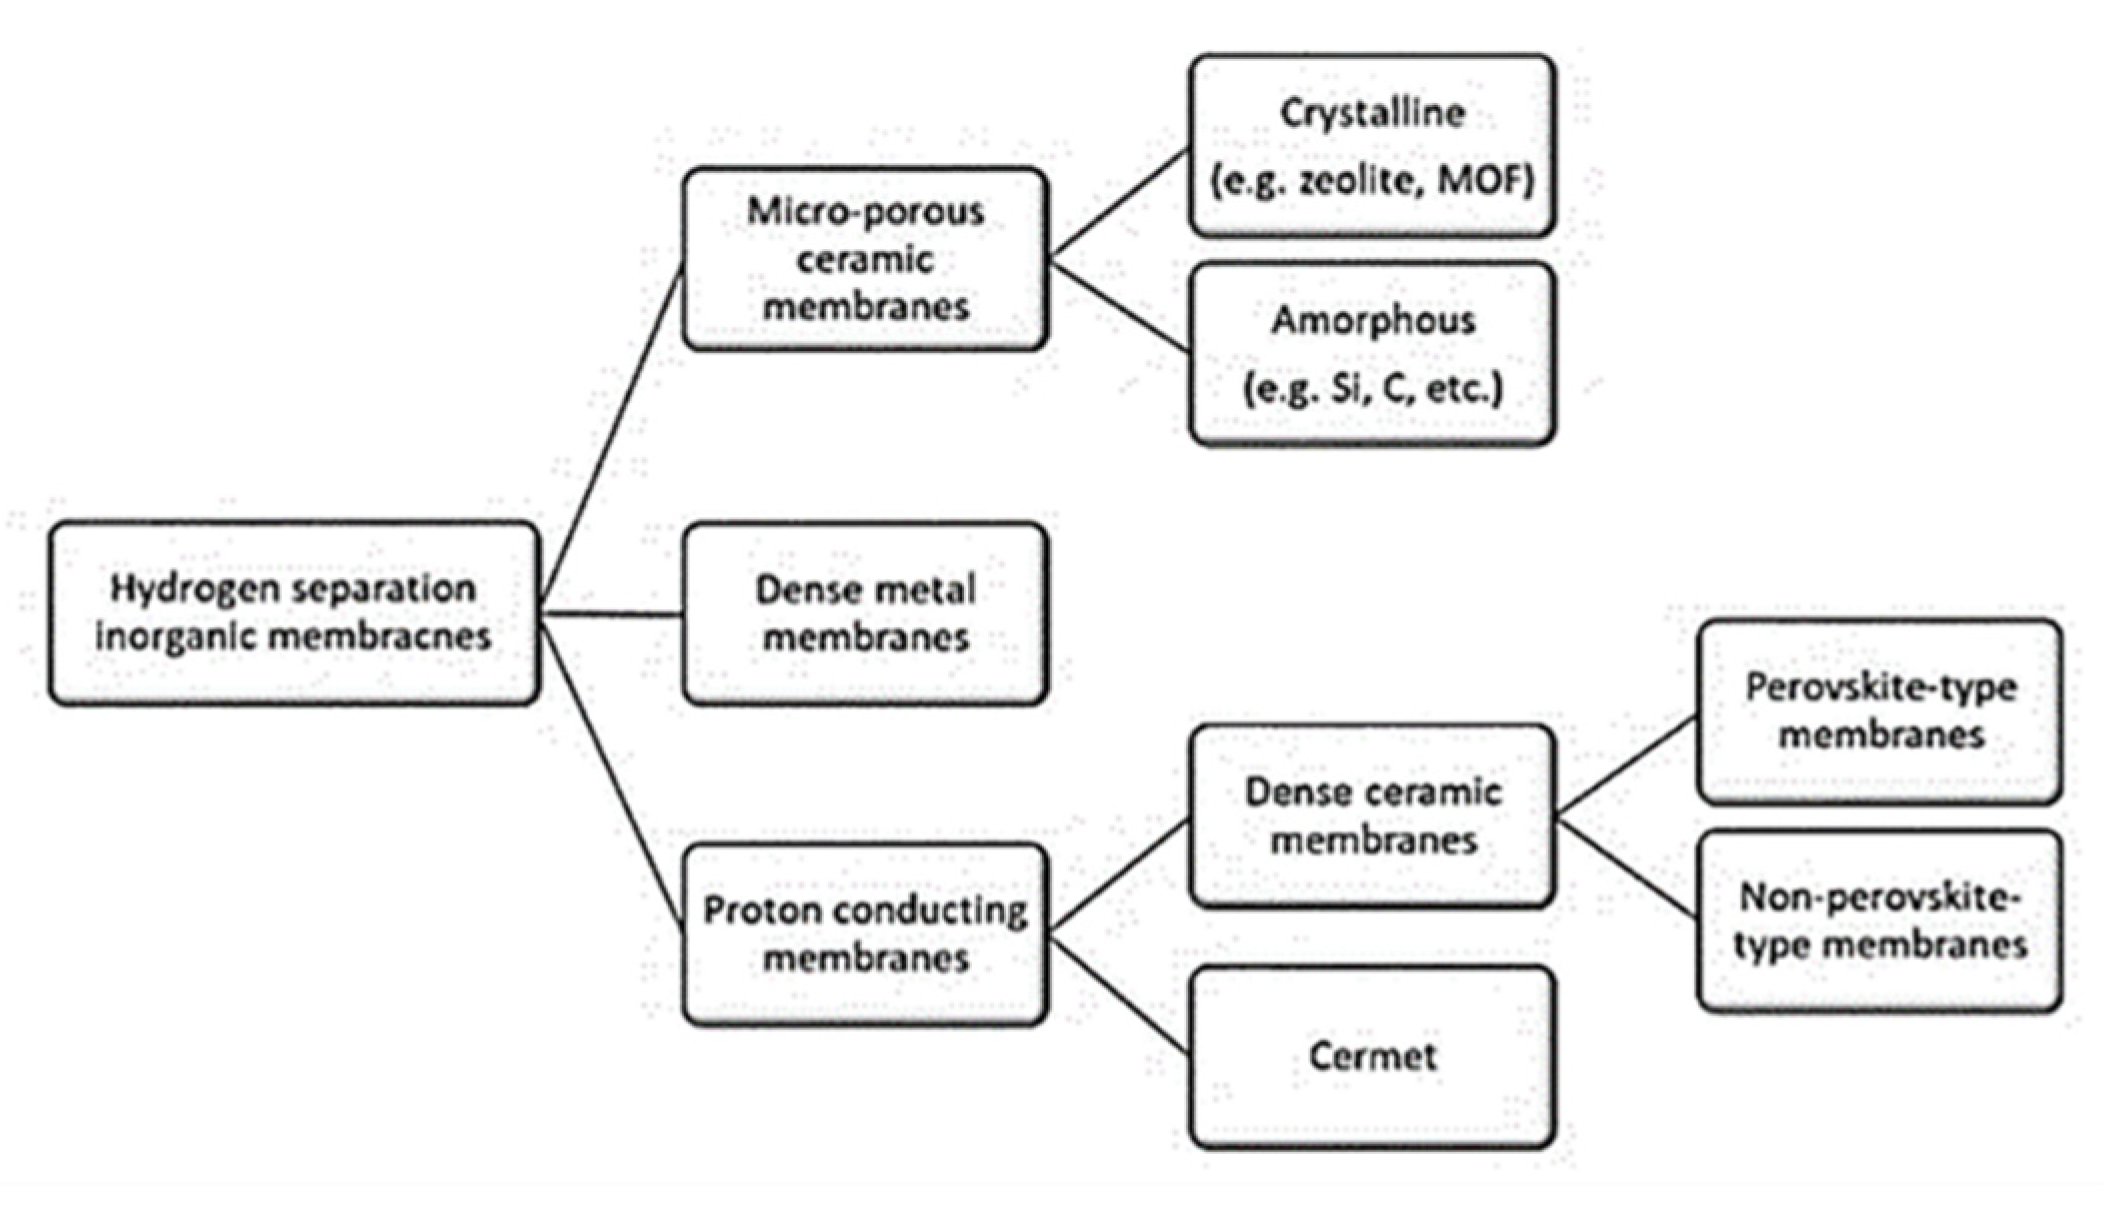
5.1.3. Membrane Reactor

Membrane reactor technology with a high conversion rate can be used for ammonia decomposition with a high hydrogen flux. It is prepared by coating the porous supports and protective layers, such as a porous ceramic tube with a Ni/La-Al2O3 catalyst or a hydrogen-selective silica membrane deposited on porous tubular alumina Ru/γ-Al2O3/α-Al2O3 bimodal catalytic support. (Figure 24). A palladium membrane reactor (PMR) supported by porous stainless steel with a Na/Ru-carbon catalyst can be used for ammonia decomposition due to its kinetically enhancing effect [39,105]. The hydrogen separated and generated with a high-purity simultaneously within the same unit [99,104,105,106,107]. The ammonia conversion can increase the thermodynamic equilibrium and kinetic enhancement effect of hydrogen removal through the membrane walls. High hydrogen separation efficiency can be achieved at lower temperatures compared to conventional systems. Using a membrane reactor combined with a solar heat absorption system can lead to energy and economic benefits [98,99,104].
The membrane reactor recovers the hydrogen of ammonia decomposition and simultaneously separates it with high purity at lower temperatures and lower costs compared to conventional systems. Table 10 and Table 11 demonstrate the performance of hydrogen recovery and the permeation through the Pd membrane at different temperatures for the Cs/Ru catalytic membrane reactor [106,107].
The performance of a conventional reactor can be enhanced by adding a membrane system, which leads to achieving a conversion beyond the thermodynamic restrictions. At temperatures above 425 °C, the ammonia conversion was higher than 86%, and the hydrogen purity was 99.998%. The application of a vacuum to the permeable side of the membrane leads to higher hydrogen recovery and enhanced ammonia conversion in compare with thermodynamic equilibrium conversion. Furthermore, the ammonia conversion was not majorly changed by the reactor feed flow rate and operating pressure [104].
The various types of membranes, such as microporous ceramic, crystalline and amorphous, dense metal and proton conducting, perovskite and non-perovskite, are displayed in Figure 25 [108]. The influencing factors of membrane separation are including membrane material, membrane sealing, membrane pollution, carbon monoxide poisoning, and membrane arrangement [109]. In the case of dense metallic membranes, hydrogen adsorbed at the surface dissociates into two hydrogen atoms that can diffuse through the metal lattice [109].

5.1.4. Other Types of Reactors

The solid oxide fuel cell (SOFC) directly generates electricity efficiently through hydrogen produced from ammonia at temperatures between 500 and 800 °C with low energy efficiency (Figure 26). Therefore, it is requiring to development of catalysts, for improving conversion rates at low temperatures [111,112].
Microfabricated reactors and some monolithic reactors were used for the decomposition of ammonia with a flow rate of 500 NmL/min over a spherical Ni–Pt/Al2O3 catalyst at atmospheric pressure, in portable fuel cell power supply. High hydrogen conversion (>99%) and operability were reached at a temperature of 873 K, but their energy efficiencies were low (<15%). The porosity and permeability of the packed bed are not parameters of engineering importance, and hence, they did not significantly affect the performance of the reactor [99,113]. There was comparison of microreactors characteristics between the micropost (conversion of 85%, flow rate of 15 Nml/min, and temperature of 650 °C); with the microreactor (conversion of 97.0%, flow rate of 10 Nml/min feed of NH3–H2 mixture, temperature of 400–700 °C) [103].
The microwave reactor has a high conversion at lower reaction temperature due to its selective heating properties, which can directly transfer the energy required for the ammonia decomposition reaction from the microwave systems to the active surface; however, the formation of a hot zone and heat losses are problems that need to be solved [114].
Figure 26. Schematic reactor integrated with SOFCs with combined heat, power and rate of ammonia decomposition [113,114].
Energies 15 08246 g026

5.2. Catalysts for Ammonia Cracking

Ammonia decomposes with adsorption over the catalyst surface and releases hydrogen in a stepwise sequence reaction. High ammonia conversion is possible at lower temperatures thermodynamically, but yet higher reaction temperatures are required (due to kinetic limitations), as well as the presence of an active catalyst. In this regard, different catalysts, promoters and support materials can be used for the required industrial application. Besides these, the supports metals and binding energy can be controlled for catalyst efficiency and suitability. The development of catalysts for economic and high-performance decomposition depends on their activity, long-term thermal stability, lifetime, lower pressure drop and system integration [48,113].

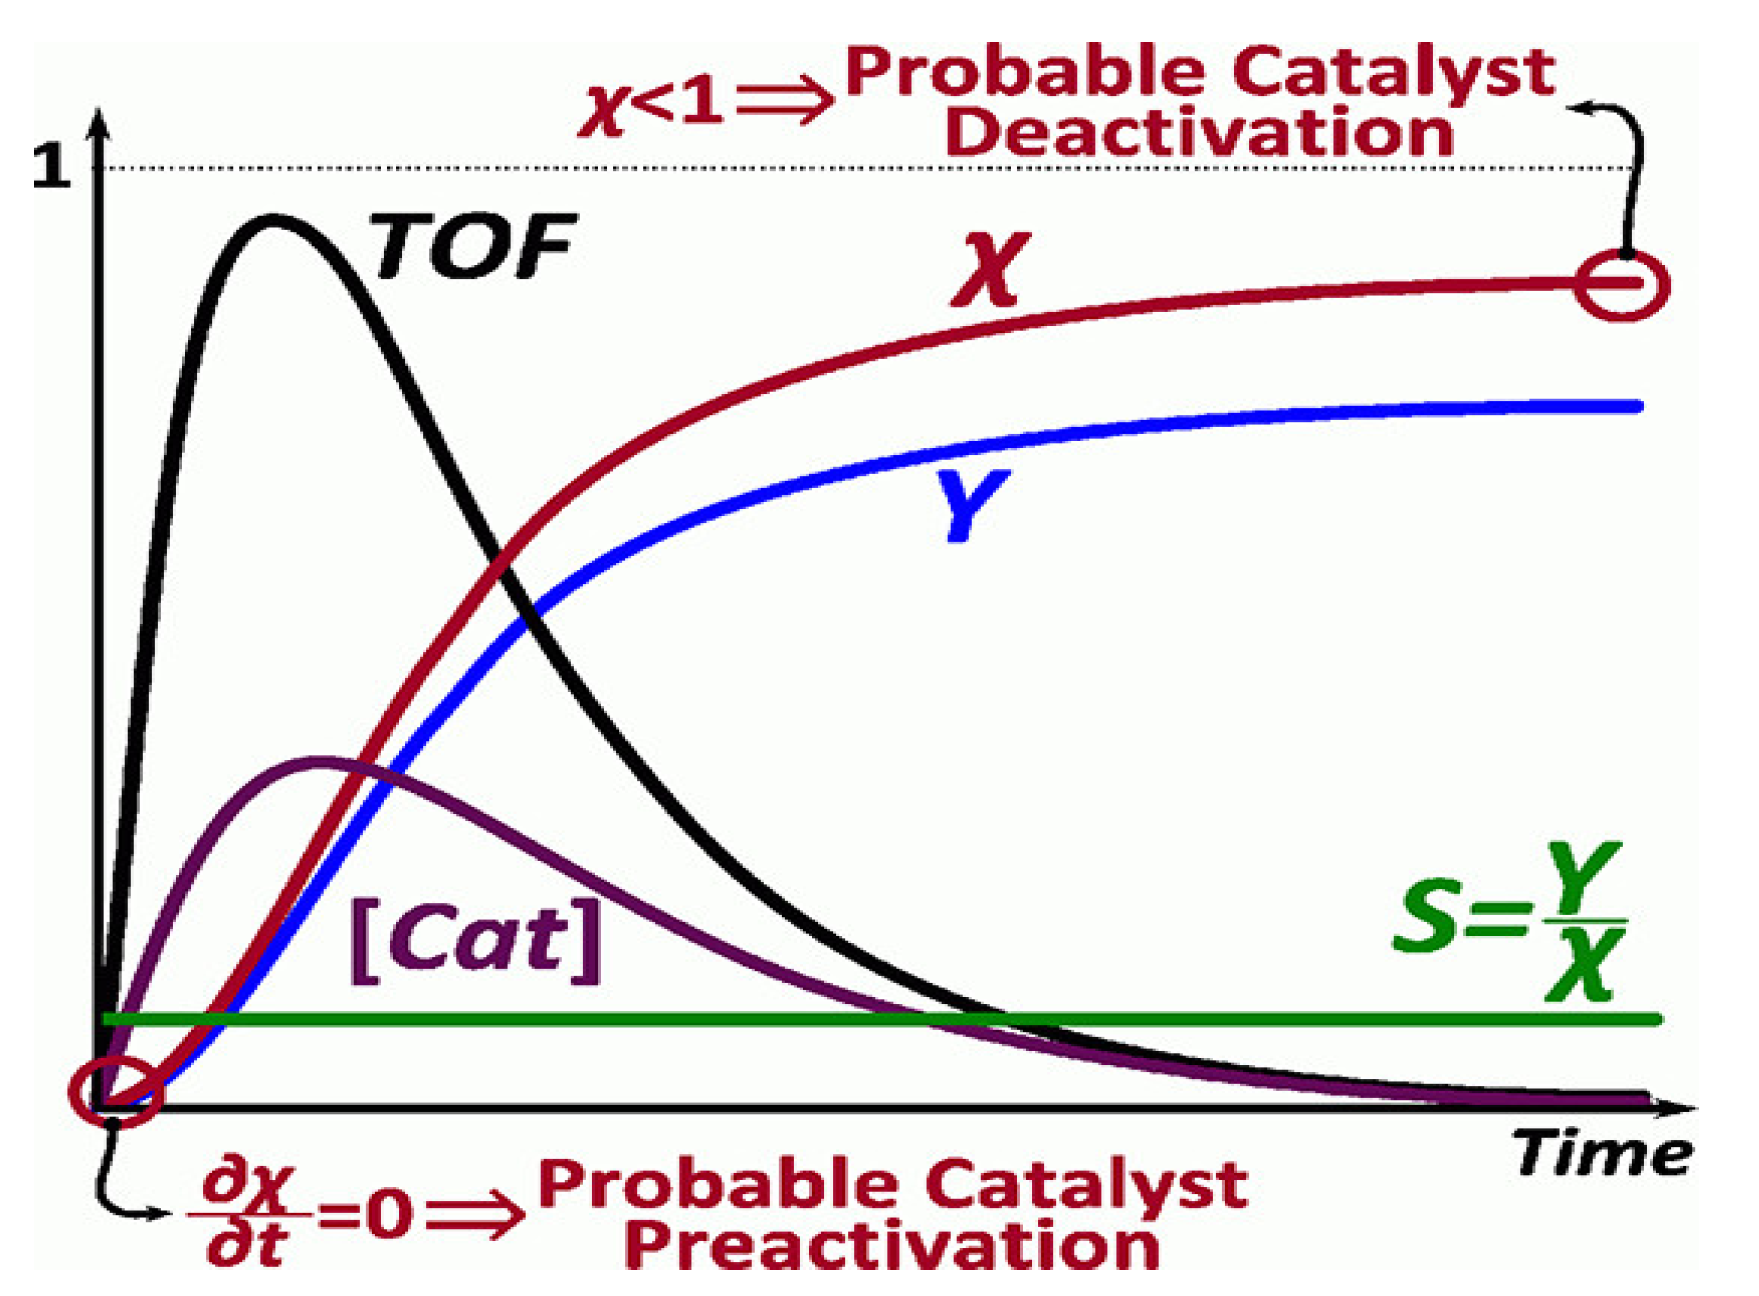
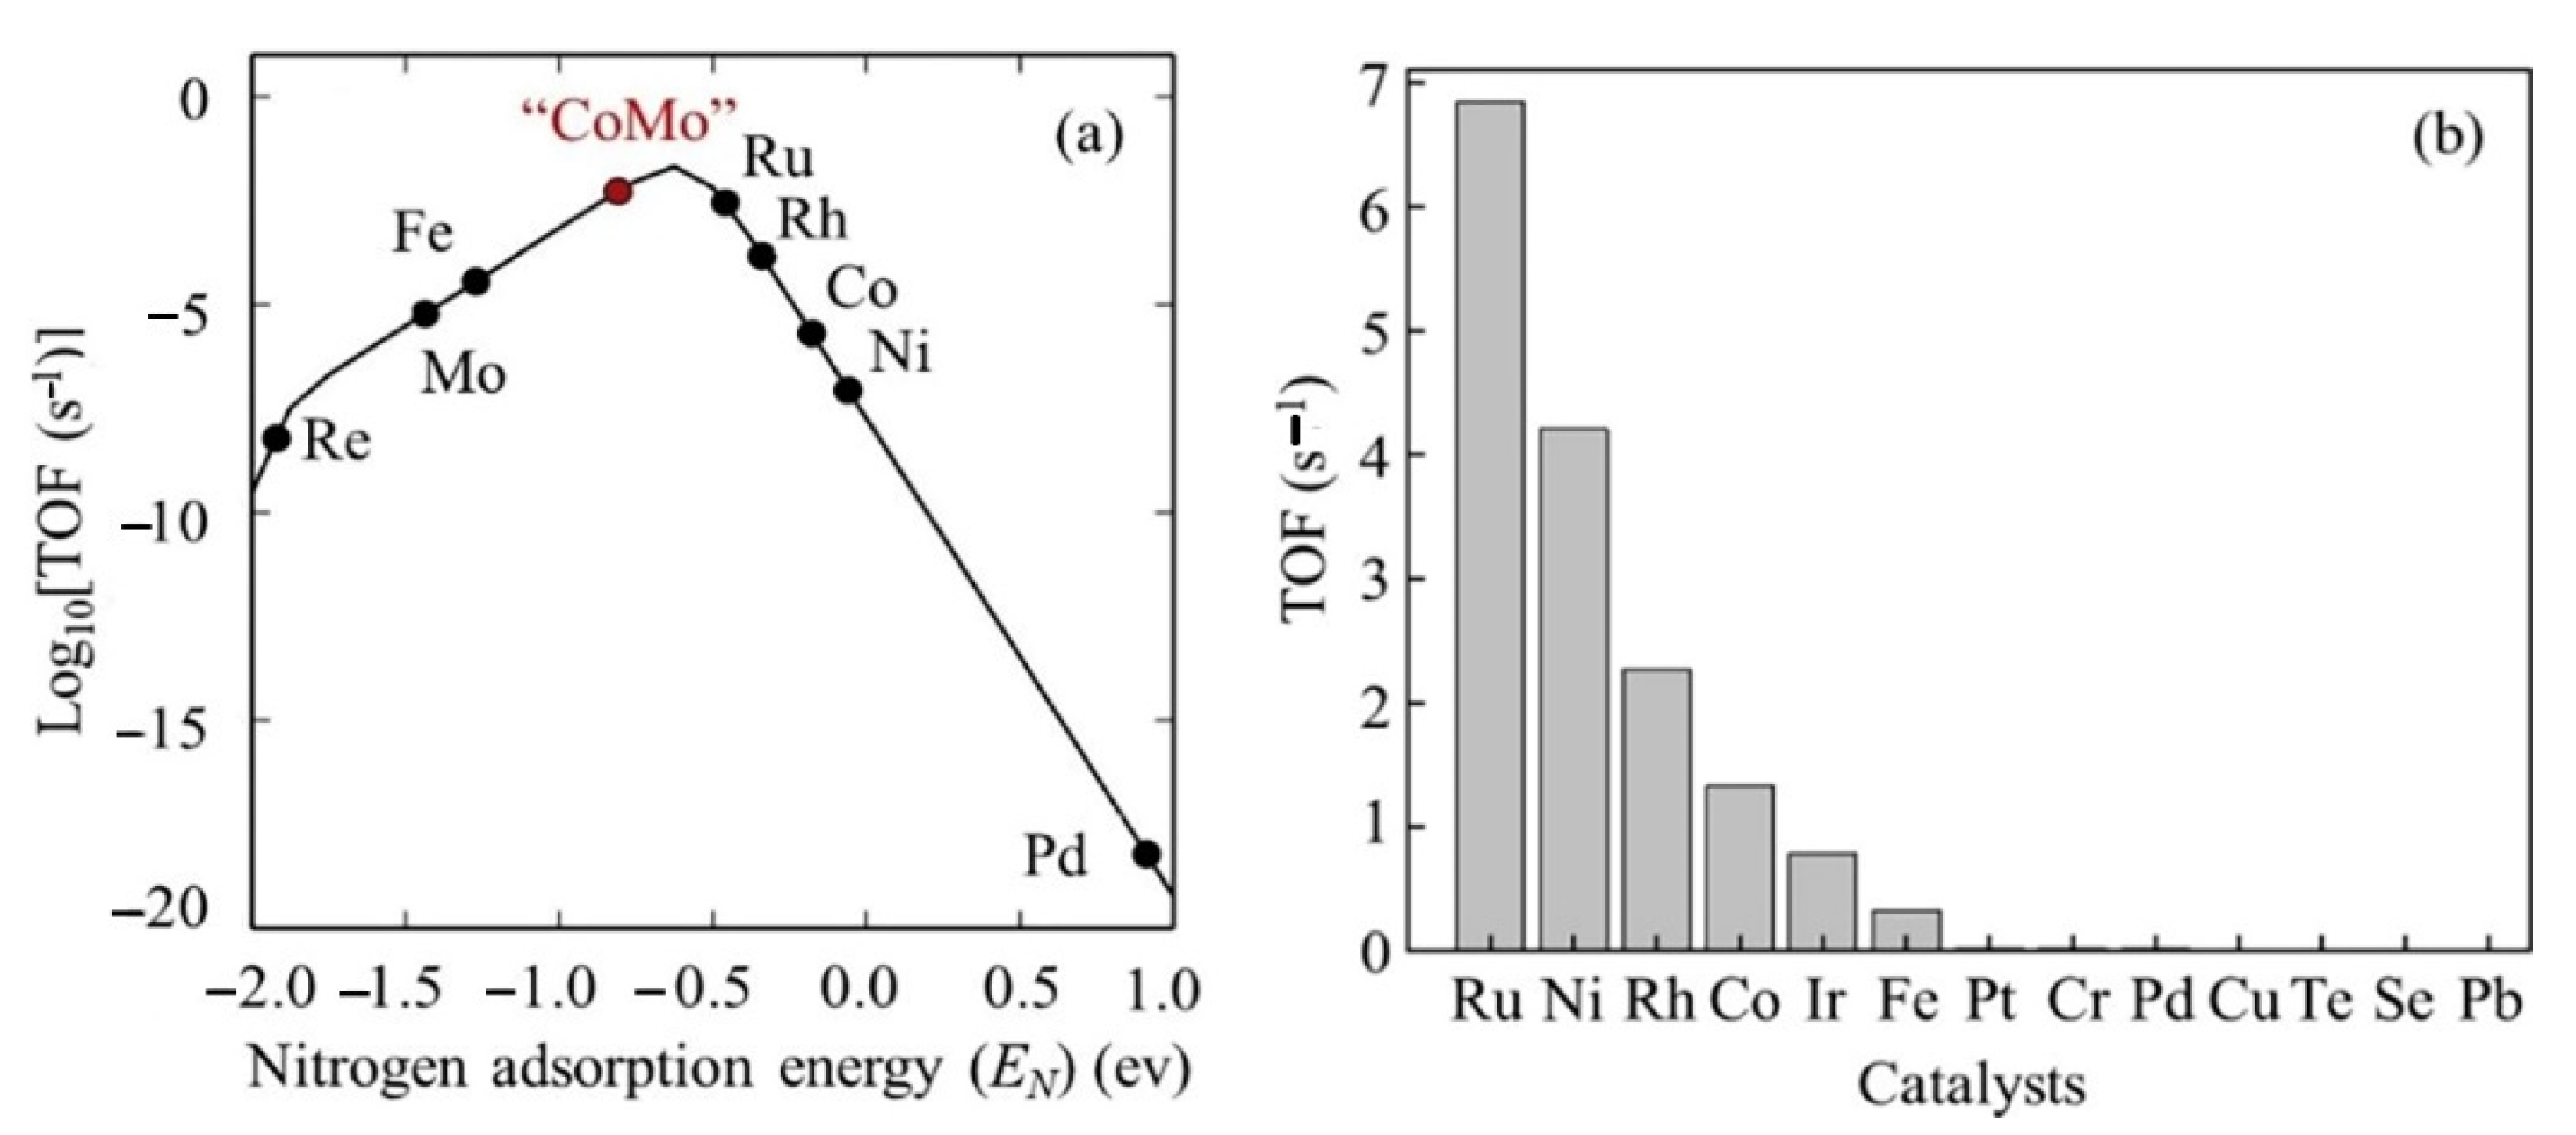
5.2.1. Catalysts Characterization, Activity and Performance

Catalytic ammonia cracking is a general technology for producing hydrogen. These catalysts consist of a transition metal, a promoter, supporter, and/or a second catalytic metal. The several factors need to be considered in the assessing of different catalysts, such as, pure metal catalysts, oxides or alloys, cost, long-term stability, and efficiency. This could include noble or precious metals and non-precious metals based on their costs, types and properties [112,115].
The most precious metals used as catalysts in catalytic decomposition include Cr, Co, Cu, Fe, Ir, Ni, Pd, Pt, Rh, Ru, Se, and Te, alloys of aluminum oxide with nickel, Ru and Pt, and alloys of iron with other metal oxides, and examples of non-precious metals include Al, Ce, Si, Sr, and Zr [43,44,115,116].
Catalysts can also be categorized into perovskite and non-perovskite types based on the similarity of their crystal structures to mineral calcium titanium oxide (CaTiO3). There is a subgroup of perovskites that consists of heavier halides (Cl, Br, and I), both fully inorganic and hybrid organic–inorganic ones, as well as the many variants. They exhibit unique sensitivity and long-term stability. Moreover, catalysts with metal–support interaction enhancement, the application of promoters, and bimetallic alloys have also been developed to overcome the high activation energy barrier [103,117,118].
Catalyst reaction rates and catalytic activity can be enhanced by the type of active metal, type of support material with good physical properties, particle size, surface area, dispersion of the catalyst, and activity of the promoting material. The presence of the additives and the alteration of the support material can modify the nitrogen desorption step and the catalytic properties of the catalyst, such as Al2O3–TiO2, which is used commercially as a support for the catalysts [119,120].
The catalytic activity and performance of different single-metal catalysts are in the order of Ru > Ni > Rh > Co > Ir > Pt ≅ Fe> Cr > Pd > Se ≅ Cu > Te > Pb, respectively [101]. Various high activity elements can be used as catalyst supports to replace the expensive Ru for the economical cracking of ammonia to hydrogen [121]. The catalytic activity varies with different ammonia concentrations and different types of support materials, such as platinum or palladium, or for example, for Ni components, i.e., Ni/Y2O3 > Ni/Gd2O3 > Ni/Sm2O3 > Ni/La2O3 > Ni/Al2O3 > Ni/CeO2 [121,122].
The performance of catalysts can be evaluated by the turnover frequency (TOF) as a quantifying rate of reaction in terms of catalytic activity and decomposition conditions. The TOF is the number of moles of reactant consumed or moles of product per mole of catalyst per unit of time (s–1 or h–1), which is significantly influenced by the catalytic activity of different catalysts metals [113,122], the catalysts nitrogen adsorption energy [118], and particle size [86]. The catalytic activity is generally lowered with a reduction in the catalyst particle size, for example, in nickel-based catalysts [86]. It is also influenced by the forms (pelletized and powder) of the supported materials [48].
Moreover, the activity for single-metal catalysts, is a function of the nitrogen binding energies (QN(0)) [115]. The TOF is defined in terms of turnover number (TON) and time of reaction, as in the following equation [122,123]:
TOF = TON   time   of   reaction
where the turnover number (TON) is a dimensionless value, defined as the number of moles of reactant consumed per mole of catalyst before deactivation under given reaction conditions [53]. The TON is an important parameter for evaluating the stability of the catalyst and is associated with the temperature, the concentration of the substrate, the deactivation of the catalyst and its pre-activation (zero slope), as shown in Figure 27. The decomposition conditions significantly influence their catalytic performance and can provide a real measure of the efficiency of a catalyst [120,121,122,123].
Nanocarbon technology can contribute to the commercialization of hydrogen production from ammonia by increasing the catalyst performance, reaction surface area, reactivity, secured durability and expanding facilities. The catalytic ability of nanostructured electro-catalysts usually varies with size and morphology [124].

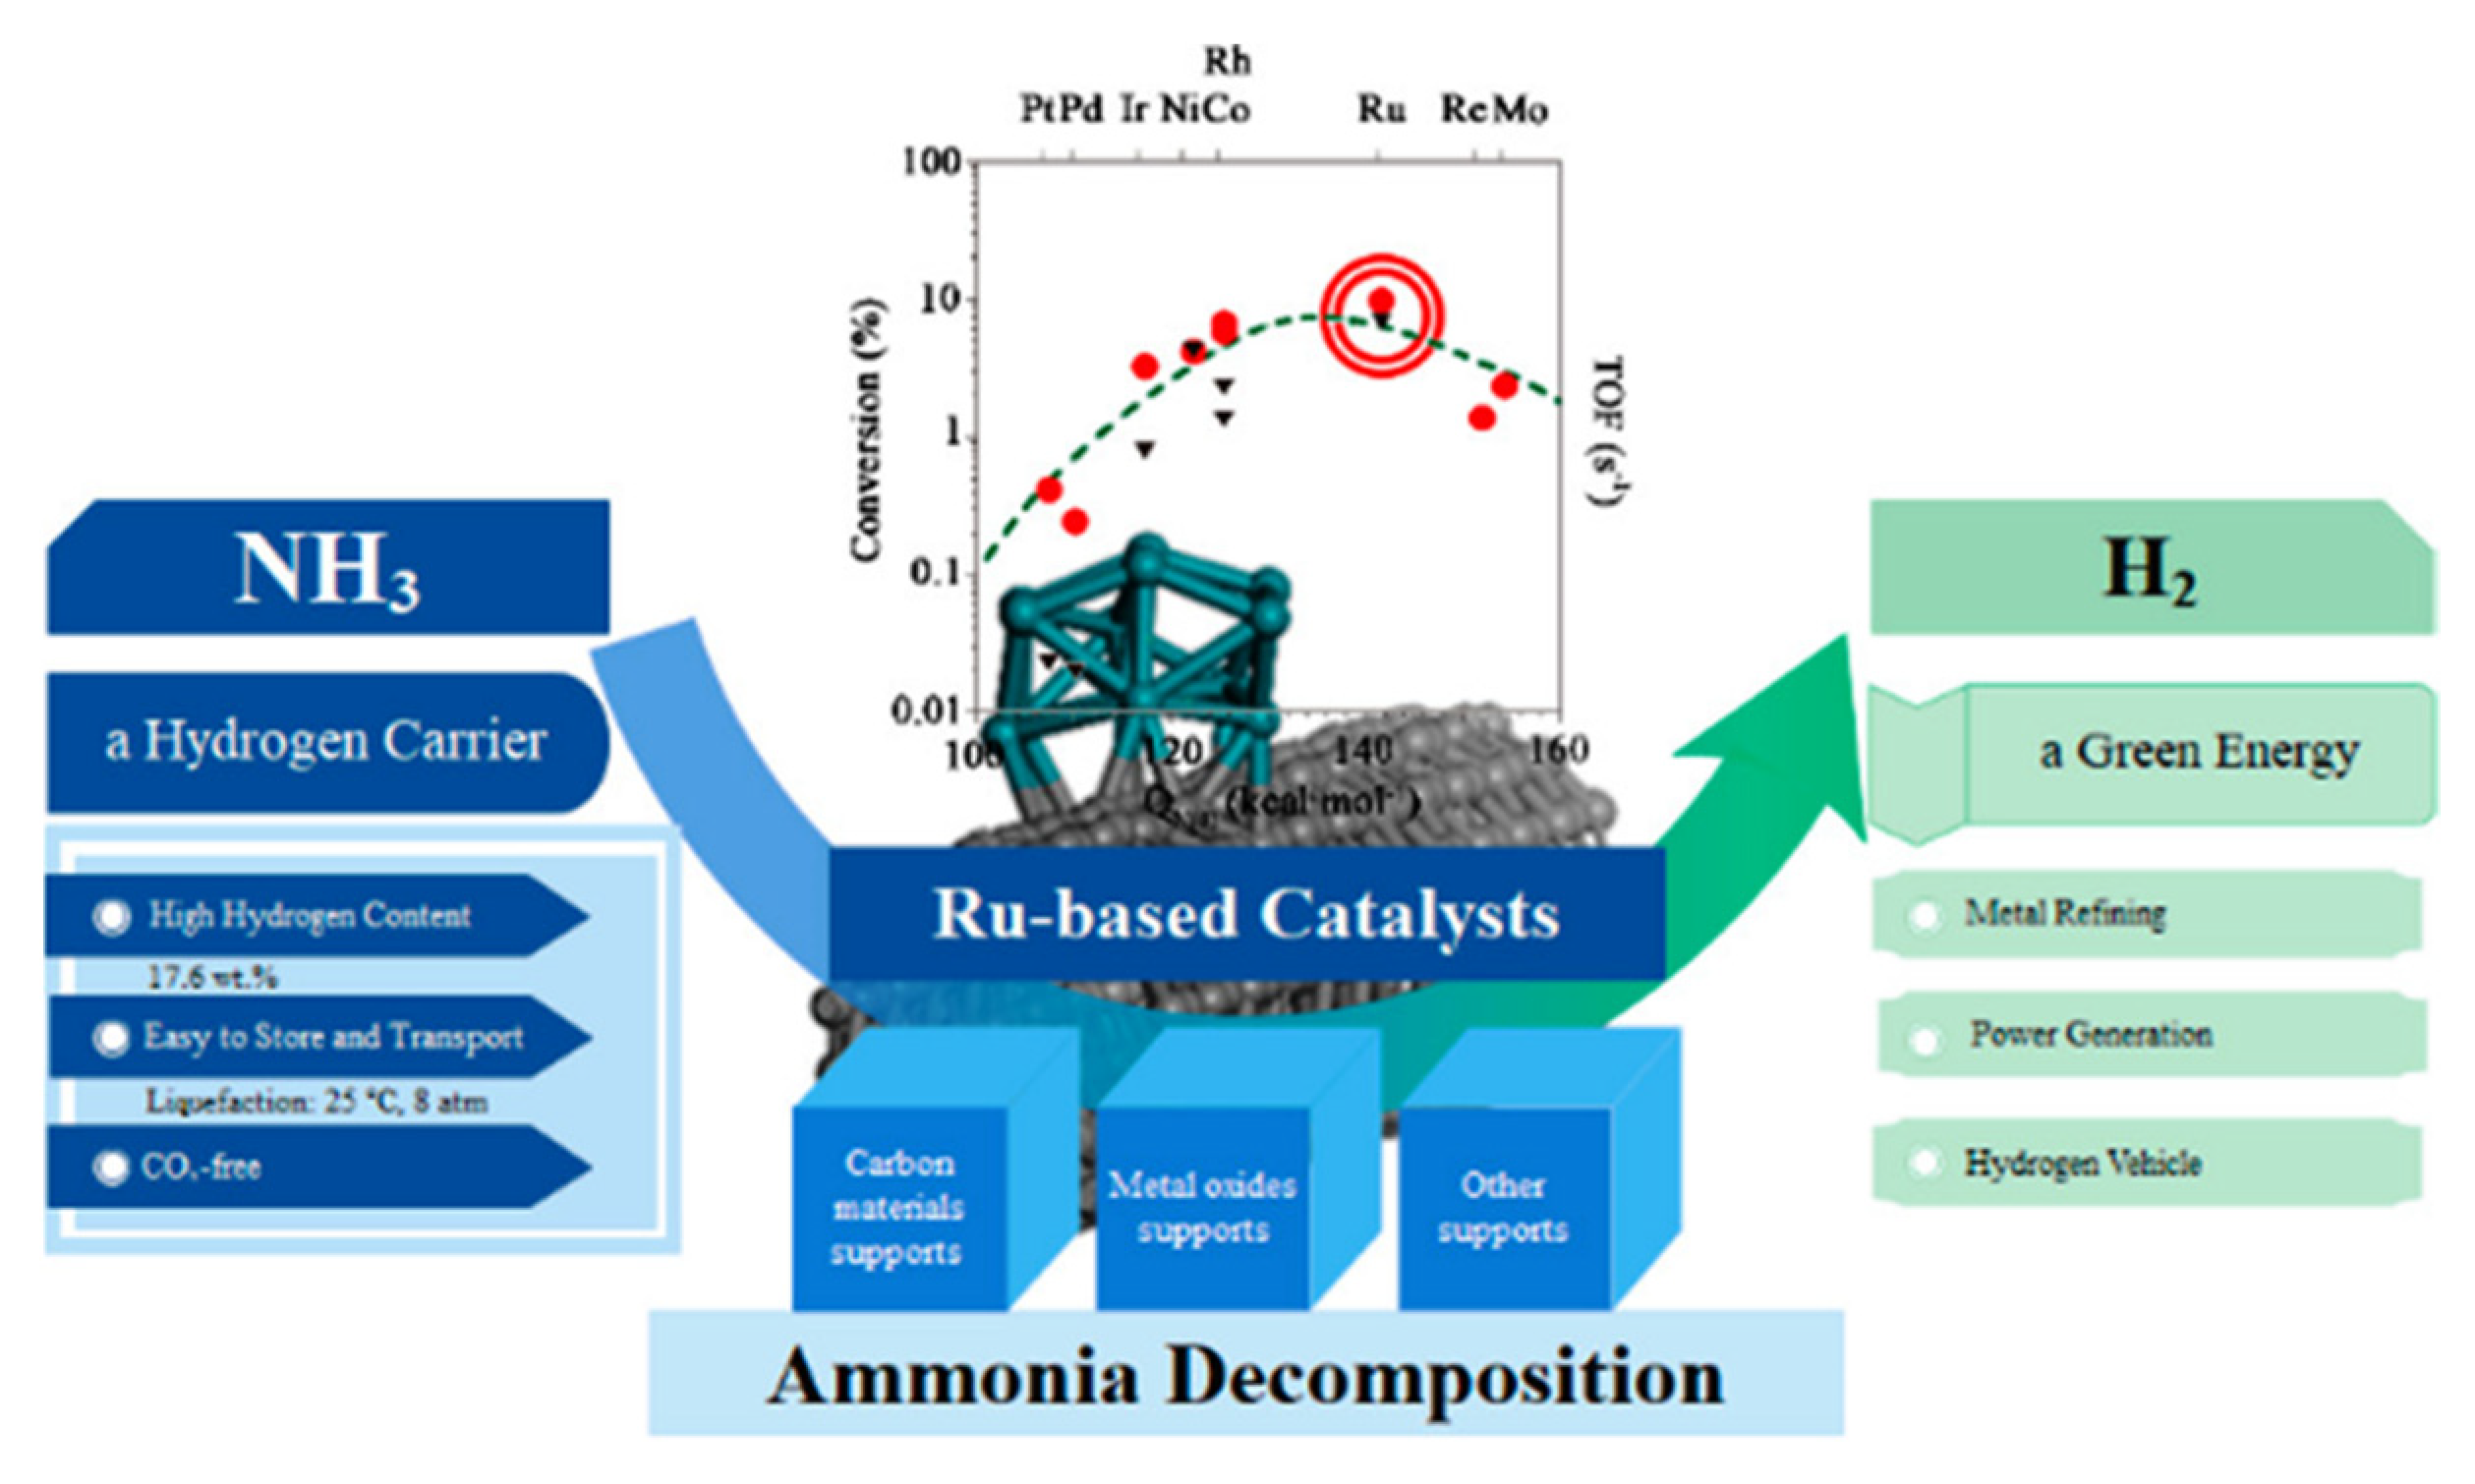
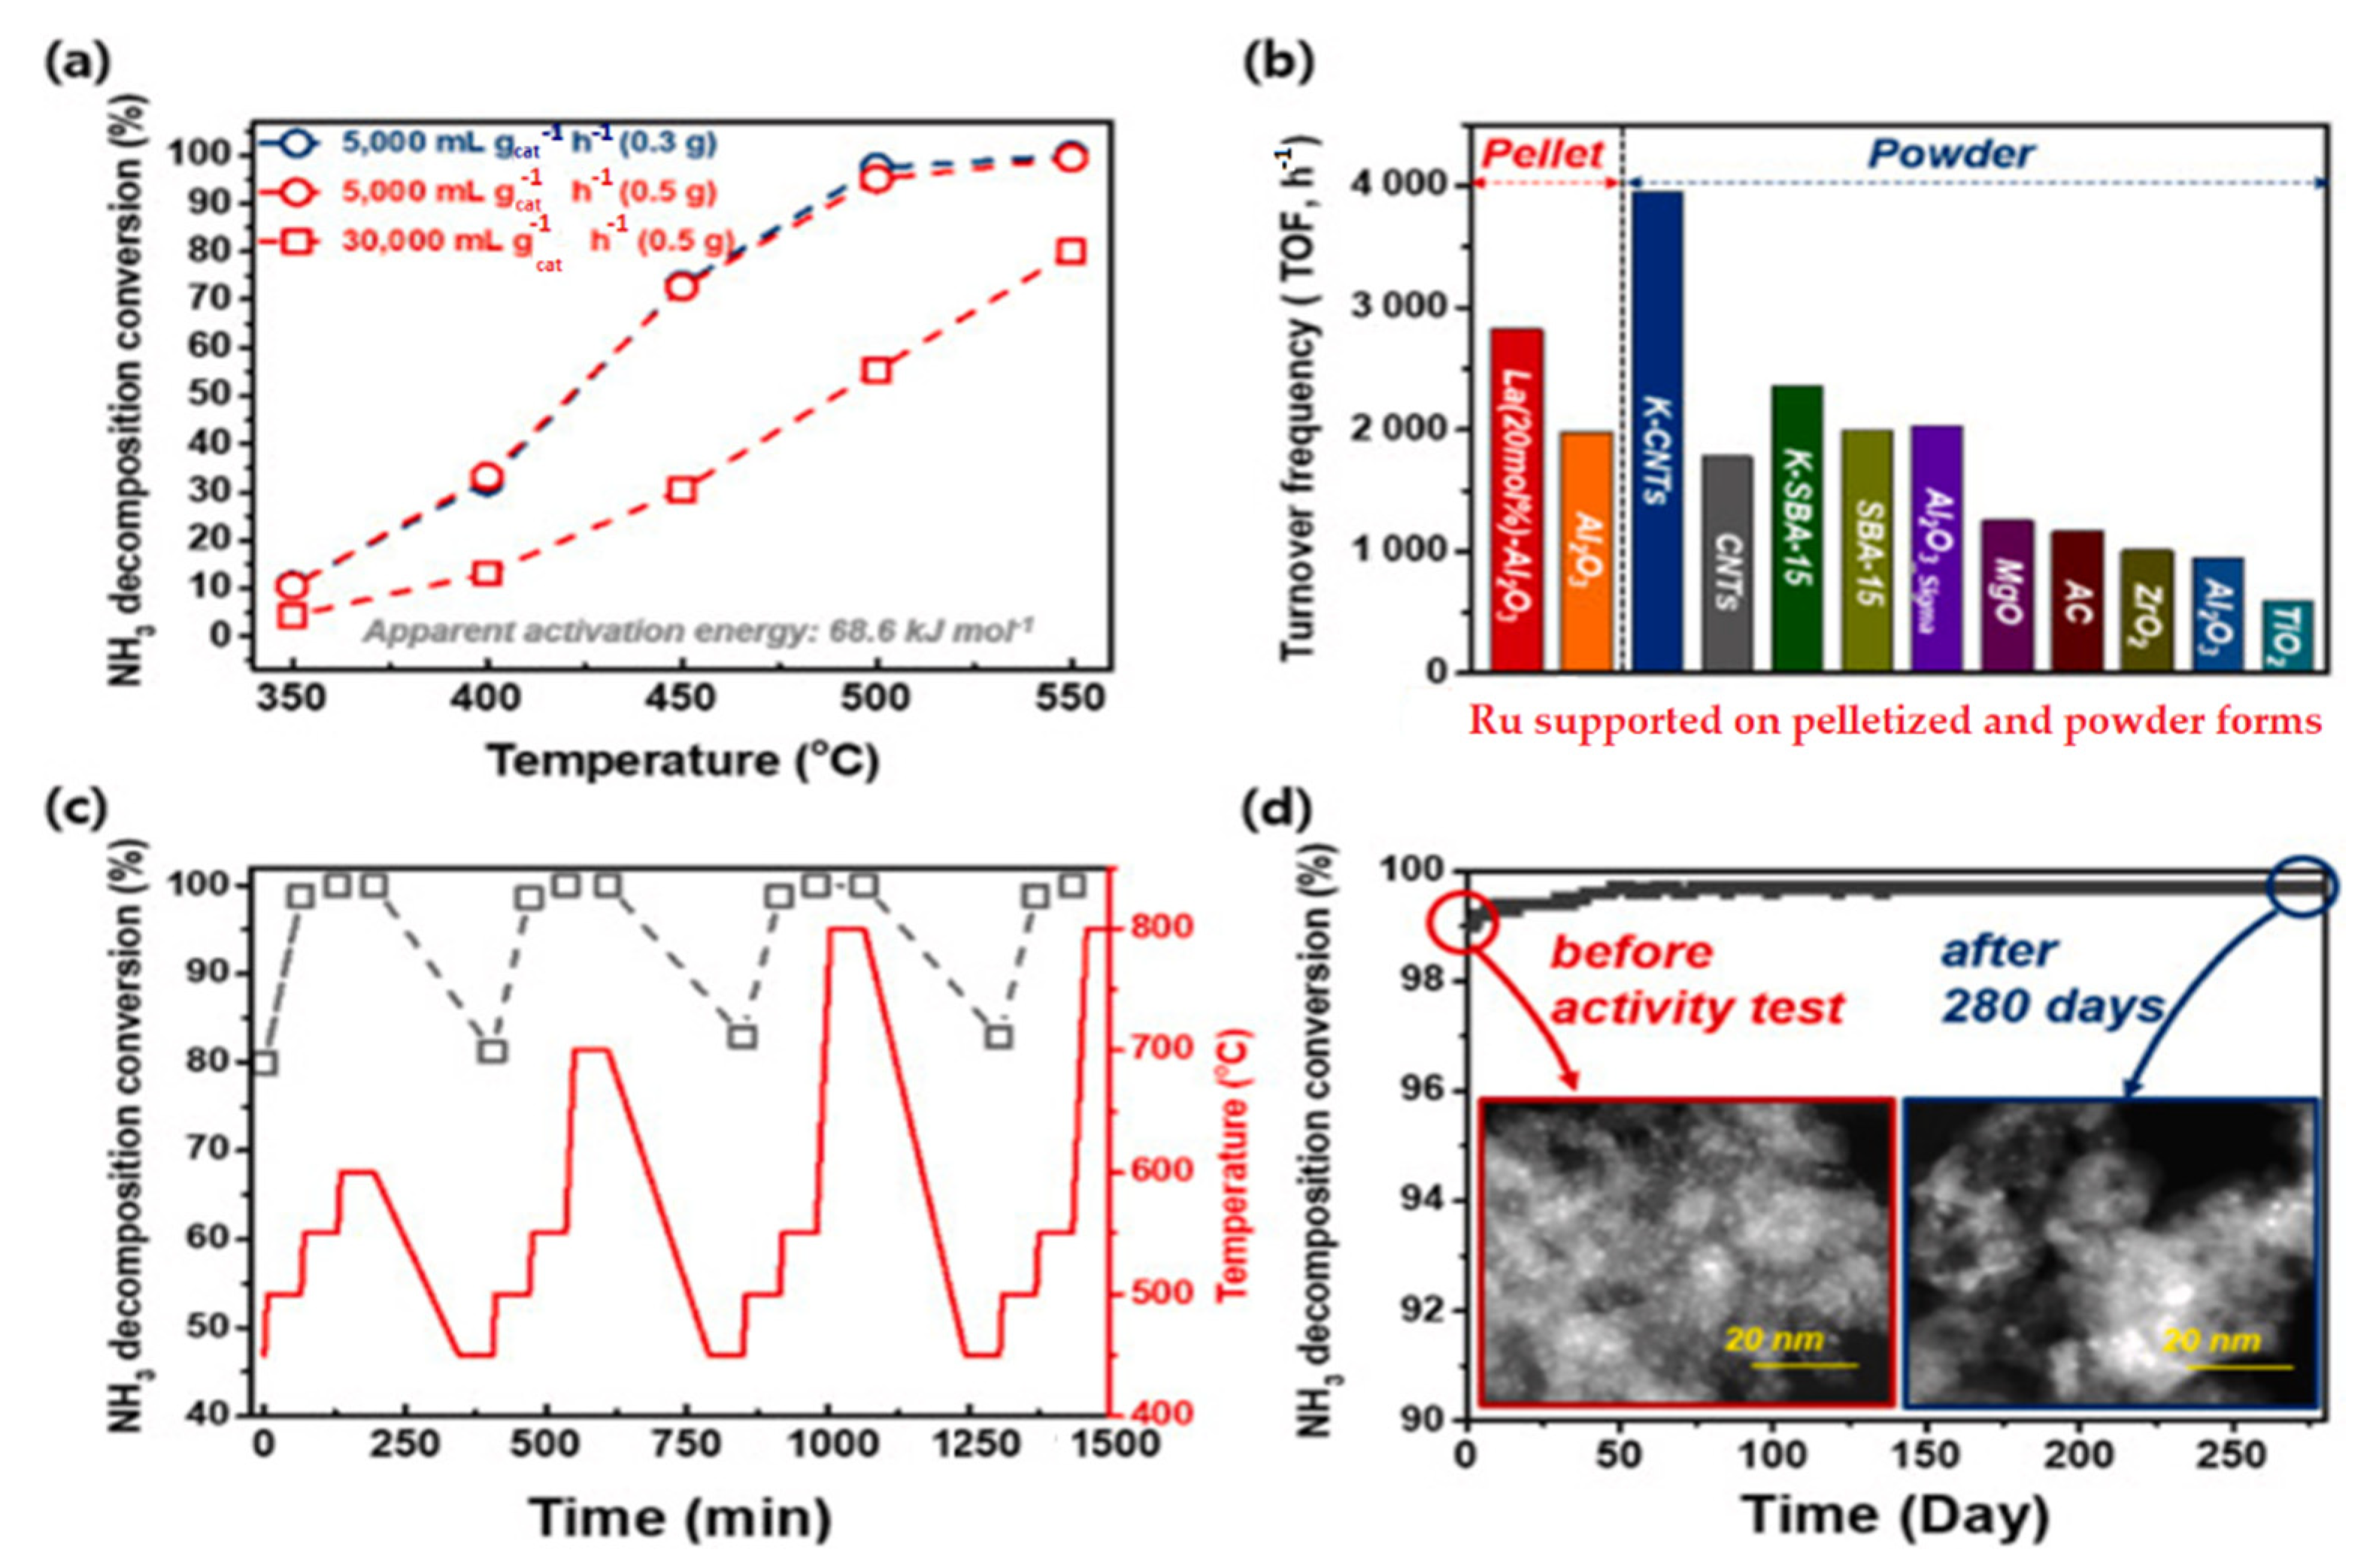
5.2.2. Ru-Based Catalysts

Ru is the most active metal among Ru, Rh, Pt, Pd, Ni, and Fe supported on carbon-based supports and metal oxides. Theoretical studies support the fact that an Ru surface has optimal binding energy with a nitrogen atom, leading to the highest ammonia decomposition activity among mono-metals (Figure 28) [98,117,118]. An Ru-based catalyst for ammonia conversion has the highest turnover frequencies (TOF) among the single-metal catalysts, which is presented as a function of the nitrogen binding energies (QN(0) kcal/mol), as shown in Figure 29 [109].
Ru-based catalysts supported on carbon materials (Figure 30) have been proposed as the most efficient catalysts for the ammonia cracking reaction [43,44,115,116]. Using Ru or Cs-Ru as a catalyst, carbon powder pre-treatment solutions and catalyst deposition conditions were obtained with a maximum ammonia conversion rate of 90% and hydrogen generation rate of 29.8 mmol/min gcat at 673 K. Ru, when supported on carbon nanotubes (CNTs), increases decomposition conversion, achieving an ammonia conversion level of about 84.65%, with an H2 formation rate of 28.35 mmol/min gcat, and maintaining the effective area of the catalyst under reaction conditions, ambient pressure and a temperature of 773 K. This is due to the high dispersion of Ru particles and the inhibition of particle growth of the catalyst, resulting in the stability of the catalyst and high catalytic activity [43,44,115,116]. The performance of the catalysts for the ammonia decomposition reaction can be enhanced by applying them over different supported materials, such as ruthenium-based catalysts on carbon materials, as the most suitable supports include active carbons, high surface area graphite carbon CNTs, and carbon nanofibers [125,126,127].
Due to the properties of an Ru-NCX heterogeneous hybrid nanocomposite catalyst containing Ru, N, and C atoms, the activity and durability of the release of hydrogen from ammonia at temperatures ranging from 475 to 550 °C were enhanced compared to Ru. If the Ru catalyst was fixed through the activation process using the CO2 of a carbon xerogel (Figure 31), the decomposition rate was 3.5 times higher than that of the existing deactivated catalyst at 450 ℃. Carbon support, nitrogen, and sodium elements were used to promote the activation of the catalyst [110,124,125].
Some Ru-based catalysts are used for ammonia cracking, such as Ru/CNTs, which have higher catalytic activity than Ru/MgO, Ru/AC, Ru/ZrO2, and Ru/Al2O3 respectively (Table 12). In addition, adding a potassium (K) promoter increased the ammonia conversion to about 97.3% and resulted in a hydrogen formation rate of 32.6 mmol/(gcat min) at an ammonia flow rate GHSV of 60,000 mL/(gcat h) at 450 °C [115]. After the Ru/CNT was modified with potassium nitrate, carbonate or potassium hydroxide (KOH) as the best promoter, the rate of ammonia cracking and the rate of hydrogen evolution significantly improved to 99.74%, and the hydrogen formation rate reached 47.88 mmol/min gcat. The Ru-based catalysts (Ru-Na/CNT) have shown a high conversion of ammonia (100%) at a low temperature of 673 K. The high activity of ruthenium nanoparticles was with sizes in the range of 3 to 5 nm [86].
The hydrogen production from ammonia decomposition on a commercial 5 wt% Ru-activated carbon catalyst with different cesium (Cs) loading at lower temperatures of 325–400 °C in the fixed-bed reactor showed the Cs effects on the ammonia conversion at a higher Cs/Ru molar ratio. Enhancing the Cs/Ru molar ratio increased the ammonia conversion with a maximum value of 4.5 as the optimum Cs loading, with almost 100% of the ammonia converted (with the GHSV (gas hourly space velocity) from 48,257 to 241,287 mL/(h·gcat), at 400 °C [103].
According to Figure 32, the ammonia decomposition conversion increased over the Ru (2 wt%)/La (20 mL%)-Al2O3 at temperatures of 350 to 550 °C under different GHSVs of 5000–30,000 mL/gcat hr and catalyst loadings. The TOF comparisons of various Ru supported on pelletized and powder forms show, among powder forms, that KCNTs have the highest and TIO2 has the lowest, and in pelletized forms, La Al2O3 has the highest value of TOF [48].
The perovskite catalyst Ru/La–Al2O3 pellet had a high catalytic activity of 2827 h−1 at 450 °C and stability for over 6700 h at 550 °C, exceeding the performance efficiency of 83.6% for producing hydrogen over 66 L/min. According to Figure 32, the simulation of the typical ammonia hydrogen production process showed that the performance of the pellets with the Ru(2 wt%)/La-Al2O3 perovskite structure is 98% or higher at 550 °C [48].
Although Ru-based catalysts show the highest catalytic activity in high ammonia concentrations at the temperature of 425 to 500 °C, it has the disadvantage of scarcity and quick deactivation that impedes the large-scale application of ammonia decomposition, and it is expensive, resulting in a high cost of ammonia decomposition [102].

5.2.3. Non-Ru-Based Catalysts

Ammonia hydrogen production technology has a clear tendency to replace expensive Ru-based catalysts with other materials [48]. High catalytic activity of the non-Ru catalysts can be achieved by modifying the primary catalyst component, adding promoter and support materials, and using inactive metals with further treatments of surface modifications and alloying techniques [120,128]. Ammonia decomposition at low temperatures with advanced catalyst that are cheaper than ruthenium, need to consider the mechanisms of the reaction kinetics, the effects of catalyst formulation and synthesis, catalyst modification including promoters and supports, and increasing the efficiency with nanotechnology and using two or more promoters at the same time [81].
Various types of transition metals, including promoters and supports, have been developed to replace precious catalysts. It is important to develop transition metal catalysts with low cost and high stability, such as Fe, Co, and Ni, etc. Among them, cobalt has been considered a replaceable metal of Ru due to its low cost and nitrogen adsorption [102].
Polycrystalline foils and wires made of Pd and Ir were used at low temperatures from 500 to 1190 K to reduce the mass of the catalyst, demonstrating the impact of catalyst form on the performance of ammonia decomposition and showing an improvement in the reaction rate. The decomposition rate of ammonia on Ir was high compared with other metals (Ir > Rh > Pt >Pd), respectively [113].
Ammonia decomposition over a series of fine powders of a Fe–MOx catalyst (M represents different metal components Ce, Al, Si, Sr, and Zr) showed that Fe–(Ce, Zr)O2 was highest because the additive (Ce, Zr)O2 solution worked as a solid acid to enhance the ammonia adsorption and reaction probability of Fe components at relatively low temperatures. A CeO2 promotor was used to increase the catalytic activity by the surface area of the catalyst, and Ni/Al2O3 was used for the stability of catalysts for ammonia decomposition, resulting in a conversion of 98.3% and hydrogen formation rate of 32.9 mmol/min gcat at 823 K [43,44,115,116].
One example of an alternative catalyst includes layers of well-dispersed Ni on mesoporous γ-alumina. This catalyst is low cost, stable and exhibits high activity, achieving complete conversion of pure NH3 at a temperature of 880 K, which makes this catalyst a promising candidate for in-situ H2 generation from ammonia to feed fuel cells in vehicles or industry [43,44,115,116].
The decomposition rate increases with the partial pressure of ammonia on surface sites of the basal planes of metals such as tungsten, platinum, and molybdenum sulfide (MoS1.65) nanocrystals at high temperatures [81,129]. The activity of ammonia decomposition improves by combining bimetallic catalysts, such as molybdenum, which has a high nitrogen binding energy with cobalt with a low binding energy and adding traces of Co to Fe [81].
Metal-sulfide photocatalysts are used in hydrogen production, CO2 reduction, pollutant decomposition, and N2 fixation due to their suitable band-gap energy, active sites, and outstanding optoelectronic properties [113]. Other alternative catalysts to expensive metals are nitrides and carbides of transitional metals, such as Fe, Co, Ni, Ti, V, Mn, and Cr, which have a high activity, as their N2 nitrogen desorption is the rate-determining step [113].
The nickel and cobalt in the form of carbon-supported cobalt catalysts can have a high ammonia conversion rate of about 350–400 °C due to weaker nitrogen binding and effectiveness activity [114]. The La-based perovskite, such as LaMO3 (M = La-Co, La-Ni, La-Ce-Co and La-Ce-Ni) and LaCeNiO3 catalyst, can replace Ru in the ammonia conversion due to their physical properties, the surface area and pore-size distribution. According to Figure 33, ammonia decomposition over perovskite-type lanthanum-based catalysts increased at different temperatures in the range of 300–600 °C and at a GHSV of 6000 h−1 [130].
The ammonia decomposition reaction over perovskite-based polymers of a lanthanum-based catalyst consisting of calcined nickel and cobalt showed a higher catalytic performance for La- and Ni (LaNiO3) than Co(LaCoO3) catalyst, with a conversion rate of 99% at 450 °C (Figure 34) [131].
Nickel-based catalysts can be used for ammonia decomposition as highly efficient non-Ru catalysts. The catalytic performance of catalysts is significantly influenced by the properties of the support [132]. They need preparation procedures and are expensive. Their efficiency depends on supports, which are highly active if supported on ceramic materials and inactive on carbon materials [133]. Although, some of its components, such as the Ni/MgAl2O4, can be used as an economical and highly efficient non-Ru catalyst. According to Figure 35, the Ni/MgAl2O4- LDH catalyst with high thermal stability, through calcined layered double hydroxide (LDH) supports, showed an ammonia conversion efficiency rate of 90% at 600 °C [132].
The main obstacle is hydrogen passivation/poisoning of the catalytic surface to attain a low-temperature conversion of the process. Furthermore, nitrogen association for this reaction can be rate-limited over an Mo3N2 cluster for an ammonia decomposition reaction. Some non-precious Mo2N-based catalysts reached the highest decomposition of 100% at 823 K [115]. Furthermore, according to Figure 36, the ammonia decomposition over Ni-based catalysts on metal oxides supported with Ni/Y2O3 reached 99.74%, and the hydrogen formation rate was 47.88 mmol/min gcat as a function of temperature [111].
The sizes of nickel particles have an effect on their activity and and their turnover frequencies (TOF) in the decomposition of ammonia. As displayed in Figure 37, the nickel particles with average sizes below 2.9 nm showed considerable activity, with an optimum value of 2.3 nm [86].
The cobalt-based catalysts consisted of a promoter element of 1% K and the use of 5% Co. Silicon carbide support (SiC) showed an excellent conversion performance of 100% at 450° C (Figure 38). The performance of cobalt was less than Ru, but it has a lower price and thus can be used as an alternative for developing a catalyst suitable for commercial purposes [133,134]. The Co3O4 nanoparticles were dispersed densely on the barium hexa-aluminate (BHA) surface, with excellent catalytic stability for high ammonia conversion rates [102].
Using alkali metal imides and amides, such as sodium amide (NaNH2) or lithium amide, Li2NH, due to their unique reaction mechanism, can increase ammonia decomposition at temperatures lower than 450 °C compared with the higher temperatures above 600 °C required for other catalysts to reach 100% conversion efficiency [81]. A comparison of the performance of lithium and sodium amide supported with nickel (Ni) and ruthenium catalysts for ammonia decomposition into hydrogen is represented in Figure 39. The catalytic performance of lithium for an ammonia flow rate of 500 sccm (cm3/min) at 580–600 °C was 99% (for 1 g of lithium imide), which was higher than sodium and other catalysts [81,135].

6. Other Ammonia Decomposition Technologies

This section takes a look at other ammonia decomposition technologies, such as electrochemical ammonia decomposition and photodecomposition technology. The separation processes of hydrogen stream from unconverted ammonia and nitrogen. In addition to these, the purification of hydrogen is briefly discussed.

6.1. Electrochemical Decomposition of Ammonia

The technology of electrochemical ammonia decomposition is an alternative to high-temperature thermal decomposition for producing high-purity and green hydrogen at near-ambient conditions and with high conversion rates, with the potential for large-scale development of clean energy. It includes hydrogen evolution reactions and ammonia oxidation reactions [53,136].
The electrochemical reaction of the electrolyzer to decompose ammonia by the electric current under ambient conditions of temperature and pressure is shown in the following reactions:
Ammonia electro-oxidation: 2NH3(aq) + 6OH → N2(g) + 6H2O + 6e, E0 = −0.77 V
Reduction of water: 6H2O + 6e → 3H2(g) + 6OH, E0 = −0.83 V
Similarly, hydrogen can also be produced from ammonia using ammonia electrolysis. In this mechanism, an alkaline electrolytic cell is used to couple ammonia electro-oxidation and hydrogen evolution. To date, the process has been determined to be too slow for practical implementation. The electro-catalytic method using aqueous alkali electrolytes has required high operating potentials, implying poor energy efficiency, and has suffered from catalyst deactivation over time [53]. The theoretical voltage of the ammonia electrolysis required is 95% less than for water electrolysis, for which the cell voltage is 1.223 V. However, practically, higher energy is required to overcome the obstacle of the catalytic process kinetics, and thus, it is important to develop efficient and highly selective catalysts [136].
Electro-catalysts in the ammonia electro-oxidation, such as Pt-based binary or ternary alloys, can provide higher catalytic activity and stability that improve the slow kinetics at the anode [136].
The polymer gel electrolyte reduced the onset potential for H2 evolution and consequently increased H2 production, NH3 conversion and Faraday efficiency before anode electro-catalyst poisoning occurred. The mechanical strength of the polymer gel needs to be improved [85].
Nickel doping in cobalt-based compounds induced the active sites and consequently enhanced electrochemical hydrogen evolution performance at lower operating temperatures and produced more pure hydrogen than the thermochemical decomposition method, resulting in enhanced electrochemical performance compared to water electrolysis [124].
Numerous promoting materials have been adopted to increase catalytic activity, including K, Na, Li, Ce, Ba, La, and Ca. In addition, K-based compounds, such as KNO3, KOH, K2CO3, KF, KCl, K2SO4 and KBr, also have potential as promoting materials. These promoting materials donate their electrons to the surface of the support material, leading to charge balance during the decomposition. The promoting material also facilitates intermediate-step stabilization due to its low ionization energy. Moreover, support materials, which are electronically conductive, cheap and have a high surface area, are also expected to improve catalytic activity. Potential support materials include carbon nanotubes, template SiO2, porous Al2O3, active carbon, graphitic carbon and mesoporous carbon [17,53,62,112,137].
The proton-conducting electrolyte cesium dihydrogen phosphate CsH2PO4 (CDP) is a catalyst used in electrochemical ammonia decomposition for hydrogen production without residual ammonia problems and a performance rate of 1.48 molH2 g−1 h−1 production at 250 °C [53]. A thermal decomposition catalyst (Cs promoted Ru on nanotubes) with an all-solid-state electrochemical conversion cell (based on CsH2PO4) is a device that is operable at 250 °C. The resulting polarization curves indicate high current density at a modest voltage (far beyond what can be attained from alkali electrolyte cells), as well as catalyst utilization efficiency that far exceeds traditional thermal decomposition [137,138,139].
Hydrogen was generated in an ammonia electrochemical cell (AEC) using 0.06 V of electricity from renewable energy on a proton-conducting membrane in the presence of a catalyst at 250 °C, which is much lower than the thermal energy required from traditional fossil-fuel methods at 500 to 600 °C. However, after removing the hydrogen, the ammonia-splitting reaction proceeds beyond what the catalyst can achieve alone, but the generation rate stay at 1.5 mmol/min/ per g catalyst. Performance of the systems is related to temperature, type and concentration of impurity of hydrogen stream [140,141].
The hybrid thermal–electrochemical technology for converting ammonia to hydrogen integrates a solid-state proton conductor with an advanced thermal-cracking catalyst, providing a highly efficient process free of residual ammonia without the risk of generating NOx. It directly produces highly pure hydrogen equivalent to the consumed energy without any loss. Using a very low energy (0.4 V) results in a hydrogen production rate comparable to that from thermal decomposition at a high temperature of 350 to 500 °C [53]. A schematic of the hybrid thermal–electrochemical cell for on-demand ammonia-to-hydrogen conversion is demonstrated in Figure 40. The thermal cracking layer (TCL) is adjacent to the hydrogen electro-catalyst layer (EL), which is, in turn, adjacent to a membrane of the solid-state proton conductor (CDP) [53]. Nanotechnologies use a CNT-Ru catalyst coated on carbon nanotubes for the electrochemical cell. The catalytic ability of a nanostructured electro-catalyst usually varies with size and morphology [124].

6.2. Photocatalytic Ammonia Decomposition

The energy supply of photodecomposition technology can be provided by radiation of an electron beam, ion beam, plasma, microwave, radio frequency (RF), and solar energy for the decomposition of ammonia over a metal-loaded photocatalyst in a reactor to obtain a high hydrogen yield (H2 μmol/g-cat) with the high conversion rate [113].
The microwave and radio frequency systems (RF) and ultraviolet radiation (UV) technologies can supply the energy required for obtaining hydrogen from decomposing ammonia over a photocatalyst at room temperature. The industrial microwave and RF operate within a range of frequencies (2.45, 1.356, 0.915 GHz, and 2.712 MHz) provided by the reaction temperature of the reactor [44,114,116].
The recent active photocatalysts, including nanostructures, C3N4, graphene and other carbon-based materials, as well as their hybrid catalysts and metals with larger work function, can provide more effective catalysts, such as ZnO and TiO2-based catalysts (Pt/M-TiO2 and Pt/Fe–TiO2) [43,44,116,142]. The hydrogen production rate increased with increasing specific surface area in the photocatalytic ammonia decomposition over the various platinum-based (Pt(0.1)/TiO2) photocatalysts (different specific surface area) in a reactor with flowing water vapor, without flowing water vapor, and fixed-bed flow reactor, especially for the specific surface area of less than 100 m2/g [116,143,144].
A high rate of hydrogen production was obtained from decomposing aqueous ammonia solutions over Pt/TiO2 photocatalysts under UV irradiation of a 500 W Xe lamp at room temperature. The process is shown in Figure 41 [145].
The performance of ammonia decomposition when using radiant solar energy can be optimized based on three indicators with similar optimization directions, including heat absorption rate, entropy generation rate, and thermal efficiency. The entropy generation rate and energy conversion rate were enhanced due to an increase in the heat absorption rate, while the thermal efficiency decreased, as exhibited in Figure 42. Solar energy with an intensity of 800 W/m2, which provided a temperature of 400 K, meeting the requirements for ammonia decomposition, resulted in an energy conversion rate of 39.6%, a thermal efficiency of 52.1%, and an entropy generation rate of 23.9 W/K [98].
The production of hydrogen from ammonia water over TIO2 catalysts (N/Fe/TiO2) doped with metal ions (Fe, Ag, Ni) and nitrogen using plasma energy showed an energy efficiency and hydrogen production efficiency rate of 60%, which was higher than 50% for conventional electrolysis, and the efficiency increased by controlling the band gap energy [43]. The highest yield of hydrogen obtained from decomposing aqueous ammonia solution with Fe-doped TiO2 photocatalysts (Pt/Fe–TiO2) is shown under UV irradiation at room temperature [44].
Photo-electro-catalytic which achieved by depositing CuO on TiO2 nanotube rows (TiNTAs), reaching hydrogen production from decomposition of ammonia with a maximum efficiency of 50.1%. This reaction can be activated by the UV radiation of the mercury lamp and control of the band gap energy at the anode by using nanostructure control and inexpensive materials [145].

6.3. Separation and Purification Technologies

The released hydrogen stream from the ammonia decomposition reactor, has a high purity without carbon monoxide. But it may contain some amount of unreacted ammonia, which can damage the catalyst after recirculating through the system for hydrogen recovery. Therefore, the output gas needs to be separated and purified [146]. Hydrogen obtained from the water electrolysis, or from catalyst cracker system using a magnesium chloride trap [135], has high purity and does not require separation process [66,147,148,149].
Generally, a hydrogen stream containing unreacted ammonia can be cooled and compressed to liquefy the ammonia and remove it, recirculated to the plasma membrane reactor system to be decomposed, or passed through a mineral acid solution (such as H2SO4) in a series of contact scrubbers. The ammonia reacts with the acid to form ammonium sulfate salt while the H2 passes unreacted through the acid [100].
There are several technologies used to separate and purify hydrogen from gas mixtures, such as hydrogen-selective membranes or cryogenic distillation for condensing the impurities and adsorbing them. Alternative technologies for purifying hydrogen at low energy intensities are pressure-driven membrane processes, an electrochemical membrane technology based on PEMs with effective hydrogen recovery from H2/N2 gas mixtures. Pressure-driven membrane processes are used for hydrogen production because they are not very energy intensive, and they yield high-purity hydrogen. However, membrane technologies are advantageous over other purification methods as they commonly depend on high-pressure feed streams, and hydrogen embrittlement is often experienced. Electrochemical hydrogen separation is a one-step operation with the possibility of high separation efficiency at low cell voltages. It can capture and store CO2 from the feed without the requirement for any further treatment [149,150].
A commercial process used for a global hydrogen product of 85% is pressure swing adsorption (PSA), which performs adsorption and desorption at alternating high pressures and high partial pressures (of 10–40 bar) until reaching the equilibrium pressure loading. It can remove a large number of impurities corresponding to the difference in adsorption to desorption loading, at a constant temperature, within few-minute short cycles [151,152]. Due to differences in hydrogen characteristics and conditions, a combination of technologies (PSA and cryogenic distillation) or a steam-washing scrubber may be required [152,153].
There are several techniques for removing the remaining ammonia from syngas, including thermal incineration, which produces NOx, scrubbing, which produces wastewater, and the catalytic method, which uses several catalysts at temperatures over 650 °C with less energy efficiency [117,118]. The various organic and inorganic catalysts for the cleanup of the presence of ammonia in syngas are developed on different materials, such as activated carbon (2–20 mgNH3/g sorbent), metal organic frameworks (MOFs-0.27–105 mgNH3/g sorbent), covalent organic frameworks (272 mgNH3/g sorbent), MCM-41 (136 mgNH3/g sorbent), alumina (34 mgNH3/g sorbent), silica gel (85 mgNH3/g sorbent), and zeolites (130 mgNH3/g sorbent) [154]. The zeolite-supported iron (Fe/HZβ) catalyst in the hot-gas cleanup of remaining ammonia (800 ppm NH3 in the gas mixture) demonstrates better catalytic activity for ammonia decomposition compared to selective catalytic oxidation (SCO) techniques at temperatures of 300–550 °C [155]. Inorganic sorbent materials that are supported with high salt loadings and metal halides are stable such as metal borohydride and metal fullerides; and can improve ammonia separation from gaseous streams at room temperature, and improve the partial pressure of ammonia near atmospheric pressure. For example, carbon silica composites of 2% loaded MgCl2 are capable of separating ammonia at temperatures above 200 °C [117,118].
The purity of hydrogen is important for PEM fuel cells (PEMFC) and phosphoric acid fuel cells (PAFC) because of their electrolyte sensitivity to ammonia [149]. Residual ammonia of more than 0.1 ppm in the fuel stream can damage the catalysts of polymer electrolyte membrane fuel cells (PEMFC) or decrease the performance of electrochemical decomposition in aqueous solution due to charge-transfer and diffusion resistances, resulting in higher tolerance to impurities and better sustainability [53,111,120,156].
Membrane-based separations can simultaneously remove nitrogen at temperatures higher than 320 °C and provide low-cost separation by coating a single membrane in cheap material (Pd-coated vanadium). A multifunctional membrane reactor with Pd membrane walls or a Ru-carbon catalyst at low temperatures can be used for the generation of high-purity hydrogen with excellent performance [41,66].

7. The Challenges and Conclusions

7.1. The Present and Future of Hydrogen and Ammonia Production

Hydrogen production is considered from the view of feedstocks, energy sources, pathways, and technology in terms of efficiency, cost, and emission. The efficiency of hydrogen production methods is dependent on their environmental emissions, total cost, such as the cost of natural gas and electricity, and their energy and exergy efficiencies.
Technologies for hydrogen production require several processes, such as thermochemical, radiochemical, electrochemical, photochemical, biochemical, and integrated systems. In view of its feedstocks and energy sources, there are pathways for producing various types of grey, blue and green hydrogen from carbon-based and renewable resources.
Hydrogen is conventionally generated from fossil fuels by reforming, plasma arc decomposition, coal gasification, and biomass gasification methods, and with high energy and exergy efficiencies among them, SMR has the highest efficiency, and thus, it is commonly used.
An alternative technology is water electrolysis using electricity power to generate pure hydrogen with high conversion rates at ambient conditions without the requirement of a purification system. However, currently, electricity has a high cost and emits GHG.
Pure hydrogen can be produced on a large scale as a by-product of mature industrial technologies, without additional purification processes, as well as from waste materials, biochemical processes of microorganisms, and combinations of dark fermentation and anaerobic digestion. However, these processes have low conversion efficiencies and need more development.
Ammonia, as a renewable hydrogen carrier, is considered to produce hydrogen due to its high contents of hydrogen (17.65%) and relative ease of transport and handling energy. Furthermore, it can supply conversion energy with the utilization of ammonia combustion. Ammonia is converted into hydrogen under high temperatures in the presence of a suitable catalyst under standard pressure. Ammonia production can be divided into three main types (grey, blue, and green) based on its feedstocks and emissions. Grey ammonia is synthesized through the thermochemical processes, including gasification of coal, reforming of natural gas, naphtha reforming, pyrolysis, and auto-thermal reactor (ATR), with high carbon emissions. Blue ammonia with lower carbon is obtained by adding the carbon capture process. Green ammonia can be produced from renewable feedstocks such as air and water with sustainable energy sources using water electrolysis instead of natural gas, oil, or coal.
The Haber–Bosch process is the most common, well-established, economic, and sustainable method of ammonia production. The exergy efficiencies for ammonia production from natural gas is 65.8% and from biomass-based is 41.3%, with the overall emission range between 0.5 and 2.3 tCO2/tNH3. Biomass gasification has lower efficiency but is cheaper than natural gas, and it has the additional possibility of using the produced syngas for electricity generation.
Green ammonia can be produced from renewable feedstock and sustainable energy sources, such as air and water, by using water electrolysis instead of natural gas, oil, or coal. However, it is expensive to produce in a green way without carbon dioxide, and its production process needs more development.

7.2. Challenges of Generating Hydrogen from Ammonia Technologies

Although the utilization of ammonia can play a role in reducing CO2 emissions, its combustion as fuel produces NOx. Therefore, it is preferred to convert ammonia to hydrogen, which can be a major carbon-free energy carrier for future energy systems and can provide sustainable energy for power, industry, buildings, and transport systems.
Table 13 demonstrates some challenges faced in producing hydrogen from ammonia. The hydrogen production from ammonia requires high temperatures, which can be obtained by the combustion of carbon-based fuels, and electrical heating, but renewables such as ammonia or hydrogen are preferred because of costs, availability, and ecofriendly.
The main ammonia-to-hydrogen conversion methods can be summarized based on the technology, temperature and efficiency, as represented in Table 14. An alternative to thermal decomposition is the electrochemical method. Furthermore, the radiation energy of an electron beam, ion beam, plasma, RF, microwave, and solar energy, for the decomposition of ammonia over the photocatalyst can provide a high hydrogen conversion rate.
The thermochemical conversion methods of ammonia to hydrogen are considered for their efficiency, reaction temperature, reactors and catalysts for achieving higher conversion efficiency under economic conditions.
The selection of a suitable method from the available technology for converting ammonia to hydrogen requires consideration of the material, temperature and energy requirements, purification and separation facilities, conversion and energy efficiency, purity, and yield of hydrogen production.
However, the studies suggested some ways to overcome the challenges throughout the ammonia decomposition for the hydrogen production process [34,62,80,81]. Therefore, more efforts and innovations in the technology of ammonia decomposition to hydrogen, are required to improve energy efficiency, reliability and scalability, which will allow selection of the most suitable utility systems with minimal energy requirements and lower operating costs [12,17,43,44,81].

7.3. Efforts for Cost Reduction Technology

Ru-based catalysts are generally used in ammonia cracking for producing hydrogen as they have the highest catalytic activity in high ammonia concentrations at temperatures of 425 °C to 500 °C and can reduce emissions ranging from 78% to 95%, but they have the disadvantages of scarcity and quick deactivation that impede the large-scale application as an expensive process, resulting in a high cost of ammonia decomposition.
Efforts have been made to find alternative catalysts to replace Ru, which can be from the various transition metals, including the promoters and supports, such as Fe, Co, Ni, Ti, V, Mn, and Cr, which have high activity, high stability, weaker nitrogen binding, effectiveness activity, and low cost.
The components of transitional metal include nitrides, carbides, alkali metals, imides and amides (NaNH2, Li2NH). Because of their unique reaction mechanism, fine powder catalysts of Fe, Ce, Al, Si, Sr, and Zr can be applicable in ammonia decomposition at relatively low temperatures.
Nano carbon technology can increase catalyst performance, reaction surface area, reactivity, secured durability, and the size of facilities. The catalytic ability of nanostructured electro-catalysts usually varies with size and morphology. However, some other limitations exist in industrial-scale applications.
There are several technologies used to separate and purify hydrogen from remaining ammonia and nitrogen, such as hydrogen-selective membranes and cryogenic distillation to condense the impurities and adsorb them.
Alternative technologies for purifying hydrogen at low energy intensities are pressure-driven membrane processes and electrochemical membrane technologies based on PEMs, which can generate high-purity hydrogen with high performance and result in a low-cost separation. However, they are currently used in fuel cells and do not have the performance and efficiency required for large-scale hydrogen purification. Although, demand of hydrogen purity in industrial utilization can be less than that of fuel cells.
However, pressure swing adsorption (PSA) is a commercial process that performs adsorption and desorption at alternating high pressures and can remove large amounts of impurities at a constant temperature within a few minutes. Because of differences in hydrogen characteristics and conditions, a combination of technologies (PSA and cryogenic distillation) or the steam-washing scrubber may be required. All of the available technologies for purifying hydrogen from gas mixtures currently have some advantages and disadvantages.
Therefore, more efforts and innovations are required in the technologies of ammonia decomposition to hydrogen to improve their energy efficiency, reliability, and scalability. These issues can be accomplished by transitioning to hydrogen energy on a large scale, which would result in a highly efficient energy system with reduced costs.
The review results show that only using hydrogen or ammonia cannot solve the problem of environmental emissions of fuels, and more efforts are required to improve the production technology, in addition to using raw low-carbon materials and energy sources to generate free-carbon hydrogen. Therefore, this paper focuses on ammonia as a renewable source and provides a suitable cracking method and catalyst for producing green fuel in the future.

Author Contributions

Conceptualization, D.S.; methodology, D.S.; resources, H.A.Y.R.; data curation, H.A.Y.R.; writing—original draft preparation, H.A.Y.R.; writing—review and editing, H.A.Y.R.; visualization, H.A.Y.R.; supervision, D.S.; project administration, D.S.; funding acquisition, D.S. All authors have read and agreed to the published version of the manuscript.

Funding

This research was funded by KETEP (Korea Institute of Energy Technology Evaluation and Planning) No. 202003040030090 and KEIT (Korea Evaluation Institute of Industrial Technology) No. 20213030040550.

Data Availability Statement

Not applicable.

Conflicts of Interest

The authors declare no conflict of interest.

References

  1. Dincer, I.; Acar, C. Review and evaluation of hydrogen production methods for better sustainability. Int. J. Hydrogen Energy 2015, 40, 11094–11111. [Google Scholar] [CrossRef]
  2. Ye, M.; Sharp, P.; Brandon, N.; Kucernak, A. System-level comparison of ammonia, compressed and liquid hydrogen as fuels for polymer electrolyte fuel cell powered shipping. Int. J. Hydrogen Energy 2022, 47, 8565–8584. [Google Scholar] [CrossRef]
  3. Zhang, X.; Jiao, K.; Zhang, J.; Guo, Z. A review on low carbon emissions projects of steel industry in the World. J. Clean. Prod. 2021, 306, 127259. [Google Scholar] [CrossRef]
  4. International Energy Agency. Net Zero by 2050: A Roadmap for the Global Energy Sector; International Energy Agency: Paris, France, 2021; 224p, Available online: https://www.iea.org/reports/net-zero-by-2050 (accessed on 20 September 2021).
  5. Thomas, H. Options for Producing Low-Carbon Hydrogen at Scale; The Royal Society: London, UK, 2018. [Google Scholar]
  6. De Pee, A.; Pinner, D.; Roelofsen, O.; Somers, K. Decarbonization of Industrial Sectors: The Next Frontier; McKensy: Atlanta, GA, USA, 2018. [Google Scholar]
  7. Hordeski, M.F. Alternative Fuels—The Future of Hydrogen; River Publishers: Gistrup, Denmark, 2020. [Google Scholar]
  8. Eichman, J.; Townsend, A.; Melaina, M. Economic Assessment of Hydrogen Technologies Participating in California Electricity Markets; National Renewable Energy Lab. (NREL): Golden, CO, USA, 2016. [Google Scholar]
  9. International Energy Agency. The Future of Hydrogen: Seizing Today’s Opportunities; International Energy Agency: Paris, France, 2019. [Google Scholar]
  10. Deloitte, B.E. The Potential of Hydrogen for the Chemical Industry; Deloitte: Beirut, Lebanon, 2021. [Google Scholar]
  11. McKinlay, C.J.; Turnock, S.R.; Hudson, D.A. Route to zero emission shipping: Hydrogen, ammonia or methanol? Int. J. Hydrogen Energy 2021, 46, 28282–28297. [Google Scholar] [CrossRef]
  12. Andersson, J.; Grönkvist, S. Large-scale storage of hydrogen. Int. J. Hydrogen Energy 2019, 44, 11901–11919. [Google Scholar] [CrossRef]
  13. Hollevoet, L.; De Ras, M.; Roeffaers, M.; Hofkens, J.; Martens, J.A. Energy-Efficient Ammonia Production from Air and Water Using Electrocatalysts with Limited Faradaic Efficiency. ACS Energy Lett. 2020, 5, 1124–1127. [Google Scholar] [CrossRef] [Green Version]
  14. Forsberg, C. Addressing the low-carbon million-gigawatt-hour energy storage challenge. Electr. J. 2021, 34, 107042. [Google Scholar] [CrossRef]
  15. Park, C.; Koo, M.; Woo, J.; Hong, B.I.; Shin, J. Economic valuation of green hydrogen charging compared to gray hydrogen charging: The case of South Korea. Int. J. Hydrogen Energy 2022, 47, 14393–14403. [Google Scholar] [CrossRef]
  16. Thomas, J.M.; Edwards, P.P.; Dobson, P.J.; Owen, G.P. Decarbonising energy: The developing international activity in hydrogen technologies and fuel cells. J. Energy Chem. 2020, 51, 405–415. [Google Scholar] [CrossRef]
  17. Jeerh, G.; Zhang, M.; Tao, S. Recent progress in ammonia fuel cells and their potential applications. J. Mater. Chem. A 2021, 9, 727–752. [Google Scholar] [CrossRef]
  18. Zendrini, M.; Testi, M.; Trini, M.; Daniele, P.; Van Herle, J.; Crema, L. Assessment of ammonia as energy carrier in the use with reversible solid oxide cells. Int. J. Hydrogen Energy 2021, 46, 30112–30123. [Google Scholar] [CrossRef]
  19. El-Shafie, M.; Kambara, S.; Hayakawa, Y. Hydrogen Production Technologies Overview. J. Power Energy Eng. 2019, 7, 107–154. [Google Scholar] [CrossRef] [Green Version]
  20. Burandt, T. Analyzing the necessity of hydrogen imports for net-zero emission scenarios in Japan. Appl. Energy 2021, 298, 117265. [Google Scholar] [CrossRef]
  21. Rogelj, J.; Geden, O.; Cowie, A.; Reisinger, A. Three ways to improve net-zero emissions targets. Nature 2021, 591, 363–365. [Google Scholar] [CrossRef] [PubMed]
  22. Stangarone, T. South Korean efforts to transition to a hydrogen economy. Clean Technol. Environ. Policy 2020, 23, 509–516. [Google Scholar] [CrossRef] [PubMed]
  23. Lemmon, E.W.; Bell, I.H.; Huber, M.L.; McLinden, M.O. NIST Standard Reference Database 23: Reference Fluid Thermodynamic and Transport Properties-REFPROP, Version 10.0; Stand. Ref. Data Program; National Institute of Standards and Technology: Gaithersbg, MD, USA, 2018. [Google Scholar]
  24. Kobayashi, H.; Hayakawa, A.; Somarathne, K.K.A.; Okafor, E.C. Science and technology of ammonia combustion. Proc. Combust. Inst. 2019, 37, 109–133. [Google Scholar] [CrossRef]
  25. Sharma, S.; Ghoshal, S.K. Hydrogen the future transportation fuel: From production to applications. Renew. Sustain. Energy Rev. 2015, 43, 1151–1158. [Google Scholar] [CrossRef]
  26. Liu, X.; Elgowainy, A.; Wang, M. Life cycle energy use and greenhouse gas emissions of ammonia production from renewable resources and industrial by-products. Green Chem. 2020, 22, 5751–5761. [Google Scholar] [CrossRef]
  27. Rivarolo, M.; Riveros-Godoy, G.; Magistri, L.; Massardo, A.F. Clean Hydrogen and Ammonia Synthesis in Paraguay from the Itaipu 14 GW Hydroelectric Plant. ChemEngineering 2019, 3, 87. [Google Scholar] [CrossRef] [Green Version]
  28. Suleman, F.; Dincer, I.; Agelin-Chaab, M. Environmental impact assessment and comparison of some hydrogen production options. Int. J. Hydrogen Energy 2015, 40, 6976–6987. [Google Scholar] [CrossRef]
  29. Akarsu, B.; Genç, M.S. Optimization of electricity and hydrogen production with hybrid renewable energy systems. Fuel 2022, 324, 124465. [Google Scholar] [CrossRef]
  30. Mansour-Satloo, A.; Agabalaye-Rahvar, M.; Mirazaei, M.A.; Mohammadi-Ivatloo, B.; Zare, K.; Anvari-Moghaddam, A. A hybrid robust-stochastic approach for optimal scheduling of interconnected hydrogen-based energy hubs. IET Smart Grid 2021, 4, 241–254. [Google Scholar] [CrossRef]
  31. von Colbe, J.B.; Ares, J.-R.; Barale, J.; Baricco, M.; Buckley, C.; Capurso, G.; Gallandat, N.; Grant, D.M.; Guzik, M.N.; Jacob, I.; et al. Application of hydrides in hydrogen storage and compression: Achievements, outlook and perspectives. Int. J. Hydrogen Energy 2019, 44, 7780–7808. [Google Scholar] [CrossRef]
  32. Ajanovic, A.; Sayer, M.; Haas, R. The economics and the environmental benignity of different colors of hydrogen. Int. J. Hydrogen Energy 2022, 47, 24136–24154. [Google Scholar] [CrossRef]
  33. Åhman, M. When Gold Turns to Sand: A Review of the Challenges for Fossil Fuel Rich States Posed by Climate Policy; IMES/EESS Report No. 124; Lund University: Lund, Sweden, 2021. [Google Scholar] [CrossRef]
  34. Ji, M.; Wang, J. Review and comparison of various hydrogen production methods based on costs and life cycle impact assessment indicators. Int. J. Hydrogen Energy 2021, 46, 38612–38635. [Google Scholar] [CrossRef]
  35. Kroposki, B.; Levene, J.; Harrison, K.; Sen, P.; Novachek, F. Electrolysis: Information and Opportunities for Electric Power Utilities; Technical Report NREL/TP-581-40605; NREL: Golden, CO, USA, 2006. [Google Scholar] [CrossRef] [Green Version]
  36. Edwards, P.P.; Kuznetsov, V.L.; David, W.I.F. Hydrogen energy. Philos. Trans. R. Soc. A Math. Phys. Eng. Sci. 2007, 365, 1043–1056. [Google Scholar] [CrossRef]
  37. Uddin, M.N.; Nageshkar, V.V.; Asmatulu, R. Improving water-splitting efficiency of water electrolysis process via highly conductive nanomaterials at lower voltages. Energy, Ecol. Environ. 2020, 5, 108–117. [Google Scholar] [CrossRef]
  38. Demirbas, A. Future hydrogen economy and policy. Energy Sources, Part B Econ. Planning, Policy 2016, 12, 172–181. [Google Scholar] [CrossRef]
  39. Oni, A.; Anaya, K.; Giwa, T.; Di Lullo, G.; Kumar, A. Comparative assessment of blue hydrogen from steam methane reforming, autothermal reforming, and natural gas decomposition technologies for natural gas-producing regions. Energy Convers. Manag. 2022, 254, 115245. [Google Scholar] [CrossRef]
  40. Fakeeha, A.; Ibrahim, A.A.; Aljuraywi, H.; Alqahtani, Y.; Alkhodair, A.; Alswaidan, S.; Abasaeed, A.E.; Kasim, S.O.; Mahmud, S.; Al-Fatesh, A.S. Hydrogen Production by Partial Oxidation Reforming of Methane over Ni Catalysts Supported on High and Low Surface Area Alumina and Zirconia. Processes 2020, 8, 499. [Google Scholar] [CrossRef]
  41. Kumar, S.S.; Himabindu, V. Hydrogen production by PEM water electrolysis—A review. Mater. Sci. Energy Technol. 2019, 2, 442–454. [Google Scholar] [CrossRef]
  42. Ghavam, S.; Vahdati, M.; Wilson, I.A.G.; Styring, P. Sustainable Ammonia Production Processes. Front. Energy Res. 2021, 9, 580808. [Google Scholar] [CrossRef]
  43. Jung, S.-C.; Chung, K.-H.; Choi, J.; Park, Y.-K.; Kim, S.-J.; Kim, B.-J.; Lee, H. Photocatalytic hydrogen production using liquid phase plasma from ammonia water over metal ion-doped TiO2 photocatalysts. Catal. Today 2022, 397–399, 165–172. [Google Scholar] [CrossRef]
  44. Obata, K.; Kishishita, K.; Okemoto, A.; Taniya, K.; Ichihashi, Y.; Nishiyama, S. Photocatalytic decomposition of NH3 over TiO2 catalysts doped with Fe. Appl. Catal. B Environ. 2014, 160–161, 200–203. [Google Scholar] [CrossRef]
  45. Acar, C.; Dincer, I. Review and evaluation of hydrogen production options for better environment. J. Clean. Prod. 2019, 218, 835–849. [Google Scholar] [CrossRef]
  46. Wen, D.; Aziz, M. Flexible operation strategy of an integrated renewable multi-generation system for electricity, hydrogen, ammonia, and heating. Energy Convers. Manag. 2022, 253, 115166. [Google Scholar] [CrossRef]
  47. Manna, J.; Jha, P.; Sarkhel, R.; Banerjee, C.; Tripathi, A.; Nouni, M. Opportunities for green hydrogen production in petroleum refining and ammonia synthesis industries in India. Int. J. Hydrogen Energy 2021, 46, 38212–38231. [Google Scholar] [CrossRef]
  48. Cha, J.; Park, Y.; Brigljević, B.; Lee, B.; Lim, D.; Lee, T.; Jeong, H.; Kim, Y.; Sohn, H.; Mikulčić, H.; et al. An efficient process for sustainable and scalable hydrogen production from green ammonia. Renew. Sustain. Energy Rev. 2021, 152, 111562. [Google Scholar] [CrossRef]
  49. Kanoglu, M.; Dincer, I.; Rosen, M.A. Understanding energy and exergy efficiencies for improved energy management in power plants. Energy Policy 2007, 35, 3967–3978. [Google Scholar] [CrossRef]
  50. El-Shafie, M.; Kambara, S.; Hayakawa, Y. Energy and exergy analysis of hydrogen production from ammonia decomposition systems using non-thermal plasma. Int. J. Hydrogen Energy 2021, 46, 29361–29375. [Google Scholar] [CrossRef]
  51. Acar, C.; Dincer, I. 3.1 Hydrogen Production. Compr. Energy Syst. 2018, 3, 1–40. [Google Scholar]
  52. Colakoglu, M.; Durmayaz, A. Energy, exergy and economic analyses and multiobjective optimization of a novel solar multi-generation system for production of green hydrogen and other utilities. Int. J. Hydrogen Energy 2022, 47, 19446–19462. [Google Scholar] [CrossRef]
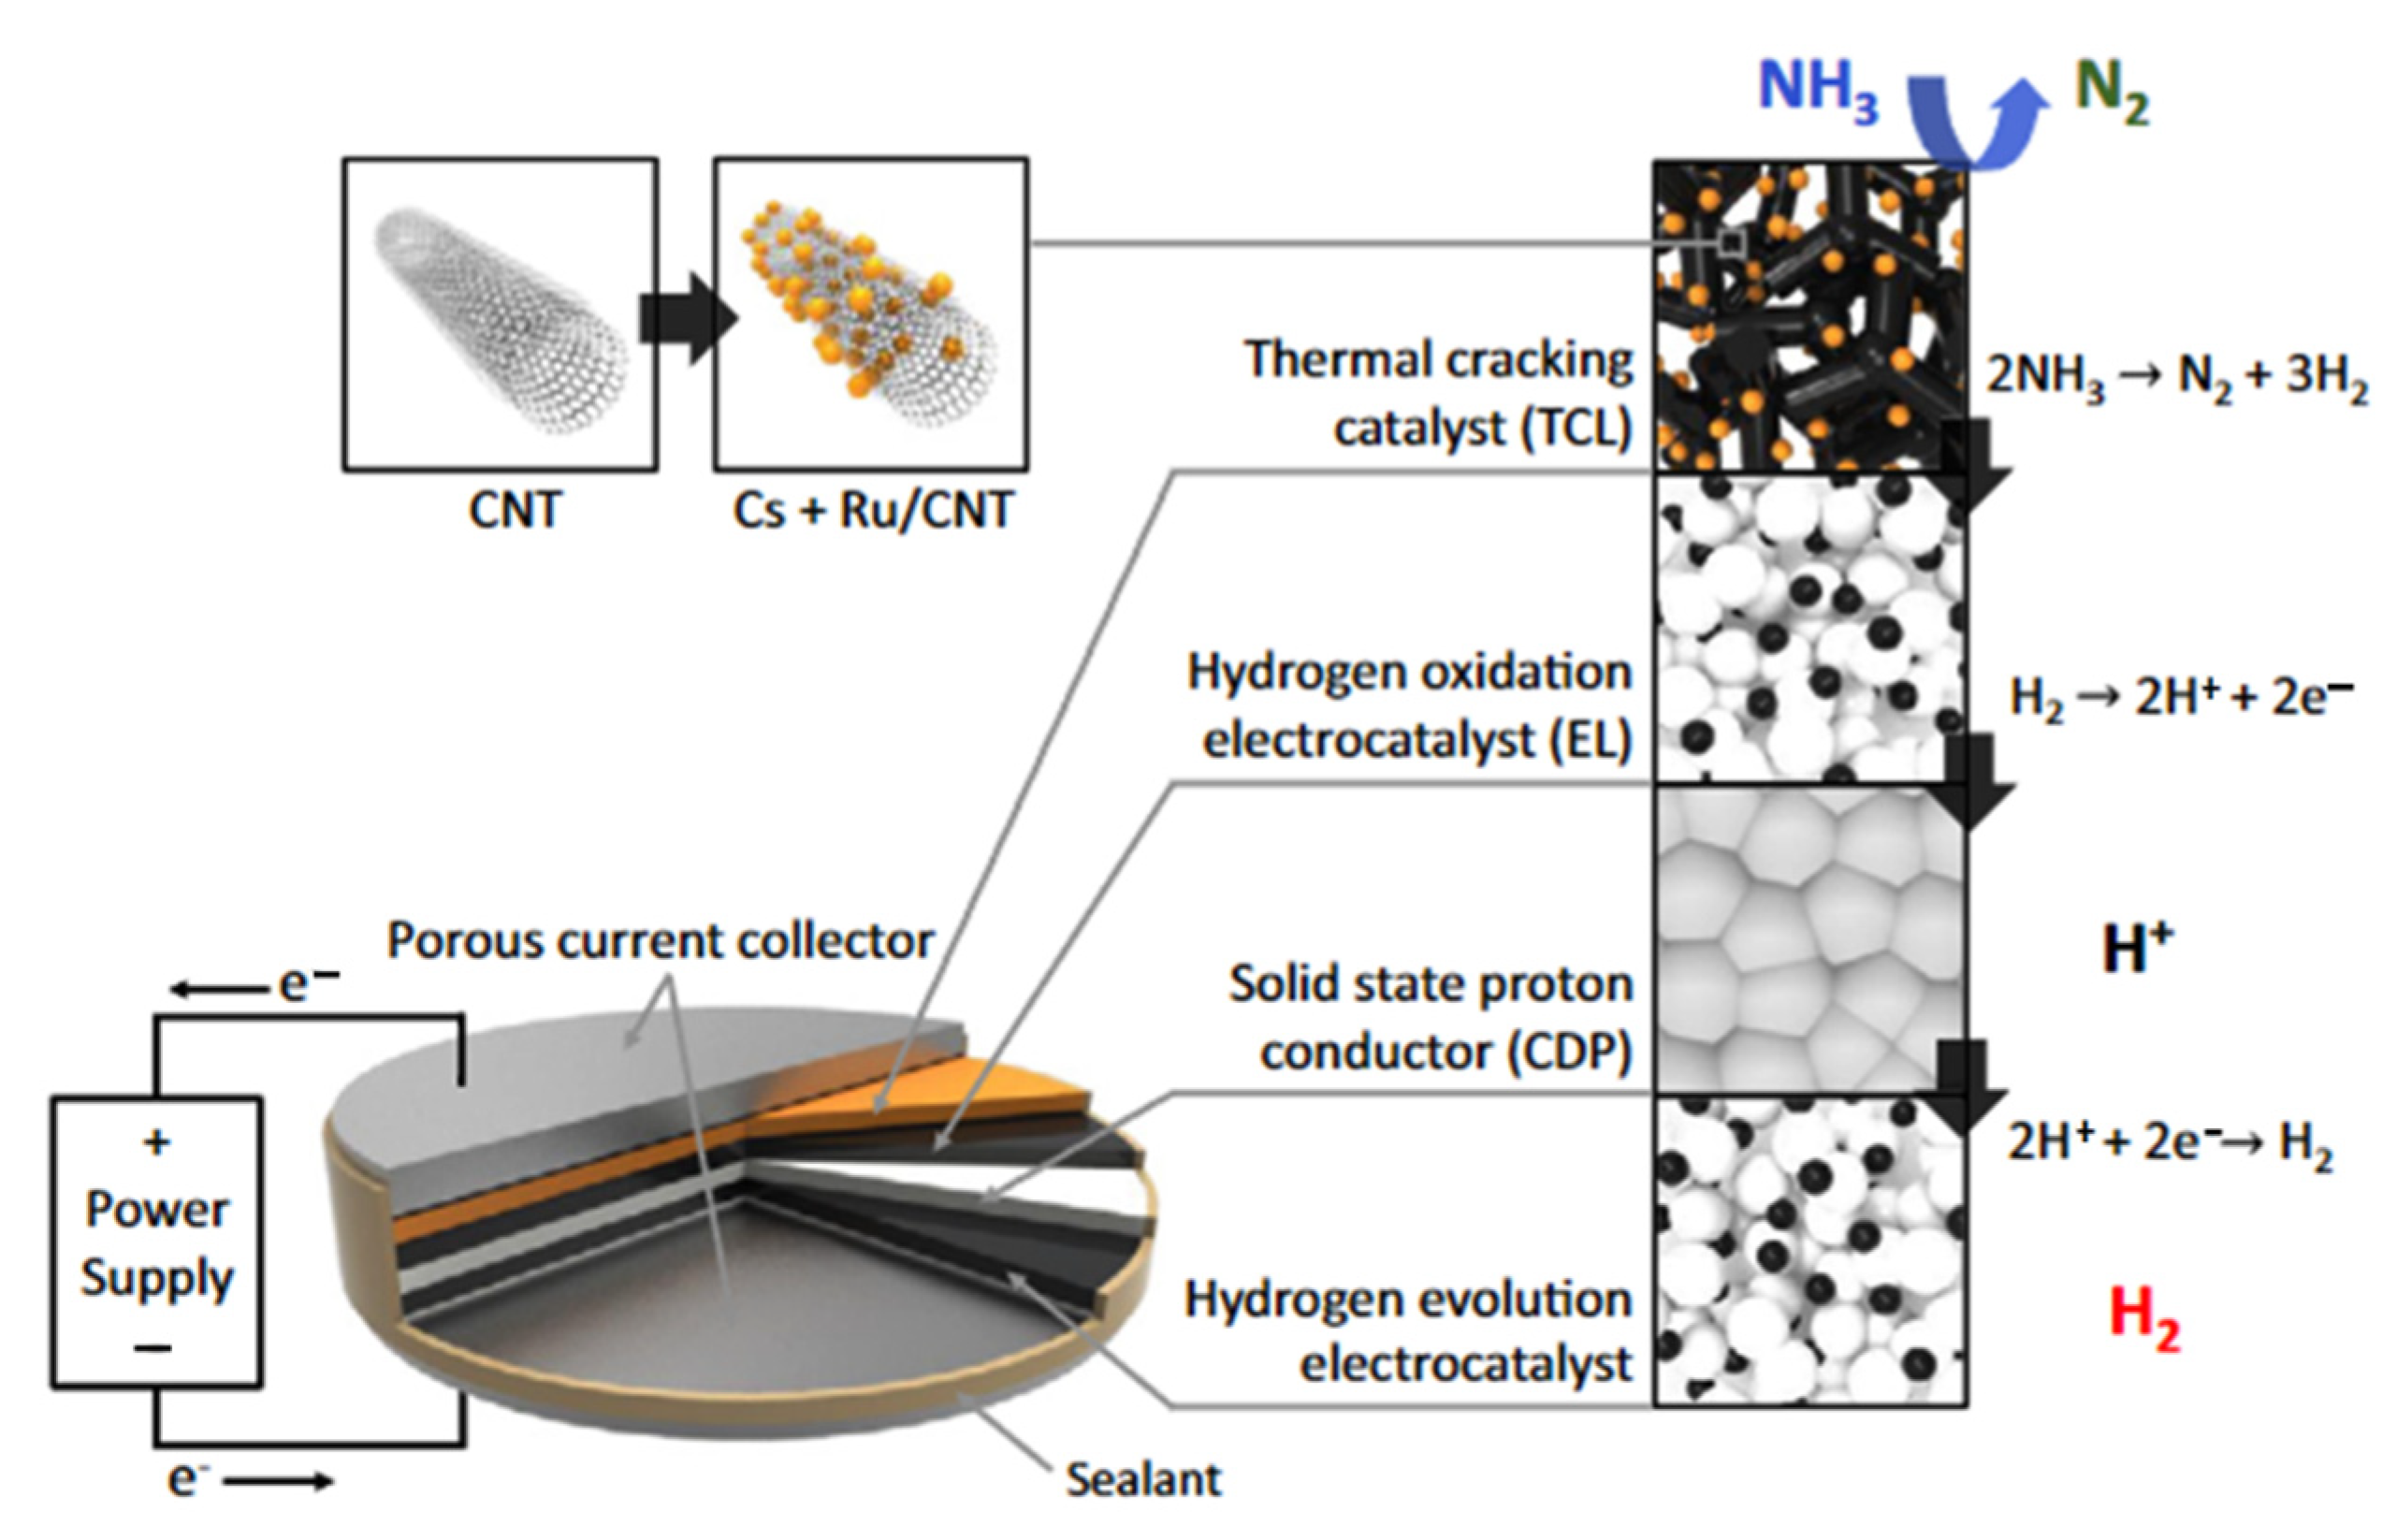
  53. Lim, D.-K.; Plymill, A.B.; Paik, H.; Qian, X.; Zecevic, S.; Chisholm, C.R.; Haile, S.M. Solid Acid Electrochemical Cell for the Production of Hydrogen from Ammonia. Joule 2020, 4, 2338–2347. [Google Scholar] [CrossRef]
  54. Esily, R.R.; Chi, Y.; Ibrahiem, D.M.; Chen, Y. Hydrogen strategy in decarbonization era: Egypt as a case study. Int. J. Hydrogen Energy 2022, 47, 18629–18647. [Google Scholar] [CrossRef]
  55. International Energy Agency. CCUS in Clean Energy Transitions; International Energy Agency: Paris, France, 2020. [Google Scholar]
  56. Wu, X.-Y.; Luo, Y.; Hess, F.; Lipiński, W. Editorial: Sustainable Hydrogen for Energy, Fuel and Commodity Applications. Front. Energy Res. 2021, 9, 698669. [Google Scholar] [CrossRef]
  57. Al-Breiki, M.; Bicer, Y. Comparative life cycle assessment of sustainable energy carriers including production, storage, overseas transport and utilization. J. Clean. Prod. 2020, 279, 123481. [Google Scholar] [CrossRef]
  58. Boerner, L.K. Industrial ammonia production emits more CO2 than any other chemical-making reaction. Chemists want to change that. Chem. Eng. News 2019, 97, 1–9. [Google Scholar]
  59. International Fertilizer Industry Association. Fertilizers, Climate Change and Enhancing Agricultural Productivity Sustainably; International Fertilizer Industry Association: Paris, France, 2009. [Google Scholar]
  60. Worrell, E.; Boyd, G. Bottom-up estimates of deep decarbonization of U.S. manufacturing in 2050. J. Clean. Prod. 2021, 330, 129758. [Google Scholar] [CrossRef]
  61. Keçebaş, A.; Kayfeci, M. Chapter 1—Hydrogen Properties. In Solar Hydrogen Production; Calise, F., D’Accadia, M.D., Santarelli, M., Lanzini, A., Ferrero, D., Eds.; Academic Press: Cambridge, MA, USA, 2019; pp. 3–29. [Google Scholar]
  62. Hasan, M.H.; Mahlia, T.M.I.; Mofijur, M.; Fattah, I.M.R.; Handayani, F.; Ong, H.C.; Silitonga, A.S. A Comprehensive Review on the Recent Development of Ammonia as a Renewable Energy Carrier. Energies 2021, 14, 3732. [Google Scholar] [CrossRef]
  63. Chu, K.H.; Lim, J.; Mang, J.S.; Hwang, M.-H. Evaluation of strategic directions for supply and demand of green hydrogen in South Korea. Int. J. Hydrogen Energy 2021, 47, 1409–1424. [Google Scholar] [CrossRef]
  64. Yuksel, Y.E.; Ozturk, M.; Dincer, I. Design and analysis of a new solar hydrogen plant for power, methane, ammonia and urea generation. Int. J. Hydrogen Energy 2022, 47, 19422–19445. [Google Scholar] [CrossRef]
  65. Lee, K.; Liu, X.; Vyawahare, P.; Sun, P.; Elgowainy, A.; Wang, M. Techno-economic performances and life cycle greenhouse gas emissions of various ammonia production pathways including conventional, carbon-capturing, nuclear-powered, and renewable production. Green Chem. 2022, 24, 4830–4844. [Google Scholar] [CrossRef]
  66. Aziz, M.; Wijayanta, A.T.; Nandiyanto, A.B.D. Ammonia as Effective Hydrogen Storage: A Review on Production, Storage and Utilization. Energies 2020, 13, 3062. [Google Scholar] [CrossRef]
  67. Bird, F.; Clarke, A.; Davies, P.; Surkovic, E. Ammonia: Fuel and Energy Store; KBR Inc.: Houston, TX, USA, 2020. [Google Scholar]
  68. Valera-Medina, A.; Gutesa, M.; Xiao, H.; Pugh, D.; Giles, A.; Goktepe, B.; Marsh, R.; Bowen, P. Premixed ammonia/hydrogen swirl combustion under rich fuel conditions for gas turbines operation. Int. J. Hydrog. Energy 2019, 44, 8615–8626. [Google Scholar] [CrossRef]
  69. Flórez-Orrego, D.; Maréchal, F.; Junior, S.D.O. Comparative exergy and economic assessment of fossil and biomass-based routes for ammonia production. Energy Convers. Manag. 2019, 194, 22–36. [Google Scholar] [CrossRef]
  70. IEA. Ammonia Technology Roadmap; International Energy Agency: Paris, France, 2021. [Google Scholar]
  71. MacFarlane, D.R.; Cherepanov, P.V.; Choi, J.; Suryanto, B.H.; Hodgetts, R.Y.; Bakker, J.M.; Vallana, F.M.F.; Simonov, A.N. A Roadmap to the Ammonia Economy. Joule 2020, 4, 1186–1205. [Google Scholar] [CrossRef]
  72. IEA; ICCA. Technology Roadmap—Energy and GHG Reductions in the Chemical Industry via Catalytic Processes; International Energy Agency: Paris, France, 2013. [Google Scholar]
  73. Ikäheimo, J.; Kiviluoma, J.; Weiss, R.; Holttinen, H. Power-to-ammonia in future North European 100% renewable power and heat system. Int. J. Hydrogen Energy 2018, 43, 17295–17308. [Google Scholar] [CrossRef]
  74. Nguyen, T.; Abdin, Z.; Holm, T.; Mérida, W. Grid-connected hydrogen production via large-scale water electrolysis. Energy Convers. Manag. 2019, 200, 112108. [Google Scholar] [CrossRef]
  75. Ouikhalfan, M.; Lakbita, O.; Delhali, A.; Assen, A.H.; Belmabkhout, Y. Toward Net-Zero Emission Fertilizers Industry: Greenhouse Gas Emission Analyses and Decarbonization Solutions. Energy Fuels 2022, 36, 4198–4223. [Google Scholar] [CrossRef]
  76. Ausfelder, F.; Herrmann, E.O.; González, L.F.L. Perspective Europe 2030 Technology Options for CO2—Emission Reduction of Hydrogen Feedstock in Ammonia Production; Dechema: Frankfurt, Germany, 2022. [Google Scholar]
  77. Penkuhn, M.; Tsatsaronis, G. Comparison of different ammonia synthesis loop configurations with the aid of advanced exergy analysis. Energy 2017, 137, 854–864. [Google Scholar] [CrossRef]
  78. Ghannadzadeh, A.; Sadeqzadeh, M. Diagnosis of an alternative ammonia process technology to reduce exergy losses. Energy Convers. Manag. 2016, 109, 63–70. [Google Scholar] [CrossRef]
  79. Flórez-Orrego, D.; de Oliveira Junior, S. Modeling and optimization of an industrial ammonia synthesis unit: An exergy approach. Energy 2017, 137, 234–250. [Google Scholar] [CrossRef]
  80. Wu, S.; Salmon, N.; Li, M.M.-J.; Bañares-Alcántara, R.; Tsang, S.C.E. Energy Decarbonization via Green H2 or NH3? ACS Energy Lett. 2022, 7, 1021–1033. [Google Scholar] [CrossRef]
  81. Mukherjee, S.; Devaguptapu, S.V.; Sviripa, A.; Lund, C.R.; Wu, G. Low-temperature ammonia decomposition catalysts for hydrogen generation. Appl. Catal. B Environ. 2018, 226, 162–181. [Google Scholar] [CrossRef]
  82. Chai, W.S.; Bao, Y.; Jin, P.; Tang, G.; Zhou, L. A review on ammonia, ammonia-hydrogen and ammonia-methane fuels. Renew. Sustain. Energy Rev. 2021, 147, 111254. [Google Scholar] [CrossRef]
  83. Fowler, D.; Coyle, M.; Skiba, U.; Sutton, M.A.; Cape, J.N.; Reis, S.; Sheppard, L.J.; Jenkins, A.; Grizzetti, B.; Galloway, J.N.; et al. The global nitrogen cycle in the twenty-first century. Philos. Trans. R. Soc. B Biol. Sci. 2013, 368, 20130164. [Google Scholar] [CrossRef] [Green Version]
  84. Lin, Q.; Jiang, Y.; Liu, C.; Chen, L.; Zhang, W.; Ding, J.; Li, J. Instantaneous hydrogen production from ammonia by non-thermal arc plasma combining with catalyst. Energy Rep. 2021, 7, 4064–4070. [Google Scholar] [CrossRef]
  85. Chiuta, S.; Everson, R.C.; Neomagus, H.W.; van der Gryp, P.; Bessarabov, D.G. Reactor technology options for distributed hydrogen generation via ammonia decomposition: A review. Int. J. Hydrogen Energy 2013, 38, 14968–14991. [Google Scholar] [CrossRef]
  86. Bell, T.E.; Murciano, L.T. H2 Production via Ammonia Decomposition Using Non-Noble Metal Catalysts: A Review. Top. Catal. 2016, 59, 1438–1457. [Google Scholar] [CrossRef] [Green Version]
  87. Ross, J.R. The Kinetics and Mechanisms of Catalytic Reactions. In Contemporary Catalysis; Elsevier: Amsterdam, The Netherlands, 2019; pp. 161–186. [Google Scholar] [CrossRef]
  88. Slycke, J.; Mittemeijer, E.; Somers, M. Thermodynamics and kinetics of gas and gas–solid reactions. In Thermochemical Surface Engineering of Steels; Woodhead Publishing: Sawston, UK, 2015; pp. 3–111. [Google Scholar] [CrossRef]
  89. Wang, W.; Padban, N.; Ye, Z.; Andersson, A.A.; Bjerle, I. Kinetics of Ammonia Decomposition in Hot Gas Cleaning. Ind. Eng. Chem. Res. 1999, 38, 4175–4182. [Google Scholar] [CrossRef]
  90. Kiełbasa, K.; Pelka, R.; Arabczyk, W. Studies of the Kinetics of Ammonia Decomposition on Promoted Nanocrystalline Iron Using Gas Phases of Different Nitriding Degree. J. Phys. Chem. A 2010, 114, 4531–4534. [Google Scholar] [CrossRef] [PubMed]
  91. Kashkarov, S.; Li, Z.; Molkov, V. Blast wave from a hydrogen tank rupture in a fire in the open: Hazard distance nomograms. Int. J. Hydrog. Energy 2012, 45, 2429–2446. [Google Scholar] [CrossRef]
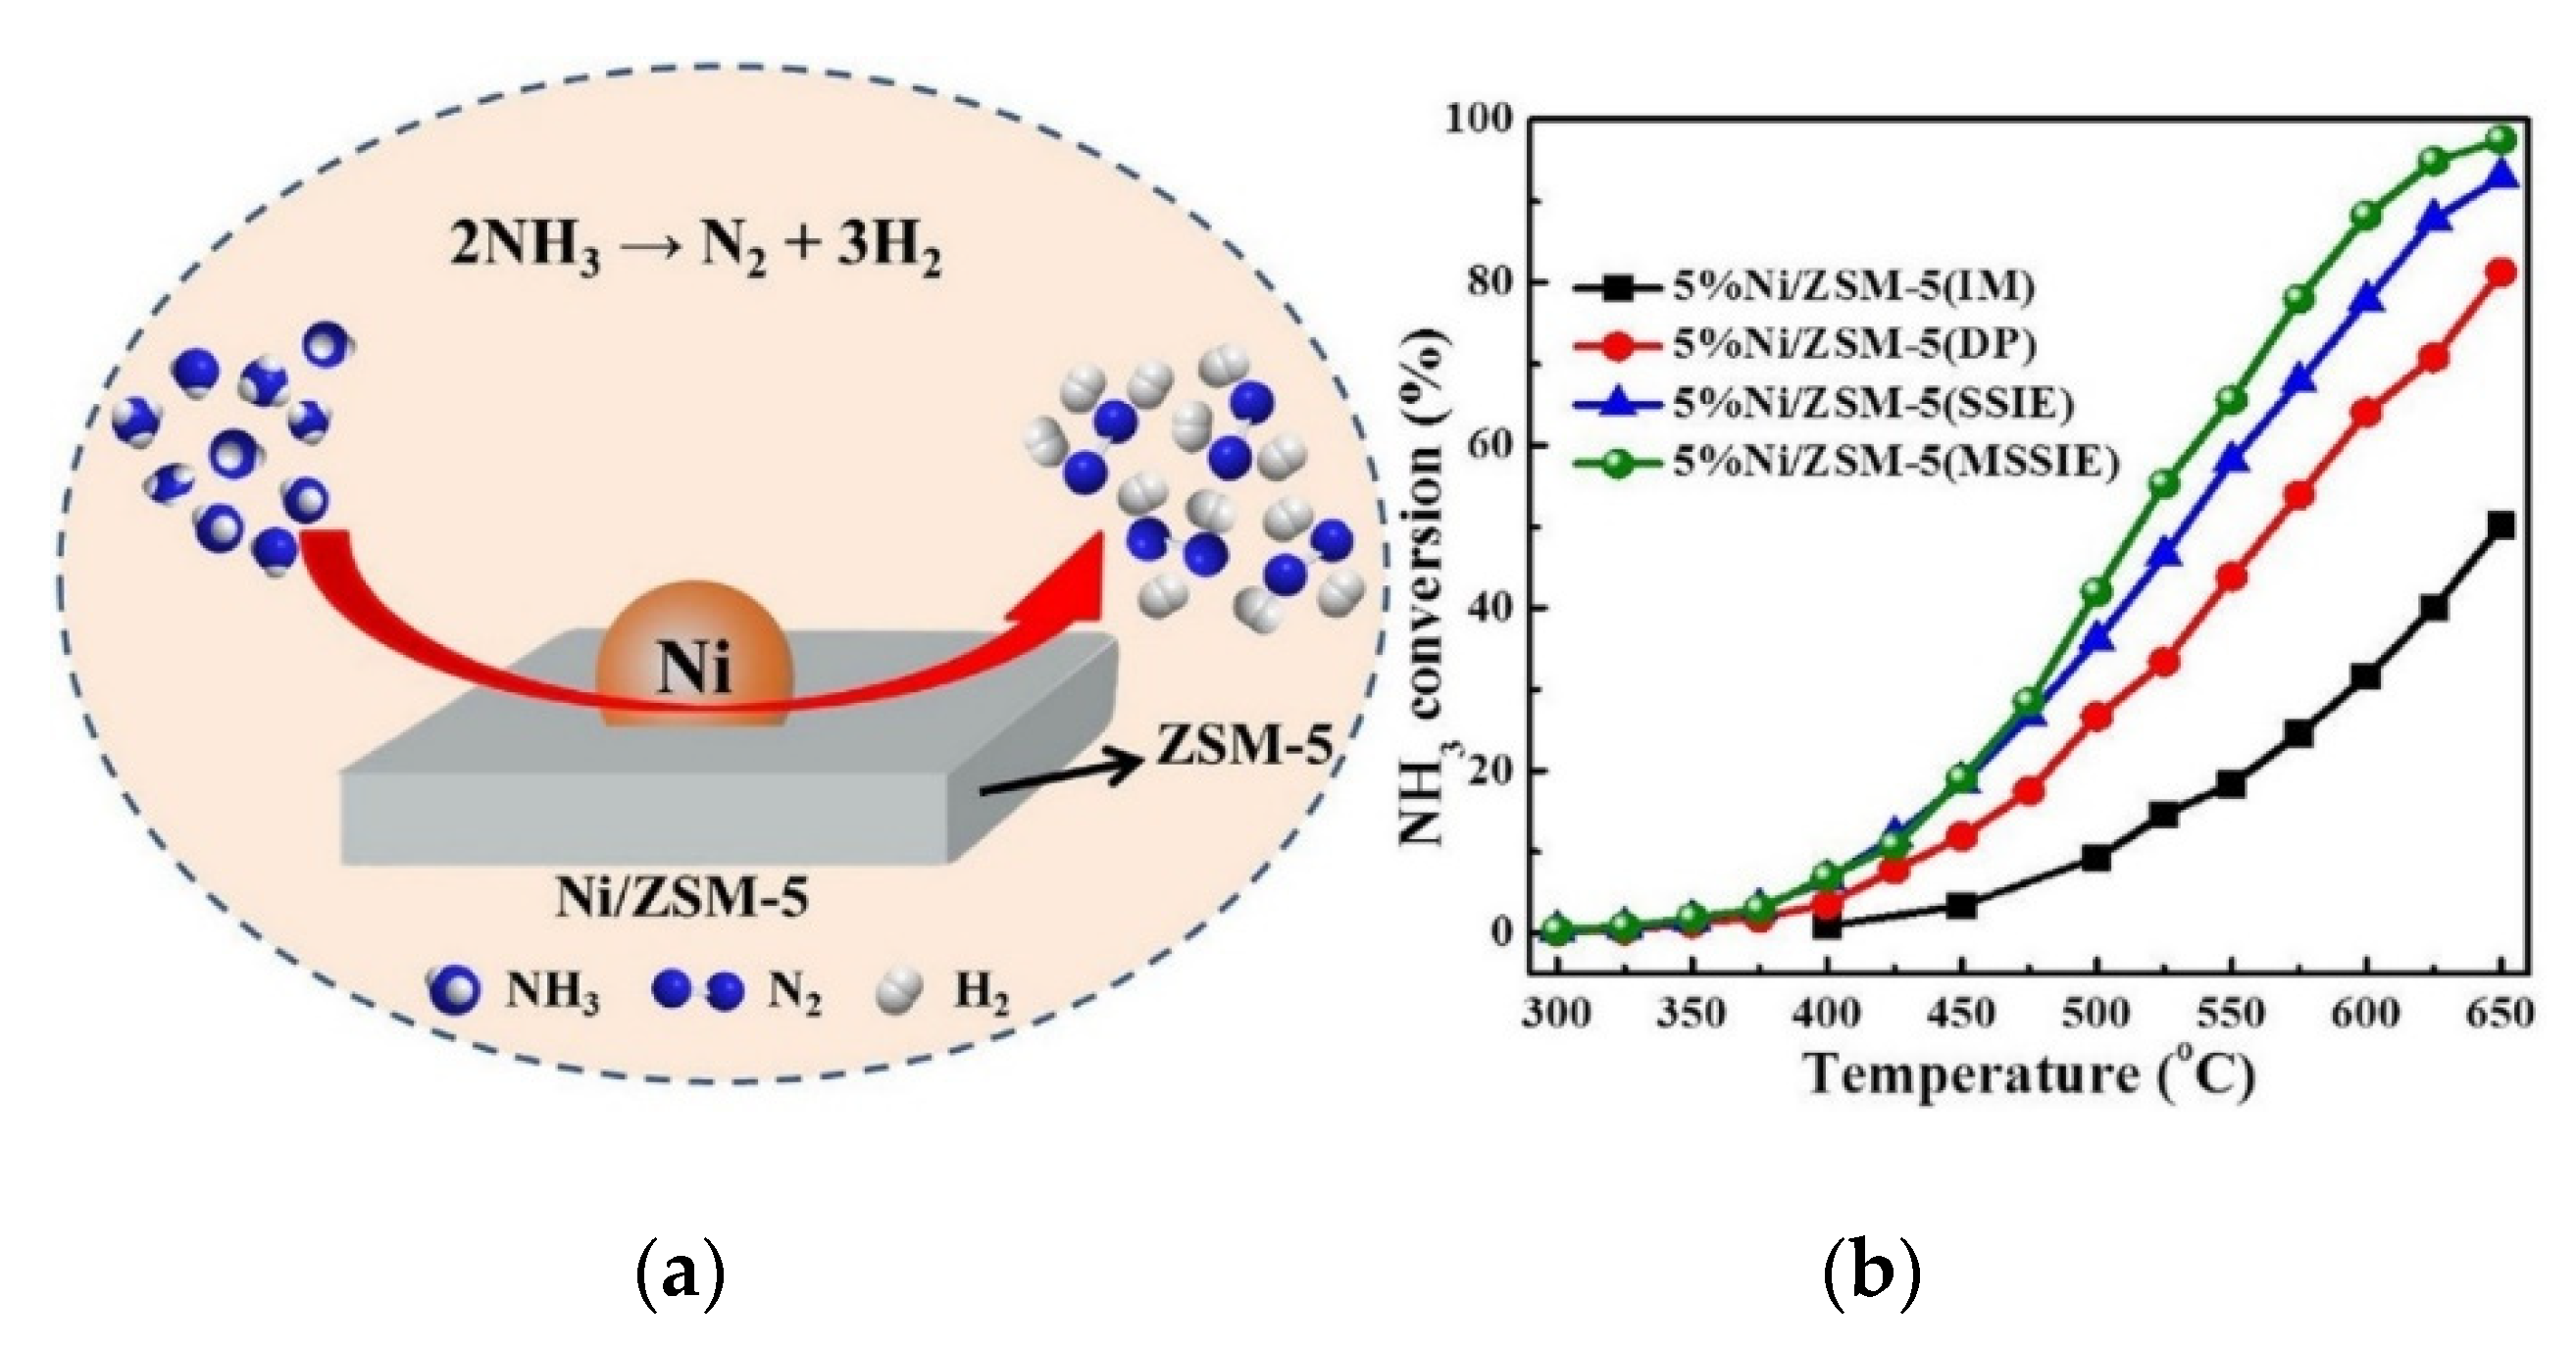
  92. Hu, Z.-P.; Weng, C.-C.; Chen, C.; Yuan, Z.-Y. Catalytic decomposition of ammonia to COx-free hydrogen over Ni/ZSM-5 catalysts: A comparative study of the preparation methods. Appl. Catal. A Gen. 2018, 562, 49–57. [Google Scholar] [CrossRef]
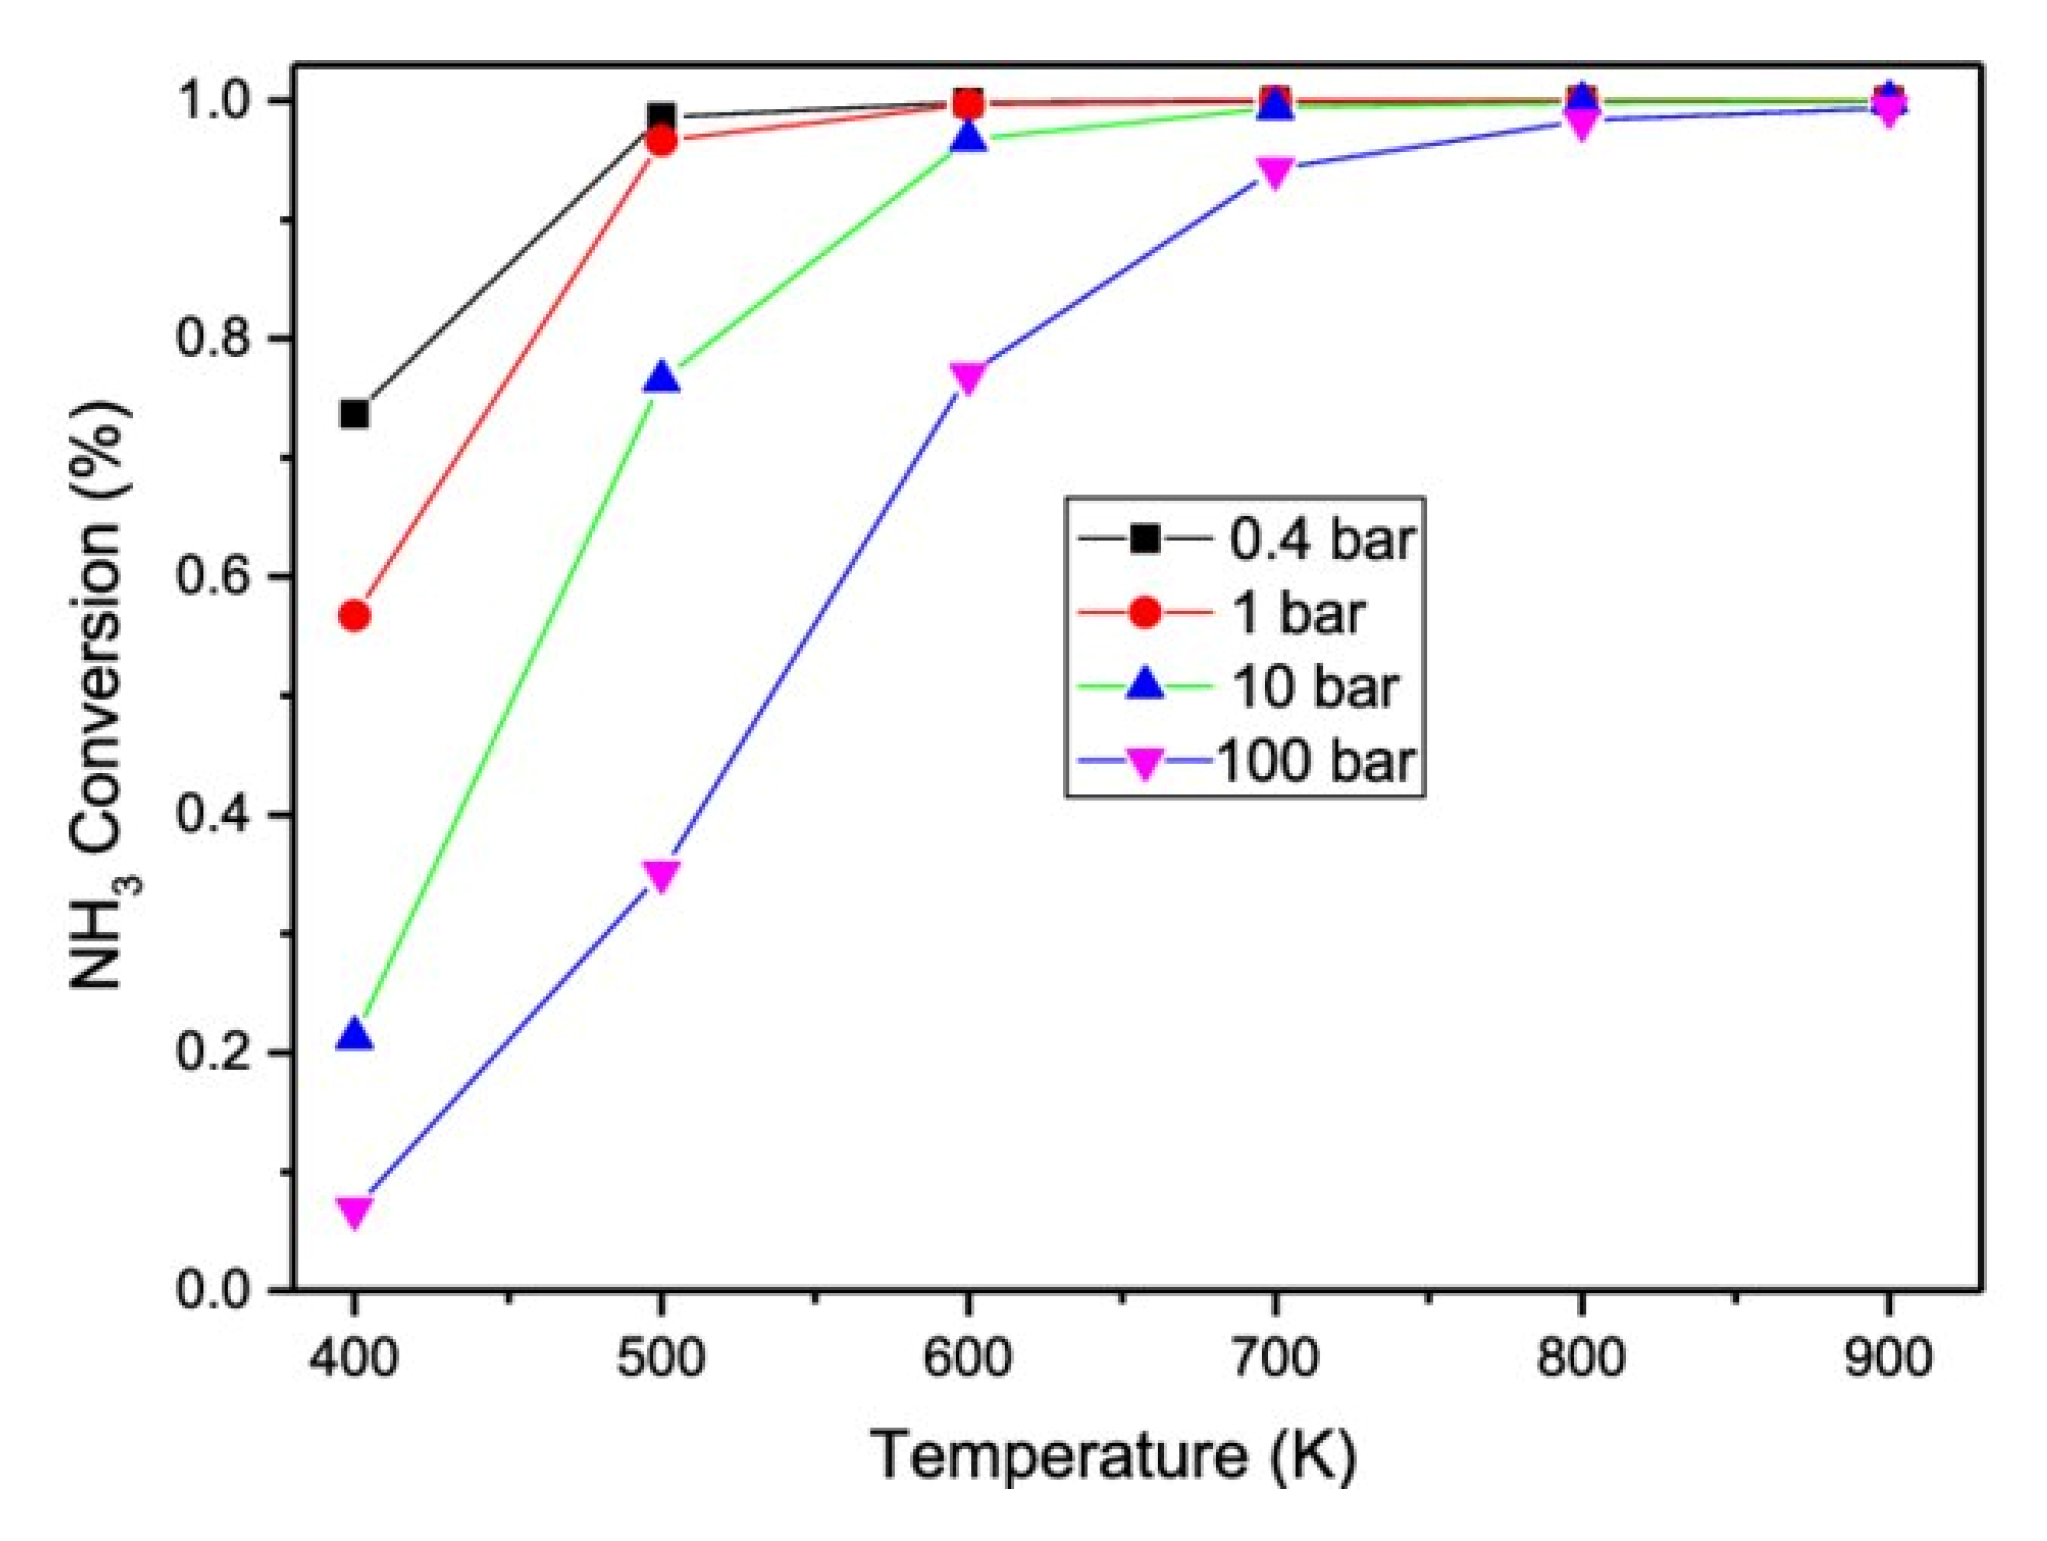
  93. Ojelade, O.A.; Zaman, S.F. Ammonia decomposition for hydrogen production: A thermodynamic study. Chem. Pap. 2020, 75, 57–65. [Google Scholar] [CrossRef]
  94. Chein, R.-Y.; Chen, Y.-C.; Chang, C.-S.; Chung, J. Numerical modeling of hydrogen production from ammonia decomposition for fuel cell applications. Int. J. Hydrogen Energy 2010, 35, 589–597. [Google Scholar] [CrossRef]
  95. Baek, S.-H.; Yun, K.; Kang, D.-C.; An, H.; Park, M.; Shin, C.-H.; Min, H.-K. Characteristics of High Surface Area Molybdenum Nitride and Its Activity for the Catalytic Decomposition of Ammonia. Catalysts 2021, 11, 192. [Google Scholar] [CrossRef]
  96. Itoh, N.; Oshima, A.; Suga, E.; Sato, T. Kinetic enhancement of ammonia decomposition as a chemical hydrogen carrier in palladium membrane reactor. Catal. Today 2014, 236, 70–76. [Google Scholar] [CrossRef]
  97. Li, G.; Kanezashi, M.; Yoshioka, T.; Tsuru, T. Ammonia decomposition in catalytic membrane reactors: Simulation and experimental studies. AIChE J. 2012, 59, 168–179. [Google Scholar] [CrossRef]
  98. Xie, T.; Xia, S.; Jin, Q. Thermodynamic Optimization of Ammonia Decomposition Solar Heat Absorption System Based on Membrane Reactor. Membranes 2022, 12, 627. [Google Scholar] [CrossRef]
  99. Do, S.-H.; Roh, J.S.; Park, H.B. Carbon-free Hydrogen Production Using Membrane Reactors. Membr. J. 2018, 28, 297–306. [Google Scholar] [CrossRef]
  100. Barisano, D.; Canneto, G.; Nanna, F.; Villone, A.; Fanelli, E.; Freda, C.; Grieco, M.; Lotierzo, A.; Cornacchia, G.; Braccio, G.; et al. Investigation of an Intensified Thermo-Chemical Experimental Set-Up for Hydrogen Production from Biomass: Gasification Process Integrated to a Portable Purification System—Part II. Energies 2022, 15, 4580. [Google Scholar] [CrossRef]
  101. Abashar, M.; Al-Sughair, Y.; Al-Mutaz, I. Investigation of low temperature decomposition of ammonia using spatially patterned catalytic membrane reactors. Appl. Catal. A Gen. 2002, 236, 35–53. [Google Scholar] [CrossRef]
  102. Li, G.; Yu, X.; Yin, F.; Lei, Z.; Zhang, H.; He, X. Production of hydrogen by ammonia decomposition over supported Co3O4 catalysts. Catal. Today 2022, 402, 45–51. [Google Scholar] [CrossRef]
  103. Chen, Y.-L.; Juang, C.-F.; Chen, Y.-C. The Effects of Promoter Cs Loading on the Hydrogen Production from Ammonia Decomposition Using Ru/C Catalyst in a Fixed-Bed Reactor. Catalysts 2021, 11, 321. [Google Scholar] [CrossRef]
  104. Cechetto, V.; Di Felice, L.; Medrano, J.A.; Makhloufi, C.; Zuniga, J.; Gallucci, F. H2 production via ammonia decomposition in a catalytic membrane reactor. Fuel Process. Technol. 2021, 216, 106772. [Google Scholar] [CrossRef]
  105. Abashar, M. Ultra-clean hydrogen production by ammonia decomposition. J. King Saud Univ. Eng. Sci. 2018, 30, 2–11. [Google Scholar] [CrossRef] [Green Version]
  106. Zhang, Z.; Liguori, S.; Fuerst, T.F.; Way, J.D.; Wolden, C.A. Efficient Ammonia Decomposition in a Catalytic Membrane Reactor To Enable Hydrogen Storage and Utilization. ACS Sustain. Chem. Eng. 2019, 7, 5975–5985. [Google Scholar] [CrossRef]
  107. Cechetto, V.; Di Felice, L.; Martinez, R.G.; Plazaola, A.A.; Gallucci, F. Ultra-pure hydrogen production via ammonia decomposition in a catalytic membrane reactor. Int. J. Hydrogen Energy 2022, 47, 21220–21230. [Google Scholar] [CrossRef]
  108. Heidenreich, S.; Müller, M.; Foscolo, P.U. Chapter 5—Advanced Process Combination Concepts. In Advanced Biomass Gasification; Heidenreich, S., Müller, M., Foscolo, P.U., Eds.; Academic Press: Cambridge, MA, USA, 2016; pp. 55–97. [Google Scholar]
  109. Yang, X.; Wang, S.; He, Y. Review of catalytic reforming for hydrogen production in a membrane-assisted fluidized bed reactor. Renew. Sustain. Energy Rev. 2021, 154, 111832. [Google Scholar] [CrossRef]
  110. Mazzone, S.; Campbell, A.; Zhang, G.; García-García, F. Ammonia cracking hollow fibre converter for on-board hydrogen production. Int. J. Hydrogen Energy 2021, 46, 37697–37704. [Google Scholar] [CrossRef]
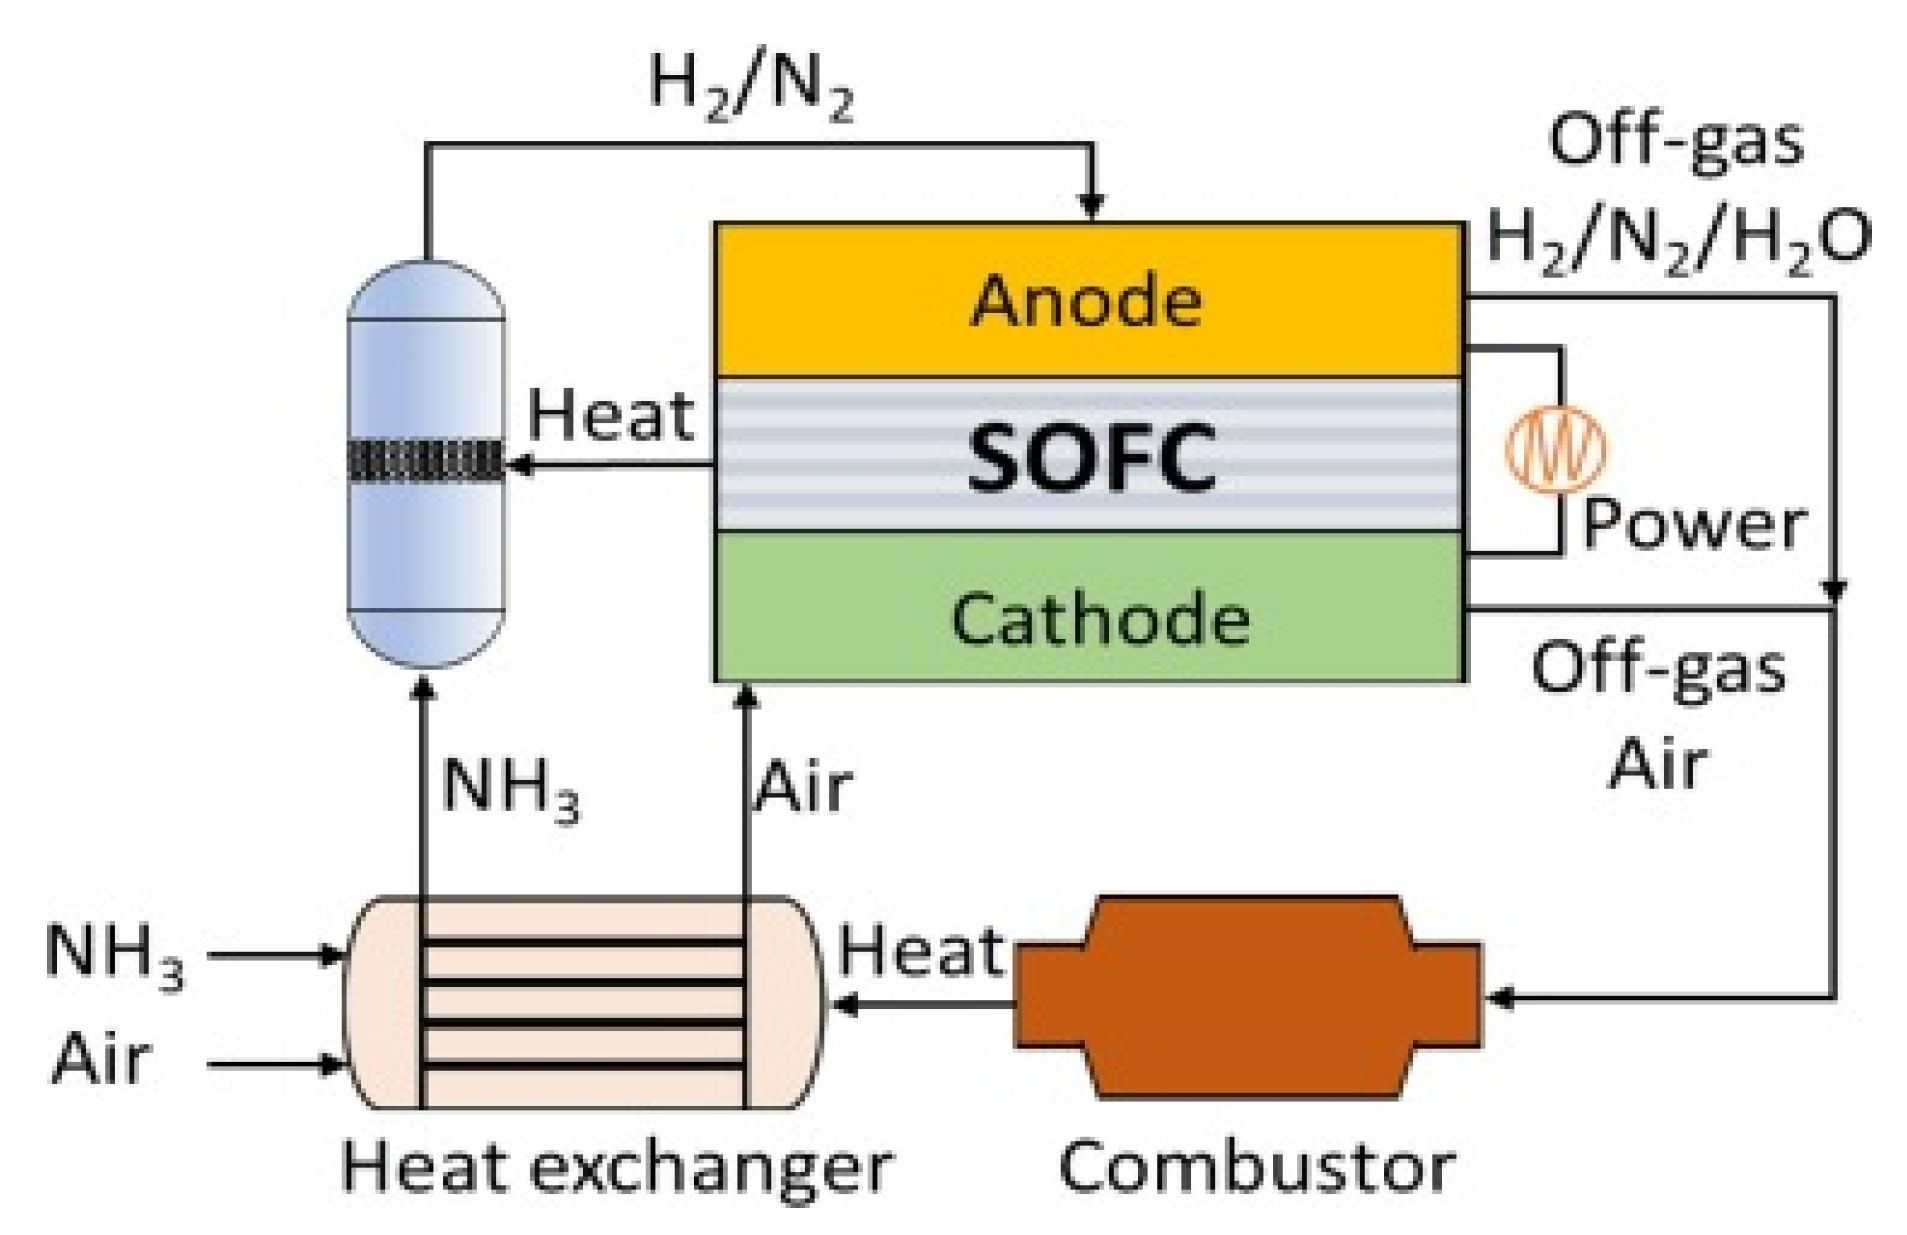
  111. Wan, Z.; Tao, Y.; Shao, J.; Zhang, Y.; You, H. Ammonia as an effective hydrogen carrier and a clean fuel for solid oxide fuel cells. Energy Convers. Manag. 2020, 228, 113729. [Google Scholar] [CrossRef]
  112. Makepeace, J.W.; He, T.; Weidenthaler, C.; Jensen, T.R.; Chang, F.; Vegge, T.; Ngene, P.; Kojima, Y.; de Jongh, P.E.; Chen, P.; et al. Reversible ammonia-based and liquid organic hydrogen carriers for high-density hydrogen storage: Recent progress. Int. J. Hydrogen Energy 2019, 44, 7746–7767. [Google Scholar] [CrossRef]
  113. Lucentini, I.; Garcia, X.; Vendrell, X.; Llorca, J. Review of the Decomposition of Ammonia to Generate Hydrogen. Ind. Eng. Chem. Res. 2021, 60, 18560–18611. [Google Scholar] [CrossRef]
  114. Seyfeli, R.C.; Varisli, D. Ammonia decomposition reaction to produce COx-free hydrogen using carbon supported cobalt catalysts in microwave heated reactor system. Int. J. Hydrogen Energy 2020, 45, 34867–34878. [Google Scholar] [CrossRef]
  115. Chen, C.; Wu, K.; Ren, H.; Zhou, C.; Luo, Y.; Lin, L.; Au, C.; Jiang, L. Ru-Based Catalysts for Ammonia Decomposition: A Mini-Review. Energy Fuels 2021, 35, 11693–11706. [Google Scholar] [CrossRef]
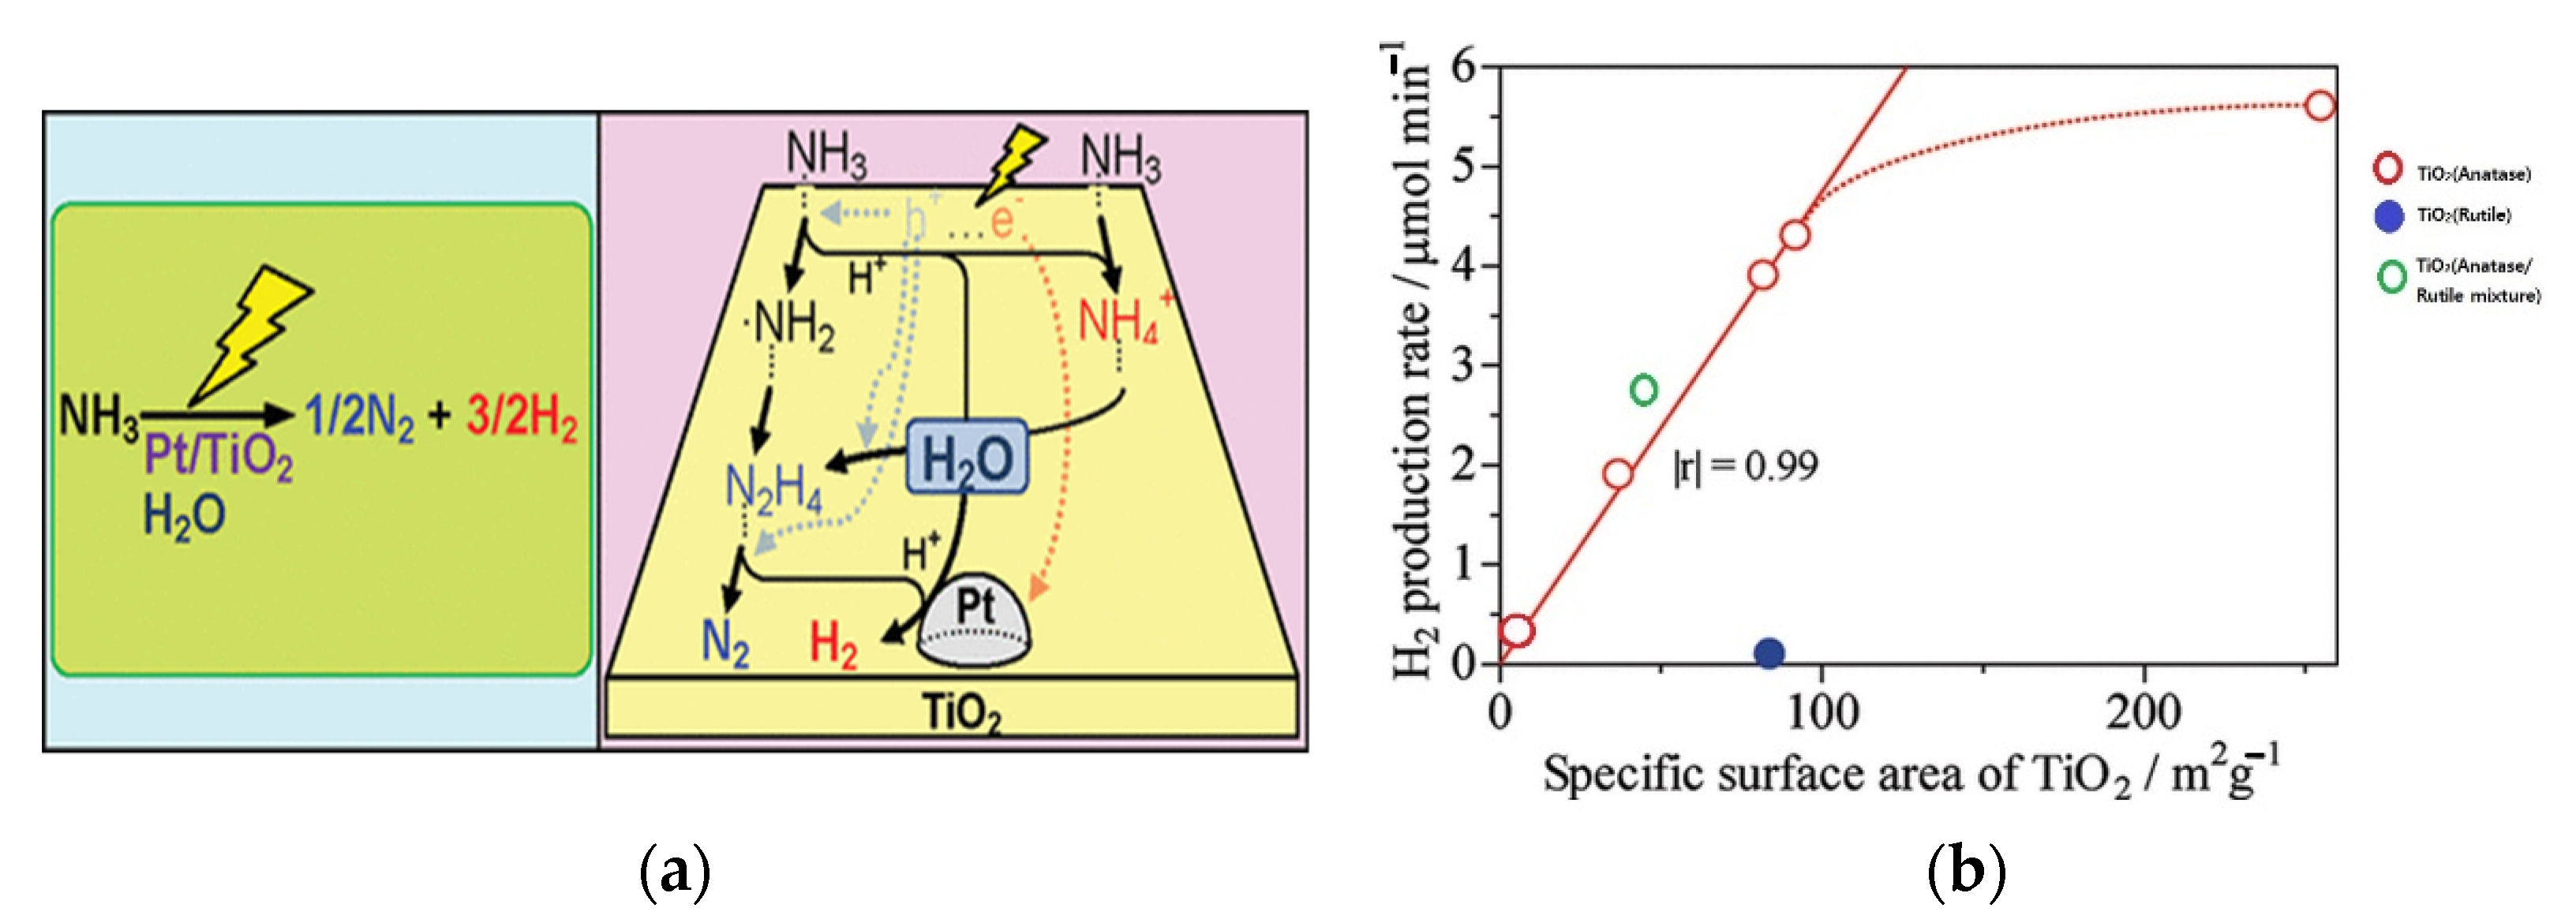
  116. Yuzawa, H.; Mori, T.; Itoh, H.; Yoshida, H. Reaction Mechanism of Ammonia Decomposition to Nitrogen and Hydrogen over Metal Loaded Titanium Oxide Photocatalyst. J. Phys. Chem. C 2012, 116, 4126–4136. [Google Scholar] [CrossRef]
  117. Akkerman, Q.A.; Manna, L. What Defines a Halide Perovskite? ACS Energy Lett. 2020, 5, 604–610. [Google Scholar] [CrossRef] [Green Version]
  118. Assirey, E.A.R. Perovskite synthesis, properties and their related biochemical and industrial application. Saudi Pharm. J. 2019, 27, 817–829. [Google Scholar] [CrossRef]
  119. Hill, A.K.; Torrente-Murciano, L.T. Low temperature H2 production from ammonia using ruthenium-based catalysts: Synergetic effect of promoter and support. Appl. Catal. B Environ. 2015, 172–173, 129–135. [Google Scholar] [CrossRef] [Green Version]
  120. Lamb, K.E.; Dolan, M.D.; Kennedy, D.F. Ammonia for hydrogen storage; A review of catalytic ammonia decomposition and hydrogen separation and purification. Int. J. Hydrogen Energy 2019, 44, 3580–3593. [Google Scholar] [CrossRef]
  121. Lente, G. Comment on “‘Turning Over’ Definitions in Catalytic Cycles”. ACS Catal. 2013, 3, 381–382. [Google Scholar] [CrossRef] [Green Version]
  122. Turnover Frequency—An Overview|ScienceDirect Topics. Available online: https://www.sciencedirect.com/topics/chemistry/turnover-frequency (accessed on 13 September 2022).
  123. Chehade, G.; Dincer, I. Progress in green ammonia production as potential carbon-free fuel. Fuel 2021, 299, 120845. [Google Scholar] [CrossRef]
  124. Jiang, K.; Li, K.; Liu, Y.-Q.; Lin, S.; Wang, Z.; Wang, D.; Ye, Y. Nickel-cobalt nitride nanoneedle supported on nickel foam as an efficient electrocatalyst for hydrogen generation from ammonia electrolysis. Electrochimica Acta 2021, 403, 139700. [Google Scholar] [CrossRef]
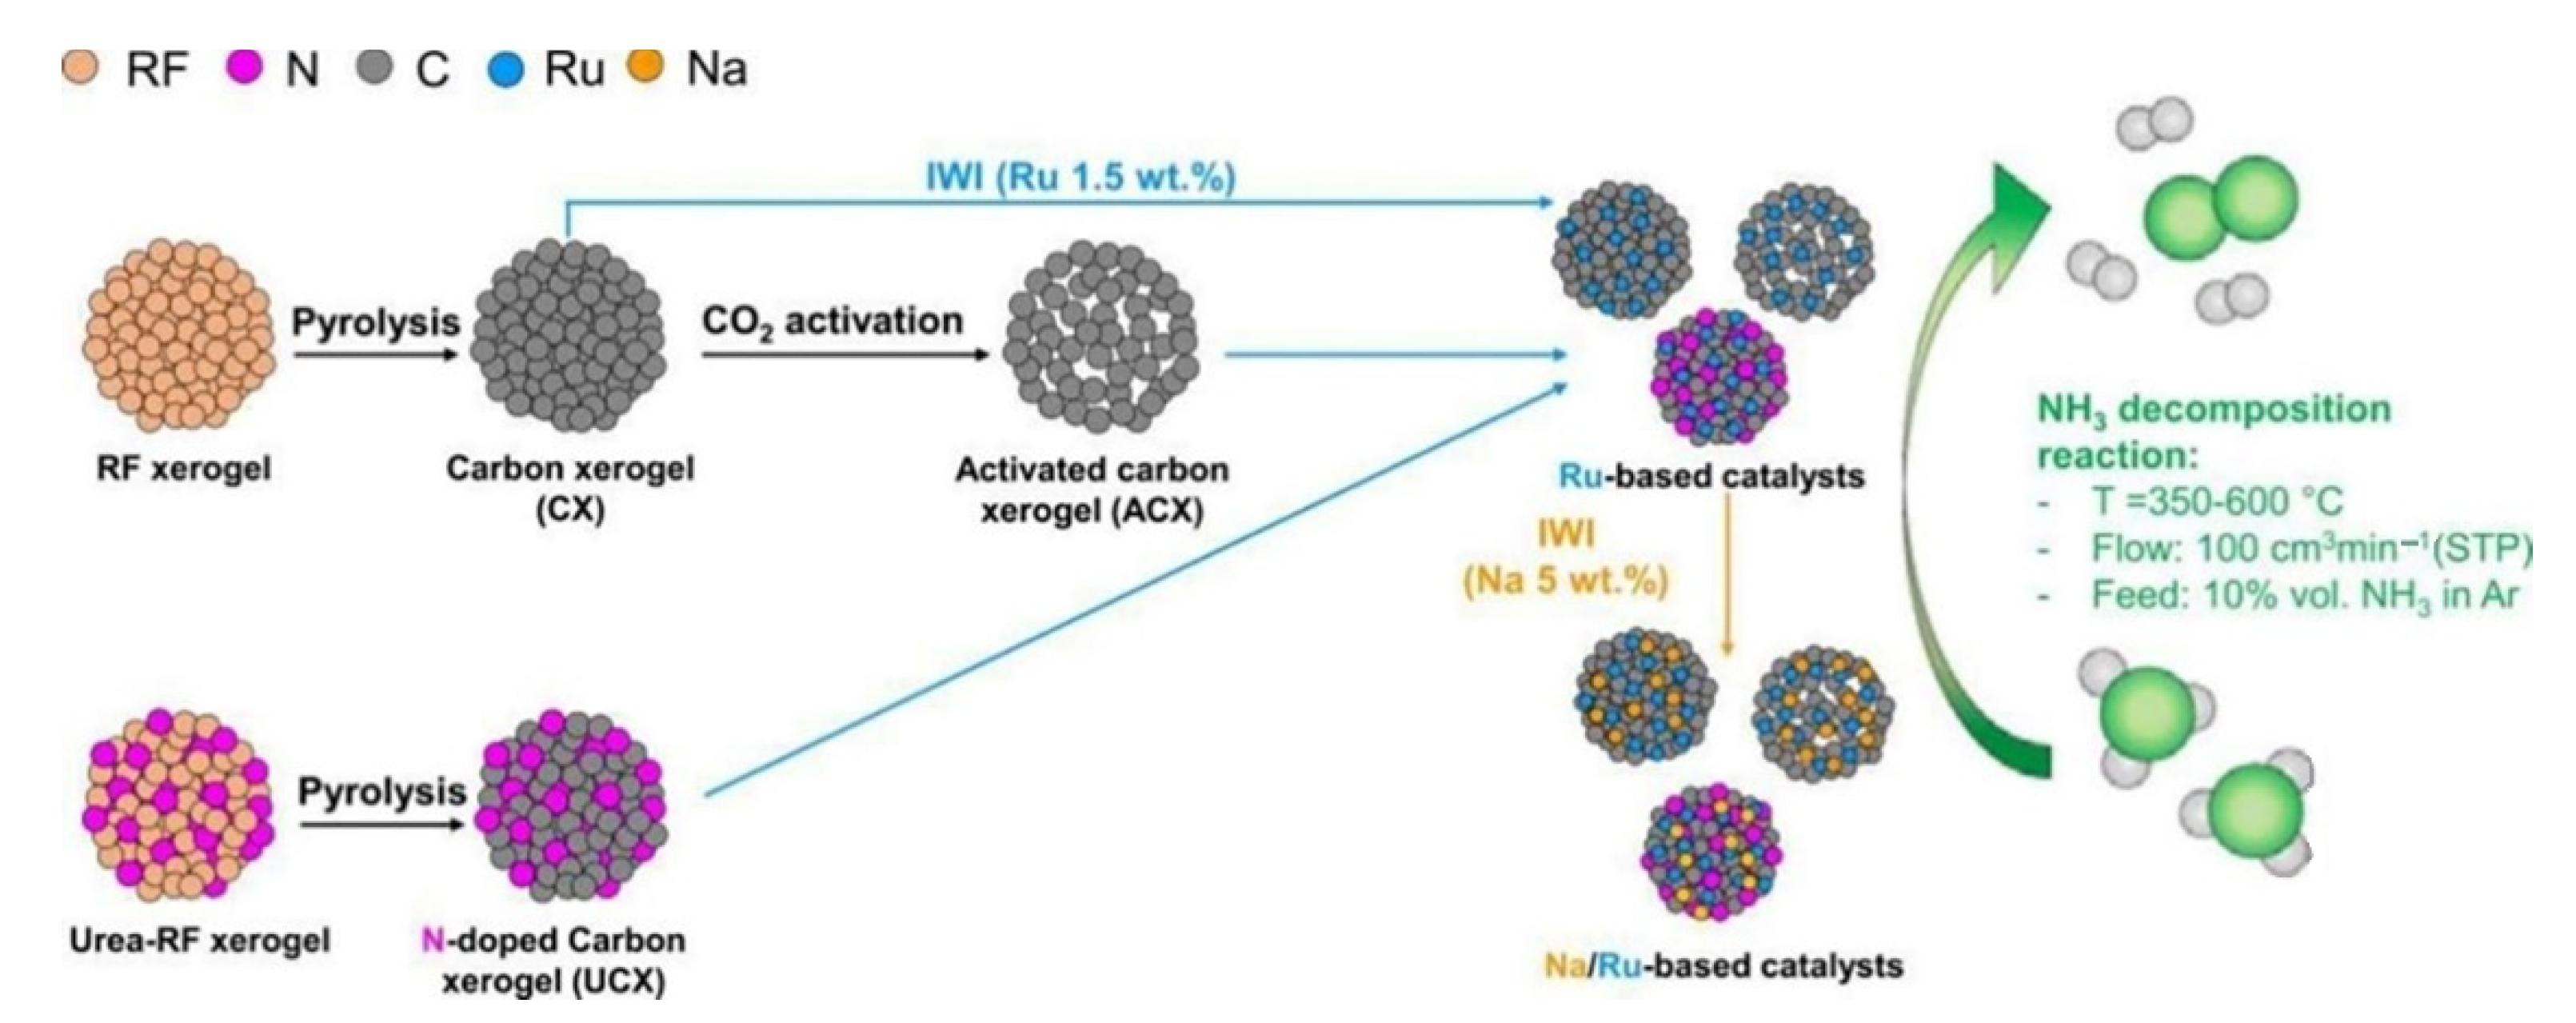
  125. Mazzone, S.; Goklany, T.; Zhang, G.; Tan, J.; Papaioannou, E.I.; García-García, F. Ruthenium-based catalysts supported on carbon xerogels for hydrogen production via ammonia decomposition. Appl. Catal. A Gen. 2022, 632, 118484. [Google Scholar] [CrossRef]
  126. Yin, S.; Xu, B.; Zhu, W.; Ng, C.; Zhou, X.; Au, C. Carbon nanotubes-supported Ru catalyst for the generation of COx-free hydrogen from ammonia. Catal. Today 2004, 93–95, 27–38. [Google Scholar] [CrossRef]
  127. Yin, S.-F.; Xu, B.-Q.; Ng, C.-F.; Au, C.-T. Nano Ru/CNTs: A highly active and stable catalyst for the generation of COx-free hydrogen in ammonia decomposition. Appl. Catal. B Environ. 2004, 48, 237–241. [Google Scholar] [CrossRef]
  128. El-Shafie, M.; Kambara, S.; Hayakawa, Y. Development of zeolite-based catalyst for enhancement hydrogen production from ammonia decomposition. Catal. Today 2021, 397–399, 103–112. [Google Scholar] [CrossRef]
  129. Liu, Y.; Wang, H.; Yuan, X.; Wu, Y.; Wang, H.; Tan, Y.Z.; Chew, J.W. Roles of sulfur-edge sites, metal-edge sites, terrace sites, and defects in metal sulfides for photocatalysis. Chem Catal. 2021, 1, 44–68. [Google Scholar] [CrossRef]
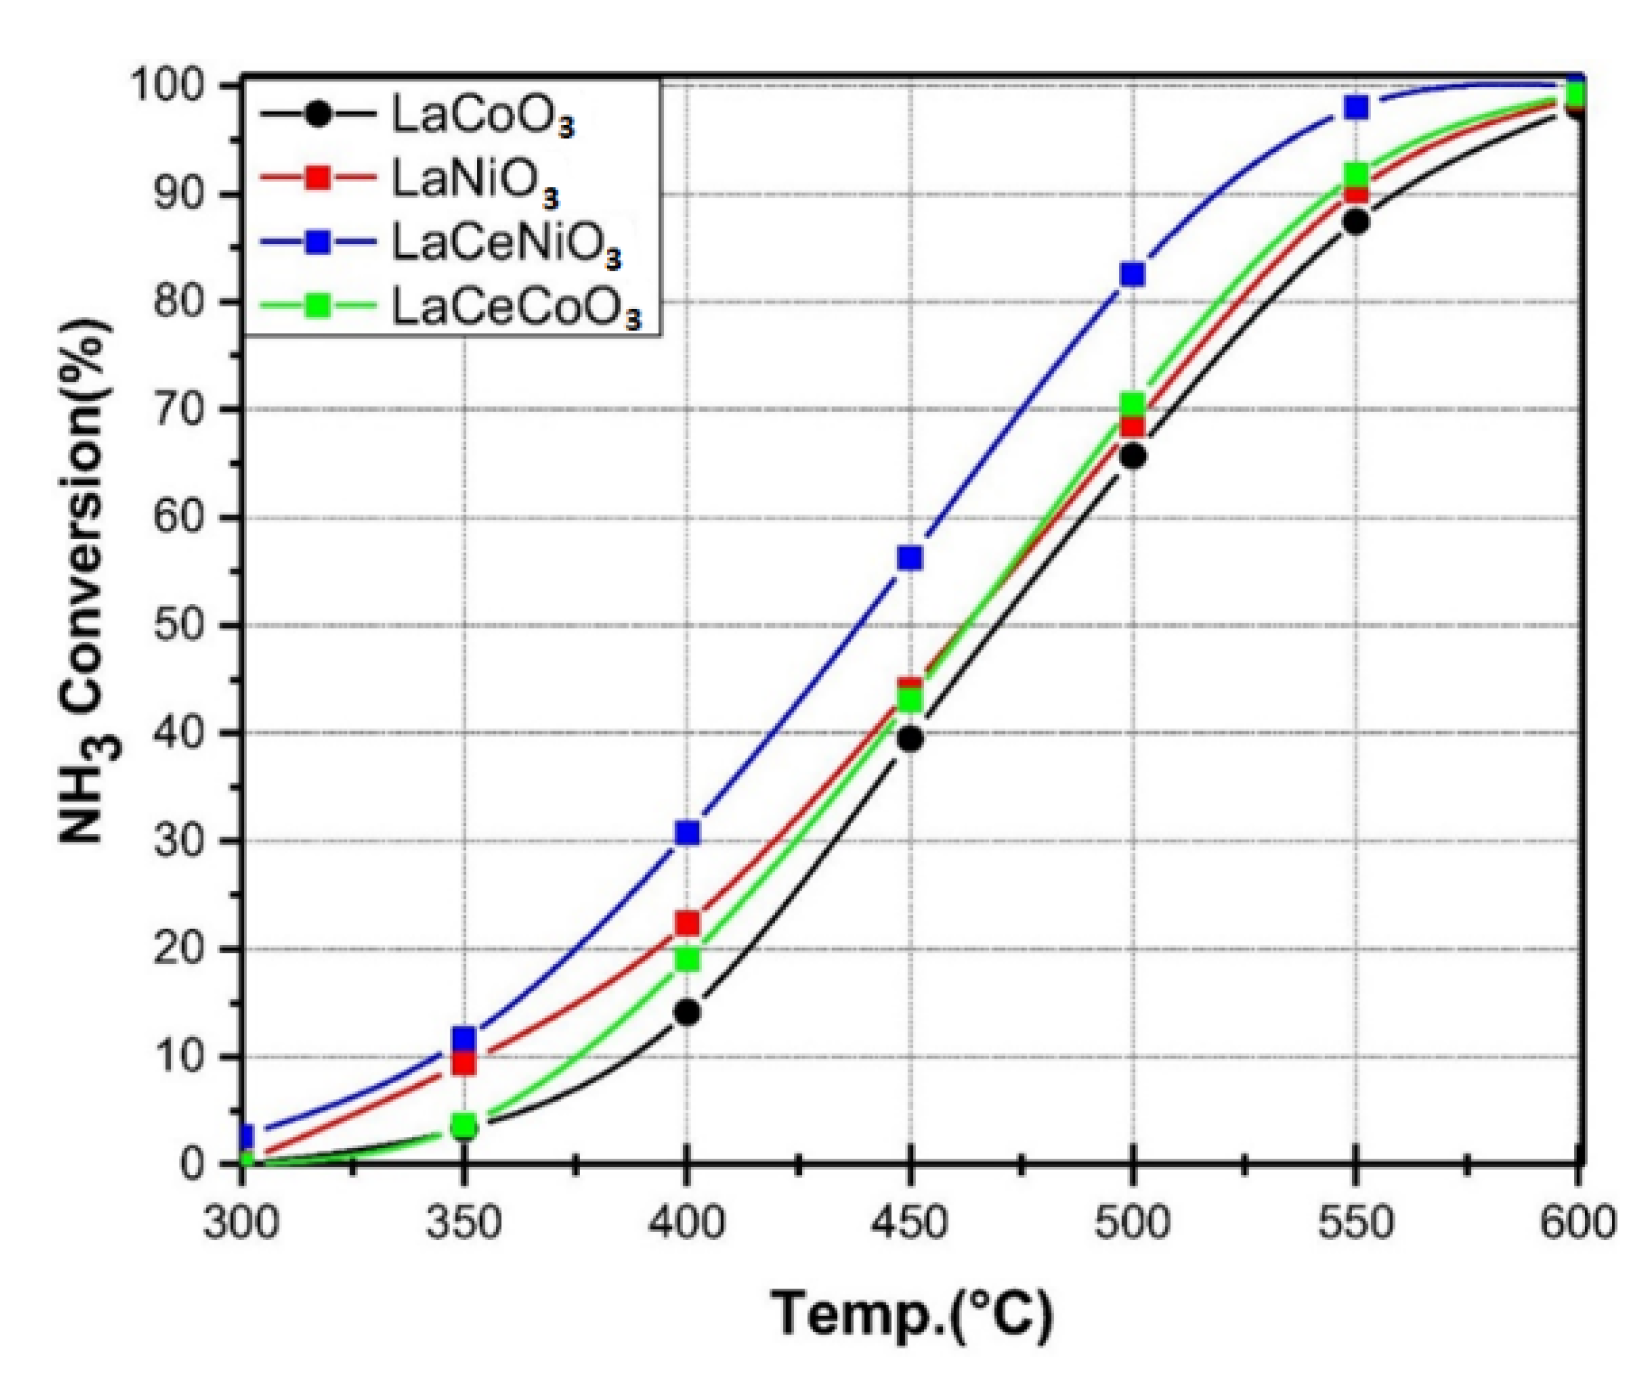
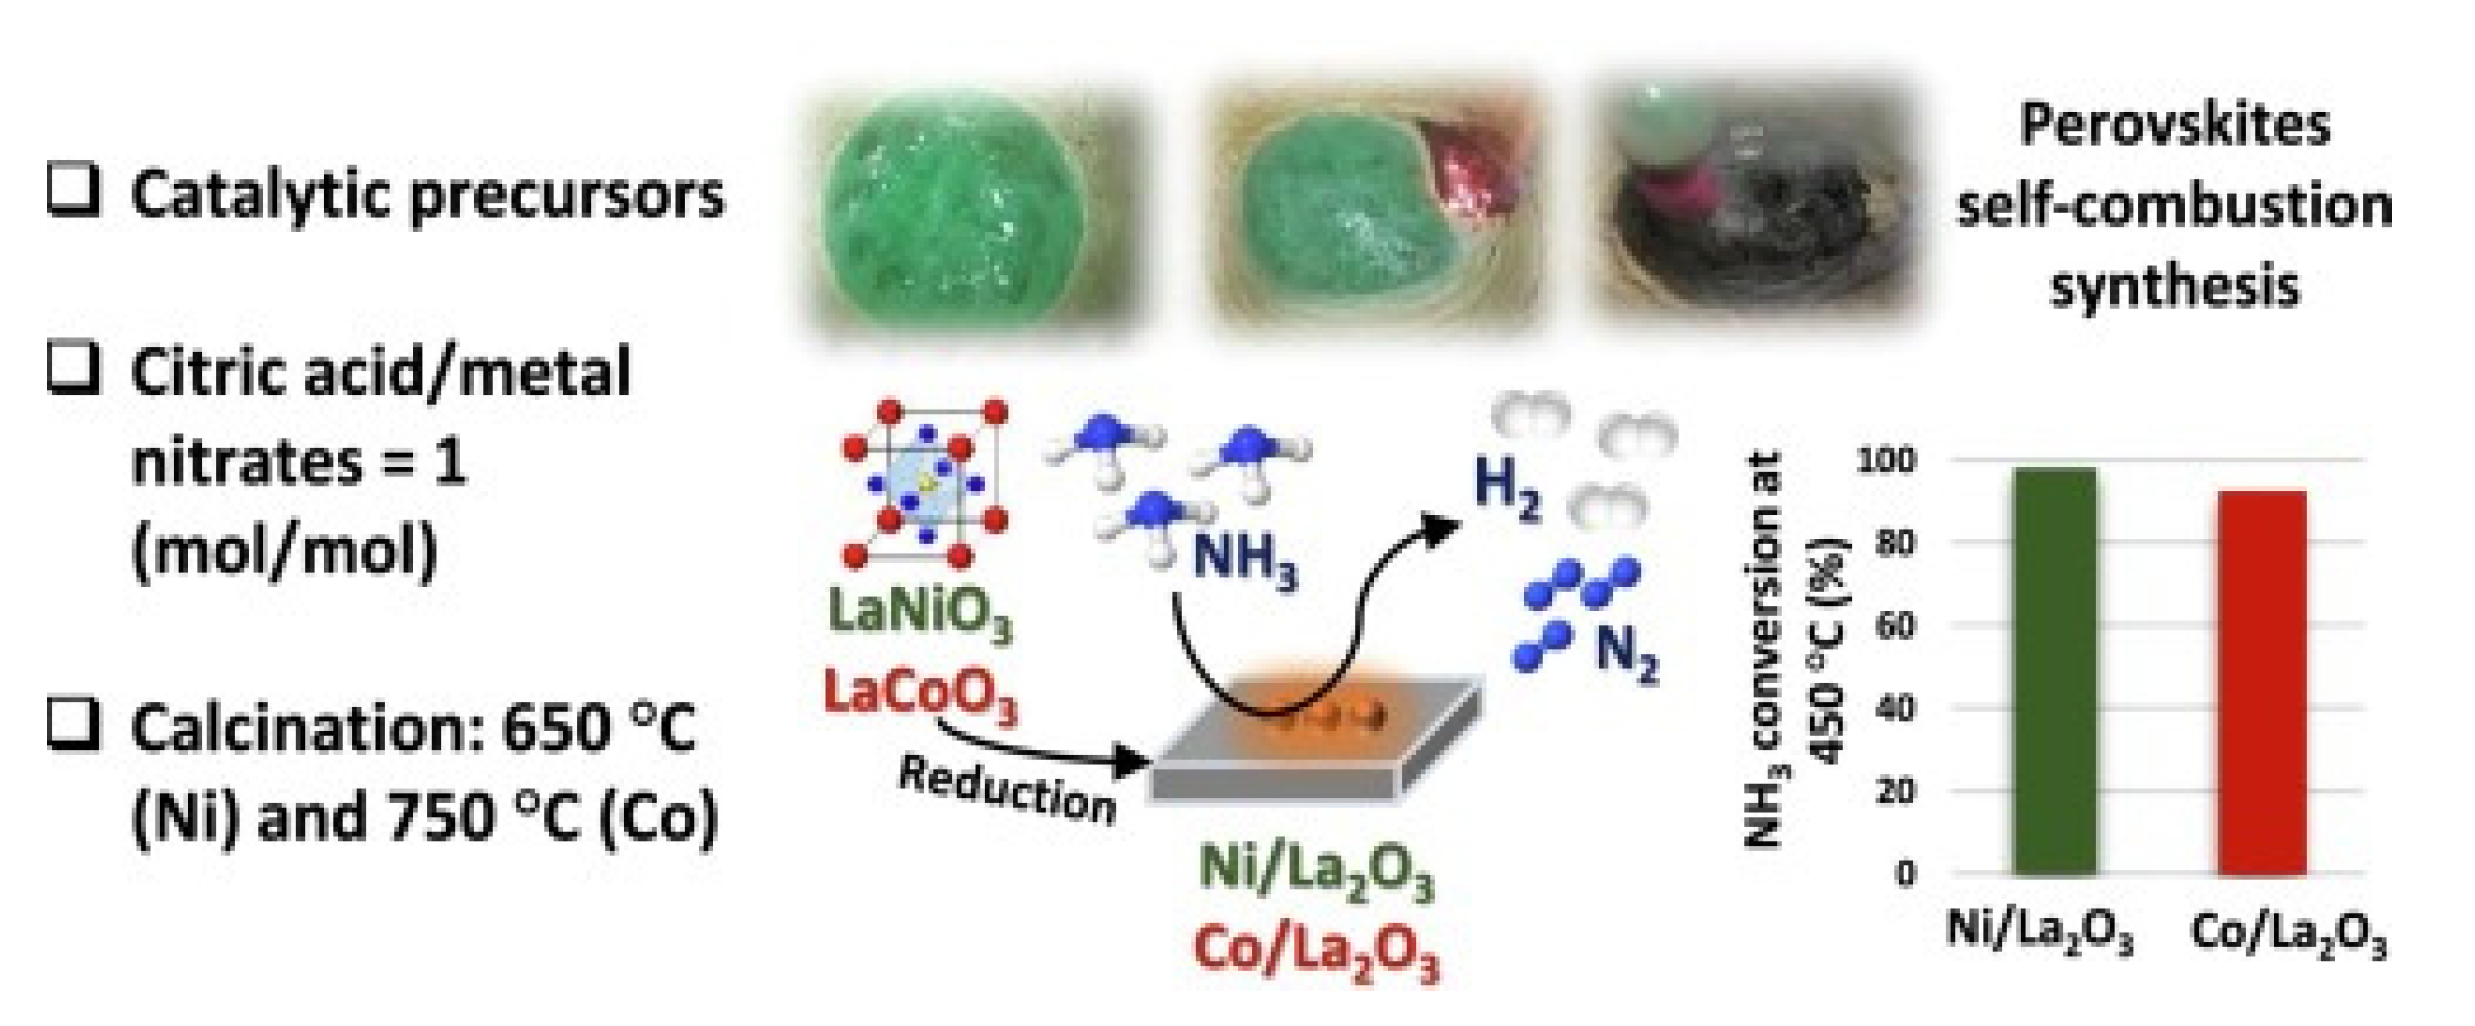
  130. Podila, S.; Driss, H.; Ali, A.M.; Al-Zahrani, A.A.; Daous, M.A. Influence of Ce substitution in LaMO3 (M = Co/Ni) perovskites for COx-free hydrogen production from ammonia decomposition. Arab. J. Chem. 2021, 15, 103547. [Google Scholar] [CrossRef]
  131. Pinzón, M.; Sánchez-Sánchez, A.; Sánchez, P.; de la Osa, A.; Romero, A. Ammonia as a carrier for hydrogen production by using lanthanum based perovskites. Energy Convers. Manag. 2021, 246, 114681. [Google Scholar] [CrossRef]
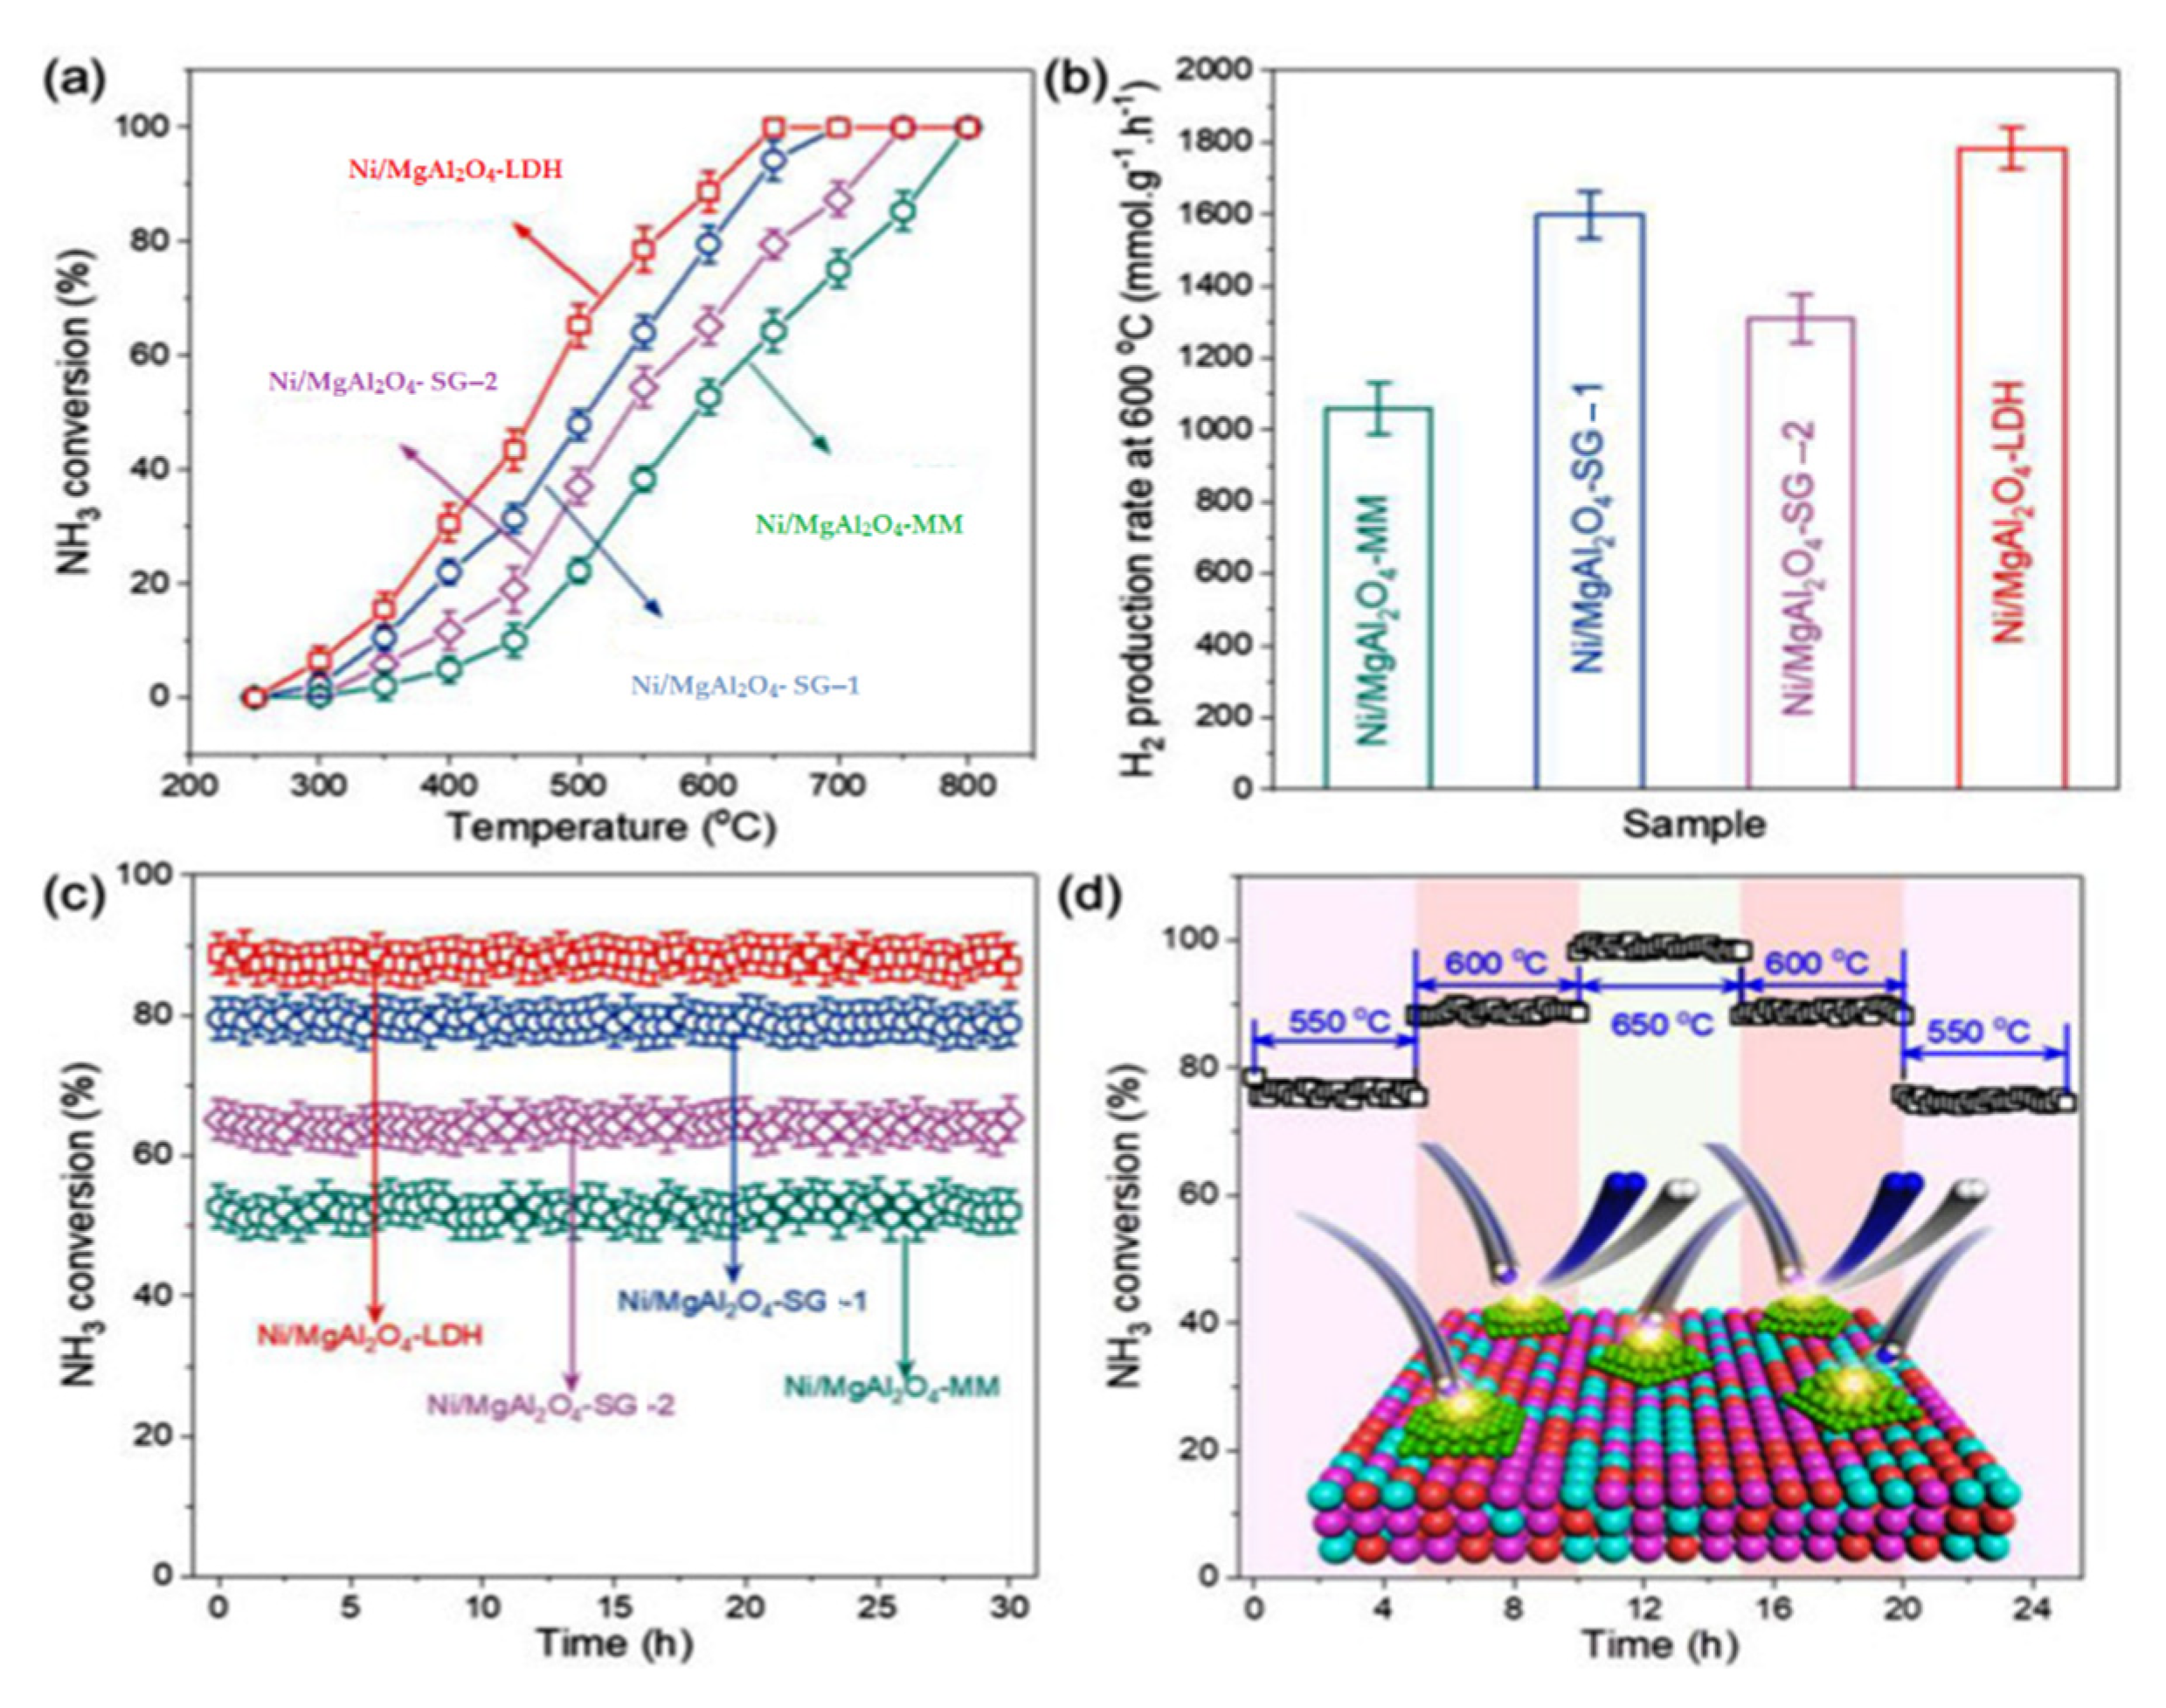
  132. Qiu, Y.; Fu, E.; Gong, F.; Xiao, R. Catalyst support effect on ammonia decomposition over Ni/MgAl2O4 towards hydrogen production. Int. J. Hydrogen Energy 2021, 47, 5044–5052. [Google Scholar] [CrossRef]
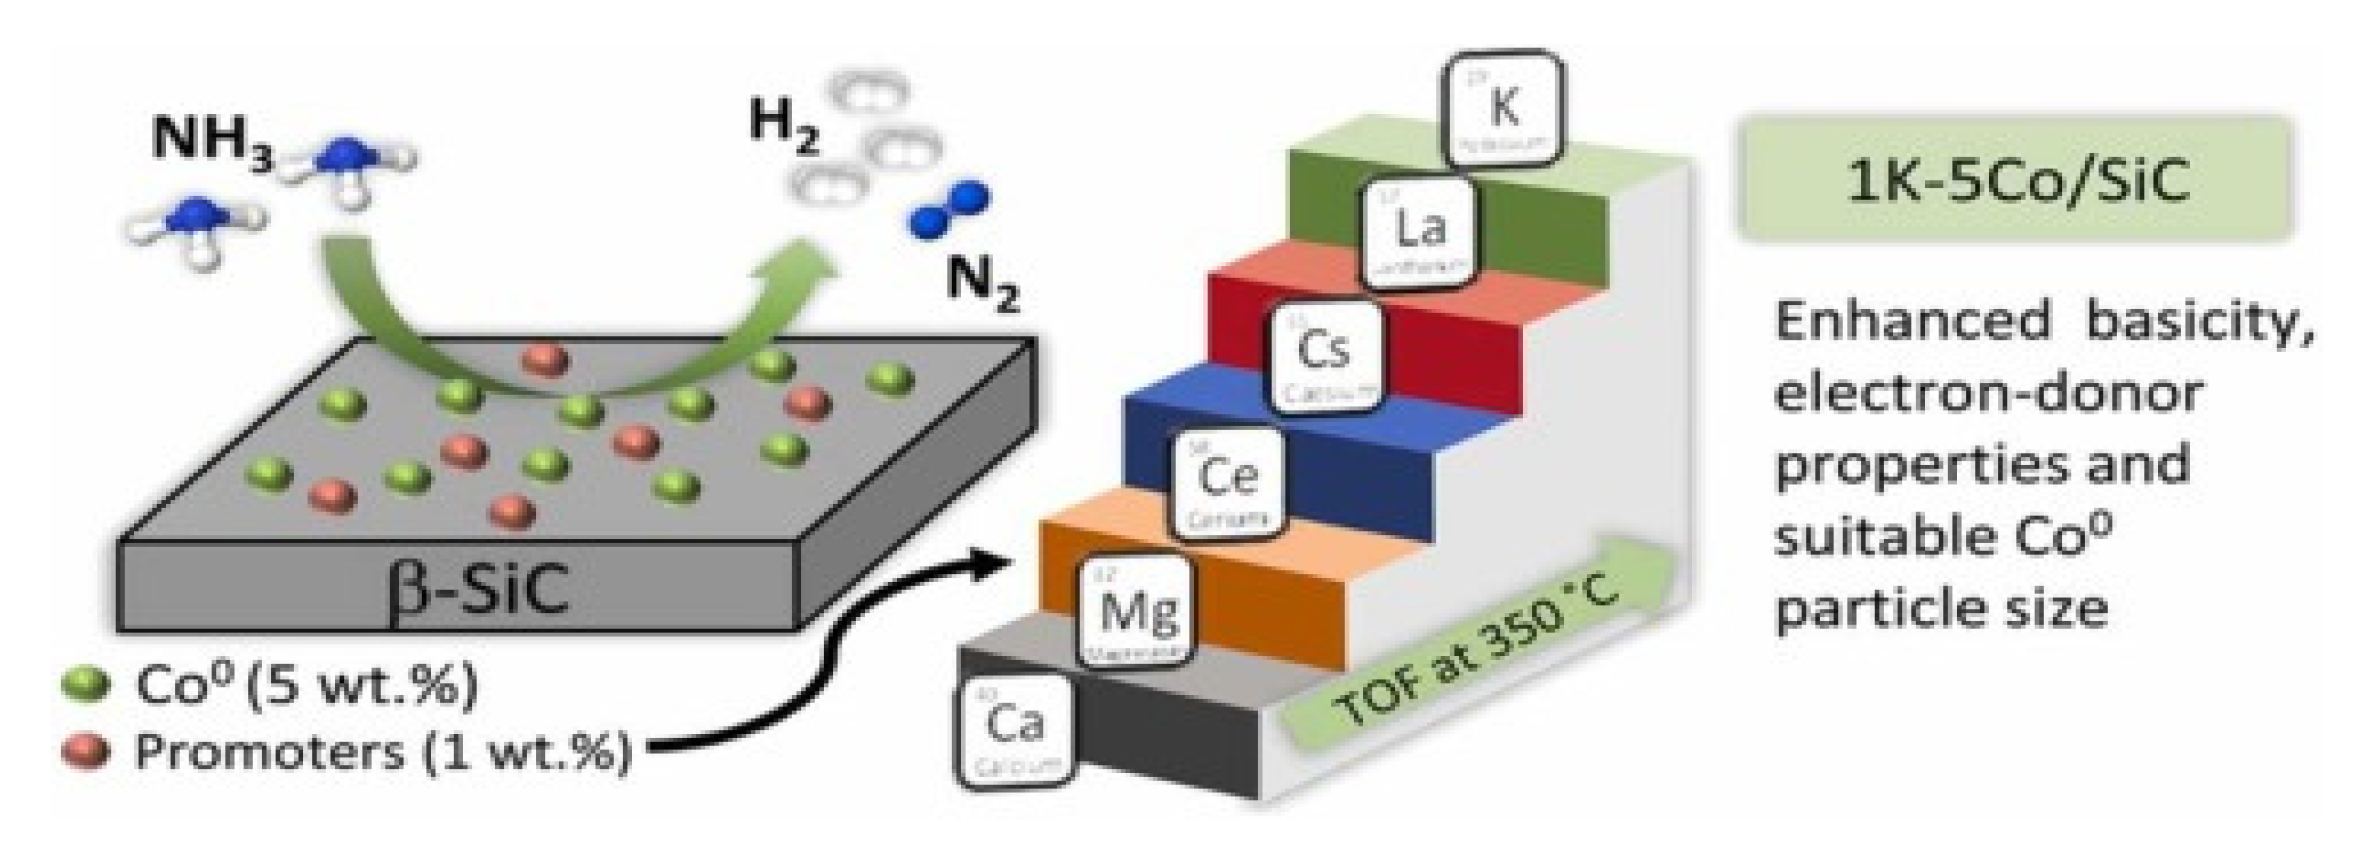
  133. Pinzón, M.; Romero, A.; de Lucas-Consuegra, A.; de la Osa, A.R.; Sánchez, P. COx-free hydrogen production from ammonia at low temperature using Co/SiC catalyst: Effect of promoter. Catal. Today 2022, 390, 34–47. [Google Scholar] [CrossRef]
  134. Gholami, Z.; Tišler, Z.; Rubáš, V. Recent advances in Fischer-Tropsch synthesis using cobalt-based catalysts: A review on supports, promoters, and reactors. Catal. Rev. 2021, 63, 512–595. [Google Scholar] [CrossRef]
  135. Jackson, C.; Fothergill, K.; Gray, P.; Haroon, F.; Makhloufi, C.; Kezibri, N.; Davey, A.; Hote, O.L.; Zarea, M.; Davenne, T.; et al. Ammonia to Green Hydrogen Project; Feasibility Study; Ecuity: Birmingham, UK, 2020; pp. 1–70. [Google Scholar]
  136. Wang, Z.; Yao, Y.; Chen, R.; Wang, Z. Research progress on electrocatalytic decomposition of ammonia for hydrogen production. CIESC J. 2022, 73, 1008–1021. Available online: https://hgxb.cip.com.cn (accessed on 15 March 2022).
  137. McEnaney, J.M.; Singh, A.R.; Schwalbe, J.A.; Kibsgaard, J.; Lin, J.C.; Cargnello, M.; Jaramillo, T.F.; Nørskov, J.K. Ammonia synthesis from N2 and H2O using a lithium cycling electrification strategy at atmospheric pressure. Energy Environ. Sci. 2017, 10, 1621–1630. [Google Scholar] [CrossRef] [Green Version]
  138. Gao, W.; Guo, J.; Wang, P.; Wang, Q.; Chang, F.; Pei, Q.; Zhang, W.; Liu, L.; Chen, P. Production of ammonia via a chemical looping process based on metal imides as nitrogen carriers. Nat. Energy 2018, 3, 1067–1075. [Google Scholar] [CrossRef]
  139. Hargreaves, J.S.J. Nitrides as ammonia synthesis catalysts and as potential nitrogen transfer reagents. Appl. Petrochem. Res. 2014, 4, 3–10. [Google Scholar] [CrossRef] [Green Version]
  140. Giddey, S.; Badwal, S.; Kulkarni, A. Review of electrochemical ammonia production technologies and materials. Int. J. Hydrogen Energy 2013, 38, 14576–14594. [Google Scholar] [CrossRef]
  141. Kyriakou, V.; Garagounis, I.; Vasileiou, E.; Vourros, A.; Stoukides, M. Progress in the Electrochemical Synthesis of Ammonia. Catal. Today 2017, 286, 2–13. [Google Scholar] [CrossRef]
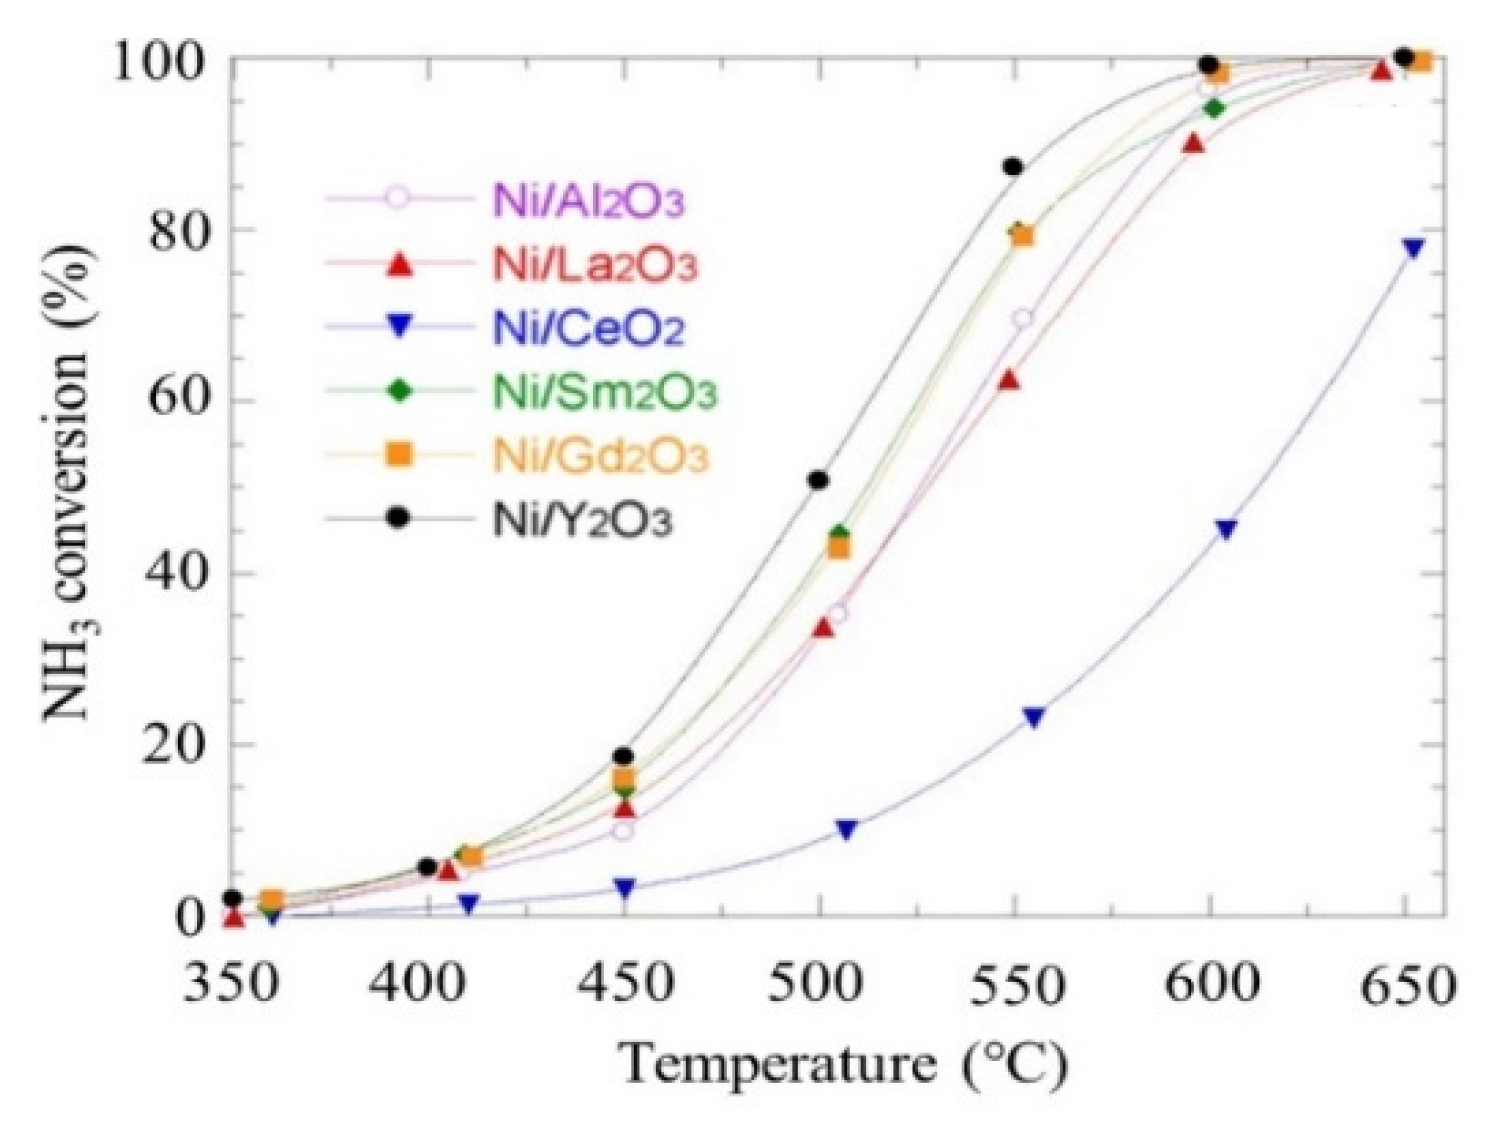
  142. Seyfeli, R.C.; Varisli, D. Performance of microwave reactor system in decomposition of ammonia using nickel based catalysts with different supports. Int. J. Hydrogen Energy 2022, 47, 15175–15188. [Google Scholar] [CrossRef]
  143. Zhang, S.; He, Z.; Zuoli, H.; Zhang, J.; Zang, Q.; Wang, S. Building heterogeneous nanostructures for photocatalytic ammonia decomposition. Nanoscale Adv. 2020, 2, 3610–3623. [Google Scholar] [CrossRef] [PubMed]
  144. Chang, F.; Gao, W.; Guo, J.; Chen, P. Emerging Materials and Methods toward Ammonia-Based Energy Storage and Conversion. Adv. Mater. 2021, 33, 2005721. [Google Scholar] [CrossRef] [PubMed]
  145. Elysabeth, T.; Mulia, K.; Ibadurrohman, M.; Dewi, E.L.; Slamet. A comparative study of CuO deposition methods on titania nanotube arrays for photoelectrocatalytic ammonia degradation and hydrogen production. Int. J. Hydrogen Energy 2021, 46, 26873–26885. [Google Scholar] [CrossRef]
  146. Hayakawa, Y.; Miura, T.; Shizuya, K.; Wakazono, S.; Tokunaga, K.; Kambara, S. Hydrogen production system combined with a catalytic reactor and a plasma membrane reactor from ammonia. Int. J. Hydrogen Energy 2019, 44, 9987–9993. [Google Scholar] [CrossRef]
  147. Giddey, S.; Badwal, S.P.S.; Munnings, C.; Dolan, M. Ammonia as a Renewable Energy Transportation Media. ACS Sustain. Chem. Eng. 2017, 5, 10231–10239. [Google Scholar] [CrossRef]
  148. Kojima, Y. Hydrogen storage materials for hydrogen and energy carriers. Int. J. Hydrogen Energy 2019, 44, 18179–18192. [Google Scholar] [CrossRef]
  149. Vermaak, L.; Neomagus, H.W.J.P.; Bessarabov, D.G. Hydrogen Separation and Purification from Various Gas Mixtures by Means of Electrochemical Membrane Technology in the Temperature Range 100–160 °C. Membranes 2021, 11, 282. [Google Scholar] [CrossRef]
  150. Huang, F.; Pingitore, A.T.; Benicewicz, B.C. Electrochemical Hydrogen Separation from Reformate Using High-Temperature Polybenzimidazole (PBI) Membranes: The Role of Chemistry. ACS Sustain. Chem. Eng. 2020, 8, 6234–6242. [Google Scholar] [CrossRef]
  151. Du, Z.; Liu, C.; Zhai, J.; Guo, X.; Xiong, Y.; Su, W.; He, G. A Review of Hydrogen Purification Technologies for Fuel Cell Vehicles. Catalysts 2021, 11, 393. [Google Scholar] [CrossRef]
  152. Speight, J.G. Chapter 15—Hydrogen Production. In Heavy Oil Recovery and Upgrading; Gulf Professional Publishing: Houston, TX, USA, 2019; pp. 657–697. [Google Scholar]
  153. Yáñez, M.; Relvas, F.M.; Ortiz, A.; Gorri, D.; Mendes, A.; Ortiz, I. PSA purification of waste hydrogen from ammonia plants to fuel cell grade. Sep. Purif. Technol. 2019, 240, 116334. [Google Scholar] [CrossRef]
  154. Malmali, M.; Le, G.; Hendrickson, J.; Prince, J.; McCormick, A.V.; Cussler, E.L. Better Absorbents for Ammonia Separation. ACS Sustain. Chem. Eng. 2018, 6, 6536–6546. [Google Scholar] [CrossRef]
  155. Çetin, Y.; Sarioğlan, A.; Okutan, H. Comparison of catalytic activities both for selective oxidation and decomposition of ammonia over FE/HZΒ catalyst. J. Turk. Chem. Soc. Sect. A Chem. 2016, 4, 227. [Google Scholar] [CrossRef] [Green Version]
  156. Wassie, S.A.; Medrano, J.A.; Zaabout, A.; Cloete, S.; Melendez, J.; Tanaka, D.A.P.; Amini, S.; Annaland, M.V.S.; Gallucci, F. Hydrogen production with integrated CO2 capture in a membrane assisted gas switching reforming reactor: Proof-of-Concept. Int. J. Hydrogen Energy 2018, 43, 6177–6190. [Google Scholar] [CrossRef]
Figure 1. Expected annual demand for hydrogen based on (a) hydrogen production technologies and (b) sectors (Mt). Hydrogen produced by electrolysis, and also as a by-product of catalytic naphtha reforming (CNR) based on technology of carbon capture, utilization and storage (CCUS). Reprinted with permission [4].
Energies 15 08246 g001
Figure 3. Transition from fossil-based to hydrogen-based energy Reprinted with permission [19].
Energies 15 08246 g003
Figure 5. Different hydrogen (a) production pathways and (b) the estimated cost of blue, grey and green hydrogen production. Reprinted with permission [10,32,33].
Energies 15 08246 g005
Figure 6. Diverse hydrogen production technologies and their energy sources. Reprinted with permission [35].
Energies 15 08246 g006
Figure 7. Chart of hydrogen production from different resources. Reprinted with permission [37].
Energies 15 08246 g007
Figure 8. (a) Hydrogen production methods by their source-based emissions and capture of CO2 emissions from combustion and chemical conversion, (b) the source of hydrogen produced in Europe, 2019. Reprinted with permission [55].
Energies 15 08246 g008
Figure 9. The comparison of various methods of hydrogen production in terms of cost (USD/kg) and their environmental impacts (kg CO2 eq). Reprinted with permission [28,57].
Energies 15 08246 g009
Figure 10. Comparison of the energy density of ammonia and hydrogen with carbon-based fuels. Reprinted with permission [69].
Energies 15 08246 g010
Figure 11. The pathways and technology roadmap of ammonia production in different scenarios (the stated policies, the sustainable development, and the Net Zero emissions) from 2020 to 2050 (electrolysis pyrolysis, biomass, coal, coal with CCS, gas, gas with CCS, oil, fossil with CCU methods and near-zero emission). Reprinted with permission [70,71].
Energies 15 08246 g011
Figure 12. Comparison of greenhouse gas emissions from different liquid ammonia production methods. (a) kg of CO2 per kg of NH3, and (b) g of CO2 per equal MJ of NH3. Reprinted with permission [56].
Energies 15 08246 g012
Figure 13. Comparison of energy consumption (GJ/t NH3) of various ammonia production technologies and their CO2 emissions (t CO2/t NH3). Reprinted with permission [75].
Energies 15 08246 g013
Figure 14. Comparison costs of different ammonia production pathways, including blue and green ammonia, based on the cumulative emission savings (Kt CO2/t NH3). Reprinted with permission [76].
Energies 15 08246 g014
Figure 15. Comparing exergy consumption for the various methods of ammonia production, including conventional, WF-RC-EE, NG-RC-no EE, NG-CC-no EE, SG-RC-no EE, SG-CC-no EE. Reprinted with permission [69].
Energies 15 08246 g015
Figure 16. Comparing CO2 emissions for the various methods ammonia production, including conventional, WF-RC-EE, NG-RC-no EE, NG-CC-no EE, SG-RC-no EE, SG-CC-no EE. Reprinted with permission [70]. The CO2 balance as a measure of the total amount of carbon dioxide emissions that are directly or indirectly caused by production activities [69].
Energies 15 08246 g016
Figure 17. Exergy loss for the important components of ammonia production systems, such as reactor, compressor, and reformer for conventional, conventional, WF-RC-EE, NG-RC-no EE, NG-CC-no EE, SG-RC-no EE, SG-CC-no EE. Reprinted with permission [69].
Energies 15 08246 g017
Figure 18. Catalytic ammonia decomposition, (a) schematic, (b) conversion with temperature. Reprinted with permission [92].
Energies 15 08246 g018
Figure 19. Ammonia conversion association with reaction temperature. Reprinted with permission [93].
Energies 15 08246 g019
Figure 20. Schematic process flow diagram of the conversion of ammonia to hydrogen and the separation and purification for the simulation model at a 500 kW scale with the output of H2. Note: HX comp = compressor cooler; HXpr = preheater; HX ref = reformer heat exchanger mantle; REF = reformer; C = compressor; ads = adsorber. Reprinted with permission [48].
Energies 15 08246 g020
Figure 21. Ammonia decomposition with the tubular fixed-bed reactor and Cs/Ru catalyst. Reprinted with permission [38,103].
Energies 15 08246 g021
Figure 22. (A) the morphology of the hollow fiber, after the sol-gel impregnation with the precursor xerogel solution (B) SEM images of the cross-section of the 4-channelled hollow fiber, at different magnifications (iiv), and the use of a precursor liquid solution results in the catalyst being uniformly dispersed. (C) deposition layers of the Al2O3 hollow fiber with the Ru-NCX catalyst in three steps of polymerization, carbonization and incipient wetness impregnation. Reprinted with permission [41,110].
Energies 15 08246 g022
Figure 23. (A) Compression of the fixed bed PBR and the HFR decomposition rate by temperature, (B) the size of reactors and their pressure drop per length, (C) designed reactor for 72 m3/h H2 supply of a 100 kW car. Reprinted with permission [41,110].
Energies 15 08246 g023
Figure 24. The effect of reaction temperature of the ammonia decomposition over a Pd-based membrane (PMR) on hydrogen recovery and ammonia concentration in the hydrogen permeate. Reprinted with permission [39].
Energies 15 08246 g024
Figure 25. Membrane reactors based on their different properties. Reprinted with permission [37].
Energies 15 08246 g025
Figure 27. Model of active catalyst concentration and the turnover frequency (TOF). Reprinted with permission [120].
Energies 15 08246 g027
Figure 28. Turnover frequency (TOF) (a) as a function of nitrogen adsorption and (b) of various precious metal catalysts. Reprinted with permission [48].
Energies 15 08246 g028
Figure 29. Comparison of turnover frequencies (TOFs) of supported catalyst for ammonia decomposition by modeling (circles, left axis) and experimenting (triangles, right axis) at 850 K. Reprinted with permission [115].
Energies 15 08246 g029
Figure 30. Ru-based catalysts for ammonia decomposition. Reprinted with permission [115].
Energies 15 08246 g030
Figure 31. Development process of resorcinol–formaldehyde carbon xerogel for Ru-based catalyst. Reprinted with permission [125].
Energies 15 08246 g031
Figure 32. Catalytic activities of Ru/La Al2O3 under different GHSVs with varying catalyst loadings (a); TOF comparisons of various Ru supported on pelletized and powder forms (b); catalytic activities with varying temperatures (c); TEM images of durability tests of the catalyst over 280 days (6700 h) (d). Reprinted with permission [48].
Energies 15 08246 g032
Figure 33. Comparison performance of lanthanum-based catalysts for ammonia decomposition. Reprinted with permission [130].
Energies 15 08246 g033
Figure 34. The process of ammonia decomposition over a La-based catalyst consists of calcined nickel and cobalt [131].
Energies 15 08246 g034
Figure 35. The effects of catalysts support properties on performance of ammonia decomposition at temperatures from 250 to 800 °C (a) ammonia conversion at different temperatures (b) different support catalysts with the highest conversion rate for the Ni/MgAl2O4- LDH catalyst (c) time course of different support catalysts and (d) time course of ammonia conversion at 550 to 600 °C [132].
Energies 15 08246 g035
Figure 36. Ammonia cracking over Ni-based catalysts at different temperatures from 350 to 650 °C. the highest ammonia conversion rate at different temperatures reached with Ni/Y2O3. Reprinted with permission [111].
Energies 15 08246 g036
Figure 37. Relationship between the forward ammonia turnover rate (TOF) and average particle size (a)) for Ni (circles) in compare with Ru (triangles), (b) for Ni–Al2O3 (solid squares) in compare with La–Al2O3 catalysts (hollow squares). Reprinted with permission [86].
Energies 15 08246 g037
Figure 38. Cobalt-based catalysts, their support and promoters in ammonia decomposition. Reprinted with permission [133].
Energies 15 08246 g038
Figure 39. Comparison of catalytic activities of metal amides with supported nickel and ruthenium catalysts at 580–600 °C. Reprinted with permission [136].
Energies 15 08246 g039
Figure 40. Schematic of ammonia-to-hydrogen conversion by the hybrid thermal–electrochemical cell. Reprinted with permission [53].
Energies 15 08246 g040
Figure 41. The hydrogen production over the platinum loaded titanium oxide photocatalysts: the highest product yield was obtained on the platinum loaded anatase. (a) variation of production rate with a specific surface area of catalyst (b). Reprinted with permission [116,143].
Energies 15 08246 g041
Figure 42. The three-dimensional coordinate system for the decomposition of ammonia with solar energy. The energy conversion rate shows the color of the surfaces: the lower rate, closer to blue, and the higher rate, closer to red. Reprinted with permission [100].
Energies 15 08246 g042
Table 1. Expected global hydrogen demand (in megatons) of the different energy sectors in the Net Zero Scenario, 2020–2030. Reprinted with permission [4,5].
Refining
(Mt)
Industry (Mt)Transport (Mt)Power (Mt)Ammonia fuel (Mt)Synfuels (Mt)Buildings (Mt)Grid Injection (Mt)
202037.1851.30.020000.010
202533.8263.222.1207.531.12.2523.85
203025.78758.5518.518.117.285.6451.7
Table 2. Comparing hydrogen properties with other fuels. Reprinted with permission [23,24].
FuelLiquid H2Gaseous H2Natural GasAmmoniaPropaneGasolineMethanol
FormulaH2H2CH4NH3C3H8C8H18CH3OH
Storage methodCryogenic liquidCompressed gasCompressed gasLiquidLiquidLiquidLiquid
Approximate AKI * Octane ratingRON > 130 MON very lowRON > 130 MON very low10711010387–93113
Storage temp (°C)−253252525252525
Storage pressure (kPa)10224,82124,82110301020101.3101.3
Fuel density (kg/m3)71.117.5187.2602.8492.6698.3786.3
Energy storage
LHV (MJ/kg)120.1120.138.118.845.842.519.7
LHV (MJ/L)8.52.17.111.322.629.715.5
Fuel requirement to match the energy of 10 gallons of gasoline
Fuel volume (L)131.5534.4157.599.249.837.972.5
Fuel weight (kg)9.49.429.559.824.526.457.0
AKI *: anti-knock index is the minimum octane rating for unleaded motor fuel and the mean of RON (research octane number) and MON (motor octane number).
Table 3. Comparison of three methods of hydrogen production from natural gas. Reprinted with permission [34].
Material and Energy RequirementsEfficiency %Temperature (°C)H2/CO Ratio
External HeatCatalystsPure Oxidation
Steam methane reforming (SMR)×70–85800–11001.2–2.8
Partial oxidation of methane (POM)××55–75950–15002
Auto-thermal reforming (ATR)×60–75700–10001.9–2.6
Table 4. Comparison of the energy and exergy efficiencies of some hydrogen production methods. Reprinted with permission [1,50,51].
MethodEnergy Efficiency
%
Exergy Efficiency
%
CostGlobal Warming Potential (GWP)Acidification Potential (AP)
ELCElectrolysis532573.433.388.6
PADPlasma arc decomposition703291.88.351.4
TLYThermolysis504061.275.074.3
TWSThermochemical water splitting423080.691.794.3
BIMBiomass conversion564581.066.720.0
BIGBiomass gasification656082.558.30.00
BIRBiomass reforming392879.362.58.6
PVEPhotovoltaic (PV) electrolysis12.4745.075.077.1
PCTPhotocatalysts2151.995.897.1
PECPhotoelectrochemical (PEC)71.50.0095.897.1
DAFDark fermentation131175.295.897.1
HTEHigh-temperature electrolysis292655.479.285.7
HYCHybrid thermochemical cycles534874.194.390.2
COGCoal gasification634691.10.0013.1
FFRFossil fuel reforming834692.825.057.1
BIPBio photolysis141372.775.097.1
PHFPhoto fermentation151476.195.897.1
APSArtificial photosynthesis9875.495.897.1
PELPhoto electrolysis7.83.470.983.397.1
IdealZero emissions and cost, efficient100100100100100
Table 5. Hydrogen production pathways and technologies. Reprinted with permission [54].
Hydrogen PathwaysSource of EnergyTechnologyEmissionsAdvantagesDisadvantages
Grey hydrogenFossil energiesReforming and gasificationCO2 emissionsMinimal cost
Huge-scale production
Innovative knowledge
Considerable CO2 emissions
Carbon tax
Finite natural resources
Blue hydrogenFossil energiesReforming and gasification and CCUSCaptured carbon emissionsEconomical compared with green hydrogen
Scaling potential with modification
Emitting low CO2 emissions
The CCUS technology needs to be improved
Investment difficulties could occur as green hydrogen becomes more competitive
Green hydrogenRESElectrolysisNo emissionsIf the installation is spread, it can be more adaptable
There are no unlimited resources required—just water and power
Significant costs
Based on the cost of power and the availability of water
Minimal capacity aspects linked with RES
Table 6. Various hydrogen production processes and their sources (feedstocks and energy) and cost per kg of hydrogen. Reprinted with permission [28,57].
ProcessSourcesCost
(USD/kgH2)
1SMR with CCSfossil fuels + NG2.27
2SMR without CCSfossil fuels + NG2.08
3CG with CCSfossil fuels coal1.63
4CG without CCSfossil fuels coal1.34
5ATR with CCSfossil fuels NG1.48
6Methane pyrolysisfossil fuels NG1.59–1.70
7Biomass pyrolysisSteam + wood1.25–2.20
8Biomass gasificationSteam + wood1.77–2.05
9Direct bio photolysisAlgae + water 2.13
10Indirect bio photolysisAlgae + water1.42
11Dark fermentationOrganic biomass2.57
12Photo fermentationOrganic biomass2.83
13Solar PV electrolysisSolar + water5.78–23.27
14Solar thermal electrolysisSolar + water5.10–10.49
15Wind electrolysisWind + water5.89–6.03
16Nuclear electrolysisNuclear + water4.15–7.00
17Nuclear thermolysisNuclear + water2.17–2.63
18Solar thermolysisSolar + water7.98–8.40
19Photo electrolysisSolar + water10.36
Table 7. Comparing the cost of hydrogen production methods based on power sources. Reprinted with permission [62].
MethodElectricity SourceHydrogen Production (kg/day)Hydrogen Cost (USD/kg)
Water electrolysisWind1400–62,9505.10–23.37
Solar PV135610.49
Solar Thermal10007.00
Thermochemical water splittingSolar60007.98–8.40
Water electrolysisNuclear10004.15
Thermochemical water splittingNuclear7000–800,0002.17–2.63
Natural gas steam reformingWith carbon capture storage-2.27
Without carbon capture storage-2.08
Coal gasificationWith carbon capture storage-1.63
Without carbon capture storage-1.34
Biomass gasification--1.77–2.05
Table 8. Equilibrium ammonia conversion depends on temperature. Reprinted with permission [85].
Temperature (°C)250300350400450500600700
NH3 conversion (%)89.2095.7098.1099.1099.5099.7099.9099.95
Table 9. Ammonia decomposition reactors, their performance, and their reaction temperatures. Reprinted with permission [81].
Type of ReactorPropertiesLimitationPerformance
Fixed Bed ReactorHigh pressure drop; difficulty in maintaining flow ratesLarge temperature gradient limits the extent of ammonia decomposition; not suitable for fast catalytic reactionsThe higher the feed temperature, the higher the conversion; temperature range 600–900 °C
MicroreactorCharacteristic length in the order of sub mm; eliminates temperature gradient; good for fast catalytic reactionsDifficult to scale up for industrial applications; also shows mass transfer limitations in some casesConversion 97.0% with feed of NH3–H2 mixture; temperature 400–700 °C; L = 55 mm D = 16 mm; 10 NmL/min P = 1 bar Efficiency = 10.4%
Micropost ReactorConsists of catalyst-covered pillar-like structures within a microchannel to reduce mass transfer limitationConversion depends on pore size; tradeoff required between conversion and pore size; has not been reported yetConversion: 85%; flow rate: 15 NmL/min; T = 650 °C P = 1 bar
Fluidized Bed Membrane ReactorRemoval of H2 from the reaction zone enhances equilibrium conversion at low temperature; lowers system capital and operating costsUse of Pd membrane reduces H2 selectivity; mostly reported using dilute ammonia; partial pressure of ammonia alters conversion; sweep gas dilutes H2Conversion:(55–99)%, 50–400 NmL/min T = 425–500 °C; P = 1–5 bar;
Catalytic Membrane ReactorUsed-metal-coated sandwich membranes inside catalyst bedFixed retentate pressure of 10 bar had to be maintained to ensure sufficient permeation of H2Conversion of 99.93% was attained at a temperature of 550 °C (Conversion: 74.4%;40 NmL/min T = 450 °C; P = 1–3 bar)
Table 10. Hydrogen permeating through Pd membrane before and after ammonia decomposing at different temperatures. Reprinted with permission [36].
Permeation
(mol cm−2s−1pa−1)
350 (°C)400 (°C)450 (°C)
Before
H24.19 × 10−115.52 × 10−116.46 × 10⁻¹¹
N2Not measurable at 5 × 10⁵ pa
After
H26.64 × 10−118.25 × 10−119.91 × 10⁻¹¹
N24.42 × 10−14N/AN/A
Table 11. Comparison of the performance of catalytic membrane reactor with the packed bed membrane reactor. Reprinted with permission [36].
Specifications of ReactorCMRCMRPBMR
Temperature (°C)400450520
Pressure (Mpa)0.5 0.50.3
Ammonia flow rate (cm3/min)61.3207.3150
Conversion (%)9895.798
Purity (%)98.799.799.2
Recovery (%)85.778.666
Productivity (mol m−3 s−1)8.123.93.6
Ru loadings (mgRu/cm2)1.431.4311.68
Table 12. Summary of ammonia decomposition catalysts based on reaction temperature, performance, conversion and efficiency rates. Reprinted with permission [115].
Catalyst/SupportTemp. (K) Conv. Eff. Rates (%)
Ru/Al2O3 at (1 bar)67399.00%
Ru/Al2O3 at (5 bar)67396.00%
Ru/Al2O3 at (5 bar)77399.00%
Ru/Al2O3 at (10 bar)67392.00%
Ru/Al2O3 at (10 bar)723 95.50%
Ru/Al2O3 at (10 bar)77397.20%
Ru/La–Al2O3 pellet catalyst77399.7%
Ru/CNT treated with KOH773 99.74%
Ru, when supported on carbon nanotubes (CNTs),77384.65% with an H2 28.35 mmol/min gcat
Ru or Cs-Ru, carbon powder pre-treatment solutions and catalyst deposition conditions 67390%, H2 29.8 mmol/min gcat
Ni components
Ni/Al2O382398.30%
Ni-CeO2/Al2O387399.90%
Ni/SBA-1587396.00%
Ni well-dispersed layers on mesoporous γ-Al2O388098%
Na/NaNH2 80099.20%
CsH2PO4 79696% for 1.48 mol H2/gcat h
Fe–MOx Ce, Al, Si, Sr, and Zr
N/Fe/TiO2 (NFT)29860% with radiation
CuO on TiO2 nanotube rows (TiNTAs)29850.1% with radiation
Rb precursor in Al-anodized Al2O3 micro-reactor873converts 99% into the equivalent of 60 W of hydrogen
Nitride and carbide catalysts
Carbides and nitrides of Fe, Co, Ni, Ti, V, Mn, and Cr
623–92396–98%
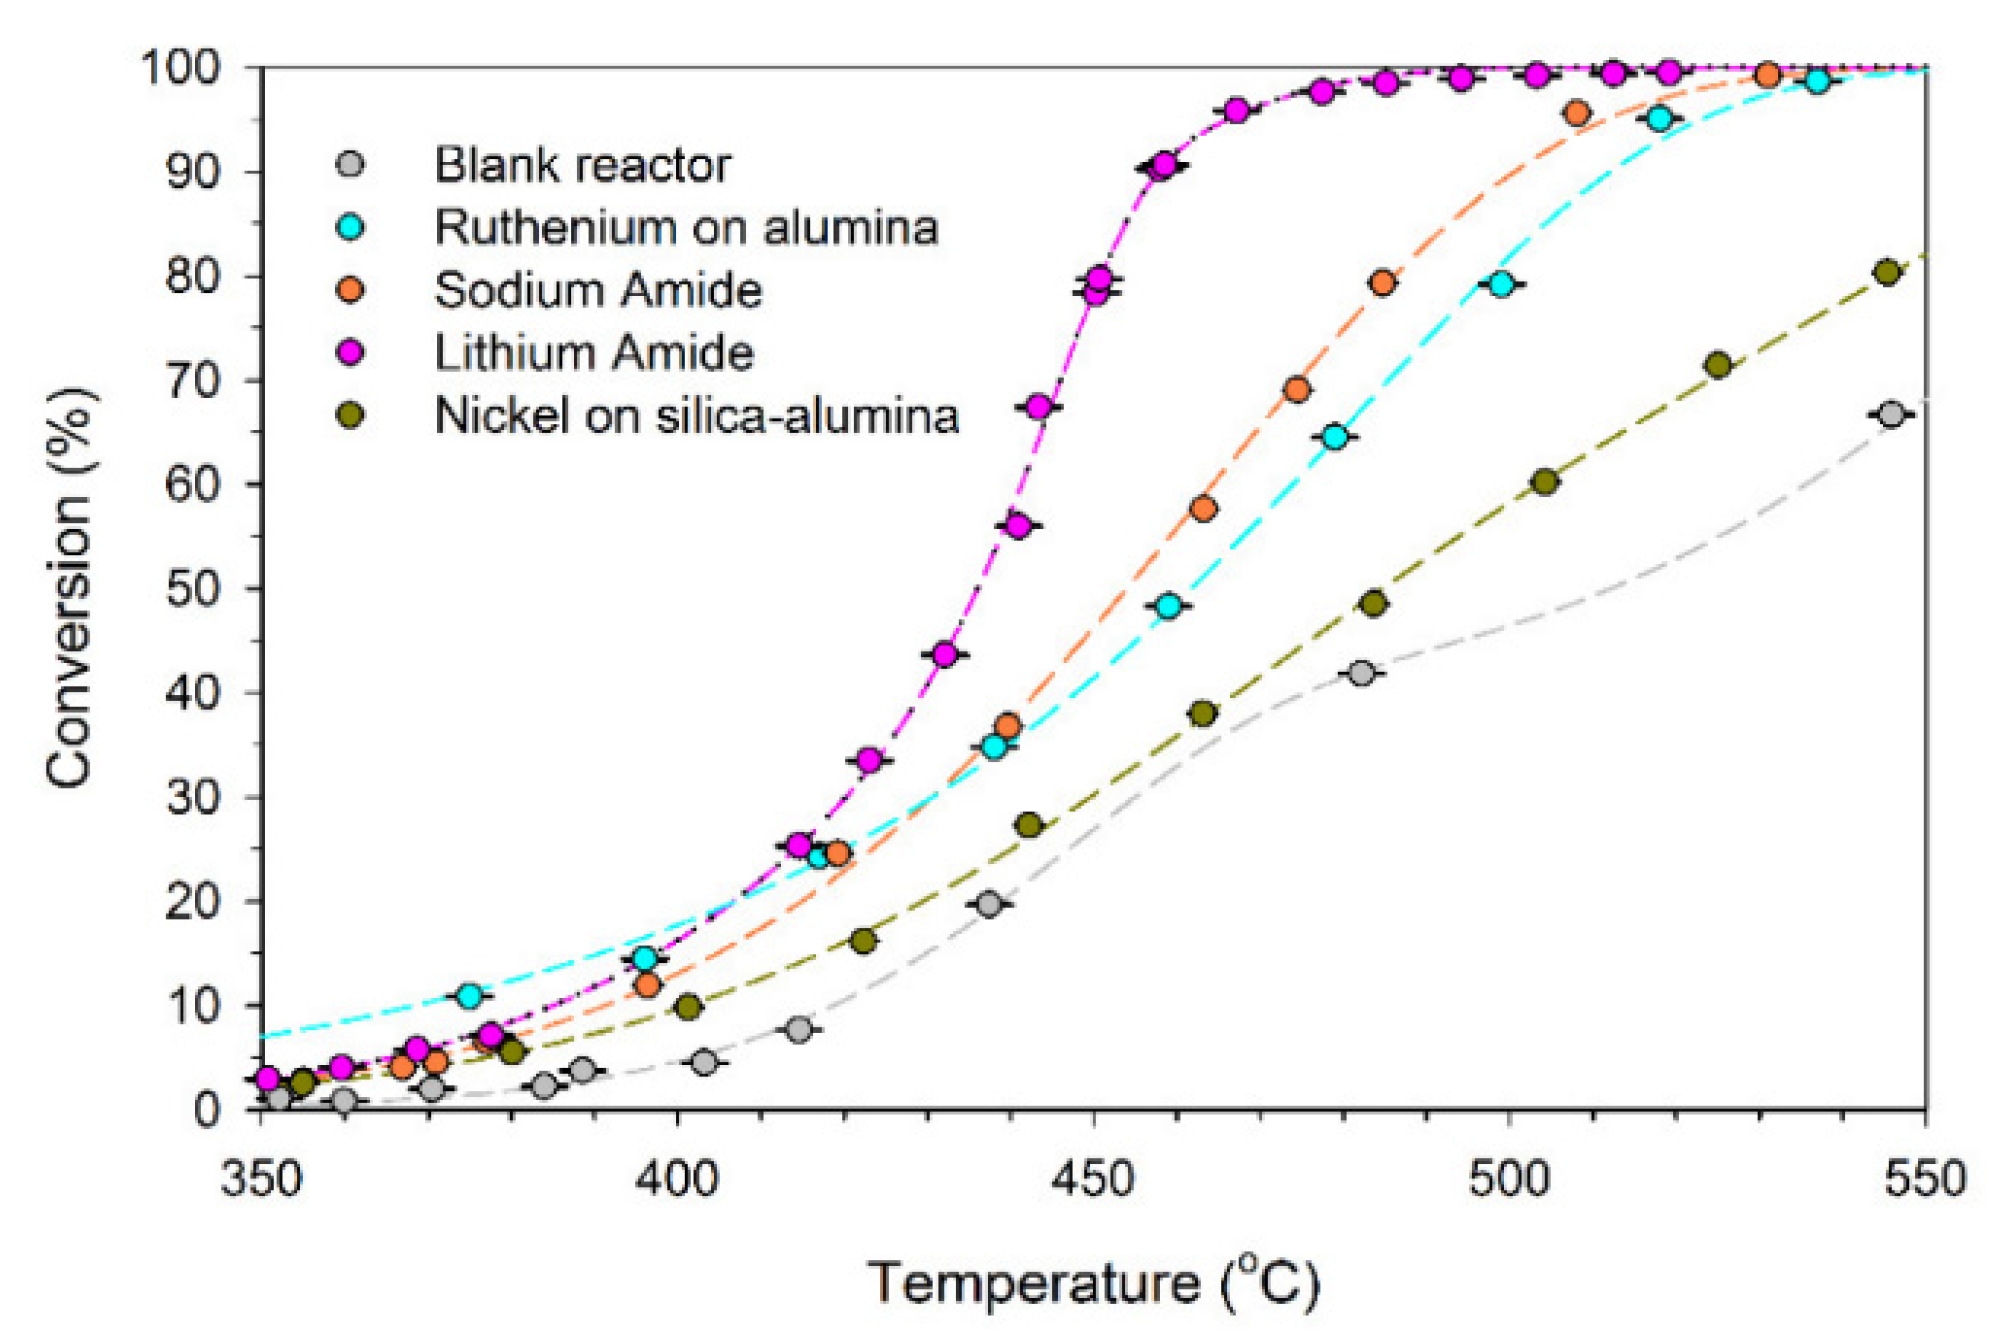
Metal amides/imides, alkali metal amides as sodium amide (NaNH2), lithium amide, Li2NH.Below 723
above 873
99%
Bimetallic catalysts, molybdenum, cobalt, CoMo and traces of Co added to Fe, Ptsn/Mgo, Pd, Cu, Gebelow 600 K96%
Table 13. Advantages and disadvantages of using ammonia for hydrogen production.
AdvantagesDisadvantages
Raw materialRenewable ammoniaToxic
Energy sourcesIf using renewable sources
No greenhouse gas emission
Greenhouse gas emissions if using carbon-based sources
NOx emission if using ammonia as fuel
TechnologyClean
Output products are green with water emission
Can reduce pollution
Sustainable
Large-scale hydrogen production systems are expensive, not well-established technology,
Energy-intensive, need high temperatures and catalyzer
Efficiency Low overall system efficiency (65%)
Table 14. Comparison of various ammonia decomposition methods for hydrogen production.
Material and Energy RequirementsPurificationEfficiencyTemperature
External HeatCatalystsSeparation
Thermochemical process HighHigh
Electrochemical process ×××HighAmbient
Photocatalytic ×Low Ambient
Publisher’s Note: MDPI stays neutral with regard to jurisdictional claims in published maps and institutional affiliations.

