1. Introduction
With the presentation of the European Green Deal at the end of 2019, the EU Commission set the ambitious goal to achieve a reduction of 55% in greenhouse gas (GHG) emissions by 2030 (with respect to 1990 levels) and to reach carbon neutrality by 2050 [
1].
The deployment of renewable energy sources (RESs) will have a primary role in reaching these targets. However, the added uncertainty introduced by the large deployment of non-dispatchable energy sources such as wind and photovoltaic power will increase the need for flexibility in the system in order to ensure the demand–supply balance.
In future energy systems, characterized by high RES penetration and limited availability of dispatchable sources such as steam and gas turbines, the increased need for flexibility is expected to be increasingly provided by the demand side through the uptake of demand response (DR) programs, which include a series of actions aiming at modifying the energy load in response to price signals, generally during periods of peak demand. Based on the definition adopted by D. Xenos et al. [
2], DR schemes can be classified as non-dispatchable and dispatchable programs. Non-dispatchable programs enable system operators to modify the consumption profile in the energy market through time-sensitive price schemes, while dispatchable programs are deployed in the reserves markets in order to ensure the availability and activation of ancillary services through economic incentives.
In this regard, the integration of the power, heating and transport sectors into a configuration of multiple energy systems and their participation in DR programs has been widely investigated and is considered pivotal for achieving carbon-neutrality in all sectors.
J. Gea-Bermúdez et al. [
3] prove the fundamental role of sector coupling in the green transition through simulations of different scenarios for the case of the Northern–Central Europe energy system. The results show that the highest greenhouse gas emission reduction is obtained for the scenarios linked to the highest electrification of the heating and transport sectors. The paper points out that the heating and electricity sector coupling is of utmost importance since heating and cooling are responsible for around half of the energy consumption in Europe [
3] and because this may bring many advantages to the system such as the integration of heat pumps, district heating networks and thermal energy storage, which are widely recognized as key technologies for the energy system transition. J. Lu et al. [
4] demonstrate that the integration of DR in the heat–electricity sector could enable the accommodation of renewable energy and enhance the resilience of the energy system. G. Ayele et al. [
5] underline the cost-effectiveness of thermal storage units for renewable integration and peak-shaving. Finally, S. Kozarcanin et al. [
6] test the effects on the power system deriving from the heating and electricity sector coupling and demonstrate that a highly electrified system leads to great cost increase but is also the only solution to reach net-zero emissions.
In recent years the research has been focusing on the electrification and flexibility potential of the residential thermal demand, which accounted for 45% of the total heating and cooling demand in 2012 [
7].
The 2019 “Decarbonising the EU Heating Sector” JRC Report [
8] identifies two main pathways for the energy transition of the residential thermal demand, namely (1) electrification of residential heat and (2) efficient heat and power production via cogeneration and district heating. The study reports the outcomes of a first assessment of the impact of these two transition pathways on the European energy system which is simulated through the open-source unit commitment and optimal dispatch model Dispa-SET [
9,
10]. Results demonstrate that in order to ensure both the security of the supply and the accommodation of high shares of renewables it is necessary to investigate more deeply the two options to find the optimal trade-off for the deployment of CHP and P2HT devices.
This paper therefore assesses and compares the effect on a country-scale energy system deriving from the large penetration of these two power-to-heat technologies. The work focuses on balancing and flexibility issues and on the participation of CHP and P2HT technologies in the provision of reserve requirements.
For this reason,
Section 1.1 describes the state of the art in the field of flexibility assessment for power-to-heat technologies (CHP and P2HT) while
Section 1.2 describes the existing methods for the evaluation of the reserve requirements in energy-system models.
1.1. The Flexibility Potential of Heat–Electricity Sector Coupling in the Residential Sector
The flexibility potential deriving from the large penetration of power-to-heat units has been largely investigated in literature in recent years. Many studies focus on P2HT devices that could enable the efficient full decarbonization of the residential heat demand: Kavvadias et al. [
11] assess the impact of the full electrification of the residential demand through the deployment of heat pumps and resistive heaters, demonstrating that this could lead to an increase in the electric peak demand in the range between 20% and 70% and results in unserved load. For this reason, the study of the flexibility potential of electric heating devices is essential in order to enable a higher integration of these technologies in the system. In this regard, different studies have been devoted to the assessment of the flexibility potential of electric heating devices in order to allow a higher integration in the system: A. Arteconi et al. [
12], D. Patteeuw et al. [
13], C. Magni et al. [
14] and Bernath et al. [
15] investigate the flexible operation of power-to-heat devices (heat pumps and electric heaters) and their impact on the overall system flexibility in terms of renewable integration, energy system costs and emission reduction at country/regional level. Georges et al. [
16] assess the amount of flexibility that could be reserved from a set of flexible residential heat pumps in the ancillary market for the case of the Belgian energy system. Results show that the deployment of 40,000 residential heat pumps could provide up to 70% of the current contracted amount of upward reserves in the winter season at half of the price compared to the base case which does not involve the deployment of power-to-heat units. However, the reserve requirements are considered constant over the year and do not consider the increased need for balancing power linked to the higher penetration of renewables in future energy system scenarios, leading to the overestimation of the potential power-to-heat devices contribution. Moreover, the participation of individual households in the ancillary market is not ready for implementation due to the lack of proper regulatory framework and business models that would allow metering and capturing such distributed sources of flexibility [
17].
Other studies focus on the flexibility potential of the second residential heat decarbonization pathway presented in [
8], namely cogeneration and district heating.
The research in this field focuses alternatively on the study of both decentralized RES-based systems (e.g., solar, geothermal) and DH systems supplied by power-to-heat technologies such as large-scale heat pumps and CHP units.
Solar-based DH networks are analyzed by A. Rosato et al. [
18], who present a model for a micro-scale solar DH network coupled with a long-term TES system. The main objective of the work is to compare this configuration with conventional residential heating systems. The results prove that DH systems combined with a TES unit enable a reduction in primary energy consumption, CO
2 emissions and operational costs. P. Mi et al. [
19] study the performances of a DH system based on photovoltaic thermal heat pumps and compare this solution with air source heat pumps, gas boilers and electric boilers for the supply. The paper demonstrates the advantages of photovoltaic-based DH systems in cities with certain meteorological characteristics. Finally, H. Rehman et al. [
20] develop a method for the comparison of decentralized photovoltaic and solar thermal DH systems using the software TRNSYS. The results show that photovoltaic-based systems outdo the solar thermal option in terms of renewable integration and pay-back time.
S. Siddiqui et al. [
21] represent the flexible operations of DH supplied by HP and linked with a thermal storage unit in order to evaluate the optimal size of the heat pump and storage units that minimizes the costs and maximizes the share of RESs. A. Arabkoohsar et al. [
22] investigate a new generation of DH networks coupled with large-scale HPs that could enable a higher system efficiency and reduced costs under flexible operations. R. Johannsen et al. [
23] test the flexible operations of a DH system under different electricity tariff schemes through the simulation tool EnergyPro [
24], demonstrating the importance of variable pricing schemes and economic remuneration to unlock the flexibility potential of power-to-heat technologies. K. Kavvadias et al. [
25] analyze the effect of the CHP units coupled with TES systems by developing a model for the representation of the flexible operations of CHP plants in the Dispa-SET energy system model [
9]. Results are measured in terms of overall efficiency of the energy supply, total operating costs and renewable integration. It is demonstrated that the integration of CHP units can lead to reduced costs and to an increase in the overall efficiency of the tested energy system, but can also increase the curtailment of renewable sources. F. Fattori et al. [
26] investigate the flexibility potential of DH systems supplied by P2HT units linked to TES systems for the integration of variable renewable sources through the development of an optimal dispatch model for the Italian energy system. The model is tested for scenarios with DH penetration corresponding to the one forecasted by the Italian Integrated National Energy and Climate Plan [
27]. Results show that the integration of these devices in the grid is effective for the accommodation of higher shares of RESs and that the benefits could increase with the increase in gas market prices. However, the paper does not consider the potential contribution of DH in the reserves market.
J. Tan et al. [
28] model the flexibility region of operation for DH systems and provide a study for a business model that could enhance the participation of DH systems in the energy and reserves market. D. Schüwer et al. [
29] assess the maximum technical reserve provision potential of CHP units for the case of Germany. First, a model for the representation of CHP plants is designed and their flexibility potential is evaluated for different configurations of the units. Then, the results are aggregated at the country level and prove that CHP could provide up to 54% of reserve requirements in the 2030 scenario. However, the reserve provision potential at the national level is not calculated through integration in an energy system model, thus not allowing the evaluation of the economic potential in the day-ahead or intraday market of the reserve provision for CHP units. Moreover, the study relies on historical data for the calculation of reserve needs and does not consider their possible variations due to the increase in RES penetration. Finally, D. Møller Sneum [
30] lists the technical barriers and solutions for unlocking the flexibility potential of DH in the energy system.
In general, the research on DH systems clearly demonstrates the effectiveness in providing flexibility to the grid, but it lacks a clear comparison between different heat supply technologies such as P2HT and CHP devices since the studies presented focus alternatively on one of the two options. Moreover, although the potential benefits in terms of renewable integration and total system costs have been already assessed by a few studies, the analyzed literature does not exhaustively assess the cost-effectiveness of DH systems in the provision of operating reserves. In particular, the papers that investigate this topic focus mainly on the representation of the DH systems while neglecting the reciprocal interactions with the power system. This is mainly due to the lack of unit-commitment energy system models that include a realistic estimation of the reserve needs and the optimization of the reserve allocation.
1.2. Reserve Representation in Open-Source Energy System Models
The majority of open-source unit-commitment and optimal dispatch energy system models neglect or oversimplify the representation of the ancillary market. This can lead to unrealistic outputs since the reservation of operating reserve capacity can significantly limit the availability of dispatchable energy sources or impose constraints on other elements of the system (e.g., storage units).
M. Groissböck [
31] discusses the maturity of 31 mainly open-source energy system models based on 81 functions, including the representation of reserves. The paper assesses the representation of reserves by dividing this characteristic into two features: “reserves margin” and “primary/secondary reserves”. The analysis shows that 18 out of the 31 models investigated completely neglect the representation of the reserves. Seven of the models investigated (Balmorel, Calliope, TIMES, OSeMOSYS, ProView, Switch and TEMOA) consider a “reserve margin” while optimizing the unit commitment of the generation units. This means that a certain percentage of the installed capacity is “locked” and considered unavailable for power generation for each time step of the optimization. This method is easy to implement but does not consider the share of non-dispatchable renewables in the system (which typically originates higher uncertainties) or the forecast error related to the energy demand. The second feature associated with the reserve representation (“primary/secondary reserves”) is included in 10 out of the 31 models analyzed in the study. In this case, the reserves are calculated based generally on the characteristics of the energy system (e.g., installed capacity, renewable penetration, load forecast) or alternatively on historical data.
Historical data are typically available on the online pages of the European TSOs (in the case of Italy, these values are available on the website of TERNA [
32]) and can be used for current scenario simulations. However, they cannot be employed to simulate future scenarios since the increase in the share of non-dispatchable energy sources such as wind and photovoltaic is expected to have a significant impact on the reserve needs.
The methods based on the characteristics of the power system can be divided into two categories: static and dynamic. The first option considers the reserve requirements constant during the year, while the second category evaluates the reserve needs for each time step based on the expected specific situation (e.g., hourly load, hourly forecasted RES availability).
Currently, most models that represent the primary and secondary reserves calculate their requirements based on static methods. One of the formulations adopted is the one suggested by the “Operation Handbook” by Entso-e [
33] that computes the reserve needs based on the yearly peak demand for each node
n as follows:
This method is currently adopted by the model Dispa-SET [
34].
The dynamic formulations employed in energy system models are typically empirical or stochastic. The “3+5” formulation is an example of an empirical method; it is proposed by NREL [
35] and applied by Carrión et al. in [
36].
Finally, an example of dynamic stochastic formulation for the German power system is proposed by [
37].
Dynamic stochastic formulations have been recently adopted by different TSOs since they allow the consideration of the uncertainty associated with variable RESs and with the expected electricity demand and its variability over the year.
Section 3.1 of this paper introduces a novel dynamic method for the assessment of the operating reserve requirements in unit-commitment and optimal dispatch models.
1.3. Rationale of the Work
As emerges from the analyzed literature, DH systems and power-to-heat technologies proved to be a promising solution to electrify and decarbonize the heating sector while ensuring the resilience of the grid thanks to their flexibility potential. However, it is not clear which would be the most cost-optimal solution for the system among different heat supply technologies such as CHP and HP. Moreover, the existing literature lacks the investigation of their potential in terms of reserve provision in the day-ahead market.
For these reasons, the objective of this work is twofold: (1) to investigate the potential contribution offered by the deployment of district heating (DH) systems in terms of flexibility and operating reserve provision through an optimal dispatch and unit commitment model and (2) to compare in terms of performance two different heating supply technologies, namely large-scale heat pumps (P2HT) and combined heat and power units (CHP). The case study analyzed here is the Italian energy system.
The paper is structured as follows:
Section 2 presents the methodology of the work, including the modeling framework adopted, the input data, the set of scenarios and the performance indicators analyzed. In
Section 3, results are presented and discussed. Finally,
Section 4 illustrates the main conclusions of the work.
2. Materials and Methods
The flexibility and operating reserve potential of DH systems supplied by P2HT and CHP units were investigated through the Dispa-SET model [
9]. Dispa-SET is an open-source unit-commitment and optimal dispatch model that focuses on balancing and flexibility problems in country-scale analysis. The model has been widely used in literature and by policymakers to represent and optimize the operations of large-scale power systems. In particular, it has been applied to energy system sector-coupling studies by M. Pavičević et al. [
38] to investigate the impact of the coupling of the power, heating and transport sectors in future Europe-wide energy systems with high shares of renewables. K. Kavvadias et al. [
25] employed the model for the investigation of the optimal operation of cogeneration plants coupled with thermal storage units for a large-scale energy system. Finally, J. J. Navarro et al. [
39] assessed the role of CHP and DH systems for the case of a decarbonized European energy system through the Dispa-SET. More information on the studies that involve the use of the Dispa-SET model is available in [
34].
In
Section 2.1, the model formulation and the integration of a novel method for the assessment of the reserve needs, together with the introduction of the power-to-heat units in the provision of the reserves, are described. Finally,
Section 2.2 introduces the set of scenarios analyzed, including different installed renewable capacities and different DH system configurations (P2HT and CHP) that are compared to test the results under different energy system configurations.
2.1. Modeling Framework
The energy system representation is based on a unit commitment and optimal dispatch formulation. The main features of the model are the following: minimum and maximum power for each unit, power plant ramping limits, reserves up and down, minimum up/down times, load shedding, curtailment, pumped-hydro storage, non-dispatchable units (e.g., wind turbines, run-of-river), power-to-heat (heat pumps and CHP), start-up costs and ramping costs. The unit commitment problem is solved through the minimization at each time step
i of the total operating system costs in all the system nodes
n. The total operating system costs are composed of fixed costs, variable costs, start-up and shut-down costs, ramp-up and ramp-down costs associated with each generation unit
u, shed load costs and costs related to each transmission line
l as described by Equation (2).
The main constraint for the system is the day-ahead demand–supply balance described in Equation (3), which must be ensured for each time step in all the nodes (countries) represented. At each time step
i, the sum of the power generated by all the units
u present in a node (including the power generated by the storage units), the power injected from neighboring nodes, and the curtailed power from renewable sources must be equal to the load in that node, plus the power consumed for energy storage, minus the load interrupted and the load shed.
represents the power generated by the unit
u at the time step
i.
and
correspond to the electricity demand and shed load related to the zone
n at each time step
i. is the power flowing in the transmission line
l at time
i. is equal to the electricity absorbed by power-to-heat units, and
is the power accumulated by each storage unit
s.
,
and
are binary variables that are equal to 1 when the power generation, storage and power-to-heat units are respectively located in the considered zone
n. Finally,
and
are the deficits in terms of minimum and maximum power. More details regarding the modeling framework are available in [
34].
2.1.1. Reserve Requirements
Besides the demand–supply balance, the reserve requirements must also be ensured at any time. In the proposed formulation, three types of reserves are defined in the day-ahead market with the following characteristics:
Secondary upward reserve (2U): reserves that can be satisfied only by spinning units, which must be ready to be activated almost immediately in case of necessity;
Secondary downward reserve (2D): reserves that can be satisfied only by spinning units, which must be ready to be activated almost immediately in case of necessity;
Tertiary upward reserve (3U): reserves that can be covered by spinning units and quick-start non-spinning units; their maximum activation time must be equal to 15 min.
The total upward and downward reserve requirements can be either defined by the user or calculated with the default static formulation proposed in the model. The total upward reserve is then split into secondary and tertiary reserves through a coefficient which represents the fraction of upward reserves that can be satisfied both by spinning and non-spinning quick-start units (tertiary upward reserves).
This work introduces a new method for the assessment of the reserve needs in energy system models. This estimation of the hourly reserve need is given in Equation (4) and is based on the dynamic formulation adopted for the evaluation of reserve requirements by the Italian TSO as reported in [
40]. Dynamic formulations have been recently adopted by different TSOs since they are more precise compared to static calculations and allow the consideration of the uncertainty deriving from the introduction of high shares of variable RESs.
is the forecasted load for the
n zone at time
i. The terms
,
and
are the standard deviations of the forecast error for the hourly load, available wind and photovoltaic generation, respectively. ε is the inverse normal distribution with a probability of 99.7% (ε = 2.74). Based on the assumptions proposed by S. Zalzar et al. [
41], the demand, wind and photovoltaic generation forecast errors are represented by normal distributions whose characteristics are reported in
Table 1.
is the total electricity demand, and and
are respectively the total wind and photovoltaic power available at time step i.
For the aim of this research, the total downward reserve requirements are considered equal to the total upward reserves.
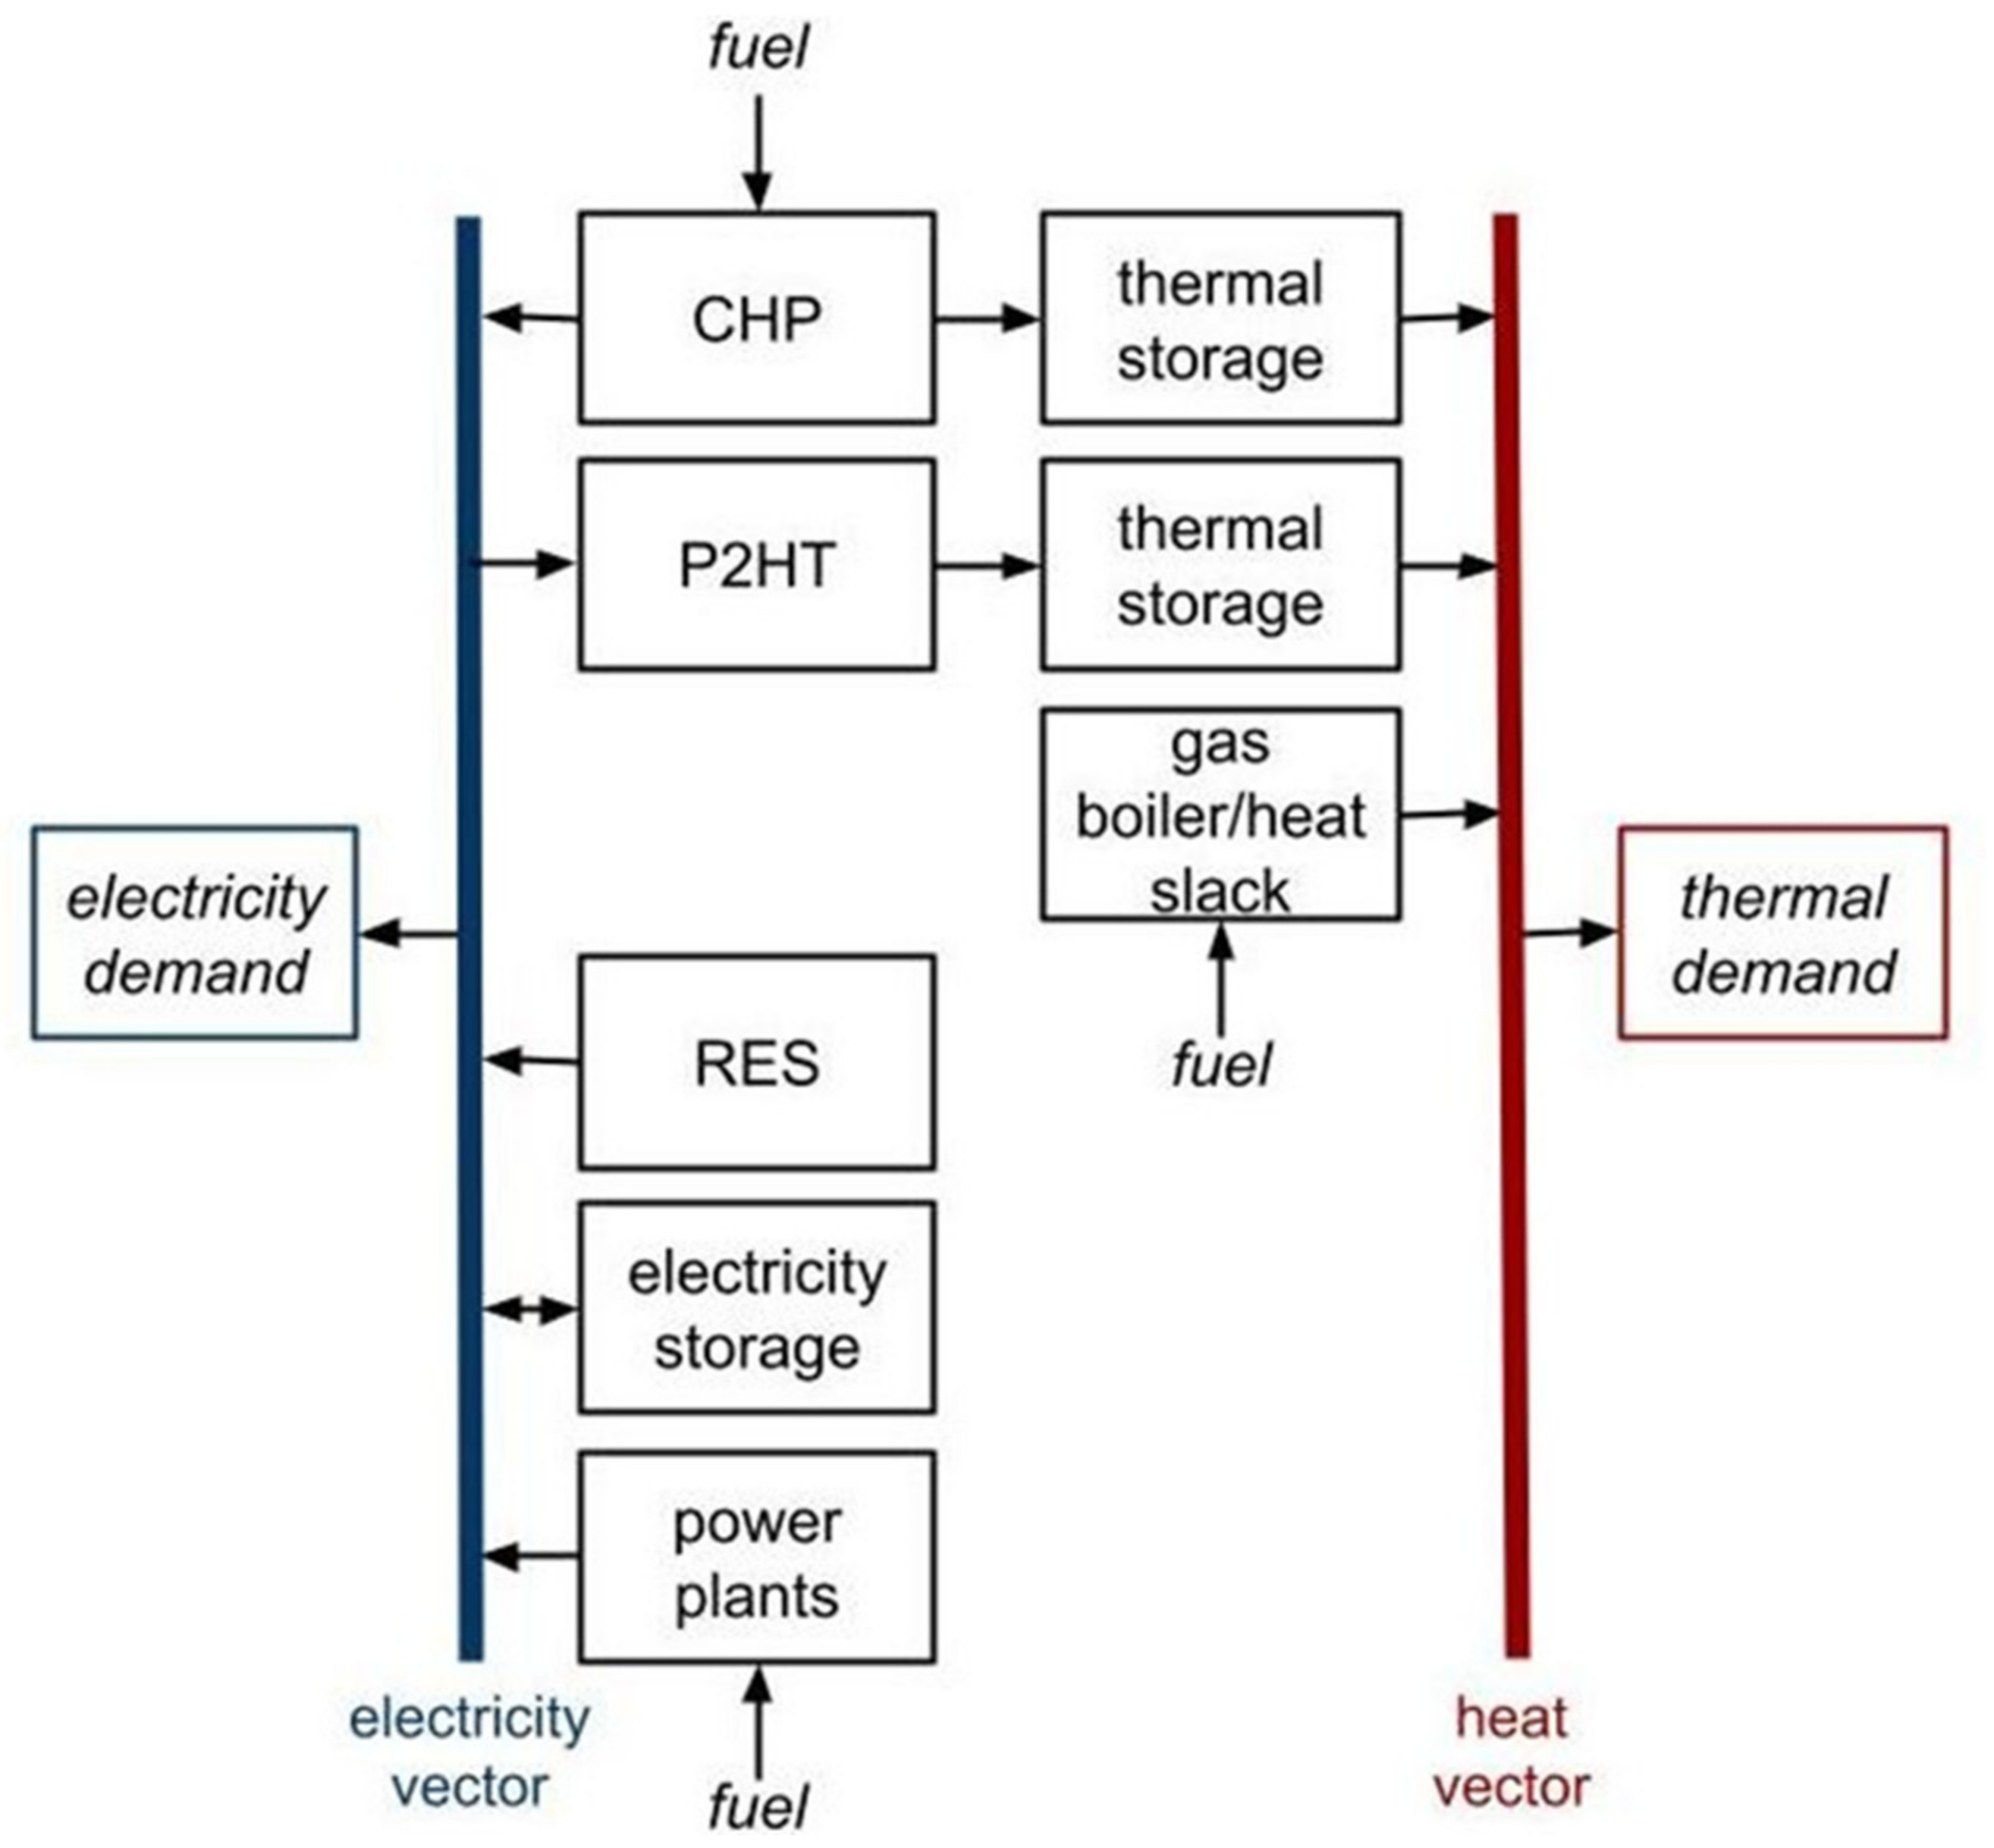
2.1.2. Power-to-Heat
The power and heating units that are in charge of the heat supply to DH systems are modeled as described in
Figure 1. The heat demand can be satisfied either by the existing P2HT and CHP units or by an alternative heat supply option (heat slack) which is considered available at any time.
The flexible operations of CHP units are modeled based on the work of K. C. Kavvadias et al. [
25], while the performances of P2HT units are established by the user through the definition of the coefficient of performance (COP). TES units associated with each power-to-heat technology are defined by thermal capacity, thermal losses and charge/discharge rate. The representation of the distribution network of DH systems is not considered.
The thermal storage is provided only by the TES unit, while the inherent storage potentials of the DH system distribution network and of the buildings are neglected, since a detailed representation of these potentials is not in the scope of this work.
The possibility for power-to-heat units to participate in the ancillary services is included in the model. For the case of heat pumps (P2HT), the participation in the provision of reserves is limited by a constraint that guarantees the thermal comfort of the final users. In the case of provision of upward reserves, the level of the storage must be high enough to ensure the heat supply for a time equal to 15 min (secondary upward reserves) or 1 h (tertiary upward reserves) in case P2HT units are shut down in the eventuality of reserve activation. For the case of downward reserves, the storage level must be sufficiently distant from the maximum level in order to allow the accumulation of heat for at least 1 h in the event in which the P2HT unit heat is forced to increase its power consumption and heat generation.
2.2. Data and Scenarios
The aim of this work is to assess the potential of DH systems coupled with TES systems in terms of flexibility and provision of operating reserves for the case study of the Italian energy system. To that end, a set of scenarios including different RES installed capacities, DH system heat supply technologies (CHP and P2HT), DH penetrations and participation of thermal units in the reserve provision are simulated and compared.
Table 2 and
Table 3 indicate the set of scenarios analyzed and their main characteristics.
The base case is defined as the scenario with no DH systems and RES installed capacity equal to RES1, which refers to the current penetration of RESs in the Italian energy system. The data regarding the base case configuration capacity mix and characteristics of the power plants as well as the availability of RESs and hourly electricity demand data are available in [
42]; the residential thermal demand is calculated through the methodology available in the “When2Heat” project documentation [
43]. RES3 refers to the maximum RES penetration scenario with an installed capacity corresponding to the one reported in the “Large Scale RES” scenario from the “e-Highway 2050” project [
44,
45]. RES2 installed RES capacity is in the middle point between RES1 and RES3.
Table 4 reports the available capacity of wind and photovoltaic (PV) energy for the three cases related to the “what-if” scenarios. The choice to test the sensitivity of the system to the penetration of photovoltaic and wind power in the “what-if” scenario analysis is motivated by the non-dispatchability of these renewable energy sources compared to others (e.g., biomass-based power plants and hydroelectric provided with storage). This characteristic makes PV and wind power significantly affect the need for flexibility and reserve requirements based on the formulation described by Equation (4).
In the case of the “100% RES—2050” scenarios, the installed capacity mix is equal to the one described in the “100% RES—2050” scenario by the “e-Highway 2050” project [
44,
45]. The installed generation capacities for all generation technologies are illustrated in
Table 5. In this scenario, only a small share of gas-based units is present, while all the other technologies are based on renewable energy sources. The main sources of dispatchable power are hydroelectric plants provided with storage and biomass-based steam turbines.
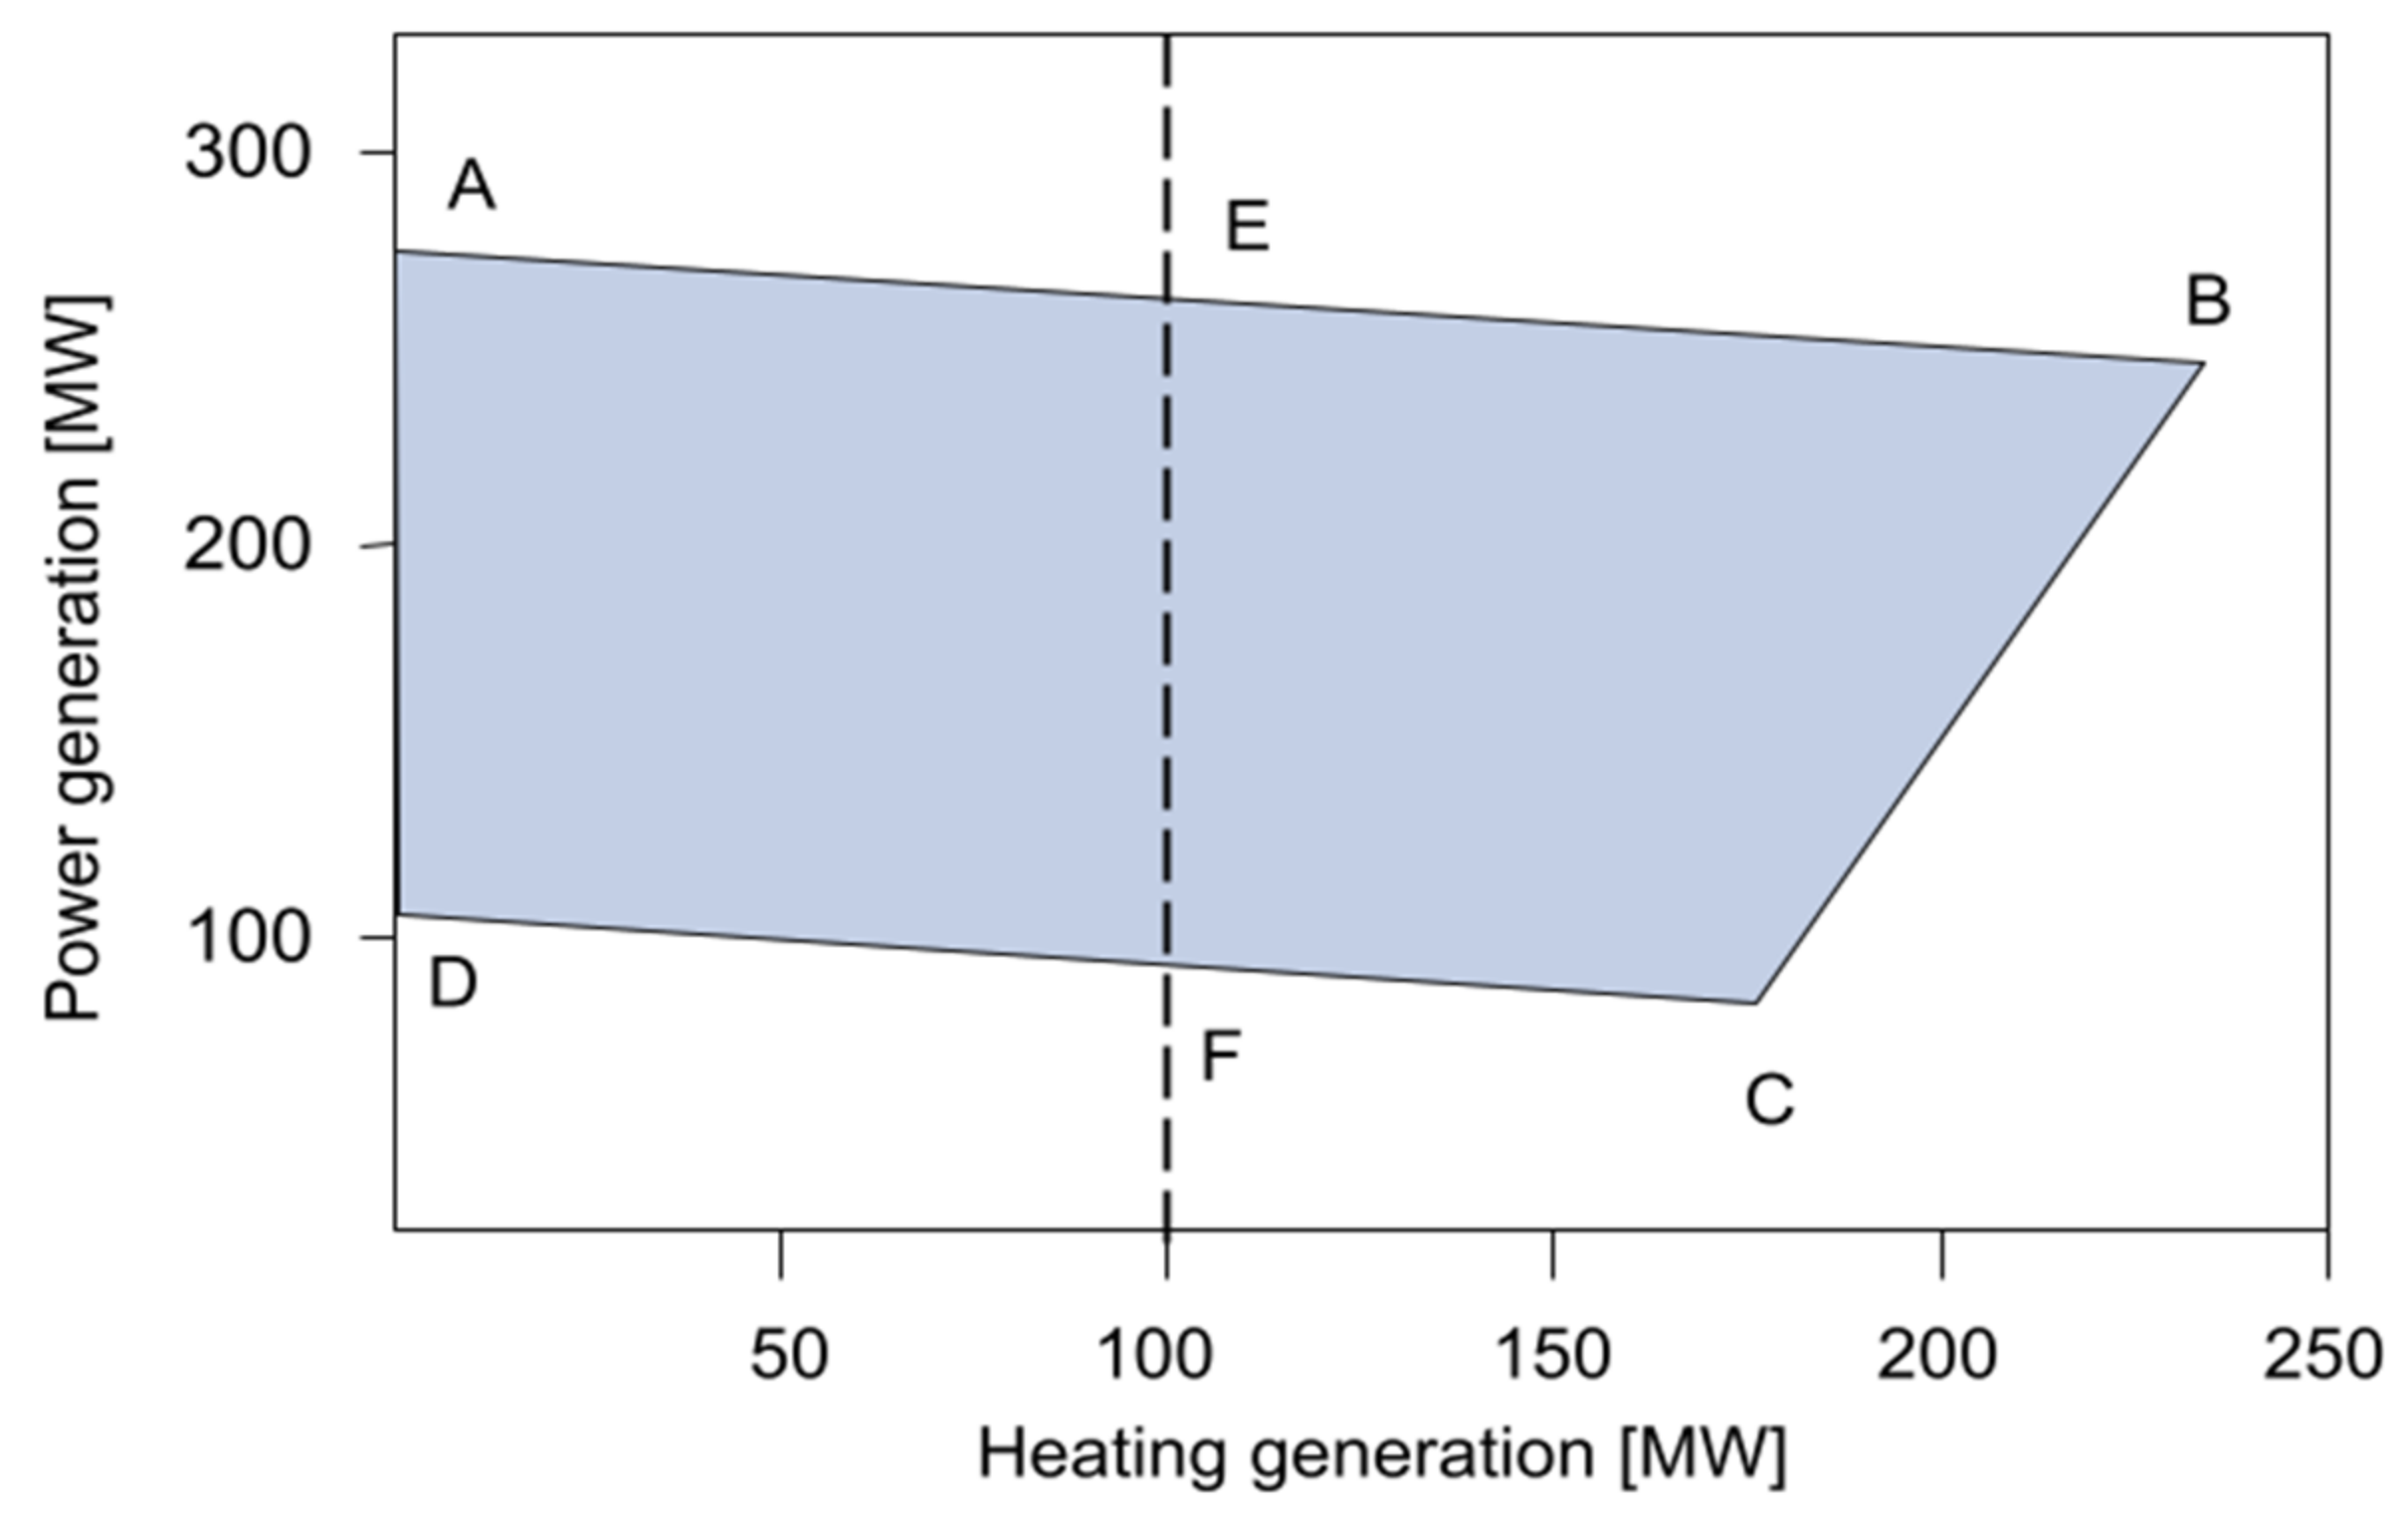
The DH system heat supply technologies are alternatively CHP, P2HT or both power-to-heat technologies; in the case of both, the thermal capacity is divided equally between CHP and P2HT units. The CHP technology selected for the simulations is the steam power plant with an extraction/condensing turbine (which allows higher operational flexibility compared to the back-pressure turbine) whose feasible operating area is described in
Figure 2 and is based on the work of K. C. Kavvadias et al. [
25]. The feasible operating conditions cover all the heating–power generation couples belonging to the area ABCD. For a fixed heat generation capacity equal to 100 MW (for example), the feasible electricity outputs are the operating points lying on the vertical segment E–F. The optimal power and heating output for CHP units is defined from the centralized system optimization at each time step.
P2HT units are modeled as large-scale heat pumps with constant coefficient of performance (COP = 3), based on the available data for existing large-scale heat [
46]. Both CHP and P2HT are provided with a TES system linked to each power-to-heat unit with a storage capacity equal to 12 h (calculated based on the thermal capacity of the unit).
The total DH thermal capacity installed is equal to 0, 33 and 66 GWh in the three scenarios. These numbers are calculated based on the hypothesis to supply respectively 0%, 25% and 50% of the residential thermal demand through DH systems. The thermal capacity associated with a certain thermal demand is calculated as 2/3 of the heat peak demand. The chosen values are in line with the objectives set by the “Italian Heat Roadmap” [
47], which sets the values of the minimum recommended shares of DH in the space heating supply to be reached by 2050 for different EU countries. For the case of Italy, the recommended value is 70% (the share of heat supplied by DH in 2015 was less than 5%). The report suggests that around 25–35% of this share should be supplied by CHP units, 20–30% by large-scale heat pumps, 25% by industrial excess heat and finally 5% by geothermal and solar thermal heating technologies. For the aim of this work, the technologies considered are restricted to the first two (CHP and P2HT) since they are directly coupled with the power system and can thus contribute to enhancing its flexibility (the investigation of the flexibility of industrial excess heat, geothermal and solar-based DH would deserve dedicated studies and different modeling approaches).
2.3. Performance Indicators
The results of the simulations, which were performed for one year with a time step equal to one hour, were compared on the basis of the following main performance indicators:
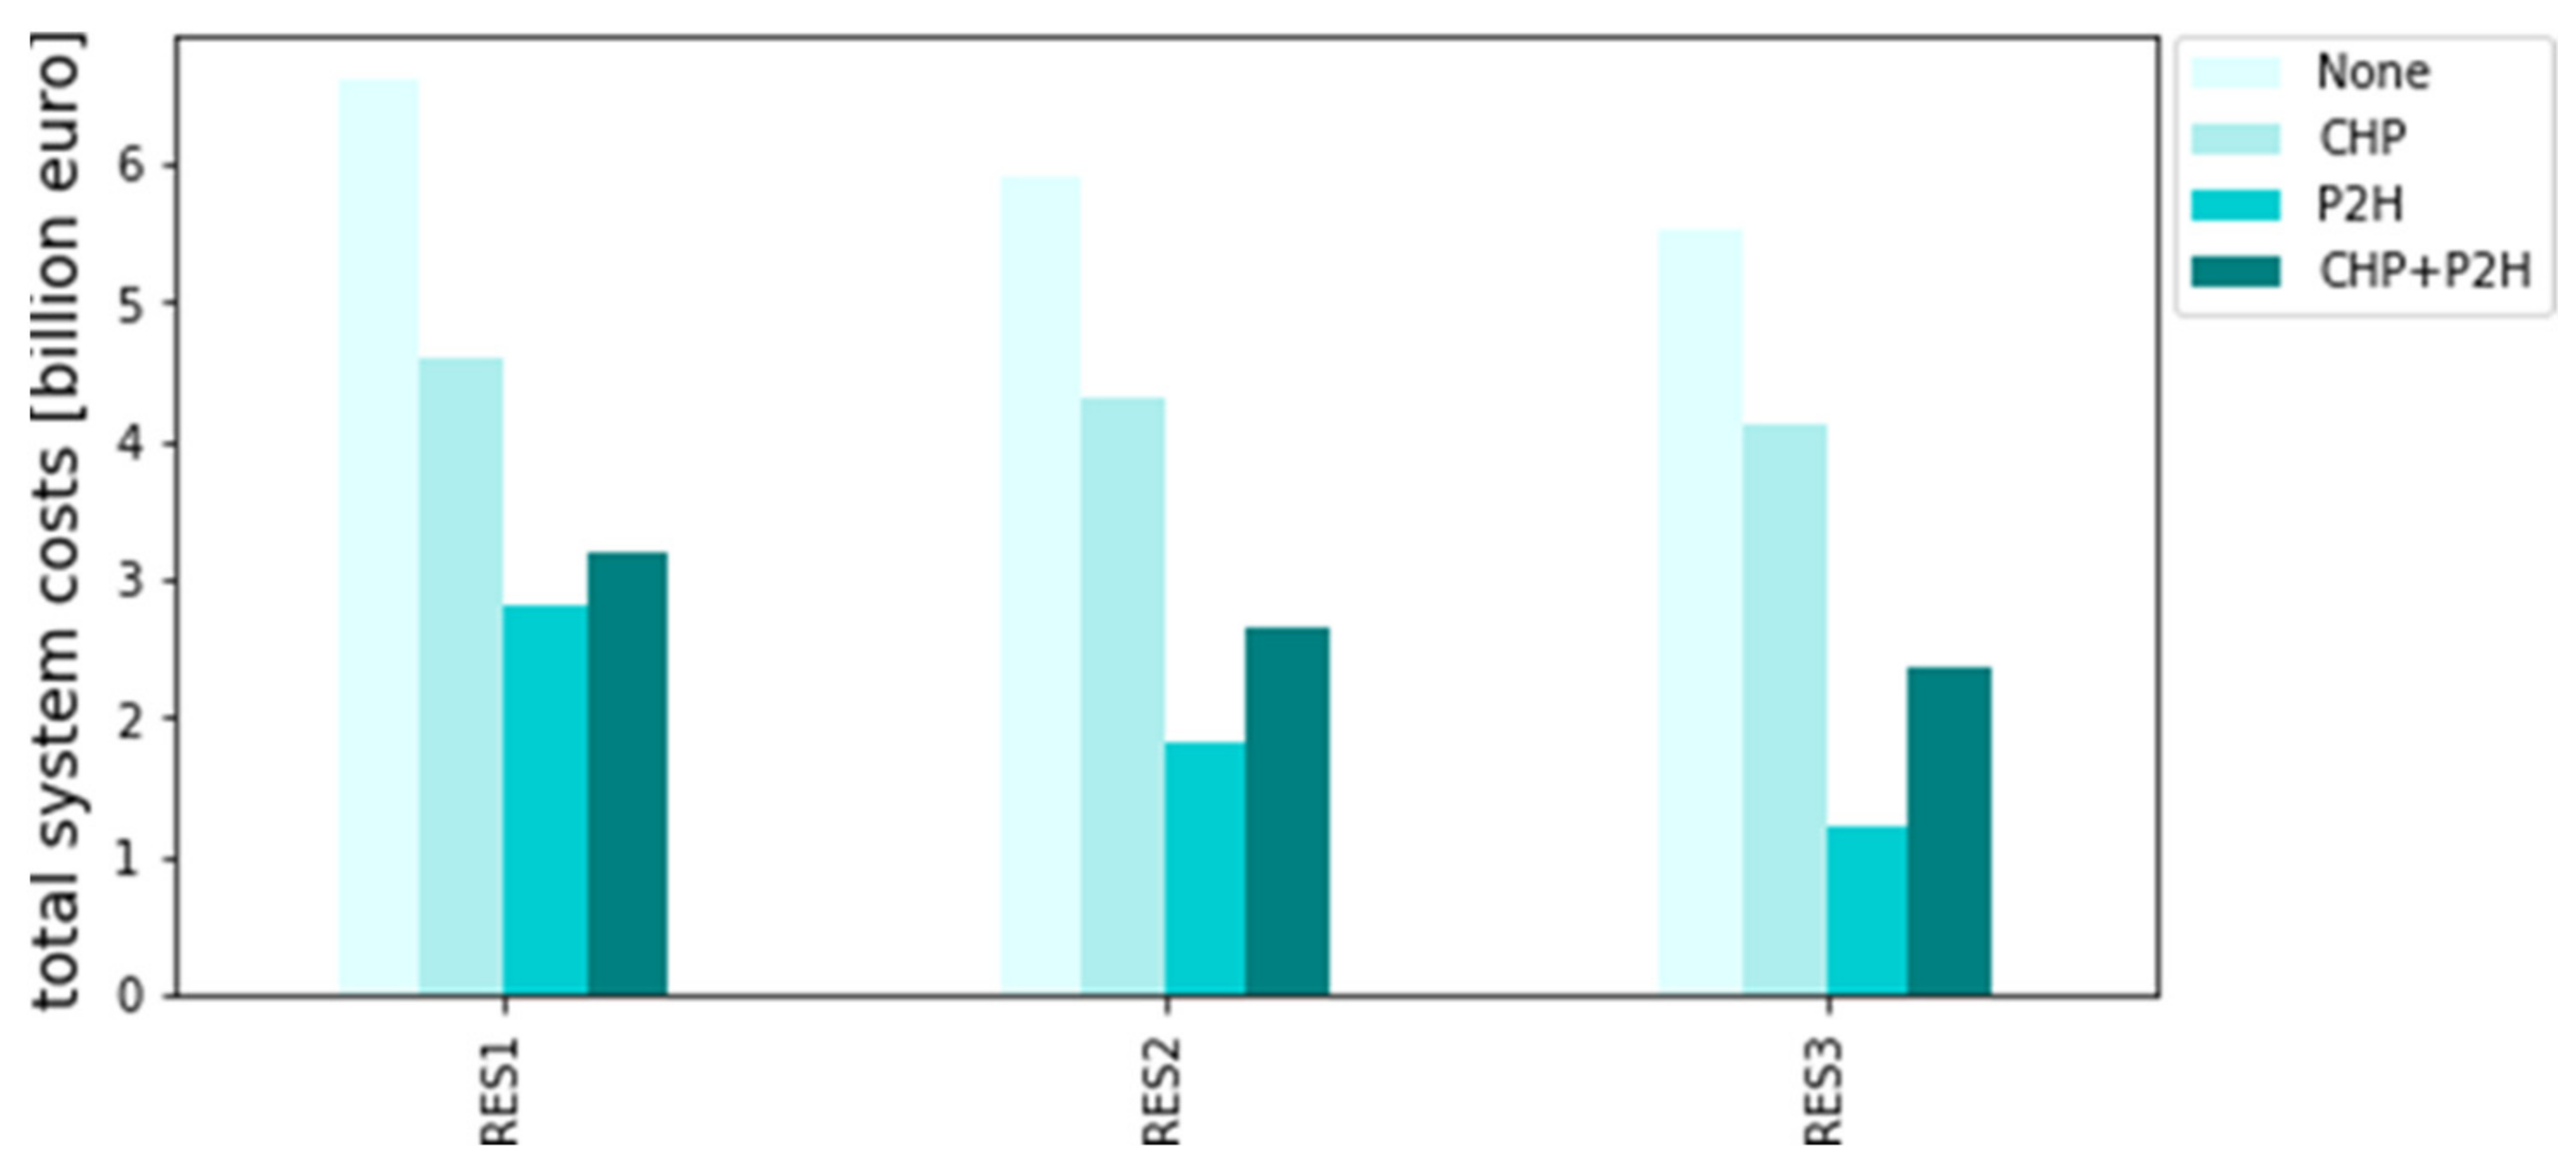
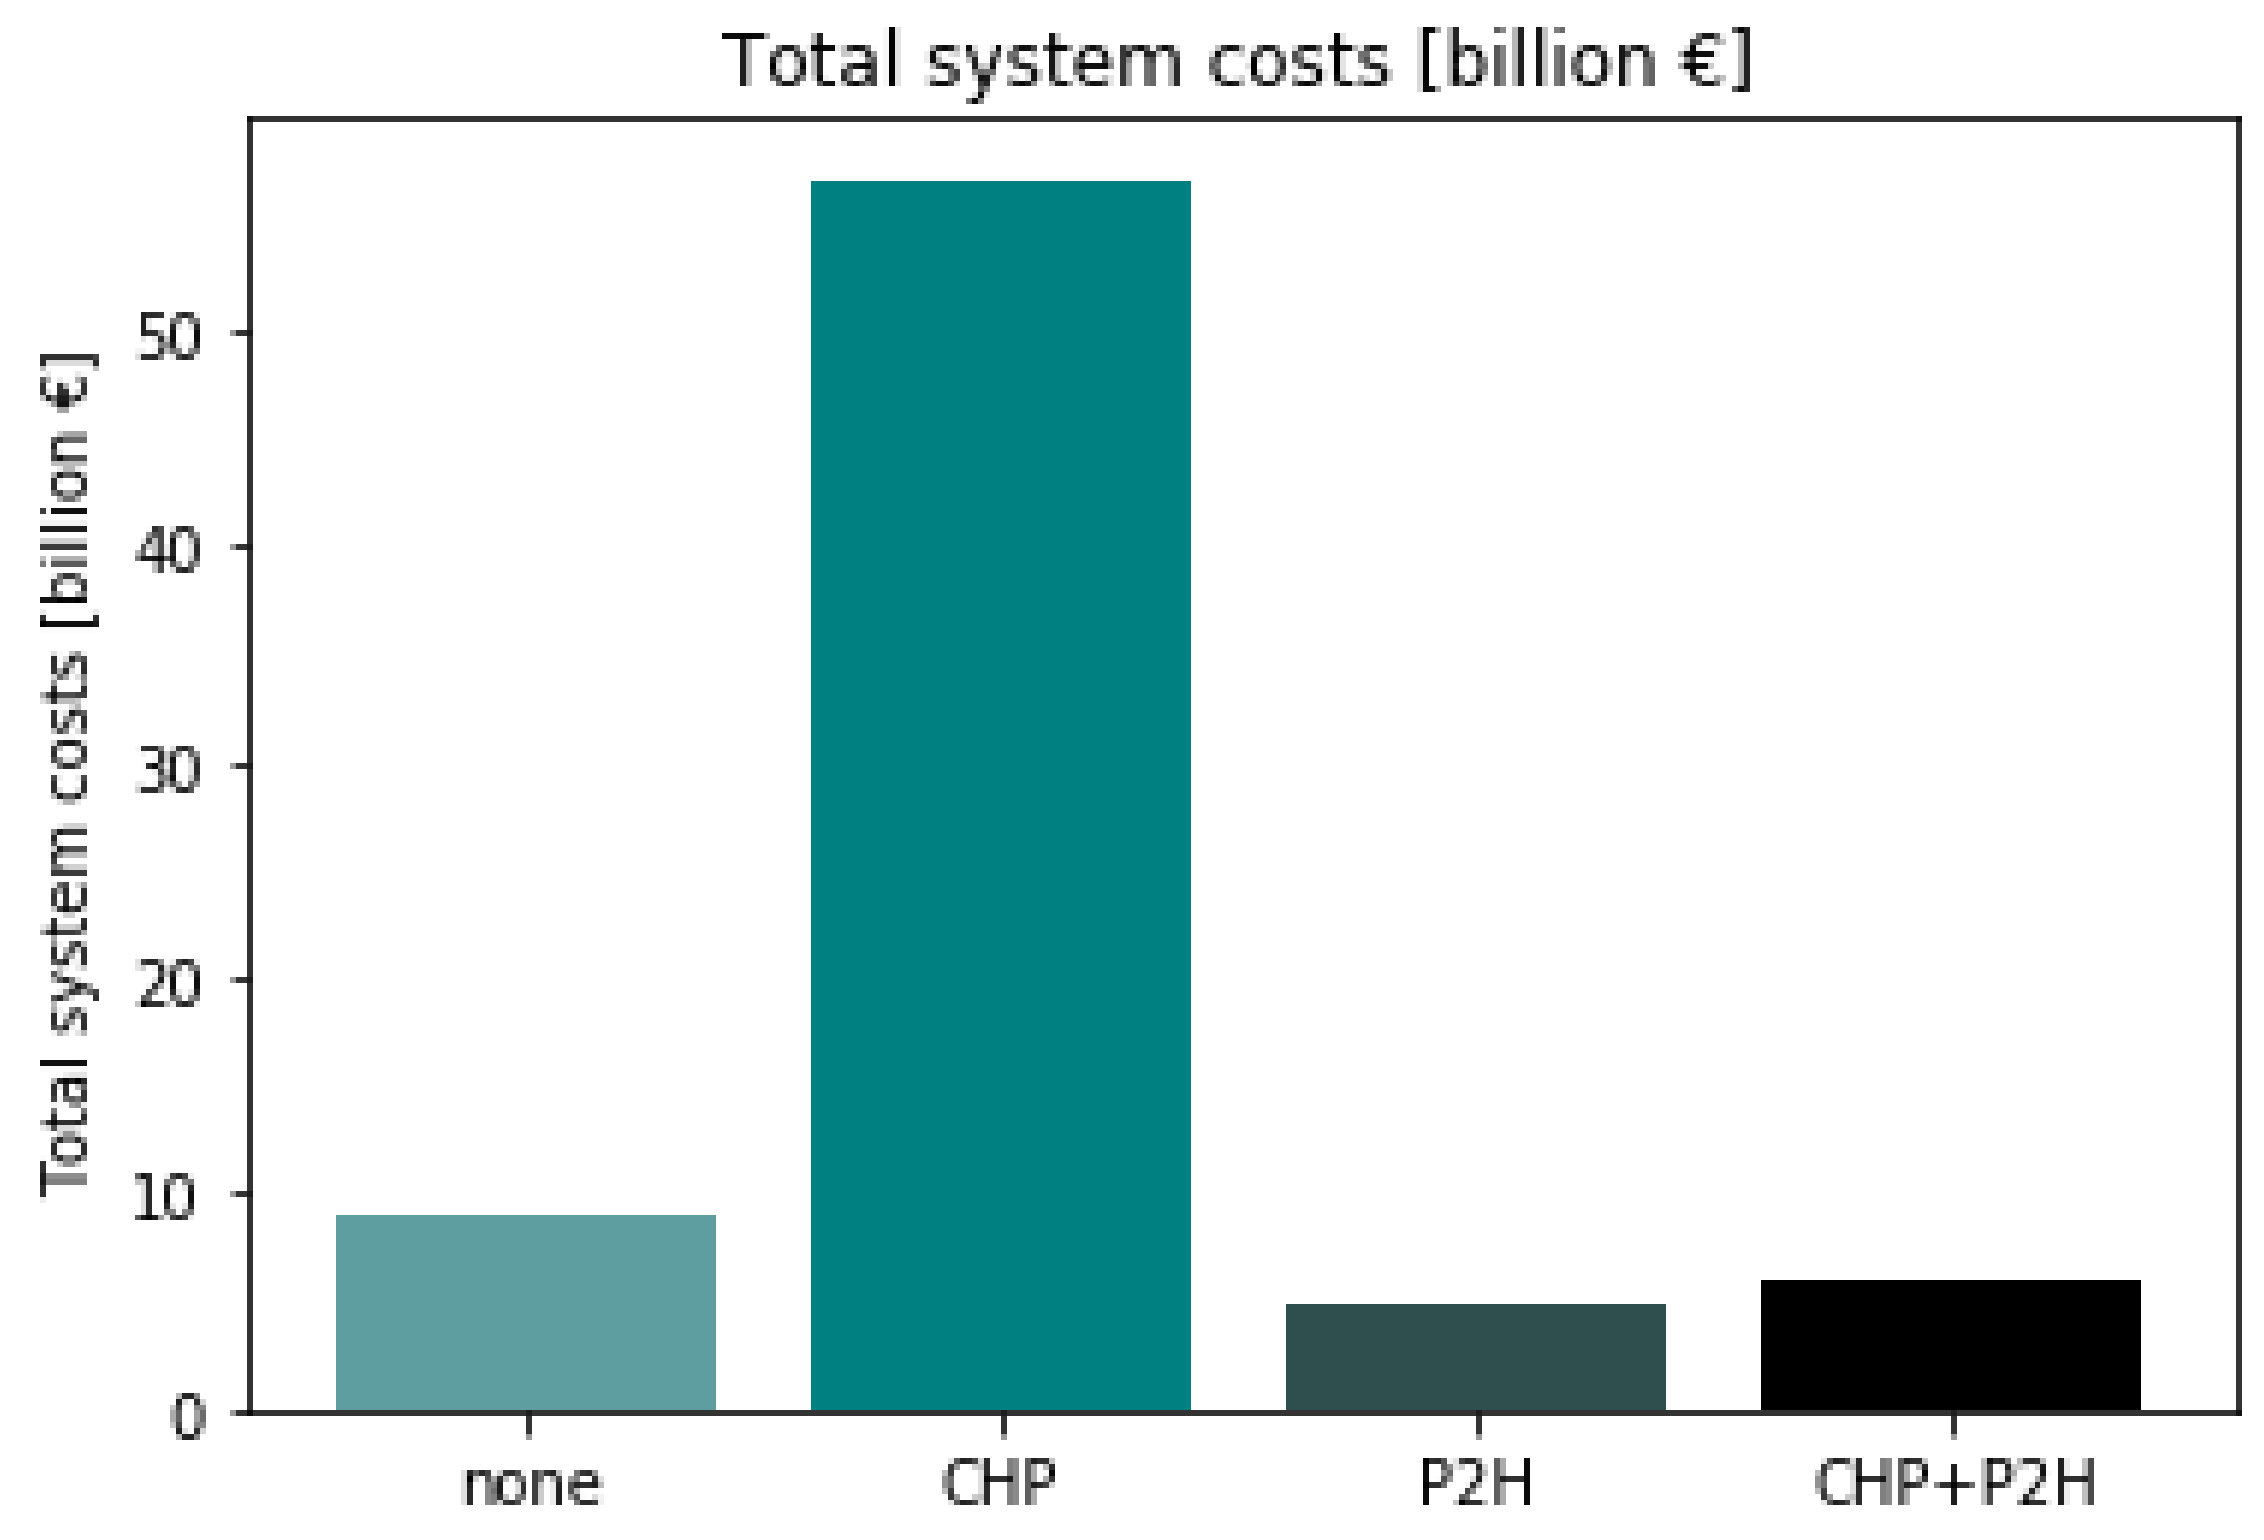
Total operating system costs, evaluated over one-year simulations as described in
Section 2.1 and expressed in EUR 1 billion;
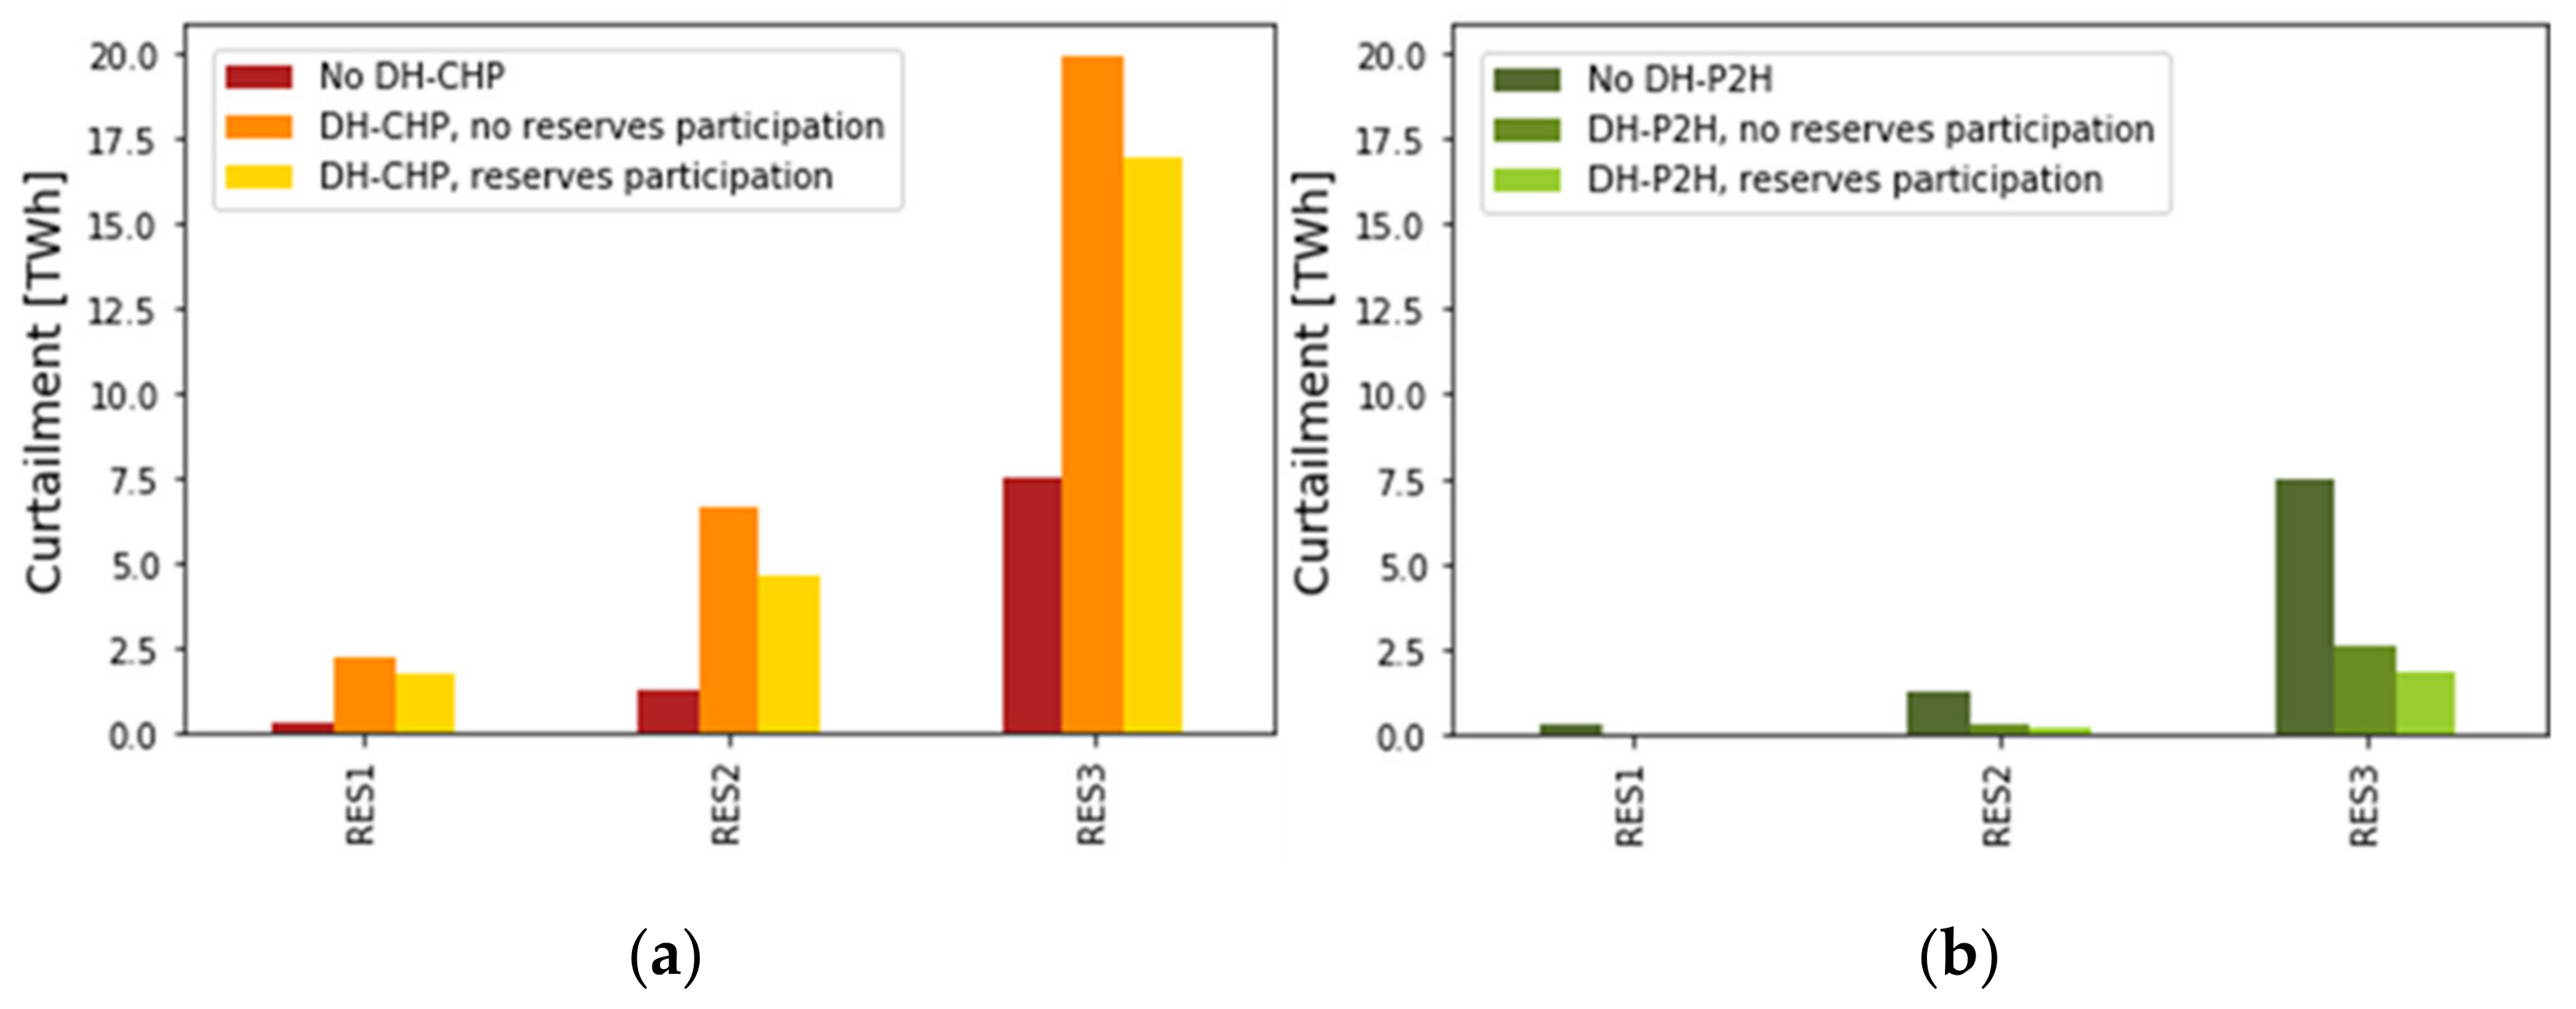
Renewable curtailment, calculated as the sum of the hourly curtailed renewable power for each time step of the year and expressed in TWh;
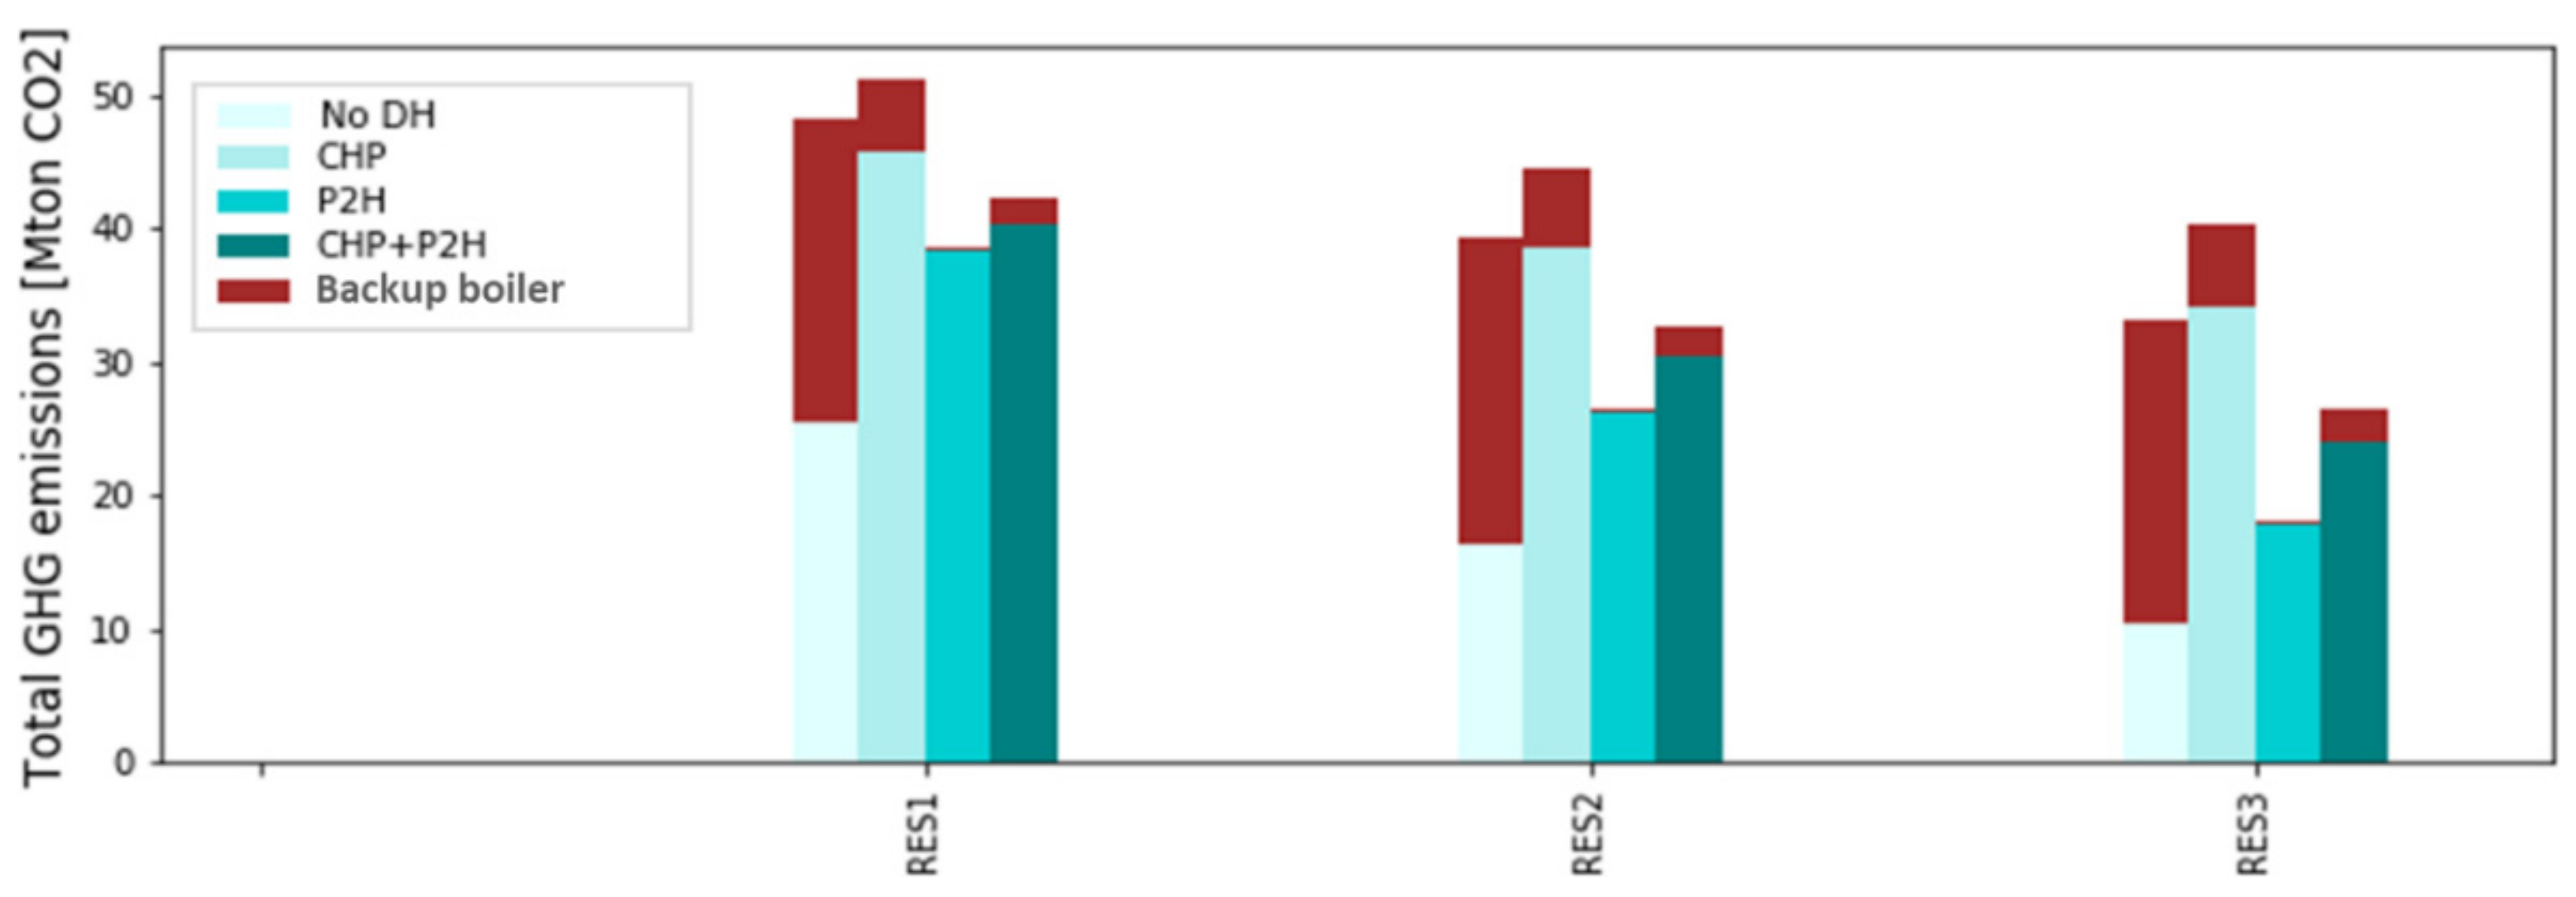
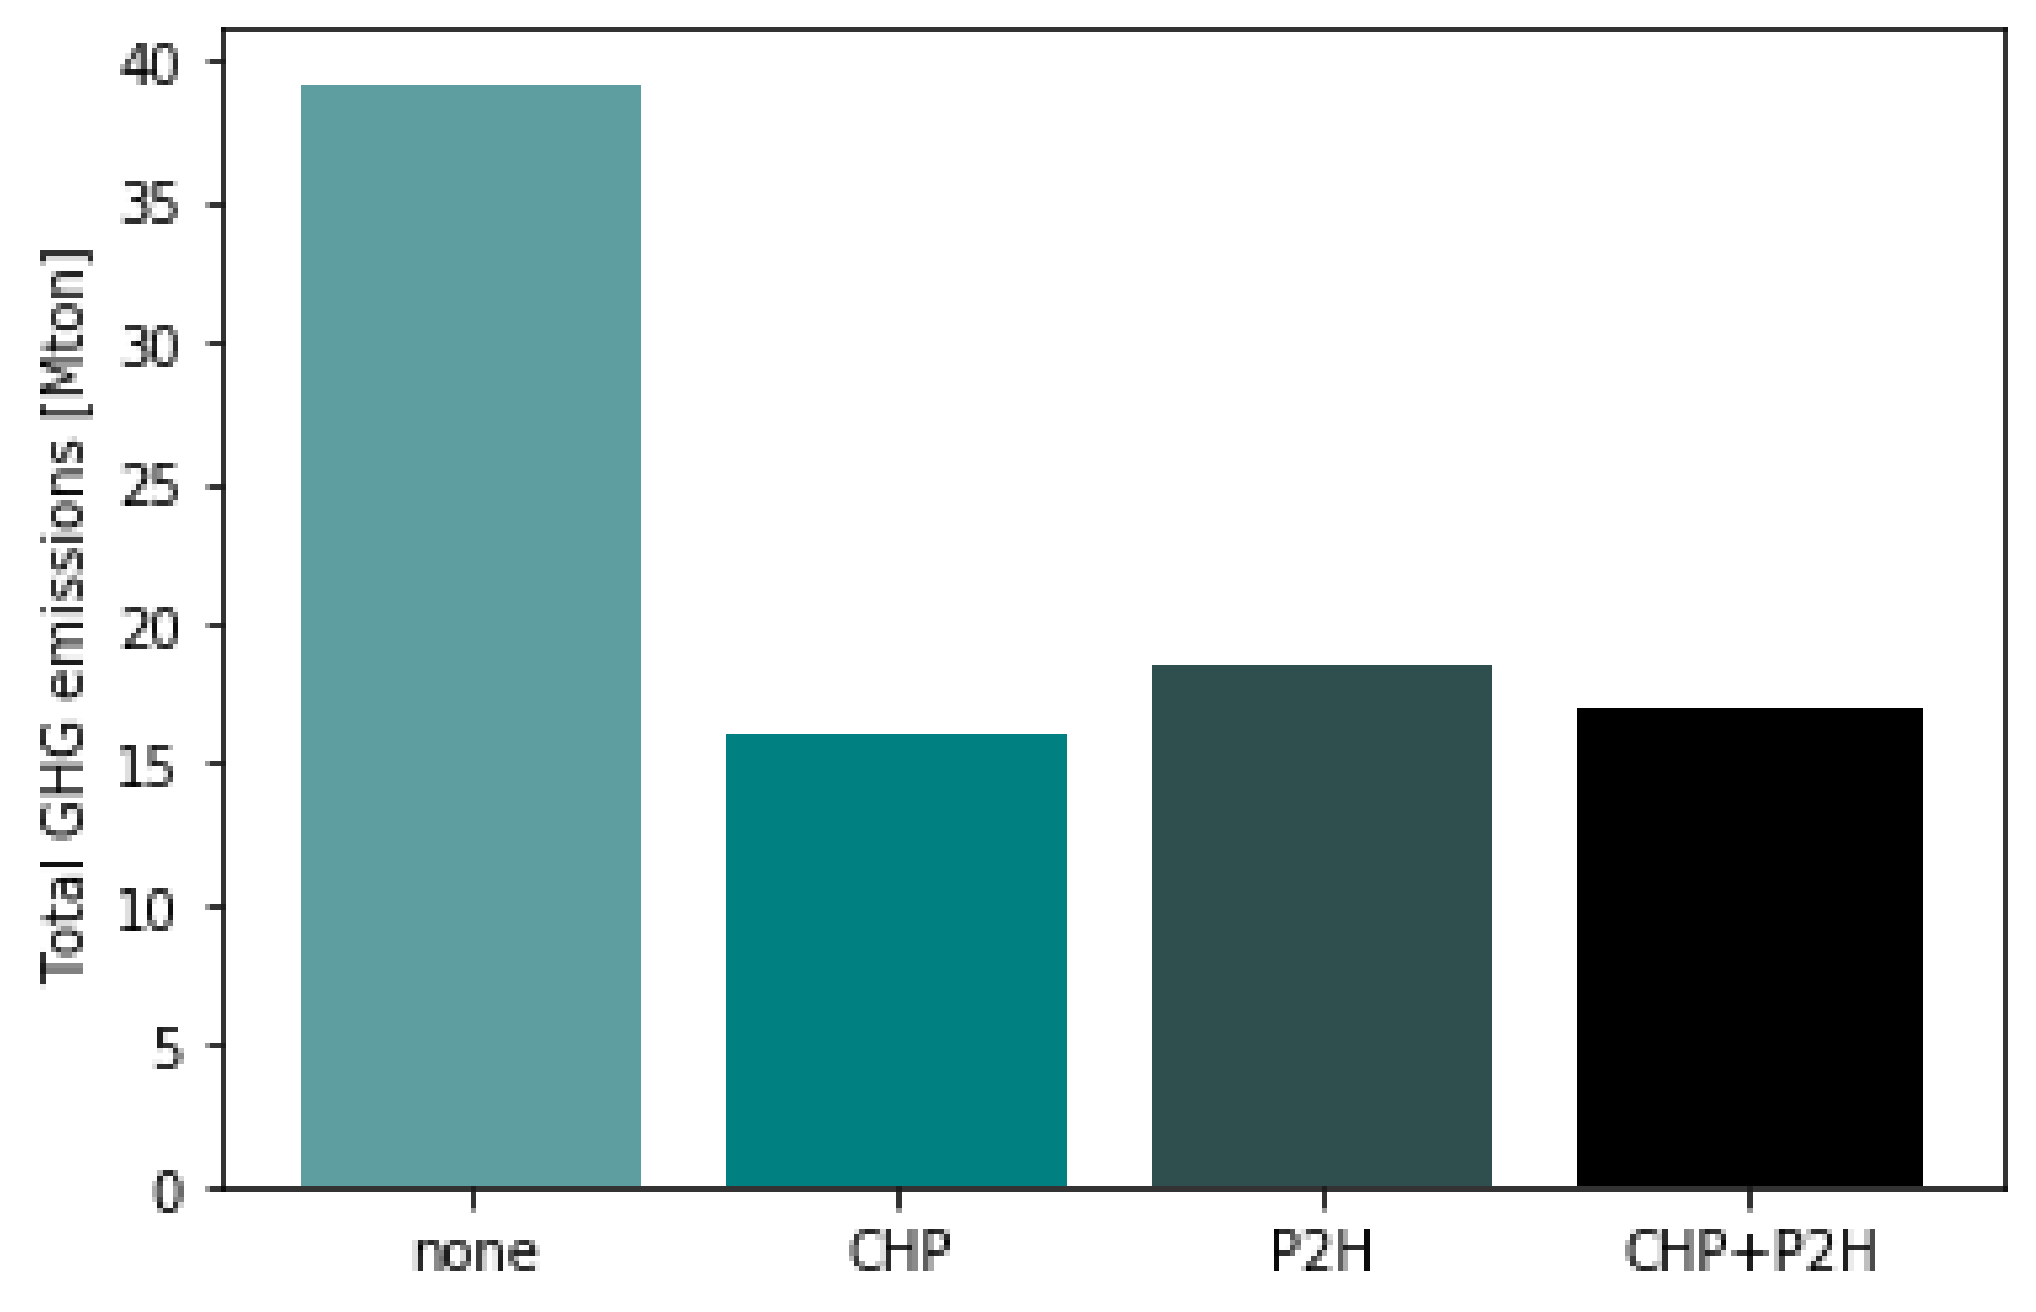
Total greenhouse gas emissions, expressed as the sum of the hourly emissions for each time step of the year in terms of Gton of CO2.
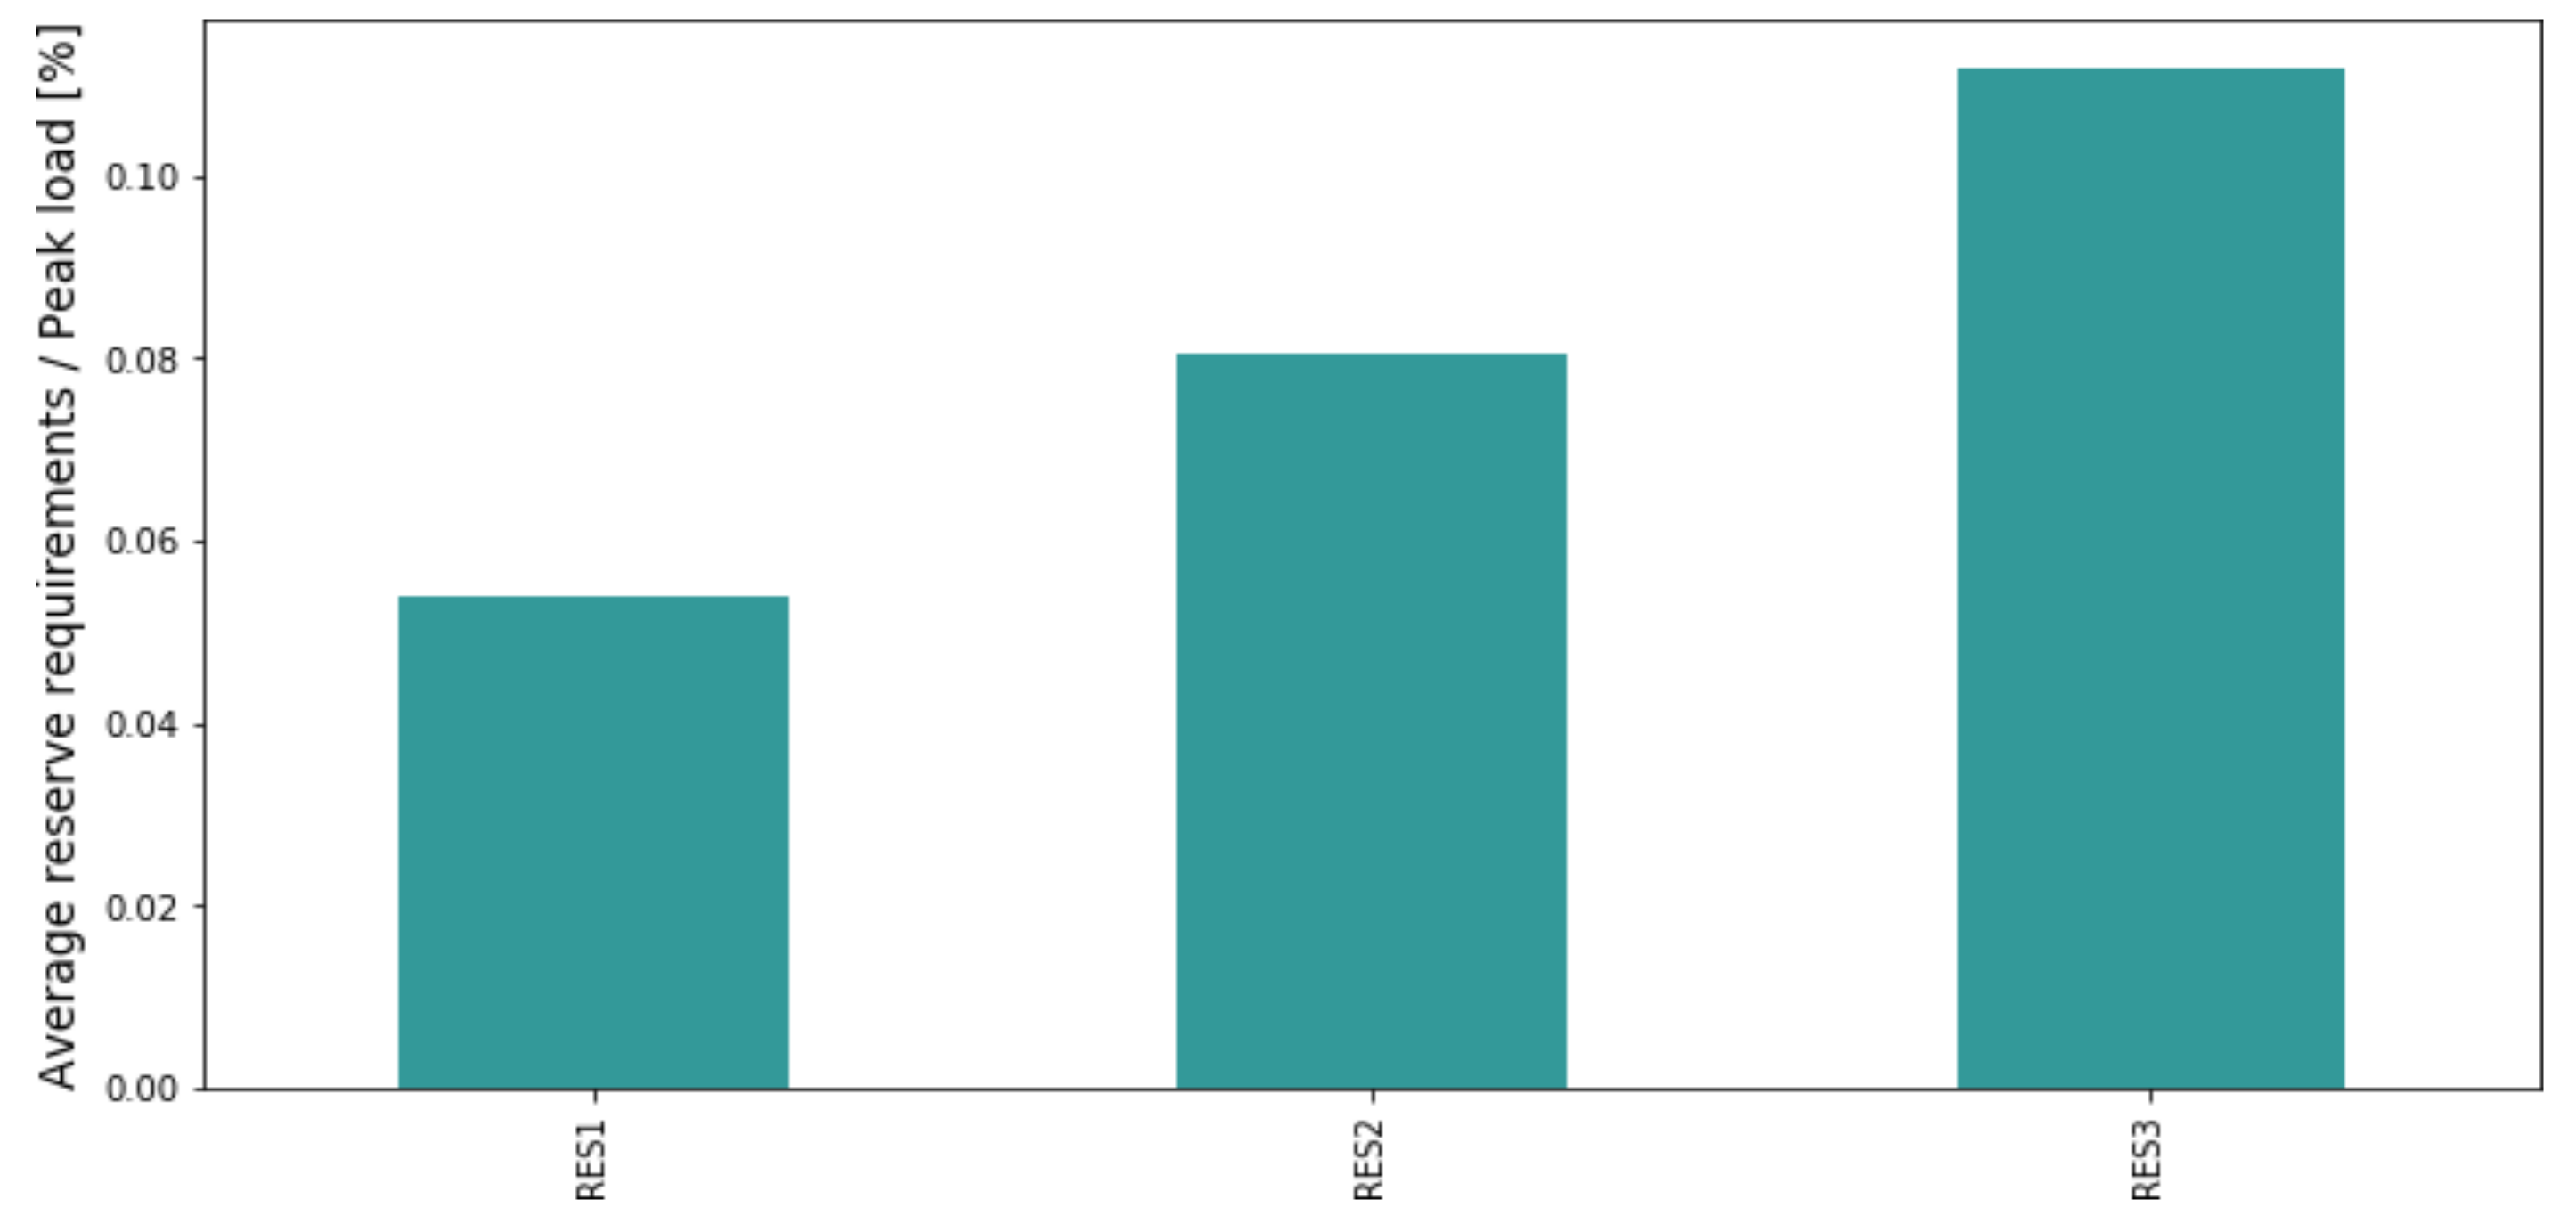
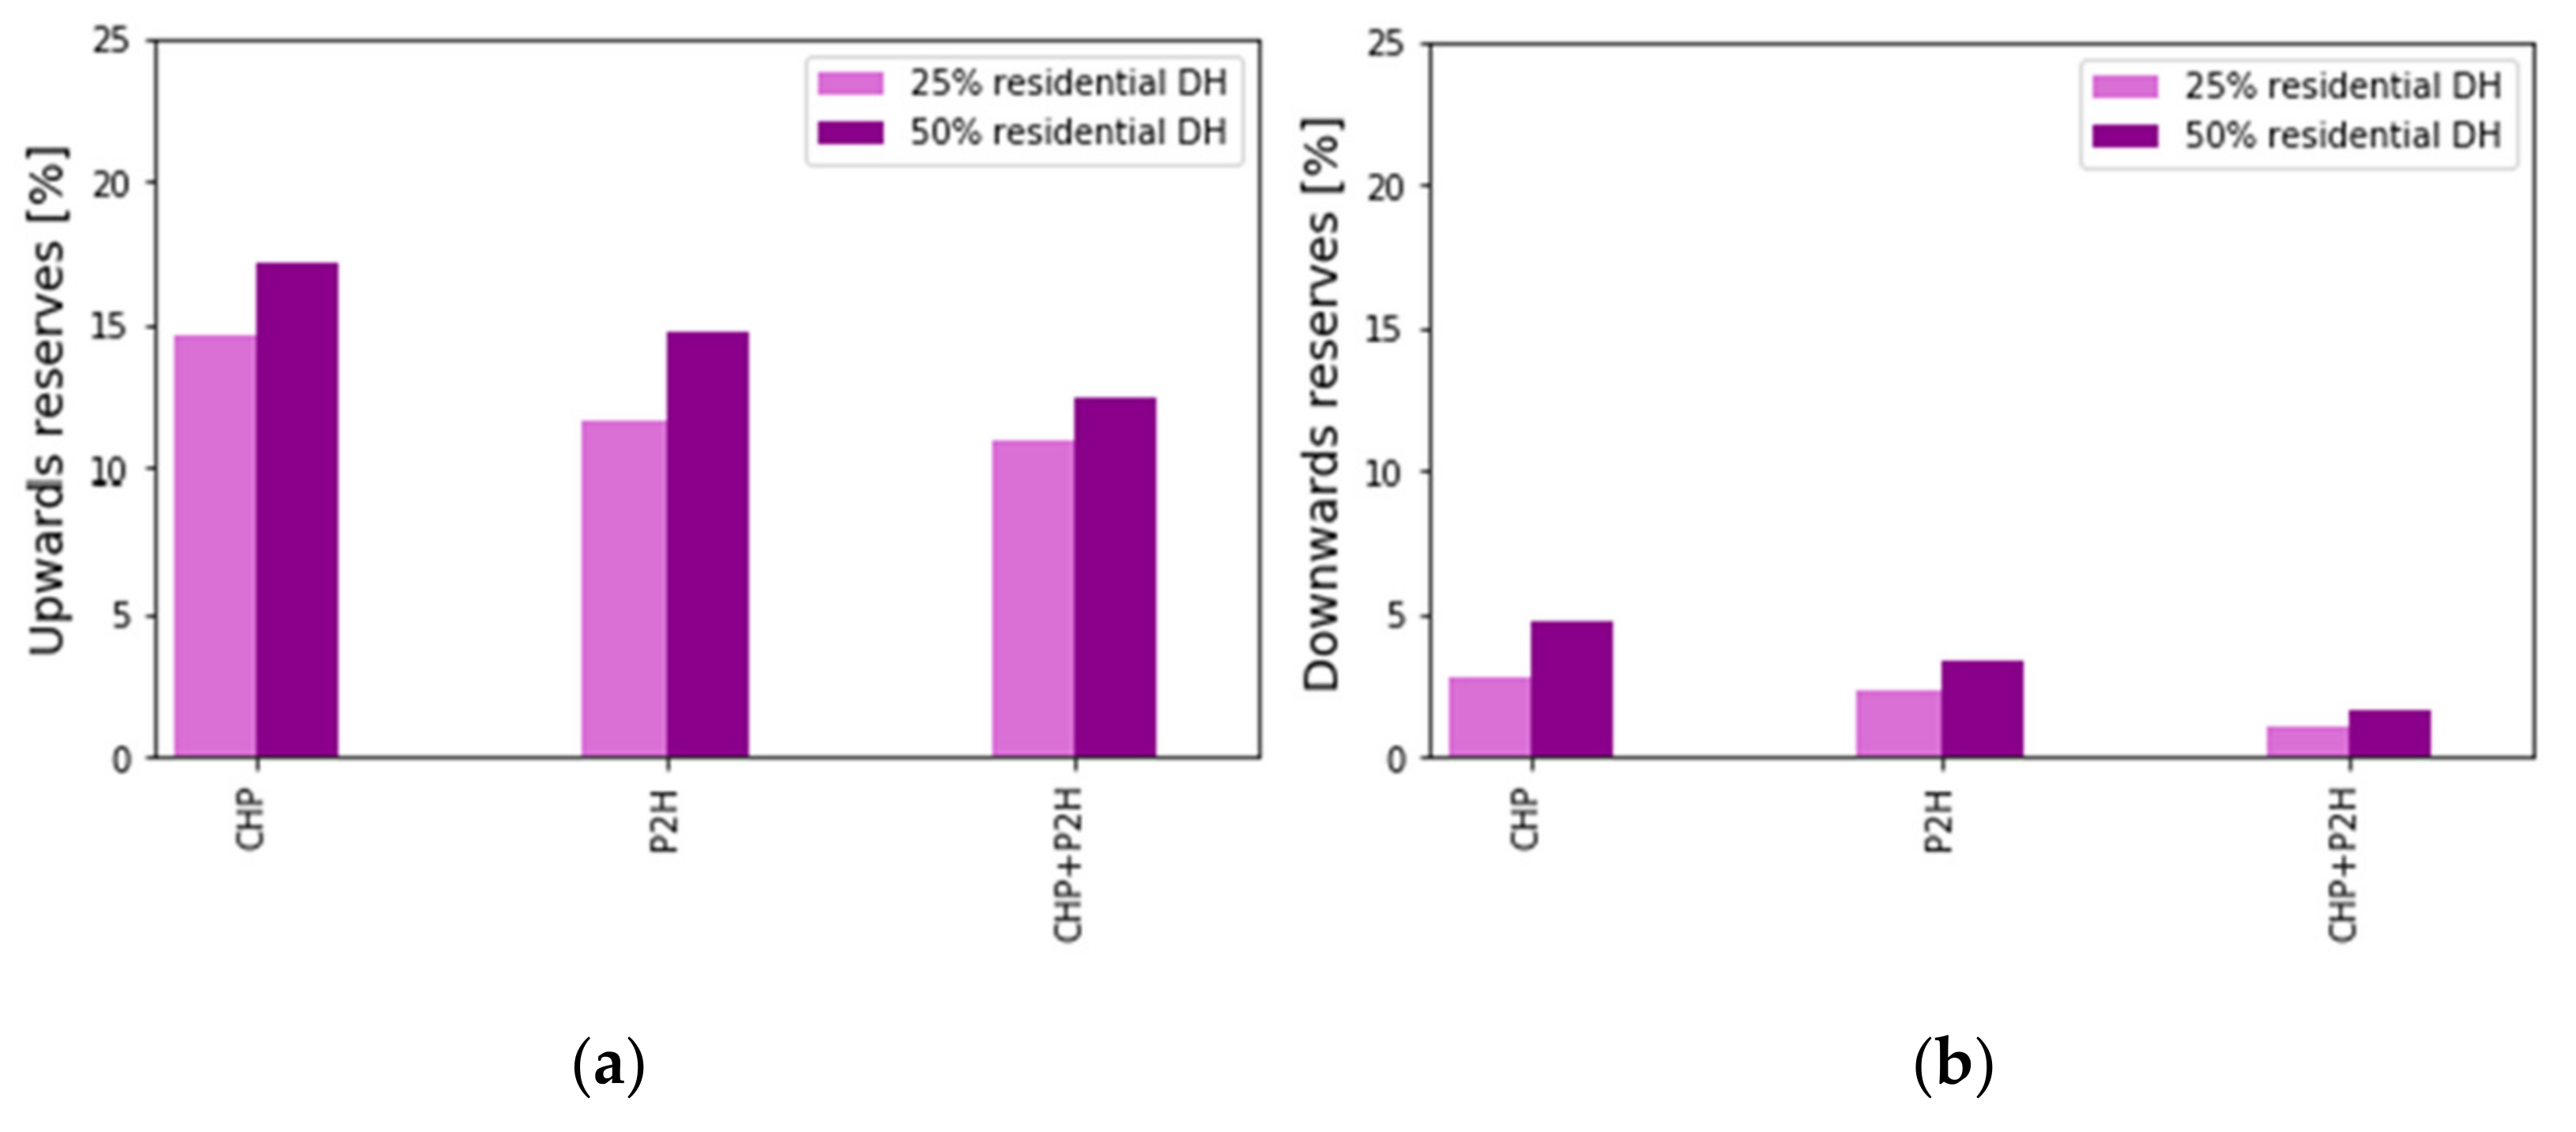
Participation of thermal units in the provision of reserves, expressed as the ratio between the yearly average contribution of the power-to-heat units in the provision of upward and downward reserve capacity with respect to the average reserve needs.
4. Conclusions
DH systems and power-to-heat technologies are a promising solution to electrify and decarbonize the heating sector while ensuring the resilience of the grid thanks to their flexibility potential. However, the existing literature was lacking a comparison between different DH supply technologies and the assessment of their large-scale potential in terms of reserve participation. Addressing these questions is of utmost importance since an increasing penetration of RESs is expected.
Therefore, the aim of this research was (1) to perform a first assessment of the potential contribution of district heating (DH) systems coupled with TES units in terms of flexibility and operating reserve provision to the energy system through the introduction of a novel method for the evaluation of reserve requirements in energy system models and (2) to compare the performance of two different DH supply technologies, namely large-scale heat pumps (P2HT) and combined heat and power (CHP) units. The Italian energy system was selected as a case study and simulated through a unit-commitment and optimal dispatch model tailored for the goals of this work through the implementation of probabilistic reserve sizing. The participation of power-to-heat units (CHP and P2HT) in the day-ahead ancillary market was modeled in various scenarios, including different generation mixes, three heat supply configurations for DH systems (CHP, P2HT, CHP + P2HT) and two different levels of DH system integrations (25% and 50% residential heat supplied). All scenarios were tested first without considering thermal units for the provision of ancillary services and then allowing them to participate in the reserves market.
Results suggest that the large deployment of DH systems coupled with TES units offers a significant contribution to the power system flexibility, in particular in terms of reserve resources.
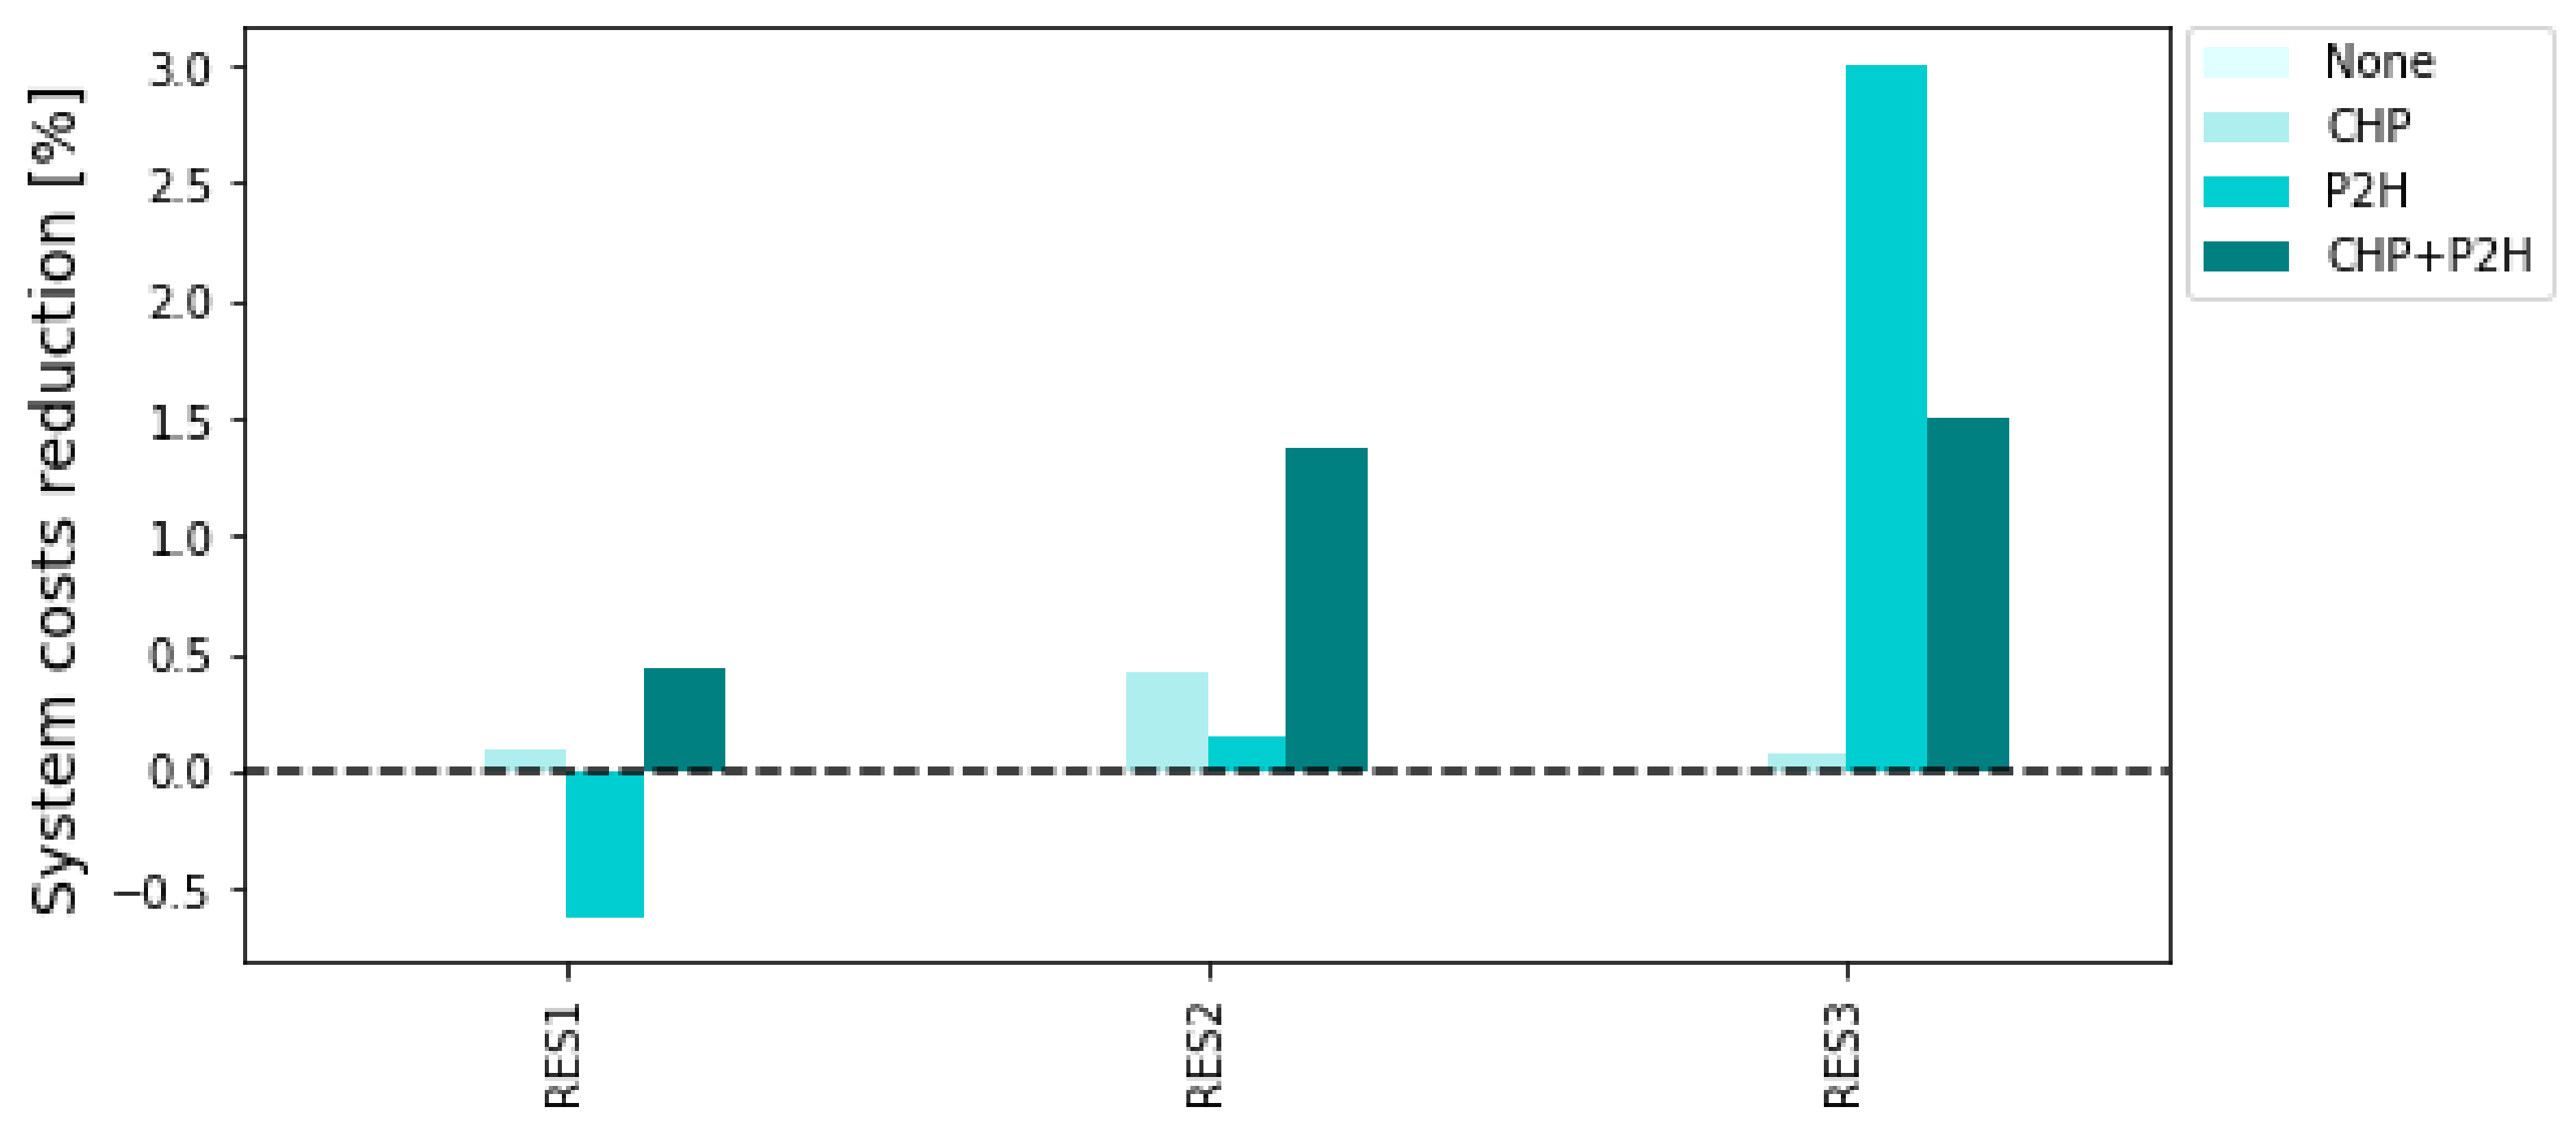
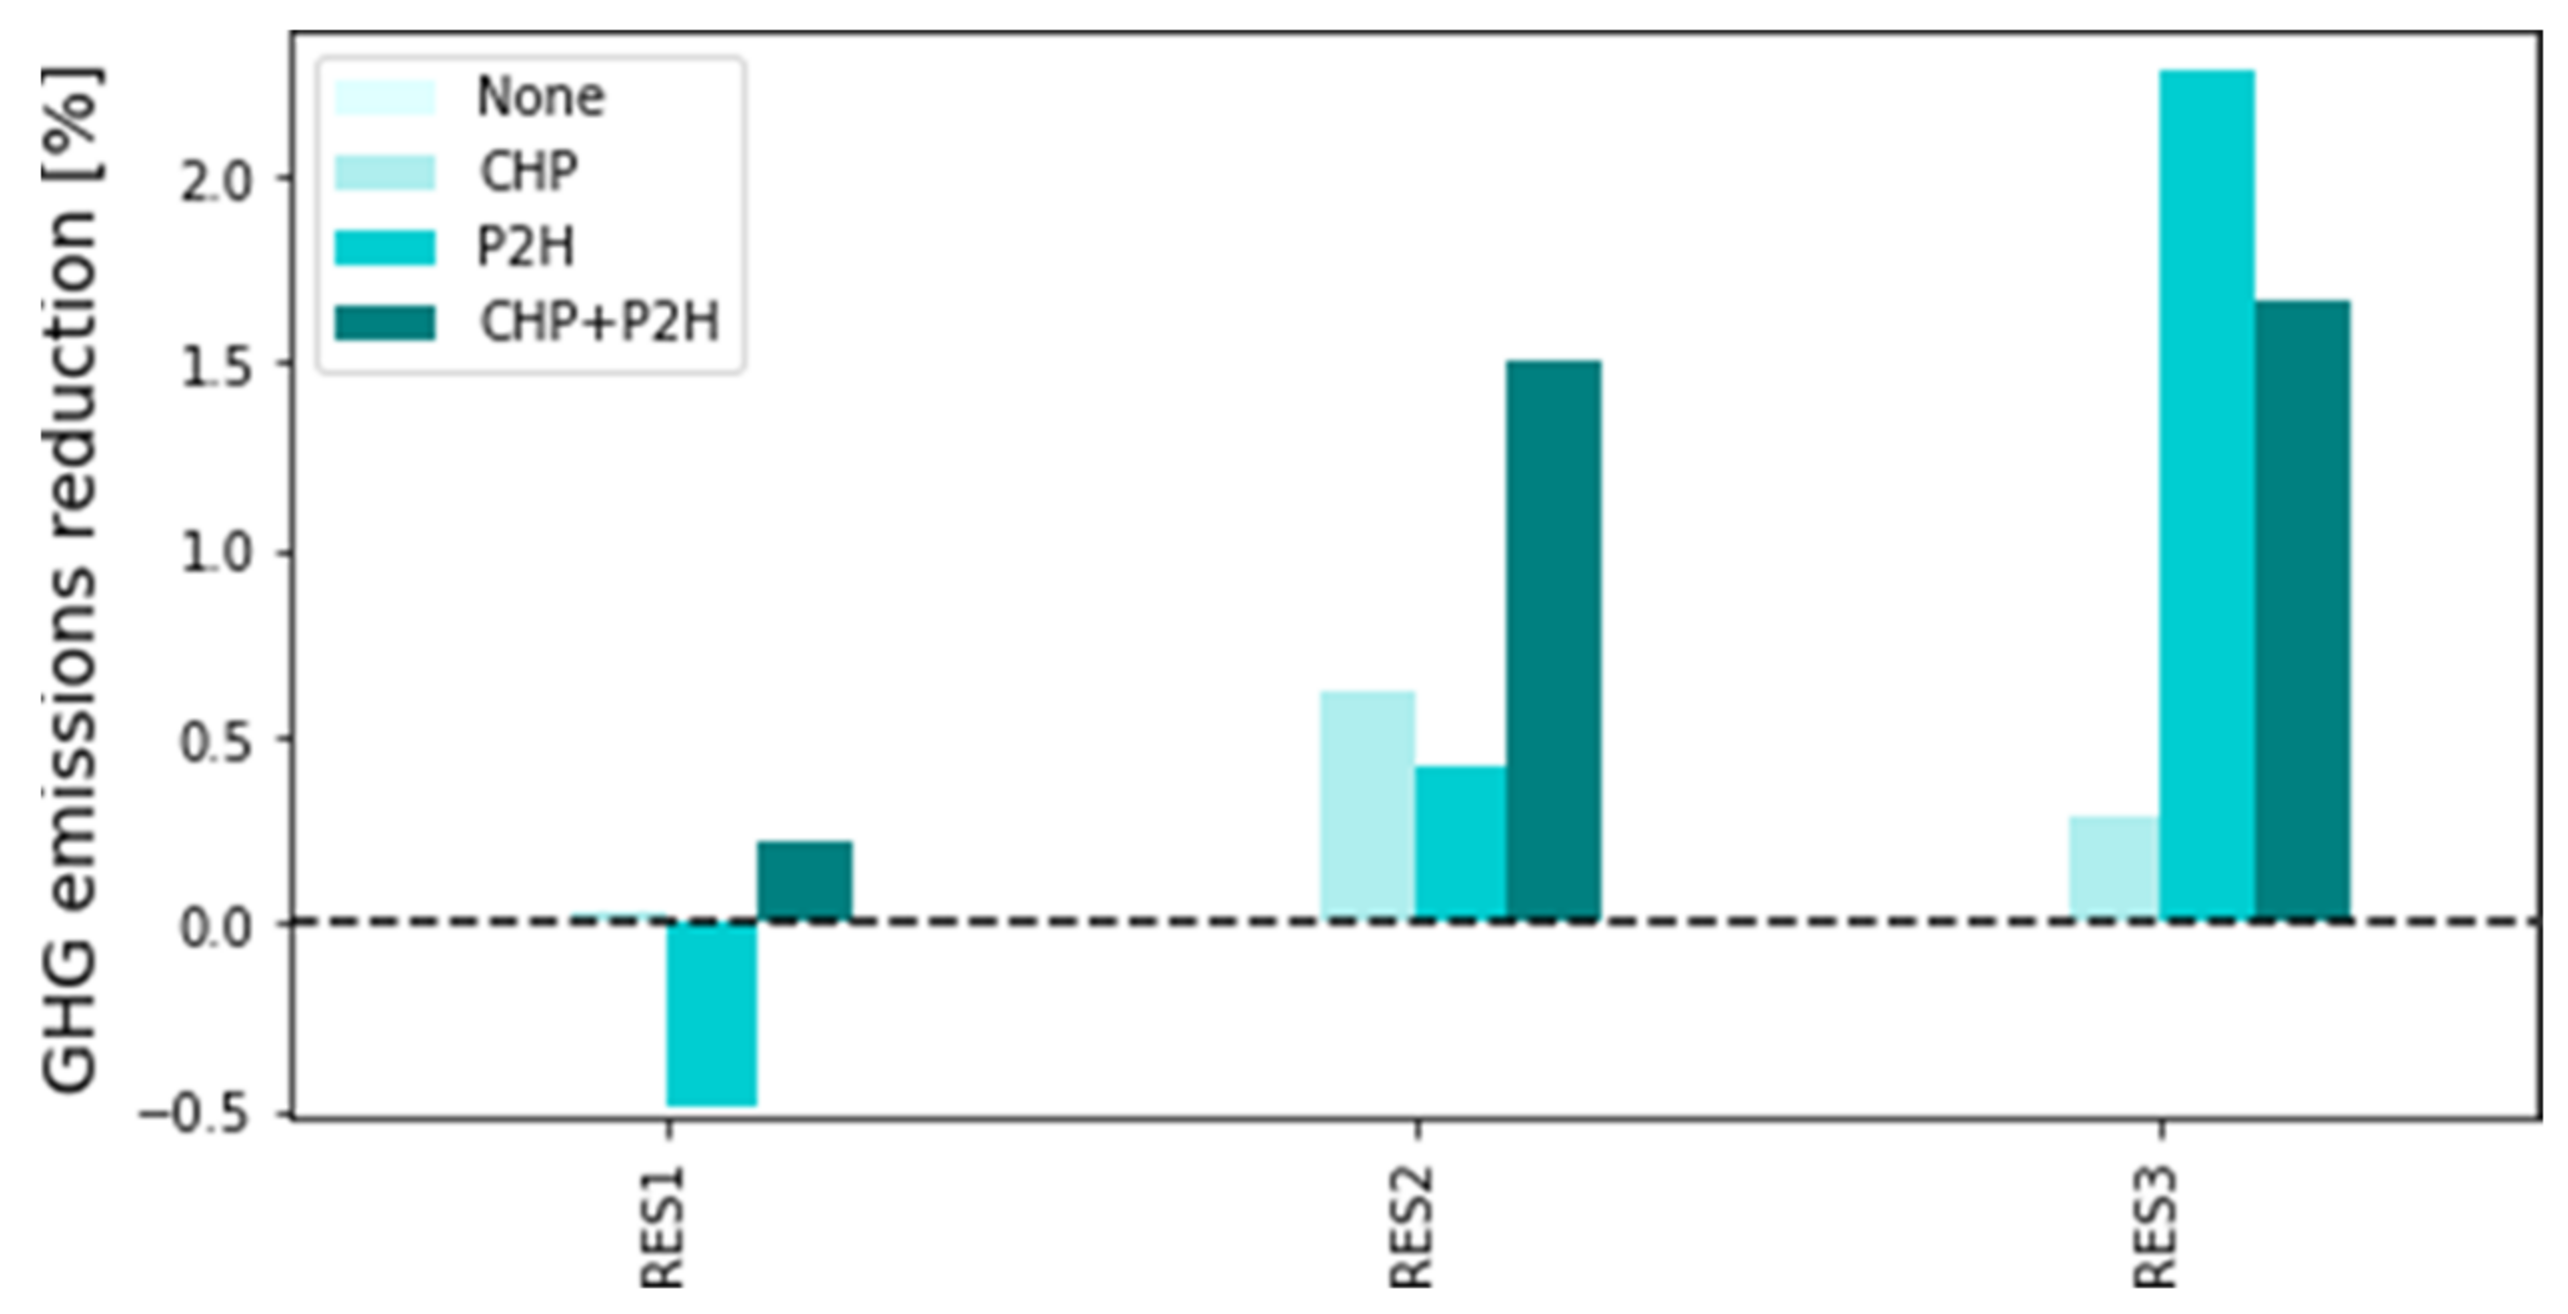
The “what-if” scenarios demonstrate that it is possible to reduce curtailment up to 75% in the highest RES penetration scenario compared to the case with no power-to-heat units in the system. The higher integration of renewables leads to reduced costs (up to 50% savings) and significantly lower GHG emissions. Moreover, the participation of those units in the reserves market is relevant (up to 18% on average for the case of upward reserves) and enables achieving a further increase in the integration of RESs thanks to the reduced need for fossil-fuel-based power plants.
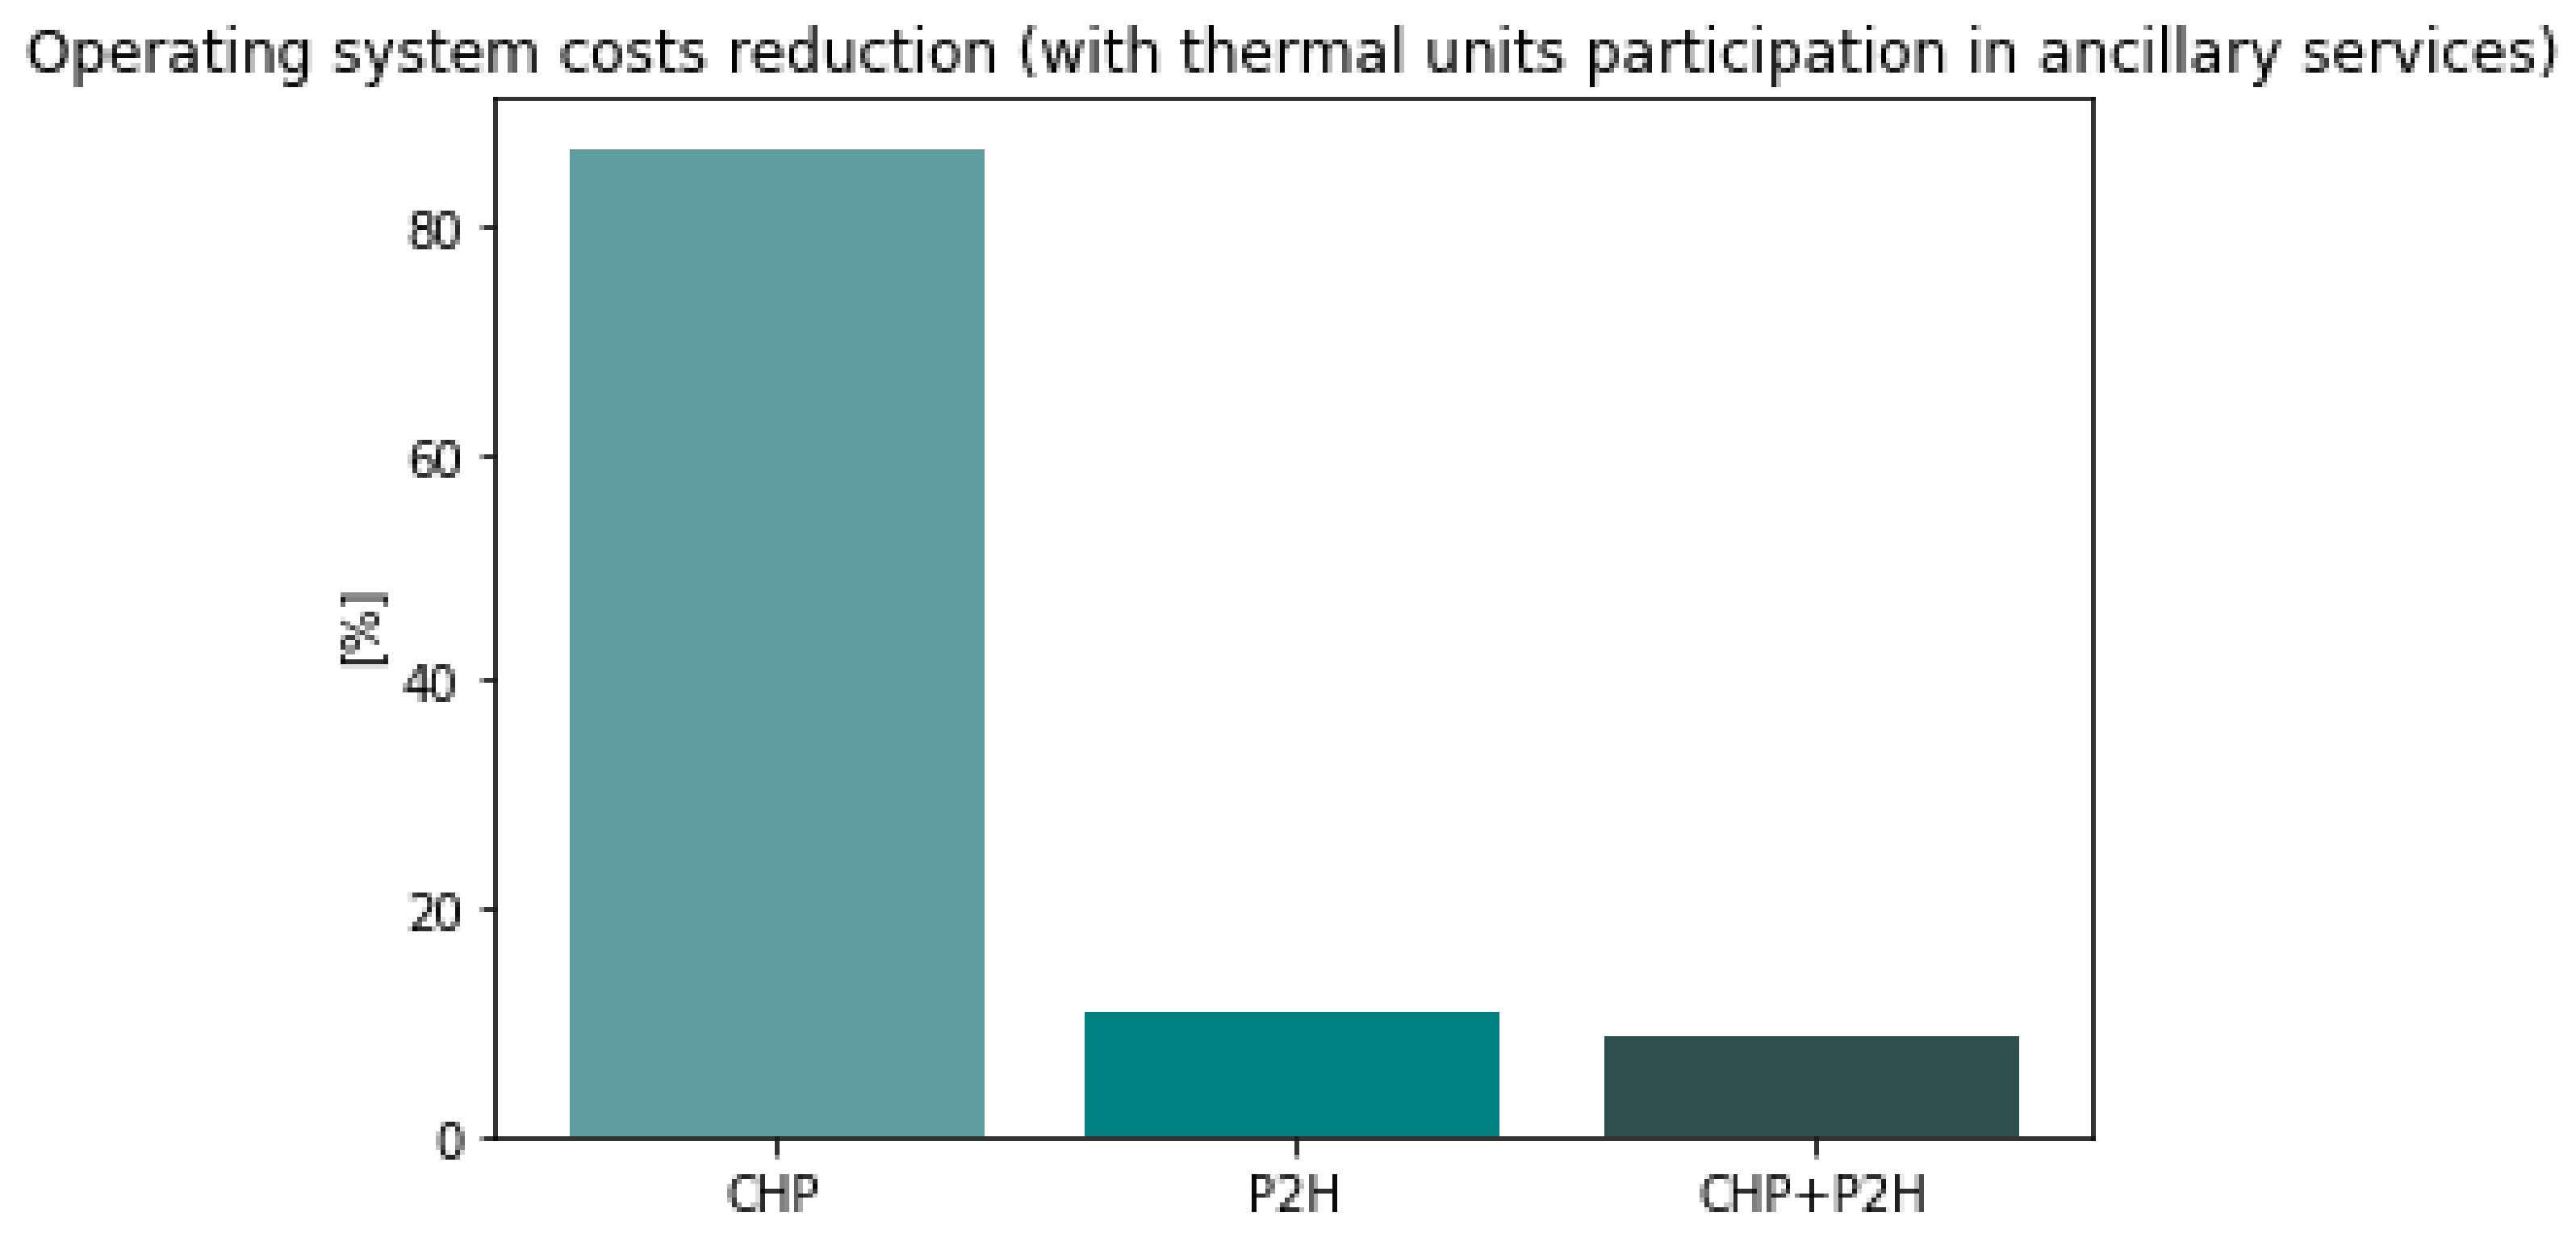
The outcomes are different for the case of CHP units: their large integration would negatively affect the integration of RESs in the energy mix, leading to higher GHG emissions; however, their participation in the reserves market proved to be more economically convenient for the system compared to the case of P2HT units. This is linked to the possibility to decouple heat and electricity production, which adds to the flexibility provided by the TES unit.
In the “100% RES—2050” scenarios, both P2HT and CHP units provide a slightly lower share of reserves due to the expected high deployment of hydroelectric power plants provided with storage systems.
The study demonstrates the utmost importance of considering the reserves market in energy system models and investigating the relationship between reserve needs and the increase in non-dispatchable RESs. It also demonstrates the potential role of power-to-heat systems for participation in the reserve provision in energy systems with high shares of RESs. Moreover, DH systems coupled with TES units and in particular the ones supplied by P2HT units can bring significant benefits to the system. However, a combination of P2HT and CHP technologies could be the most effective solution to ensure the security of the supply in systems with reduced availability of dispatchable sources. In order to establish the optimal trade-off between power-to-heat and CHP units, it is necessary to perform more simulations including scenarios with decreased dispatchable capacity installed. Further analysis could include the investigation of the economic value of the flexibility provided by thermal units and a detailed cost–benefit analysis for the determination of the optimal deployment of DH systems and heat-supply technologies.


