Article

Comparative Analysis of Riser Base and Flowline Gas Injection on Vertical Gas-Liquid Two-Phase Flow

1
Faculty of Mining and Energy Engineering, Sebha University, Sebha 00218, Libya
2
School of Engineering, University of Lincoln, Brayford Pool, Lincoln LN6 7TS, UK
3
Atmospheric Emissions Research Group, Cranfield University, Cranfield MK43 0AL, UK
4
Department of Chemical Engineering, Federal University of Technology, Minna PMB 65, Nigeria
5
Centre for Thermal Energy Systems and Materials, Cranfield University, Cranfield MK43 0AL, UK
*
Authors to whom correspondence should be addressed.
Energies 2022, 15(19), 7446; https://doi.org/10.3390/en15197446
Submission received: 10 September 2022 / Revised: 27 September 2022 / Accepted: 27 September 2022 / Published: 10 October 2022
(This article belongs to the Section A: Sustainable Energy)

Abstract

:
Gas injection is a frequently used method for artificial lift and flow regime rectification in offshore production and transportation flowlines. The flow behaviour in such flowlines is complex and a better understanding of flow characteristics, such as flow patterns, void fraction/hold up distributions and pressure gradient is always required for efficient and optimal design of downstream handling facilities. Injection method and location have been shown to strongly affect downstream fluid behaviour that can have important implications for pumping and downstream facility design, especially if the development length between pipeline and downstream facility is less than L/D = 50 as reported by many investigators. In this article, we provide the results of an experimental investigation into the effects of the gas injection position on the characteristics of the downstream upwards vertical gas flow using a vertical riser with an internal diameter of 52 mm and a length of 10.5 m. A horizontal 40-m-long section connected at the bottom provides options for riser base or horizontal flow line injection of gas. The flowline gas injection is performed 40 m upstream of the riser base. A 16 by 16 capacitance wire mesh sensor and a gamma densitometer were used to measure the gas-liquid phase cross-sectional distribution at the riser top. A detailed analysis of the flow characteristics is carried out based on the measurements. These include flow regimes, cross-sectional liquid holdup distributions and peaking patterns as well as analysis of the time series data. Our findings show that flow behaviours differences due to different gas injection locations were persisting after a development length of 180D in the riser. More specifically, core-peaking liquid holdup occurred at the lower gas injection rates through the flowline, while wall-peaking holdup profiles were established at the same flow conditions for riser base injection. Wall peaking was associated with dispersed bubbly flows and hence non-pulsating as against core-peaking was associated with Taylor bubbles and slug flows. Furthermore, it was found that the riser base injection generally produced lower holdups. It was noted that the circumferential injector used at the riser base promoted high void fraction and hence low liquid holdups. Due to the bubbly flow structure, the slip velocity is smaller than for larger cap bubbles and hence the void fraction is higher. The measurements and observations presented in the paper provides valuable knowledge on riser base/flowline gas introduction that can directly feed into the design of downstream facilities such as storage tanks, slug catchers and separators.

1. Introduction

1.1. Background

In many significant applications in the oil and gas, chemical, and nuclear sectors, gas-liquid lift in two-phase flows is widely employed to modify fluid behaviour for various desirable outcomes. This is very important in the design of downstream facilities, for example in oil and gas pipeline risers where gas injection is used for artificial lift to boost oil production. This reduces the average density of the fluid flowing in vertical wells and risers [1] and reduces the occurrence of back pressure.
Investigators have studied gas lift characteristics in vertical pipes [2,3,4,5]. Hagedorn et al. [2] measured the liquid production rate, air injection rate, temperatures and surface pressures in a test well equipped with gas-lift valves. They conducted experiments for a wide range of liquid flow rates, gas-liquid ratios, and liquid viscosities. They developed dimensionless correlations for the prediction of pressure gradients for several pipe sizes, flow conditions, and liquid properties. Szalinski et al. [3] investigated the injection of air into silicone oil and air-water flows. They studied bubble coalescence and breakup phenomena using a wire mesh sensor and discovered that there was severe non-equilibrium such that more coalescence occurs than breakup in oil. Bubbles in the air–water flow tend to be larger than in air/silicone oil flow at similar conditions suggesting a viscosity effect on coalescence/breakup.
The initial review of the literature showed that gas injection affects downstream riser fluid properties. However, there is a lack of an assessment on the impact of injection methods and locations on flow behaviour at the riser top, which can affect the sizing and type of downstream process units such as slug catchers and separators.
In summary, two main shortcomings have been identified, namely: a lack of in-depth knowledge of the effect of gas injection method and its influence on the suitability of existing prediction models. Therefore, the novelty of this study is tackled under two main objectives. Firstly, the effect of gas injection method (inline or riser base) on downstream fluid behaviour is investigated via the use of experimental measurements 180D downstream of the riser base. This is because gas injection method and location have important implications on not only the quality of gas lift and flow regime but can affect downstream facility design. To achieve this aim, experiments were conducted to establish the nature of void fraction distribution at the top of a 52 mm internal diameter riser using two advanced instrumentation systems: a single beam clamp-on gamma densitometer and a 16-by-16 wire mesh sensor (WMS). Both systems were used so as to provide cross-validation of the measurements to provide a reliable database. Cross-sectional void fraction profiles were obtained for a range of gas and liquid superficial velocities injected through a horizontal flowline and directly at the riser base, respectively. Secondly, the study assesses the suitability of published void fraction and holdup prediction models for each of the upstream injection methods. These are important during the design stage so that the amount of downstream liquid, for example, can be appropriately predicted and can have significant implications for the specification of collection and separation equipment at the end of the riser in a process plant or offshore production facility.

1.2. Literature Review

Investigators have studied gas lift characteristics in vertical pipes over the last 2–3 decades including recent works [6,7,8,9]. However, the effect of upstream injection location and the prediction of their effect on downstream flow and facilities has not been well established. As a result, lots of trial and error and the experience of specific engineers is relied upon. Particularly, the void fraction and flow pattern are important and precise/detailed predictions of phase behaviour prior to operation can be extremely valuable.
Guerra et al. [8] measured gas jets in liquid cross flows in vertical pipes. Three distinct injection angles (−45°, 0°, 45°), two orifice diameters and air and water flow rates were studied. They characterised the continuous and dispersed flow phases including the bubble diameter distribution, and shapes depending on the air injection angles. They found that size distributions of the large bubbles are strongly dependent on the flow parameters and the injector geometry. However, the study did not investigate the effects of injection on downstream two-phase characteristics.
Vishnyakov et al. [4] experimentally studied gas injection during enhanced oil recovery by measuring the characteristics of reservoir pressure and product recovery. In their work, they found that high miscibility of injected gas with reservoir liquids is obtained at high pressures leading to increased oil recovery. Descamps et al. [5] conducted experimental research on the effect of gas injection on the phase inversion between oil and water flowing through a vertical tube. They employed different types of gas injectors and found that gas injection affected bubble size as well as the phase inversion process. The influence on the pressure drop was found to be considerable especially at mixture velocities greater than 1 m/s. These studies show the importance of injected gas on downstream mixture properties and a number of correlations have been suggested for the prediction of void fraction ( α ) and hence liquid holdup ( H L ) given the upstream gas and liquid conditions. Liquid holdup is obtained from the void fraction by the interrelationship between the two quantities:
H L = 1 α
Different authors have studied the behaviour of the void fraction with pipe diameter/inclination, superficial/mixture velocities, input gas quality, and other physical properties of the respective fluid phases (e.g., [10,11,12]). Table 1 summarises several popular correlations for void fraction in the literature. These include the homogenous model, which assumes both fluids are travelling at the same velocity and phase slip is neglected. It is flow regime independent and but the tendency to underestimate the void fraction at high gas superficial velocities. The most famous correction to the homogenous model is the model proposed by Lockhart & Martinelli [13], which used a large data set from experiments conducted with air-water, air-oil, and combinations of air and kerosene or benzene. Subsequently, authors have attempted to improve the accuracy at such conditions either by deriving their correlations to be flow-regime-dependent or more crucially by introducing a slip ratio which accounts for the velocity differences.
Authors such as Woldesemayat & Ghajar [14] have developed correlations that are very accurate for air–water vertical flows and which are based on Zuber & Findlay’s [15] drift flux model. An example is the correlation of Almabrok et al. [16] where data for bubbly, churn and annular flow were used and mostly apply for large pipe systems (i.e., those with diameter greater than 100 mm). Other correlations in the literature have completely different forms from those of the slip ratio or drift flux variety. These include those of Gomez et al. [17] which is an exponential relationship that relate the liquid holdup with liquid Reynolds number and pipe inclination. A good number of the available correlations in the literature were developed with data and conditions for simultaneous air and liquid introduction into the test pipe section.
The various correlations itemised in Table 1 were statistically compared with the experimental data, and recommendations based on the observations are made. These include the homogenous model, which has proved accurate for low void fraction dispersed flows where phase slip is negligible; the Lockhart & Martinelli model [13]; and more recent ones developed by Woldesemayat & Ghajar [14] and Almabrok et al. [16]. Brief descriptions of each correlation’s features, conditions and limitations are given in the table. This study hence aims to establish the viability of each of these correlations for downstream gas void fraction/holdup prediction. In order to do this, an experimental setup was devised on a vertical riser system at Cranfield University for establishing compatibility of existing predictive relationships with flow line or riser base injection methods.

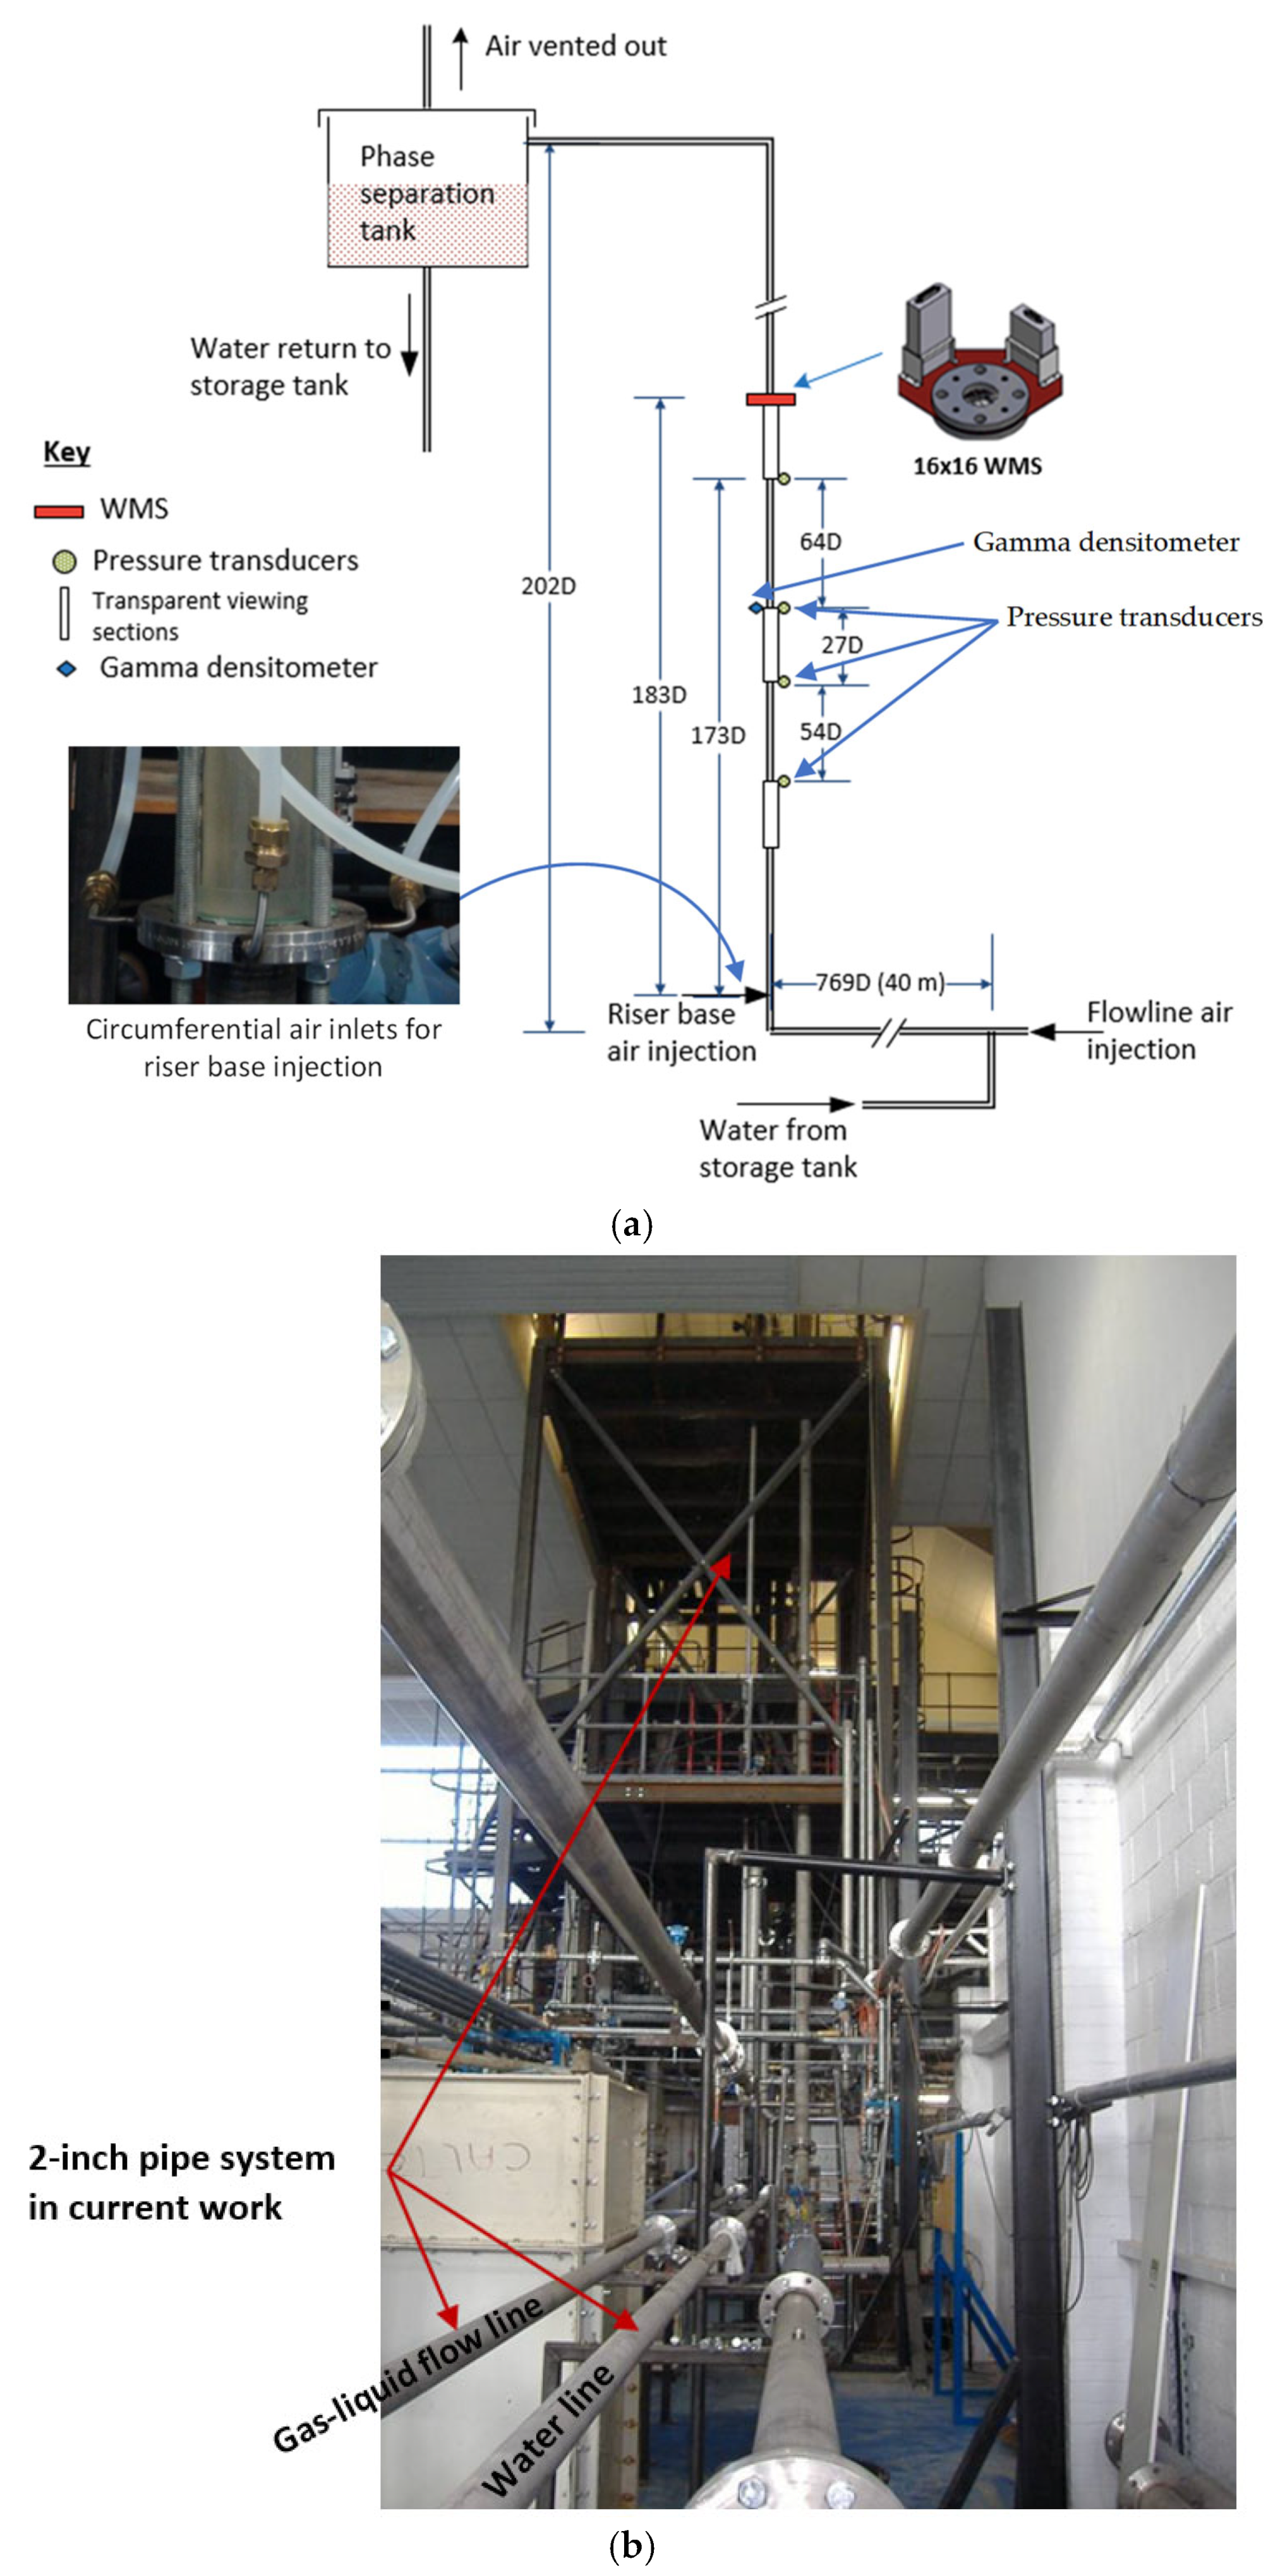
2. Experimental Setup and Procedure

2.1. Experimental Rig

The experiments of this work were performed in the 52 mm diameter vertical riser system of the three-phase test facility in the Process Systems Engineering (PSE) Laboratory at Cranfield University, Cranfield, UK. The 52-mm (i.e., 2-inch) riser system is constructed of stainless-steel NB schedule 10 and consists of a 40-m length of horizontal flowline connected to a 10.5-m length of vertical pipe. The two-phase air-water test facility flow line, including the 52 mm riser, is schematically shown in Figure 1. It is an automatically controlled testing facility that has the capacity to measure, supply, and manage the air and water flows to the testing area. Additionally, by using a multistage pump, water is pumped into the test system from a 12.5 m3 storage tanks. The test rig is designed with sufficient flexibility that different parametric effects can be investigated by adjusting or modifying its configuration. Therefore, air can be injected into the flowline either at the horizontal section, which is at the upstream of the riser base or at the riser base. The water is injected in the flow loop by a multi-stage Grundfos CR90-5 pump (Grundfos, Bjerringbro, Denmark). The start-up, speed control and shutdown of this pump are carried out remotely by using the Emerson DeltaV control system (Emerson, St. Louis, MO, USA). At the outlet from the test section, the liquid and the air mixture are separated into air and liquid (water). The air is then discharged to the atmosphere.
Water enters its respective coalescers where they are further separated from the other phase. The water is then directed into the storage tank with the air being vented. The facility consists of two flow loops, namely, a 52 mm and 102 mm flow loop. For the purposes of this work only the 52 mm flow loop was used. It consists of a 40-m-long horizontal flowline, connecting to a 10.5-m-long vertical pipe. The vertical stainless-steel riser has three transparent Perspex sections of lengths of 55 cm, 20 cm, and 40 cm. They are fitted at locations 0.2 m, 4 m, and 8.4 m above the riser base, respectively. Visual observation of the flow can be made through these transparent sections. The riser outlet is connected to a two-phase separator, where the air and liquid are separated. Instruments are installed in the riser to study the multiphase flow characteristics and fluids distributions inside the riser.
In order to measure the differential pressure ( Δ P ) across the 52 mm riser system, the vertical section of the riser has four calibrated flush mounted pressure transducers Druck PMP 1400 (Druck, Billerica, MA, USA) installed at axial distances of 0.9 m, 3.66 m, 5.04 m, and 8.3 m from the riser base, respectively. Their outputs were recorded with LabVIEW (NI, Austin, TX, USA) at a recording rate of 100 Hz. A single beam clamp-on gamma densitometer was installed near the riser top at 8.2 m from the riser base. Furthermore, a 16 × 16 capacitance wire mesh sensor is installed at 0.6 m above the gamma densitometer. The following section has more information on these instrumentations.

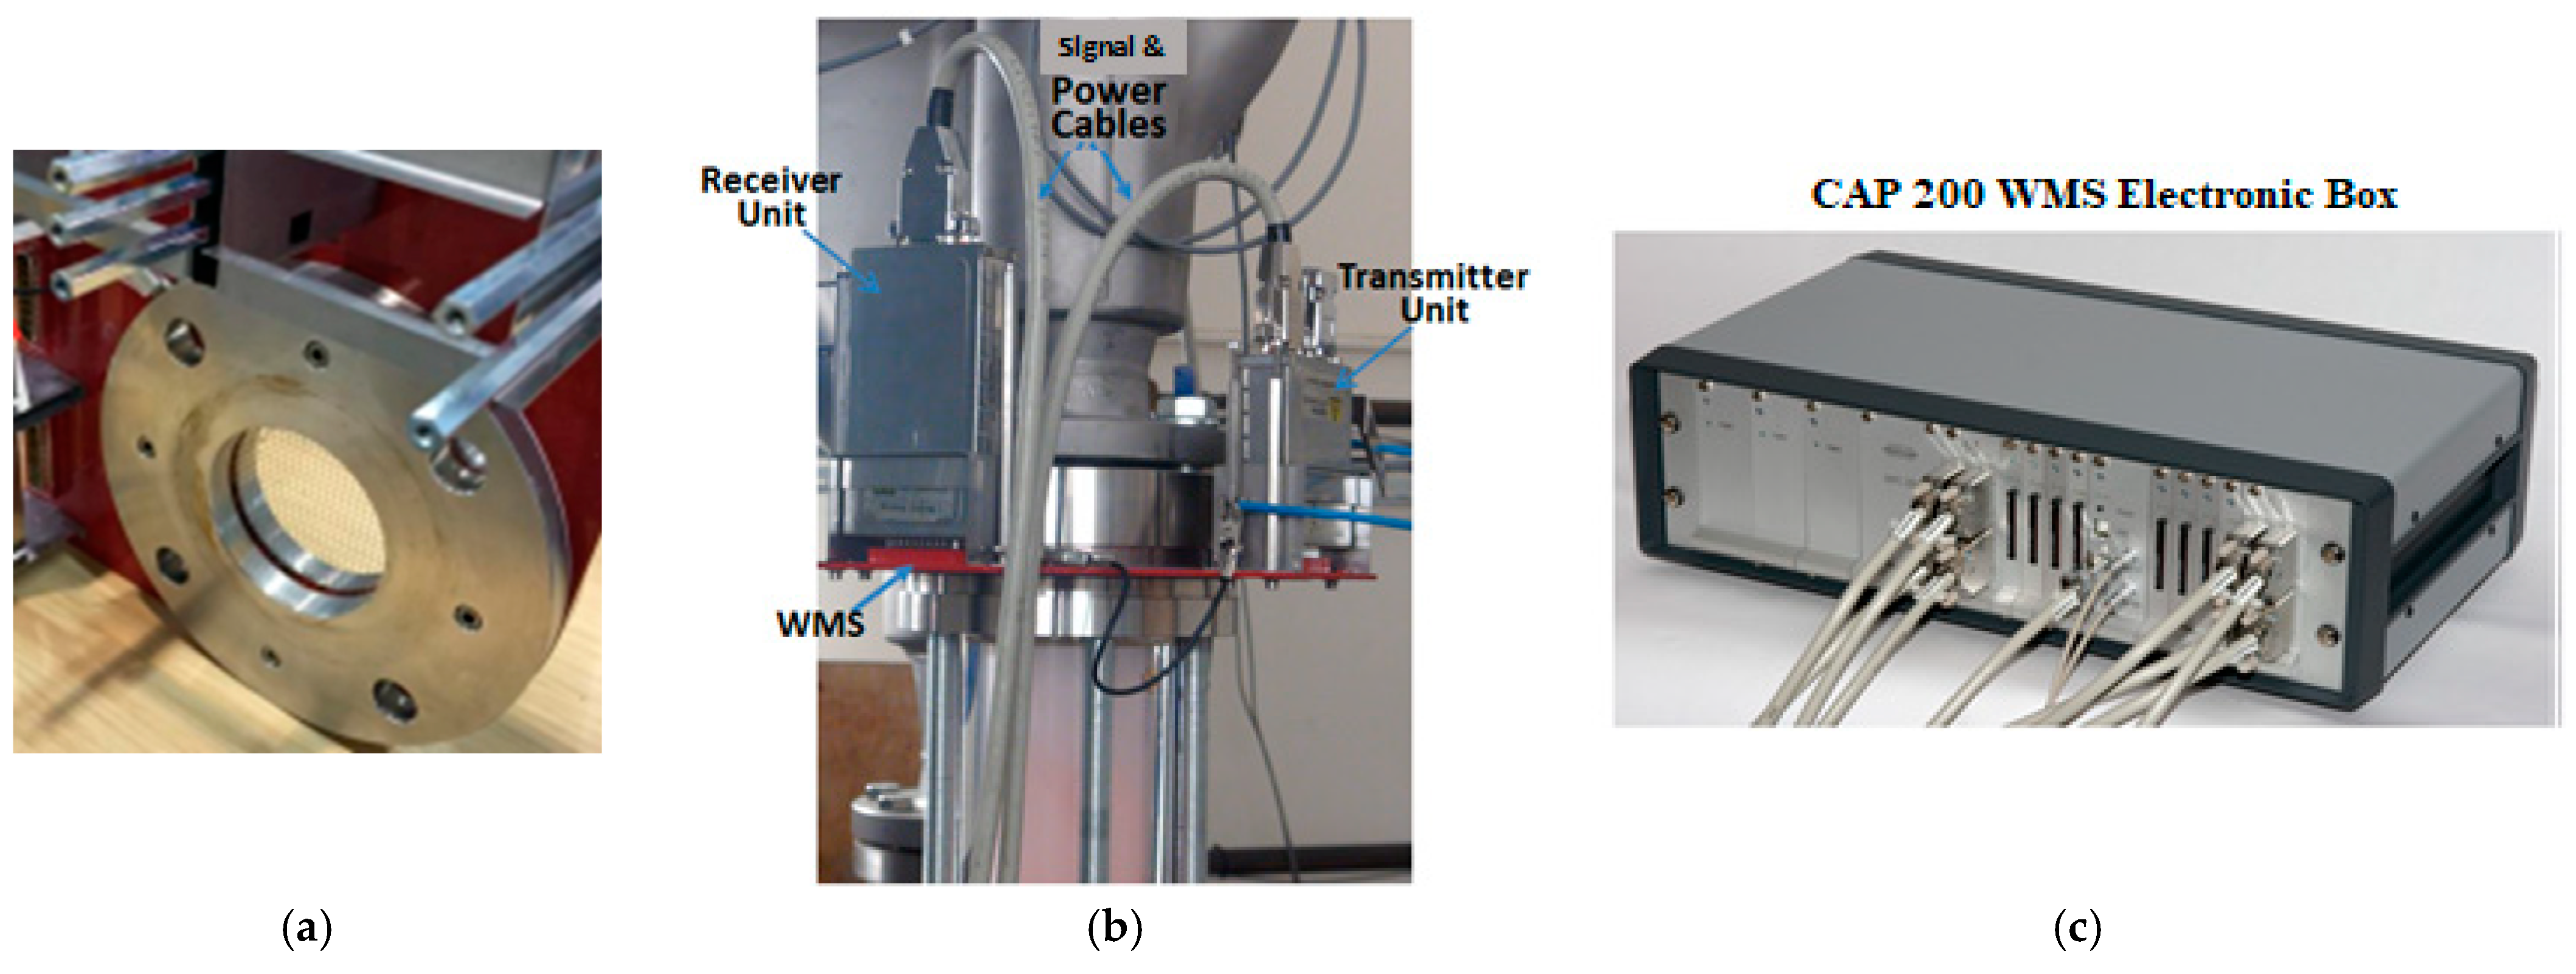
2.2. Instrumentation

2.2.1. Gamma Densitometer (GD)

The gamma densitometer used in this study comprises a gamma source, its housing, a detector unit, and a data processing box. A detector unit is positioned directly across from the source on the opposite side of the pipe, and a collimated gamma ray is aimed at the pipe. The gamma-source housing consists of an outer stainless-steel casing. This casing gives mechanical strength and strictness to the lead-filled internals, which include a gamma radionuclide source capsule enclosed by a lead body to prevent the gamma ray from scattering into the surrounding area. The radioisotope caesium-137 serves as the gamma source. This source delivers a narrow gamma-ray beam directed along the pipe’s cross-sectional diameter towards the sodium iodide crystal in the detecting unit. In order to create an outlet that produces a cone of gamma beam with uniform physical qualities in all directions and an angle of 6 degrees to be directed across the diameter of the pipeline, a collimator designed to restrict the size and angle of spread of the gamma rays is integrated into the housing unit.
The Gamma-detection unit includes a sodium iodide crystal with a photomultiplier 30 × 60 mm tube for the gamma ray detection and amplifier electronics and two single-channel analysers. The crystal produces a visible light pulse whose energy is proportional to that of the incident gamma photon and is detected by a photomultiplier which converts the light pulses into voltage pulses of proportional amplitudes. These voltage pulses are then amplified using appropriate electronic circuits before being sent to channel analysers for classification. The single-channel analysers (SCAs) serve as voltage pulses counters. They are configurated to measure the gamma count of the hard energy spectrum between 0.50–0.94 MeV and the gamma count for all attention photon energies between 0.1–0.94 MeV. The difference between the two measured ranges is known as the soft energy spectrum count. The detection unit also includes a temperature-regulating component that regulates the detector’s internal temperature to prevent it from falling below 20 °C, minimising the impact of temperature variations on the detecting electronics in the process. The manufacturer, Neftemer Ltd. (Woodbridge, UK), estimated the accuracy of the gamma densitometer count measurements to be 5% [22].
Since gamma rays are usually attenuated as they travel through the medium due to interaction of their photons with the matter, gas composition will have an effect on the transmitted signals. The degree to which gamma rays are attenuated depends on the energy of the gamma rays and the density of the absorbing medium [17,18,19]. In the current study, gamma densitometer GD units, supplied by Neftemer Ltd. were installed at the top part of the 52 mm vertical riser at a high of 9 m (~183D) from the riser base.
For multiphase flow measurement, the GD source directly emits high energy photons (called hard spectrum counts) and scattered radiation (soft spectrum counts). The received gamma counts sampled at 250 Hz were transferred to a local PC where the acquired data were stored and processed. The gamma phase fractions (gas void fraction or water fraction) were determined by using The Beer–Lambert for liquid holdup in gas–liquid flows [19]:
H L = ln I M I A / ln I L I A
where I M denotes the mean gamma count from gas-liquid mixture in the pipe; I A is the mean calibrated gamma count for an empty pipe (i.e., 100% Air); I L is the mean calibrated gamma count for the pipe containing pure liquid and H L is the liquid holdup. As a result, calibrations of the gamma meter with air (empty pipe), and water only were completed before and after each experimental run for around 30 min in static settings. The calibration values for the hard and soft gamma counts of each fluid were then calculated by averaging the recorded gamma count rates.

2.2.2. Wire Mesh Sensor (WMS)

WMS measurement methods are crucial to understanding the behaviour of gas-liquid flow in pipes. In this research study, a 16 × 16 wire mesh sensor WMS based on capacitance (permittivity) measurements of the fluids [16] was employed for the gas–water flow measurements in a 52 mm vertical riser. Figure 2 shows the actual images for the 16 × 16 WMS manufactured by Helmholtz–Zentrum Dresden–Rossendorf (HZDR, Dresden, Germany) with its capacitance electronic box and associated software, which was utilised in the present work to obtain the cross-sectional void fraction data.
Many authors such as Abdulkadir et al. [23,24], Prasser et al [25], and da Silva et al. [26] have employed the capacitance WMS in the past to conduct gas–oil flow investigation. On the matter of gas–water systems the conductance WMS has been widely applied due to the wide difference in the conductivity of air and water. For the capacitance variant, such as that used in this work, it is also useful mostly for non-conducting fluids such as oils but can also be used in place of conductance sensors where there is a wide variation in relative permittivity. The capacitance wire mesh sensors used in this study are made up of 16 receiver and 16 transmitter wires of 250 µm diameter that create a measuring matrix with 16 × 16 elements. The 16 wires made from stainless steel within each plane have a diameter and wire separation of 0.12 mm and 3.125 mm, respectively. The inner diameter of the two WMS, both with a 2.5 mm axial plane distance that determines their spatial/temporal resolution, is similar to the measurement section’s diameter. Voltage pulses were supplied in progressive sequence to actuate the transmitter electrode. The receiver wire current emanating from the triggering of a delivered transmitter wire is a measure of the capacitance or conductivity of the gas and liquid in the analogous control surface near the point where the two wires intersect. For capacitance permittivity-based electronics an equivalent linear relationship between gas void fraction α and relative permittivity ( ϵ r ) values can be assumed, which is known as parallel model of mixture permittivity.
α = ϵ r   w a t e r ϵ r   m i x ϵ r   w a t e r   ϵ r   a i r
The WMS data in this work were collected at a frequency of 1000 frames/s for a total time, of 30 s, for each experimental run. This was essential for the dynamics of the flow to be fully captured by the WMS. Consequently, the total data obtained for each experimental case are in thousands (30,000 data points). Each run of the experiments was reproduced twice to determine the standard deviation. Details of the WMS methodology is in da Silva et al. [26] and Abdulkadir et al. [23,24].

2.3. Experimental Procedure

In the present study, the experiments were conducted to investigate the behaviour of two-phase gas-liquid upward flow in terms of flow patterns and phase fraction distribution. Two different configurations of gas injection were examined: (i) A circumferential injection to the vertical section was achieved via four uniformly distributed inlets at the riser base. (ii) Horizontal inline injection at 40 m upstream of the riser base. The liquid superficial velocities and gas superficial velocities tested are ranged from 0.25 to 2.0 m/s and 0.39 to 3.22 m/s, respectively. The experiments were performed by delivering an amount of water flow through the 52 mm riser system at constant liquid superficial velocity and varying air injection. At each fixed superficial velocity of the liquid (water), variable air superficial velocity values from 0.39 m/s (6 Sm3/h) to 3.22 m/s (50 Sm3/h) were supplied to the measurements section in the riser. The gas flow rate was converted from Sm3/h to m3/h by dividing it by the system’s measured absolute pressure (i.e., gauge pressure + 1 bar). The gas superficial velocities were calculated at the operating conditions at the highest part of the riser where WMS and Gamma densitometer are installed at the upper part of the vertical riser system spaced 0.6 m from each other. Before pumping the fluids, the system was pressurised to 1 barg at the riser top outlet. Prior to taking any test point readings for each flow condition, the system was allowed approximately 25 min to stabilise. An Emerson DeltaV system was used to control the flowrates of fluids. LabVIEW system was used to record pressure, temperature and injected gas flow data at a scan rate of 1000 Hz and recording rate of 100 Hz. More information on the experimental facility and instrumentation can be found in previous works by some of the present authors [27,28,29,30].
The capacitance WMS and the clamp-on gamma densitometer were used at the top of the riser to determine the void fraction at each test point of the air-water experiments. By considering the acquired time series of the cross-sectionally averaged void fraction, the mean void fraction was directly determined from the WMS data. In the case of the gamma meter, the average obtained values of hard and soft gamma counts were used to calculate the void fraction by using the Beer–Lambert equation. The void fraction obtained was then used to calculate the holdup according to Equation (1). To ascertain the accuracy and consistency of the measurements, Figure 3 shows a comparison between the holdups obtained by the WMS and gamma densitometer plotted against each other over a wide range of flow conditions.
The single beam gamma densitometer has been shown to be strongly flow-regime-dependent. However, Stahl et al. & von Rohr [31] have shown a maximum error limit of ±16.67% in void fraction measurement can occur using single-beam gamma densitometers. Hence, together with the WMS and other random experimental uncertainties, it is seen in Figure 3 that the gamma and WMS holdups are less than ±30% of each other. This may be considered acceptable for most of the riser base injections, which tend to have more dispersed bubbles. However, for the flow line injection method where there are larger bubbles, the deviations are expected to be higher, and this is reflected in the plot.

3. Results and Discussion

3.1. Flow Patterns

In order to study the impact of inlet conditions on flow behaviours that occur in the riser, results of selected scenarios for gas-water flow will be presented. The flow pattern in the riser was determined for each flow condition that was investigated in these experiments. This was achieved by using a visualization produced by wire mesh sensor data (incorporating data that can provide cross-sectional view movies to see the flow as it would be seen if the pipe were transparent). Based on this technique, the flow characteristics identified in this study are in general identified as bubbly, slug, churn. Figure 4 presents flow regime maps for air-water flow with both flowline and riser base gas injection. For gas injection through the flowline, bubbly flow pattern was observed at liquid superficial velocity of 1 m/s and gas velocities ranging 0.39 < u s g < 0.95 m/s; whereas spherical cap bubbly flow was identified when gas was injected through the riser base at the same flow conditions.
Bubbly-to-slug transition was observed at liquid superficial velocity of 1 m/s and gas superficial velocity of 0.39 m/s. At the same superficial liquid velocity of 1 m/s and higher gas superficial velocities of 0.95 m/s, the flow transferred to slug flow when gas was injected at the riser base, while for flowline gas injection, the flow remained as bubbly flow for the same flow conditions. Therefore, it can be observed from the maps that the bubbly flow region is a bit longer for flow-line gas injection than for riser base gas injection. The reason for this discrepancy could be due to the influences of the flow regimes that occur in the horizontal flowline at this flow conditions. As gas superficial velocity increases to 1.55 m/s ( Q g = 25 Sm3/h), the flow regime indicates slug flow for both flowline and riser base gas injection. At the highest gas superficial velocity of about 2.94 m/s, flowline gas injection forms slug/churn flow whereas the riser base gas injection is showing almost churn flow.

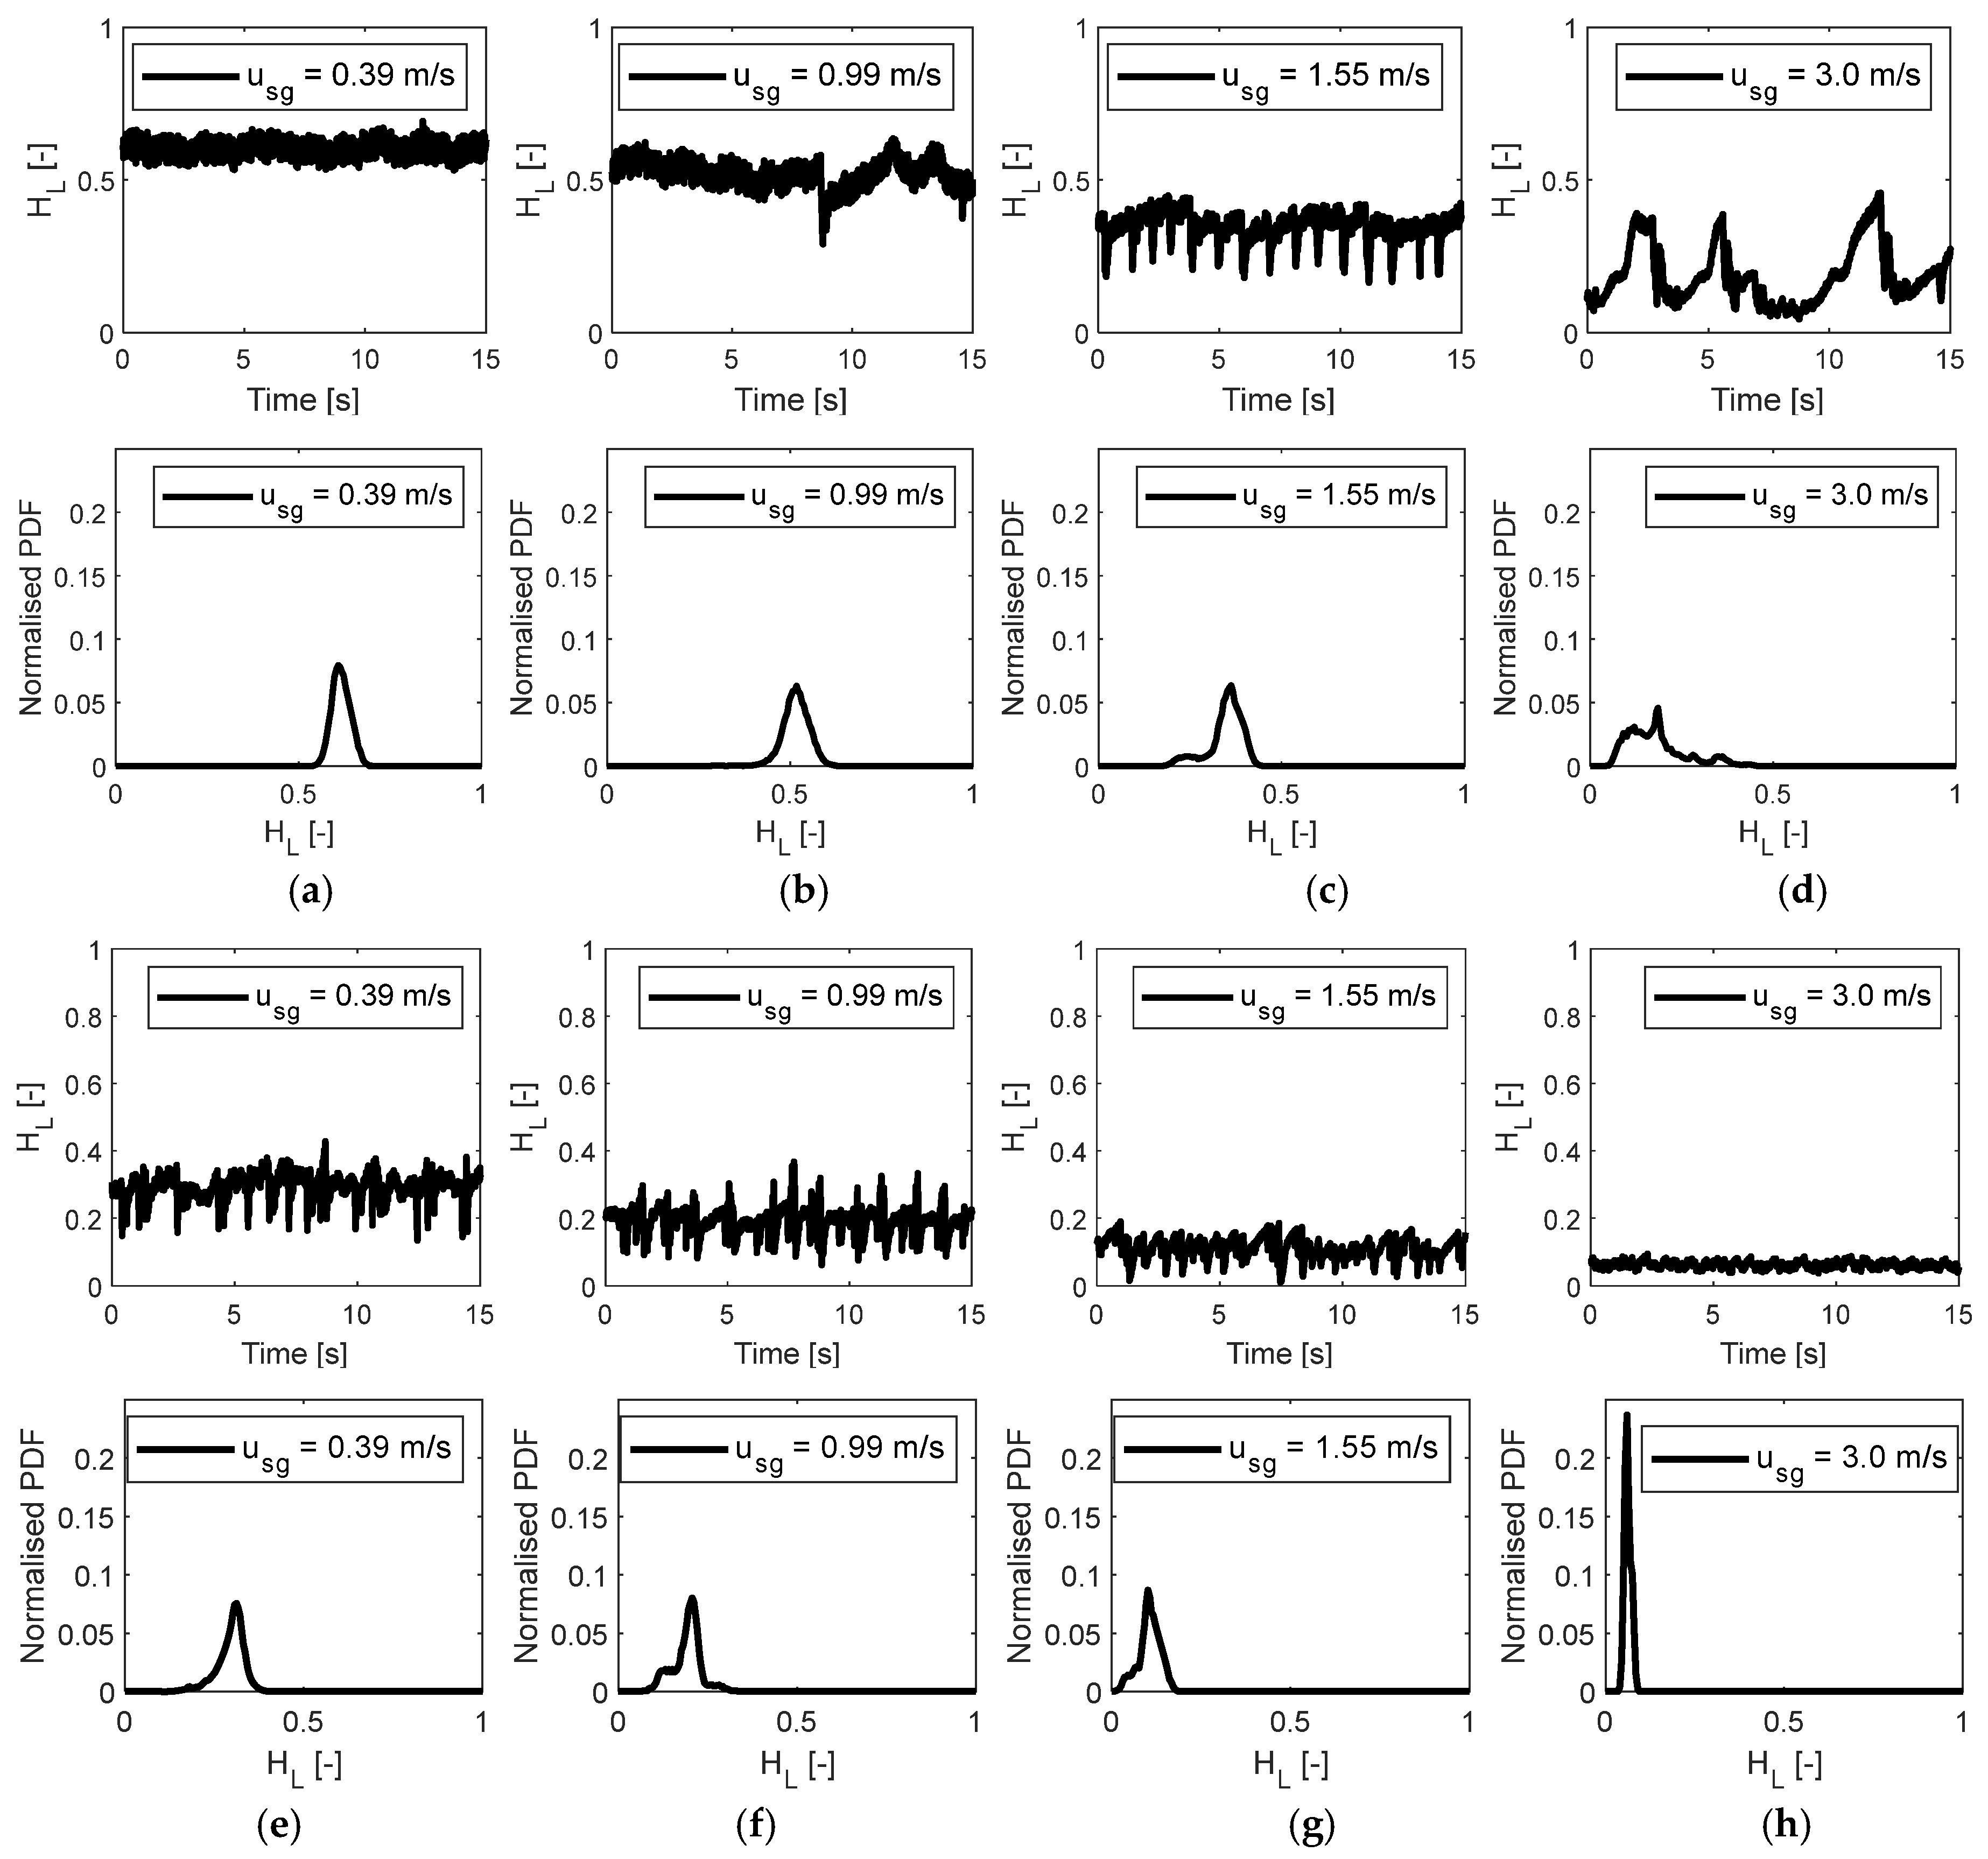
3.2. Probability Distribution Functions (PDFs) of Liquid Hold up Measurements

The use of time traces and corresponding PDFs for analysing time histories or series of measured signals is a simple quantitative means for the determination of flow patterns inside the riser pipeline. As a result of this, Figure 5 illustrates the time series and corresponding PDFs of holdup for u s l = 1 m/s. Fifteen seconds of the entire 30 s is presented, and it sufficiently shows the dynamics of each flow condition. Figure 5a–d shows the behaviour using the flowline injection and Figure 5e–h shows those of the riser base injection method. It can be observed from the shapes of the time trace and corresponding PDF for gas injection at 0.39 m/s at the flowline (Figure 5a) that the time trace for this flow condition centres around a low cross-sectional average hold up of about 0.25 with small fluctuations corresponding to the passage of small pockets of air bubbles in the liquid’s structure. The corresponding PDF presents a single peak, which also indicates a bubbly flow regime, whereas in the flowline case (Figure 5a) for the same flow condition, the holdup time trace shows less fluctuations around higher holdup value, and the corresponding PDF presents a narrower single peak, which both are characteristics of typical bubbly flow. By increasing the gas superficial velocity to about 0.99 m/s at the same water flow of 1 m/s, the time traces and PDF for riser base gas injection are shown in Figure 5f. The time traces exhibit larger fluctuations at lower holdup values. The PDF has a single peak with the small progressive development of a second peak. The shapes of the holdup time traces and the PDFs for this flow condition under the riser base injection imply that there is slug flow in the riser, whereas in the case of flow line gas injection Figure 5b the holdup time trace shows less fluctuations around higher holdup values, and the corresponding PDF still presents a single peak at higher holdup.
This is produced by the alternate passing of gas bubbles in the measurement section in the riser. For the flow line gas injection given in Figure 5c, the shape of the time traces and its PDF for this flow condition implies that there is a slug flow in the riser. At the highest superficial gas velocity of about 3.0 m/s for the riser base method (Figure 5h) and flowline injection given in Figure 5d, the holdup time series shows lower average values of holdup, and the corresponding PDF shape shows a nearly single peak situated in the lower holdup region. It is noted that plug flow was observed in some cases such as Figure 5d where the period of fluctuations between long gas bubbles and liquid plugs is long. For these cases, a near-identical cyclic behaviour was observed, and the 15 s presented is repeatedly exhibited and there was no need to show longer time series characteristics.
Higher holdup values are obtained at lower gas flow rates but with large amplitude fluctuations at lower gas flow rates for the riser base injection cases. Smoother holdup time series results at the high gas flow rates indicating a more stabilised liquid phase at these conditions. The reason for the larger fluctuations at low gas flow rates is the existence of large dispersed, and spherical cap bubbles (as show in Figure 4a). Furthermore, since the gas at the riser base is injected by small holes circumferentially and L/D being less than 200, we will show in the next section that there is still a significant wall peak. As the bubble coalescence is still incomplete, the flow structure seems to be not yet well developed. Due to the bubbly flow structure, the slip velocity is smaller than for larger cap bubbles and hence the void fraction is higher. Moreover, Prasser & Hafeli [32] reported that the standard WMS algorithm tends to overestimate the void fraction, especially for dispersed bubbly flow with small gas fractions.
Large coalesced and a near continuum of bubbles occur at around u s g = 3 m/s; these do not produce long chunks of liquid and hence fluctuations are not observed as in the lower gas flow condition at u s g = 0.39 m/s. Conversely, the opposite is true for flowline injection. Larger amplitude fluctuations in the holdups were observed at high gas flow rates (due to large Taylor bubbles and hence slug flow) than at lower flow rates where the traces are smooth (due to the existence of finely dispersed bubbles). It may also be observed that consistently high holdup is obtained for the flowline injection than those of the riser base at the same conditions. The existence of the circumferential injection (shown in Figure 1a) promotes appreciable mixing and hence expansion and more so than seen in the flowline injection method. While the long horizontal development length available (more than 40 m) prior to reaching the vertical section allows for gas expansion more than in the riser base conditions, it does not seem to produce sufficient gas expansion but rather promotes coalescence with the tendency of lower void and hence higher liquid holdups.

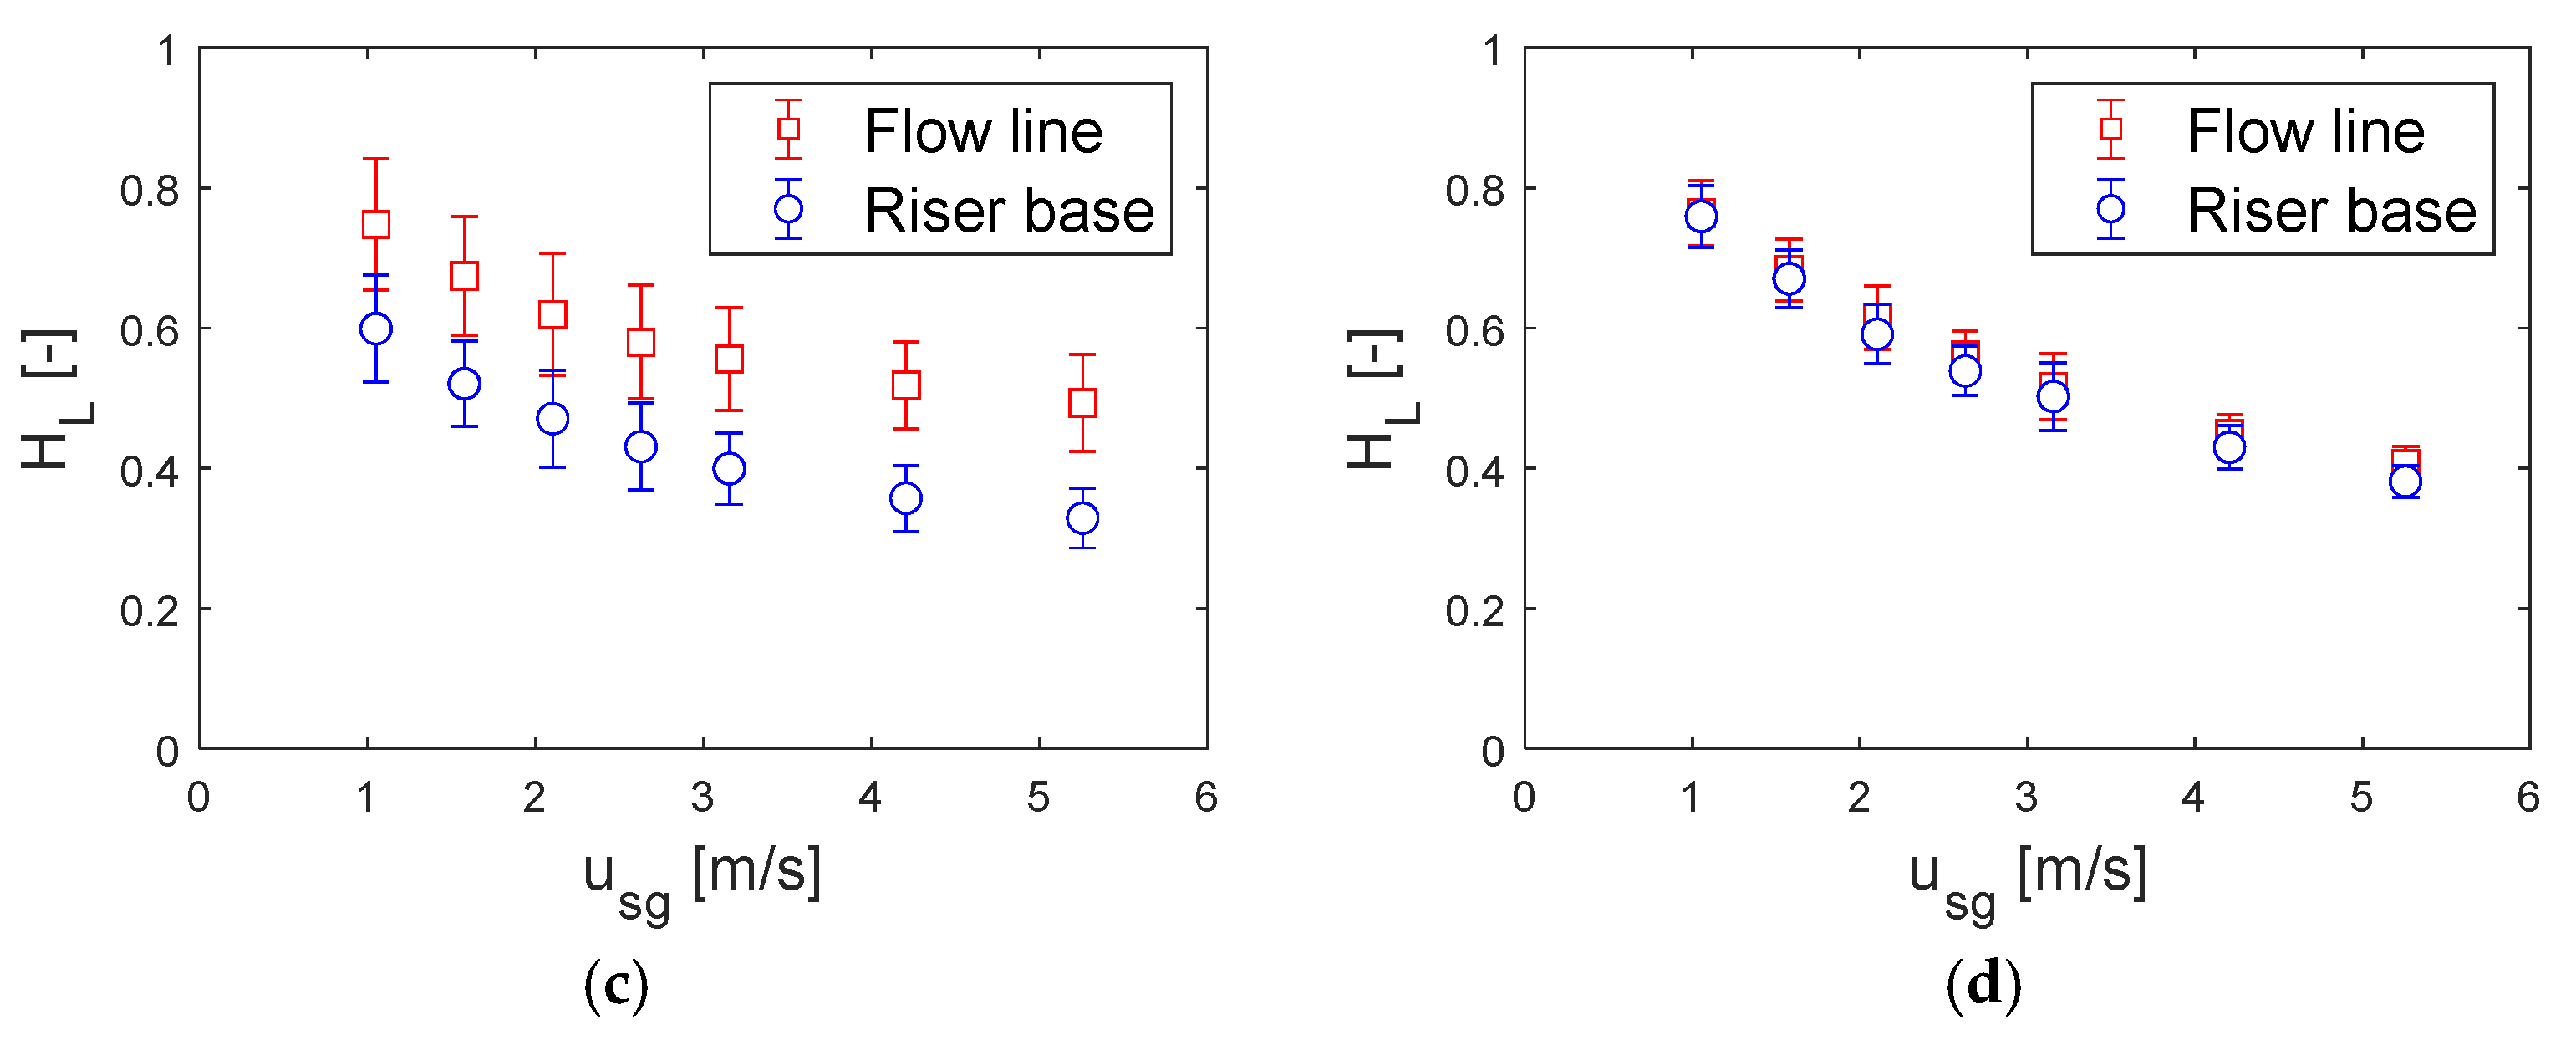
3.3. Effect of Superficial Gas Velocity and Injection Method on Holdup

Figure 6a–d shows the variation of mean liquid hold up with superficial gas velocity for u s l = 0.25, 0.5, 1.0, and 2.0 m/s, respectively. The error bars were determined by taking the standard deviation of the fluctuations of the time series data. Due to the relatively higher gas void fraction, the lower superficial liquid velocities of 0.25 and 0.5 m/s experienced more fluctuations, hence the higher magnitudes of the error bars of around 20% and 15%, respectively. Comparison was made for the flow line and riser base injection methods and there is a difference in the value of H L for the two injection methods, especially at the lower u s l conditions. The difference is seen to be reduced as u s l increases. This is because as the flow line injection location is further downstream, the flow is more stabilised before reaching the vertical 183D position where the measurement was taken, and a liquid-dominated flow regime resulted. Conversely, at 2 m/s the two injection methods produce near-identical mean liquid holdup due the stability induced by the high liquid flow, hence negating the inlet effects.
The flow regimes encountered in the horizontal flowline at this flow condition may also explain the differences in the vertical section due to the different gas injection configurations. For the flow line gas injection for this flow condition, the higher gas void fraction distribution is towards the pipe wall, with a decrease in void fraction towards the centre of the pipe. This signifies a wall-peaking bubbly profile. Conversely, a higher void fraction distribution near the pipe centre was obtained for the riser base gas injection under the same flow conditions, indicating a core-peaking bubbly flow profile. These are clearly seen in the insets on the plot in Figure 4. The insets are axial slice images of the reconstructed WMS images at the same conditions of u s l = 1.0 m/s and u s g = 0.95 m/s for the two injection methods.
Core peaking bubbly and sometimes different sizes of gas pockets within the liquid structure forming small slugs flow regime were identified for riser base gas injection at the same flow conditions. This could be the result of the effect of the long upstream horizontal flowline, which provides sufficient distance for proper gas and liquid mixing and slightly large bubbles tend to move near the pipe wall, especially at lower gas superficial velocities and higher liquid flow rate of 1 m/s. This influences the vertical riser behaviour and reduces the effects of some unstable processes (such as hydrodynamic slugging) from the flowline-riser system.

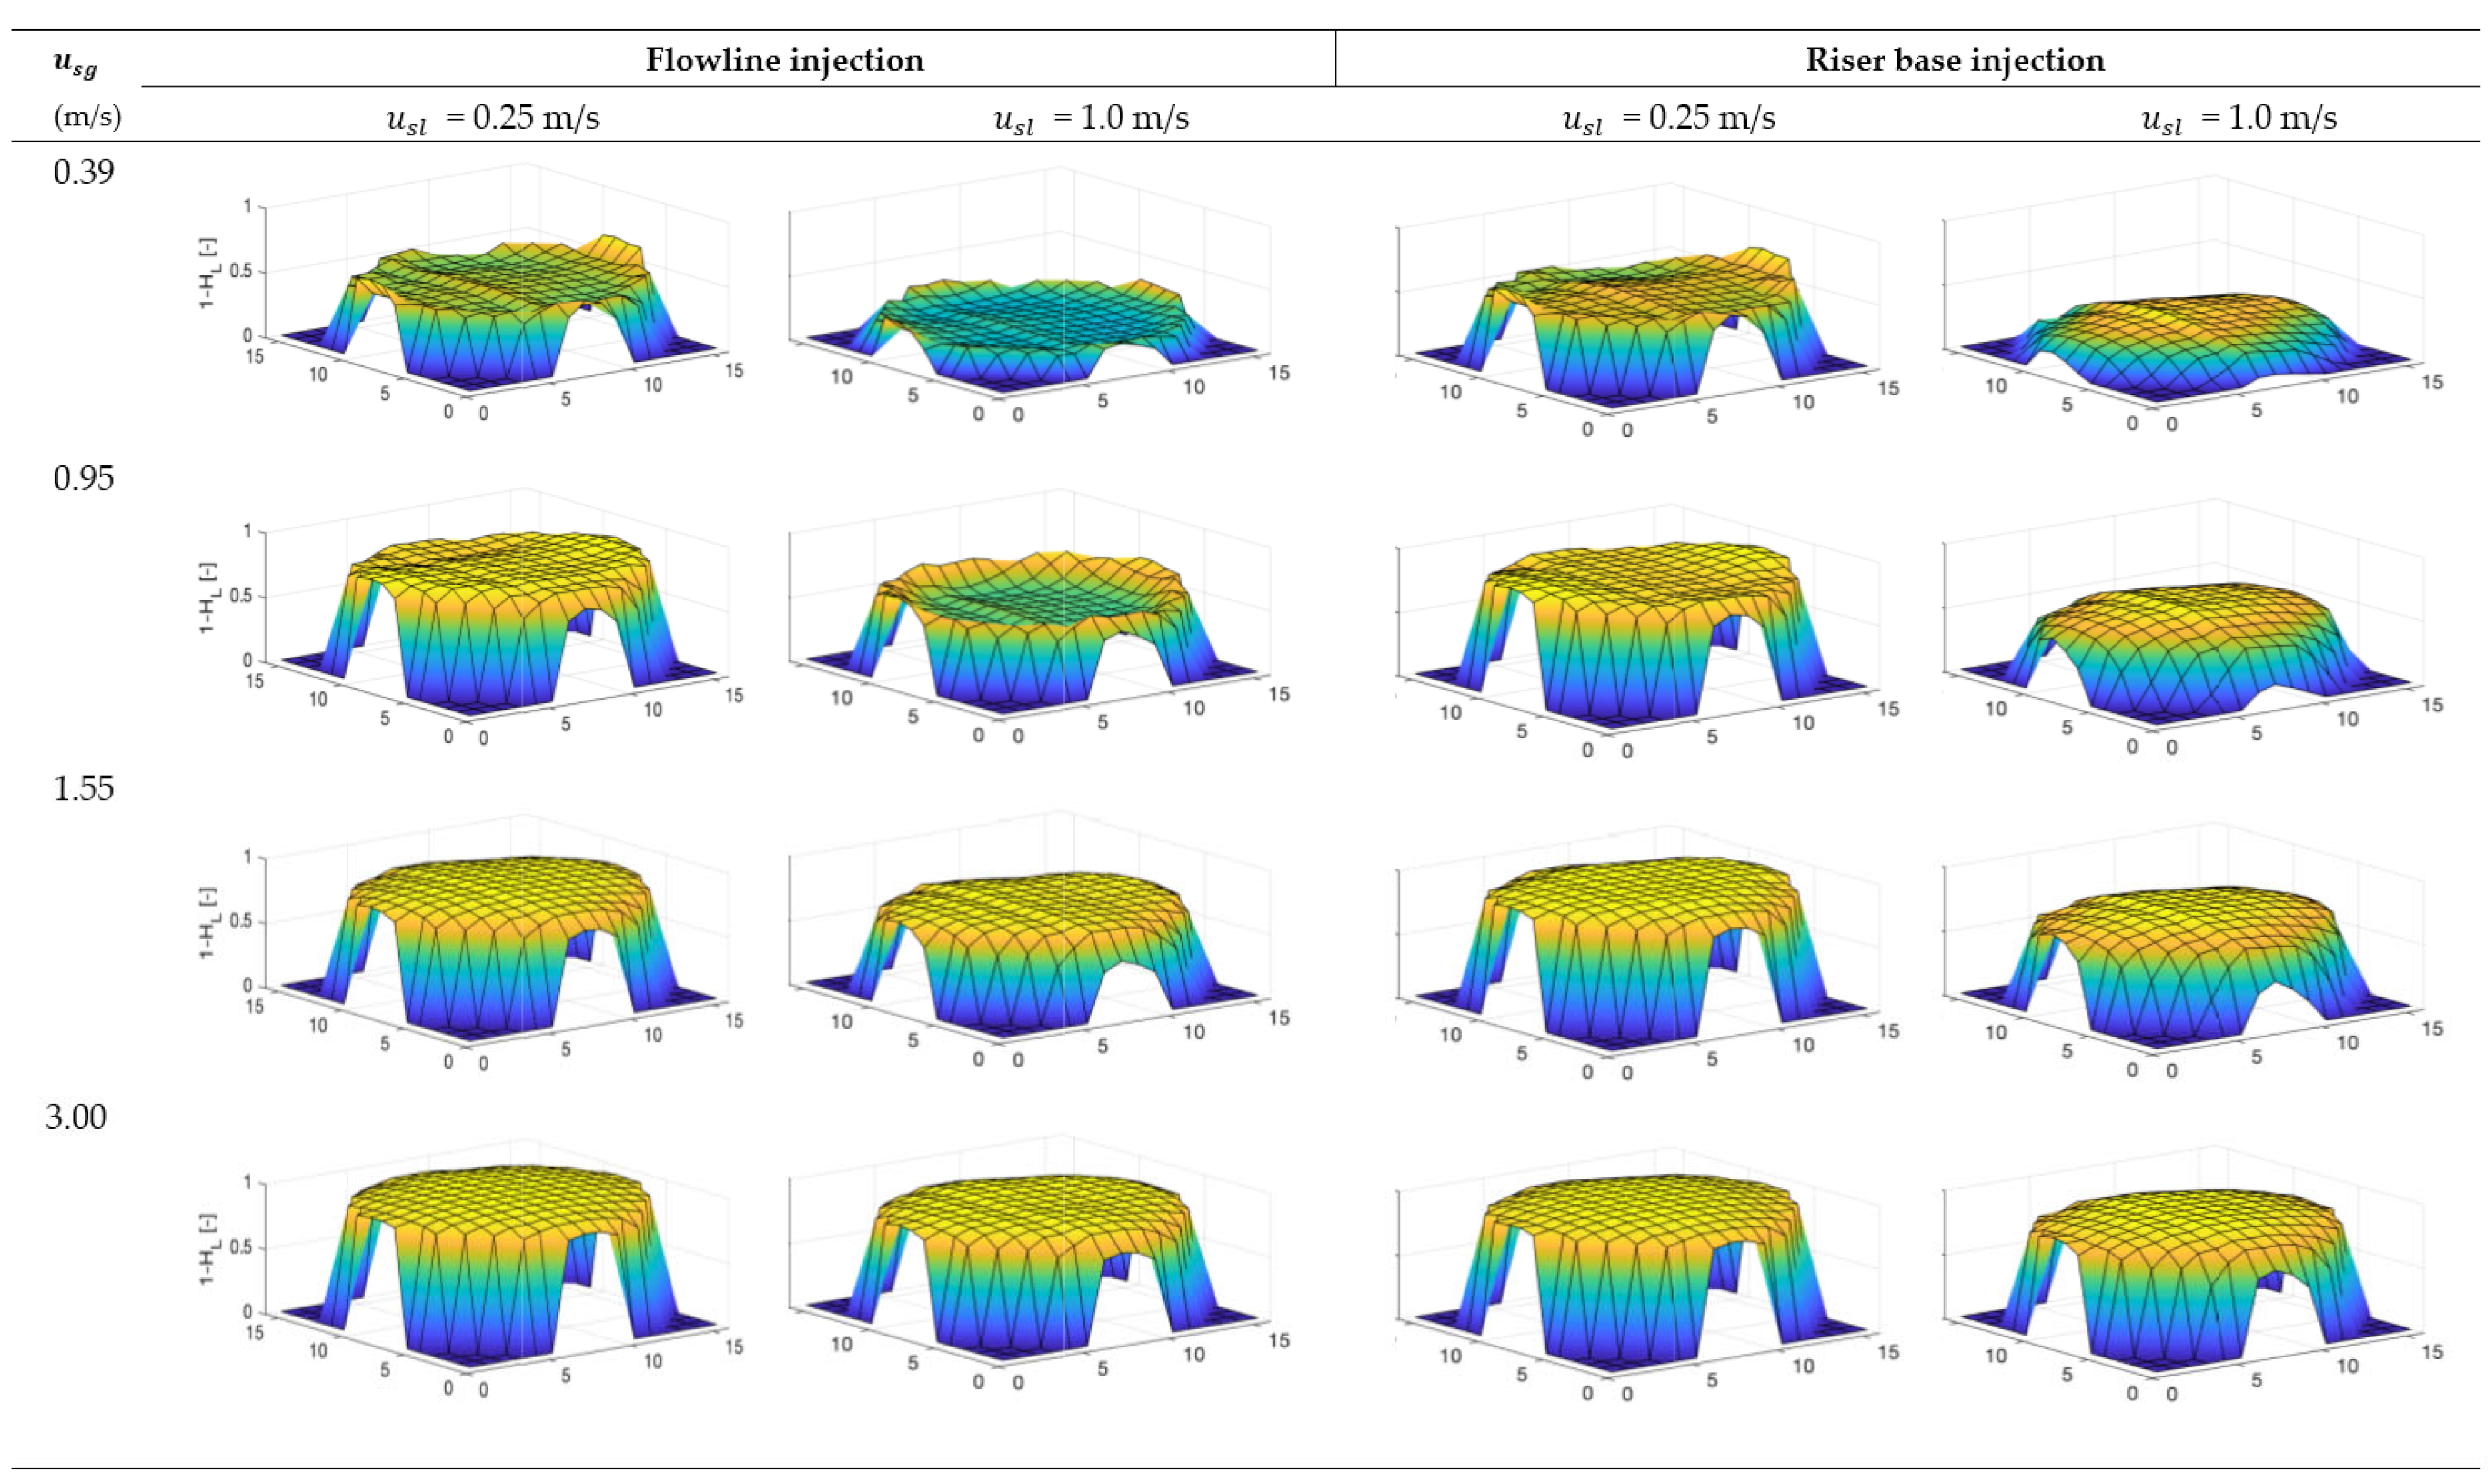
3.4. Peaking Behaviour of Holdup

To further visualise the effect of injection method on downstream void characteristics, three-dimensional surface plots have been produced from mean cross-sectional void data. These are shown in Figure 7. At the low u s l value of 0.25 m/s, irrespective of the magnitude of u s g , there is remarkable similarity in the profiles. Wall-peaking behaviour is exhibited at u s g = 0.39 and 0.95 m/s. However, there seems to be a transition to core-peaking void fraction as u s g reaches 1.55 m/s and it is attributable to the transition from bubbly to slug flow regime. Ogasawara et al. [33] noted that this phenomenon is closely related to a shear-induced lift force on bubbles that can have a surfactant-like effect on the wall. This can have important lubricating properties for gas lift and heavy oil transport purposes.
An increasingly marked difference is seen at the higher liquid flow condition of u s l = 1.0 m/s. While flowline injection shows similar behaviour as at low u s l values (wall- to core-peaking with increasing gas flow), the riser-base injection method exhibits distinctly clear core-peaking void profiles. This is because of the existence of larger bubbles that flow line injection induces, as clearly seen in the reconstructed images in Figure 4. The transition from horizontal to vertical flow in the flowline injection method induces increased turbulence due to the bend geometry, promoting bubble breakup and thus more dispersed bubbles. Conversely, the riser base injection case has no such encounter with such a geometrical transition. Instead, injected bubbles rise with a combination of buoyancy and the momentum flow of the primary liquid phase. Bubble coalescence is thus promoted rather than broken up, hence the resulting shape of the profiles observed. We note the importance of these observations being accounted for in the design of downstream facilities such as slug catchers/breakers. This should also be considered when designing downstream separators so that they are sufficiently sized and hence cope with the intermittent splashing or large liquid overflows that can occur, e.g., where flowline injection exists. An eventual consequence can be increased capital costs that may be unnecessarily incurred without adequate knowledge of resulting flow regimes because of the injection method.

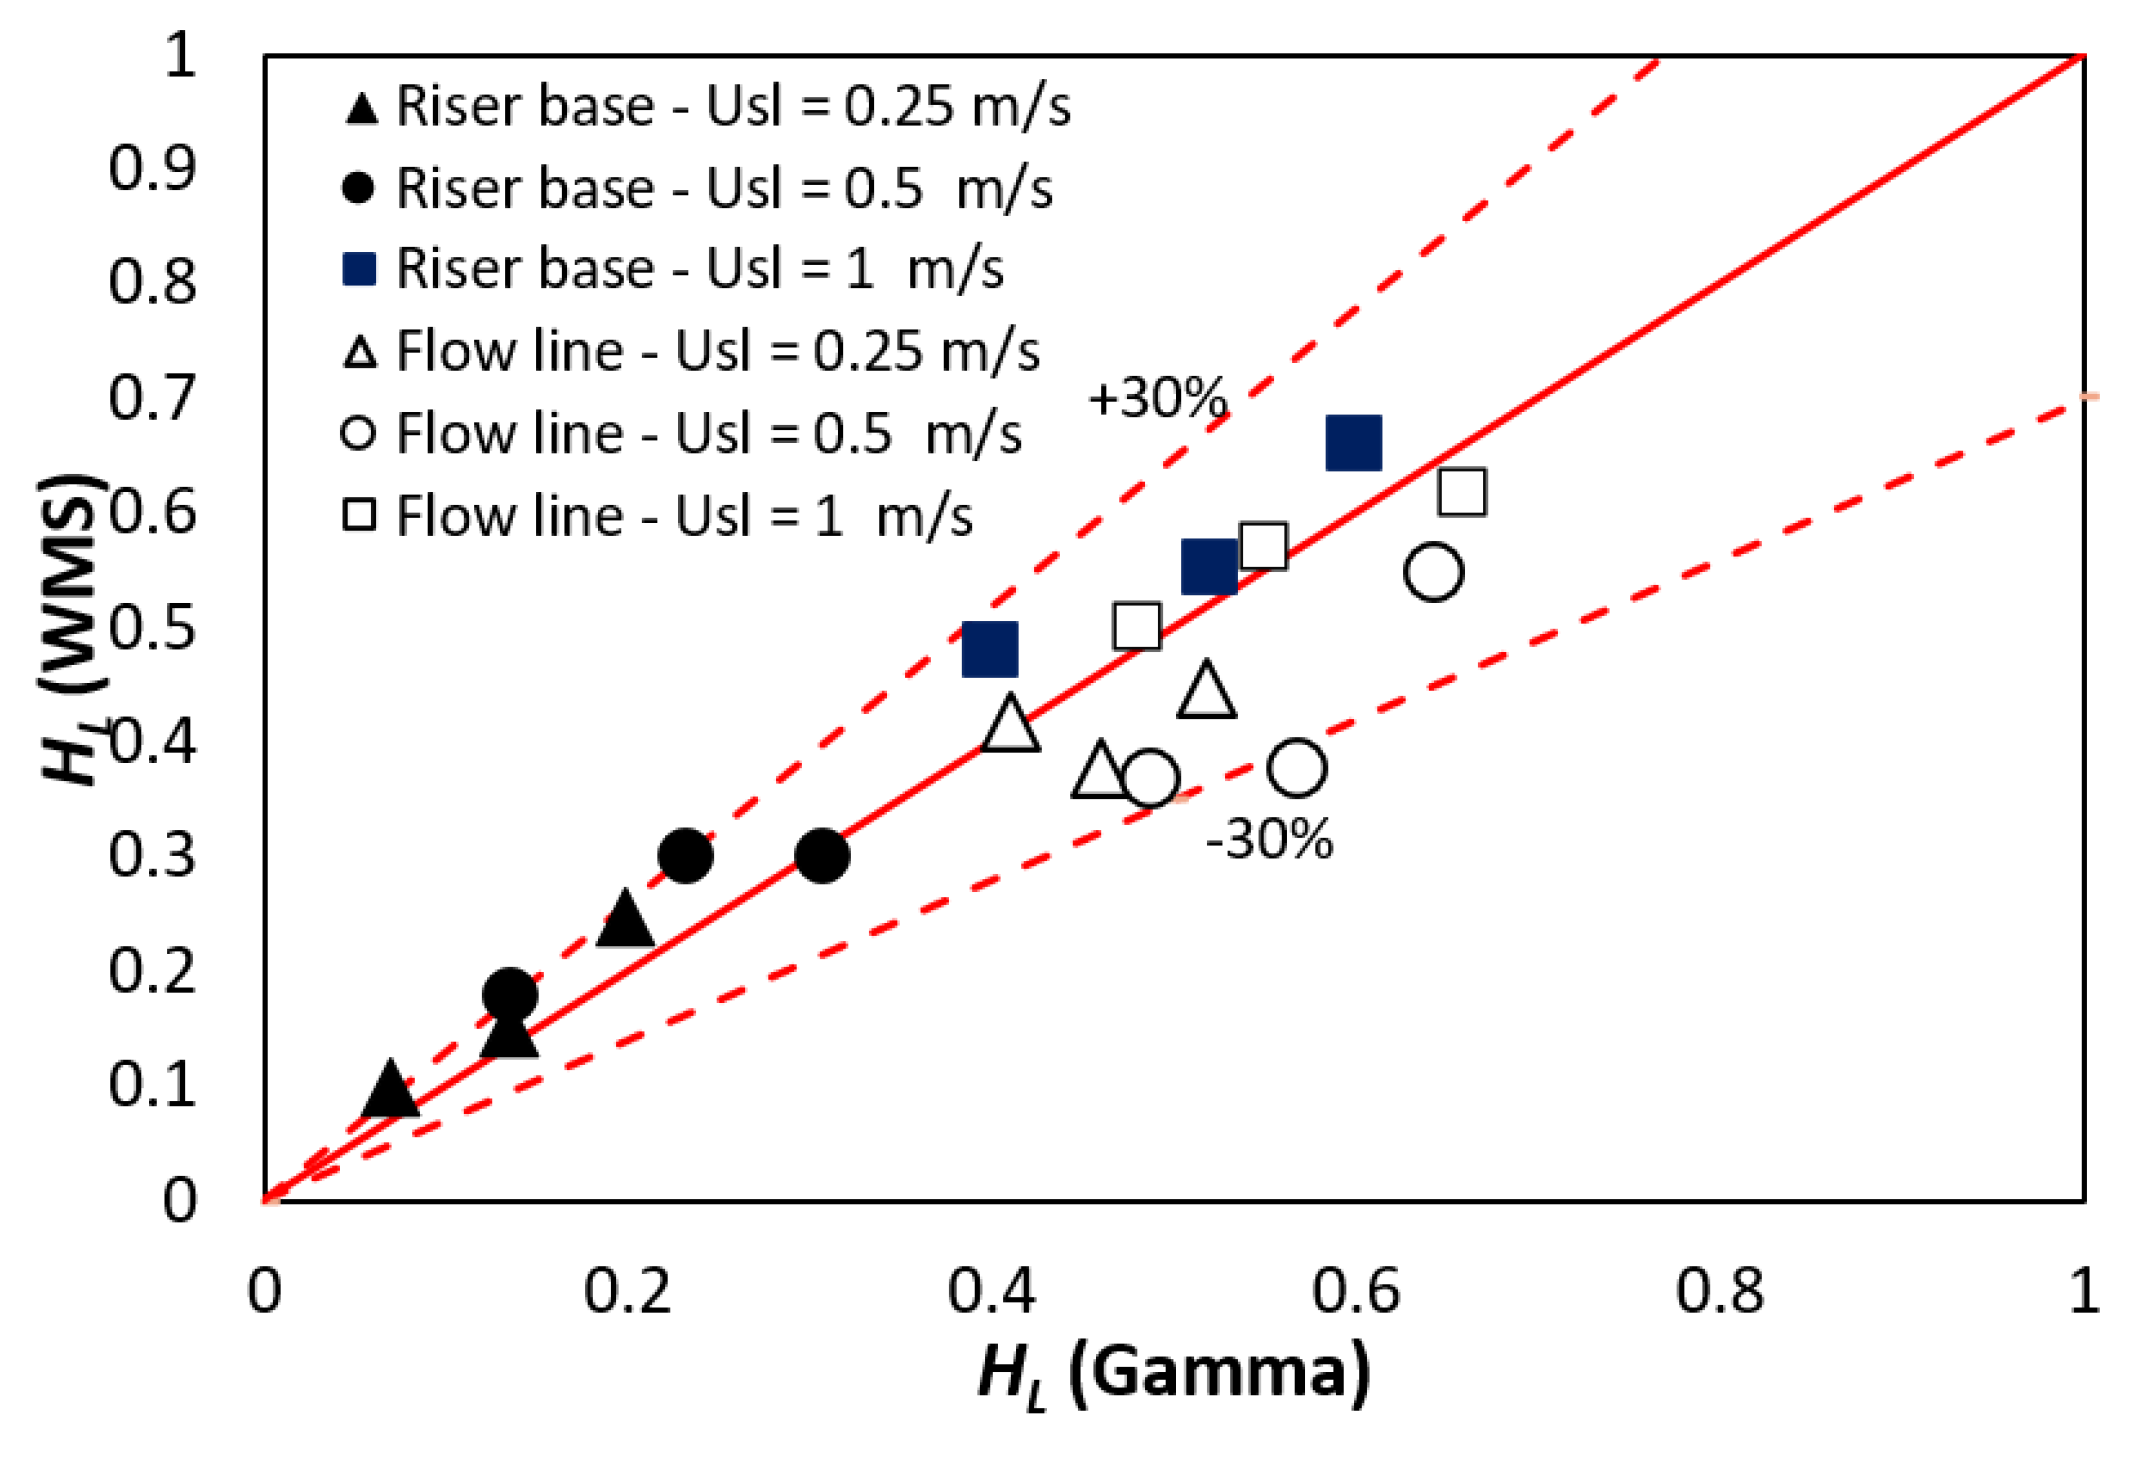
3.5. Analysis of Appropriate Correlations for Hold-Up Prediction

To determine the suitability of current methods in predicting the liquid holdup of the two injection methods, five void fraction correlations were sampled from the literature for a comparative analysis. The correlations are those of Lockhart and Martinelli [13], Nicklin et al. [34], Huq and Loth [20], Almabrok et al. [16], Gomez et al. [17], Woldesemayat and Ghajar [14] and the homogenous model. Figure 8a shows the predictions of these correlations compared with the experimental data for the flowline injection case. It is seen that most of the predictions by the models are within the ±30% error margins. Though the Woldesemayat and Ghajar [14] correlation was within the error band, it however has a very narrow range of holdup prediction of between 0.5 and 0.6, while the experimental data were between 0.35 and 0.75, and hence it must be used with caution despite having deviations well within ±30%.
The homogenous model produced massive overpredictions especially as lower liquid holdups corresponding to high gas flows. This is because of the large phase slip ratios at these conditions which the homogenous model ignores. Conversely, the Almabrok et al. [16] correlation greatly under-predicts at low holdups. This may be because of the correlation being developed exclusively for large pipes of 100 mm and above where the flow behaviour has been shown [35,36,37,38,39,40] to differ from those of small pipes.
The comparison between the models and the experimental data obtained for the riser base injection method is presented in Figure 7b. Unlike for the flowline injection, it can be seen that most of the models produced overpredictions. The Almabrok et al. [16] correlation, however, was the best performing, especially at higher holdups. This may be due to the riser base injection producing core-peaking voids as shown in Figure 7; the behaviour is very similar to those consistently obtained in large diameter pipes. In order to quantitatively evaluate the correlations’ predictions, two statistical tools were used, namely the root mean square and the mean percentage absolute errors. The mean square errors were calculated as follows:
R M S E = 1 N i = 1 N H L e x p ,   i H L c o r r ,   i 2
While the mean percentage mean absolute errors were calculated using:
M P A E = 1 N i = 1 N H L e x p ,   i H L c o r r ,   i × 100 %
where the subscripts “exp” and “corr” represent “experiment” and “correlation” respectively. Figure 9 depicts bar plots showing the RMSE and MPAE for the different correlations against the riser base and flowline injection holdups. As can be seen, the flow line injection generally shows lower RMSE and MPAE values for all cases. As mentioned in Section 3.4, flow line injection is more likely to produce more stabilised flow due to the additional horizontal development length before the instrumentation location at 138D from the riser base. As a result, the flow line case produces conditions similar to those used in developing the various correlations, which have up to 150D in flow development length.
In both riser base and flowline injection cases, the homogenous flow model is shown to give the largest MPAE and RMSE values. The Nicklin et al. [34], Huq & Loth [20] and Woldesemayat & Ghajar [14] models provide similar levels of prediction for the flow line injection method and are the best performing. In the case of the riser base injection method, Almabrok et al. [16] was the best performing in predicting H L , as shown by the MPAE and RMSE values. In essence, it can be concluded that the Huq & Loth and the Nicklin can be used with confidence for predicting flowline injected void fractions and holdups and can do so within ±30% error band. Conversely, none of the correlations can be used with confidence for riser base injection prediction except that of Almabrok et al. [16], which shows a remarkable accuracy, as shown by the MPAE and RMSE as well as its predictions being entirely within the ±30% error margin. Conclusively, this study has provided valuable information that can find wide use in the process of the design of process pipelines and downstream facilities, which include separators, surge tanks, and slug breaker units.

4. Conclusions

In this study, we have demonstrated an experimental comparative analysis of upstream injection methods, and their effects on the nature of phase distribution at the top end of a riser were investigated using two advanced instruments, namely a gamma densitometer system and a wire mesh sensor (WMS). Both systems were used to cross-validate each other’s measurements; the mean holdup showed that measurements by the WMS and gamma densitometer were within 30% of each other and their PDFs had remarkable similarities in shape. It was found that injection location strongly affects downstream fluid behaviour, which can have important implications for pumping and downstream facility design. Our findings showed that core-peaking liquid holdup occurs at the lower gas injection rates through the flowline, while wall-peaking holdup profiles were established at the same flow conditions for riser base injection. It has been noted that the phenomenon of wall-peaking holdup is closely related to shear-induced lift force on rising bubbles that can have a surfactant-like effect on the wall with important lubricating properties for gas lift or heavy oil transport. It can be assumed that even for low void fractions after an infinite riser length, the wall peaking could disappear due to bubble coalescence and hence more uniform void distributions or slight core peaking. In order to prove or disprove this hypothesis, further experiments will need to be carried out with different L/D ratios between gas injection and the measurement position to show that the flow is no longer developing beyond the L/D = 183 examined here. However, for cases where the downstream facilities are within a similar range of this study, the wall-peaking or core-peaking characteristics reported can be helpful. In conclusion, the study provides valuable information that can be utilised for the design of downstream facilities such as slug catchers and separators in industrial process systems.

Author Contributions

Conceptualisation, S.K.B.A.; Data curation, S.K.B.A.; Formal analysis, A.M.A.; Writing—original draft, S.K.B.A. and A.M.A.; Writing—review and editing, S.K.B.A., A.M.A., Y.D.B., M.A., R.O.A., L.L. and H.Y. All authors have read and agreed to the published version of the manuscript.

Funding

This research received no external funding.

Data Availability Statement

Data can be made available upon reasonable request.

Acknowledgments

The first author would like to acknowledge the support given by Sebha University. All authors sincerely acknowledge the PSE Laboratory staff at Cranfield University (especially Stan Collins and Kelvin White) for their tireless efforts during experimental campaigns.

Conflicts of Interest

The authors declare no conflict of interest.

References

  1. Guet, S.; Rodriguez, O.; Oliemans, R.; Brauner, N. An inverse dispersed multiphase flow model for liquid production rate determination. Int. J. Multiph. Flow 2006, 32, 553–567. [Google Scholar] [CrossRef]
  2. Hagedorn, A.R.; Brown, K.E. The Effect of Liquid Viscosity in Two-Phase Vertical Flow. J. Pet. Technol. 1964, 16, 203–210. [Google Scholar] [CrossRef]
  3. Szalinski, L.; Abdulkareem, L.; Da Silva, M.; Thiele, S.; Beyer, M.; Lucas, D.; Perez, V.H.; Hampel, U.; Azzopardi, B. Comparative study of gas–oil and gas–water two-phase flow in a vertical pipe. Chem. Eng. Sci. 2010, 65, 3836–3848. [Google Scholar] [CrossRef]
  4. Vishnyakov, V.; Suleimanov, B.; Salmanov, A.; Zeynalov, E. Water altering gas injection. In Primer on Enhanced Oil Recovery; Elsevier: Amsterdam, The Netherlands, 2020; pp. 127–139. [Google Scholar] [CrossRef]
  5. Descamps, M.; Oliemans, R.; Ooms, G.; Mudde, R.; Kusters, R. Influence of gas injection on phase inversion in an oil–water flow through a vertical tube. Int. J. Multiph. Flow 2006, 32, 311–322. [Google Scholar] [CrossRef]
  6. Sami, N.A.; Turzo, Z. Computational fluid dynamic (CFD) modelling of transient flow in the intermittent gas lift. Pet. Res. 2020, 5, 144–153. [Google Scholar] [CrossRef]
  7. Rodrigues, H.T.; Almeida, A.R.; Barrionuevo, D.C.; Fraga, R.S. Effect of the gas injection angle and configuration in the efficiency of gas lift. J. Pet. Sci. Eng. 2020, 198, 108126. [Google Scholar] [CrossRef]
  8. Guerra, L.; Temer, B.; Loureiro, J.; Freire, A.S. Experimental study of gas-lift systems with inclined gas jets. J. Pet. Sci. Eng. 2022, 216, 110749. [Google Scholar] [CrossRef]
  9. Rosettani, J.; Ahmed, W.; Geddis, P.; Wu, L.; Clements, B. Experimental and numerical investigation of gas-liquid metal two-phase flow pumping. Int. J. Thermofluids 2021, 10, 100092. [Google Scholar] [CrossRef]
  10. Archibong-Eso, A.; Aliyu, A.M.; Yan, W.; Okeke, N.E.; Baba, Y.D.; Fajemidupe, O.; Yeung, H. Experimental Study on Sand Transport Characteristics in Horizontal and Inclined Two-Phase Solid-Liquid Pipe Flow. J. Pipeline Syst. Eng. Pract. 2020, 11, 04019050. [Google Scholar] [CrossRef]
  11. Fajemidupe, O.T.; Aliyu, A.M.; Baba, Y.D.; Archibong-Eso, A.; Yeung, H. Sand minimum transport conditions in gas–solid–liquid three-phase stratified flow in a horizontal pipe at low particle concentrations. Chem. Eng. Res. Des. 2019, 143, 114–126. [Google Scholar] [CrossRef] [Green Version]
  12. Fajemidupe, O.T.; Aliyu, A.M.; Baba, Y.D.; Archibong-Eso, A.; Yeung, H. Minimum sand transport conditions in gas-solid-liquid three-phase stratified flow in horizontal pipelines. Chem. Eng. Res. Des. 2019, 143, 114–126. [Google Scholar] [CrossRef] [Green Version]
  13. Lockhart, R.; Martinelli, R. Proposed correlation of data for isothermal two-phase, two-component flow in pipes. Chem. Eng. Sci. 1949, 45, 39–48. [Google Scholar]
  14. Woldesemayat, M.A.; Ghajar, A.J. Comparison of void fraction correlations for different flow patterns in horizontal and upward inclined pipes. Int. J. Multiph. Flow 2007, 33, 347–370. [Google Scholar] [CrossRef]
  15. Zuber, N.; Findlay, J.A. Average Volumetric Concentration in Two-Phase Flow Systems. J. Heat Transf. 1965, 87, 453–468. [Google Scholar] [CrossRef]
  16. Almabrok, A.A.; Aliyu, A.M.; Baba, Y.D.; Lao, L.; Yeung, H.; Aliyu, A. Void fraction development in gas-liquid flow after a U-bend in a vertically upwards serpentine-configuration large-diameter pipe. Heat Mass Transf. 2017, 54, 209–226. [Google Scholar] [CrossRef] [Green Version]
  17. Gomez, L.; Shoham, O.; Taitel, Y. Prediction of slug liquid holdup: Horizontal to upward vertical flow. Int. J. Multiph. Flow 2000, 26, 517–521. [Google Scholar] [CrossRef]
  18. Pietrzak, M.; Płaczek, M. Void fraction predictive methods in two-phase flow across a small diameter channel. Int. J. Multiph. Flow 2019, 121, 103115. [Google Scholar] [CrossRef]
  19. Butterworth, D. A comparison of some void-fraction relationships for co-current gas-liquid flow. Int. J. Multiph. Flow 1975, 1, 845–850. [Google Scholar] [CrossRef]
  20. Huq, R.; Loth, J.L. Analytical two-phase flow void prediction method. J. Thermophys. Heat Transf. 1992, 6, 139–144. [Google Scholar] [CrossRef]
  21. Da Silva, M.J.; Thiele, S.; Abdulkareem, L.A.; Azzopardi, B.J.; Hampel, U. High-resolution oil–gas two-phase flow measurement with a new capacitance wire-mesh tomography. Flow Meas. Instrum. 2010, 21, 191–197. [Google Scholar] [CrossRef]
  22. Tesi, A. Multiphase Flow Measurement Using Gamma-Based Techniques. Ph.D. Thesis, Cranfield University, Bedford, UK, 2011. [Google Scholar]
  23. Abdulkadir, M.; Abdulahi, A.; Eastwick, C.N.; Azzopardi, B.J.; Smith, I.E.; Unander, T.E.; Mukhtar, A. Investigating the effect of pressure on a vertical two-phase upward flow with a high viscosity liquid. AIChE J. 2019, 66, e16860. [Google Scholar] [CrossRef]
  24. Abdulkadir, M.; Jatto, D.; Abdulkareem, L.; Zhao, D. Pressure drop, void fraction and flow pattern of vertical air–silicone oil flows using differential pressure transducer and advanced instrumentation. Chem. Eng. Res. Des. 2020, 159, 262–277. [Google Scholar] [CrossRef]
  25. Prasser, H.-M.; Misawa, M.; Tiseanu, I. Comparison between wire-mesh sensor and ultra-fast X-ray tomograph for an air–water flow in a vertical pipe. Flow Meas. Instrum. 2005, 16, 73–83. [Google Scholar] [CrossRef]
  26. Da Silva, M.J.; Schleicher, E.; Hampel, U. Capacitance wire-mesh sensor for fast measurement of phase fraction distributions. Meas. Sci. Technol. 2007, 18, 2245–2251. [Google Scholar] [CrossRef]
  27. Baba, Y.D.; Aliyu, A.M.; Archibong, A.-E.; Almabrok, A.A.; Igbafe, A.I.; Aliyu, A. Study of high viscous multiphase phase flow in a horizontal pipe. Heat Mass Transf. 2017, 54, 651–669. [Google Scholar] [CrossRef]
  28. Ahmed, S.K.B.; Aliyu, A.M.; Ehinmowo, A.; Yeung, H. Effect of riser base and flowline gas injection on the characteristics of gas-liquid two-phase flow in a vertical riser system. In Proceedings of the SPE Nigeria Annual International Conference and Exhibition, Virtual, 11–13 August 2020; OnePetro: Houston, TX, USA, 2020. [Google Scholar] [CrossRef]
  29. Ahmed, S.K.B.; Lao, L.; Yeung, H. Liquid/gas flows and development on riser: Upstream effect. In Proceedings of the International Conference on Multiphase Flow, Jeju, Korea, 26–31 May 2013; pp. 1–10. [Google Scholar]
  30. Aliyu, A.M.; Baba, Y.D.; Lao, L.; Yeung, H.; Kim, K.C. Interfacial friction in upward annular gas–liquid two-phase flow in pipes. Exp. Therm. Fluid Sci. 2017, 84, 90–109. [Google Scholar] [CrossRef]
  31. Stahl, P.; von Rohr, P.R. On the accuracy of void fraction measurements by single-beam gamma-densitometry for gas–liquid two-phase flows in pipes. Exp. Therm. Fluid Sci. 2003, 28, 533–544. [Google Scholar] [CrossRef]
  32. Prasser, H.-M.; Häfeli, R. Signal response of wire-mesh sensors to an idealized bubbly flow. Nucl. Eng. Des. 2018, 336, 3–14. [Google Scholar] [CrossRef]
  33. Ogasawara, T.; Takagi, S.; Matsumoto, Y. Influence of local void fraction distribution on turbulent structure of upward bubbly flow in vertical channel. J. Phys. Conf. Ser. 2009, 147, 012027. [Google Scholar] [CrossRef]
  34. Nicklin, D.J.; Wilkes, J.C.; Davidson, J.F. Two-phase flow in vertical tubes. Trans. Inst. Chem. Eng. 1962, 40, 61–68. [Google Scholar]
  35. Aliyu, A.M. Vertical Annular Gas-Liquid Two-Phase Flow in Large Diameter Pipes. Ph.D. Thesis, Cranfield University, Bedford, UK, 2015. [Google Scholar]
  36. Aliyu, A.M.; Kim, Y.K.; Choi, S.H.; Ahn, J.H.; Kim, K.C. Development of a dual optical fiber probe for the hydrodynamic investigation of a horizontal annular drive gas/liquid ejector. Flow Meas. Instrum. 2017, 56, 45–55. [Google Scholar] [CrossRef]
  37. Lao, L.; Xing, L.; Yeung, H. Behaviours of elongated bubbles in a large diameter riser. In Proceedings of the 8th North American Conference on Multiphase Technology, Banff, AB, Canada, 20–22 June 2012; OnePetro: Houston, TX, USA, 2012; pp. 381–392. Available online: www.onepetro.org/conference-paper/BHR-2012-A026 (accessed on 15 January 2022).
  38. Omebere-Iyari, N.K. The effect of pipe diameter and pressure in vertical two-phase flow. Ph.D. Thesis, University of Nottingham, Nottingham, UK, 2006. [Google Scholar]
  39. Aliyu, A.M.; Seo, H.; Kim, H.; Kim, K.C. Characteristics of bubble-induced liquid flows in a rectangular tank. Exp. Therm. Fluid Sci. 2018, 97, 21–35. [Google Scholar] [CrossRef]
  40. Kaji, R.; Azzopardi, B. The effect of pipe diameter on the structure of gas/liquid flow in vertical pipes. Int. J. Multiph. Flow 2010, 36, 303–313. [Google Scholar] [CrossRef]
Figure 1. (a) Schematic of the test facility at Cranfield University. Images in insets shows the WMS used and circumferential air inlet for the riser base injection. The variable D is the internal pipeline diameter. (b) Actual photo of 52 mm experimental facility.
Energies 15 07446 g001
Figure 2. (a) Image showing 16 × 16 WMS, (b) the WMS installed on the riser showing the transmitter and receiver units (c) The capacitance WMS electronic box (model used is CAP 200).
Energies 15 07446 g002
Figure 3. Cross validation of gamma densitometer and WMS mean liquid holdups at various u s l conditions for both the flowline and riser base injections.
Energies 15 07446 g003
Figure 4. Flow regime map for air-water flow at top of the riser, (a) flowline and (b) riser base gas injection. All reconstructed images on the right are for u s l = 1.0 m/s.
Energies 15 07446 g004aEnergies 15 07446 g004b
Figure 5. WMS PDFs of holdup for u s l = 1 m/s and u s g = 0.39–3.00 m/s. (ad) flowline injection (eh) riser base injection.
Energies 15 07446 g005
Figure 6. Trends of mean gamma densitometer liquid holdup with superficial gas velocity for (a) u s l = 0.25 m/s (b) u s l = 0.5 m/s (c) u s l = 1 m/s (d) u s l = 2 m/s.
Energies 15 07446 g006aEnergies 15 07446 g006b
Figure 7. Surface plots of 1 H L profiles for the riser base and flowline injection methods at u s g = 0.25 and 1.0 m/s for u s l = 0.39–3.00 m/s.
Energies 15 07446 g007
Figure 8. Comparison of predictions by various correlations and experimental H L for (a) flowline (b) riser base injection [13,14,16,17,20,34].
Energies 15 07446 g008
Figure 9. Mean square and mean percentage absolute errors for the various model predictions compared with the current experimental liquid holdups for the riser base and flow line injection methods [13,14,16,17,20,34] (a) RMSE for riser base (b) RMSE for flow line (c) MPAE for riser base (d) MPAE for flow line.
Energies 15 07446 g009aEnergies 15 07446 g009b
Table 1. Summary of correlations for liquid holdup/void fraction prediction.
Author(s)Equation and CommentsEqn.
Homogenous model (see Woldesemayat & Ghajar [14] and Pietrzak & Placzek [18]) α = 1 + 1 x x ρ g ρ L 1 (2)
Developed for low gas volume fraction dispersed phase where the slip with the continuous phase is small. It is pipe inclination independent.
Lockhart & Martinelli [13] (see Butterworth [19]) α = 1 + 0.28 1 x x 0.64 ρ g ρ l 0.36 μ l μ g 0.07 1 (3)
The Lockhart–Martinelli is one of the most-used empirical correlations for two-phase flows and pressure drop in pipes. Combinations of fluids used by Lockhart & Martinelli to generate their original model include air/water, air/various oils; and pipes of diameters that range between 1.5 and 25 mm. Butterworth [19] showed that the Lockhart–Martinelli parameter X can be used to derive Equation (3).
Huq & Loth [20] α = 1 2 1 x 2 1 2 x + 1 + 4 x 1 x ρ l ρ g 1 0.5 (4)
Huq & Loth’s analytical model is for predicting the lower limit of void fraction as a function of gas quality and system pressure in vertical pipes.
Almabrok et al. [16] α = u s g 1.028 u m + 0.35 g σ Δ ρ ρ l 2 (5)
Almabrok and co-workers obtained the void fraction equation from the regression of 347 data points from vertical large pipes of diameter 101.6, 127, 152, and 203 mm from air/water studies covering bubbly, churn, and annular flows.
Gomez et al. [17] H L = e 0.4 θ + 2.48 × 10 6 R e l (6)
where θ is the inclination angle and the equation is valid for 0 < θ < 1.57 . Total of 283 data points for horizontal and vertical pipes with diameters ranging from 51 to 203 mm. Fluid combinations include air/oil, air/kerosene, air/water, nitrogen/diesel, and Freon/water.
Woldesemayat & Ghajar [14] α = u s g u s g 1 + u s l u s g ρ g ρ l 0.1 + 2.9 g D σ 1 + c o s θ ρ l ρ g ρ l 2 0.25 1.22 + 1.22 s i n θ P a t m P s y s t e m (7)
2700 data points were used comprising horizontal, inclined and vertical flow, for air/water, air/kerosene mixtures. Pipe diameters ranged between 12- and 78-mm. Correlation was obtained by modifying Dix’s and others [21] correlation to account for operating pressure and pipe inclination.
Publisher’s Note: MDPI stays neutral with regard to jurisdictional claims in published maps and institutional affiliations.

