
An Intelligent Data-Driven Approach for Electrical Energy Load Management Using Machine Learning Algorithms


Abstract
:1. Introduction
2. Literature Review
3. Gap Analysis
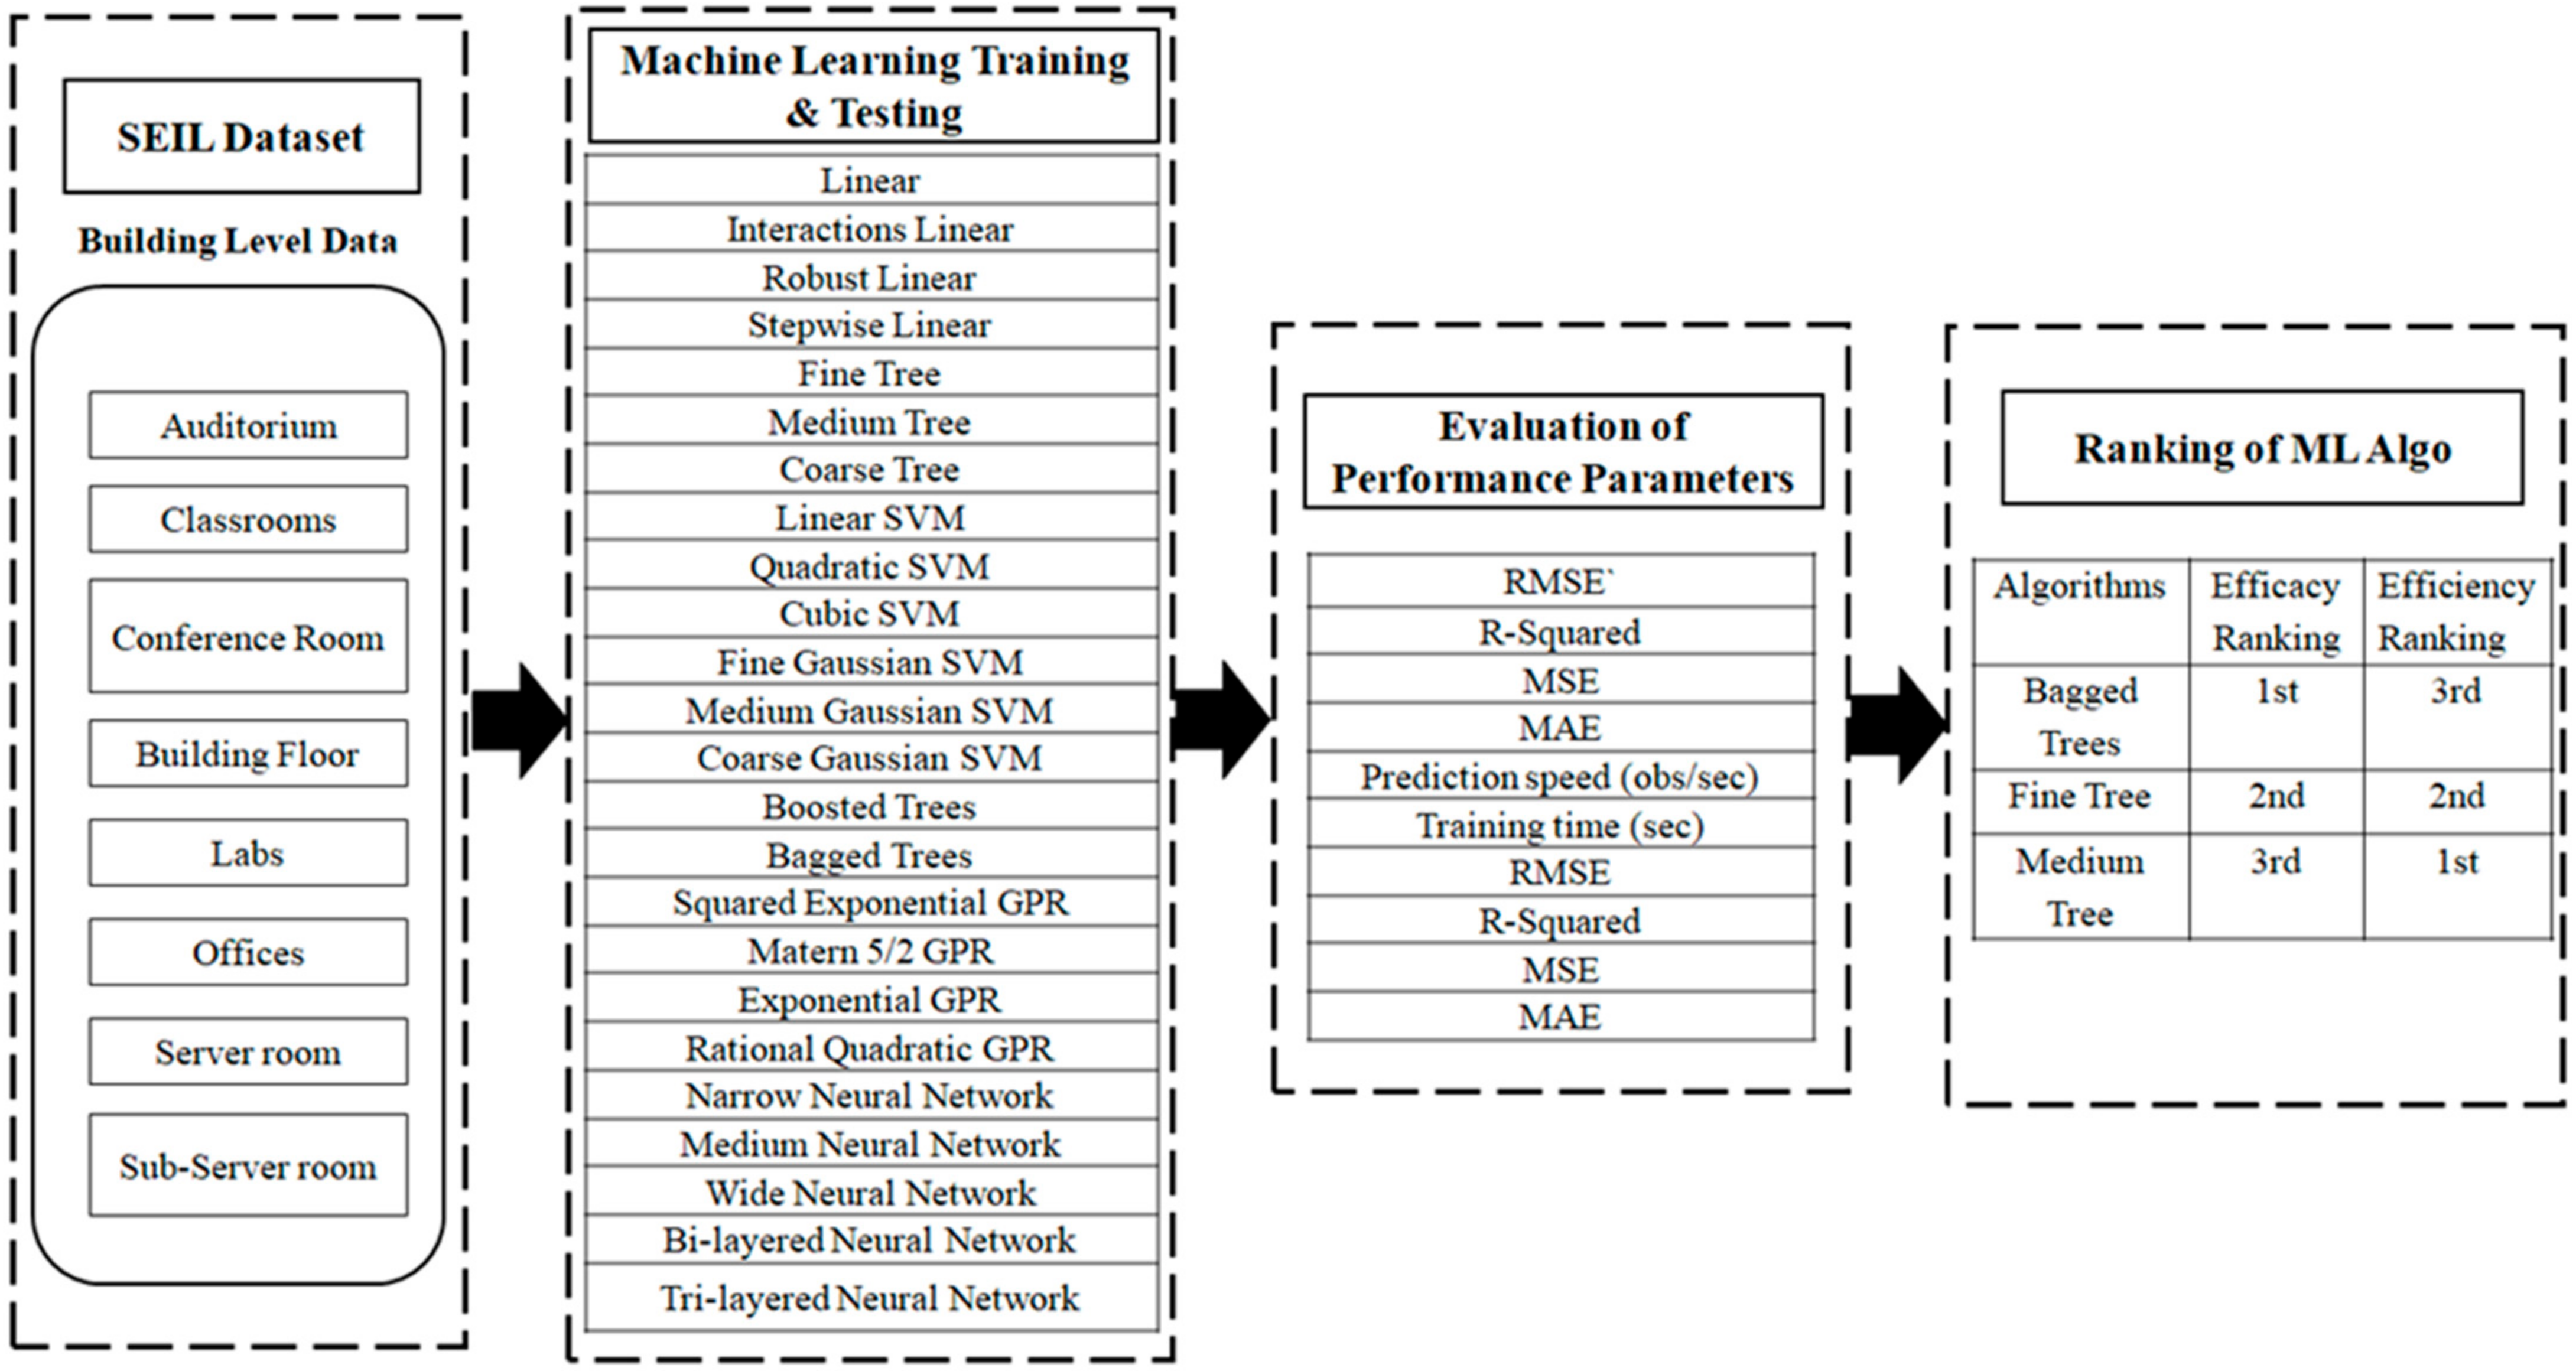
4. Dataset Description and System Setup
5. Methodology
6. Results
7. Discussion
8. Conclusions
Author Contributions
Funding
Institutional Review Board Statement
Informed Consent Statement
Data Availability Statement
Conflicts of Interest
References
- Tian, J.; Li, K.; Xue, W. An adaptive ensemble predictive strategy for multiple scale electrical energy usages forecasting. Sustain. Cities Soc. 2021, 66, 102654. [Google Scholar] [CrossRef]
- Sepehr, M.; Eghtedaei, R.; Toolabimoghadam, A.; Noorollahi, Y.; Mohammadi, M. Modeling the electrical energy consumption profile for residential buildings in Iran. Sustain. Cities Soc. 2018, 41, 481–489. [Google Scholar] [CrossRef]
- Spandagos, C.; Ng, T.L. Equivalent full-load hours for assessing climate change impact on building cooling and heating energy consumption in large Asian cities. Appl. Energy 2017, 189, 352–368. [Google Scholar] [CrossRef]
- Somu, N.; Gauthama, R.M.R.; Ramamritham, K. A hybrid model for building energy consumption forecasting using long short term memory networks. Appl. Energy 2020, 261, 114131. [Google Scholar] [CrossRef]
- Batlle, E.A.O.; Palacio, J.C.E.; Lora, E.E.S.; Reyes, A.M.M.; Moreno, M.M.; Morejón, M.B. A methodology to estimate baseline energy use and quantify savings in electrical energy consumption in higher education institution buildings: Case study, Federal University of Itajubá (UNIFEI). J. Clean. Prod. 2020, 244, 118551. [Google Scholar] [CrossRef]
- He, F.; Zhou, J.; Feng, Z.-k.; Liu, G.; Yang, Y. A hybrid short-term load forecasting model based on variational mode decomposition and long short-term memory networks considering relevant factors with Bayesian optimization algorithm. Appl. Energy 2019, 237, 103–116. [Google Scholar] [CrossRef]
- Zhong, H.; Wang, J.; Jia, H.; Mu, Y.; Lv, S. Vector field-based support vector regression for building energy consumption prediction. Appl. Energy 2019, 242, 403–414. [Google Scholar] [CrossRef]
- Wang, R.; Wang, J.; Xu, Y. A novel combined model based on hybrid optimization algorithm for electrical load forecasting. Appl. Soft Comput. 2019, 82, 105548. [Google Scholar] [CrossRef]
- Li, C.; Tang, M.; Zhang, G.; Wang, R.; Tian, C. A hybrid short-term building electrical load forecasting model combining the periodic pattern, fuzzy system, and wavelet transform. Int. J. Fuzzy Syst. 2020, 22, 156–171. [Google Scholar] [CrossRef]
- Ahmad, T.; Chen, H.; Guo, Y.; Wang, J. A comprehensive overview on the data driven and large scale based approaches for forecasting of building energy demand: A review. Energy Build. 2018, 165, 301–320. [Google Scholar] [CrossRef]
- Wei, Y.; Zhang, X.; Shi, Y.; Xia, L.; Pan, S.; Wu, J.; Han, M.; Zhao, X. A review of data-driven approaches for prediction and classification of building energy consumption. Renew. Sustain. Energy Rev. 2018, 82, 1027–1047. [Google Scholar] [CrossRef]
- Amasyali, K.; El-Gohary, N.M. A review of data-driven building energy consumption prediction studies. Renew. Sustain. Energy Rev. 2018, 81, 1192–1205. [Google Scholar] [CrossRef]
- Wang, Y.; Yang, D.; Zhang, X.; Chen, Z. Probability based remaining capacity estimation using data-driven and neural network model. J. Power Sources 2016, 315, 199–208. [Google Scholar] [CrossRef]
- Koschwitz, D.; Frisch, J.; van Treeck, C. Data-driven heating and cooling load predictions for non-residential buildings based on support vector machine regression and NARX Recurrent Neural Network: A comparative study on district scale. Energy 2018, 165, 134–142. [Google Scholar] [CrossRef]
- Smarra, F.; Jain, A.; de Rubeis, T.; Ambrosini, D.; D’Innocenzo, A.; Mangharam, R. Data-driven model predictive control using random forests for building energy optimization and climate control. Appl. Energy 2018, 226, 1252–1272. [Google Scholar] [CrossRef] [Green Version]
- Johannesen, N.J.; Kolhe, M.; Goodwin, M. Relative evaluation of regression tools for urban area electrical energy demand forecasting. J. Clean. Prod. 2019, 218, 555–564. [Google Scholar] [CrossRef]
- Jain, R.K.; Smith, K.M.; Culligan, P.J.; Taylor, J.E. Forecasting energy consumption of multi-family residential buildings using support vector regression: Investigating the impact of temporal and spatial monitoring granularity on performance accuracy. Appl. Energy 2014, 123, 168–178. [Google Scholar] [CrossRef]
- Moon, J.; Park, J.; Hwang, E.; Jun, S. Forecasting power consumption for higher educational institutions based on machine learning. J. Supercomput. 2018, 74, 3778–3800. [Google Scholar] [CrossRef]
- Chou, J.-S.; Tran, D.-S. Forecasting energy consumption time series using machine learning techniques based on usage patterns of residential householders. Energy 2018, 165, 709–726. [Google Scholar] [CrossRef]
- Li, K.; Xie, X.; Xue, W.; Dai, X.; Chen, X.; Yang, X. A hybrid teaching-learning artificial neural network for building electrical energy consumption prediction. Energy Build. 2018, 174, 323–334. [Google Scholar] [CrossRef]
- Khan, P.W.; Byun, Y.-C.; Lee, S.-J.; Park, N. Machine learning based hybrid system for imputation and efficient energy demand forecasting. Energies 2020, 13, 2681. [Google Scholar]
- Ahmad, T.; Chen, H. A review on machine learning forecasting growth trends and their real-time applications in different energy systems. Sustain. Cities Soc. 2020, 54, 102010. [Google Scholar] [CrossRef]
- Akhtar, S.; Sujod, M.Z.B.; Rizvi, S.S.H. A Hybrid Soft Computing Framework for Electrical Energy Optimization. In Proceedings of the 2021 6th International Multi-Topic ICT Conference (IMTIC), Lahore, Pakistan, 14 November 2021. [Google Scholar]
- Akhtar, S.; Sujod, M.Z.b.; Rizvi, S.S.H. A Novel Deep Learning Architecture for Data-Driven Energy Efficiency Management (D2 EEM)-Systematic Survey. In Proceedings of the 2021 International Conference on Engineering and Emerging Technologies (ICEET), Tianjin, China, 1–3 July 2021. [Google Scholar]
- Zhang, Q.; Yang, L.T.; Chen, Z.; Li, P. A survey on deep learning for big data. Inf. Fusion 2018, 42, 146–157. [Google Scholar] [CrossRef]
- Li, Y.; Hang, C.; Ding, L.; Pan, Y.; Gao, X. Deep learning in bioinformatics: Introduction, application, and perspective in the big data era. Methods 2019, 166, 4–21. [Google Scholar] [CrossRef] [Green Version]
- Wang, H.; Lei, Z.; Zhang, X.; Zhou, B.; Peng, J. A review of deep learning for renewable energy forecasting. Energy Convers. Manag. 2019, 198, 111799. [Google Scholar] [CrossRef]
- Manic, M.; Amarasinghe, K.; Rodriguez-Andina, J.J.; Rieger, C. Intelligent buildings of the future: Cyber aware, deep learning-powered, and human interacting. IEEE Ind. Electron. Mag. 2016, 10, 32–49. [Google Scholar] [CrossRef]
- Marino, D.L.; Amarasinghe, K.; Manic, M. Building energy load forecasting using deep neural networks. In Proceedings of the IEEE IECON 2016—42nd Annual Conference of the IEEE Industrial Electronics Society, Florence, Italy, 23–26 October 2016. [Google Scholar]
- Grolinger, K.; Capretz, M.A.M.; Seewald, L. Energy consumption prediction with big data: Balancing prediction accuracy and computational resources. In Proceedings of the 2016 IEEE International Congress on Big Data (BigData Congress), San Francisco, CA, USA, 27 June–2 July 2016. [Google Scholar]
- Mocanu, E.; Nguyen, P.H.; Gibescu, M.; Larsen, E.M.; Pinson, P. Demand forecasting at low aggregation levels using factored conditionally restricted Boltzmann machine. In Proceedings of the IEEE 2016 Power Systems Computation Conference (PSCC), Genoa, Italy, 20–24 June 2016. [Google Scholar]
- Amarasinghe, K.; Marino, D.L.; Manic, M. Deep neural networks for energy load forecasting. In Proceedings of the 2017 IEEE 26th International Symposium on Industrial Electronics (ISIE), Edinburgh, UK, 19–21 June 2017. [Google Scholar]
- Paterakis, N.G.; Mocanu, E.; Gibescu, M.; Stappers, B.; van Last, W. Deep learning versus traditional machine learning methods for aggregated energy demand prediction. In Proceedings of the 2017 IEEE PES Innovative Smart Grid Technologies Conference Europe (ISGT-Europe), Torino, Italy, 26–29 September 2017. [Google Scholar]
- Chen, Y.; Shi, Y.; Zhang, B. Modeling and optimization of complex building energy systems with deepneural networks. In Proceedings of the IEEE 2017 51st Asilomar Conference on Signals, Systems, and Computers, Pacific Grove, CA, USA, 29 October–1 November 2017. [Google Scholar]
- Mocanu, E.; Mocanu, D.C.; Nguyen, P.H.; Liotta, A.; Webber, M.E.; Gibescu, M.; Slootweg, J.G. On-line building energy optimization using deep reinforcement learning. IEEE Trans. Smart Grid 2018, 10, 3698–3708. [Google Scholar] [CrossRef] [Green Version]
- Nichiforov, C.; Stamatescu, G.; Stamatescu, I.; Calofir, V.; Fagarasan, I.; Iliescu, S.S. Deep learning techniques for load forecasting in large commercial buildings. In Proceedings of the IEEE 2018 22nd International Conference on System Theory, Control and Computing (ICSTCC), Sinaia, Romania, 10–12 October 2018. [Google Scholar]
- Afrasiabi, M.; Mohammadi, M.; Rastegar, M.; Kargarian, A. Multi-agent microgrid energy management based on deep learning forecaster. Energy 2019, 186, 115873. [Google Scholar] [CrossRef]
- Ahmad, T.; Chen, H. Deep learning for multi-scale smart energy forecasting. Energy 2019, 175, 98–112. [Google Scholar] [CrossRef]
- Hafeez, G.; Alimgeer, K.S.; Wadud, Z.; Shafiq, Z.; Khan, M.U.A.; Khan, I.; Khan, F.A.; Derhab, A. A Novel Accurate and Fast Converging Deep Learning-Based Model for Electrical Energy Consumption Forecasting in a Smart Grid. Energies 2020, 13, 2244. [Google Scholar] [CrossRef]
- Han, T.; Muhammad, K.; Hussain, T.; Lloret, J.; Baik, S.W. An Efficient Deep Learning Framework for Intelligent Energy Management in IoT Networks. IEEE Internet Things J. 2020, 8, 3170–3179. [Google Scholar] [CrossRef]
- Khan, Z.A.; Ullah, A.; Ullah, W.; Rho, S.; Lee, M.; Baik, S.W. Electrical Energy Prediction in Residential Buildings for Short-Term Horizons Using Hybrid Deep Learning Strategy. Appl. Sci. 2020, 10, 8634. [Google Scholar] [CrossRef]
- Elsisi, M.; Tran, M.-Q.; Mahmoud, K.; Lehtonen, M.; Darwish, M.M.F. Deep learning-based industry 4.0 and internet of things towards effective energy management for smart buildings. Sensors 2021, 21, 1038. [Google Scholar] [CrossRef] [PubMed]
- Truong, L.H.M.; Chow, K.H.K.; Luevisadpaibul, R.; Thirunavukkarasu, G.S.; Seyedmahmoudian, M.; Horan, B.; Mekhilef, S.; Stojcevski, A. Accurate Prediction of Hourly Energy Consumption in a Residential Building Based on the Occupancy Rate Using Machine Learning Approaches. Appl. Sci. 2021, 11, 2229. [Google Scholar] [CrossRef]
- Hamdoun, H.; Sagheer, A.; Youness, H. Energy time series forecasting-analytical and empirical assessment of conventional and machine learning models. J. Intell. Fuzzy Syst. Prepr. 2021, 40, 12477–12502. [Google Scholar] [CrossRef]
- Hafiz, F.; Awal, M.A.; de Queiroz, A.R.; Husain, I. Real-Time Stochastic Optimization of Energy Storage Management Using Deep Learning-Based Forecasts for Residential PV Applications. IEEE Trans. Ind. Appl. 2020, 56, 2216–2226. [Google Scholar] [CrossRef]
- Wu, L.-X.; Lee, S.-J. A deep learning-based strategy to the energy management-advice for the time-of-use rate of household electricity consumption. J. Internet Technol. 2020, 21, 305–311. [Google Scholar]
- Arienti, J.H.L. Time Series Forecasting Applied to an Energy Management System—A Comparison between Deep Learning Models and Other Machine Learning Models. Doctoral Dissertation, Universidade Nova de Lisboa, Lisbon, Portugal, 2020. [Google Scholar]
- Aragón, G.; Puri, H.; Grass, A.; Chala, S.; Beecks, C. Incremental deep-learning for continuous load prediction in energy management systems. In Proceedings of the 2019 IEEE Milan PowerTech, Milan, Italy, 23–27 June 2019. [Google Scholar]
- Kumar, H.; Priyanka, M.M.; Krithi, R. Explainable ai Deep reinforcement learning agents for residential demand-side cost savings in smart grids. arXiv 2019, arXiv:1910.08719. [Google Scholar]
- Tanted, S.; Agarwal, A.; Mitra, S.; Bahuman, C.; Ramamritham, K. Database and Caching Support for Adaptive Visualization of Large Sensor Data. In Proceedings of the ACM IKDD CoDS and 25th COMAD, Hyderabad, India, 5–7 January 2020; pp. 98–106. [Google Scholar]
- Luo, X.J.; Oyedele, L.O. Forecasting building energy consumption: Adaptive long-short term memory neural networks driven by genetic algorithm. Adv. Eng. Inform. 2021, 50, 101357. [Google Scholar] [CrossRef]
- Ramamritham, K.; Karmakar, G.; Shenoy, P.J. Smart Energy Management: A Computational Approach. In International Conference on Big Data Analytics; Springer: Cham, Switzerland, 2017. [Google Scholar]
- Jois, S.; Ramamritham, K.; Agarwal, V. Impact of Facade Based Building Integrated Photo Voltaicson the Indoor Thermal Comfort in Tropical Urban Areas—Mumbai as a Case Study; AGU Fall Meeting 2019; American Geophysical Union: Washington, DC, USA, 2019. [Google Scholar]
- Jois, S.; Ramamritham, K.; Agarwal, V. Modeling Tools Development for Assessing Façade Based PV Feasibility in a Data-Scarce Developing Nation Using Open Source Technology; AGU Fall Meeting 2019; American Geophysical Union: Washington, DC, USA, 2019. [Google Scholar]
- Lee, S.; Shenoy, P.; Ramamritham, K.; Irwin, D. vSolar: Virtualizing Community Solar and Storage for Energy Sharing. In Proceedings of the Ninth International Conference on Future Energy Systems (e-Energy ‘18), Karlsruhe, Germany, 12–15 June 2018; ACM: New York, NY, USA, 2018. [Google Scholar]


| Ref | Year | Proposed Work | Limitations |
|---|---|---|---|
| [25] | 2018 | In this literature, the large data is called Big Data for energy management. | The availability of the referenced massive datasets is limited. |
| [26] | 2019 | Deep learning approaches have outdone themselves in dealing with big data. | There is the challenge of managing the large data package. |
| [27] | 2019 | The authors have strongly argued for the usefulness of Deep Learning frameworks to design the electrical energy efficiency management system. | Huge standard reference limits set of data for electric energy. |
| [28] | 2016 | ||
| [29] | 2016 | This is a comparative consideration of two varieties of the Deep Learning network: (LSTM) and sequence architecture (S2 S). | In this study, coverage is limited to a single residential customer. |
| [30] | 2016 | They then compared the proposed model with the regression of existing support vector and Deep Learning frameworks. The result of the simulation shows that the local RVS surpassed the RVS and H2 O in-Deep Learning. | The authors stated that they used data on submissions; however, the details of the data were not included in this document. |
| [31] | 2016 | This paper presented the Factored Conditional Limited Boltzmann Machine (FCRBM) to forecast energy demands. The model has been tested on the EcoGrid EU data set. | The author of this paper needed to compare his research study with other variations of Deep Learning architecture and currently performed systems. |
| [32] | 2017 | The authors have compared the convolutional neural network (CNN/ConvNet) with the study presented in 2016. | No new CNN/ConvNet architecture was presented in this study, and neither was the pre-trained network described. |
| [33] | 2017 | Initially formed the Recurrent neural networks (RNN) using a data-driven approach. | This model-less, evidence-based approach has surpassed the approach of model-based studies in management of energy. |
| [34] | 2017 | This study provided a comprehensive comparison of conventional machine learning algorithms, including vector support machines, Gaussian processes, regression trees, overall amplification and linear regression, and the Deep Learning method. | Validation of the claim related to the energy management system is observed to be unclear. |
| [35] | 2018 | This method is optimized for building energy management, and explores two DL algorithms, namely, Deep Q-learning (DQN) and Deep Policy Gradient (DPG), at the same time. | The parametric fringe of the proposed technique proved insufficient. Moreover, the cognitive scope of the gadget seems to be very trendy. |
| [36] | 2018 | The authors have used Recurrent neural networks (RNN) to forecast time series data of energy consumption for a university campus. | The robustness of this work could be enhanced if the master data set had been chosen. |
| [37] | 2019 | The authors have suggested using the methods of alternating direction of multipliers (ADMM) and accelerated alternating direction of multipliers (AADM) to find the optimum value of operation of the micro network distribution. | This study did not include the data-based approach to energy forecasting. Moreover, it was felt that the parametric comparison was missing in this work. |
| [38] | 2019 | This work submitted a data-driven, Deep Learning approach to district-wide energy demand forecasting. | This study appears deficient because of the absence of a baseline data set and extensive comparison with pre-existing models. |
| [39] | 2020 | The FS-FCRBM-GWDO hybrid model is superior to the existing models presented in this study. | The gap between the existing real-world reference data set and the pre-established model is deficient. |
| [40] | 2020 | Major contributions include device-based real-time power management via a common cloud data monitoring server. | The actual application was outside the scope of study. |
| [41] | 2020 | The authors have used a convolutional neural network (CNN) and a multilayer bi-directional synchronized recurrent unit (MB-GRU) to predict the consumption load of a residential building. | The degree of contribution to research could increase if the updated architecture of Deep Learning could be introduced. Moreover, the systematic evaluation of the novel model may be established in comparison to the existing pre-trained Deep Learning architectures. |
| [42] | 2021 | A machine (computer) based vision approach, You Only Look Once (YOLO v3), was utilized to calculate the number of individuals within the region. It is more in correlation with the temperature range of the air conditioning units. | The author’s study would be made more effective by implementing new variants of Deep Learning. |
| [43] | 2021 | A new machine learning model for forecasting the energy usage on an hourly basis in a residential building is proposed. | The performance of the machine learning algorithm is compromised as a result of the performance plateau highlighted with big data. |
| [44] | 2021 | Deep Learning is the best candidate for power prediction based on time series. The concern in this study is increasingly associated with the fact that the performance of ML and DL is found. | Three small data sets were used to validate the study. the authors could not pursue the novel Deep Learning architecture of a machine learning model for data-driven energy efficiency forecasting. |
| [45] | 2020 | Comparison of Machine Learning and DL algorithms with the residential building dataset. The comparison was based on competition between ML and DL. | These works also highlight the urgent need for a master data set for domain-specific applications such as hospitals, schools, universities, residential buildings, etc. |
| [46] | 2020 | ||
| [47] | 2020 | ||
| [48] | 2019 | The work continued to use the RNN with the LSTM approach to forecast energy demand. This work also suggested a gap in the development of any new DL architecture and a pre-formed network of master datasets. | This work also suggests a gap in the development of new ML on master datasets. |
| [49] | 2019 | Smart Energy Informatics Lab (SEIL) offered data-driven reinforcement learning for predicting demand. | |
| [50] | 2020 | SEIL-IIT introduced the database medium for adaptive data visualization of large sensors. | |
| [51] | 2020 | Smart Energy Informatics Lab (SEIL), the same group, studied the hybrid model for predicting energy consumption in buildings through LSTM networks. | |
| [52] | 2017 | There has been a push for a data-driven approach to the intelligent energy management system. | |
| [53] | 2019 | In this work reference is made to the data set generated by their research. Another area that this group has targeted is solar photovoltaic optimisation and building thermal modelling [53,54,55]. This is beyond the scope of our study. | The Pre-Trained model is deficient. |
| [54] | 2019 | ||
| [55] | 2018 |
| Attribute Number | Attribute Symbol | Attribute Number | Attribute Symbol | Attribute Number | Attribute Symbol | Attribute Number | Attribute Symbol |
|---|---|---|---|---|---|---|---|
| 1. | V1 | 8. | VA1 | 15. | W | 22. | PF3 |
| 2. | V2 | 9. | VA2 | 16. | VAR1 | 23. | PF |
| 3. | V3 | 10. | VA3 | 17. | VAR2 | 24. | FwdWh |
| 4. | A1 | 11. | VA | 18. | VAR3 | 25. | FwdVAh |
| 5. | A2 | 12. | W1 | 19. | VAR | 26. | FwdVARh, FwdVARhC |
| 6. | A3 | 13. | W2 | 20. | PF1 | ||
| 7. | A | 14. | W3 | 21. | PF2 |
| Algorithm | Training | Testing | ||||||||
|---|---|---|---|---|---|---|---|---|---|---|
| RMSE | R-Squared | MSE | MAE | Prediction Speed (Obs/s) | Training Time (s) | RMSE | R-Squared | MSE | MAE | |
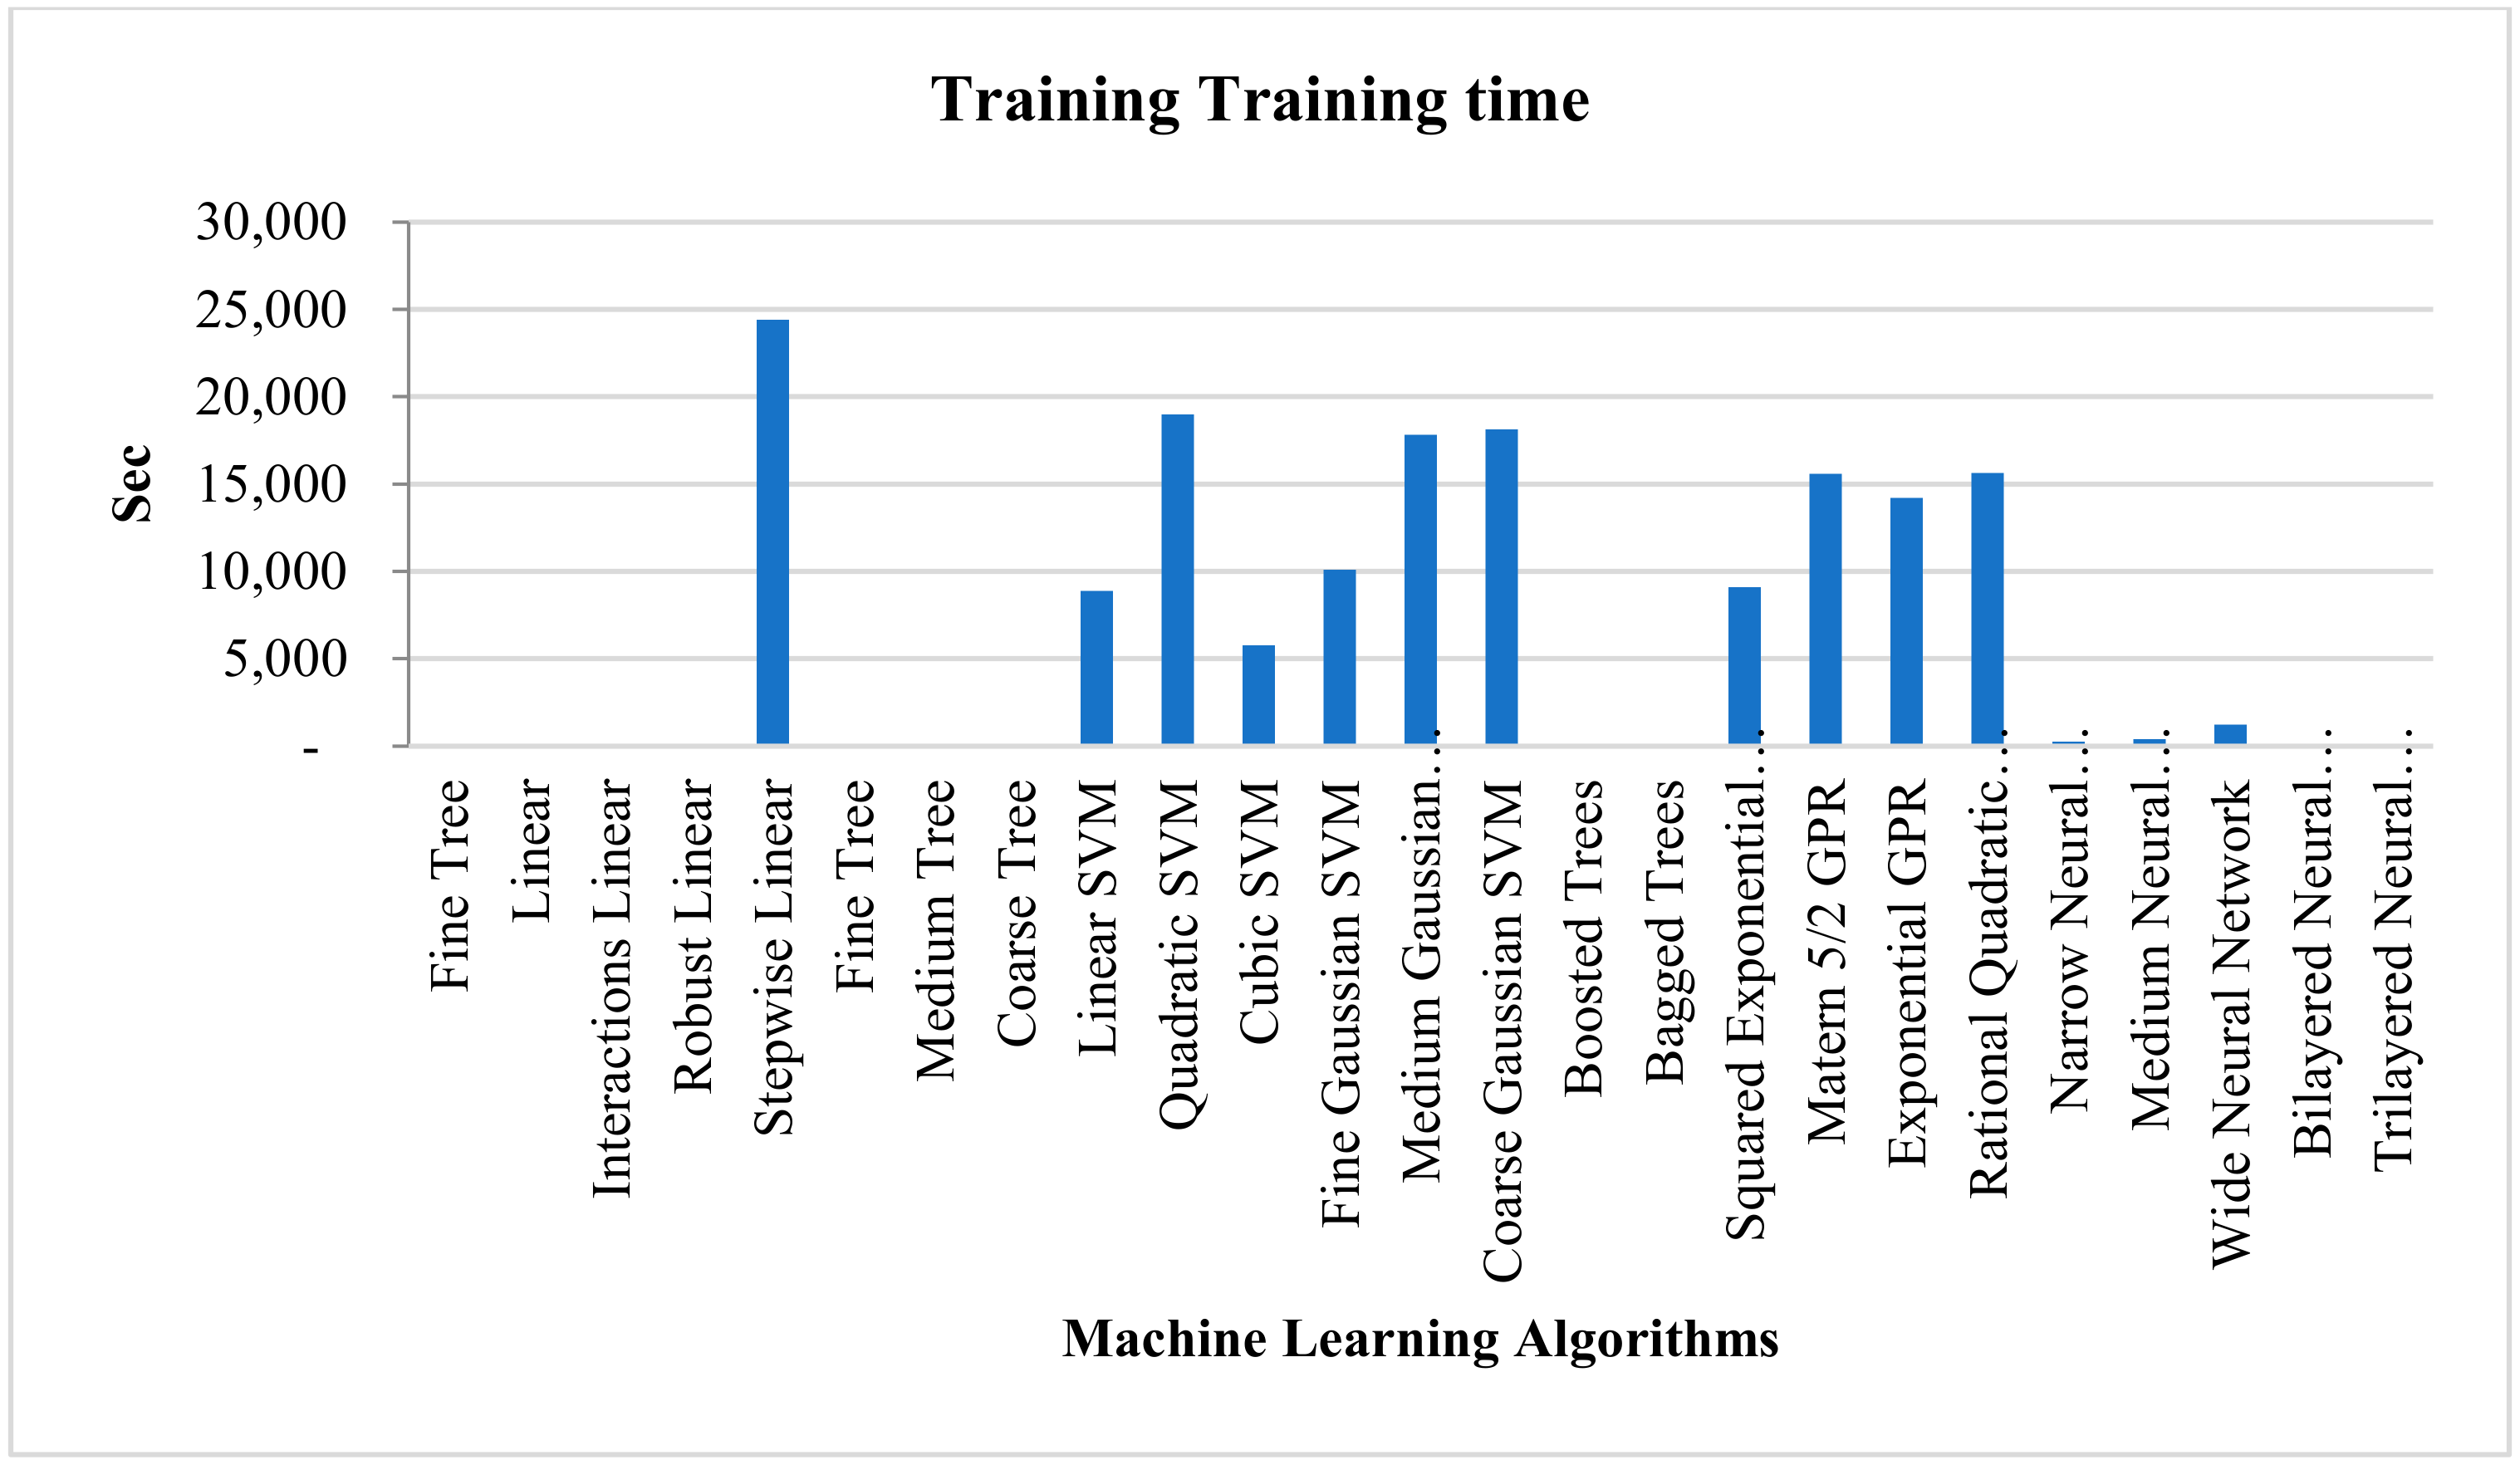
| Linear | 1.35 × 10⁸ | 0.54 | 1.83 × 10¹⁶ | 8.42 × 10⁷ | 790,000 | 22.065 | 1.36 × 10⁸ | 0.53 | 1.84 × 10¹⁶ | 8.45 × 10⁷ |
| Interactions Linear | 1.22 × 10⁸ | 0.62 | 1.48 × 10¹⁶ | 8.02 × 10⁷ | 110,000 | 65.108 | 1.23 × 10⁸ | 0.62 | 1.50 × 10¹⁶ | 8.05 × 10⁷ |
| Robust Linear | 1.64 × 10⁸ | 0.32 | 2.68 × 10¹⁶ | 5.25 × 10⁷ | 790,000 | 19.44 | 1.65 × 10⁸ | 0.31 | 2.71 × 10¹⁶ | 5.30 × 10⁷ |
| Stepwise Linear | 1.18 × 10⁸ | 0.65 | 1.39 × 10¹⁶ | 7.63 × 10⁷ | 600,000 | 24,417 | 1.18 × 10⁸ | 0.64 | 1.40 × 10¹⁶ | 7.66 × 10⁷ |
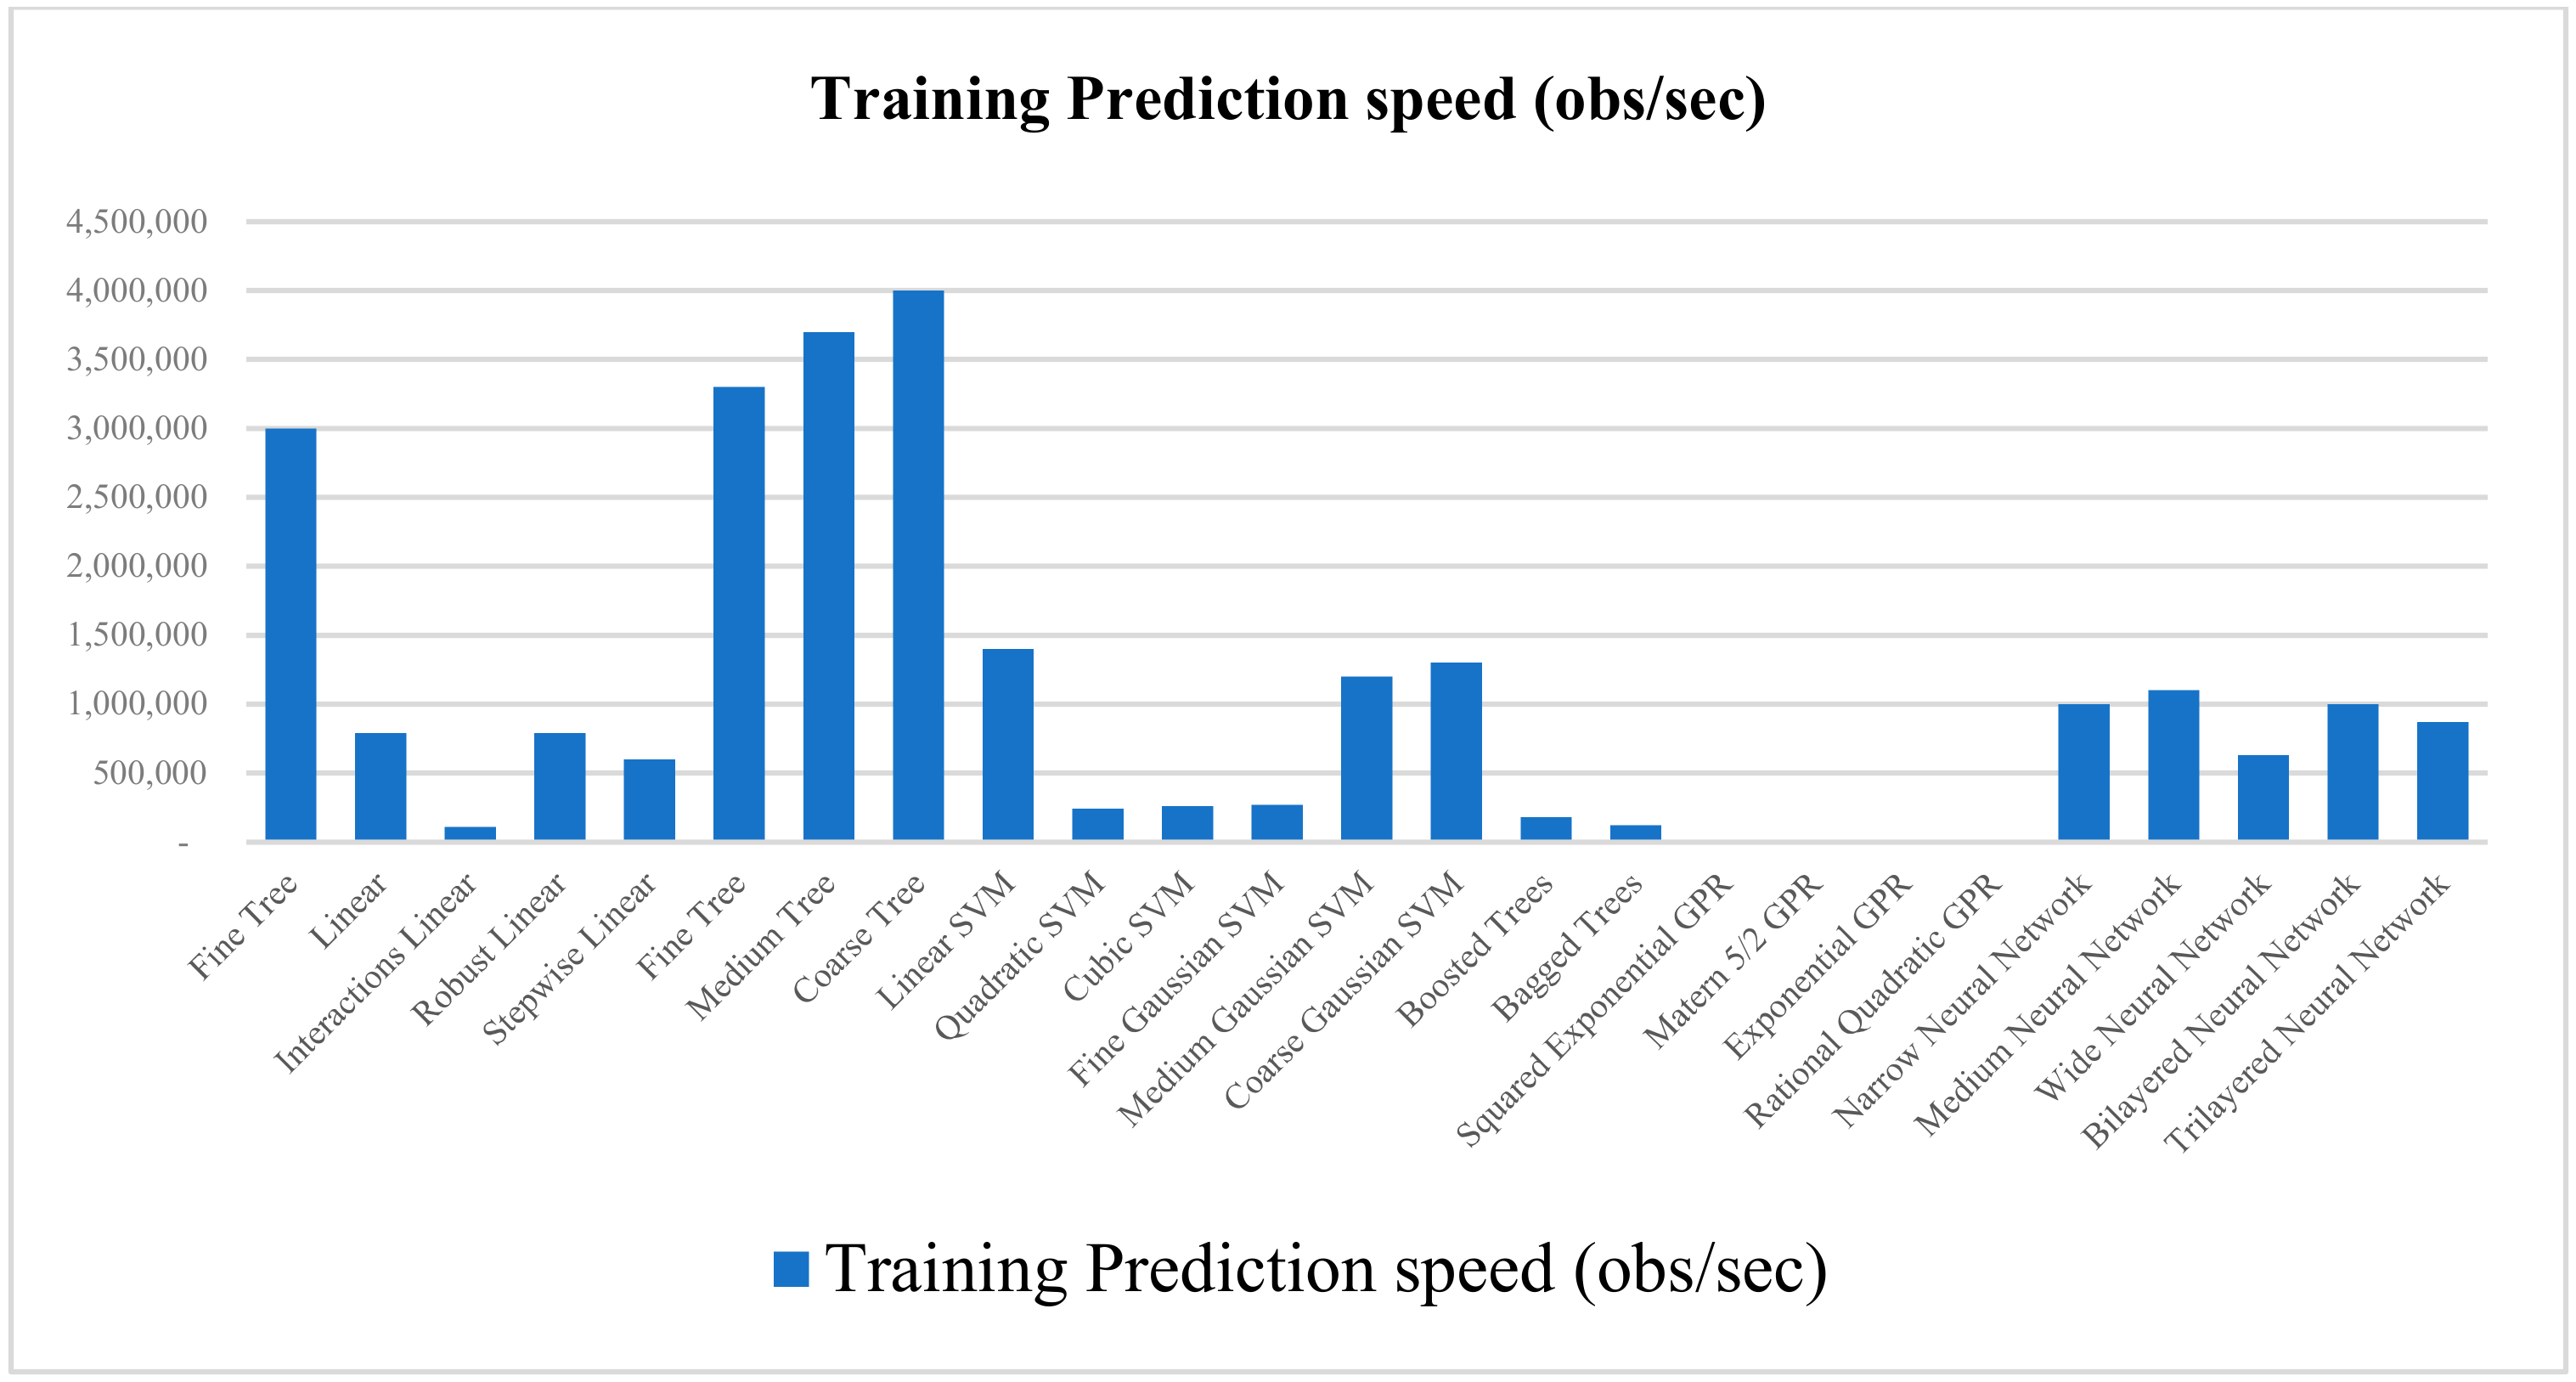
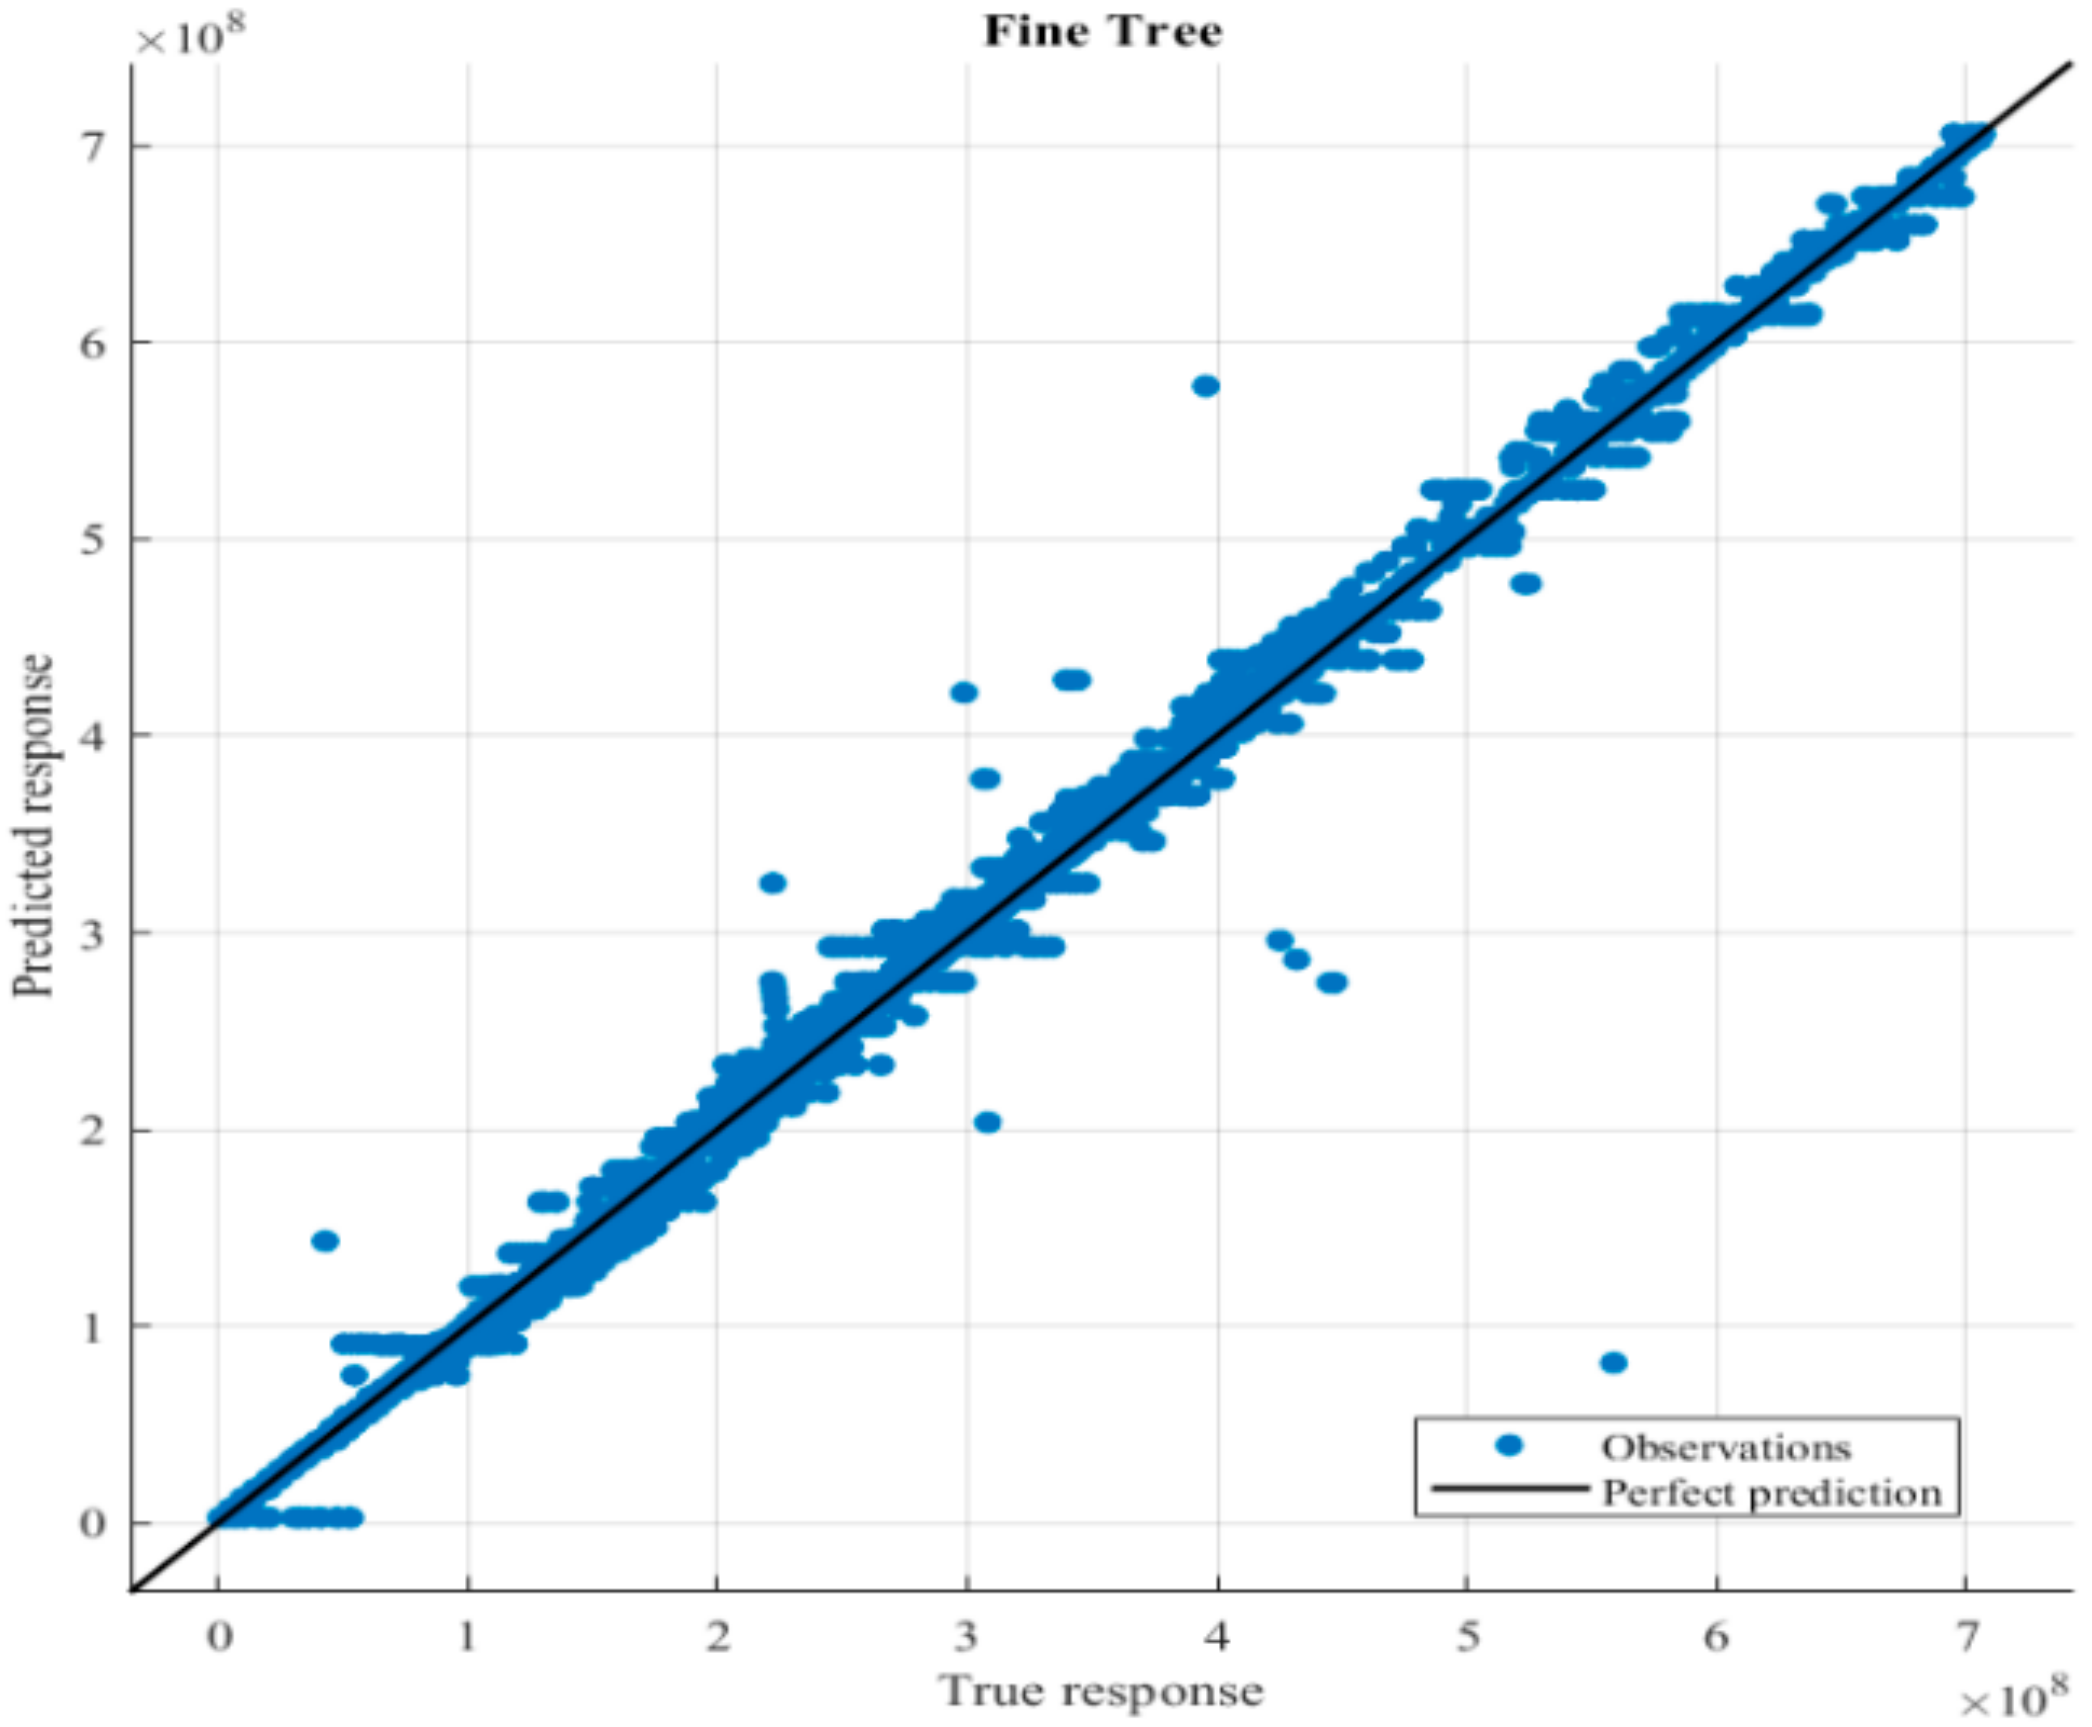
| Fine Trees | 2.11 × 10⁶ | 1 | 4.44 × 10¹² | 1.40 × 10⁶ | 3,300,000 | 8.3244 | 2.38 × 10⁶ | 1 | 5.64 × 10¹² | 1.41 × 10⁶ |
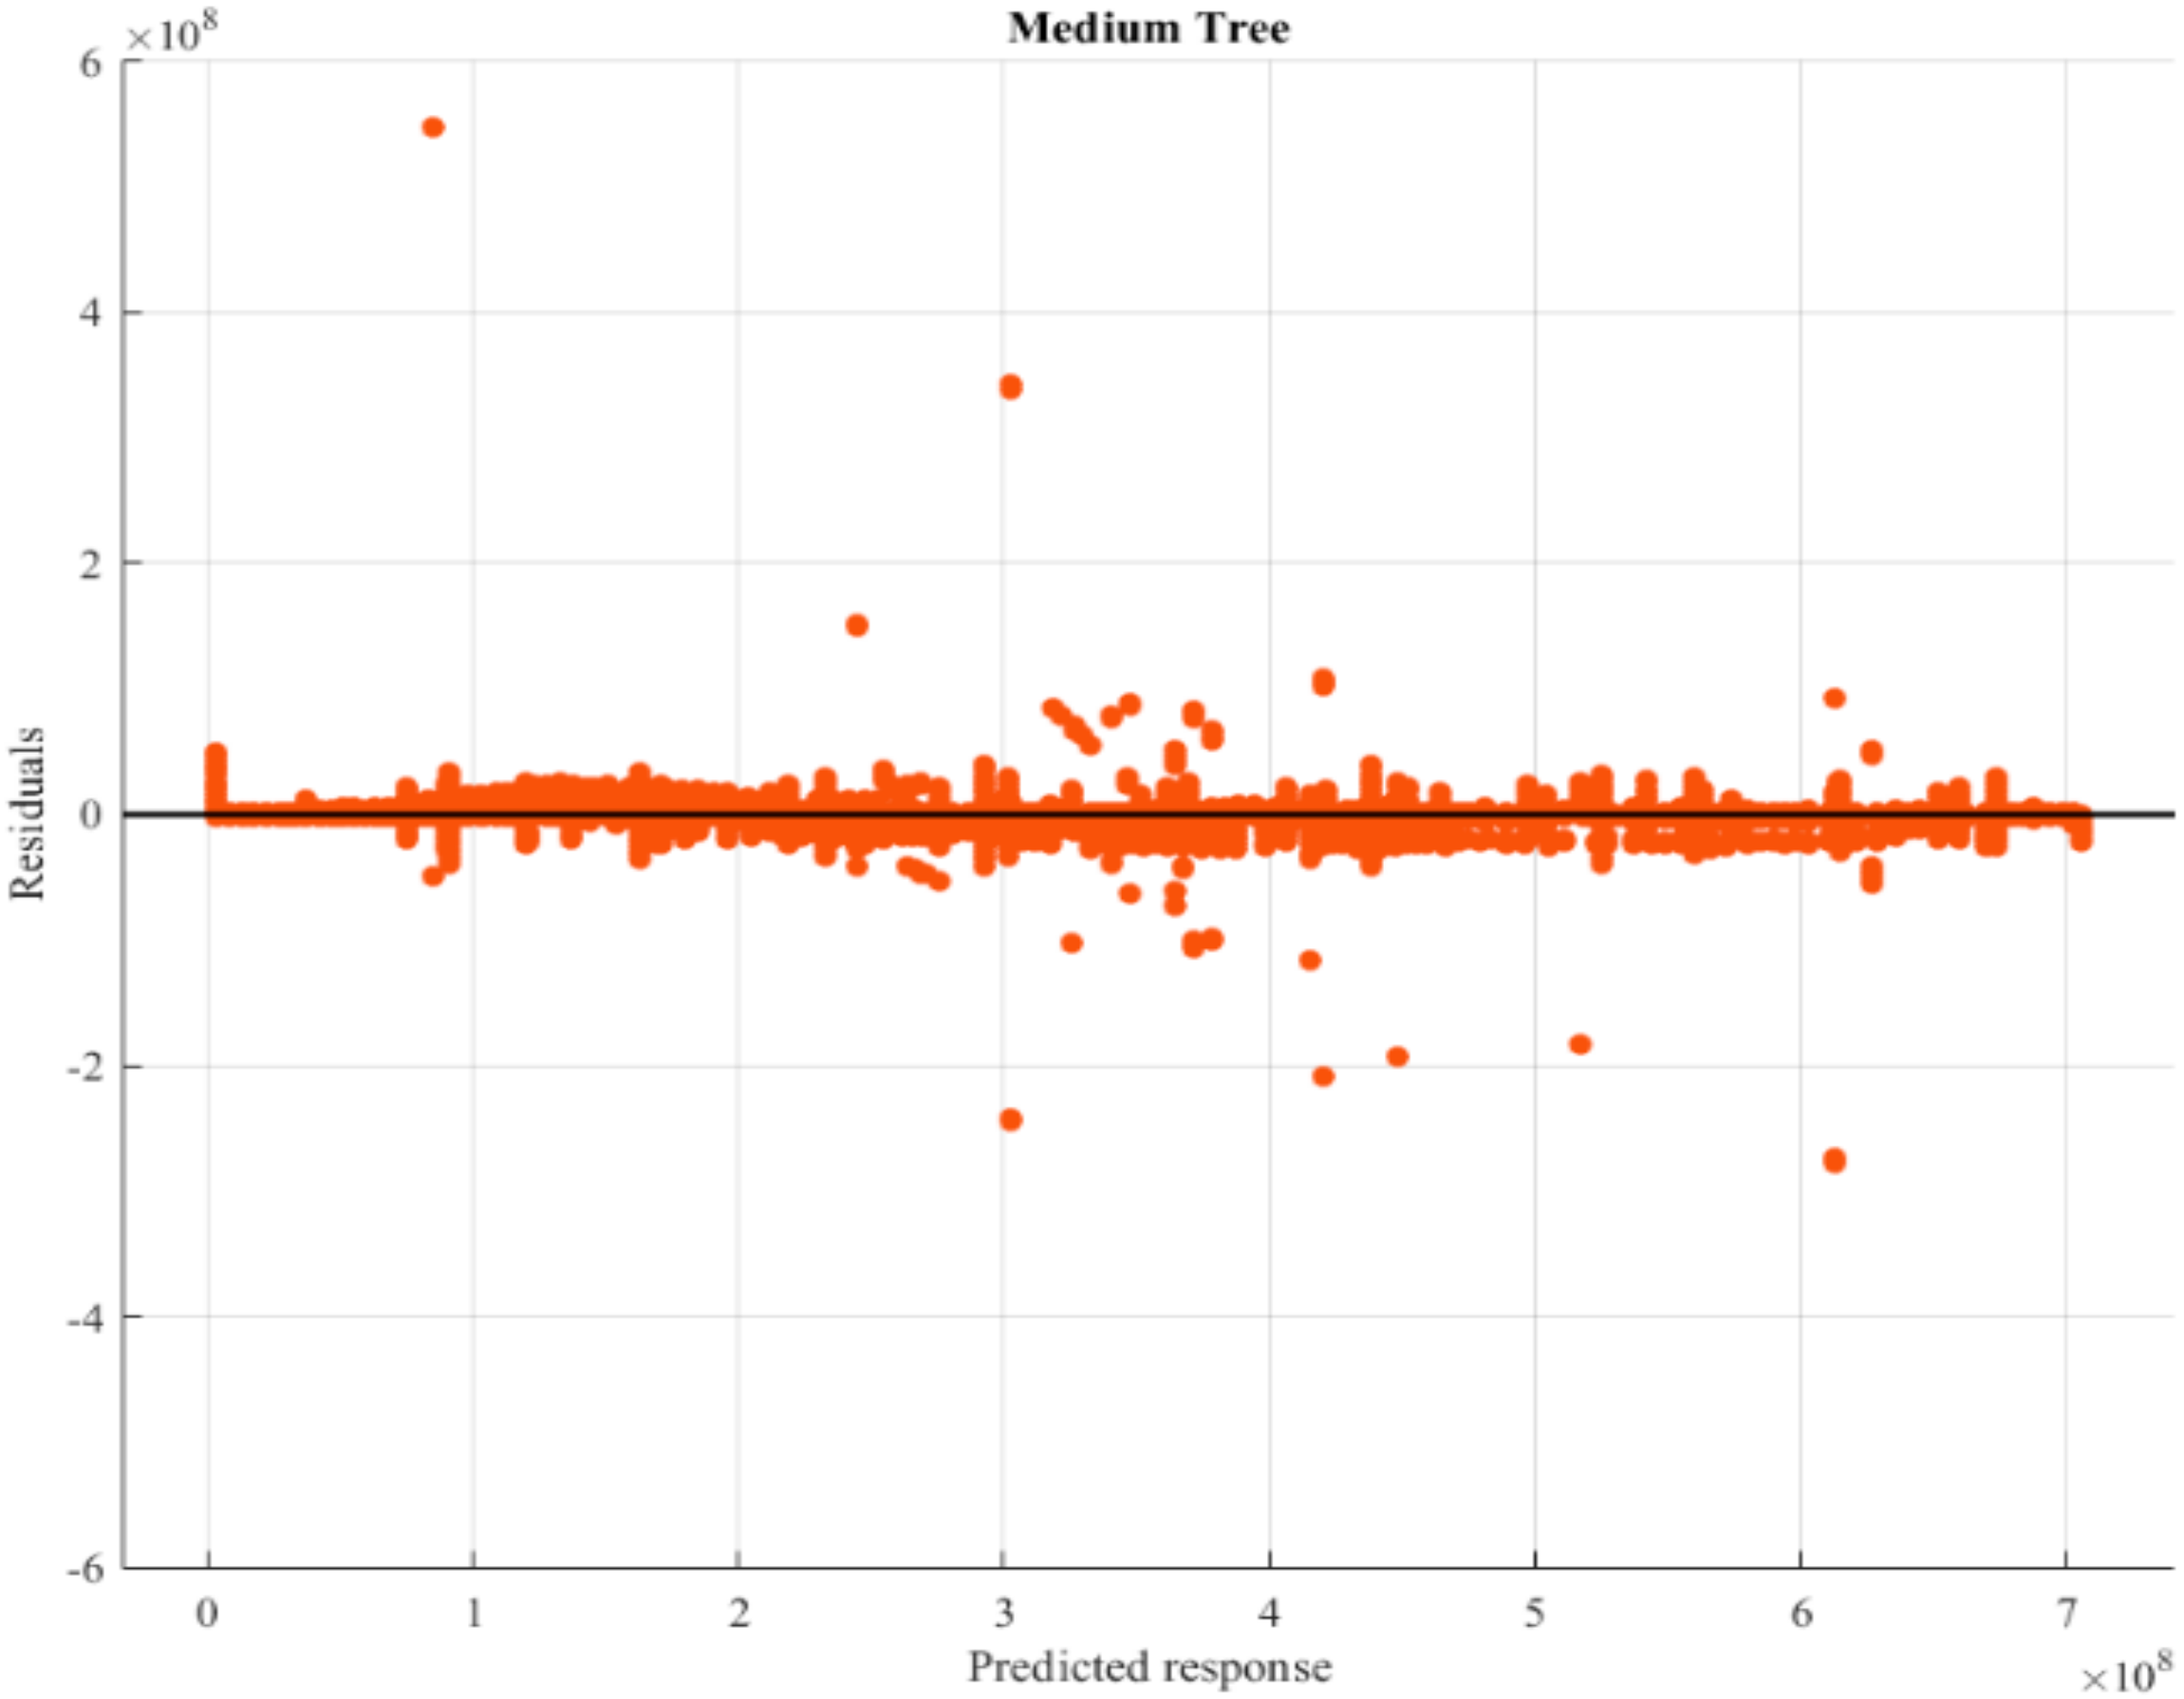
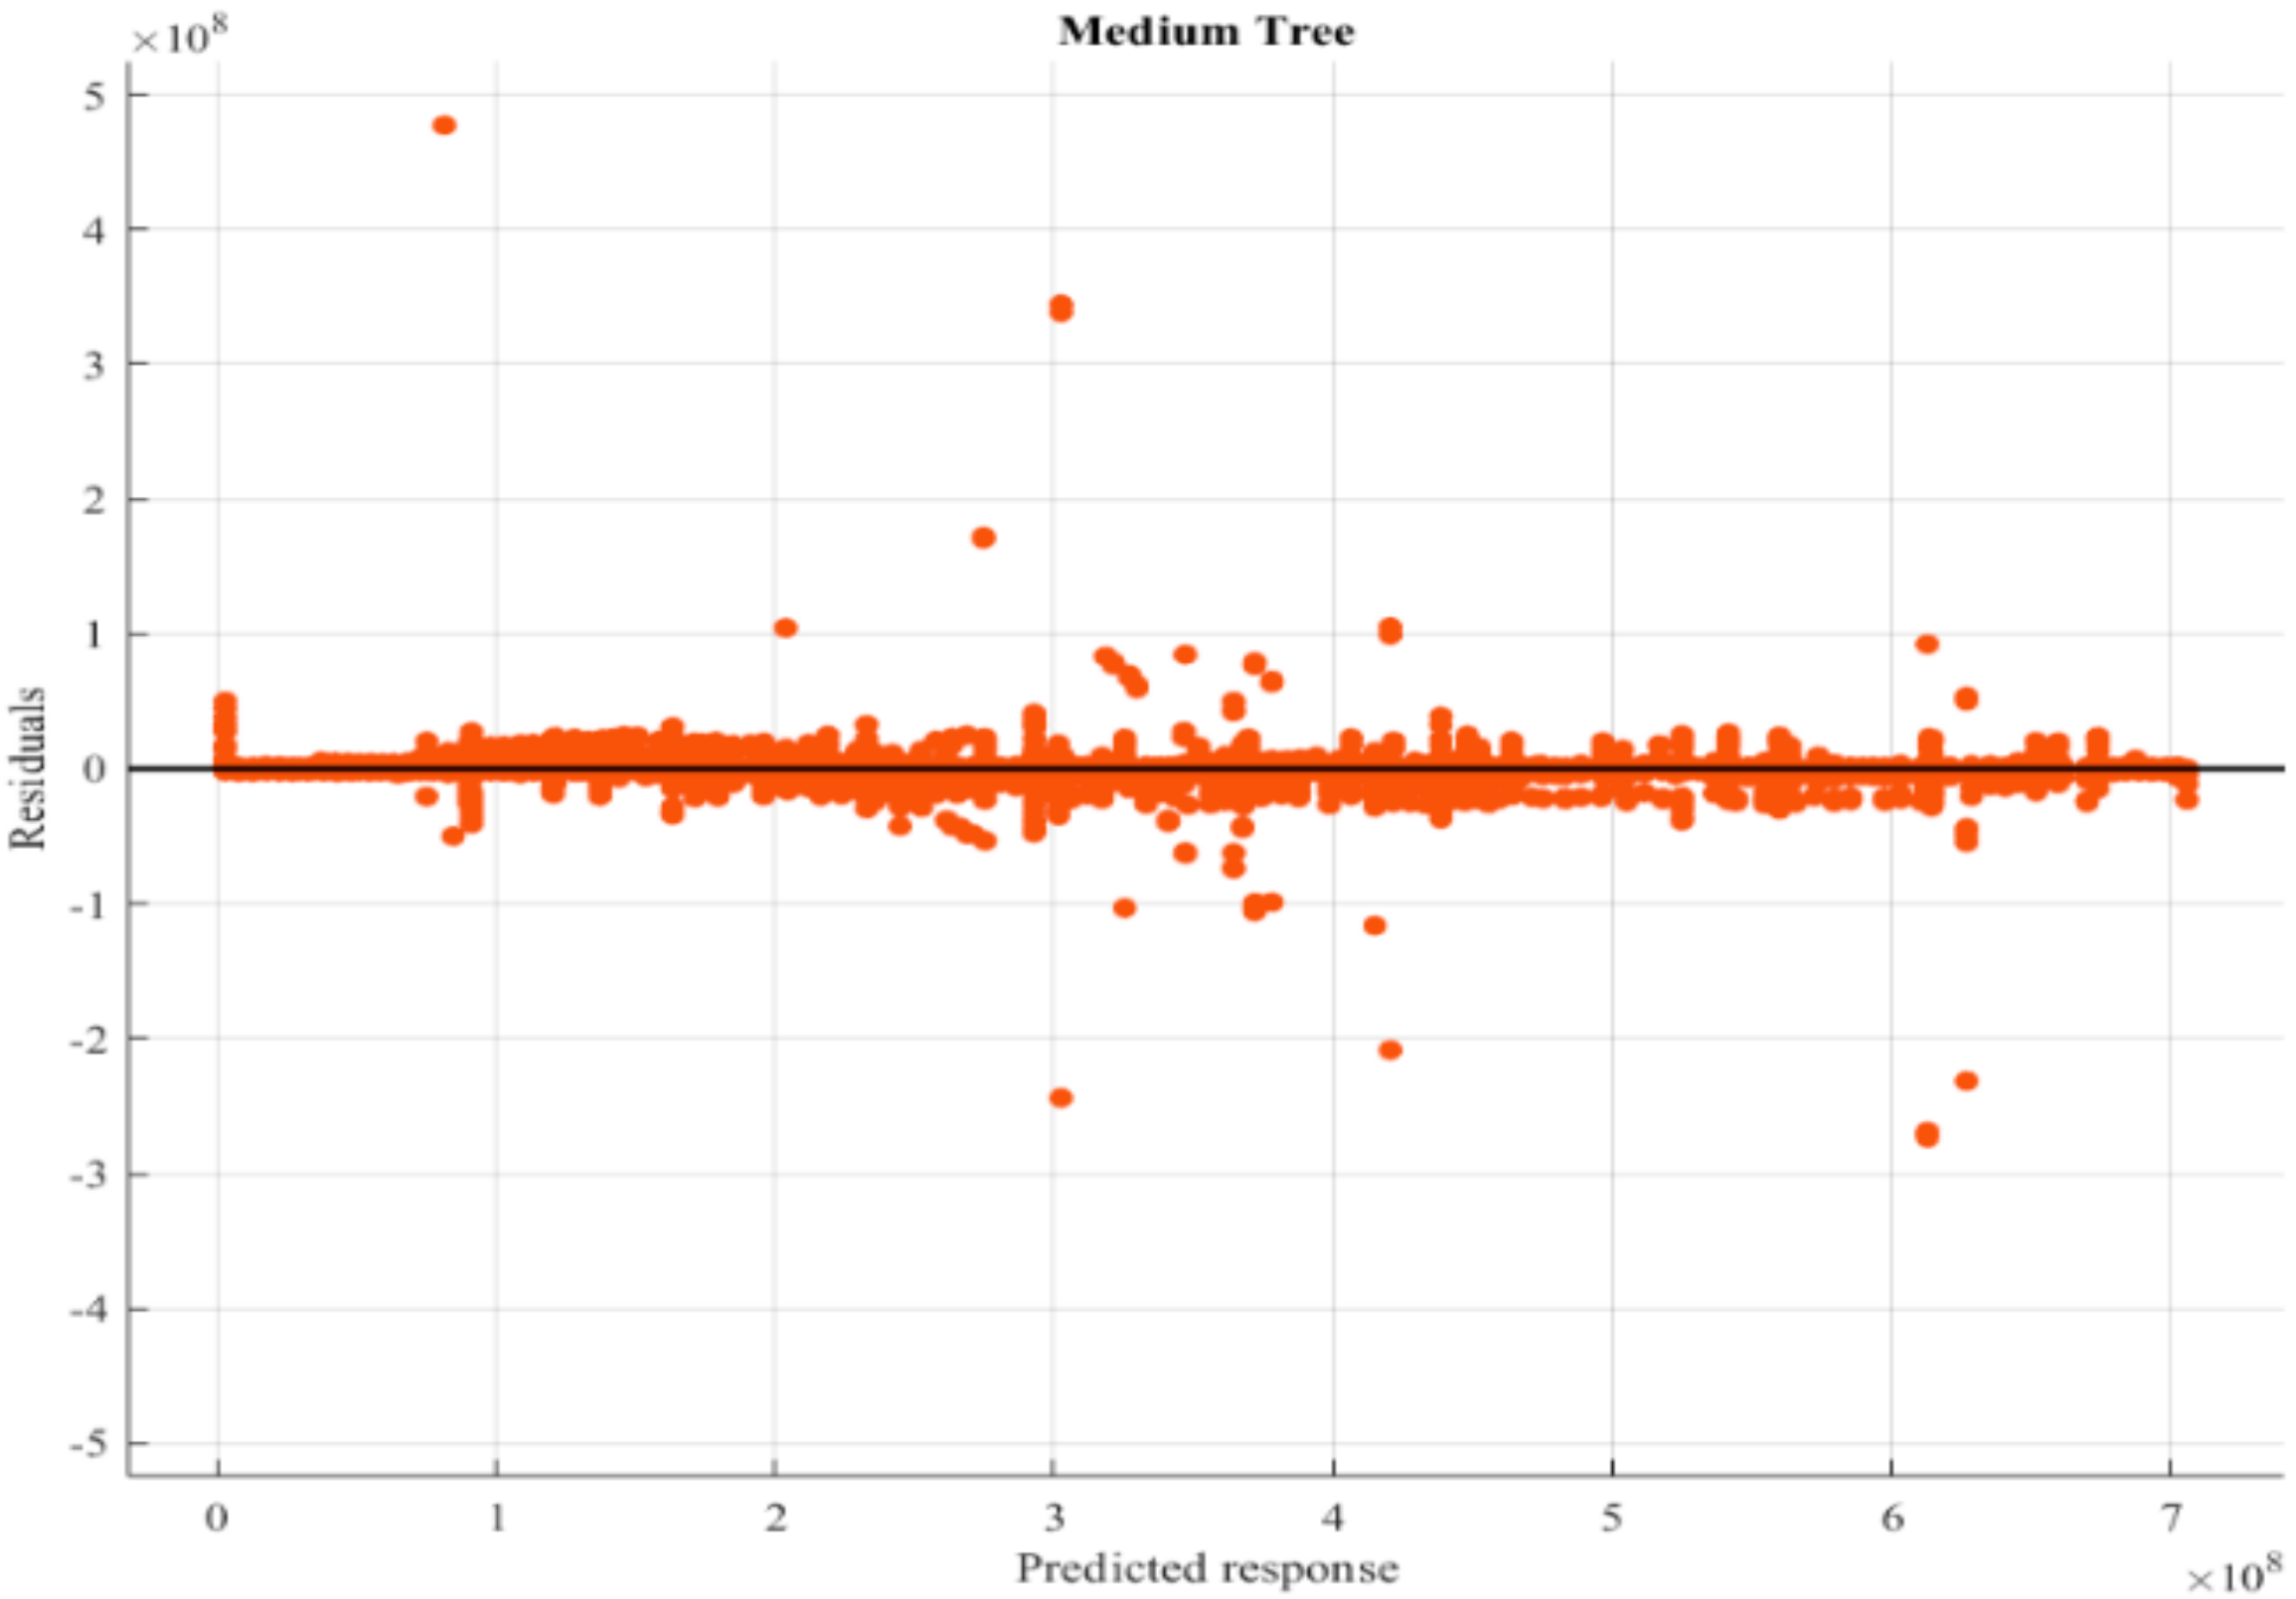
| Medium Trees | 2.81 × 10⁶ | 1 | 7.87 × 10¹² | 1.42 × 10⁶ | 3,700,000 | 8.0721 | 3.20 × 10⁶ | 1 | 1.02 × 10¹³ | 1.43 × 10⁶ |
| Coarse Tree | 4.26 × 10⁶ | 1 | 1.81 × 10¹³ | 1.49 × 10⁶ | 4,000,000 | 7.5477 | 4.63 × 10⁶ | 1 | 2.15 × 10¹³ | 1.50 × 10⁶ |
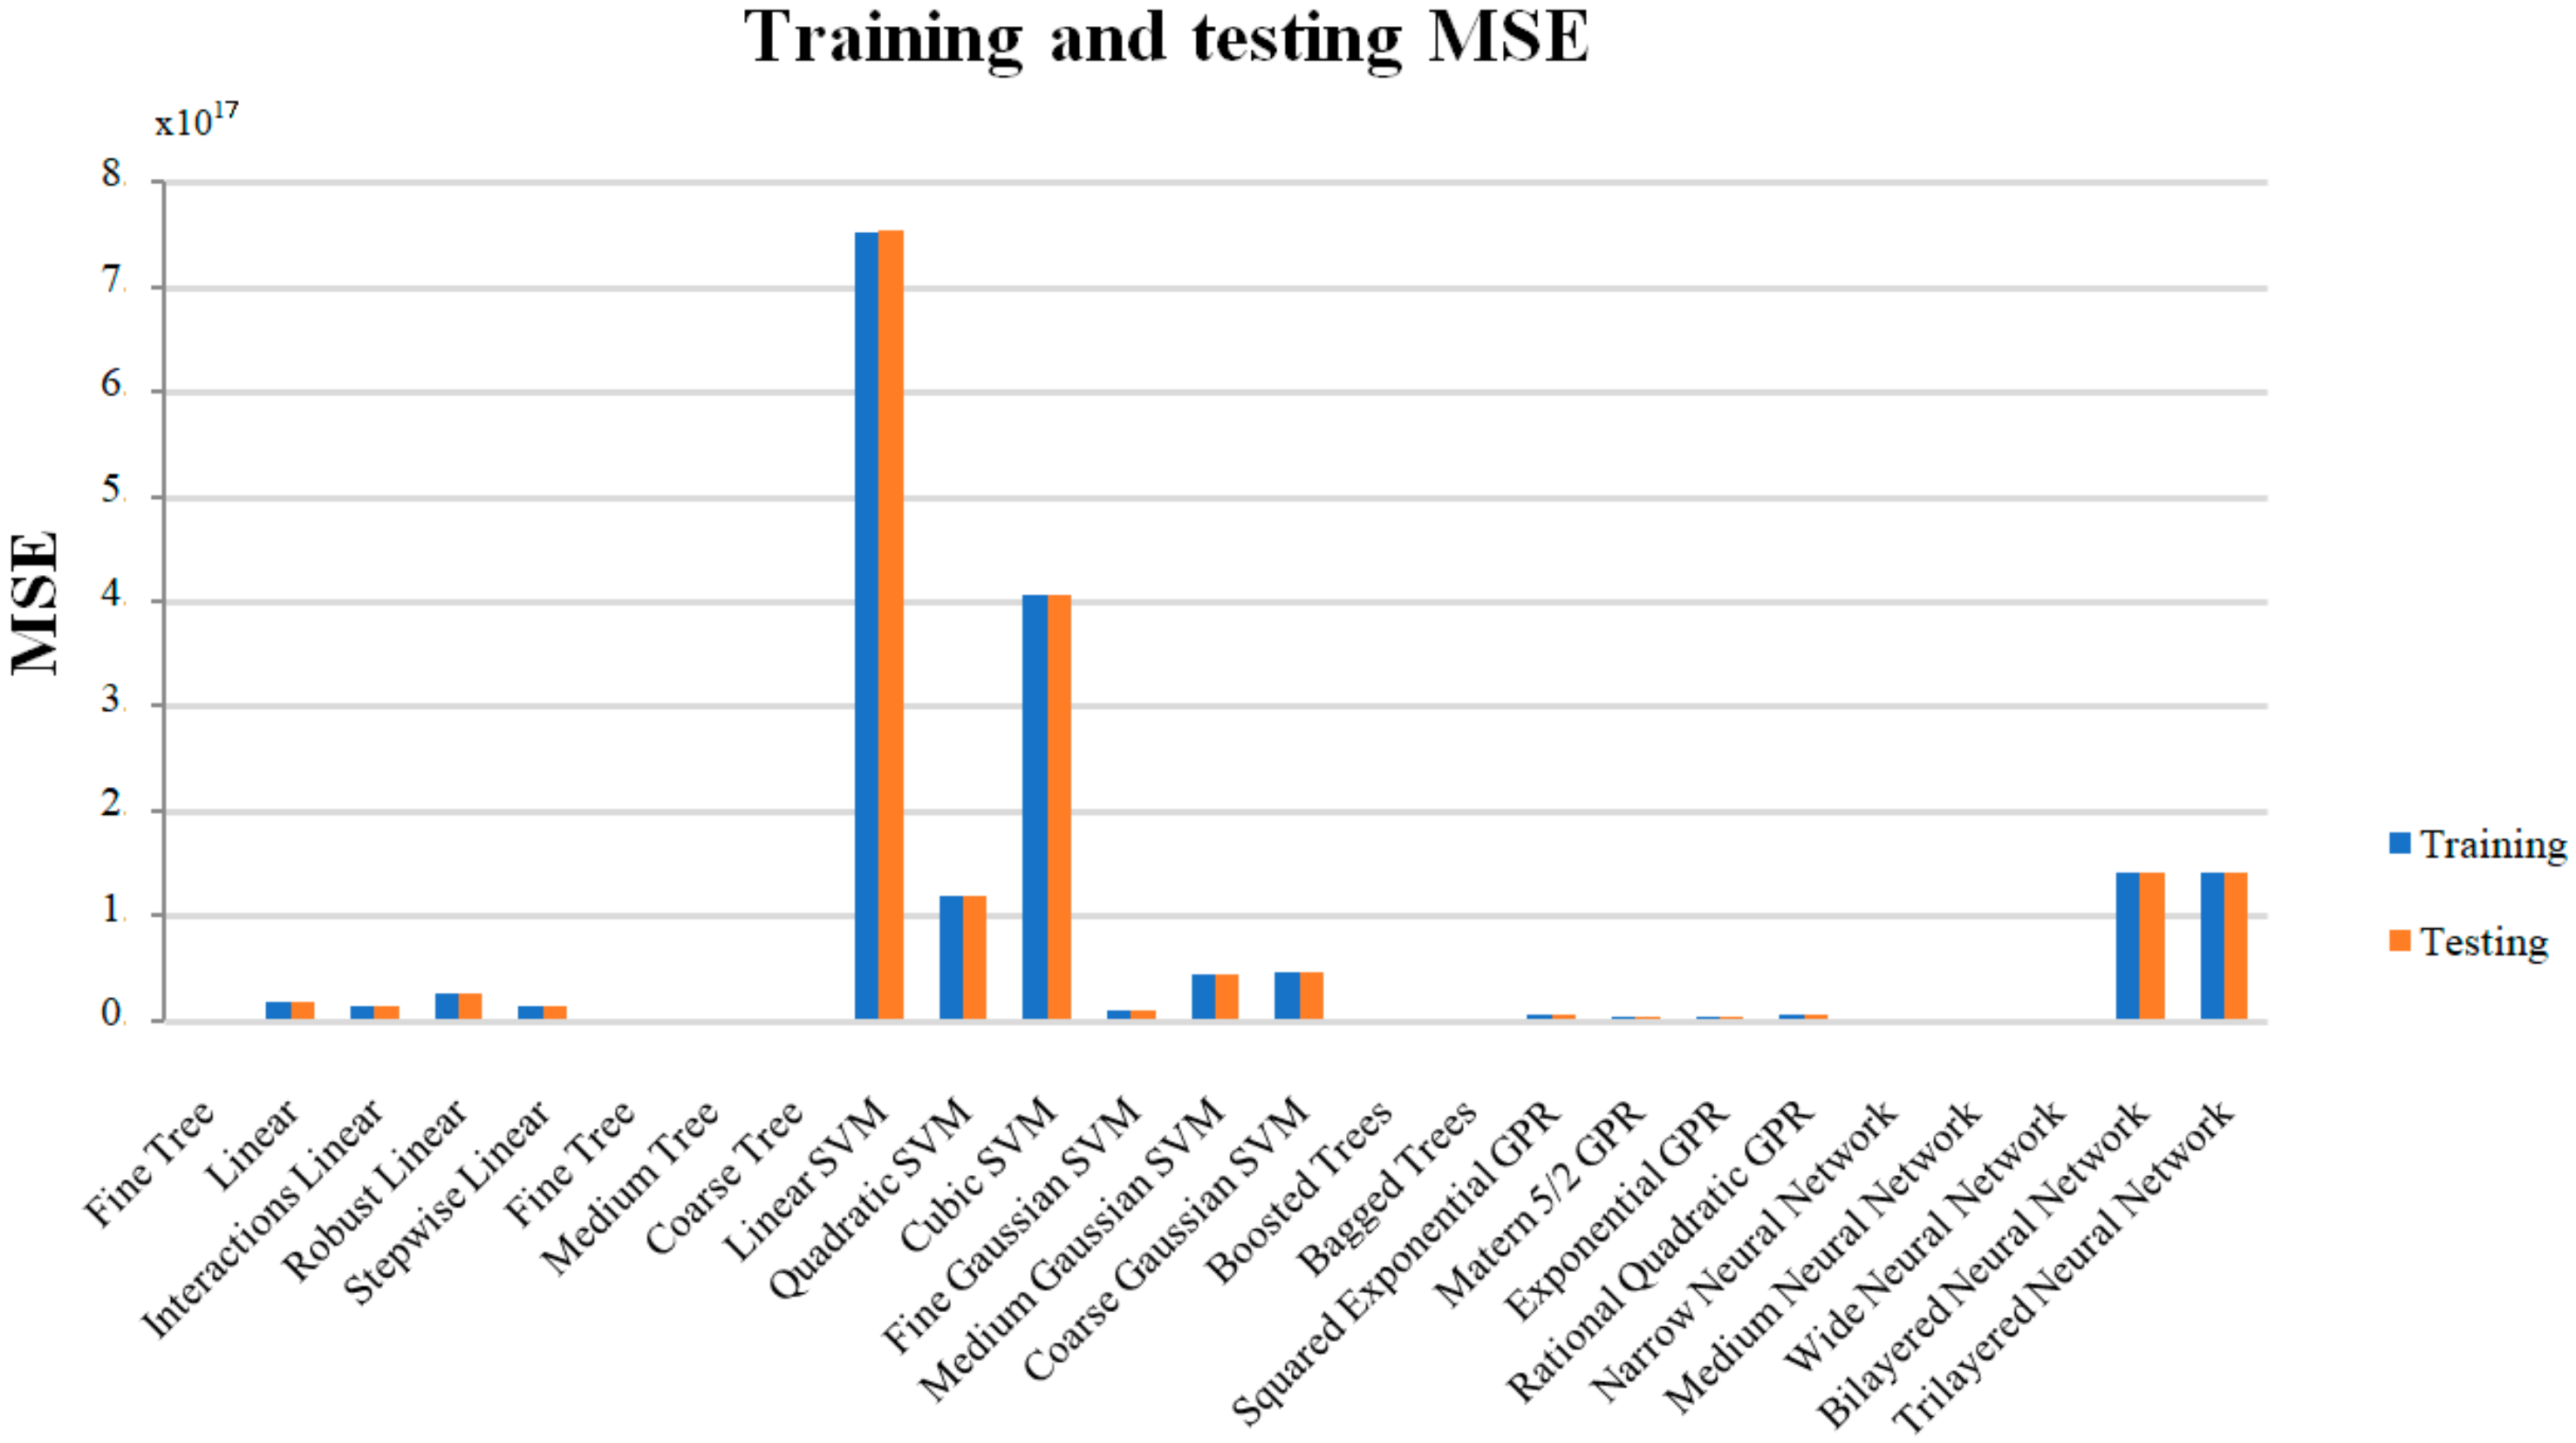
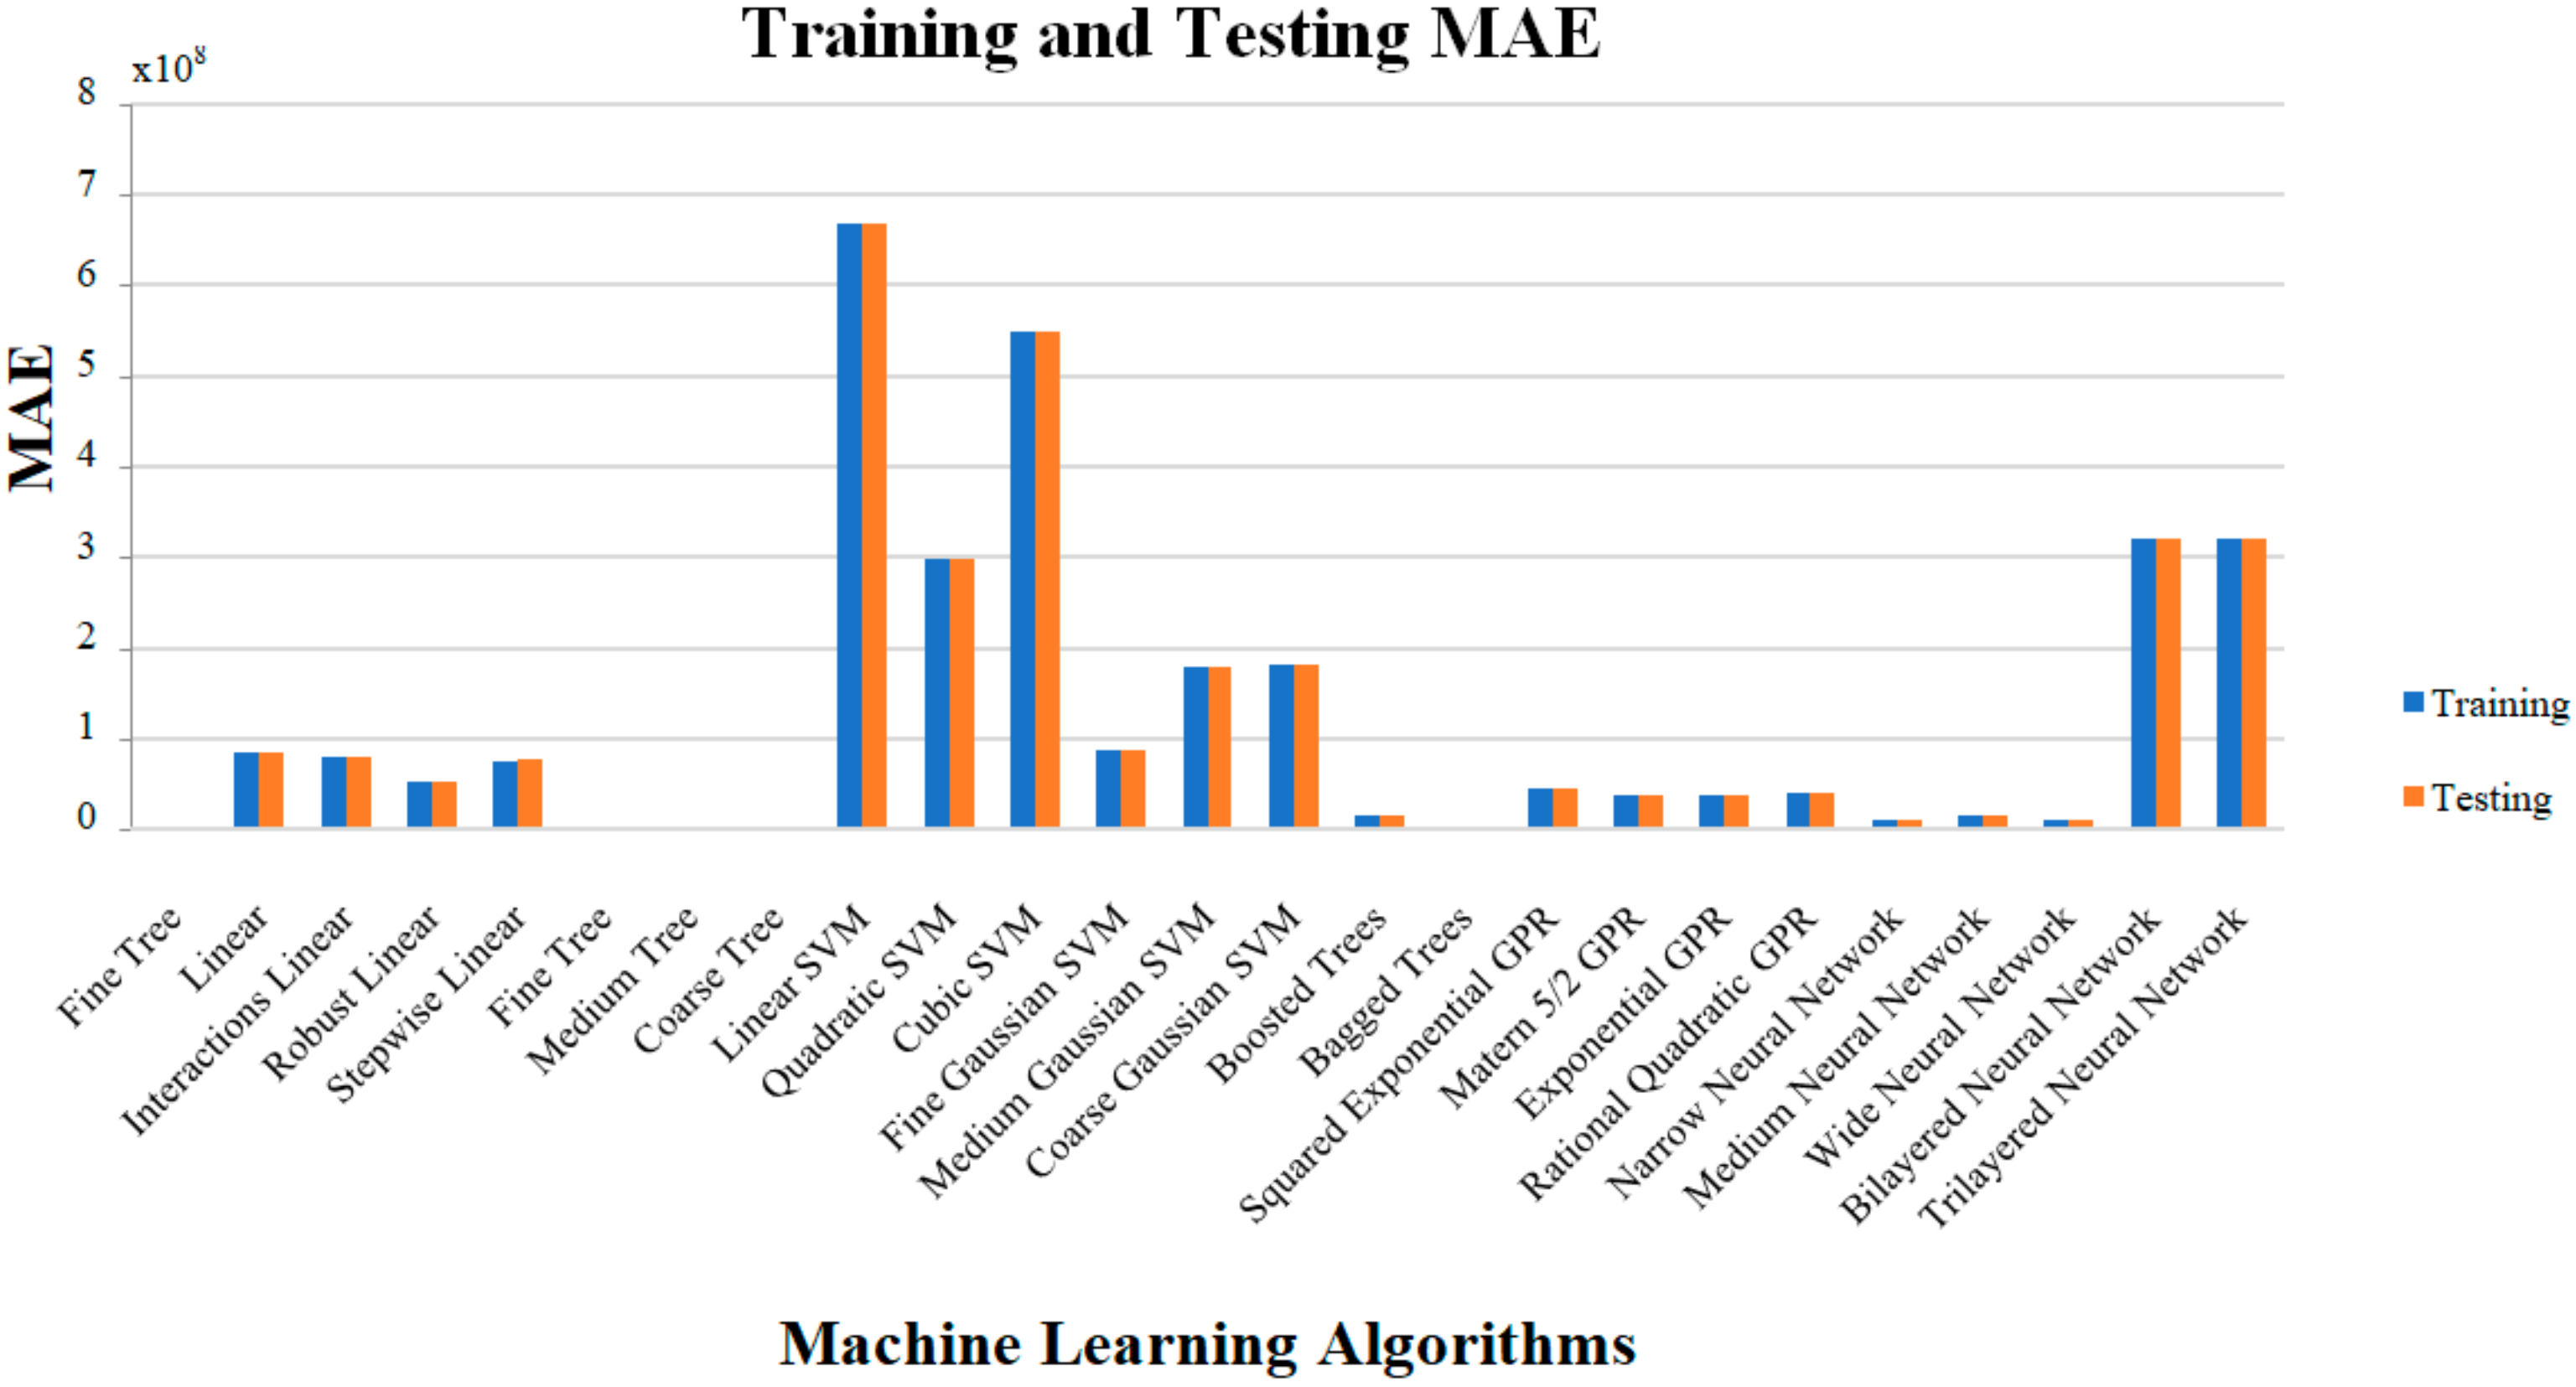
| Linear SVM | 8.67 × 10⁸ | −18.13 | 7.52 × 10¹⁷ | 6.69 × 10⁸ | 1,400,000 | 8892.6 | 8.68 × 10⁸ | −18.13 | 7.54 × 10¹⁷ | 6.69 × 10⁸ |
| Quadratic SVM | 3.46 × 10⁸ | −2.05 | 1.20 × 10¹⁷ | 2.98 × 10⁸ | 240,000 | 18,985 | 3.45 × 10⁸ | −2.02 | 1.19 × 10¹⁷ | 2.98 × 10⁸ |
| Cubic SVM | 6.38 × 10⁸ | −9.35 | 4.07 × 10¹⁷ | 5.50 × 10⁸ | 260,000 | 5761.7 | 6.37 × 10⁸ | −9.31 | 4.06 × 10¹⁷ | 5.50 × 10⁸ |
| Fine Gaussian SVM | 1.04 × 10⁸ | 0.72 | 1.08 × 10¹⁶ | 8.83 × 10⁷ | 270,000 | 10,099 | 1.04 × 10⁸ | 0.72 | 1.08 × 10¹⁶ | 8.85 × 10⁷ |
| Medium Gaussian SVM | 2.10 × 10⁸ | −0.13 | 4.43 × 10¹⁶ | 1.80 × 10⁸ | 1,200,000 | 17,835 | 2.11 × 10⁸ | −0.13 | 4.44 × 10¹⁶ | 1.80 × 10⁸ |
| Coarse Gaussian SVM | 2.17 × 10⁸ | −0.19 | 4.69 × 10¹⁶ | 1.82 × 10⁸ | 1,300,000 | 18,127 | 2.17 × 10⁸ | −0.2 | 4.71 × 10¹⁶ | 1.82 × 10⁸ |
| Boosted Trees | 2.33 × 10⁷ | 0.99 | 5.42 × 10¹⁴ | 1.66 × 10⁷ | 180,000 | 62.082 | 2.31 × 10⁷ | 0.99 | 5.34 × 10¹⁴ | 1.66 × 10⁷ |
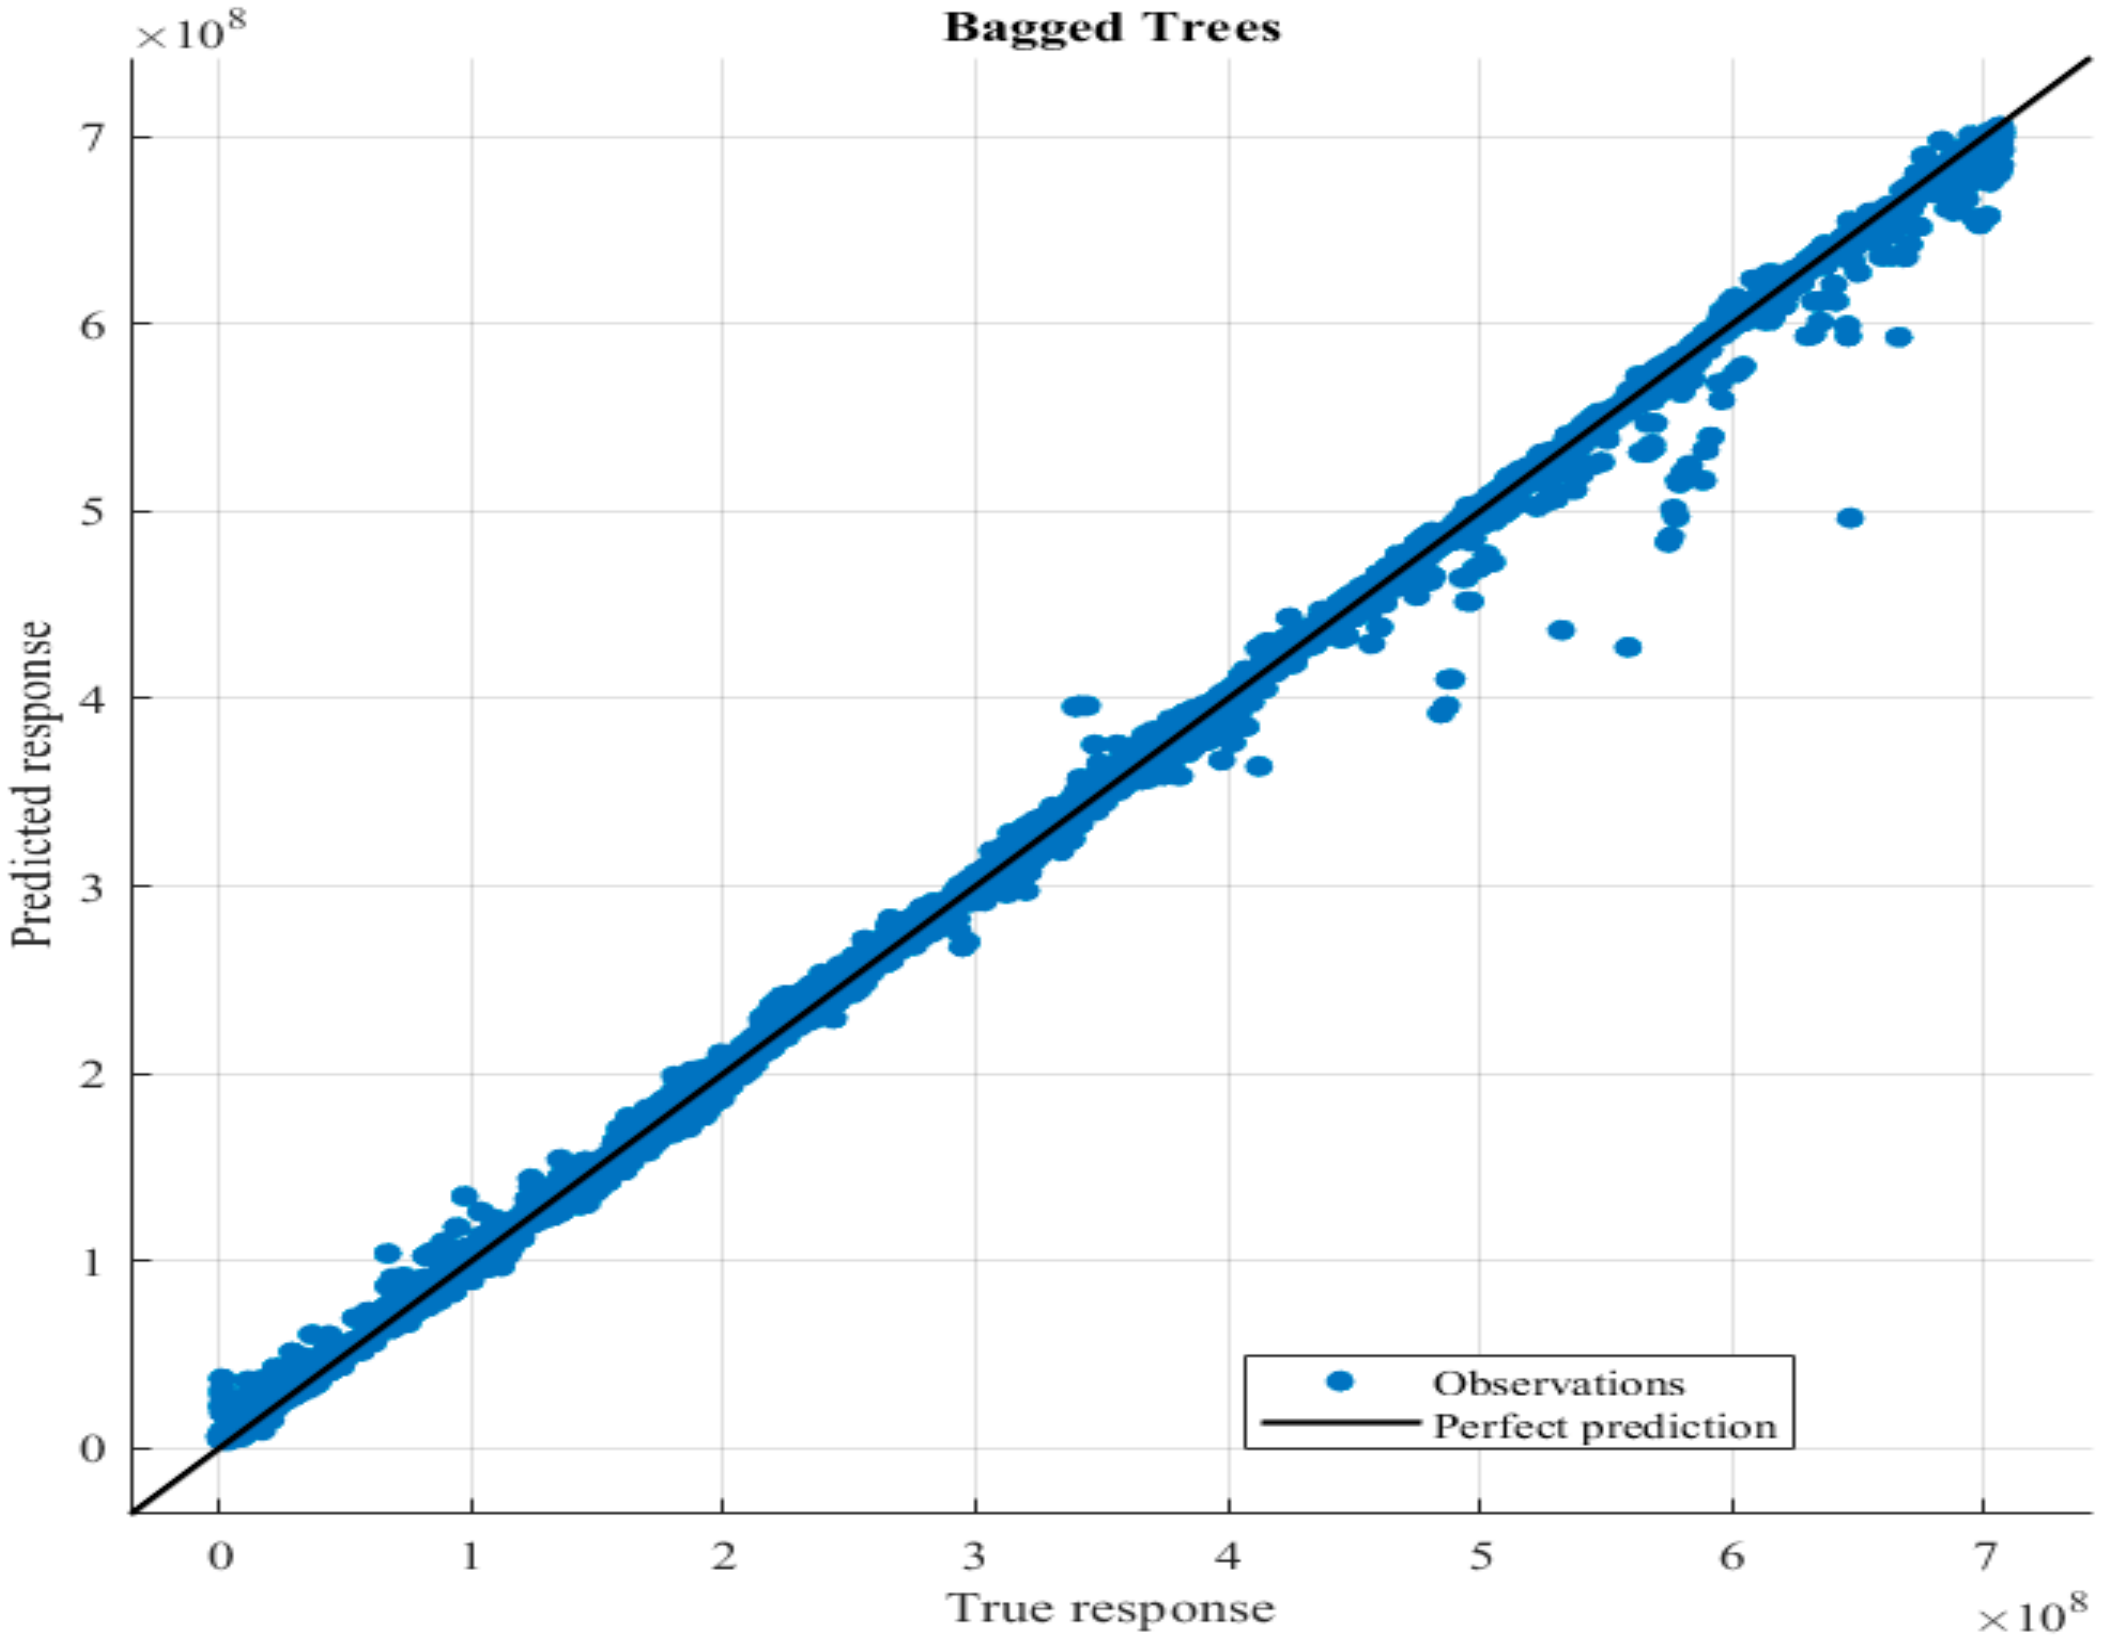
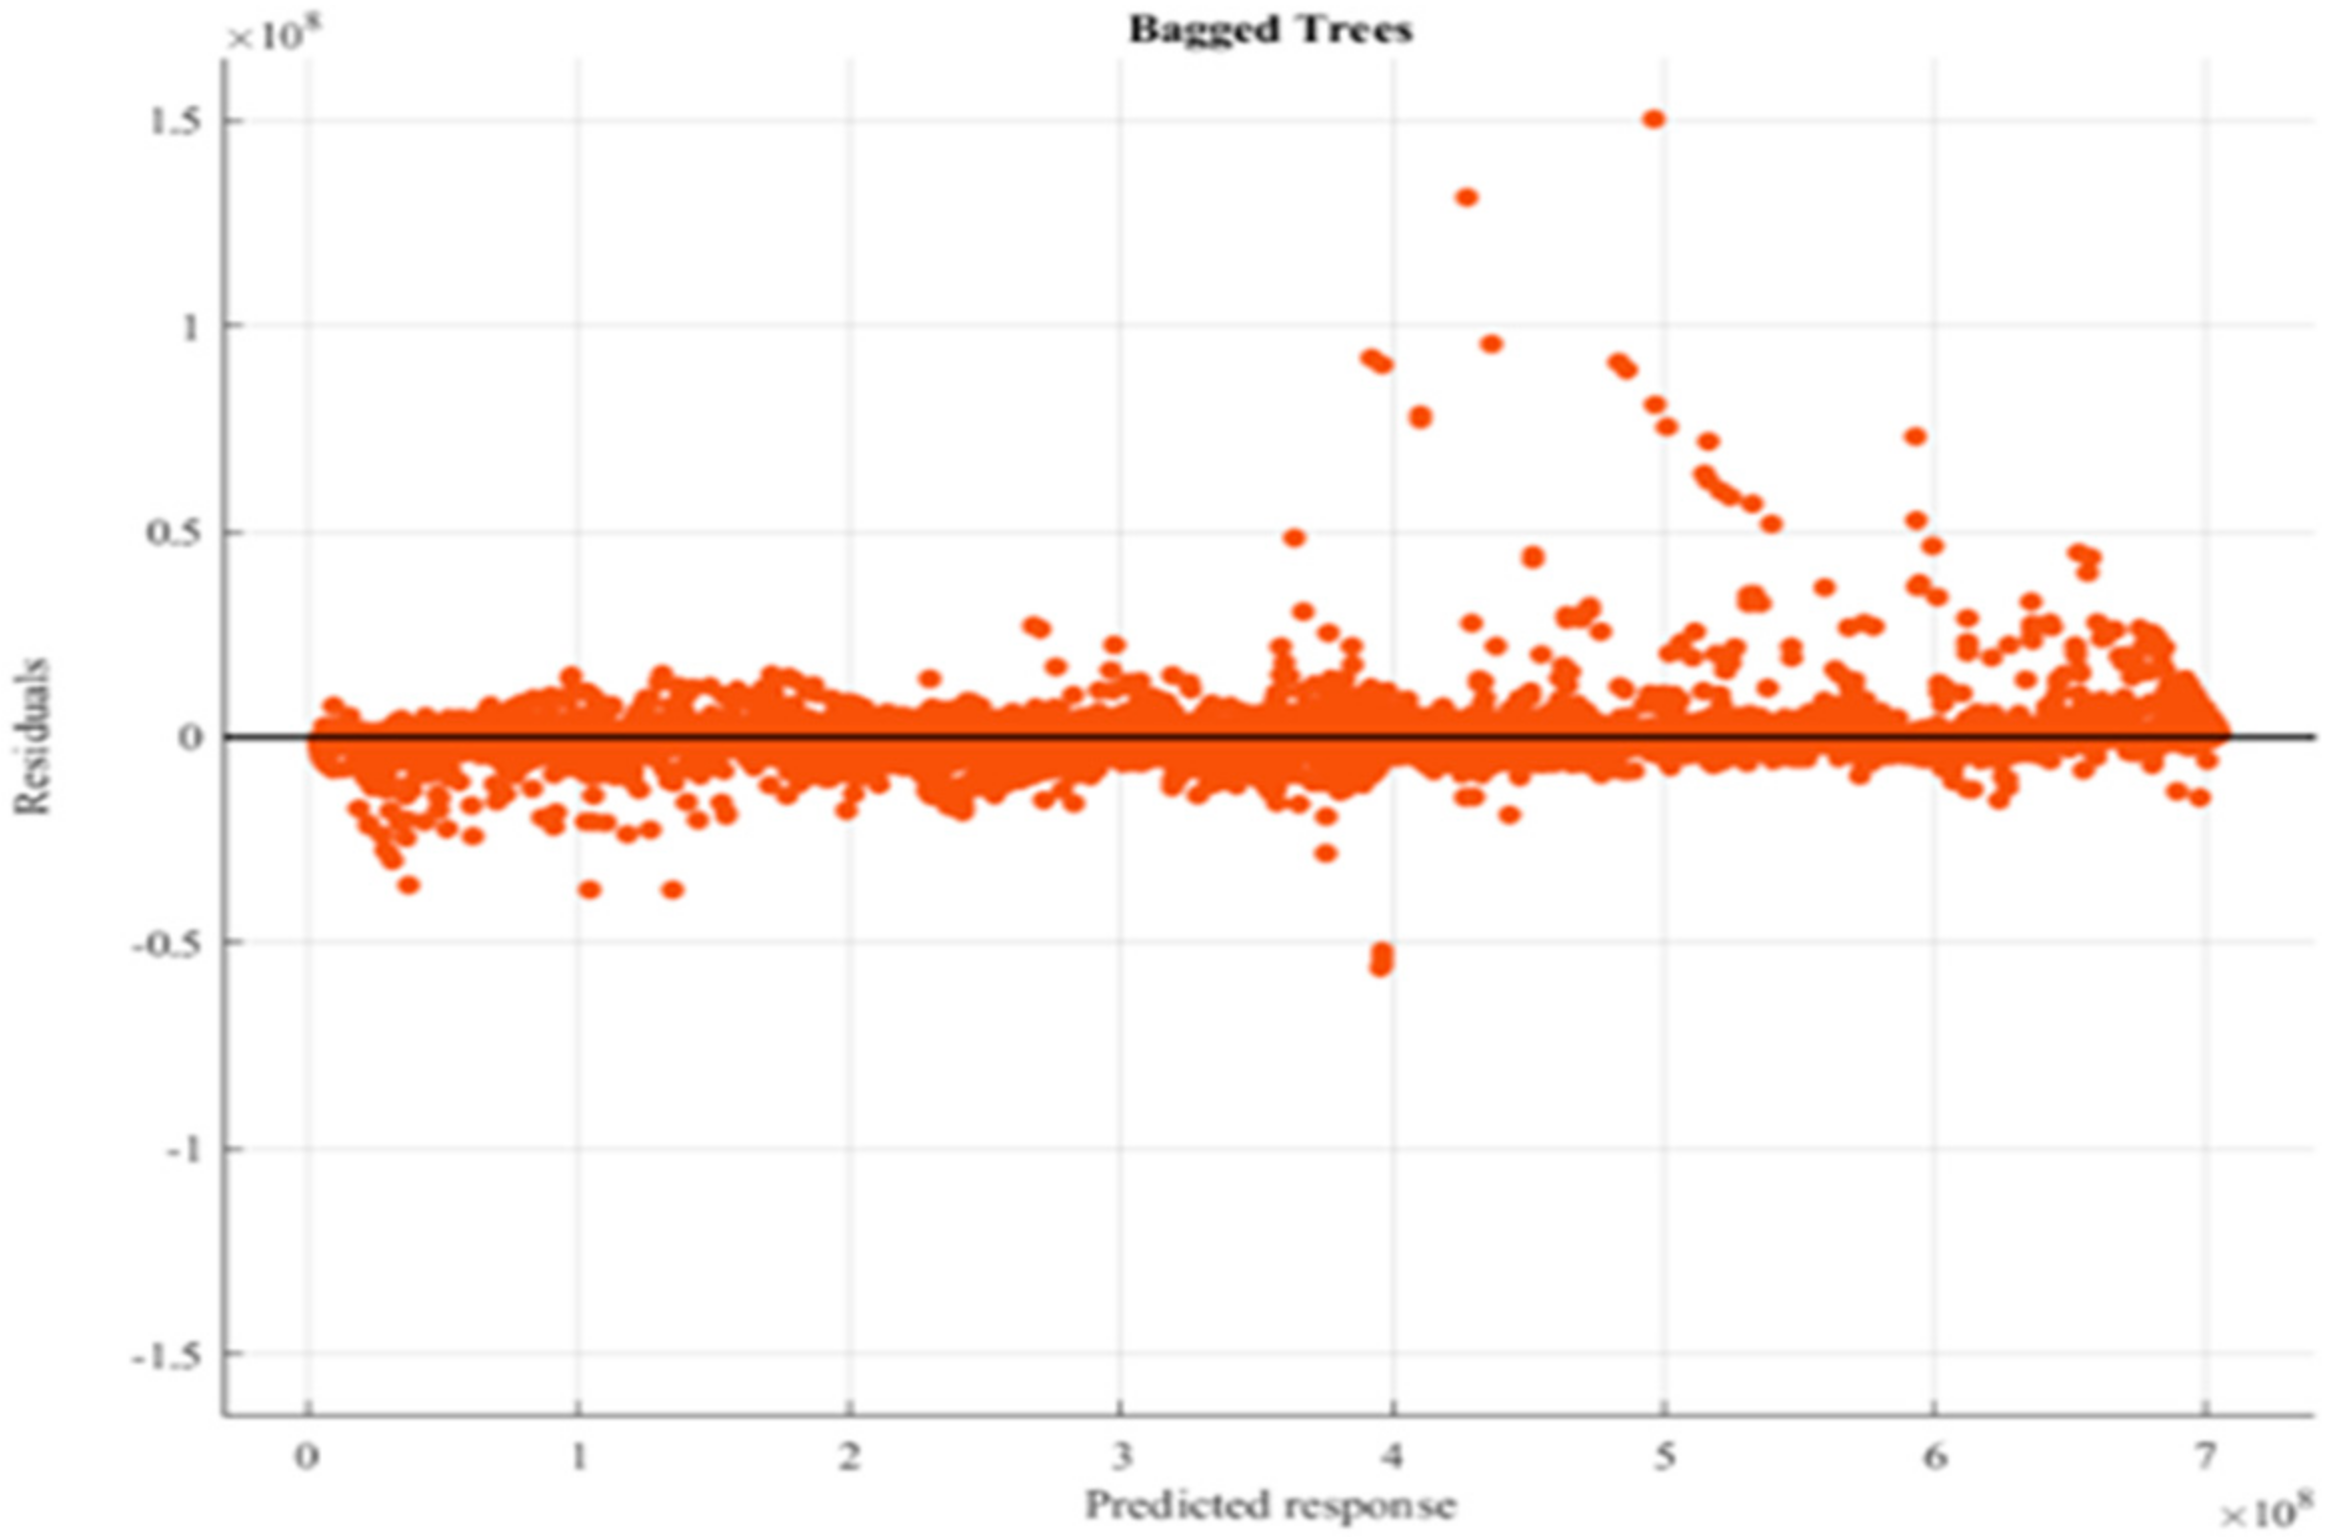
| Bagged Trees | 1.58 × 10⁶ | 1 | 2.48 × 10¹² | 1.06 × 10⁶ | 120,000 | 119.87 | 1.78 × 10⁶ | 1 | 3.17 × 10¹² | 1.09 × 10⁶ |
| Squared E × ponential GPR | 7.68 × 10⁷ | 0.85 | 5.89 × 10¹⁵ | 4.62 × 10⁷ | 200 | 9102.8 | 7.66 × 10⁷ | 0.85 | 5.87 × 10¹⁵ | 4.62 × 10⁷ |
| Matern 5/2 GPR | 6.40 × 10⁷ | 0.9 | 4.10 × 10¹⁵ | 3.87 × 10⁷ | 110 | 15,589 | 6.40 × 10⁷ | 0.9 | 4.10 × 10¹⁵ | 3.88 × 10⁷ |
| E × ponential GPR | 6.86 × 10⁷ | 0.88 | 4.70 × 10¹⁵ | 3.73 × 10⁷ | 130 | 14,212 | 6.87 × 10⁷ | 0.88 | 4.72 × 10¹⁵ | 3.73 × 10⁷ |
| Rational Quadratic GPR | 7.30 × 10⁷ | 0.86 | 5.33 × 10¹⁵ | 4.11 × 10⁷ | 110 | 15,637 | 7.28 × 10⁷ | 0.87 | 5.29 × 10¹⁵ | 4.11 × 10⁷ |
| Narrow Neural Network | 3.18 × 10⁷ | 0.97 | 1.01 × 10¹⁵ | 1.04 × 10⁷ | 1,000,000 | 254.45 | 3.12 × 10⁷ | 0.98 | 9.76 × 10¹⁴ | 1.03 × 10⁷ |
| Medium Neural Network | 2.54 × 10⁷ | 0.98 | 6.46 × 10¹⁴ | 1.46 × 10⁷ | 1,100,000 | 396.17 | 2.51 × 10⁷ | 0.98 | 6.32 × 10¹⁴ | 1.46 × 10⁷ |
| Wide Neural Network | 1.81 × 10⁷ | 0.99 | 3.27 × 10¹⁴ | 1.14 × 10⁷ | 630,000 | 1238.8 | 1.79 × 10⁷ | 0.99 | 3.19 × 10¹⁴ | 1.14 × 10⁷ |
| Bi-layered Neural Network | 3.77 × 10⁸ | −2.62 | 1.42 × 10¹⁷ | 3.21 × 10⁸ | 1,000,000 | 35.635 | 3.77 × 10⁸ | −2.6 | 1.42 × 10¹⁷ | 3.20 × 10⁸ |
| Tri-layered Neural Network | 3.77 × 10⁸ | −2.62 | 1.42 × 10¹⁷ | 3.21 × 10⁸ | 870,000 | 48.817 | 3.77 × 10⁸ | −2.6 | 1.42 × 10¹⁷ | 3.20 × 10⁸ |
| Algorithm | Efficacy Ranking | Efficiency Ranking |
|---|---|---|
| Bagged Trees | 1st | 3rd |
| Fine Trees | 2nd | 2nd |
| Medium Trees | 3rd | 1st |
Publisher’s Note: MDPI stays neutral with regard to jurisdictional claims in published maps and institutional affiliations. |
© 2022 by the authors. Licensee MDPI, Basel, Switzerland. This article is an open access article distributed under the terms and conditions of the Creative Commons Attribution (CC BY) license (https://creativecommons.org/licenses/by/4.0/).
Share and Cite
Akhtar, S.; Sujod, M.Z.B.; Rizvi, S.S.H. An Intelligent Data-Driven Approach for Electrical Energy Load Management Using Machine Learning Algorithms. Energies 2022, 15, 5742. https://doi.org/10.3390/en15155742
Akhtar S, Sujod MZB, Rizvi SSH. An Intelligent Data-Driven Approach for Electrical Energy Load Management Using Machine Learning Algorithms. Energies. 2022; 15(15):5742. https://doi.org/10.3390/en15155742
Chicago/Turabian StyleAkhtar, Shamim, Muhamad Zahim Bin Sujod, and Syed Sajjad Hussain Rizvi. 2022. "An Intelligent Data-Driven Approach for Electrical Energy Load Management Using Machine Learning Algorithms" Energies 15, no. 15: 5742. https://doi.org/10.3390/en15155742