Article

Natural Gas Sweetening Using an Energy-Efficient, State-of-the-Art, Solid–Vapor Separation Process

1
Department of Chemical Engineering, College of Engineering, Qatar University, Doha P.O. Box 2713, Qatar
2
Department of Chemical and Biomolecular Engineering, National University of Singapore, Engineering Drive 4, Singapore 117585, Singapore
*
Author to whom correspondence should be addressed.
Energies 2022, 15(14), 5286; https://doi.org/10.3390/en15145286
Submission received: 8 June 2022 / Revised: 28 June 2022 / Accepted: 4 July 2022 / Published: 21 July 2022

Abstract

:
With the anticipated rise in global demand for natural gas (NG) and liquefied natural gas (LNG), sour gas reserves are attracting the attention of the gas industry as a potential resource. However, to monetize these reserves, sour natural gas has to be sweetened by removing acid gases (carbon dioxide and/or hydrogen sulfide) before liquefaction. The solidification of these acid gases could be the basis for their separation from natural gas. In this study, a state-of-the art solid-vapor (SV) separation unit is developed for removal of acid gases from methane and simulated using a customized Aspen Plus operation unit. The operating principles and conditions, mathematical model, and performance results are presented for the SV unit. Further performance analyses, means of optimization and comparisons to conventional methods used by the industry were studied. Results showed that for similar sweet gas purity, the developed SV unit consumes only 27% of the energy required by the amine sweetening unit. Furthermore, it saves on capital costs, as it requires less equipment and does not suffer from high levels of corrosion.

1. Introduction

Natural gas (NG) consists mainly of methane (CH4) and can possibly be contaminated with acid gases, such as carbon dioxide (CO2) and/or hydrogen sulfide (H2S). A common practice in the NG industry is to liquefy it to produce liquefied natural gas (LNG), which can be more conveniently stored and transported. The global demand for LNG reached 360 million tons in the year 2020, and it is expected to reach 700 million tons by the year 2040 [1]. In order to meet the expected global energy demand, industry is now looking to exploit sour gas reserves around the world. However, sour natural gas may contain high concentrations of CO2 and/or H2S gases, which have to be removed before the NG liquefaction process [2]. This step is essential to obtain NG within the standard pipeline specifications [3], as acid gases accelerate corrosion in pipelines and the equipment of liquefaction plants [4]. Many technologies are used for acid gas removal from NG, with amine scrubbing (physicochemical absorption) being the most common technique [5]. The sulfinol process is a common method used to this end, utilizing blends of sulfolane (as a physical solvent) and diisopropanolamine (DIPA) (as a chemical solvent) [6]. This process is preferred in LNG applications, as sulfur compounds are more soluble in this blended solvent than in aqueous amines, and solvent loadings are preferred, especially under higher acid gas partial pressures [7]. Additionally, it requires lower circulation rates and it is less corrosive than other types of amine, requiring smaller equipment and lower capital cost [8]. However, such amine-scrubbing technologies are energy-intensive and suffer from high maintenance and operational costs due to the corrosivity and volatility of the amines [9]. Therefore, new technologies used to separate acid gases from NG were developed (such as adsorption, membrane separation, microbial algal systems, and cryogenic separation) [10].
Cryogenic separation technologies rely on the differences among the volatilities of different components to be separated physically [4]. They have many advantages over the amine absorption process. Such advantages include low environmental footprint, applicability in high- and low-pressure systems, the elimination of the need for solvents (thus, no solvent recovery plants are required) [11], lower corrosion potentials [4], and a high energetic efficiency [12]. They involve conventional (e.g., liquid–vapor separation), nonconventional (e.g., solid–vapor separation) [13], and hybrid methods [4]. In conventional methods (such as cryogenic distillation), avoiding solid formation is a necessity [13] because solids might block and damage the equipment and liquefaction train [12,14]. Nonconventional methods benefit from desublimation or solidification to improve the separation process and reduce the energy requirements [15]. Nonconventional technologies include cryogenic packed beds [16], moving packed beds [17], Stirling coolers [18], and cryogenic carbon capture with an external cooling loop (CCC-ECL) [19]. Hybrid technologies combine the benefits of conventional and nonconventional technologies into a single-unit operating system to overcome the disadvantages of conventional methods and achieve improved or similar results at lower cost than nonconventional technologies [4]. For example, in the controlled freezing zone (CFZ)TM [20], the separation of acid gases from methane depends on freezing CO2 and H2S to be removed from the mixture as solids [5,20]. Therefore, it is important to accurately determine the solidification limits and the associated phase equilibria in sour NG mixtures in order to design and optimize the corresponding separation equipment [5]. Maqsood et al. [21] developed a hybrid cryogenic network for separating CO2 from a CH4-CO2 mixture. The network consists of a packed bed and a cryogenic separator. The study was conducted in vapor–solid (packed bed) vs. vapor–liquid (VL) (cryogenic separator) and vapor–liquid–solid (VLS) (combination of the two units) phase regions. The results indicated that energy consumption was about 37% of the energy required by conventional cryogenic distillation network. However, this study only dealt with and CH4-CO2 mixture and was not expanded to include a ternary mixture of CH4-CO2-H2S gases. Furthermore, the results were never compared to the industry-common amine sweetening unit.
Ababneh and Al-Muhtaseb developed an empirical correlation model based on the Peng–Robinson equation of state (PR EoS), which was able to describe the solid–liquid–vapor equilibria (SLVE) for the ternary system of CH4-CO2-H2S [22]. Additionally, they suggested an equilibrium stage separation unit based on that model to separate sour gases from methane. The SLVE and the separation unit were simulated using Aspen Custom Modeler (ACM) software [22]. It was concluded that conducting the separation in the solid–vapor equilibrium (SVE) region would produce higher-purity methane and higher recovery for CO2 and H2S when compared to the SLVE region.
In this study, we build on the conclusion of Ababneh and Al-Muhtaseb [22], and a solid–vapor (SV) separation unit is further developed, with additional energy balance calculations for the unit added to the ACM model. The ACM model is successfully exported to the Aspen Plus environment, and sample performance results are presented herein. The performance of the SV separation unit is analyzed, optimized, and compared to other traditional CO2 separation technologies (such as amine scrubbing), in terms of the product quality (CH4 purity), removal ratio of acid gases, and the energy requirements.

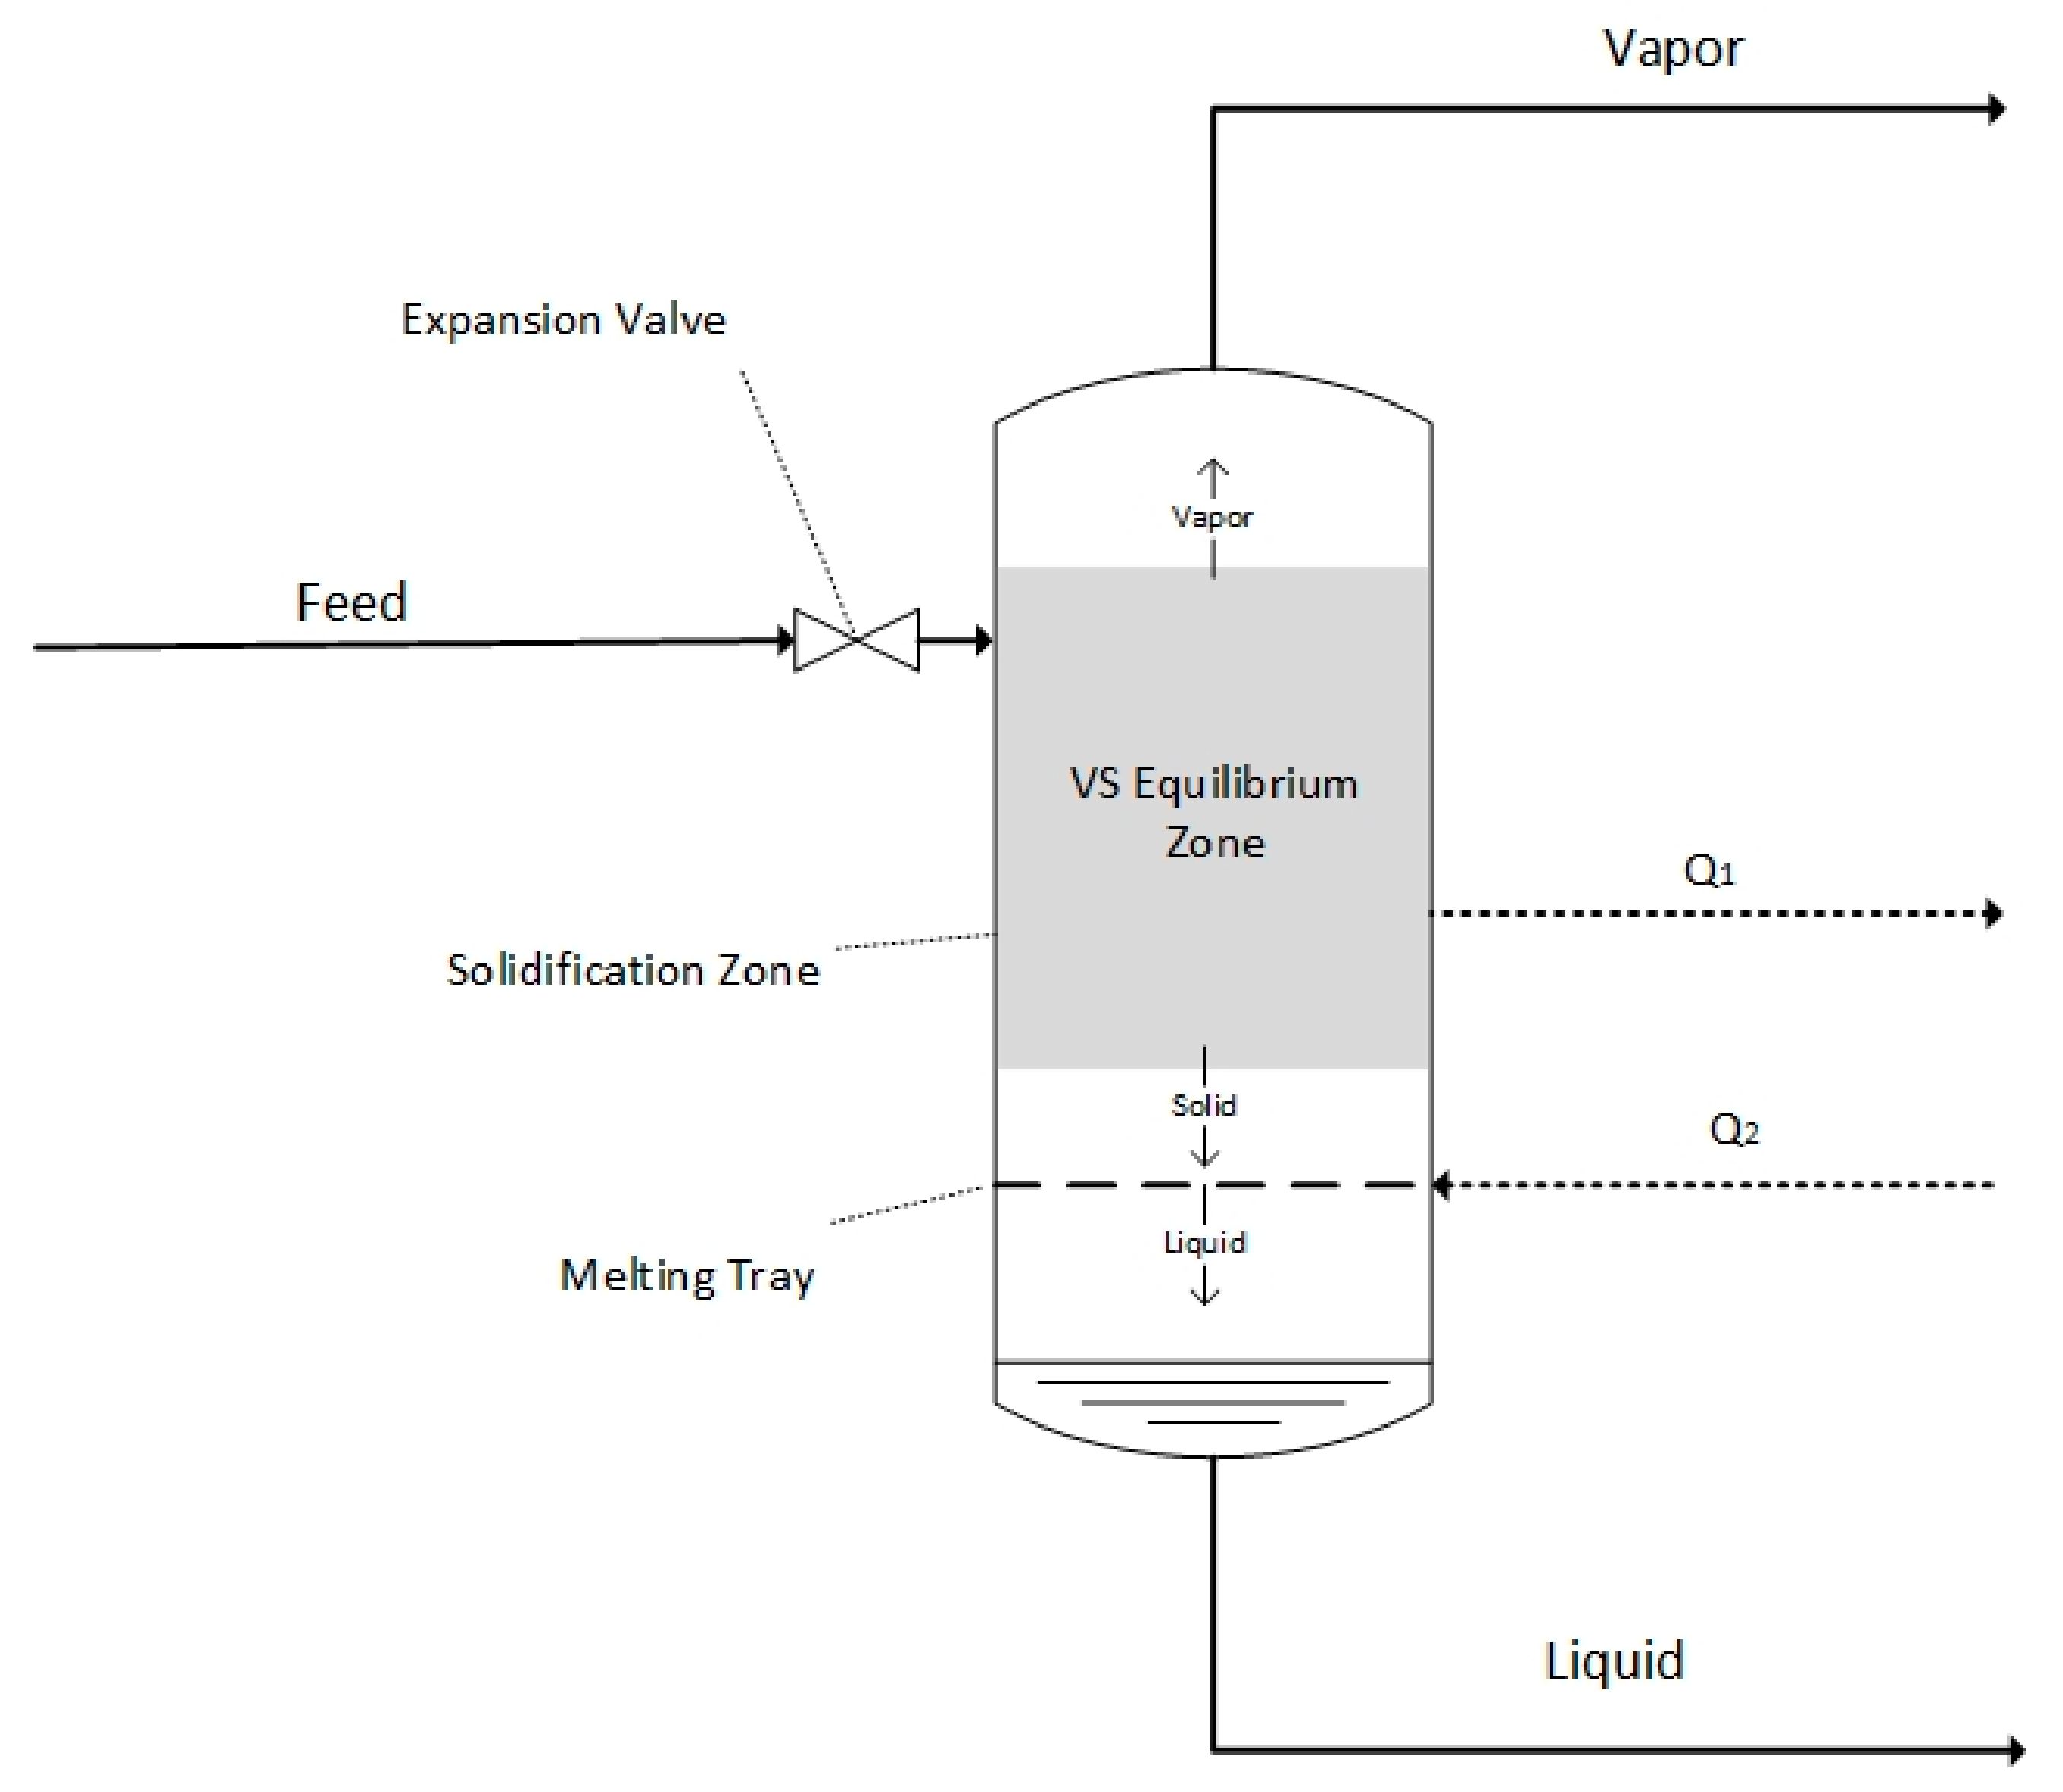
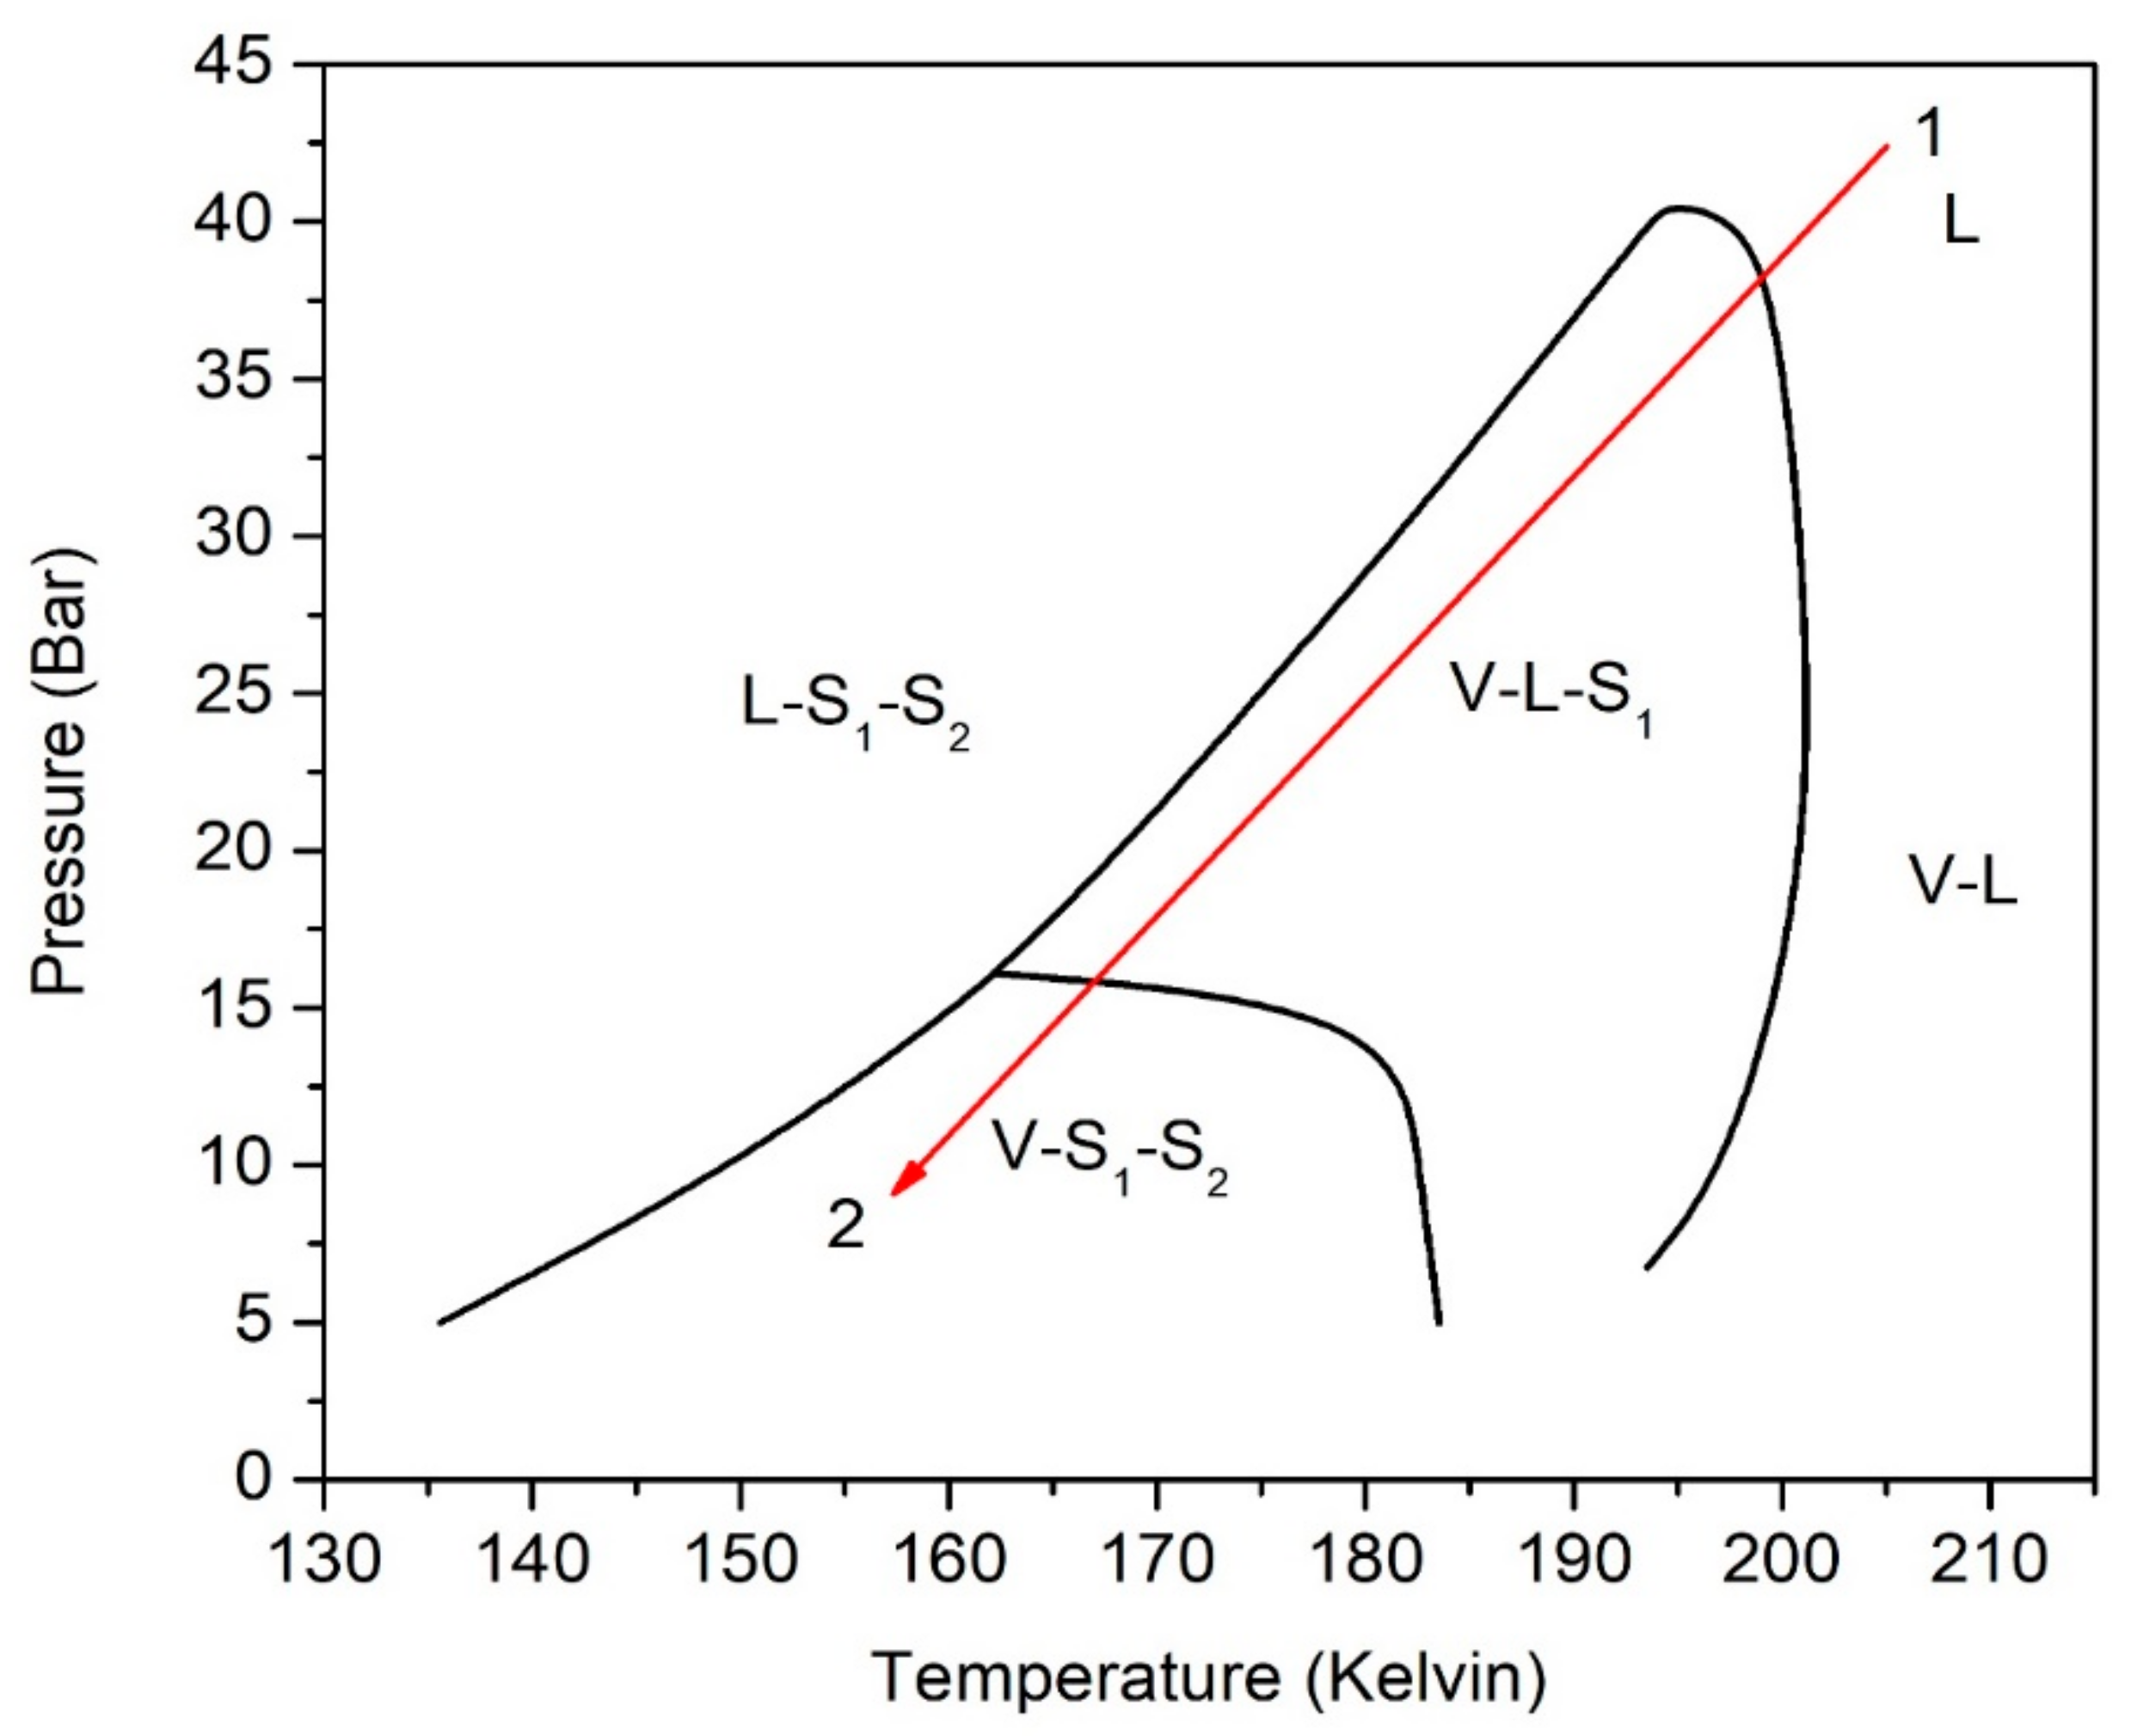
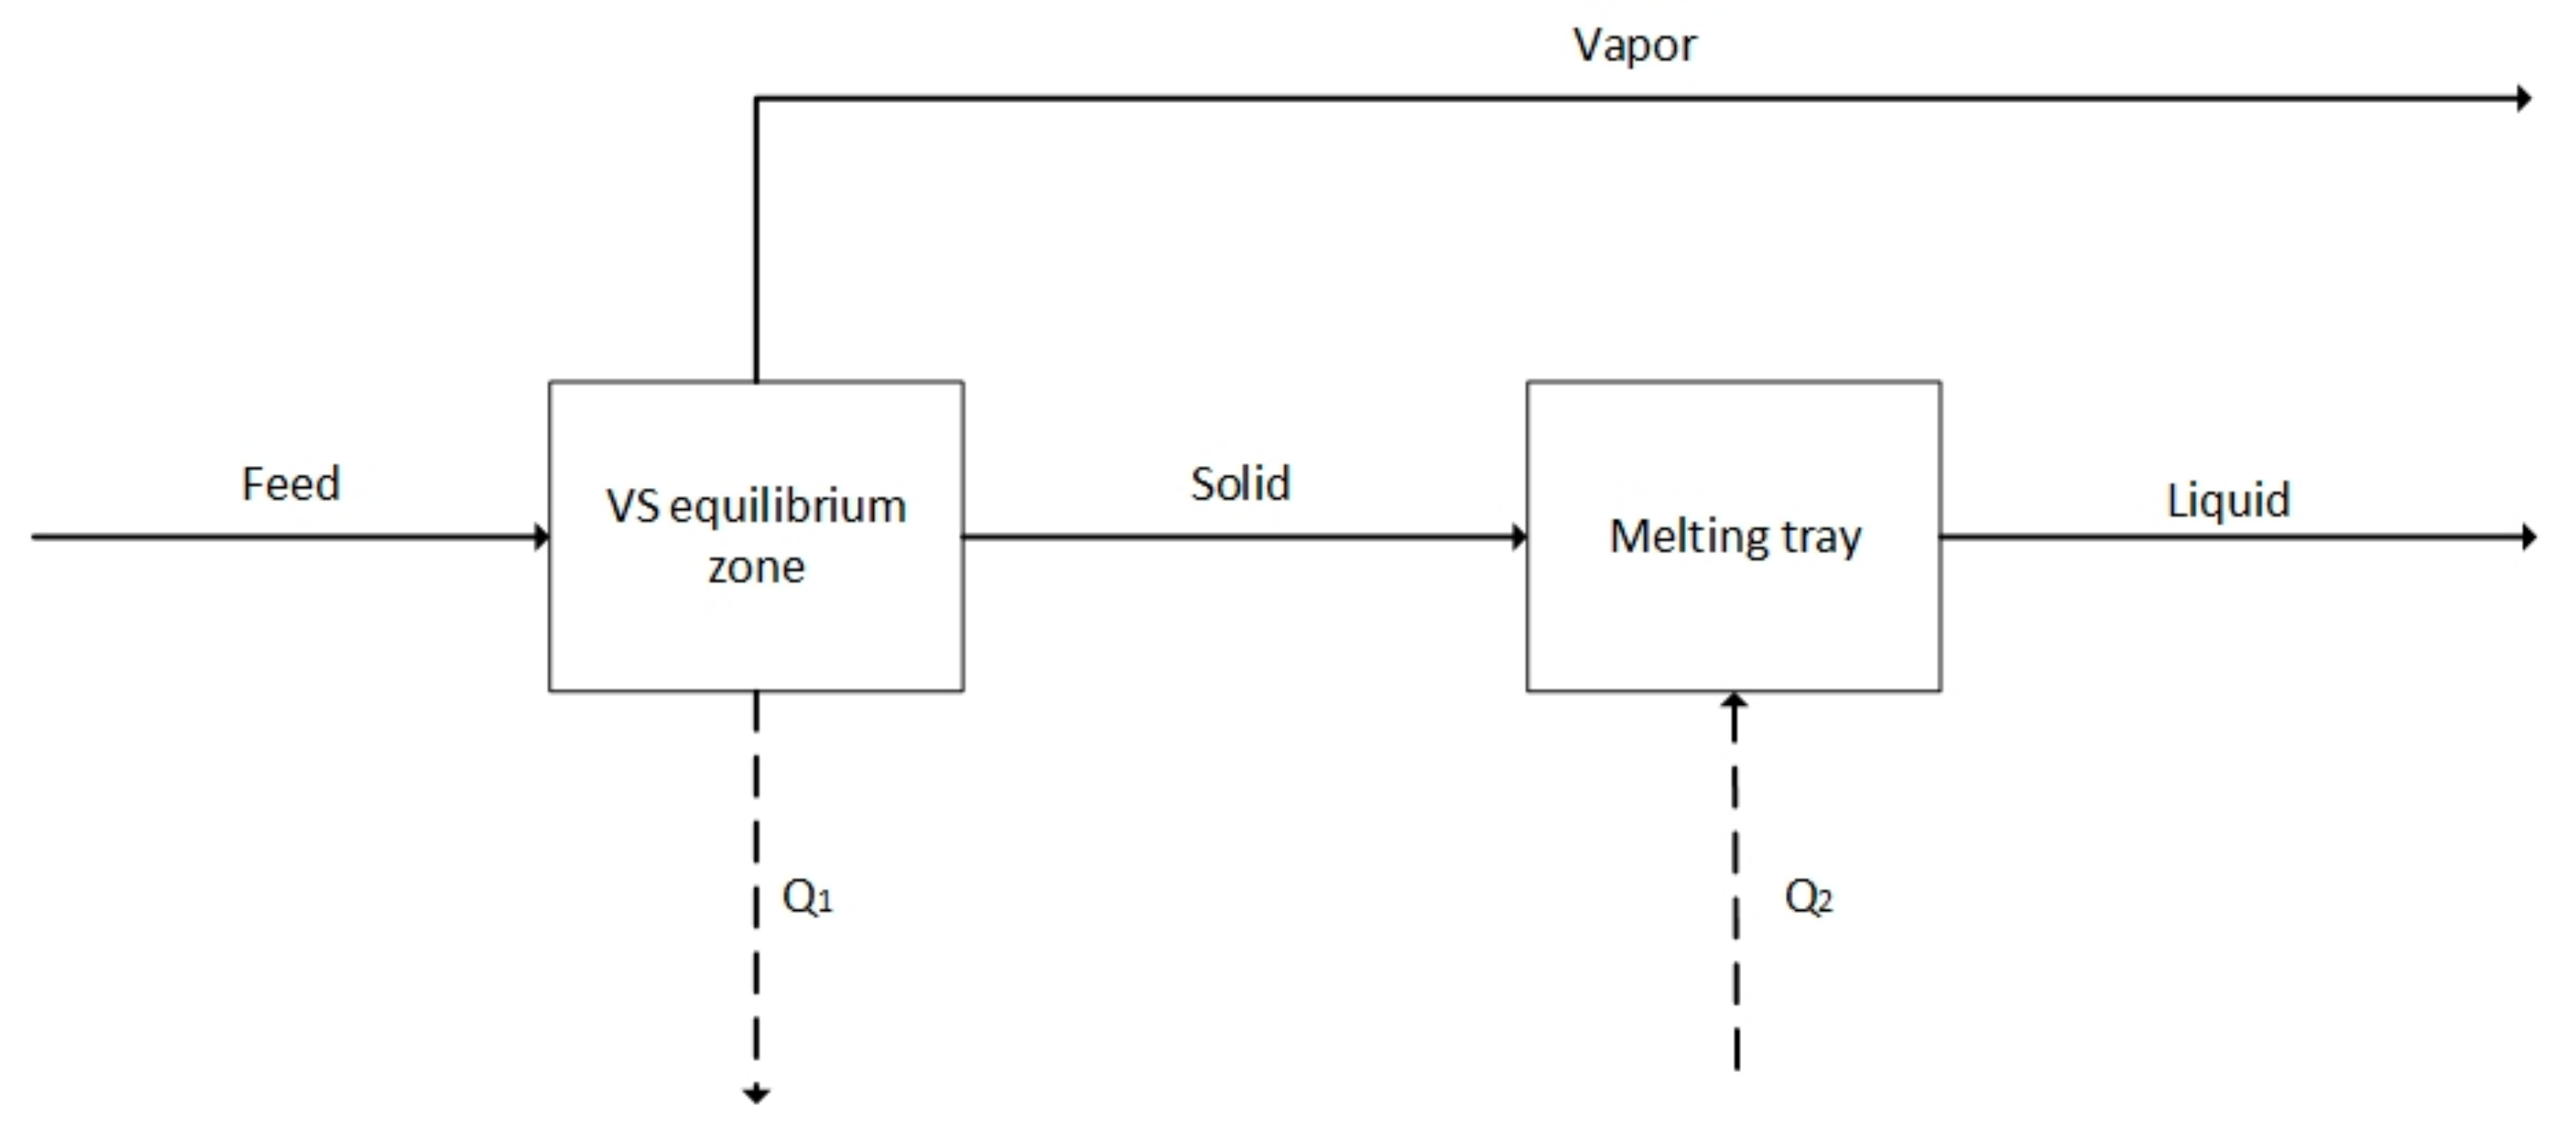
2. SV Separation Unit

Figure 1 shows a schematic diagram of the suggested separation unit, which involves an expansion valve on the feed stream leading to the separation unit. The separation unit involves a solid–vapor equilibrium (SVE) separation zone and a heated melting tray beneath the SVE zone.
The feed, which should initially be in liquid phase, is throttled using the expansion valve. Ideally, the throttling process is performed adiabatically, but subsequent cooling (Q1) might be required to either ensure that its pressure and temperature drop to a condition that corresponds to the SVE zone (where CH4 remains in the vapor phase and only CO2 and H2S solidify [22]) or enhance the separation of acid gases. Figure 2 further explains this process; the conditions of the feed stream (point “1”) are transformed to reach point “2”, at which the mixture enters the solidification zone and the separation of acid gases into a solid phase is achieved. The formed solids (in the SVE zone) descend due to their higher densities, reaching the melting tray, which is supplied with sufficient heat (Q2) to melt the solids into a liquid stream. The formed liquid stream (consisting of CO2 and H2S) can be collected at the bottom of the unit, whereas high-purity methane gas is collected at the top of the unit.
In the SVE solidification zone, CH4 does not solidify under the studied conditions [22]; it remains fully in the vapor phase. Only CO2 and H2S coexist in the vapor and solid phases. For SVE, their fugacities must be the same in each phase, as listed in Equations (1) and (2). On the other hand:
f ^ C O 2 V = f ^ C O 2 S
f ^ H 2 S V = f ^ H 2 S S
where superscripts V and S refer to the vapor and solid phases, respectively; and the fugacities f ^ C O 2 V , f ^ H 2 S V , f ^ C O 2 S , and f ^ H 2 S S are given by Equations (3)–(6) [22,23].
f ^ H 2 S V = y H 2 S φ ^ H 2 S V P
f ^ C O 2 V = y C O 2 φ ^ C O 2 V P
f ^ C O 2 S = x C O 2   φ ^ C O 2 S u b T ,   P C O 2 S u b   P C O 2 S u b   e x p v C O 2 s R T P P C O 2 S u b
f ^ H 2 S S = x H 2 S   φ ^ H 2 S S u b T ,   P H 2 S S u b P H 2 S S u b   e x p v H 2 S s R T P P H 2 S S u b
where yi and φ ^ i V are the mole fraction and fugacity coefficient, respectively, of component i in the vapor phase; P and T are the pressure and temperature of the SVE unit, respectively; xi is the mole fraction of component i in the solid phase; P i S u b is the sublimation pressure of component i at the specified temperature, T; φ ^ i S u b is the fugacity coefficient of the solid component, i (at T and P i S u b ); and v i s is the solid-phase molar volume of component i. Note that the exponential terms in Equations (5) and (6) often approach unity and can sometimes be ignored, especially when the solid-phase molar volume of component i is unknown (such as in the case of H2S).
P C O 2 S u b and P H 2 S S u b can be calculated in terms of temperature (T) using Equations (7) and (8), respectively [24,25].
ln P C O 2 S u b P t = T t T   14.740846   1 T T t + 2.4327015   1 T T t 1.9 ± 5.3061778   1 T T t 2.9
where ( T t = 216.592 K, P t = 0.51795 MPa) are the triple-point conditions of pure CO2.
log 10 P H 2 S S u b = 7.22418 118.0 T 0.196426   T + 0.0006636 T 2
The material balance equations for the SV separation unit are given by:
Total material balance:
n ˙ F e e d = n ˙ V a p o r + n ˙ L i q u i d
Material balance on CH4:
z C H 4 n ˙ F e e d = y C H 4 n ˙ V a p o r
Material balance on CO2:
z C O 2 n ˙ F e e d = y C O 2 n ˙ V a p o r + x C O 2 n ˙ L i q u i d
n ˙ L i q u i d = n ˙ S o l i d = n ˙ S o l i d C O 2 + n ˙ S o l i d H 2 S
x C O 2 + x H 2 S = 1
y C H 4 + y C O 2 + y H 2 S = 1
x C O 2 = n ˙ S o l i d C O 2 n ˙ S o l i d
where n ˙ F e e d , n ˙ V a p o r , and n ˙ S o l i d are the total molar flow rates of the feed stream, vapor stream, and solid (or liquid) streams, respectively; and zi is the mole fraction of component i in the feed.
The separation unit has two utility streams: Q1 and Q2. Q1 represents cooling of the feed stream (which is being adiabatically throttled) to either reach the conditions of the SVE zone or enhance the solidification of acid gases. Q2 represents heating required to melt the solids formed in the SVE zone. Note that cooling (Q1) is required only if adiabatic throttling of the feed (in the expansion valve) is not sufficient to reach the conditions in the SVE region, as illustrated in Figure 2, or if further solidification of acid gases is needed, where the cooling step will take place after the throttling valve. Figure 3 further explains the mass and energy flow schemes for the SV separation unit.
Q ˙ 1 is the cooling rate for the feed stream (if needed), and Q ˙ 2 is the heating rate required to melt solids formed in the SVE zone into a liquid stream. Steady-state energy balances on the two subsystems illustrated in Figure 3 give:
Q ˙ 1 = H ˙ F e e d ( H ˙ V a p o r + H ˙ S o l i d s )
Q ˙ 2 = H ˙ l i q u i d H ˙ S o l i d s
where:
H ˙ F e e d = n ˙ F e e d h L i q u i d T F e e d , P F e e d
H ˙ V a p o r = n ˙ V a p o r   h V a p o r T , P
H ˙ l i q u i d = n ˙ L i q u i d h L i q u i d T , P
and   H ˙ S o l i d s = n ˙ S o l i d _ C O 2 h S o l i d _ C O 2 + n ˙ S o l i d _ H 2 S h S o l i d _ H 2 S
where H ˙ is the enthalpy flow rate; h is the molar enthalpy of the component/stream; h V a p o r is the molar enthalpy of the vapor stream emerging from the SVE unit; and h L i q u i d and h S o l i d are the molar enthalpies of the liquid stream emerging from the melting tray and the solid stream entering to the melting tray at T and P, respectively. They are determined under the corresponding conditions by the built-in Aspen Plus models. Furthermore, the molar enthalpies of the solid phase can be estimated by:
h S o l i d _ C O 2 T , P = h V a p o r _ C O 2 T , P Δ h C O 2 s u b
h S o l i d _ H 2 S T , P = h V a p o r _ H 2 S T , P Δ h H 2 S s u b
where Δ h i s u b is the enthalpy of sublimation of component i , which equals 28.83 kJ/mol for CO2 [26] and 23.8 kJ/mol for H2S [27].

3. Results and Discussion

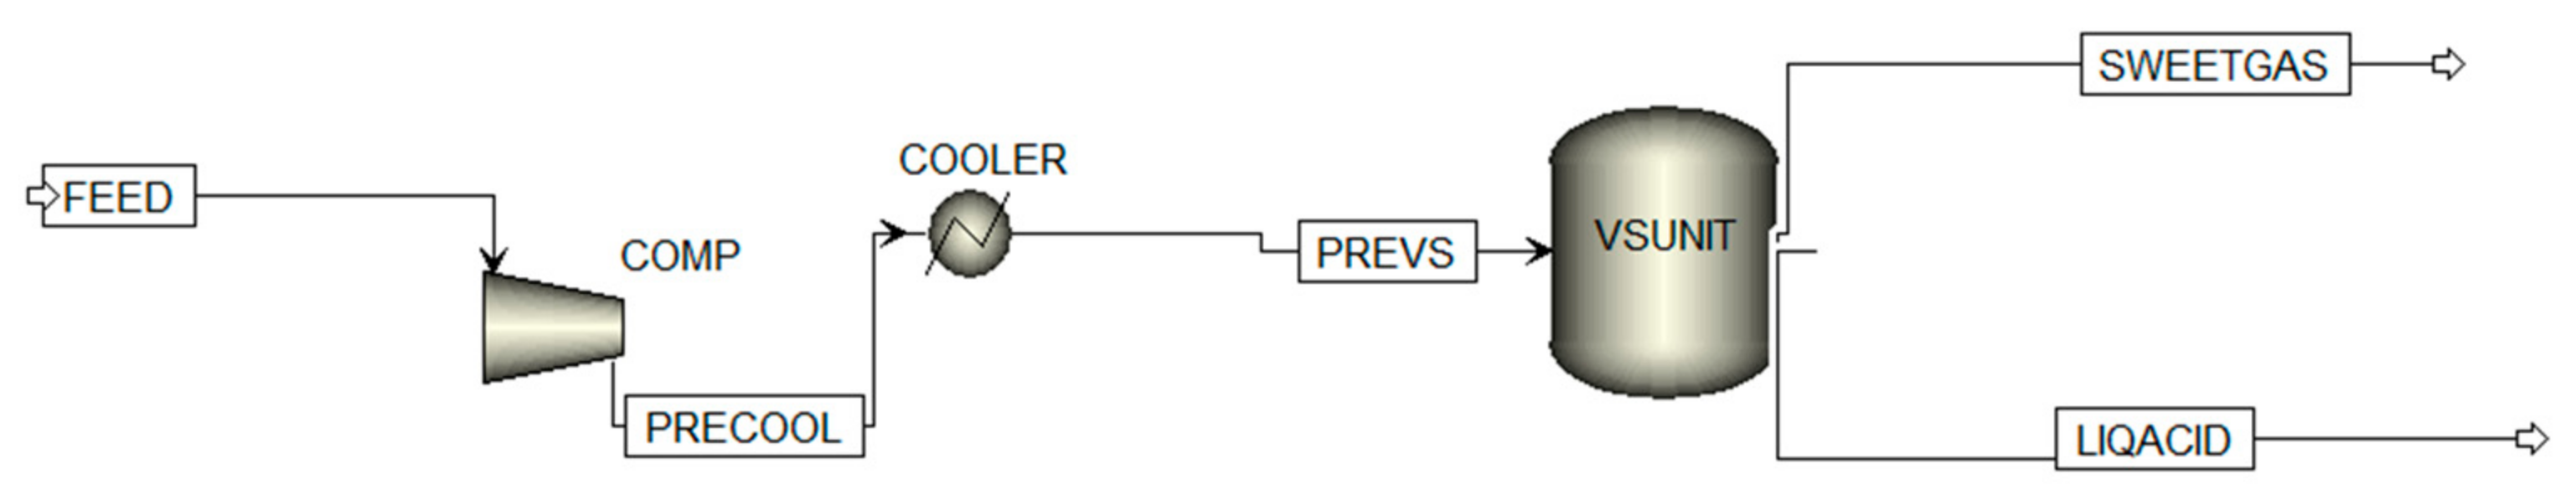
3.1. SV Separation Unit

The SV separation unit model (described by the equations presented above) was exported to Aspen Plus for simulation. The following three-feed compositions (mole%) were tested:
Feed A (80% CH4, 10% CO2, 10% H2S);
Feed B (80% CH4, 15% CO2, 5% H2S);
Feed C (70% CH4, 17.5% CO2, 12.5% H2S); and
Feed C’ (70% CH4, 17.5% CO2, 12.5% H2S) with additional cooling.
The feeds at 80 bar and 200 K were throttled to 10 bar to assure that the SV unit was in the SVE zone, as illustrated in Figure 2 and predicted elsewhere [22]. The overall performance results are listed in Table 1.
Table 1 shows that when the methane composition in the feed stream is high (such as in cases A and B), the sweet gas (vapor outlet) stream would have a higher purity of methane. However, when a sourer gas is fed to the unit (such as in case C), the methane purity in the outlet vapor would be relatively low. Therefore, the operation conditions could be optimized if required, for example, by adjusting the temperature of the SV equilibrium unit (cooling it down) or adding another SV separation unit.
The first option for optimization (further cooling of the feed stream) is demonstrated in case C’, where the feed was cooled down to 165 K (in addition to being adiabatically throttled). The purity of the produced methane improved significantly to about 99%, and the gas removal ratios also increased significantly. However, a cooling rate ( Q ˙ 1 ) of 485 W/(mole of the feed) is required, whereas a higher heating rate ( Q ˙ 2 ) was needed to melt the acid gases as a result of higher solidification amounts of CO2 and H2S.

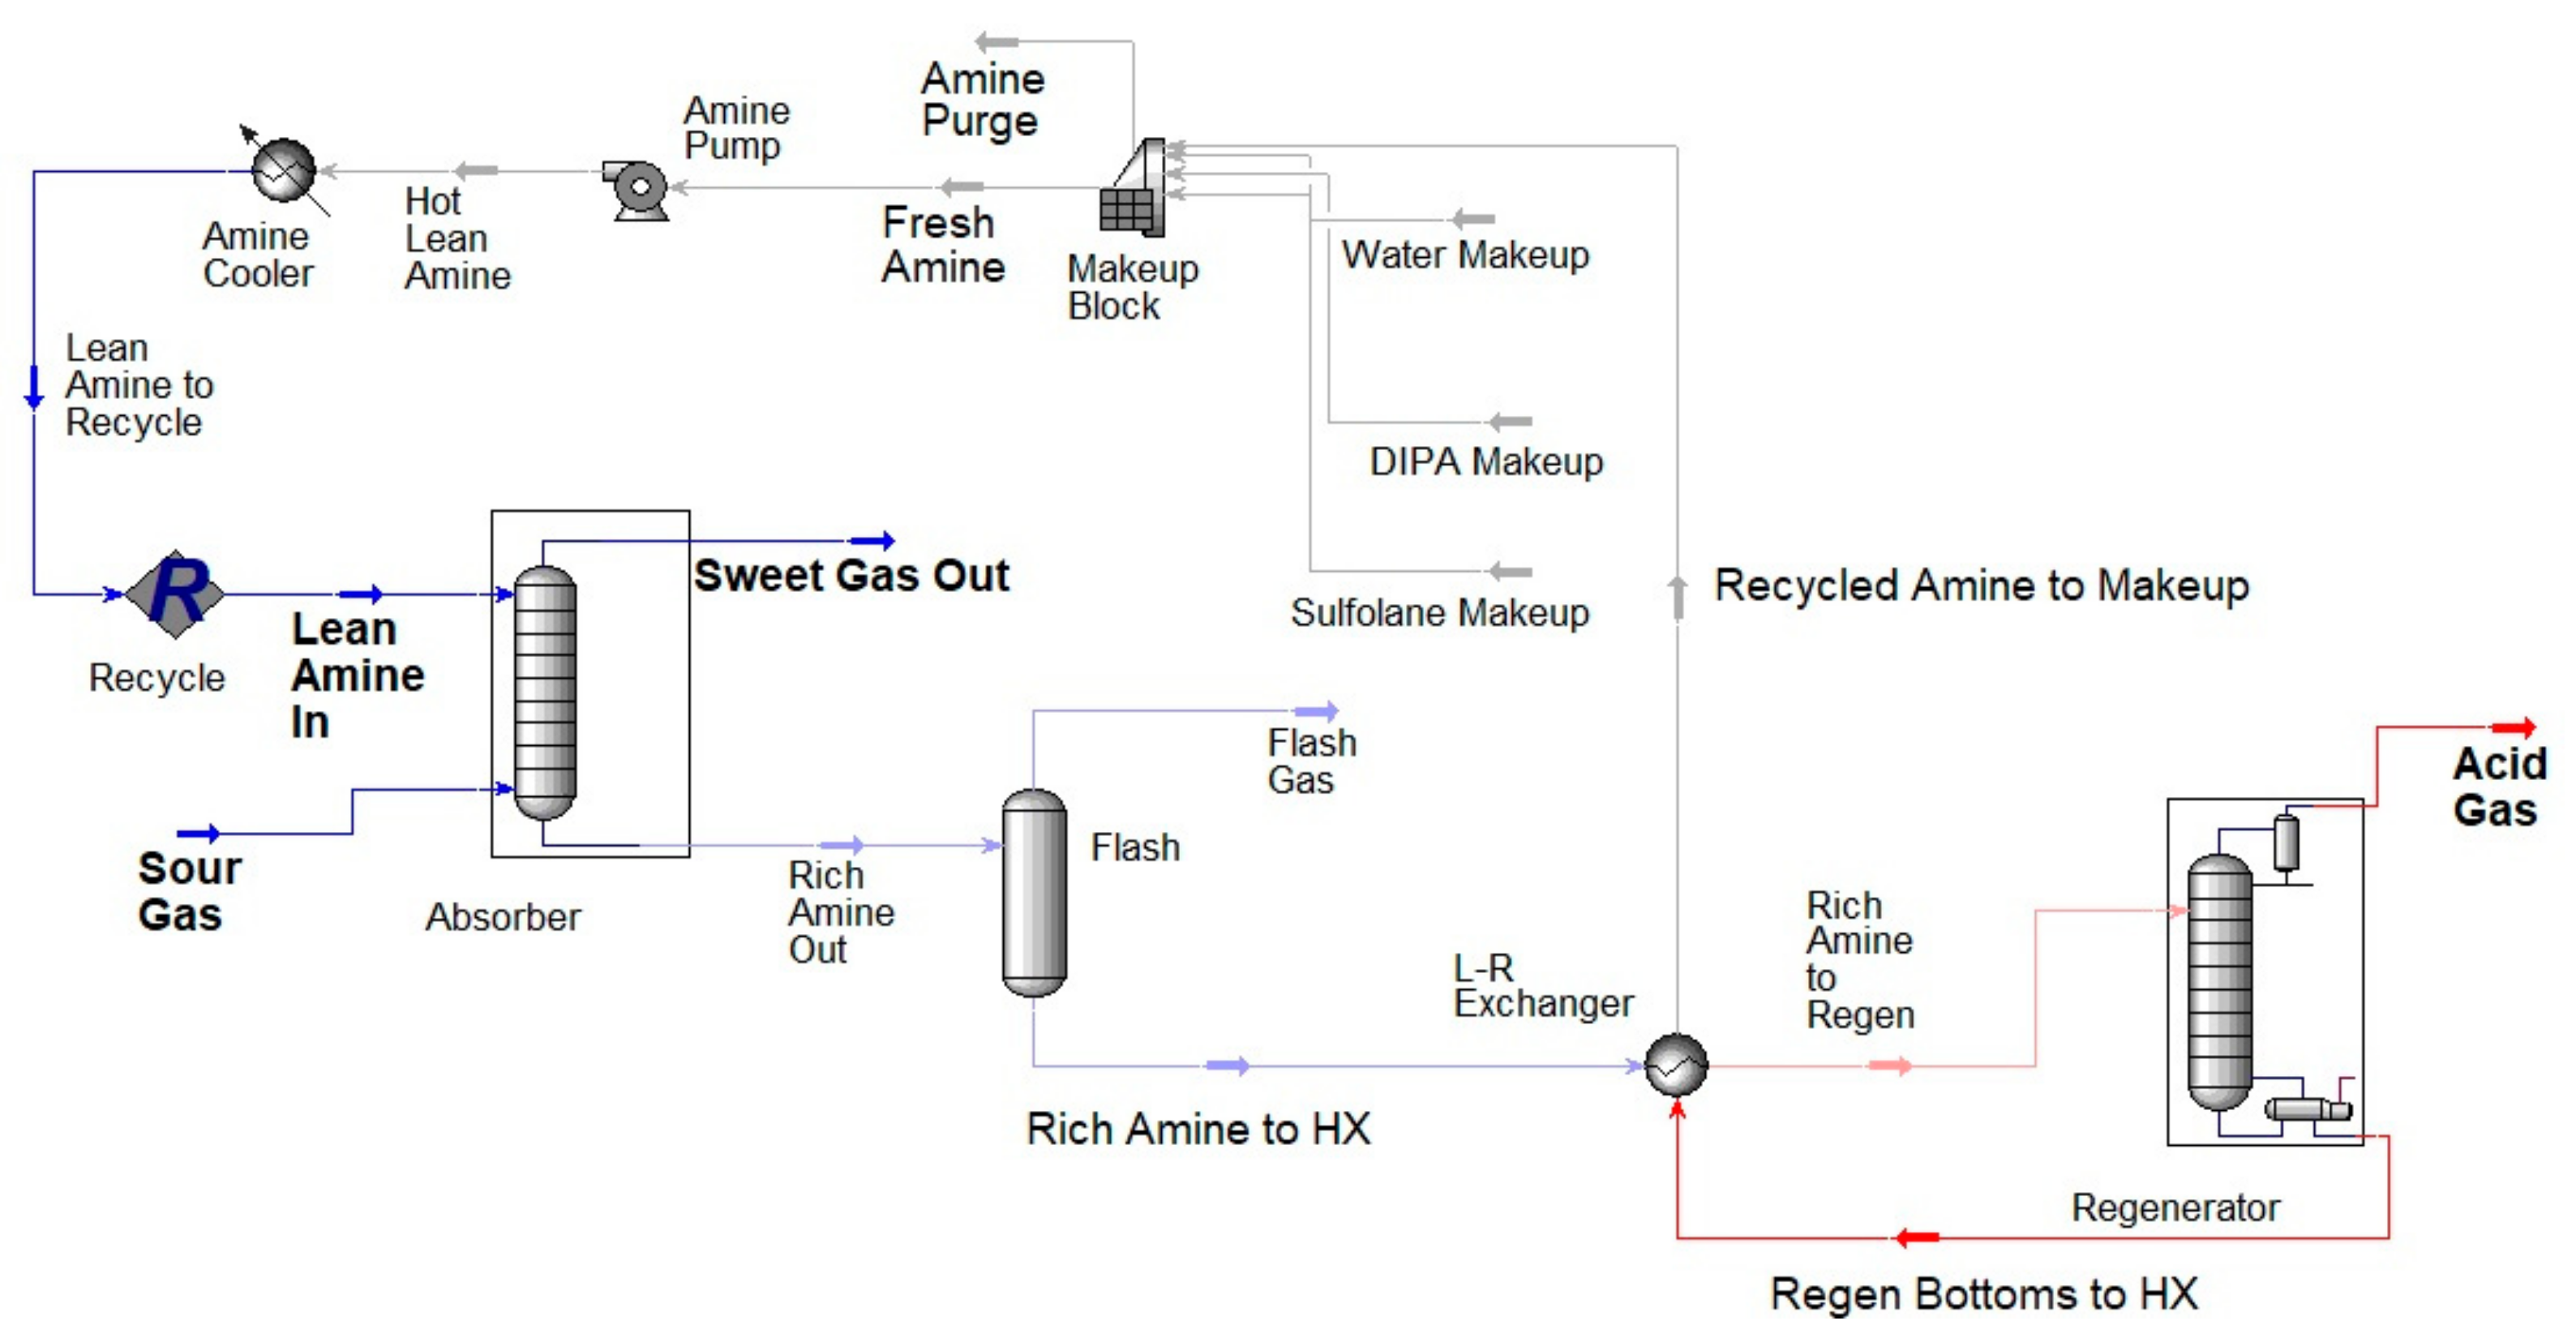
3.2. Comparison with a Traditional Amine-Sweetening Unit

A traditional amine-sweetening unit was simulated using Aspen Hysys® software. Two different feed compositions (with low and high concentrations of acid gases), where the compositions represent actual natural gas streams extracted in state of Qatar, were tested. Furthermore, in this study, only CH4, CO2, and H2S gases were considered, and the compositions were normalized to exclude other trace gases (such as C2+). The two cases of tested feed stream compositions and conditions are presented in Table 2.
The targeted goal is to produce a sweetened gas stream with a minimum purity of 99.7%. Figure 4 shows a traditional acid gas treatment flow sheet employing sulfolane and DIPA as a chemical solvent under high pressure to remove H2S and CO2 from sour gas. The sour gas is fed into a high-pressure absorber (45 bar), which purifies the natural gas mixture to the sales gas specification. Then, acid gases are stripped from the rich amine in a regenerator column, which operates under low pressure (2 bar) and high temperature (135 °C) and recycles the sulfolane and DIPA-lean solvent (with potential makeup) back to the absorber column.
Figure 5 illustrates a process flow diagram of the SV separation unit. A feed gas under the same conditions (40 °C and 45 bar) is fed to a compressor, with the output pressure between 70 and90 bar. Then, the sour gas is cooled and liquefied to 210 K. The liquid mixture is then throttled adiabatically just before entering the SV unit and cooled further if deemed necessary (e.g., to improve the SV separation). Vapor–solid separation takes place in the SV unit, and the sweet gas flows to the top of the unit, whereas the sour gases are collected at the bottom of the unit in the liquid phase (as explained in Section 2).

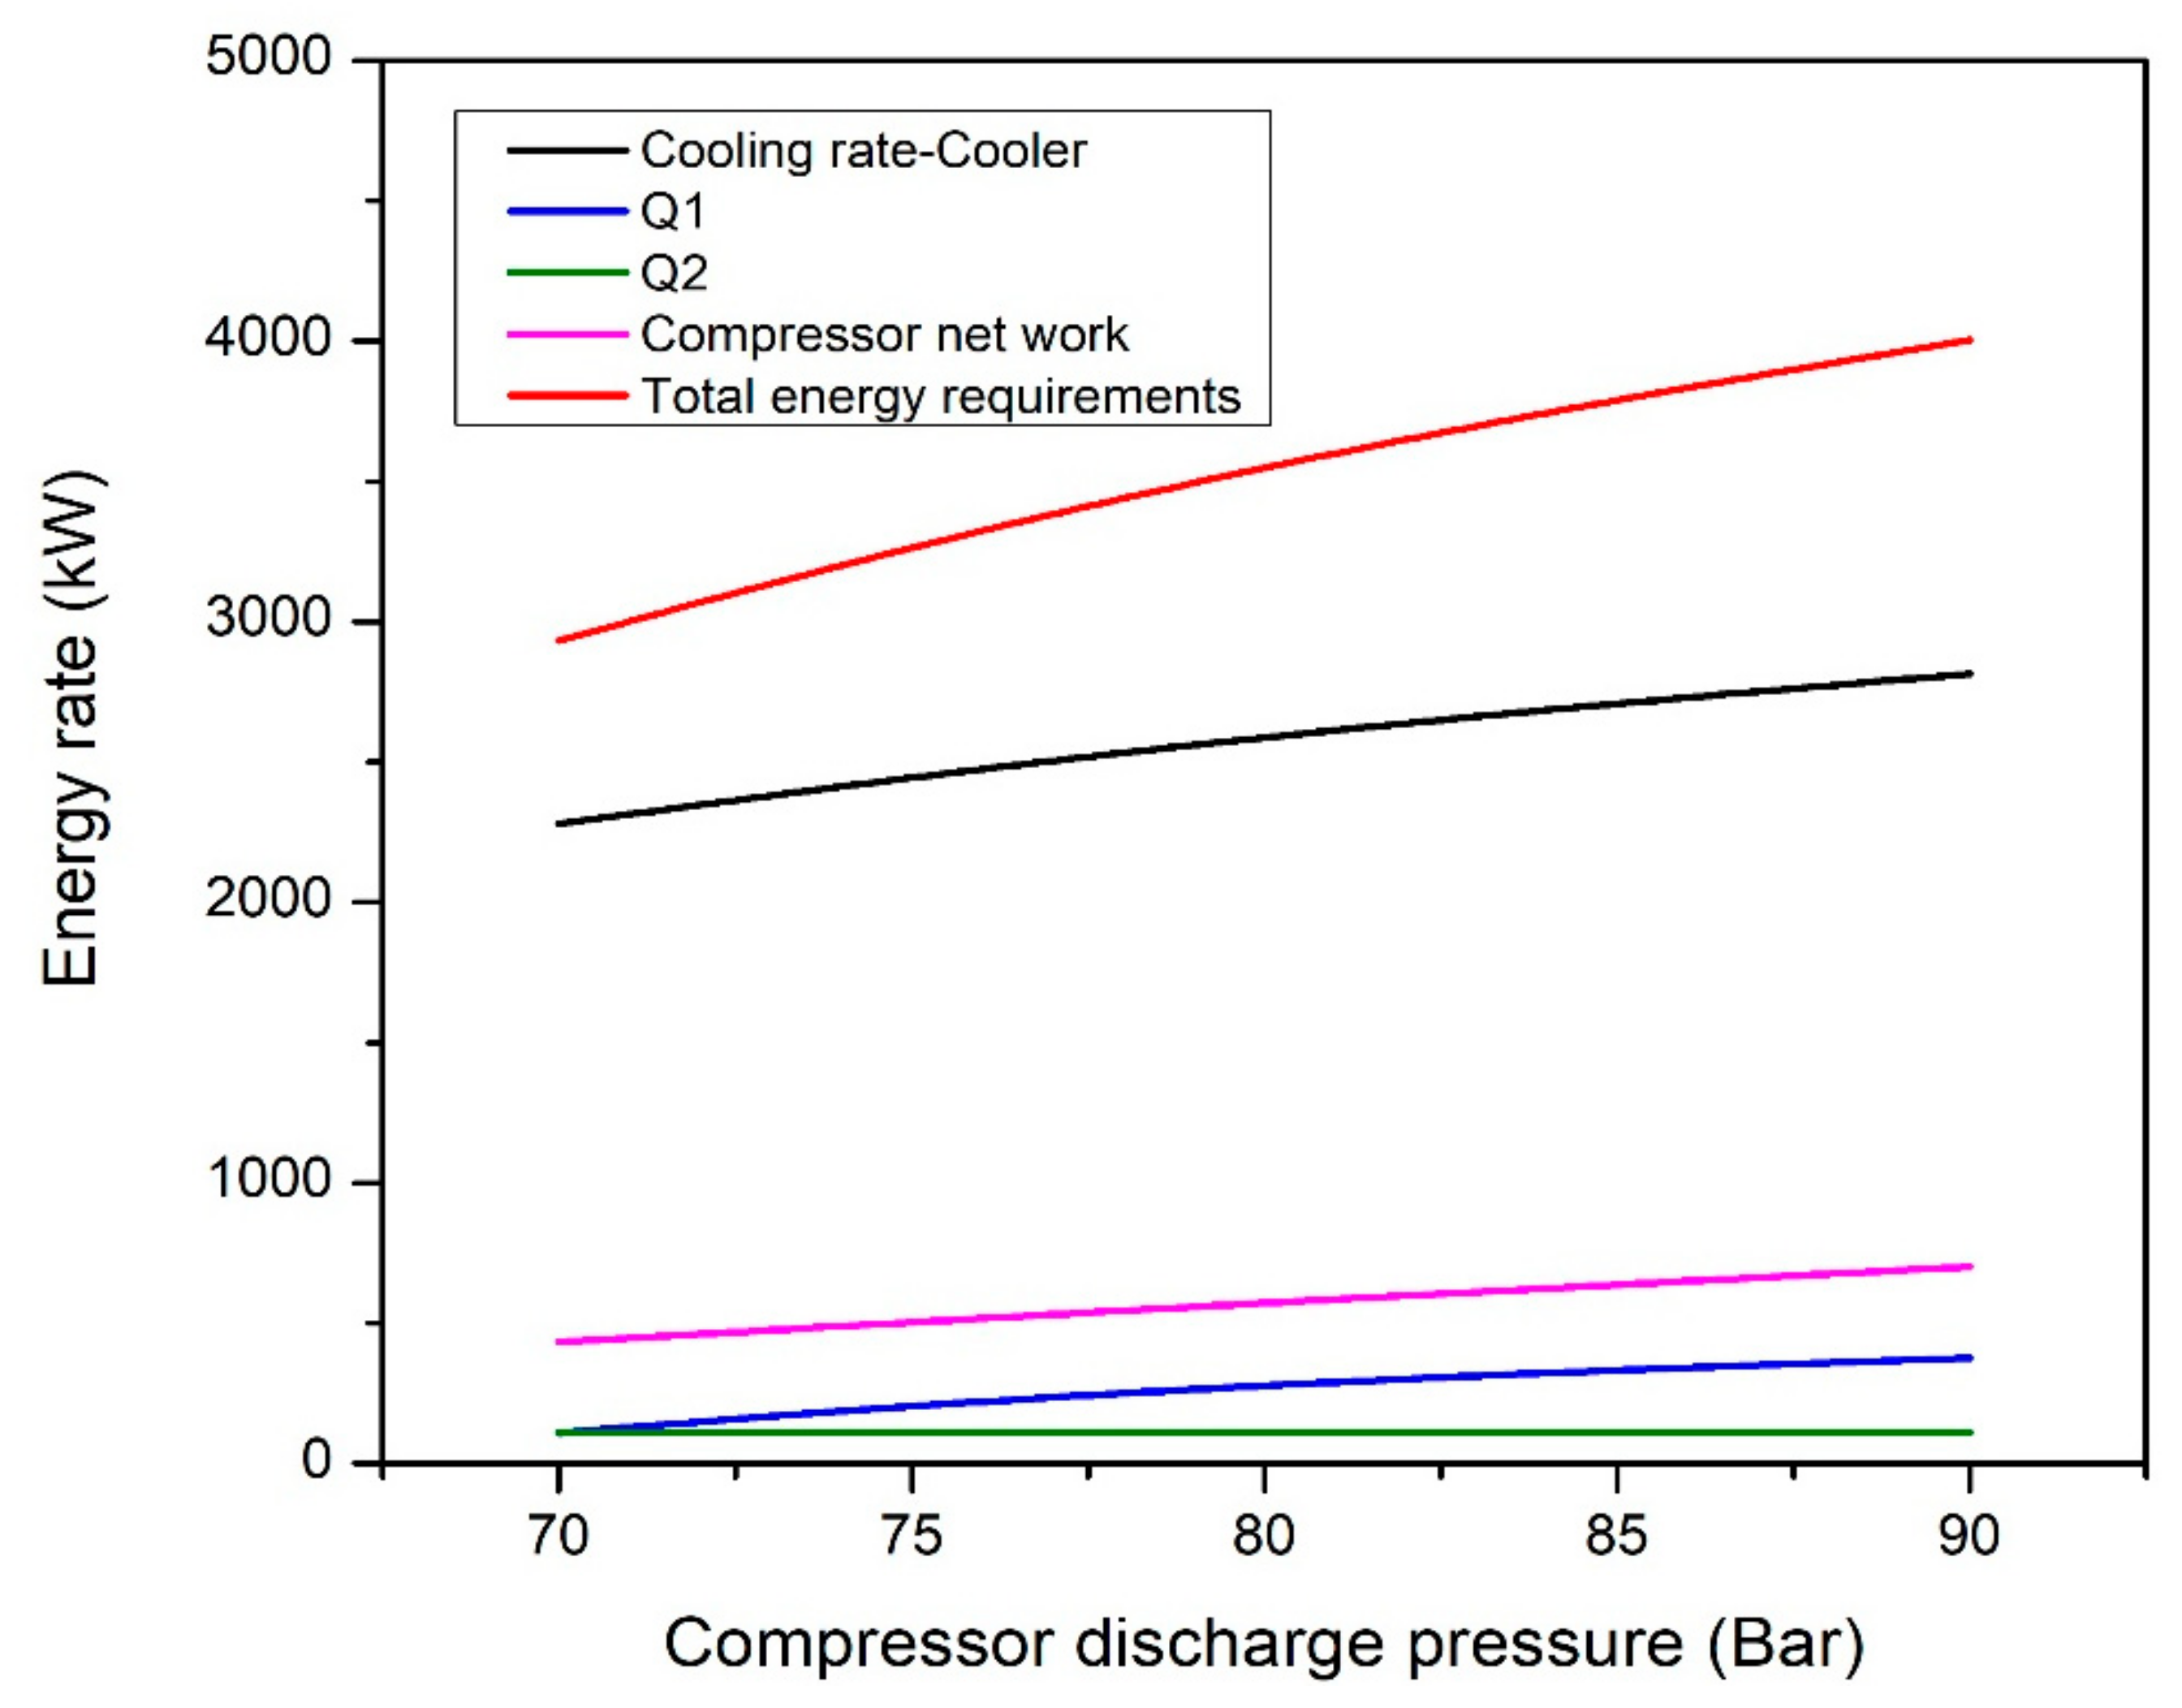
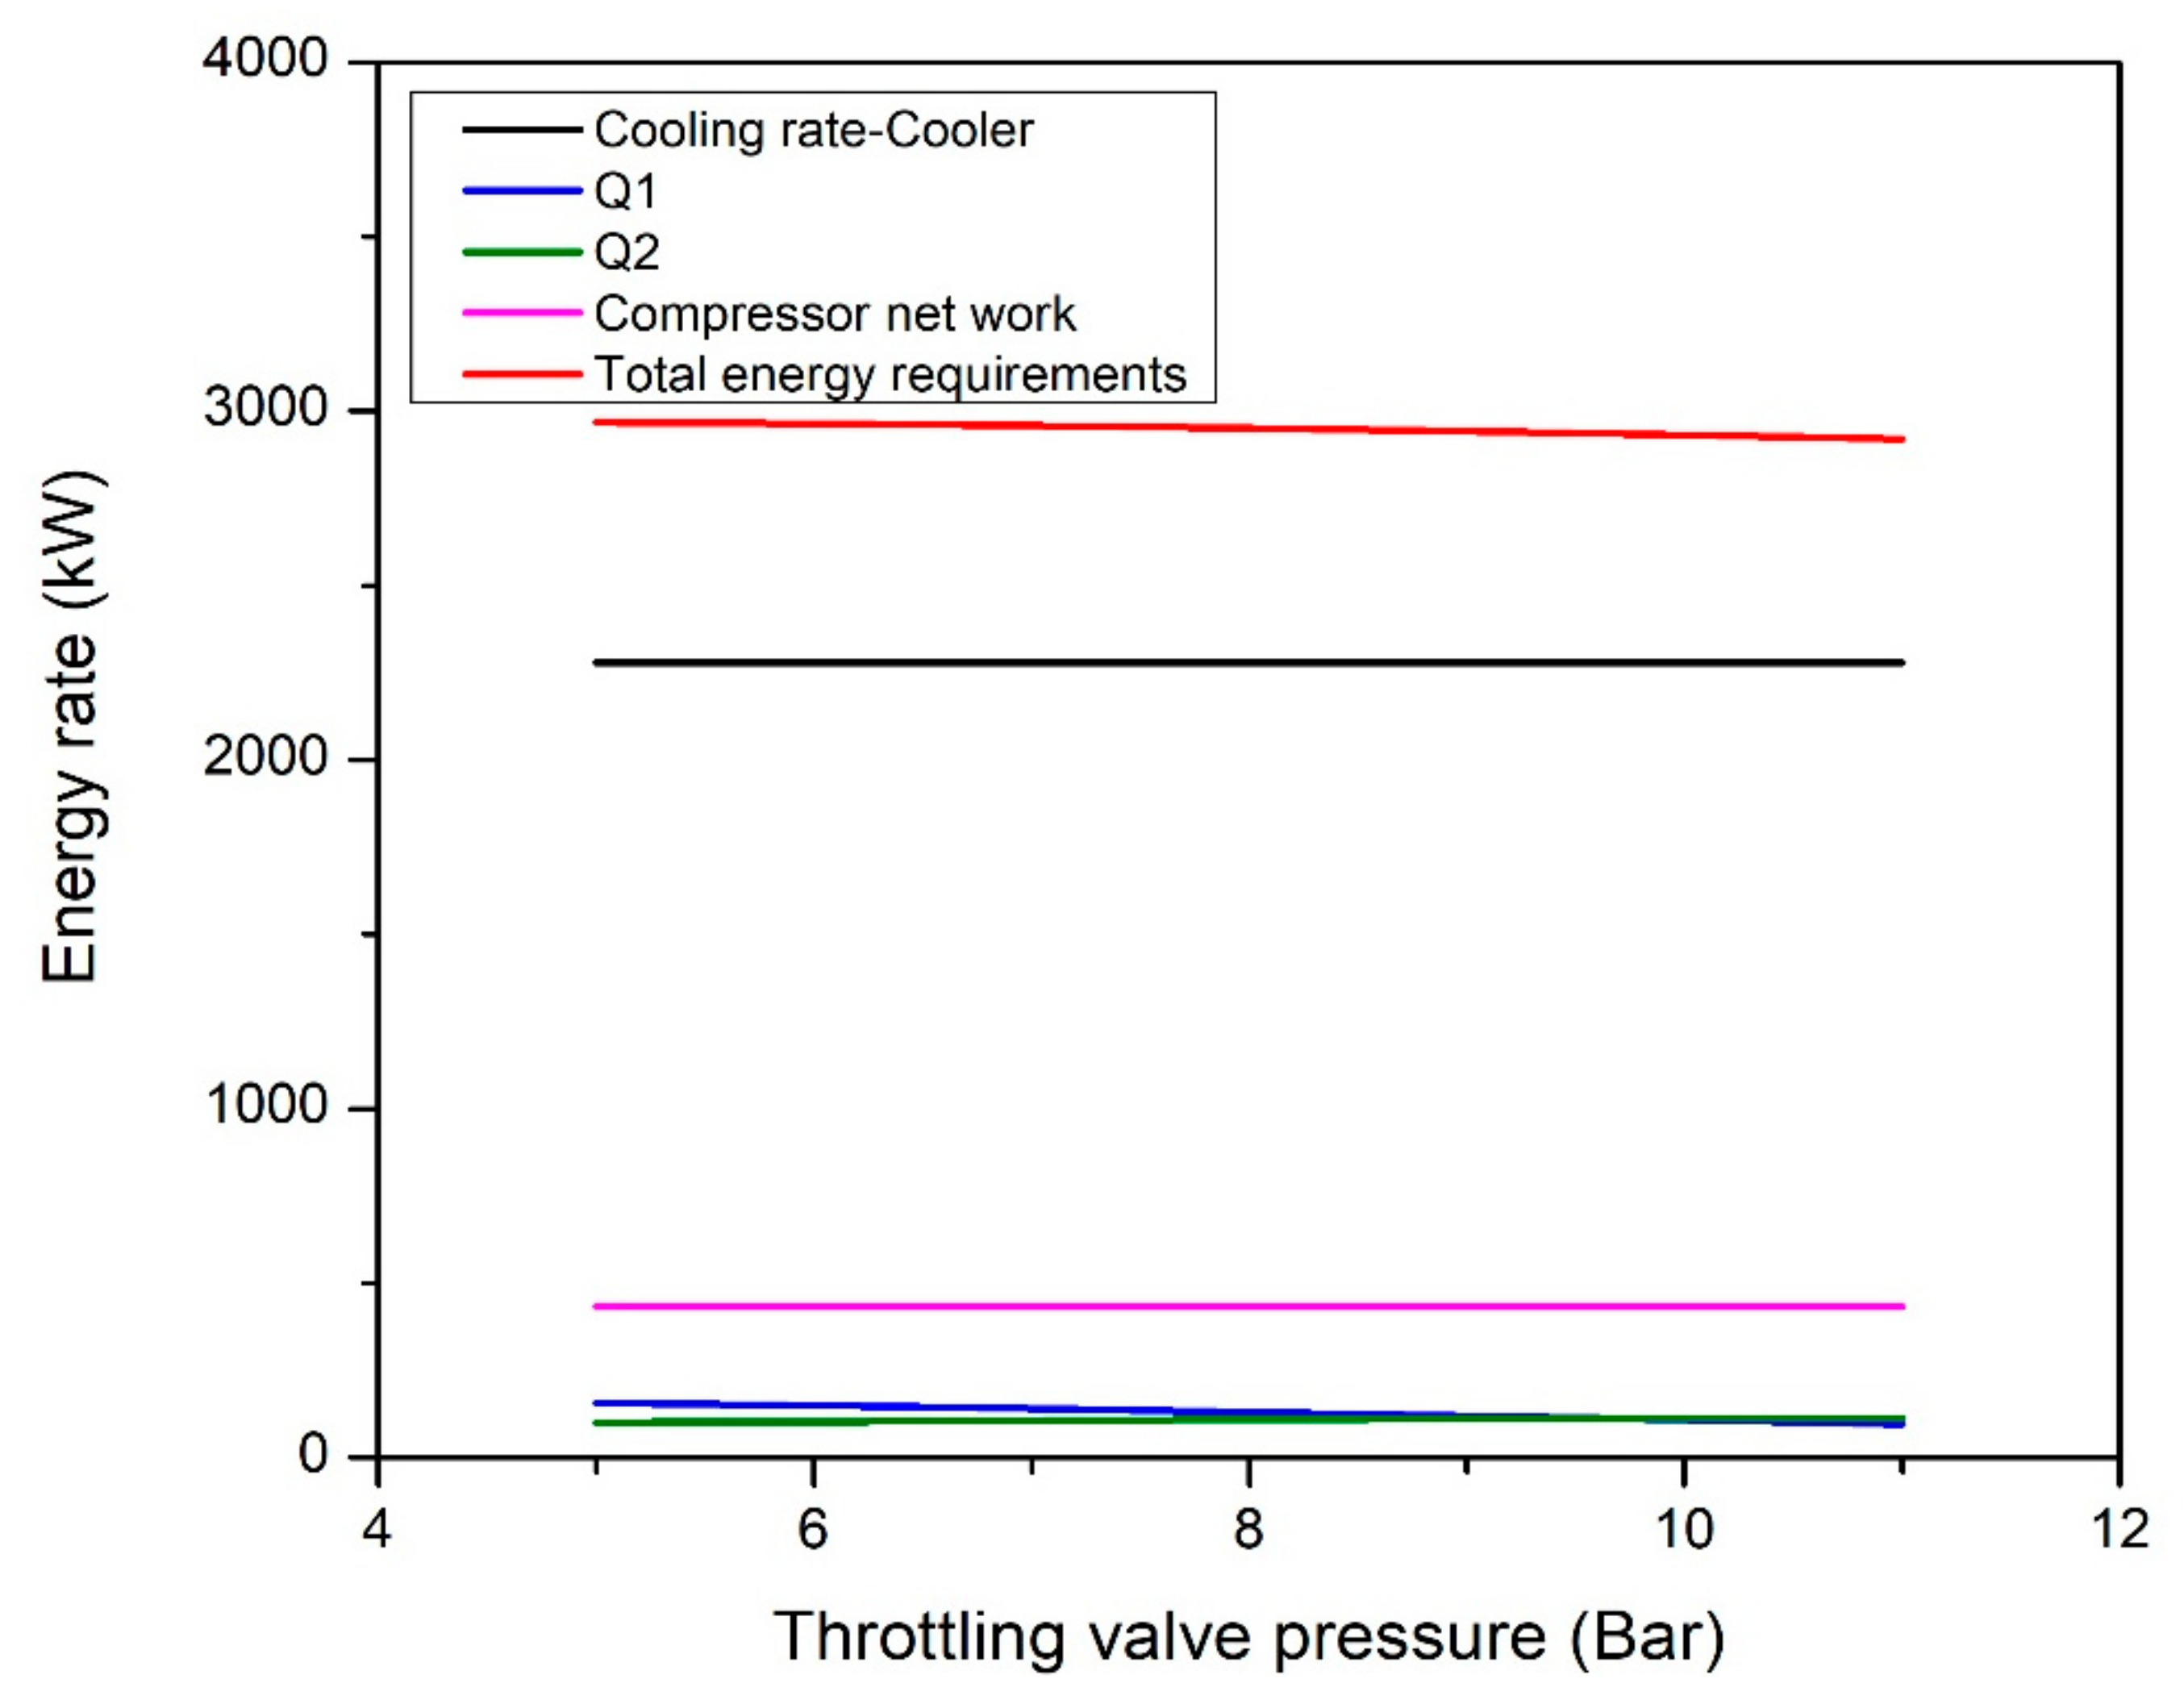
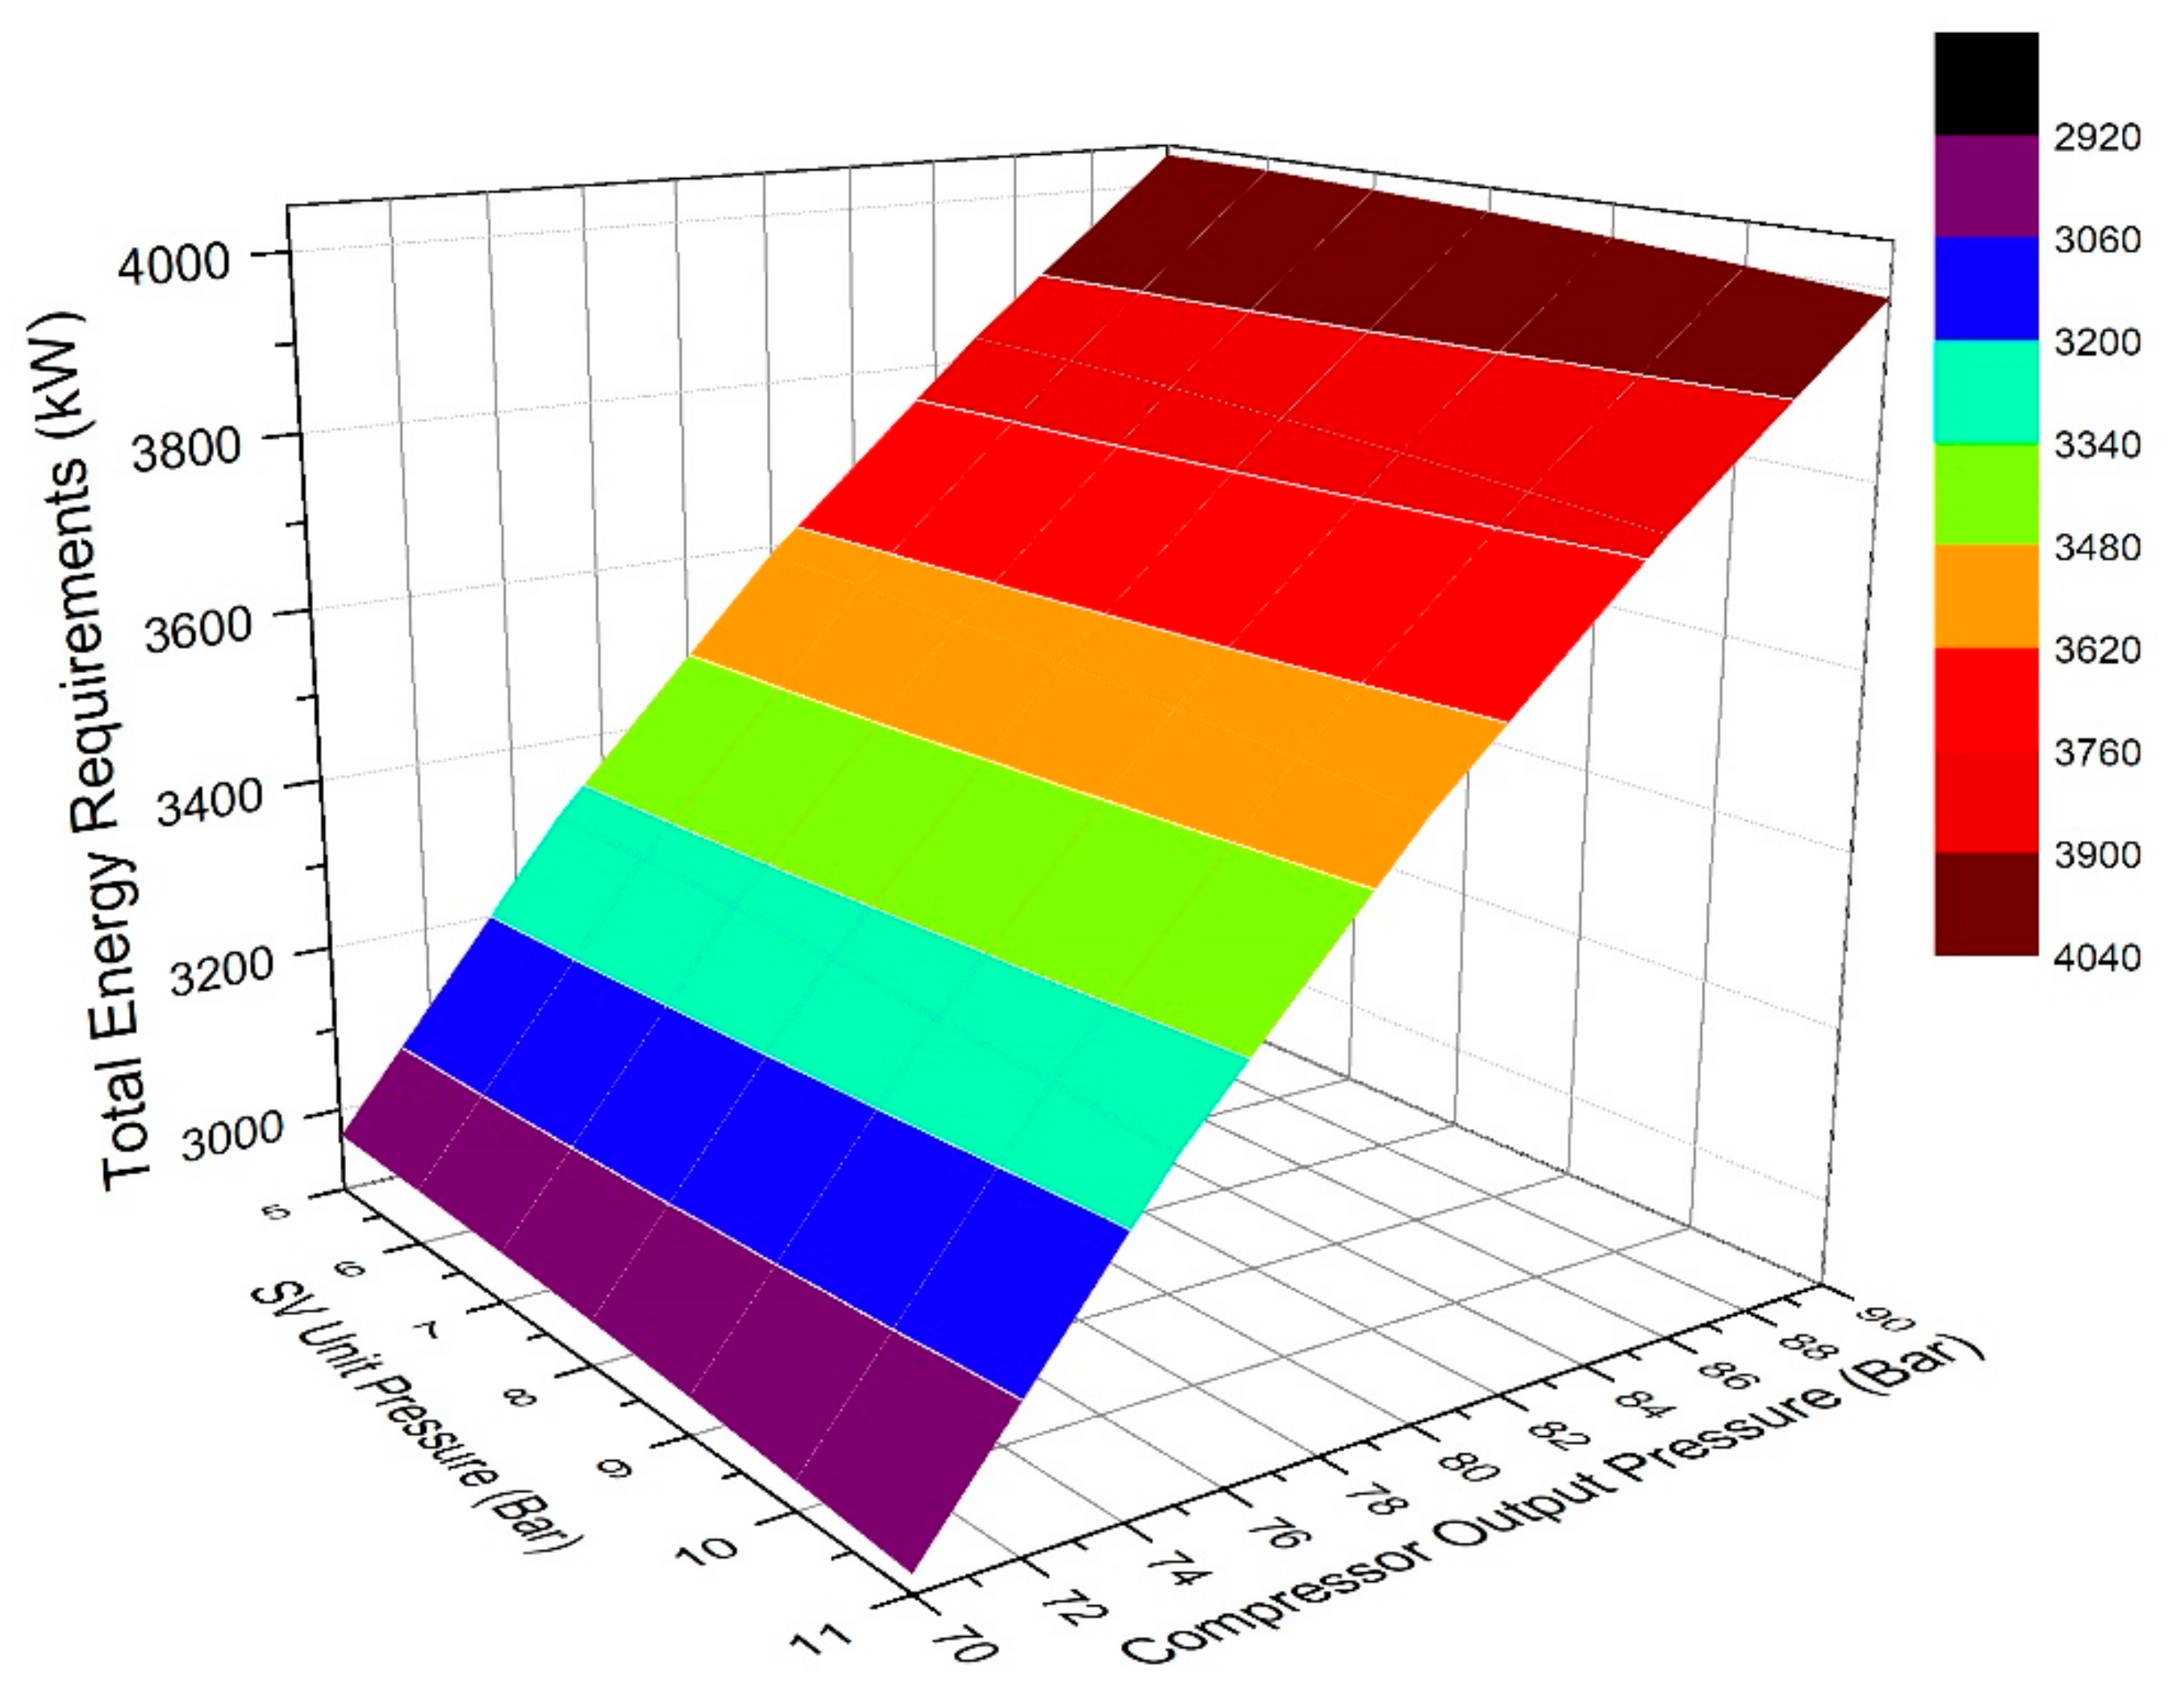
3.3. Sensitivity Analysis and Optimization of the SV Separation Unit

The impact of the compressor discharge pressure and the throttling pressure in the SV separation unit on the overall energy consumption of the process was studied while maintaining the targeted purity level (99.7% pure CH4). The results are presented in Figure 6 and Figure 7. Figure 6 shows that increasing the compressor pressure increases the total energy requirement significantly due to (1) the increased work for the compressor itself and (2) the higher cooling rate of the cooler as a result of the higher temperature and pressure of the sour gas discharged from the compressor. Although the higher pressure has a negligible impact on Q ˙ 2 (SV unit heating rate), it has a noticeable impact on the Q ˙ 1 of the SV unit (again, as result of the higher pressure of the feed coming into the SV unit, which requires more cooling to reach the targeted purity). On the other hand, Figure 7 shows that the throttling pressure of the feed to the SV separation unit has less impact on the total energy rate requirements. The higher the throttling pressure lowers the cooling rate needed within the SV separation unit ( Q ˙ 1 ), whereas there is no change in the cooling needed upstream of the unit or heating within the SV unit itself. The SV separation unit is optimized (with the target of minimizing the energy consumption while achieving the needed purity) by manipulating both the throttling pressure of the SV separation unit and the compressor pressure. The optimization results for case A are presented in Figure 8, where the minimum energy consumption is achieved for a compressor discharge pressure of 70 bar and a throttling pressure of 11 bar. To better illustrate the process, Figure 9 represents the process in the SV separation unit for case 2 as an example. The sour gas feed (point 1 (313 K and 45 bar)) is pressurized and cooled to reach point 2 (210 K and 70 bar), which is then throttled in the SV unit and cooled to 11 bars and 153.63 K (point 3), where the sweet gas is separated in the vapor phase.

3.4. Comparison between Amine-Sweeting Unit and the SV Unit

The two processes (the SV separation process and the amine absorption process) were compared to each other on the same basis using the same feed flow rate, compositions, and conditions as presented in Table 2. The optimized results of the traditional amine-sweetening unit are summarized in Table 3, and the optimized results for the SV separation unit PFD are presented in Table 4. Although the amine-sweetening unit is able to achieve higher molar removal levels of acid gases compared to the SV unit, the presence of water in the sweet gas stream (resulting from the evaporation of water in the used solvent mixture) means that further processing might be needed to remove it. Additionally, the sweet gas would be at a relatively high temperature ≈ 50 °C, which means that cooling might be needed if the sweet gas is to be liquefied.
A comparison of the total energy requirements of the two processes shows that the SV separation process requires only 26–27% of the energy needed for the amine-sweeting process, as shown in Table 3 and Table 4, indicating one of the main advantages offered by the SV separation process over traditional amine units. Additionally, the SV separation process requires fewer equipment units, eliminates the need for corrosive solvents that damage the equipment over time, and avoids contamination of the sweet gas product with water moisture. Therefore, the SV separation process is associated with lower capital and operational costs in comparison to the traditional absorption processes.

4. Conclusions

With the increased demand for natural gas, new technologies are emerging to sweeten and monetize sour gas supplies more visibly. In this study, a state-of-the-art separation unit was developed. This separation unit is based on operation in the solid–vapor equilibrium (SVE) region in order to remove acid gases from natural gas by solidification. The solid–vapor (SV) separation unit offers some key advantages over traditional amine-scrubbing units, such as lower energy requirements, capital costs, maintenance and operational costs, and production of water-free sweet gas streams.
Simulation results showed that the unit produces high-purity methane gas, with high removal ratios of CO2 and H2S from the feed stream. Moreover, in the case of high concentrations of CO2 and H2S in the feed stream, the separation can be enhanced by cooling the feed stream to lower temperatures within the SVE zone. Cooling is required if adiabatic throttling is insufficient to bring the mixture to the VSE zone or when higher levels of methane purity or acid gas removal ratios are needed.

Author Contributions

Conceptualization, H.A. and S.A.A.-M.; methodology, H.A. and S.A.A.-M.; software, H.A. and A.A.; work execution, H.A. and A.A.; writing—original draft preparation, H.A. and S.A.A.-M.; writing—review and editing, I.A.K. and S.A.A.-M.; supervision, I.A.K. and S.A.A.-M. All authors have read and agreed to the published version of the manuscript.

Funding

This research received no external funding.

Institutional Review Board Statement

Not applicable.

Informed Consent Statement

Not applicable.

Data Availability Statement

All data generated or analyzed during this study are included in this article.

Acknowledgments

Open access funding provided by the Qatar National Library.

Conflicts of Interest

The authors declare no conflict of interest.

References

  1. Shell Lng Outlook 2021. In Royal Dutch Shell; 2021.
  2. Kelley, B.; Valencia, J.; Northrop, P.; Mart, C. Controlled Freeze Zone™ for developing sour gas reserves. Energy Procedia 2011, 4, 824–829. [Google Scholar] [CrossRef] [Green Version]
  3. Wardzinski, J.; Foss, M.; Delano, F. Interstate Natural Gas—Quality Specifications & Interchangeability. Cent. Energy Econ. 2004. [Google Scholar]
  4. Maqsood, K.; Mullick, A.; Ali, A.; Kargupta, K.; Ganguly, S. Cryogenic carbon dioxide separation from natural gas: A review based on conventional and novel emerging technologies. Rev. Chem. Eng. 2014, 30, 453–477. [Google Scholar] [CrossRef]
  5. Ababneh, H.; Al-Muhtaseb, S.A. A review on the solid–liquid–vapor phase equilibria of acid gases in methane. Greenh. Gases Sci. Technol. 2022. [Google Scholar] [CrossRef]
  6. Mokhatab, S.; Poe, W.A. Chapter 7–Natural Gas Sweetening. In Handbook of Natural Gas Transmission and Processing; Speight, J.G., Ed.; Gulf Professional Publishing: Boston, MA, USA, 2012; pp. 253–290. [Google Scholar]
  7. Speight, J.G. (Ed.) 8–Gas cleaning processes. In Natural Gas; Gulf Professional Publishing: Boston, MA, USA, 2019; pp. 277–324. [Google Scholar]
  8. Guo, B.; Ghalambor, A. Chapter 8–Dehydration. In Natural Gas Engineering Handbook; Speight, J.G., Ed.; Gulf Publishing Company: Boston, MA, USA, 2005; pp. 143–171. [Google Scholar]
  9. Wang, M.; Lawal, A.; Stephenson, P.; Sidders, J.; Ramshaw, C. Post-combustion CO2 capture with chemical absorption: A state-of-the-art review. Chem. Eng. Res. Des. 2011, 89, 1609–1624. [Google Scholar] [CrossRef] [Green Version]
  10. Salvi, B.L.; Jindal, S. Recent developments and challenges ahead in carbon capture and sequestration technologies. SN Appl. Sci. 2019, 1, 885. [Google Scholar] [CrossRef] [Green Version]
  11. Ali, A.; Maqsood, K.; Redza, A.; Hii, K.; Shariff, A.B.; Ganguly, S. Performance enhancement using multiple cryogenic desublimation based pipeline network during dehydration and carbon capture from natural gas. Chem. Eng. Res. Des. 2016, 109, 519–531. [Google Scholar] [CrossRef]
  12. Théveneau, P.; Fauve, R.; Coquelet, C.; Mougin, P. Measurement and modelling of solid apparition temperature for the CO2–H2S–CH4 ternary system. Fluid Phase Equilibria 2020, 509, 112465. [Google Scholar] [CrossRef]
  13. Font-Palma, C.; Cann, D.; Udemu, C. Review of Cryogenic Carbon Capture Innovations and Their Potential Applications. J. Carbon Res. 2021, 7, 58. [Google Scholar] [CrossRef]
  14. Yang, X.; Rowland, D.; Sampson, C.C.; Falloon, P.E.; May, E.F. Evaluating cubic equations of state for predictions of solid-fluid equilibrium in liquefied natural gas production. Fuel 2022, 314, 123033. [Google Scholar] [CrossRef]
  15. Ali, A.; Maqsood, K.; Syahera, N.; Shariff, A.B.M.; Ganguly, S. Energy Minimization in Cryogenic Packed Beds during Purification of Natural Gas with High CO2Content. Chem. Eng. Technol. 2014, 37, 1675–1685. [Google Scholar] [CrossRef]
  16. Tuinier, M.; Annaland, M.V.S.; Kramer, G.; Kuipers, J. Cryogenic CO2 capture using dynamically operated packed beds. Chem. Eng. Sci. 2010, 65, 114–119. [Google Scholar] [CrossRef]
  17. Willson, P.; Lychnos, G.; Clements, A.; Michailos, S.; Font-Palma, C.; Diego, M.E.; Pourkashanian, M.; Howe, J. Evaluation of the performance and economic viability of a novel low temperature carbon capture process. Int. J. Greenh. Gas Control 2019, 86, 1–9. [Google Scholar] [CrossRef]
  18. Song, C.-F.; Kitamura, Y.; Li, S.-H.; Ogasawara, K. Design of a cryogenic CO2 capture system based on Stirling coolers. Int. J. Greenh. Gas Control 2012, 7, 107–114. [Google Scholar] [CrossRef] [Green Version]
  19. Jensen, M.J.; Russell, C.S.; Bergeson, D.; Hoeger, C.D.; Frankman, D.J.; Bence, C.S.; Baxter, L.L. Prediction and validation of external cooling loop cryogenic carbon capture (CCC-ECL) for full-scale coal-fired power plant retrofit. Int. J. Greenh. Gas Control 2015, 42, 200–212. [Google Scholar] [CrossRef] [Green Version]
  20. Valencia, J.A.; Denton, R.D.; Northrop, P.S.; Mart, C.J.; Smith, R.K. Controlled Freeze Zone Technology for the Commercialization of Australian High CO2 Natural Gas. In Proceedings of the Paper Presented at the SPE Asia Pacific Oil & Gas Conference and Exhibition, Adelaide, Australia, 14–16 October 2014; Volume 2, pp. 951–961. [Google Scholar] [CrossRef]
  21. Maqsood, K.; Ali, A.; Nasir, R.; Abdulrahman, A.; Bin Mahfouz, A.; Ahmed, A.; Shariff, A.B.; Ganguly, S.; Mubashir, M.; Show, P.L. Experimental and simulation study on high-pressure V-L-S cryogenic hybrid network for CO2 capture from highly sour natural gas. Process Saf. Environ. Prot. 2021, 150, 36–50. [Google Scholar] [CrossRef]
  22. Ababneh, H.; Al-Muhtaseb, S.A. An empirical correlation-based model to predict solid-fluid phase equilibria and phase separation of the ternary system CH4-CO2-H2S. J. Nat. Gas Sci. Eng. 2021, 94, 104120. [Google Scholar] [CrossRef]
  23. Nikolaidis, I.K.; Boulougouris, G.C.; Peristeras, L.D.; Economou, I.G. Equation-of-State Modeling of Solid–Liquid–Gas Equilibrium of CO2 Binary Mixtures. Ind. Eng. Chem. Res. 2016, 55, 6213–6226. [Google Scholar] [CrossRef]
  24. Span, R.; Wagner, W. A New Equation of State for Carbon Dioxide Covering the Fluid Region from the Triple-Point Temperature to 1100 K at Pressures up to 800 MPa. J. Phys. Chem. Ref. Data 1996, 25, 1509–1596. [Google Scholar] [CrossRef] [Green Version]
  25. The vapour pressure of hydrogen sulphide. Proc. R. Soc. London. Ser. A Math. Phys. Sci. 1951, 209, 408–415. [CrossRef]
  26. Shakeel, H.; Wei, H.; Pomeroy, J. Measurements of enthalpy of sublimation of Ne, N2, O2, Ar, CO2, Kr, Xe, and H2O using a double paddle oscillator. J. Chem. Thermodyn. 2018, 118, 127–138. [Google Scholar] [CrossRef] [PubMed] [Green Version]
  27. Chadwick, A.V. 8 Diffusion in molecular solids. In Diffusion in Non-Metallic Solids (Part 1); Beke, D.L., Ed.; Springer: Berlin/Heidelberg, Germany, 1999. [Google Scholar]
Figure 1. Schematic diagram for the suggested SV separation unit.
Energies 15 05286 g001
Figure 2. A simplified path for the throttling/equilibrium process (red line) versus the SLVE phase diagram [22]. Phases: V: vapor, L: liquid, S1: solid CO2, S2: solid H2S.
Energies 15 05286 g002
Figure 3. Simplified mass and energy flows for the SV separation unit.
Energies 15 05286 g003
Figure 4. Process flow diagram of the simulated optimized amine-sweeting unit.
Energies 15 05286 g004
Figure 5. Process flow diagram of the SV separation unit.
Energies 15 05286 g005
Figure 6. Impact of the compressor discharge pressure on the SV separation unit’s energy requirements.
Energies 15 05286 g006
Figure 7. Impact of the throttling valve pressure on the SV separation unit’s energy requirements.
Energies 15 05286 g007
Figure 8. Combined impact of compressor discharge pressure and throttling pressure of the SV unit on the total energy requirements of the SV process (case A).
Energies 15 05286 g008
Figure 9. Illustration of the gas-sweetening unit using a TP phase diagram for case 2. Point 1 is the sour gas feed, point 2 is sour gas after being pressurized and cooled, and point 3 represents the product for which the sweet gas is separated in the vapor phase.
Energies 15 05286 g009
Table 1. Results for the tested three-feed compositions.
FeedABCC’ *
T (K) after throttle valve161.3168.0182.2165.0
Heat Transfer Rate
(W/kmol Feed)
Q ˙ 1 000486
Q ˙ 2 552617780885
Vapor-Phase Composition (mol%)CH499.298.494.198.9
CO20.514.10.7
H2S0.30.61.80.4
Liquid-Phase Composition (mol%)CO249.675.756.658.2
H2S50.424.343.441.8
Removal Ratio in Liquid Phase (%)CO296.294.682.797.1
H2S97.690.988.997.6
CO2 + H2S96.993.785.397.3
* Feed C’ represents another run of feed “C” but with subsequent cooling (Q1).
Table 2. Dry-basis compositions of the two tested feeds and their specifications.
FeedCase 1Case 2
Dry-feed compositionCH496.19%89.27%
CO22.87%5.88%
H2S0.94%4.85%
Feed flow ratekg/h287,640287,640
kmol/h16,905.115,496.1
Feed conditionsTemperature (°C)40
Pressure (bar)45
Table 3. Optimized results of the amine-sweetening unit.
Case 1Case 2
SolventSulfolane-DIPA
Solvent flow ratekg/h52,201.2893,296.03
kmol/h784.51402
Sweet gas compositionCH499.67%99.74%
CO20.0020%0.0004%
H2S0.0657%0.0005%
H2O0.2667%0.2625%
Molar removalCO299.93%≈100%
H2S93.28%≈100%
Energy requirements (kW)Reboiler58356112.3
Condenser3428.63300.1
Pump78.8140.7
Cooler1530.72636.9
Total10,873.112,189.9
Sweet gas conditionsTemperature (K)323.54323.19
Pressure (bar)4545
Table 4. Optimized results of the SV separation unit.
Case 1Case 2
Temperature after throttle valve (K)153.6
Vapor-Phase Composition (mol%)CH499.7000%99.7000%
CO20. 1737%0.1737%
H2S0.1263%0.1263%
Liquid-Phase Composition (mol%)CO276.7620%54.7203%
H2S23.2380%45.2797%
Molar removal (%)CO294.2%97.36%
H2S87.03%97.67%
Energy requirements (kW)Compressor431.95427.85
Cooler2278.572590.68
Q ˙ 1 96.4093.88
Q ˙ 2 113.12301.43
Total2920.053226.08
Sweet gas conditionsTemperature (K)153.63
Pressure (bar)11
Publisher’s Note: MDPI stays neutral with regard to jurisdictional claims in published maps and institutional affiliations.

