Article

Qualitative–Quantitative Warning Modeling of Energy Consumption Processes in Inland Waterway Freight Transport on River Sections for Environmental Management

by
Elżbieta Szaruga
* and
Elżbieta Załoga
*
Department of Transport Management, Institute of Management, University of Szczecin, Cukrowa 8 Street, 71-004 Szczecin, Poland
*
Authors to whom correspondence should be addressed.
Energies 2022, 15(13), 4660; https://doi.org/10.3390/en15134660
Submission received: 27 May 2022 / Revised: 21 June 2022 / Accepted: 22 June 2022 / Published: 25 June 2022
(This article belongs to the Section A: Sustainable Energy)

Abstract

:
The article concerns the assessment of the energy consumption of inland waterway freight transport on river sections in the context of environmental management. The research question was: Does the choice of the route determine the total energy consumption of inland waterway transport and therefore affect the potential of cargo transport of this mode? The article aims to indicate the directions of energy consumption by inland waterway freight transport depending on the route selection, the volume of transport, and the length of the route. The study was carried out on nine sections of the Odra River in Poland during the years 2015–2020. Statistical and econometric techniques were used, i.e., ANOVA, generalized linear models, Eta coefficients, Lasso and Ridge regularization, and X-average control charts (Six Sigma tool). Based on early warning models, river sections were identified that favor the rationalization of energy consumption in terms of the network. The sensitivity of the energy consumption of inland waterway transport to changes in the average distance and in the volume of transport was examined. With the use of Six Sigma tools, the instability of the energy consumption processes of inland waterway transport was identified, paying attention to the source of the mismatch, which was the increase in the average transport distance in the sections, where energy consumption increased due to the operational and navigation conditions of these sections.

1. Introduction

1.1. Presentation of Research Problems

Transport is the bloodstream of the economy and the foundation of society’s development [1,2], and therefore, it requires setting directions for improvement toward sustainable development [3,4]. This improvement is indicated in the context of resource use by transport [5]. There is also a strong link between economic development and the continual increase in energy consumption on a global scale [6,7,8]. A similar relationship was noticed in transport, and therefore, attention has been paid to the need to promote one of the paradigms of sustainable development, i.e., decoupling [9,10]. The achievement of the goals outlined in the white paper ‘Roadmap to a Single European Transport Area—Towards a competitive and resource efficient transport system’ by 2050 is synonymous with cutting off the oil dependency of the transport system without compromising mobility and efficiency [2,11,12]. It is connected with the need to improve the energy efficiency of all modes of transport, the implementation of sustainable fuels, and more efficient propulsion systems [11]. It is worth highlighting that sustainable development is the cornerstone of European climate [13] and energy policy. There is a need to reduce emissions from the transport sector by approximately 90% by 2050, which was emphasized in the ‘Green Deal’ [14,15]. The main pillar of the Green Deal is the ‘shift paradigm’ [13,14], that is, the modal shift from road to rail or inland shipping [16,17,18,19].
Inland waterway transport is considered to be the least energy-intensive transport mode among the modes of transport [20,21,22,23]. It is one of the components of a comprehensive transport system [24,25,26] and is associated with an environmentally friendly alternative [27,28,29,30] in terms of energy consumption [31,32], gas emissions [33], and noise [34,35,36]. However, the untapped potential of inland waterways has been noted [37,38], and the need to increase their importance in inland goods transport is noted [2,22]. Shifting freight from road to water transport requires financing waterway infrastructure [39], and one of the greatest barriers to development is financing infrastructure [34].
The waterway is one of the elements of inland waterway transport [40,41], but due to its functions, it is essential for the development of inland navigation [36] and also influences economic development [24], especially in regions connected to the river [42]. It is emphasized that this type of transport is specific to market processes and sustainable development policy [34,43,44,45]. The efficiency of inland waterway transport is closely related to improving the infrastructure of waterways, the structure of energy consumption, and the permissible carrying capacity of vessels [46,47]. Inland waterway transport plays a supporting role in coastal and maritime transport. However, it has less potential and scope for actions to improve energy intensity and energy efficiency management than sea or coastal transport. This is particularly related to the quality of infrastructure and ships, which limits improvements in making inland waterway transport sufficient to coordinate coastal and maritime transport. Therefore, inland waterway transport is a challenge from the point of view of promotion in the transport system without avoiding large losses in efficiency [46]. The criteria that limit the possibility of inland waterway transport for transshipment and further transport are mainly the parameters of the waterway [36,48,49,50].
Using an isolated and network approach, the research carried out is novel in the methodology of estimating the energy consumption of inland waterway freight transport on nine sections of the Odra River with different navigation conditions. The study used a combination of various data science techniques, the results of which could be adapted to neural networks in the future. Techniques in the field of data mining, econometrics, industrial statistics, and machine learning (artificial intelligence) were combined to recognize consumption patterns in inland waterway transport.
This study addressed the issues described and was an attempt to operationalize the early warning concept of energy consumption processes in inland waterway freight transport on river sections in the context of environmental management. An attempt to harmonize various statistical and econometric techniques to the data science approach, including, among others, the ANOVA method, Lasso and Ridge regularization (part of machine learning), and finally, the Six Sigma tool, may contribute to the methodology of studying the energy consumption of inland waterway transport. In addition, the article also has practical value in terms of the possibility of implementing the approach as a tool to support decisions in the field of the qualitative–quantitative early modeling of energy consumption processes in inland waterway transport in river sections.

1.2. Organization of the Paper

The article focuses on examining the energy consumption of inland waterway transport for specific river sections. The research problem was formulated in the form of a question: Does the choice of route determine the total energy consumption of inland waterway transport and thus affect the potential of cargo transport of this mode? In addition, two more questions were formulated in the context of the research problem: Do particular sections of the Odra River differ significantly in the levels of energy consumption by inland waterway freight transport? Do particular sections of the Odra River differ significantly in the volumes of the inland waterway transport of cargo? In the context of this problem, a research hypothesis was formulated: the choice of the route along particular sections of the river determines the rationalization of energy consumption (and energy intensity) by inland waterway transport. The article aims to indicate the directions of energy consumption by inland waterway freight transport depending on the route selection, the volume of transport, and the length of the route. The spatial scope of the study covers nine sections of the Odra River in Poland that are diversified in terms of navigation conditions. The temporal scope covers the years 2015–2020. Statistical and econometric techniques were used, i.e., analysis of variance (ANOVA), generalized linear models, Eta coefficient, Lasso and Ridge regularization (to separate the signal from the noise), Six Sigma tools (X-average control charts), and other statistics (mean, standard deviation, skewness, F statistics, Wald Chi-Square test-type III, Omnibus test). The combination of the indicated methods allowed for in-depth analysis and identification of the areas of deregularization (in the sense of instability) of the energy consumption of inland waterway freight transport, which is important from the point of view of an early warning system.
The article consists of five parts. The first is the introduction. The second part contains a brief literature review with text mining techniques, such as a word cloud, topic modeling (using Latent Dirichlet Allocation), mapping latent variables, and mapping the factors of the energy consumption of inland waterway transport. The third part is a description of the research and methodology. The fourth part contains the empirical research results and a discussion. The article ends with conclusions.

2. Brief Literature Review

Energy intensity is one of the measures of sustainable development, and three dimensions are intertwined within it: economic (management of scarce resources in the context), environmental (information about the exploitation of the environment; pollution is a side effect), and social (the scale of its exploitation determines the possibility of meeting the needs of future generations) [51]. Energy consumption processes are important for environmental and economic management from a macroeconomic point of view [10,52]. Environmental management means actions aimed at improvement and also includes reducing costs and risks, striving for sustainable development, and, at the same time, ensuring compliance with the guidelines for development [53].
Text mining was carried out on the basis of the selected literature due to its connection with the discussed topic. Originally, 73 publications (mainly from the Web of Science, Scopus, and Google Scholar databases) were identified; after removing duplicates, a complete literature review classified 41 publications for further examination, including [1,3,4,11,13,18,20,21,22,23,24,25,27,28,29,30,31,32,34,35,36,37,38,39,40,41,43,44,46,47,48,49,50,53,54,55,56,57,58,59,60]. The structure of the studied publications includes 33 journal articles (80%) and 8 conference materials (20%).
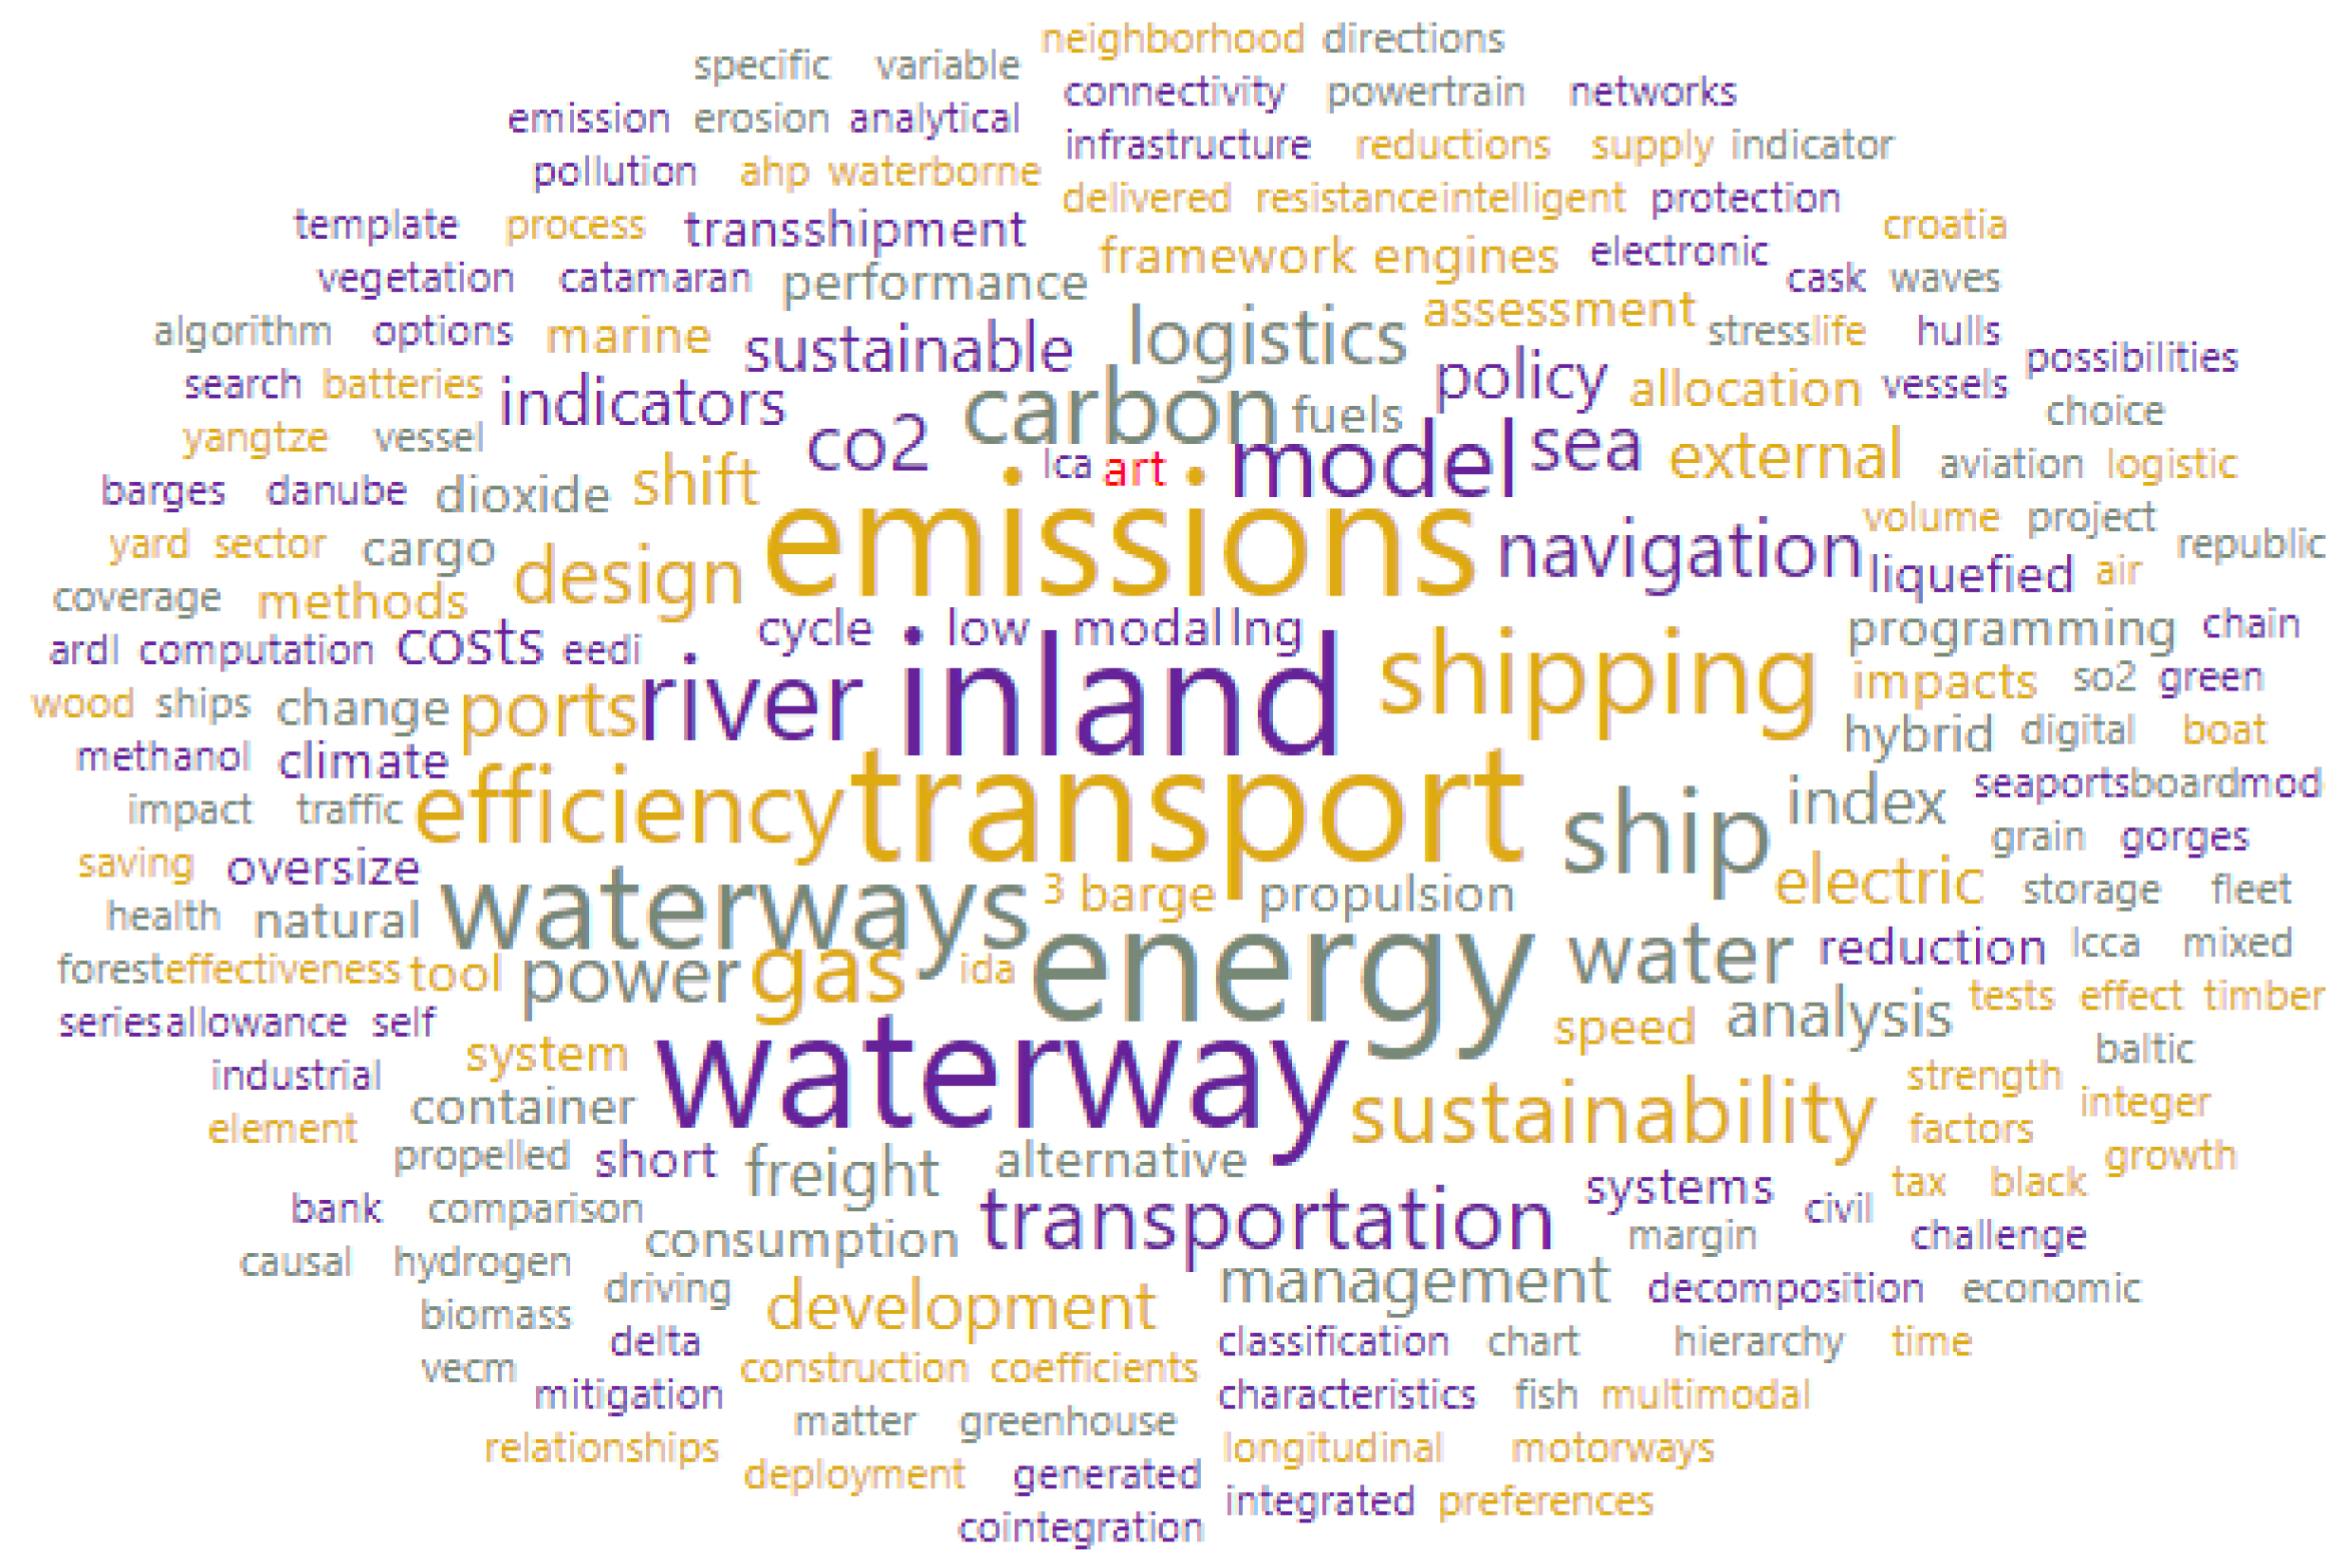
Figure 1 shows a word cloud. This tool is useful to visualize keyword frequency in the given publications. Among the most popular are inland waterway (waterways) transport, energy, emissions, ship, shipping, efficiency, ports, and river. There are also other variations of words in the cloud because the text was not subjected to lemmatization. Its original content was not interfered with, as would be reflected in the results at further stages of the study (high sensitivity to an external interference). Words marked with a smaller font indicate the diversity of the issues undertaken by scientists and the connections between the issues.
Noting the diversity of issues, which oscillated around the main concern, that is, energy consumption in inland waterway transport, the modeling of the topic was carried out using the Latent Dirichlet Allocation technique (Table 1). The technique is, in a way, an attempt to identify the similarities of latent variables in as-yet undiscovered patterns of words scattered across various documents. In combination with multidimensional scaling (MDS), the marginal probability of a topic and the most characteristic representatives in the corpus were estimated. For example, when analyzing Topic 3, it can be assessed that the publications had an econometric overtone, focused on dynamic cointegrating relations. Topic 8 focused on linear programming (optimization methods), while Groups 1 and 4 concerned problematics broadly understood in transport policy.
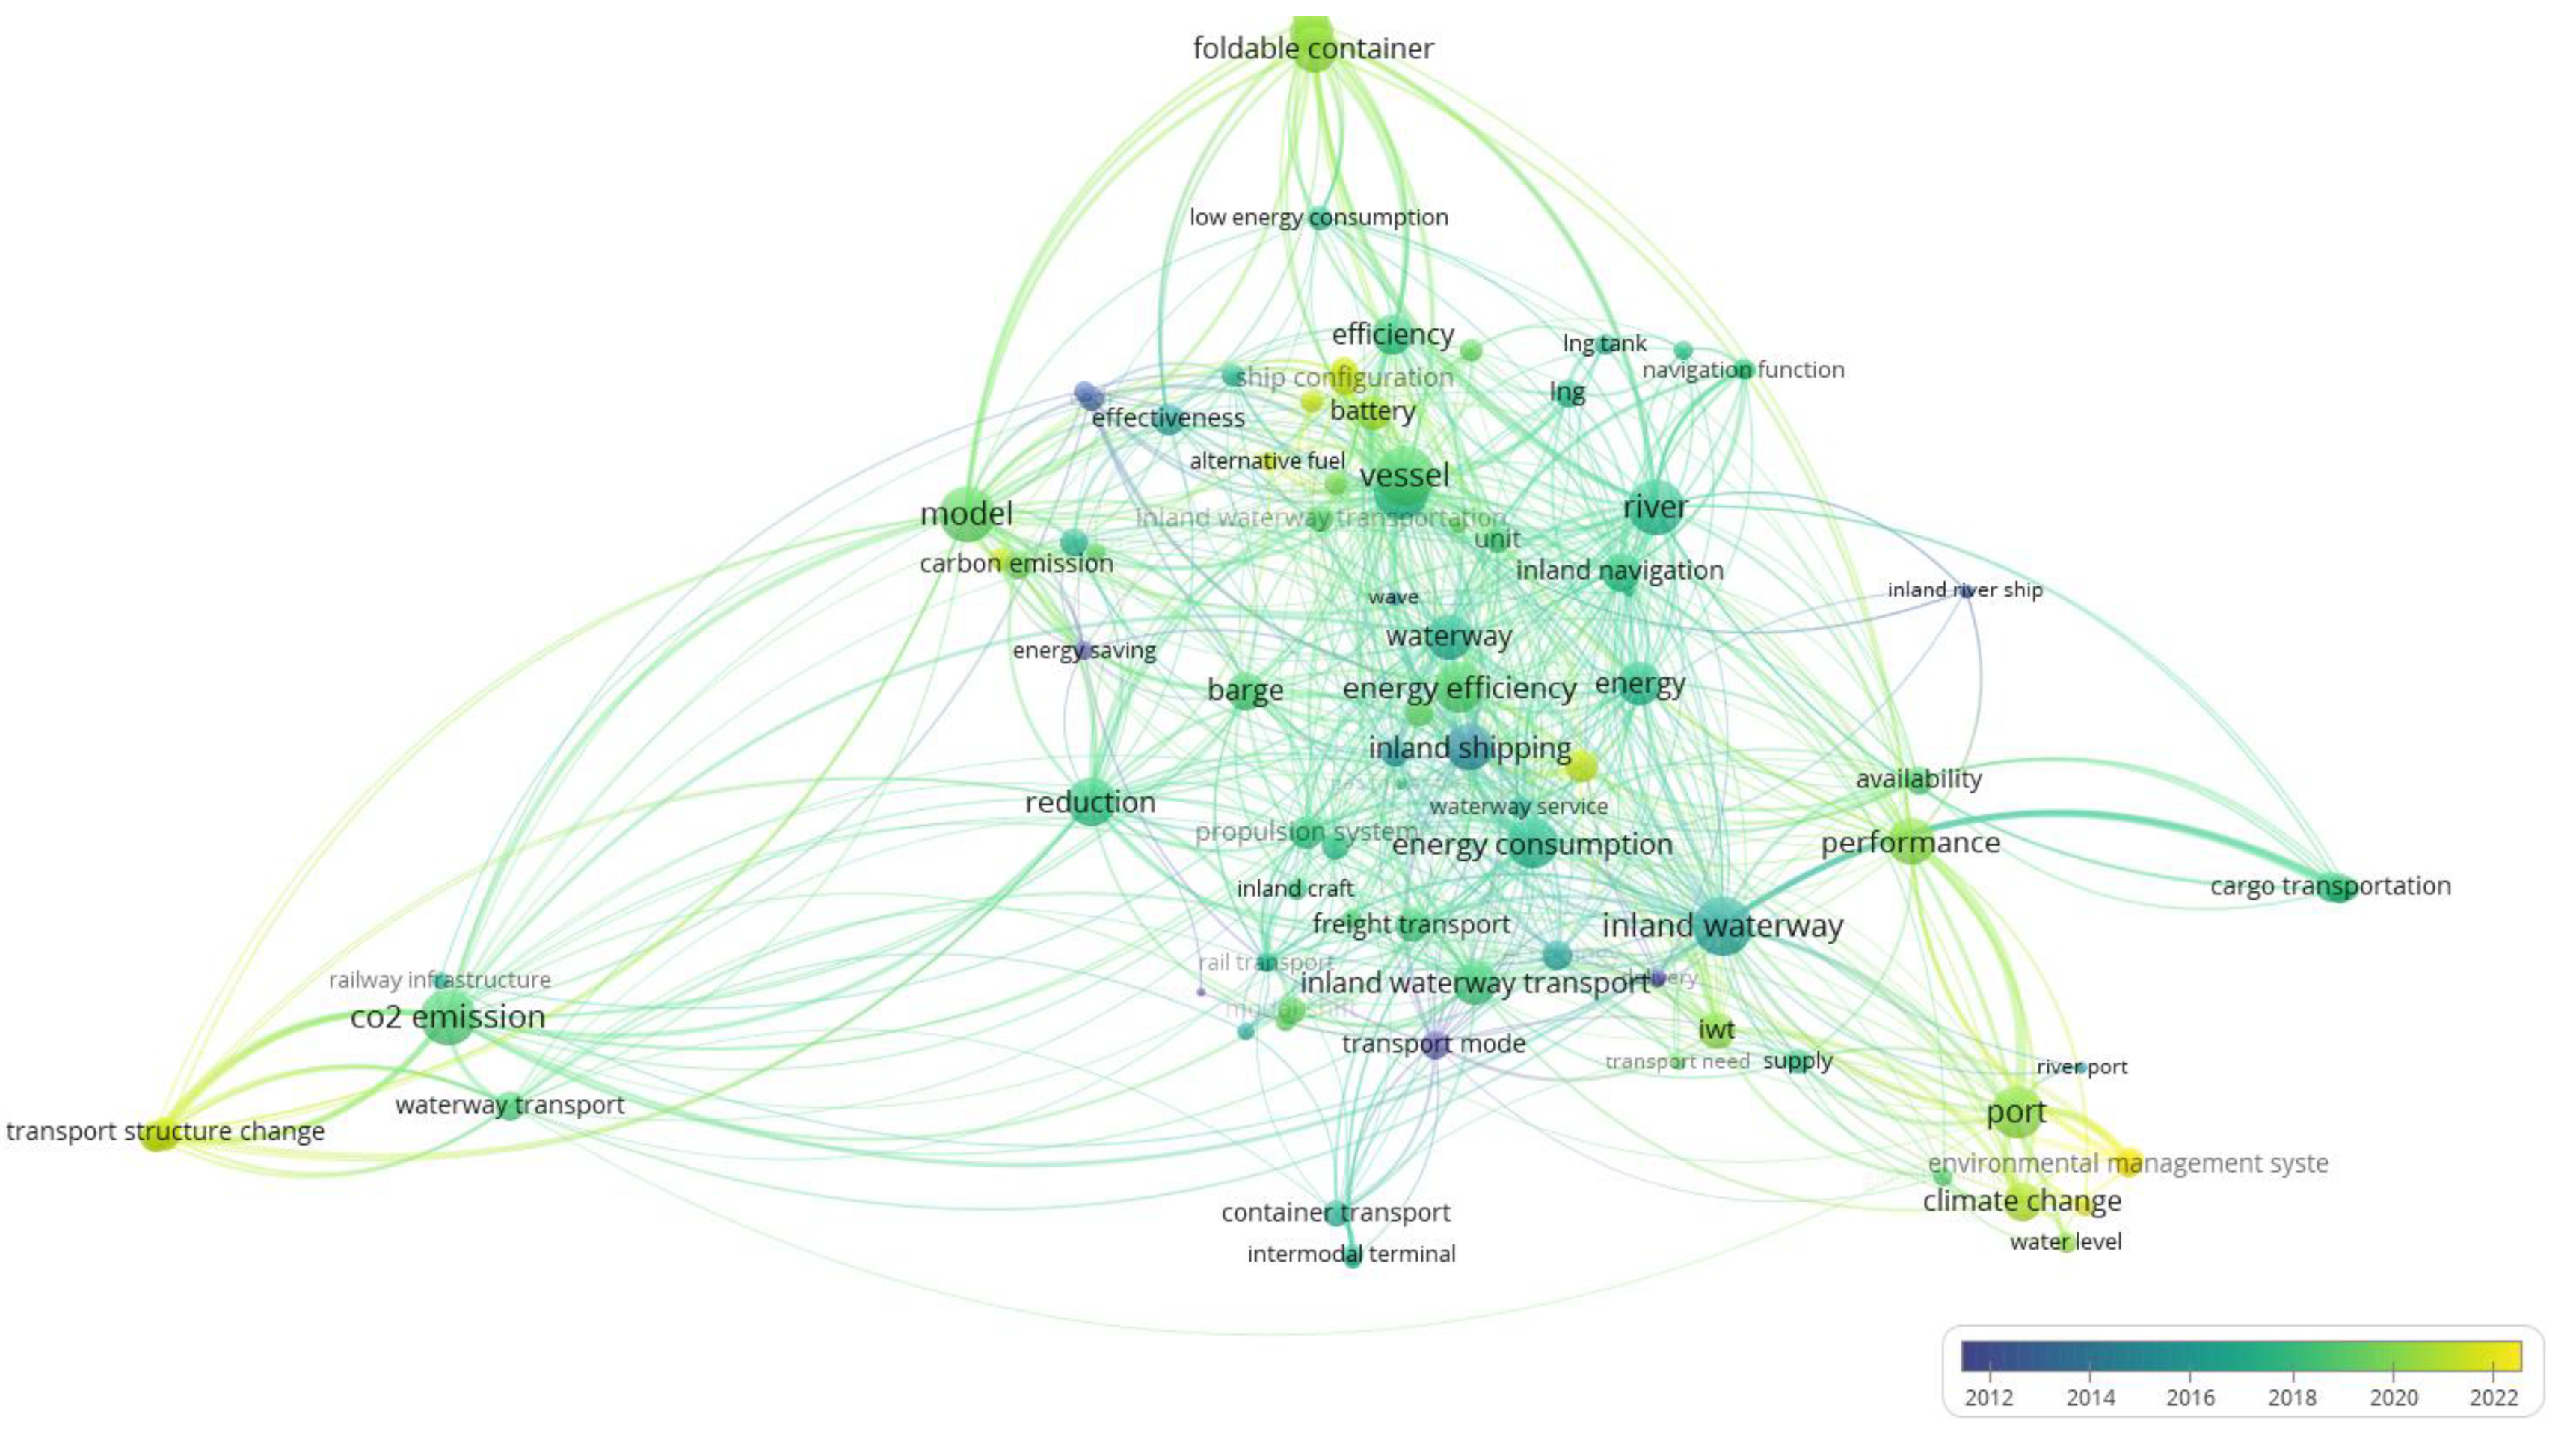
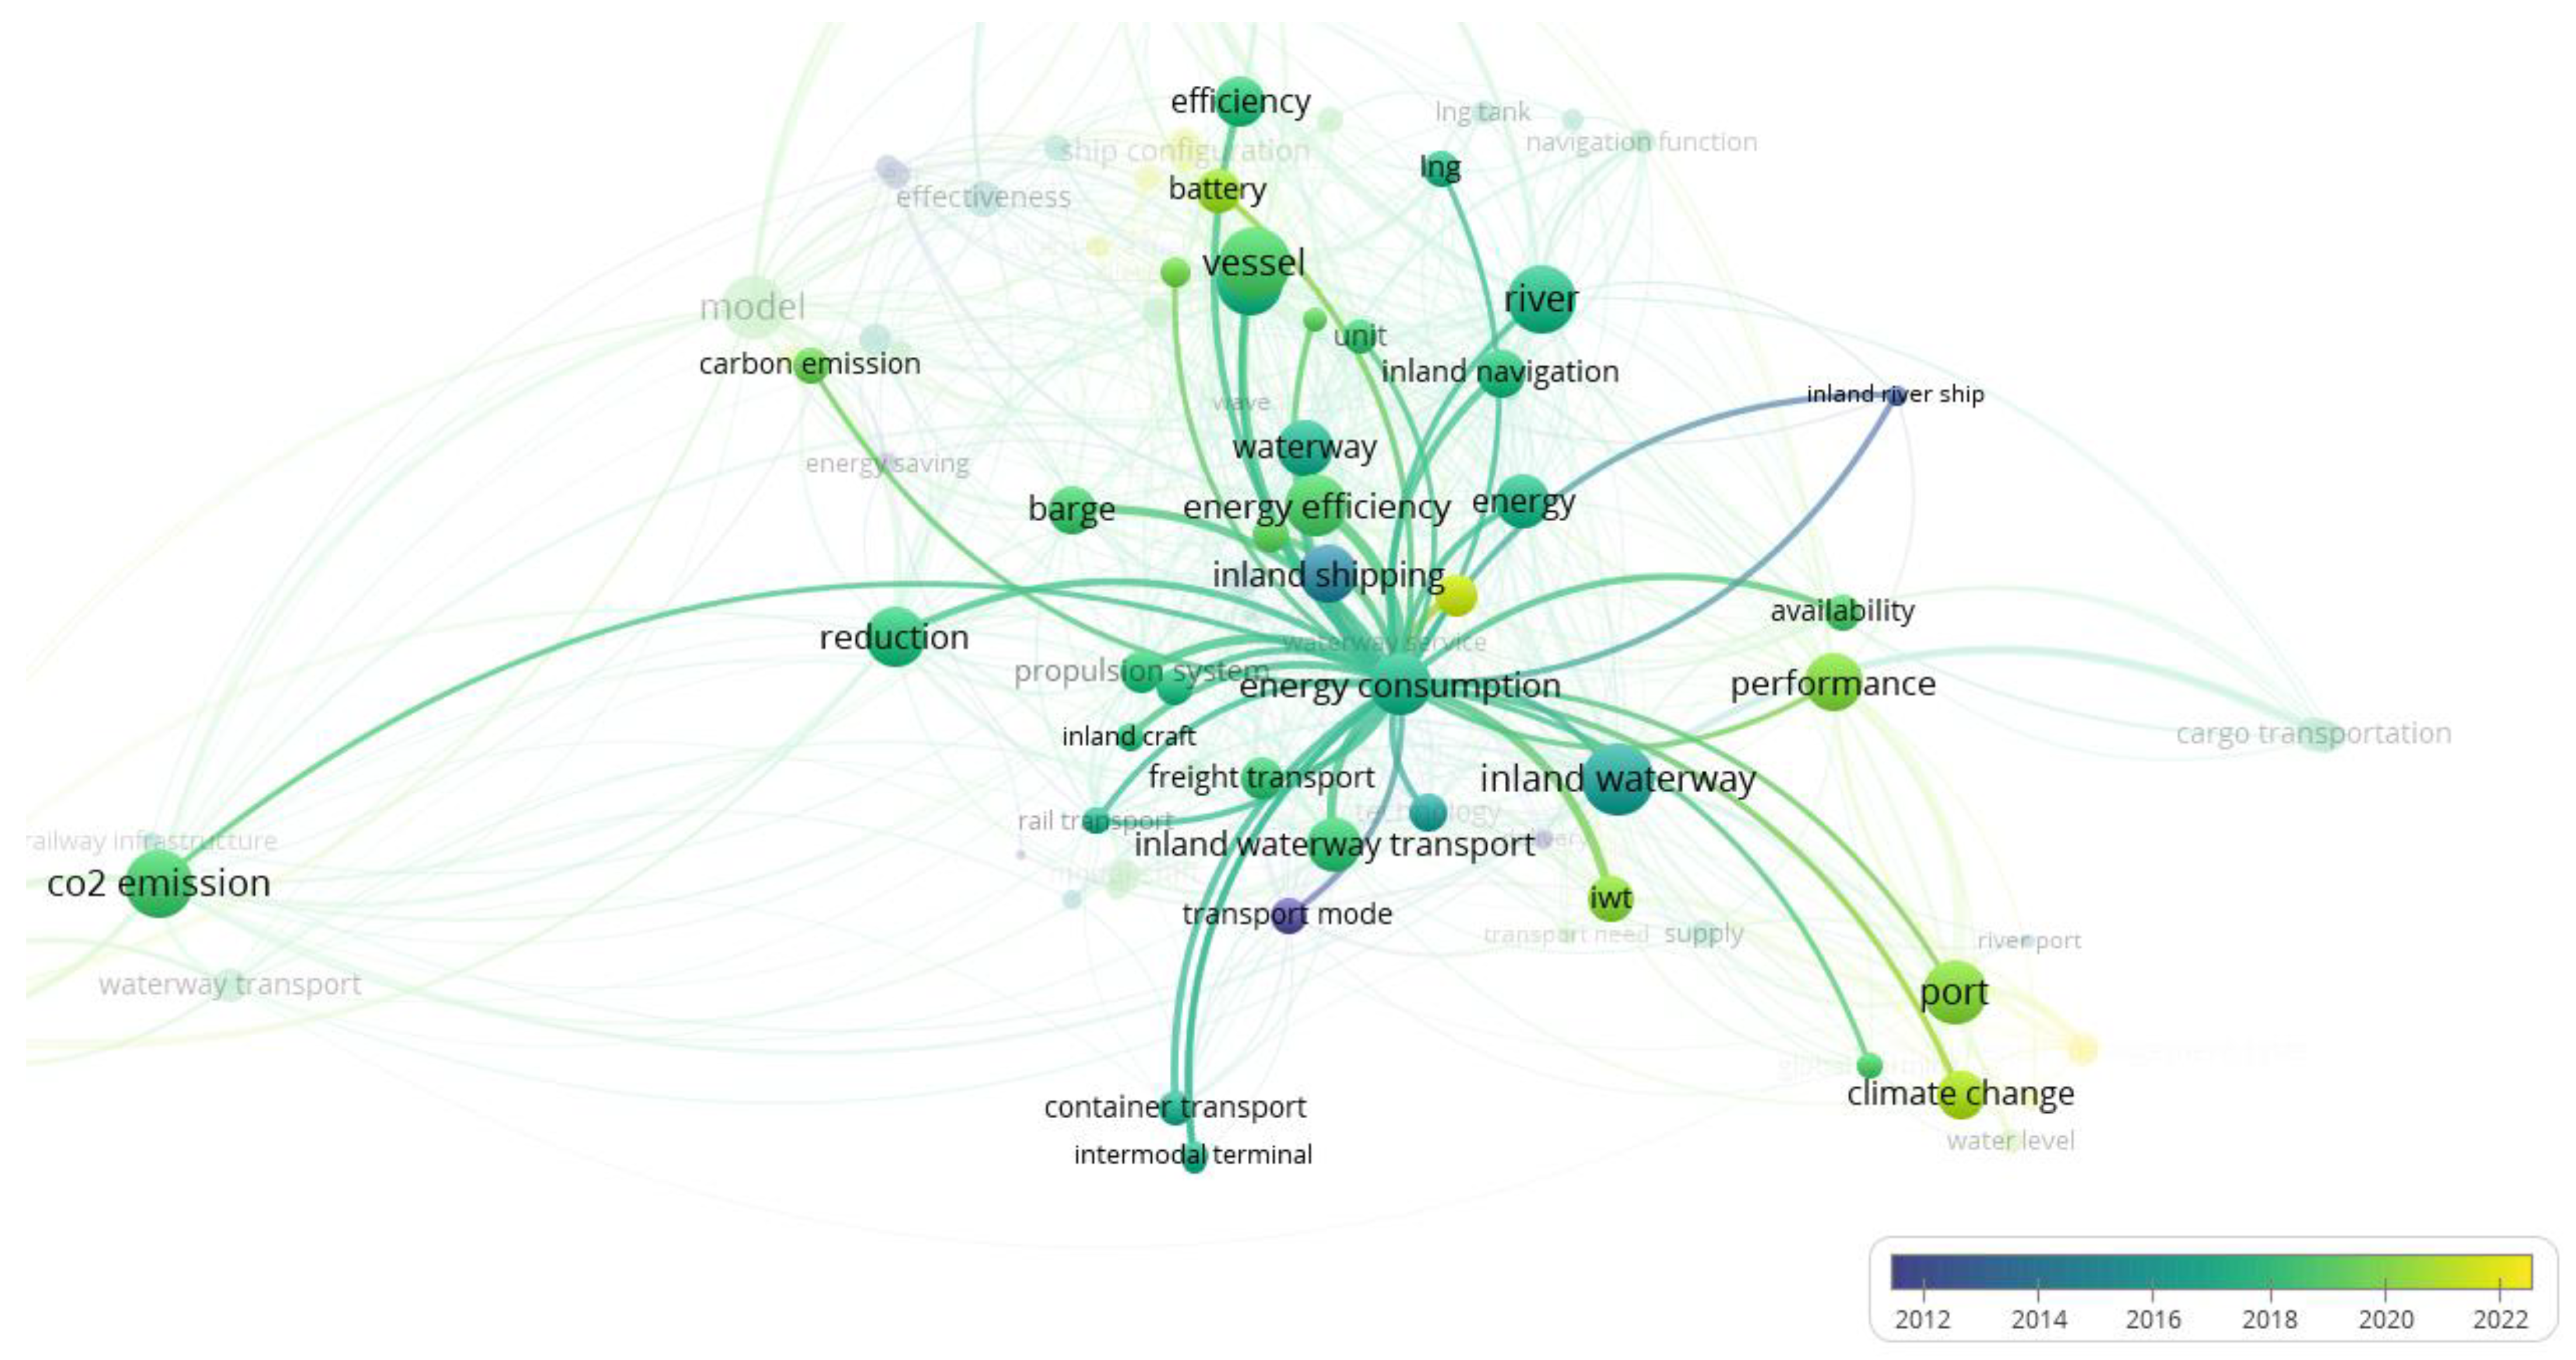
By exploring the selected publications in-depth, the focus was on mapping latent variables in the network of connections (Figure 2). Based on the network of relationships created, the latent variable ‘energy consumption’ was identified and attention was paid to how trends in the scientific research evolved. It can be noticed that in the last 5–6 years, the areas related to energy consumption, energy efficiency, inland waterway transport, and carbon dioxide emissions, followed by the areas of climate change and alternative drives have gained importance. On the other hand, in the previous decade, such issues related to the volume of transport and the mode of transport itself (from the point of view of the integration of various modes) played a role. Nevertheless, when analyzing the general network of connections, it can be seen that the authors extended the areas of interest that were the focus of a decade ago. This means that these issues have not lost their importance, although the emphasis has slightly shifted toward issues related to climate and energy policy at the expense of the issues of transport itself. This further means that the lens is focused on the concept of sustainable development rather than economic growth (including increased transport). There are also clear divisions among the micro-, meso-, and macroeconomic approaches to the described issues.
The exploration of the texts allowed for the identification of one more area of consideration. Based on Figure 1 and Figure 2 and Table 1, it can be noticed that the river (its sections or features, e.g., navigational features) are of particular importance in the context of the discussed issues. Therefore, this can be considered a latent variable that may have significance in shaping the energy consumption of inland waterway transport.
Table 1 shows that the highest marginal probability of the topic is related to the issues related to vessels, their power, efficiency, and energy consumption (micro–macro level). This was also confirmed by an attempt to identify the measurable energy consumption factors of inland waterway transport.
The review of the literature using text mining techniques is complemented by the identification of measurable (non-hidden) energy consumption factors of inland waterway transport at the microeconomic level (Table 2). In this case, these are not hidden (qualitative) factors, but those that can be quantified.
Identifying the factors influencing energy consumption in inland waterway transport at various levels using a multidimensional approach allowed for the assessment of data coverage for further analysis and the identification of the methodological and empirical gap. It is also a justification for the direction of the research for the analyzed area.

3. Data and Methods

3.1. Data

In the analysis, annual secondary data from the public databases of Główny Urząd Statystyczny (Central Statistical Office of Poland, GUS) [62,63,64,65,66] and Dziedzinowe Bazy Wiedzy (Knowledge Databases, DBW) [67] were used. The volume of inland waterway transport (in tons) and the transport performance (in ton-kilometers) were obtained from the GUS data and the unit energy consumption of the contractual vessel (in MJ/tkm) from the DBW. On their basis, the total energy consumption (in GJ) of inland waterway freight transport, the energy intensity of inland waterway transport, and the average distance traveled by 1 ton of goods were calculated (more information in the footer of Table 4). The cross-sectional data represent 9 sections of the Odra River (Table 4) and the time data concern the years 2015–2020.
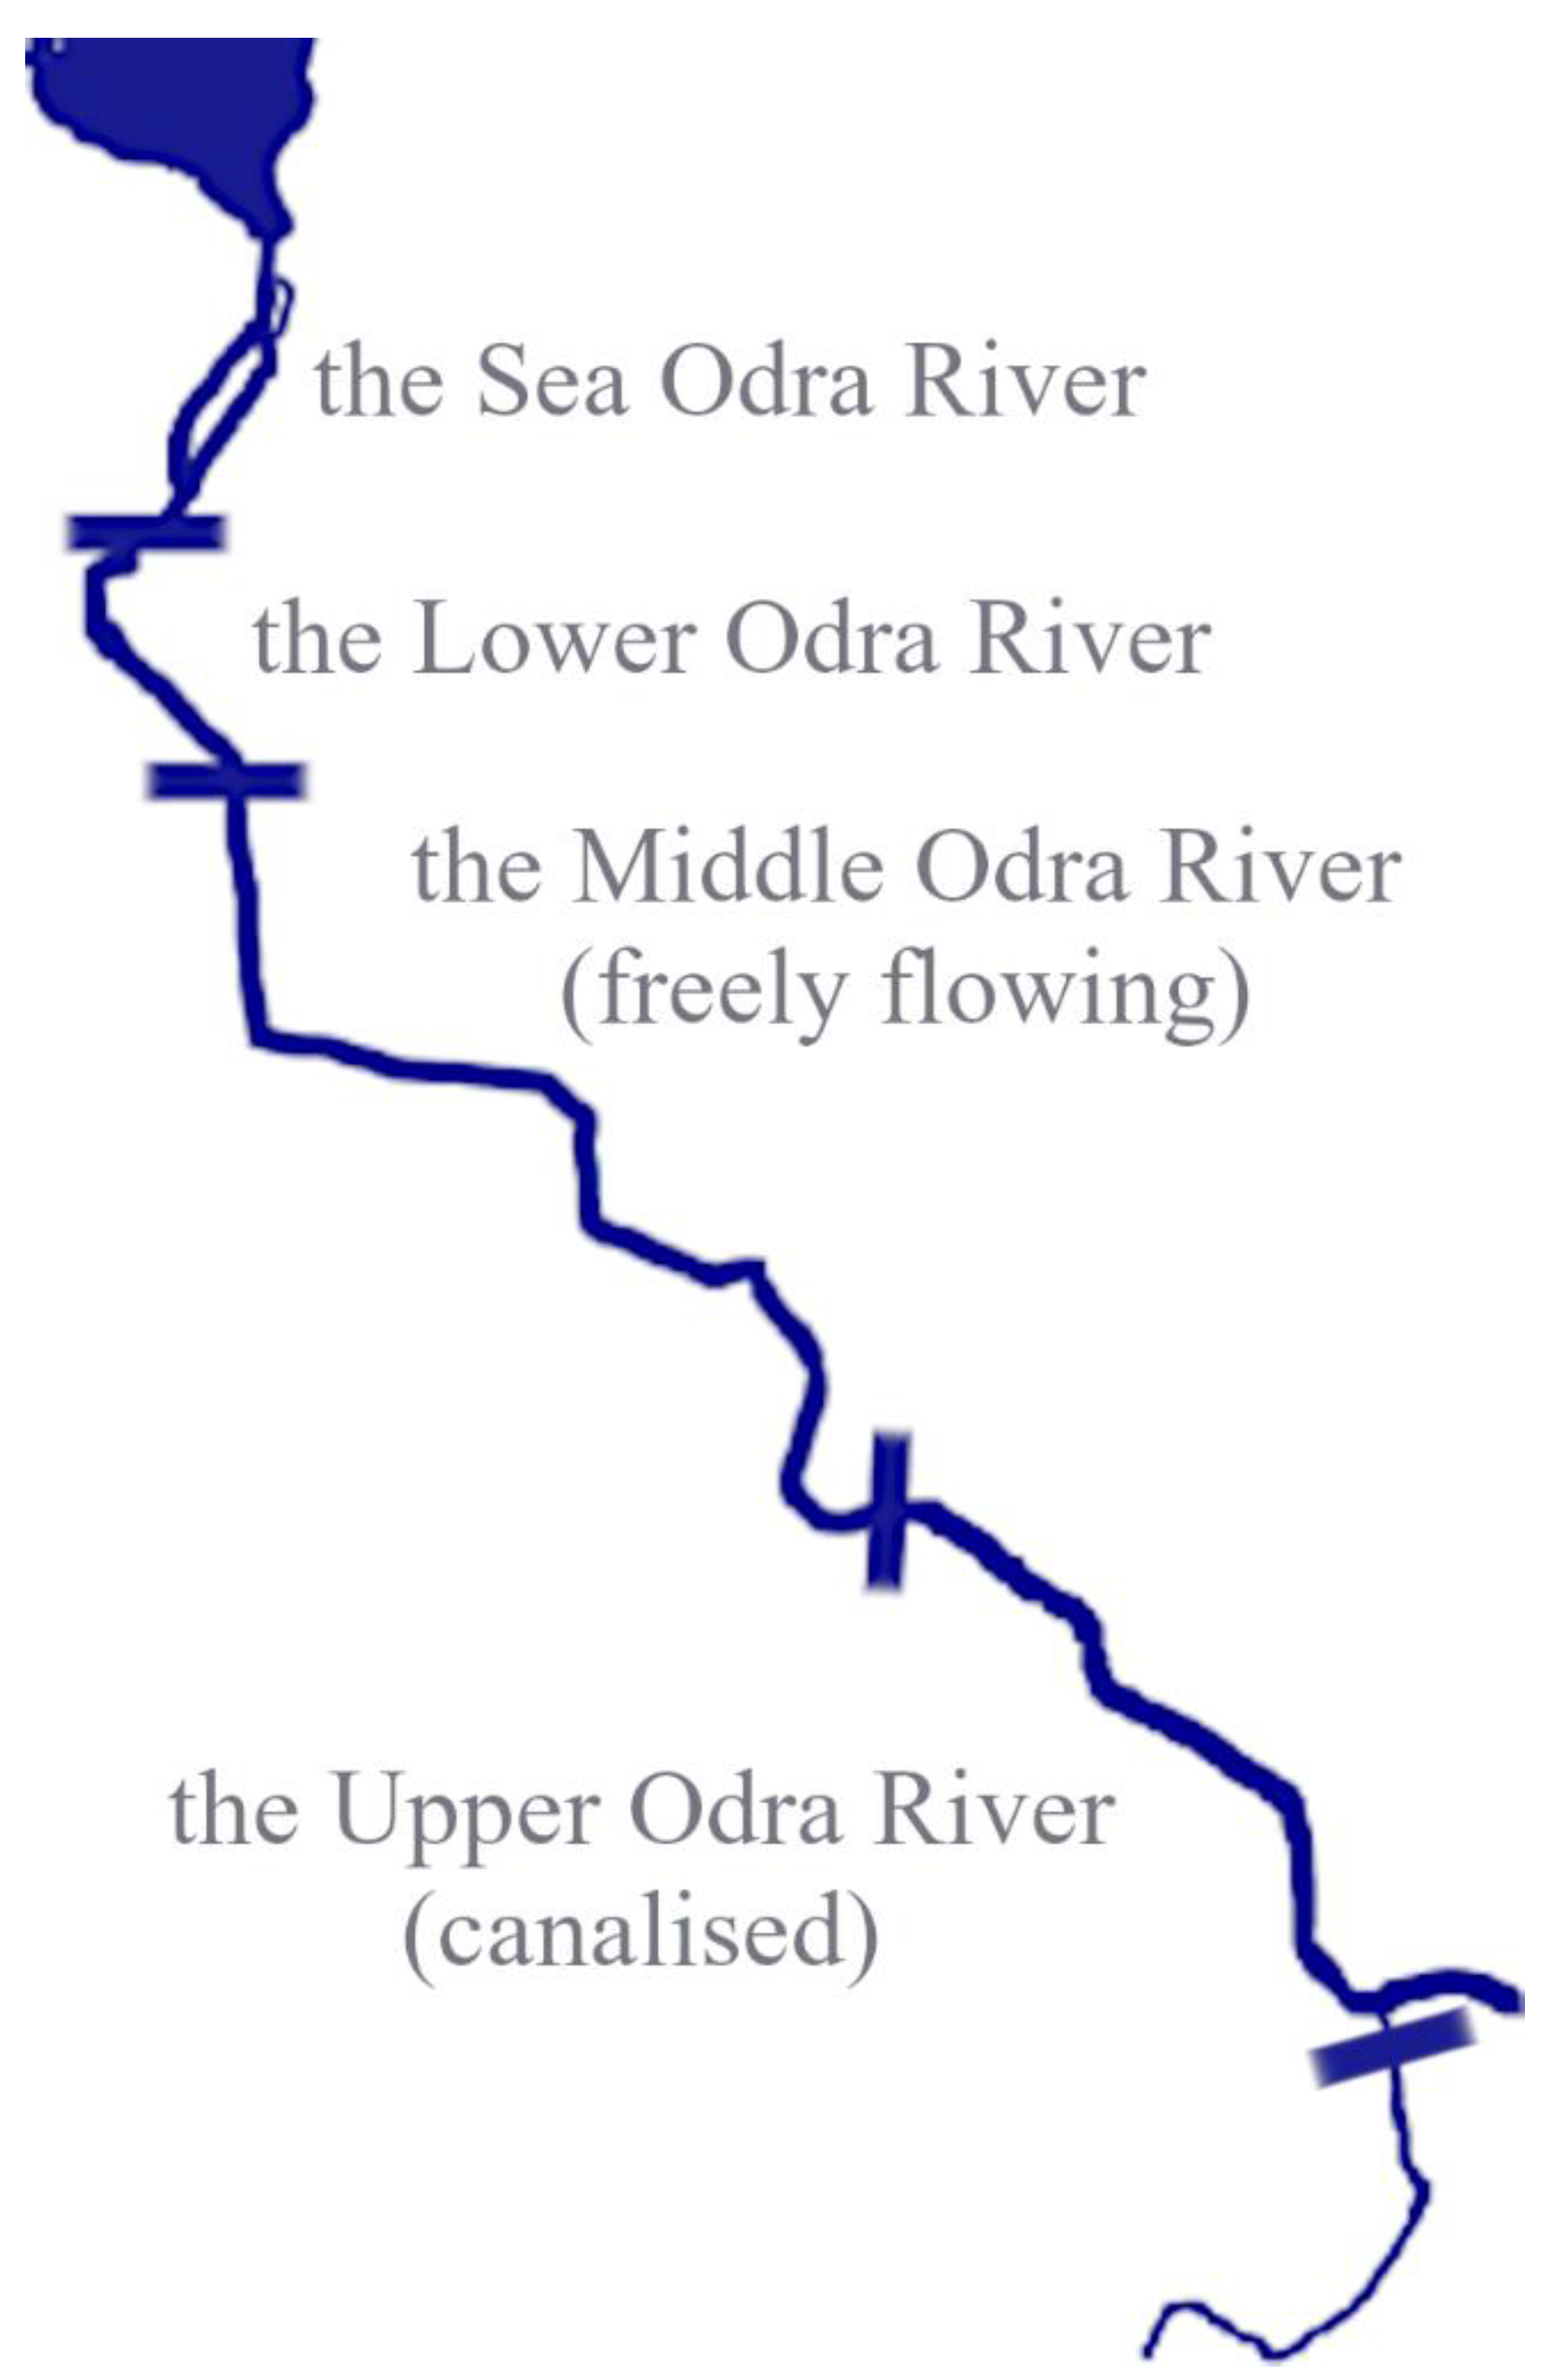
Table 3 presents the particular sections of the Odra River, and Figure 3 presents its graphic visualization. The article adopts classification and nomenclature for particular sections of the Odra River similar to the one presented by GUS [62,63,64,65,66]. This was necessary due to the principle of uniformity of the data. For clarity, the sea section of the Odra River has been translated as the Sea Odra River (in Polish ‘Odra morska’; this name of the river section is not mentioned in other classifications except the one proposed by GUS). However, there is also a different classification for particular sections of the Odra River. The Odra River is one of the two main rivers in Poland included in the Accord. Européen Sur Les Grandes Voies Navigables (AGN) agreement as to the E-30 route (Danube–Baltic Sea). The 687 km-long Odra River waterway consists of sections that meet the requirements of various classes of international classification (II, III, and Vb). The canalized Odra and the lower section of the Odra offer the best navigation conditions.
Table 4 presents selected descriptive statistics of the studied variables in particular sections of the Odra River.
Based on selected descriptive statistics of features for the Odra River and its sections, it was calculated that the average energy consumption by inland waterway transport is equal to 102,511.3 GJ. When analyzing the standard deviation in comparison to the mean value, it can be seen that the ratio of these two values is approximately 2.8. This value is equal to the coefficient of variation (280%), which proves a very large differentiation of the analyzed sections and years due to the mentioned feature (energy consumption). The highest average annual energy consumption recorded in the Lower Odra River section is equal to 552,159.24 GJ, and the Sea Odra River section is equal to 241,234.21 GJ. The lowest average values in the Sea Odra River–Upper Odra River (canalized) section, the Middle Odra River (freely flowing)–Lower Odra River section, and the Middle Odra River (freely flowing) sections are 356.78 GJ, 368.81 GJ, and 392.67 GJ, respectively.
Analyzing the volume of inland waterway freight transport, the average annual value in the selected sections is 330,354.44 tons. The observations deviated from this value by 560,382.60 tons on average. In comparing the two values, it was found that the transport varied in particular sections of the Odra River over the years. The highest volumes of transport were recorded on the Upper Odra River (canalized) section and the Lower Odra River section, while the lowest was on the Sea Odra River–Upper Odra River (canalized) section.
When assessing the resultant value of both energy consumption and the volume of transport, i.e., the energy intensity of inland waterway transport, large diversity among the analyzed sections and individual years can also be found. The average value of energy intensity was 1,380,332.85 kJ/ton. The sections of the Upper Odra River (canalized)– Lower Odra River and the Middle Odra River (freely flowing)–Upper Odra River (canalized) were characterized by the highest average annual energy intensity. The Upper Odra River (canalized) section was characterized by the lowest energy intensity.
The annual average distance traveled by 1 ton of goods for all sections is approximately equal to 190 km, with the highest average annual value recorded in the Upper Odra River (canalized)–Lower Odra section and the lowest for the Upper Odra River (canalized) section, as is the case with the energy intensity of this type of transport.
When analyzing the value of skewness, it can be observed that most of the features examined in particular sections were characterized by a right-hand distribution (similarly to the average values for the entire river). Only in the case of the Sea Odra River section is a left-hand distribution noticeable on all the examined variables. In the case of the Upper Odra River (canalized)–Lower Odra River section for it is noticeable on two variables: energy intensity and average distance, and in the case of the Lower Odra River section, for one variable: the transport of goods. High skewness values may suggest that there is a problem of disturbance/instability of the processes: energy consumption, transport volume, and their resultant value-energy intensity of transport, which were examined using industrial statistics (X-average control charts) later in the article.

3.2. Methods

The Eta coefficient (η) was used to investigate the relationship between the route selection (qualitative, nominal variable) and the energy consumption by inland waterway transport, the volume of transport, the energy intensity of this mode of transport, and the average distance traveled by 1 ton of goods (quantitative variables).
Eta correlation is associated with the analysis of variance (ANOVA). Using ANOVA, it was investigated how the independent variable influences the dependent variable. Because the variable represented by the route selection (‘Route section’) has many levels (these are different sections of the Odra River), it was an appropriate method to investigate the differences among the studied groups. In other words, it led to the verification of whether the selection of specific sections of the Odra River differentiates energy consumption, the volume of transport, the energy intensity of transport, and/or the average distance traveled by 1 ton of goods.
The Fisher (F) statistic and the p-value were used for verification (statistical significance was assumed at a p-value of <5%). The relationships among the ANOVA results, the correlation coefficient η, and the F statistic can be written as follows [68]:
η 2 = SS   ( between   groups ) SS   total
η = η 2
F = [ η 2 · ( N k ) ] [ ( 1 η 2 ) ( k 1 ) ]
where SS (between groups) is the sum of the squares of the effect for the independent variable, SS total is the total of the sum of squares, 1 − k and Nk are the degrees of freedom (df), N is the number of total observations, and k is the number of groups.
Bearing in mind that the choice of route may, on the one hand, differentiate the discussed quantities (energy consumption, volume of transport, energy intensity, and average distance), and, on the other hand, shape these values, the study was extended to include generalized linear models to explain the energy consumption of inland waterway transport and the energy intensity of this transport. The models were verified with the Wald Chi-Square test (type III) [69] and the Omnibus test [70].
The models were also tested for overfitting and collinearity. To separate the signal from the information noise, the Lasso (L1) and Ridge (L2) method for the energy intensity model was used (for more information about the whole procedure [71,72]). Lasso regularization was also used to eliminate collinear attributes.
In the final part of the study, the Six Sigma tool was used, i.e., X-average control charts, to define the centerline, warning lines, and control lines (see Six Sigma methodology [73]). The use of this method was necessary from the point of view of diagnosing the instability of consumption processes and was complementary to the previously used ones. With this technique, it was possible to identify the years in which the instability had occurred.

4. Results and Discussion

Due to the diversity of the features described above, the following research questions arose: Do particular sections of the Odra River differ significantly in terms of energy consumption, the volume of transport, the energy intensity of inland waterway transport, and the average distance traveled by 1 ton of goods in the analyzed years? Does the selection of the route along the Odra River (the river section for transport activity) determine the volume of inland waterway freight transport, energy consumption, and thus the energy intensity of this transport, and its average distance? The answers to these research questions can be found in the results of the analysis of variance (ANOVA) and association measures (Eta and Eta squared). The results are presented in Table 5 and Table 6, respectively.
Based on variance analysis, it can be estimated that the particular sections of the Odra River differ significantly in terms of transport volume (F (8, 45) = 39.74 with a p-value < 0.01, η2 = 87.6%), energy consumption (F (8, 45) = 3.52 with a p-value < 0.01, η2 = 38.5%), energy intensity in inland waterway transport (F (8, 45) = 2.72 with a p-value < 0.01, η2 = 32.6%), and the average distance traveled by 1 ton of goods (F (8, 45) = 7.29 with a p-value < 0.01, η2 = 38.5%).
For the differentiation in the volume of inland waterway freight transport, 87.6% can be explained by the performance of transport in various sections of the Odra River. On the other hand, the operation of transport on various sections of the Odra River explains 38.5% of the diversification of energy consumption and 32.6% of the diversification of the energy intensity of inland waterway transport. Additionally, for the differentiation of the average distance traveled by 1 ton of goods, 56.5% can be explained by the performance of transport services in various sections of the Odra River. Therefore, the decision to transport on a given section of the Odra River is an important factor in determining, on the one hand, the volume of transport, and, on the other hand, the energy consumption by inland waterway freight transport. Moreover, the choice of the route (Odra River section) determines the energy intensity and the average distance traveled of 1 ton of goods. These conclusions provide the basis for the construction of a model with which it will be possible to assess the impact of the decision on the selection of the section of the Odra River (route) on the energy consumption by inland waterway freight transport (Table 7) and the energy intensity of this type of transport (Table 8).
The model presented in Table 7 suggests that an increase in inland waterway freight transport by 1 ton (with the current structure of transport in the analyzed Odra River sections maintained) will increase energy consumption by 1.87 GJ on the Odra River ceteris paribus. In other words, there is a growing marginal cost of 1.87 GJ/ton, equated here with the energy intensity of this type of transport. This is higher than the average cost (energy intensity), equal to approximately 1.38 GJ/ton (see mean of total sections in Table 4). Therefore, according to the economic theory of marginal costs, one can expect an increase in the average cost with an increase in transport volume.
The increase in marginal costs correlates with a decrease in marginal benefits. The transport of each subsequent ton of cargo without changing the transport structure within the analyzed routes consumes more and more energy resources. Therefore, there is a need to make decisions about the rationalization of transport in selected sections of the Odra River. The model shows that three route sections can be selected that are important in the context of reorganizing inland waterway freight transport, taking into account the need to minimize the energy intensity of this transport (i.e., through the prism of weighted scaling). In these sections, the most efficient operation of this transport is in terms of energy consumption and transport volume, and they include the following: the Upper Odra River (canalized), the Sea Odra River, and the Lower Odra River. The following relationships can be assessed:
  • Inland waterway freight transport, which takes place through the Upper Odra River (canalized) section, contributes to lower energy consumption on the entire Odra River by 2,429,136.57 GJ compared to if this section of the route was excluded from use (ceteris paribus).
  • Inland waterway freight transport via the Sea Odra River section allows for lower energy consumption on the entire Odra River by 757,157.09 GJ compared to if this section was excluded from use (ceteris paribus).
  • The possibility of providing inland waterway freight transport through the Lower Odra River section allows one to reduce the total energy consumption on the entire Odra River by 675,166.21 GJ compared to the situation if this section was excluded from use (ceteris paribus).
In contrast to these conclusions, it is also possible to identify sections that are characterized by the opposite direction of influence. For one of them, with the strongest impact, the following relationship was assessed:
  • The performance of transport services on the Sea Odra River–Lower Odra River section causes an increase in the total energy consumption by 19,157.01 GJ on the entire Odra River as compared to the situation if the transport were planned for a section other than this one.
This is probably influenced by the transport distance, i.e., the combination of the Lower Odra River section and the Sea Odra River section. However, it is also worth looking at this section from the network point of view. Excluding this section from the route for hypothetical energy consumption mitigation could disrupt the continuity of the supply chain over longer distances.
Taking into account the fact that the Odra River sections discussed differ significantly from each other in the analyzed characteristics, the analysis was extended with additional elements. The energy intensity of the inland waterway freight transport was examined based on the average distance traveled by 1 ton of goods and the choice of route, also taking into account the continuity of the supply chain (Table 8). The energy consumption itself and the volume of transport do not fully reflect the specificity of this type of transport.
Based on the model presented in Table 8, the following conclusions were formulated, assessing the direction and strength of the relationships:
  • An increase in the average distance traveled by 1 ton of goods by 1 km will increase the energy intensity by 8364.14 kJ/ton (approx. 8 MJ/ton, ceteris paribus).
  • Inland waterway freight transport on the Sea Odra River–Upper Odra River section causes an increase in energy intensity of this type of transport by 253,284.55 kJ/ton (253 MJ/ton) compared to the case of abandoning transport of goods along the entire analyzed Odra River (ceteris paribus).
  • Inland waterway transport on the Middle Odra River (freely flowing) section increases the energy intensity of this transport by 123,500.67 kJ/ton (123.5 MJ/ton) compared to if the transport on this section was abandoned (ceteris paribus).
  • Inland waterway transport on the Upper Odra River (canalized)–Lower Odra River section causes a decrease in energy intensity by 958,057.01 kJ/ton (958 MJ/ton) compared to if this section was excluded from transport (ceteris paribus).
  • Inland waterway transport on the Middle Odra River (freely flowing)—Upper Odra River (canalized) section reduces the energy intensity of this transport by 732,960.51 kJ/ton (733 MJ/ton) compared to if it had not been carried out following this route (ceteris paribus).
To sum up, the energy intensity of inland waterway transport is the highest when carrying out cargo transport on the entire Odra River and only on the Middle Odra River (freely flowing) section. On the one hand, it can be noticed that the extension of the route of the Upper Odra River (canalized)–Lower Odra River by a section to the sea causes a breaking point somewhere. This was a situation in which transports planned along the entire route were less favorable in terms of the ratio of energy consumption to transport volume. On the other hand, planning transports through the Middle Odra River (freely flowing) section with another section resulted in a reversal of the energy intensity changing. Transport only on this section was relatively more energy-intensive in relation to the transport of 1 ton compared to the case of an extension of the route to the upper or lower section of the Odra River. This means that the energy intensity of inland waterway transport is not unit proportional to the average transport distance (to the length of the route) but is also dependent on the operating conditions of the roads (a latent variable in the qualitative variable).
Regularization as part of machine learning is useful to avoid overfitting the model. To separate the signal from the information noise, Lasso (L1) and Ridge (L2) regularizations were used. Parameter assessments using these techniques are presented in Table 9.
As a result of the regularization carried out using two methods (Lasso and Ridge), the Lasso method (Table 9) obtained values similar to the pure model (Table 8). The Ridge method was used to obtain results that reduced the impact of transport activity on a given section of the Odra River, leading to an improvement in energy intensity, and the results for parameters that increased the energy intensity indicators were strengthened. In one of the Odra River sections—Middle Odra River (freely flowing)–Lower Odra River—a completely different direction of influence was obtained compared to the pure model (before the regularization of parameters) and the model with L1 (Lasso) regularization. It can be assumed that the results obtained by L2 regularization (Ridge) avoid overfitting, but they shift the values and may break down the error evaluation efficiency, omitting a lot of valuable information about further directions of exploration. Its results can be treated as complementary. The L1 (Lasso) regularization gives higher confidence, which has an additional advantage (that the L2 method does not have)–it eliminates the collinearity of the examined attributes. The results of regularization by the L1 (Lasso) method also indicate that the pure models are not overfitted and do not have the effect of bloating the variance (which occurs in the case of collinear attributes). This is valuable information from the point of view of the influence of the neighborhood in the network system for the continuity of the supply chain (how much a given section is burdened by loads). However, for the sake of clarity, the results confirmed in the two methods were adopted—before regularization and after regularization (Lasso). In all three methods, the impact of the average distance traveled by 1 ton of goods on the energy intensity of this transport was confirmed. Along with its increase, an increase in the energy intensity is noticeable.
This provides the basis for exploring these two variables with industrial statistics (Six Sigma tools), i.e., the X-average control chart. The regularization process over time for all sections is shown jointly in Figure 4 and 
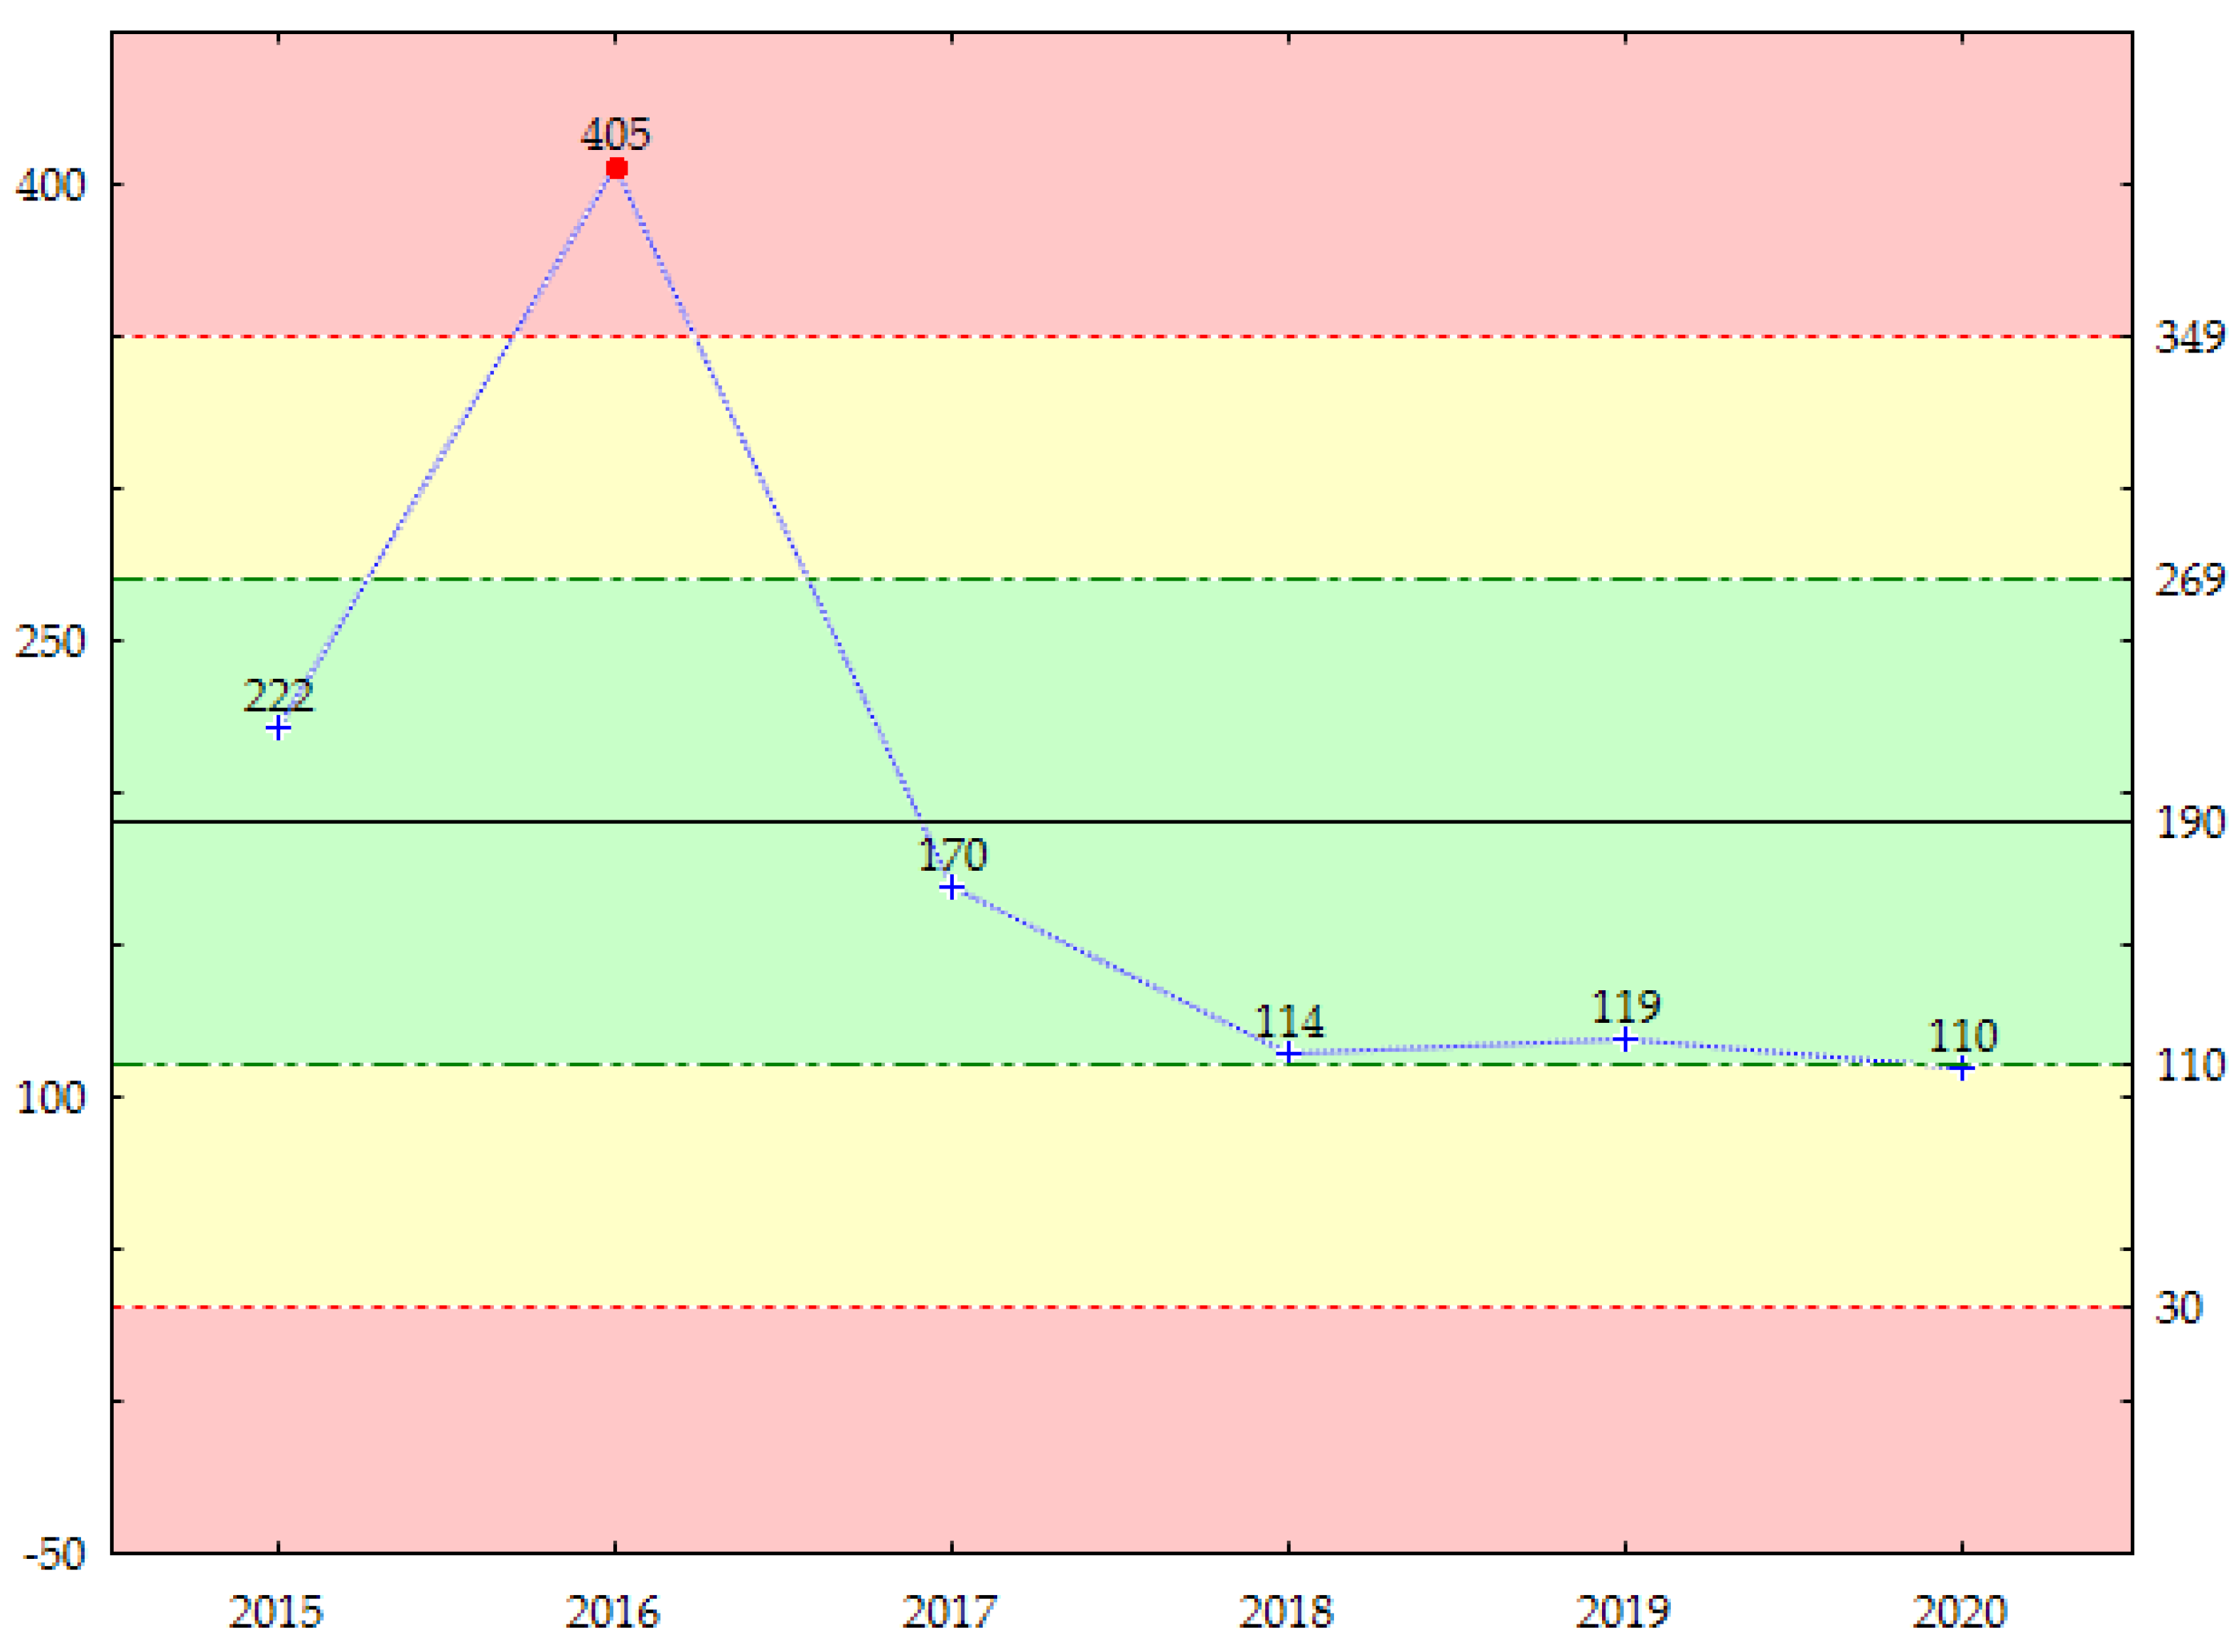
Figure 5. It is assumed that the central value is equal to the mean (the stabilization range covers the green area), the first warning threshold was set at plus/minus 1σ (the first-level warning signal covers the yellow area), and the control (tolerance) limit at plus/minus 2σ (3σ is also assumed, but due to the standard deviation, the threshold should be lowered to 2σ). The results in the red area require intervention (unstable process). It is assumed that in the case of energy intensity, the upper limits are alarming from the point of view of energy intensity. On the one hand, the lower ones may indicate a reduction in energy intensity as a good management result, but on the other hand, they may also be a hidden signal of a reduction in transport activity, which may also be an alarming signal.
By analyzing the average annual data (Figure 4 and Figure 5), it can be seen that the energy-intensive process of the inland transport of goods was stabilized in 2017, 2019, and 2020. It was within the permissible deviations from the central value (+/−1σ). At the same time, one can notice relatively large fluctuations in 2015 and 2016—two extreme values, exceeding the second-level warning threshold (+/−2σ). In 2018, there was a warning signal about the reduction of energy intensity, but it was not a permanent signal. However, the greatest doubts are raised by the upper deviation of energy intensity, which was caused, on the one hand, by the relatively high consumption of total energy in the analyzed years, but also by an increase in the average distance traveled by 1 ton of goods. When analyzing the process of shaping the average distance traveled by 1 ton of goods, stabilization can be noticed in 2015 and 2017–2020. Only in 2016 did this distance deviate significantly. Using the data mining method, it was identified that the reason for this was an increase in the transport volume or the transport performance, energy consumption, and average distance traveled by 1 ton of goods on two sections—the Sea Odra River–Upper Odra River (canalized) and the Middle Odra River (freely flowing).
Summing up, the organization of transport in these two sections causes a significant negative instability of the transport energy intensity. It might seem that transport over longer distances is less energy-intensive, but in the case of the Odra River, with different hydrological and operational conditions, it turns out that increasing the distance along the entire river increases energy intensity. The shifting of loads among river sections can improve energy intensity. The issue of diminishing marginal benefits from an additional ton of goods, which generates more and more energy consumption, is also quite important. This also provides the basis for the study of particular sections of the Odra River in terms of energy intensity in an isolated system.
The results clearly show that the energy consumption of inland waterway transport is influenced by the selection of the route section under which the navigable usefulness of the waterway is hidden (latent variable), i.e., the natural conditions of rivers and the navigation conditions. Their improvement depends on the regulation of navigational conditions within the shaping of the trail and the dredging of the river. They are necessary to improve navigability and accessibility and to avoid bottlenecks, consequently reducing the energy intensity of this mode of transport. The research shows that it is important to raise standards and create a coherent waterway to improve the energy consumption of inland waterway transport over long distances. Odra River sections that significantly reduce the energy consumption of inland waterway transport in the entire network have been identified, which may bring immeasurable benefits for inland waterway transport itself, as well as for the intermodal integration of the entire transport network from the point of view of environmental management. Intermodal integration will relieve the environment by reducing infrastructure congestion, mitigating environmental pollution in transport, and reducing energy consumption per unit of transport volume. In this respect, the results of the energy consumption of inland waterway transport are valuable in the entire network system as well as in various sections and over long distances, especially in the case of low-value and bulk cargo transport. As previously mentioned, inland waterway transport does not burden the environment as much as road transport and may be complementary to other modes, provided that appropriate infrastructure investments are made. This research is also an additional argument for the discussion about the need to invest in the Odra waterway from the point of view of energy consumption.

5. Conclusions

The analyses presented allow for the identification of quantitative and qualitative factors that influence the energy consumption of inland waterway freight transport and the indication of the rationalization directions for the energy intensity.
Based on the literature review using text mining techniques (including Latent Dirichlet Allocation, MDS, word cloud, and direction mapping), research directions on the energy intensity of inland waterway transport were identified, as well as research methods and latent (immeasurable) variables. By exploring this issue deeper, the marginal probability of the occurrence of a given area in the research of other scientists was calculated. In addition to latent variables, quantifiable variables were also identified. This contributed to the evaluation of the potential of the issues being investigated, the development of a methodology integrating various techniques, and the recognition of the cognitive gap regarding the rationalization directions of the energy intensity of the inland waterway freight transport, using the example of the Odra River.
The conclusions obtained from the literature review made it possible to map the factors with the data obtained for the study using statistical and econometric methods (i.e., ANOVA, generalized linear models, Eta coefficient, the Lasso and the Ridge regularization, Six Sigma). In general, the literature review was complementary to the main statistical and econometric research.
Based on empirical research, the directions of rationalization of the energy consumption of inland waterway freight transport were indicated depending on the route selection, the volume of transport, and/or the length of the route. Therefore, the objective of the study was achieved. The research hypothesis was confirmed that the choice of the route along particular sections of the river determines the rationalization of energy consumption (and energy intensity) of inland waterway freight transport. The conducted research provided positive answers to the research questions. All of them can be answered with ‘YES’. The choice of route determines the total energy consumption of this transport and affects the potential of transport in this mode. In addition, particular sections of the Odra River differ significantly in the level of energy consumption of inland waterway freight transport and the volume of transport. This means that, on the one hand, they are an element of the network system, and on the other hand, they have their specificity (certain navigation and operating conditions), and the use of a given fairway may create the energy consumption of this transport in a completely different way.
In addition, it was indicated which sections are used to rationalize the energy intensity of transport and to what extent. In addition, the impact of the increase in the volume of transport and the length of the route on the energy intensity of this transport was assessed. These issues gained the attribute of measurability and comparability. Lasso and Ridge regularization to denoise the signals turned out to be necessary in this respect. The Ridge regularization technique eliminated the issue of overmatching of the achieved results but did not eliminate less important attributes. The results achieved with Lasso regularization in this regard inspire more confidence. They confirm that the pure models are not overfitted and are devoid of collinearity.
The extension also evaluates the stability of the energy-intensive processes of inland waterway transport and the identification of signals about dysregulation using Six Sigma tools. The use of control charts made it possible to identify the sources and moments of instability of these processes and to indicate the tolerance thresholds that are important from an early warning point of view. Modeling the energy consumption processes of this mode of transport from the point of view of early warning was an important tool for the management of inland waterway transport, transport policy, shipowners, and all those involved in this process. They make it possible to change unfavorable patterns into activities that contribute to reducing energy consumption by monitoring, predicting, and avoiding negative consequences for the environment. These studies also show the differences among the Odra River sections, the scale of the potential benefits of reducing energy intensity, and the increase in the potential for waterway use if the waterway were to be invested in some sections. The polemic about the need to invest in the infrastructure of this transport gains new arguments for its development.
However, this study also has limitations. It does not take into account all possible rationalization directions and does not focus on the lower granularity of the data, which is a challenge for the future. However, the main advantage of the approach used is its versatility and the possibility of developing it with new elements. This enables the level of analysis to be extended to research on the structure of transport or the flexibility of intermodal substitution.
The research carried out is innovative because, so far in the analyzed literature, there have been no studies on the methodology for estimating the energy consumption of the inland waterway freight transport on the nine sections of the Odra River differentiated in terms of navigational conditions and route length, nor studies on the energy consumption of the inland waterway freight transport of the Odra River using the network and the isolated approach. The study is multidimensional and also refers to the problem of disregarding consumption processes, which is important from the point of view of environmental management. The selection of research techniques in the field of data mining and knowledge discovery (part of the so-called data science) is an innovative proposal to enrich the methodology of assessing the energy consumption of inland waterway transport and a proposal to enrich the theory of energy management in transport. The research is interdisciplinary, as it covers many research areas, i.e., management, economics, transport, statistics, and IT.

Author Contributions

Conceptualization, E.S. and E.Z.; methodology, E.S.; validation, E.S. and E.Z.; formal analysis, E.S.; investigation, E.S. and E.Z.; resources, E.S. and E.Z.; writing—original draft preparation, E.S. and E.Z.; writing—review and editing, E.S. and E.Z.; visualization, E.S. and E.Z.; supervision, E.S. and E.Z.; project administration, E.S. and E.Z.; funding acquisition, E.S. and E.Z. All authors have read and agreed to the published version of the manuscript.

Funding

This research received no external funding.

Institutional Review Board Statement

Not applicable.

Informed Consent Statement

Not applicable.

Data Availability Statement

Data are contained within the article. To estimate the analyzed results, the authors used raw data from the databases included in the references listed as [62,63,64,65,66,67].

Conflicts of Interest

The authors declare no conflict of interest.

References

  1. Anton, C.; Gasparotti, C.; Rusu, E. A Challenge for the Inland Navigation—A Connection Between the Baltic and the Black Seas. In Proceedings of the International Conference on Traffic and Transport Engineering (ICTTE 2018), Belgrade, Serbia, 27–28 September 2018; Cokorilo, O., Ed.; City Net Scientific Research Center Ltd.: Belgrade, Serbia, 2018; pp. 175–186. [Google Scholar]
  2. European Commission. WHITE PAPER. Roadmap to a Single European Transport Area—Towards a Competitive and Resource Efficient Transport System; COM(2011) 144 Final; European Commission: Brussels, Belgium, 2011. [Google Scholar]
  3. Chesneau, J.-B.; Le Net, E.; Berg, S. A Transport Tool to Evaluate Sustainability Impacts of Transport Processes within the Forest Wood Chain. Eur. J. For. Res. 2012, 131, 73–80. [Google Scholar] [CrossRef]
  4. Othman, A.; El-gazzar, S.; Knez, M. A Framework for Adopting a Sustainable Smart Sea Port Index. Sustainability 2022, 14, 4551. [Google Scholar] [CrossRef]
  5. Kisielińska, J.; Roman, M.; Pietrzak, P.; Roman, M.; Łukasiewicz, K.; Kacperska, E. Utilization of Renewable Energy Sources in Road Transport in EU Countries—TOPSIS Results. Energies 2021, 14, 7457. [Google Scholar] [CrossRef]
  6. Złoty, M. Finansjalizacja Wybranych Rynków Surowcowych na Świecie; Wydawnictwo Uniwersytetu Łódzkiego: Łódź, Poland, 2021; ISBN 978-83-8220-572-5. [Google Scholar]
  7. Rutkowska, M.; Bartoszczuk, P.; Singh, U.S. Management of GREEN Consumer Values in Renewable Energy Sources and Eco Innovation in INDIA. Energies 2021, 14, 7061. [Google Scholar] [CrossRef]
  8. Sidorczuk-Pietraszko, E. Spatial Differences in Carbon Intensity in Polish Households. Energies 2020, 13, 3108. [Google Scholar] [CrossRef]
  9. Załoga, E. Paradygmaty rozwoju transportu Unii Europejskiej. In Współczesna Polityka Transportowa; Rydzkowski, W., Ed.; Polskie Wydawnictwo Ekonomiczne: Warszawa, Poland, 2017; pp. 67–92. [Google Scholar]
  10. Szaruga, E.; Kłos-Adamkiewicz, Z.; Gozdek, A.; Załoga, E. Linkages between Energy Delivery and Economic Growth from the Point of View of Sustainable Development and Seaports. Energies 2021, 14, 4255. [Google Scholar] [CrossRef]
  11. Pencheva, V.; Asenov, A.; Beloev, I.; Georgiev, V. Study of the Use of Alternative Energy Sources in Inland Waterway Transport. Transp. Probl. 2019, 14, 109–120. [Google Scholar] [CrossRef] [Green Version]
  12. Przybyłowski, A.; Kałaska, A.; Przybyłowski, P. Quest for a Tool Measuring Urban Quality of Life: ISO 37120 Standard Sustainable Development Indicators. Energies 2022, 15, 2841. [Google Scholar] [CrossRef]
  13. Hofbauer, F.; Putz, L.-M. External Costs in Inland Waterway Transport: An Analysis of External Cost Categories and Calculation Methods. Sustainability 2020, 12, 5874. [Google Scholar] [CrossRef]
  14. European Commission. Communication from the Commission. The European Green Deal; COM(2019) 640 Final; European Commission: Brussels, Belgium, 2019. [Google Scholar]
  15. Paprocki, W. Virtual Airport Hub—A New Business Model to Reduce GHG Emissions in Continental Air Transport. Sustainability 2021, 13, 5076. [Google Scholar] [CrossRef]
  16. Szaruga, E.; Skąpska, E.; Załoga, E.; Matwiejczuk, W. Trust and Distress Prediction in Modal Shift Potential of Long-Distance Road Freight in Containers: Modeling Approach in Transport Services for Sustainability. Sustainability 2018, 10, 2370. [Google Scholar] [CrossRef] [Green Version]
  17. Załoga, E. Nowa Polityka Transportowa Unii Europejskiej. In Transport. Tendencje Zmian; Wojewódzka-Król, K., Załoga, E., Eds.; Wydawnictwo Naukowe PWN: Warszawa, Poland, 2022; ISBN 978-83-01-22033-4. [Google Scholar]
  18. Jonkeren, O.; Francke, J.; Visser, J. A Shift-Share Based Tool for Assessing the Contribution of a Modal Shift to the Decarbonisation of Inland Freight Transport. Eur. Transp. Res. Rev. 2019, 11, 8. [Google Scholar] [CrossRef]
  19. European Commission. Communication from the Commission to the European Parliament, the Council, the European Economic and Social Committee and the Committee of the Regions. Sustainable and Smart Mobility Strategy—Putting European Transport on Track for the Future; COM(2020) 789 Final; European Commission: Brussels, Belgium, 2020. [Google Scholar]
  20. Zhu, S.; Gao, J.; He, X.; Zhang, S.; Jin, Y.; Tan, Z. Green Logistics Oriented Tug Scheduling for Inland Waterway Logistics. Adv. Eng. Inform. 2021, 49, 101323. [Google Scholar] [CrossRef]
  21. Savey, P. Le transport fluvial, un mode très ancien devenu moderne: Inland schipping: An old transport mode become modern. Houille Blanche-Rev. Int. 2002, 88, 146–150. [Google Scholar] [CrossRef]
  22. Beskovnik, B. Importance of Short Sea Shipping and Sea Motorways in the European and Slovenian Transport Policy. Pomorstvo 2006, 20, 23–34. [Google Scholar]
  23. Lebkowski, A. Evaluation of the Possibility of Using Hybrid Electric-Propulsion Systems for Inland Barges. TransNav 2018, 12, 261–269. [Google Scholar] [CrossRef]
  24. Wang, X.; Pan, J.; Zhu, W. Digital Waterway Construction Based on Inland Electronic Navigation Chart. In Proceedings of the International Conference on Intelligent Earth Observing and Applications 2015, Guilin, China, 23–24 October 2015; Zhou, G., Kang, C., Eds.; SPIE—The International Society for Optical Engineering: Bellingham, WA, USA, 2015; Volume 9808, p. 98082H. [Google Scholar]
  25. Percic, M.; Vladimir, N.; Korican, M. Electrification of Inland Waterway Ships Considering Power System Lifetime Emissions and Costs. Energies 2021, 14, 7046. [Google Scholar] [CrossRef]
  26. Nowakowski, T.; Kulczyk, J.; Skupień, E.; Tubis, A.; Werbińska-Wojciechowska, S. Inland Water Transport Development Possibilities—Case Study of Lower Vistula River. Arch. Transp. 2015, 35, 53–62. [Google Scholar] [CrossRef]
  27. Paulauskas, V.; Paulauskas, D.; Placiene, B.; Jonkus, M.; Kaulitsky, A. Inland Waterway Shipping of Oversized Cargo. In Proceedings of the Transport Means 2017, Juodkrante, Lithuania, 20–22 September 2017; Kaunas University of Technology: Kaunas, Lithuania, 2017; pp. 819–823. [Google Scholar]
  28. Paulauskas, V.; Paulauskas, D.; Placiene, B.; Barzdziukas, R.; Marciniak, Z. Inland Waterways (IWW) for the Oversize Cargo Transportation and Water Tourism. In Proceedings of the Transport Means 2018, Trakai, Lithuania, 3–5 October 2018; Kaunas University of Technology: Kaunas, Lithuania, 2018; pp. 1142–1146. [Google Scholar]
  29. Bazaluk, O.; Havrysh, V.; Nitsenko, V. Energy Efficiency of Inland Waterways Transport for Agriculture: The Ukraine Case Study. Appl. Sci. 2021, 11, 8937. [Google Scholar] [CrossRef]
  30. Kalina, T.; Piala, P. River–Sea Technology in Transport of Energy Products. TransNav 2012, 6, 469–473. [Google Scholar]
  31. Golebiowski, C. Inland Water Transport in Poland. In Proceedings of the Transport Research Arena TRA 2016, Warsaw, Poland, 18–21 April 2016; Rafalski, L., Zofka, A., Eds.; Elsevier Science BV: Amsterdam, The Netherlands, 2016; Volume 14, pp. 223–232. [Google Scholar]
  32. Tzannatos, E.; Tselentis, B.; Corres, A. An Inland Waterway Freight Service in Comparison to Land-Based Alternatives in South-Eastern Europe: Energy Efficiency and Air Quality Performance. Transport 2016, 31, 119–126. [Google Scholar] [CrossRef] [Green Version]
  33. Durajczyk, P.; Drop, N. Possibilities of Using Inland Navigation to Improve Efficiency of Urban and Interurban Freight Transport with the Use of the River Information Services (RIS) System—Case Study. Energies 2021, 14, 7086. [Google Scholar] [CrossRef]
  34. Zaloga, E.; Kuciaba, E. Financing of Inland Navigation Development in Germany and Poland in a Context of Competitive and Resource Efficient Transport System. Sci. J. Marit. Univ. Szczec. 2014, 37, 95–100. [Google Scholar]
  35. Zhang, R.; Huang, C.; Feng, X. Empty Container Repositioning with Foldable Containers in a River Transport Network Considering the Limitations of Bridge Heights. Transp. Res. Pt. A-Policy Pract. 2020, 133, 197–213. [Google Scholar] [CrossRef]
  36. Percic, M.; Vladimir, N.; Fan, A. Techno-Economic Assessment of Alternative Marine Fuels for Inland Shipping in Croatia. Renew. Sust. Energ. Rev. 2021, 148, 111363. [Google Scholar] [CrossRef]
  37. Krcum, M.; Plazibat, V.; Mrcelic, G.J. Integration Sea and River Ports—The Challenge of the Croatian Transport System for the 21st Century. Nase More Znanstveni Časopis za More i Pomorstvo 2015, 62, 247–255. [Google Scholar] [CrossRef]
  38. Haselbauer, K.; Haberl, A.; Hoffmann, M.; Blab, R.; Simoner, M.; Hartl, T. Derivation of Budget Requirements for Different Levels of Fairway Quality Based on Harmonized Maintenance Strategies for Inland Waterways. In Life-Cycle of Engineering Systems: Emphasis on Sustainable Civil Infrastructure, Proceedings of the Fifth International Symposium on Life-Cycle Civil Engineering (IALCCE 2016), Delft, The Netherlands, 16–19 October 2016; Bakker, J., Frangopol, D.M., VanBreugel, K., Eds.; CRC Press-Balkema: Leiden, The Netherlands, 2017; pp. 2037–2044. [Google Scholar]
  39. Galieriková, A.; Sosedová, J. Environmental Aspects of Transport in the Context of Development of Inland Navigation. Ekológia 2016, 35, 279–288. [Google Scholar] [CrossRef] [Green Version]
  40. Li, T.; Ding, Y.; Xia, W. An Integrated Method for Waterway Health Assessment: A Case in the Jingjiang Reach of the Yangtze River, China. Phys. Geogr. 2018, 39, 67–83. [Google Scholar] [CrossRef]
  41. Amacher, R.; Liechti, T.C.; Pfister, M.; De Cesare, G.; Schleiss, A.J. Wave-Reducing Stern Flap on Ship Convoys to Protect Riverbanks. Nav. Eng. J. 2015, 127, 95–102. [Google Scholar]
  42. Jiang, Y.; Lu, J.; Cai, Y.; Zeng, Q. Analysis of the Impacts of Different Modes of Governance on Inland Waterway Transport Development on the Pearl River: The Yangtze River Mode vs. the Pearl River Mode. J. Transp. Geogr. 2018, 71, 235–252. [Google Scholar] [CrossRef]
  43. Wojewódzka-Król, K.; Rolbiecki, R. The Role of Inland Waterway Transport in City Logistics. Transp. Econ. Logist. 2019, 84, 103–114. [Google Scholar] [CrossRef]
  44. Wojewódzka-Król, K.; Rolbiecki, R. Innovative Solutions for Inland Waterway Transport. Transp. Econ. Logist. 2018, 80, 245–255. [Google Scholar] [CrossRef]
  45. European Commission. Communication from the Commission to the European Parliament, the Council, the European Economic and Social Committee and the Committee of the Regions. NAIADES III: Boosting Future-Proof European Inland Waterway Transport; COM(2021) 324 Final; European Commission: Brussels, Belgium, 2021. [Google Scholar]
  46. Zhou, D.; Huang, F.; Wang, Q.; Liu, X. The Role of Structure Change in Driving CO2 Emissions from China’s Waterway Transport Sector. Resour. Conserv. Recycl. 2021, 171, 105627. [Google Scholar] [CrossRef]
  47. Cempirek, V.; Cejka, J. Future of the Inland Waterway Transport. Nase More 2017, 64, 108–111. [Google Scholar] [CrossRef]
  48. Wisnicki, B.; Trojanowski, J.; Kujawski, A. Biomass Supply Logistics in the Szczecin Area. In Proceedings of the Green Cities—Green Logistics for Greener Cities, Szczecin, Poland, 2–3 March 2016; Iwan, S., Thompson, R.G., Eds.; Elsevier Science BV: Amsterdam, The Netherlands, 2014; Volume 151, pp. 351–359. [Google Scholar]
  49. Christodoulou, A.; Christidis, P.; Bisselink, B. Forecasting the Impacts of Climate Change on Inland Waterways. Transp. Res. Part D Transp. Environ. 2020, 82, 102159. [Google Scholar] [CrossRef]
  50. Sun, X.; Yan, X.; Wu, B.; Song, X. Analysis of the Operational Energy Efficiency for Inland River Ships. Transp. Res. Part D: Transp. Environ. 2013, 22, 34–39. [Google Scholar] [CrossRef]
  51. Szaruga, E. Racjonalizacja Energochłonności Transportu Samochodowego. Wyzwanie XXI Wieku; Edu-Libri: Kraków, Poland, 2018; ISBN 978-83-65648-81-5. [Google Scholar]
  52. Szaruga, E.; Załoga, E. Rationalization of Energy Intensity of Road Transport of Member Countries of the International Energy Agency. In Proceedings of the Challenges of Urban Mobility, Transport Companies and Systems, Sopot, Poland, 27–29 May 2018; Suchanek, M., Ed.; Springer International Publishing: Cham, Switzerland, 2019; pp. 333–342. [Google Scholar]
  53. Puig, M.; Azarkamand, S.; Wooldridge, C.; Selén, V.; Darbra, R.M. Insights on the Environmental Management System of the European Port Sector. Sci. Total Environ. 2022, 806, 150550. [Google Scholar] [CrossRef]
  54. Zhukov, V.A.; Kostylev, I.I.; Ivanchenko, A.A.; Bezyukov, O.K. Prospects of Use Gas Engines on Sea and River Vessels. In Proceedings of the 2018 IEEE International Conference “Quality Management, Transport and Information Security, Information Technologies” (IT QM IS), Saint Petersburg, Russia, 24–28 September 2018; pp. 287–289. [Google Scholar]
  55. Lebkowski, A. Reduction of Fuel Consumption and Pollution Emissions in Inland Water Transport by Application of Hybrid Powertrain. Energies 2018, 11, 1981. [Google Scholar] [CrossRef] [Green Version]
  56. Li, X.; Fan, Y.; Wu, L. CO2 Emissions and Expansion of Railway, Road, Airline and in-Land Waterway Networks over the 1985–2013 Period in China: A Time Series Analysis. Transport. Res. Part D-Transport. Environ. 2017, 57, 130–140. [Google Scholar] [CrossRef]
  57. Kos, S.; Vukic, L.; Brcic, D. Comparison of External Costs in Multimodal Container Transport Chain. Promet 2017, 29, 243–252. [Google Scholar] [CrossRef] [Green Version]
  58. Kalina, T.; Jurkovic, M.; Sapieta, M.; Binova, H.; Sapietova, A. Strength Characteristics of Lng Tanks and Their Application in Inland Navigation. AD ALTA J. Interdiscip. Res. 2017, 7, 274–281. [Google Scholar]
  59. Khant, L.M. Comparison of Effectctiveness Between High-Speed Catamarans and Different Kinds of Transport. Mar. Intellect. Technol. 2014, 2, 12–16. [Google Scholar]
  60. Simic, A.; Radojcic, D. On Energy Efficiency of Inland Waterway Self-Propelled Cargo Vessels. FME Trans. 2013, 41, 138–145. [Google Scholar]
  61. Van Eck, N.J.; Waltman, L. Visualizing Bibliometric Networks. In Measuring Scholarly Impact: Methods and Practice; Ding, Y., Rousseau, R., Wolfram, D., Eds.; Springer International Publishing: Cham, Switzerland, 2014; pp. 285–320. ISBN 978-3-319-10377-8. [Google Scholar]
  62. GUS: Transport Wodny Śródlądowy w Polsce w 2020 Roku. Available online: https://stat.gov.pl/download/gfx/portalinformacyjny/pl/defaultaktualnosci/5511/4/11/1/tablice_transport_wodny_srodladowy_w_polsce_w_2020_roku.xlsx (accessed on 17 February 2022).
  63. GUS: Transport Wodny Śródlądowy w Polsce w 2019 Roku. Available online: https://stat.gov.pl/download/gfx/portalinformacyjny/pl/defaultaktualnosci/5511/4/10/1/transport_wodny_srodladowy__tablice_za_2019.xlsx (accessed on 17 February 2022).
  64. GUS: Transport Wodny Śródlądowy w Polsce w 2018 Roku. Available online: https://stat.gov.pl/download/gfx/portalinformacyjny/pl/defaultaktualnosci/5511/4/9/1/transport_wodny_srodladowy_tablice_za_2018.xlsx (accessed on 17 February 2022).
  65. GUS: Transport Wodny Śródlądowy w Polsce w 2017 Roku. Available online: https://stat.gov.pl/download/gfx/portalinformacyjny/pl/defaultaktualnosci/5511/4/8/1/transport_wodny_srodladowy_w_polsce_w_2017_tablice.xlsx (accessed on 17 February 2022).
  66. GUS: Transport Wodny Śródlądowy w Polsce w 2016 Roku. Available online: https://stat.gov.pl/download/gfx/portalinformacyjny/pl/defaultaktualnosci/5511/4/7/1/transport_wodny_srodladowy_w_polsce_w_2016_roku.pdf (accessed on 17 February 2022).
  67. DBW: Dziedzinowa Baza Wiedzy (Knowedge Databases). Available online: http://swaid.stat.gov.pl/SitePages/StronaGlownaDBW.aspx (accessed on 17 February 2022).
  68. Richardson, J.T.E. Eta Squared and Partial Eta Squared as Measures of Effect Size in Educational Research. Educ. Res. Rev. 2011, 6, 135–147. [Google Scholar] [CrossRef]
  69. Ghosh, A.; Mandal, A.; Martín, N.; Pardo, L. Influence Analysis of Robust Wald-Type Tests. J. Multivar. Anal. 2016, 147, 102–126. [Google Scholar] [CrossRef] [Green Version]
  70. Ducharme, G.R.; Ferrigno, S. An Omnibus Test of Goodness-of-Fit for Conditional Distributions with Applications to Regression Models. J. Stat. Plan. Inference 2012, 142, 2748–2761. [Google Scholar] [CrossRef]
  71. Bedoui, A.; Lazar, N.A. Bayesian Empirical Likelihood for Ridge and Lasso Regressions. Comput. Stat. Data Anal. 2020, 145, 106917. [Google Scholar] [CrossRef]
  72. Pereira, J.M.; Basto, M.; Silva, A.F. da The Logistic Lasso and Ridge Regression in Predicting Corporate Failure. Procedia Econ. Financ. 2016, 39, 634–641. [Google Scholar] [CrossRef] [Green Version]
  73. Čampulová, M.; Veselík, P.; Michálek, J. Control Chart and Six Sigma Based Algorithms for Identification of Outliers in Experimental Data, with an Application to Particulate Matter PM10. Atmos. Pollut. Res. 2017, 8, 700–708. [Google Scholar] [CrossRef]
Figure 1. Word cloud from papers on the energy consumption of inland waterway transport. Source: own elaboration based on 41 references [1,3,4,11,13,18,20,21,22,23,24,25,27,28,29,30,31,32,34,35,36,37,38,39,40,41,43,44,46,47,48,49,50,53,54,55,56,57,58,59,60].
Energies 15 04660 g001
Figure 2. Mapping latent variables from the literature on issues connected with the energy consumption of inland waterway transport. Note: Technical publication on mapping and clustering using VOSviewer [61]. Limitations: The authors did not take into account many valuable publications in the study, instead taking into account the need to narrow the thematic scope of the described issues. Source: own elaboration based on 41 references [1,3,4,11,13,18,20,21,22,23,24,25,27,28,29,30,31,32,34,35,36,37,38,39,40,41,43,44,46,47,48,49,50,53,54,55,56,57,58,59,60].
Energies 15 04660 g002aEnergies 15 04660 g002b
Figure 3. The Odra River sections. Note: In an isolated system, attention can be drawn to 4 sections of the Odra River: the Sea Odra River, the Lower Odra River, the Middle Odra River (freely flowing), and the Upper Odra River (canalized). However, the adoption of such an arrangement would exclude longer routes beyond the boundaries of the section concerned. The network system includes 9 sections of the Odra River, additionally connecting two or more sections into one in the case of transports performed outside the section boundaries from an isolated system, e.g., the Sea Odra River—the Lower Odra River. Transport over longer sections was not decomposed and assigned to sections from an isolated system but to sections from the network system. Source: own elaboration.
Energies 15 04660 g003
Figure 4. X-average control chart for the energy intensity of inland waterway transport on all sections of the Odra River. Note: The central line for the energy intensity is 1,380,332.85 kJ/ton, and the sigma for the energy intensity is equal to 528,464.61 kJ/ton. Source: own elaboration.
Energies 15 04660 g004
Figure 5. X-average control chart for the average distance traveled by 1 ton of goods by inland waterway transport on all sections route of the Odra River. Note: The central line for the average distance traveled by 1 ton of goods is 190.06 km, and sigma for the average distance traveled by 1 ton of goods is equal to 79.82 km. Source: own elaboration.
Energies 15 04660 g005
Table 1. Topic modeling using the Latent Dirichlet Allocation technique and MDS.
TopicTopic KeywordsMarginal Topic ProbabilityMost Representative Words of Topic
1transport, inland, navigation, waterway, energy, transportation, freight, sustainable, modal, shift0.0338modal, freight, sustainable, shift, navigation
2gas, energy, ship, electric, liquefied, natural, marine, engines, LNG, transport0.1165natural, liquefied, marine, engine, LNG
3emissions, sea, transportation, energy, carbon, development, sustainability, CO2, consumption, dioxide0.0621ARDL, VECM, series, specific, relationships
4inland, transport, logistics, CO2, indicators, waterway, transshipment, sustainability, shift, management0.1538transshipment, template, integrated, mitigation, variable
5water, transport, river, waterways, low, propulsion, climate, change, alternative, impacts0.0449discharges, levels, droughts, vessel, Danube
6inland, transportation, cargo, oversize, river, ship, water, energy, waterways, shipping0.0726cargo, oversize, supply, biomass, green
7transport, inland, emissions, waterways, waterway, carbon, energy, external, efficiency, power0.1861cycle, system, vessels, greenhouse, impact
8shipping, transport, model, design, inland, waterway, speed, management, allocation, programming0.0532containers, bridge, standard, optimization, linear
9transport, ports, energy, emissions, inland, ship, power, shipping, efficiency, development0.1583sector, decomposition, factors, aviation, driving
10river, transport, index, waterway, costs, short, model, sustainability, assessment, longitudinal0.0839longitudinal, Yangtze, board, protection, cask
Note: Topic evaluation: log perplexity—59.6236; topic coherence—0.5268. Source: own elaboration based on 41 references [1,3,4,11,13,18,20,21,22,23,24,25,27,28,29,30,31,32,34,35,36,37,38,39,40,41,43,44,46,47,48,49,50,53,54,55,56,57,58,59,60].
Table 2. Overview of factors related to issues on energy consumption in inland waterway transport from the point of view of vessels.
AuthorIssueFactorsSource
Sun et al.operational energy efficiency for inland river shipsriver sections; oil consumption; voyage speed; load; draft; engine speeds[50]
Zhukov et al.energy efficiency of river ships with gas enginesspeed of the vessel; displacement of the vessel; factors considering the influence of displacement, features, and external conditions; design power of main engines and auxiliary engines; electric power; specific effective fuel consumption of engines; emissions from engines; efficiency coefficient of innovative energy production technologies; power developed; CO2 emissions[54]
Percic et al.(a) ships’ energy needs(a) main energy power; auxiliary energy power; average ship speed; ship energy consumption per distance traveled; fuel oil consumption; specific fuel oil consumption[25]
(b) river vessels’ energy needs(b) energy consumption for a ship sailing upstream; energy consumption for a ship sailing downstream; length of a one-way trip; annual number of return trips; length of a return trip; annual energy consumption of the vessel
(c) energy demands of stationary units(c) average load of ship’s power; time that the vessel spends in operation annually; annual fuel oil consumption of the vessel; fuel oil density; average power onboard the vessel; annual energy consumption of the vessel
Simic and Radojcicenergy efficiency of inland waterway self-propelled cargo vesselcarbon factor; specific fuel consumption; engine rating; transport performance by vessel-specific capacity measure and design speed for evaluating power conditions: ship size, hull form, and fairway restrictions; external factors: wind, waves, hull and propeller roughness[60]
Lebkowskireduction of fuel consumption in inland water transport(a) barge resistance and barge velocity to calculate the towing power[55]
(b) frictional resistance; lower speed hull form factor; appendage resistance; wave resistance; bulbous bow pressure resistance; transom pressure resistance; residual resistance; and aerodynamic drag to calculate total resistance
(c) stern shape coefficient; beam; waterline length; draft; displaced volume; prismatic coefficient; length of run; corrective coefficient; position of the center of buoyancy
(d) density of ware; ship speed; frictional resistance coefficient; appendage shape coefficient; and surface of appendage to calculate appendage resistance
(e) density of air; ship velocity; transverse area; and ship hull drag coefficient to calculate the aerodynamic drag
(f) towing power; drive train efficiency; barge hull efficiency; shaft efficiency; rotational efficiency; and free-running propeller efficiency to calculate to power drive motor
(g) effective power on the engine power take-off shaft; heat losses; losses related to engine internal friction to calculate power contained within the fuel
Source: own elaboration based on sources from the last column of the table.
Table 3. Sections of the Odra River.
No.Route Section
1Upper Odra River (canalized)
2 Middle Odra River (freely flowing)–Upper Odra River (canalized)
3 Middle Odra River (freely flowing)
4 Middle Odra River (freely flowing)–Lower Odra River
5 Upper Odra River (canalized)–Lower Odra River
6 Lower Odra River
7 Sea Odra River–Lower Odra River
8 Sea Odra River–Upper Odra River (canalized)
9 Sea Odra River
Source: own elaboration based on classification of particular sections of the Odra River by GUS [62,63,64,65,66].
Table 4. Selected summary statistics of inland waterway transport features by sections of the Odra River in 2015–2020.
Route SectionStatisticsEnergy Consumption (GJ)Transport of Goods (tons)Energy Intensity (kJ/ton)Average Distance (km)
Upper Odra River (canalized)mean89,328.591,519,881.6765,035.0010.83
standard deviation72,474.44530,106.9752,063.559.63
skewness0.982.170.751.30
Middle Odra River (freely flowing)–Upper Odra River (canalized)mean4338.44792.673,382,292.17492.01
standard deviation6611.83779.153,674,134.19363.76
skewness2.000.181.880.23
Middle Odra River (freely flowing)mean392.67115.17995,573.33104.26
standard deviation907.96171.002,018,306.03185.58
skewness2.441.802.392.24
Middle Odra River (freely flowing)–Lower Odra Rivermean368.81153.33958,313.33115.83
standard deviation675.33198.661,388,769.91144.38
skewness2.201.201.440.71
Upper Odra River (canalized)–Lower Odra Rivermean5301.181208.833,783,886.50566.94
standard deviation4369.67827.381,786,716.3355.13
skewness0.330.38−0.45−0.27
Lower Odra Rivermean552,159.24926,772.67555,157.0085.68
standard deviation707,771.69273,745.51599,726.2161.06
skewness2.42−0.042.360.96
Sea Odra River–Lower Odra Rivermean29,121.7932,077.331,097,162.33163.61
standard deviation33,503.0711,351.321,574,713.43156.87
skewness2.290.352.441.07
Sea Odra River–Upper Odra River (canalized)mean356.7651.331,158,306.50108.20
standard deviation873.88125.742,837,259.89265.04
skewness2.452.452.452.45
Sea Odra Rivermean241,234.21492,137.00427,269.5063.22
standard deviation157,856.48238,029.45200,056.211.23
skewness−0.05−1.09−0.92−1.29
Totalmean102,511.30330,354.441,380,332.85190.06
standard deviation285,687.74560,382.602,169,639.84250.36
skewness5.731.892.211.41
Note: To calculate energy consumption, the unit of energy consumption of a contractual inland vessel for the transport of goods for a given year (MJ/thousand tkm) was used and multiplied by the transport performance (thousand tkm) on a given section of the Odra River. The limitation of this approach is the lack of exploration of the energy consumption of the diversified inland waterway transport fleet. In the presented approach, such a detailed level of data granularity is not required. Energy intensity is the energy consumption per unit of transport volume expressed in the unit kJ/ton (the amount expressed in kJ/ton is equal to the amount expressed in the unit MJ/thousand tons—this is another notation of the unit of the same size). Source: own calculations based on data from [62,63,64,65,66,67].
Table 5. Analysis of variance (ANOVA).
FeaturesItemsSum of SquaresdfMean SquareFSignificance
Energy consumption * Route sectionbetween groups (combined)1.66 × 101282.08 × 10113.523.08 × 10−3
within groups2.66 × 1012455.91 × 1010--
total4.32 × 101253---
Transport of goods (tons) * Route sectionbetween groups (combined)1.46 × 101381.82 × 101239.746.69 × 10−18
within groups2.06 × 1012454.59 × 1010--
total1.66 × 101353---
Energy intensity * Route sectionbetween groups (combined)8.14 × 101381.02 × 10132.721.55 × 10−2
within groups1.68 × 1014453.74 × 1012--
total2.49 × 101453---
Average distance * Route sectionbetween groups (combined)1.88 × 10682.34 × 1057.293.66 × 10−6
within groups1.45 × 106453.21 × 104--
total3.32 × 10653---
Source: own calculations.
Table 6. Measures of association.
FeaturesEtaEta Squared
Energy consumption * Route section0.62030.3847
Transport of goods (tons) * Route section0.93600.8760
Energy intensity * Route section0.57110.3261
Average distance * Route section0.75140.5645
Source: own calculations.
Table 7. Model of energy consumption in inland waterway freight transport in relation to the selection of the route section and the volume of transport.
ParameterBStandard ErrorSignificance
Transport of goods (tons)1.872.02 × 10−9<0.01 ***
Route section = Upper Odra River (canalized)−2,429,136.573.21 × 10−3<0.01 ***
Route section = Middle Odra River (freely flowing)–Upper Odra River (canalized)7753.462.22 × 10−4<0.01 ***
Route section = Middle Odra River (freely flowing)1184.914.09 × 10−4<0.01 ***
Route section = Middle Odra River (freely flowing)–Lower Odra River431.034.17 × 10−4<0.01 ***
Route section = Upper Odra River (canalized)–Lower Odra River4092.392.10 × 10−4<0.01 ***
Route section = Lower Odra River−675,166.212.09 × 10−3<0.01 ***
Route section = Sea Odra River–Lower Odra River19,157.013.93 × 10−4<0.01 ***
Route section = Sea Odra River–Upper Odra River (canalized)1565.053.79 × 10−4<0.01 ***
Route section = Sea Odra River−757,157.091.30 × 10−3<0.01 ***
(Scale)1 a--
Note: Dependent Variable: Energy consumption. Model: Route section, transport of goods (tons). Scale weight variable: Energy intensity. The good fit of the model was verified on the basis of the Omnibus test. Based on the Wald Chi-Square test (type III), it was verified that the model effects, i.e., ‘Route section’ and ‘Transport of goods (tons)’, are statistically significant (p-value < 1%). a—Fixed at the displayed value. ***—Significance of p-value at a level equal to or lower than 1%. Source: own calculations.
Table 8. Warning model of energy intensity in inland waterway freight transport in relation to the selection of the route section and the average distance traveled by 1 ton of goods.
ParameterBStandard ErrorSignificance
Average distance8364.168.31 × 10−4<1% ***
Route section = Upper Odra River (canalized)−25,515.114.08 × 10−1<1% ***
Route section = Middle Odra River (freely flowing)–Upper Odra River (canalized)−732,960.515.78 × 10−1<1% ***
Route section = Middle Odra River (freely flowing)123,500.674.17 × 10−1<1% ***
Route section = Middle Odra River (freely flowing)–Lower Odra River−10,535.124.19 × 10−1<1% ***
Route section = Upper Odra River (canalized)–Lower Odra River−958,057.016.24 × 10−1<1% ***
Route section = Lower Odra River−161,450.974.14 × 10−1<1% ***
Route section = Sea Odra River–Lower Odra River −271,324.964.30 × 10−1<1% ***
Route section = Sea Odra River–Upper Odra River (canalized)253,284.554.18 × 10−1<1% ***
Route section = Sea Odra River−101,500.494.12 × 10−1<1% ***
(Scale)1 a--
Note: Dependent Variable: Energy intensity. Model: Route section, average distance. The good fit of the model was verified on the basis of the Omnibus test. On the basis of the Wald Chi-Square test (type III), it was verified that the model effects, i.e., ‘Route section’ and ‘Average distance’ are statistically significant (p-value < 1%). a—Fixed at the displayed value. ***—Significance of p-value at a level equal to or lower than 1%. Source: own calculations.
Table 9. Regularized warming model of energy intensity in inland waterway freight transport in relation to the selection of route section and the average distance traveled by 1 ton of goods by Lasso and Ridge methods.
IDParameterCoefficient
(Lasso L1)
Coefficient
(Ridge L2)
Difference
1Average distance8364.117964.39−399.72
2Route section = Upper Odra River (canalized)−25,505.57−18,160.447345.13
3Route section = Middle Odra River (freely flowing)–Upper Odra River (canalized)−732,927.03−459,658.38273,268.65
4Route section = Middle Odra River (freely flowing)123,496.86141,584.7518,087.89
5Route section = Middle Odra River (freely flowing)–Lower Odra River−10,520.3530,661.6441,181.99
6Route section = Upper Odra River (canalized)–Lower Odra River−958,019.80−626,923.99331,095.81
7Route section = Lower Odra River−161,437.70−109,028.5852,409.12
8Route section = Sea Odra River–Lower Odra River−271,307.81−176,500.1294,807.69
9Route section = Sea Odra River–Upper Odra River (canalized)253,280.93254,177.94897.01
10Route section = Sea Odra River−101,488.35−65,337.8036,150.55
Note: α = 1 (regularization strength for L1 and L2). Italics indicate change of direction (sign from minus to plus). Source: own calculations.
Publisher’s Note: MDPI stays neutral with regard to jurisdictional claims in published maps and institutional affiliations.

