
Community Flexible Load Dispatching Model Based on Herd Mentality

Abstract
:1. Introduction
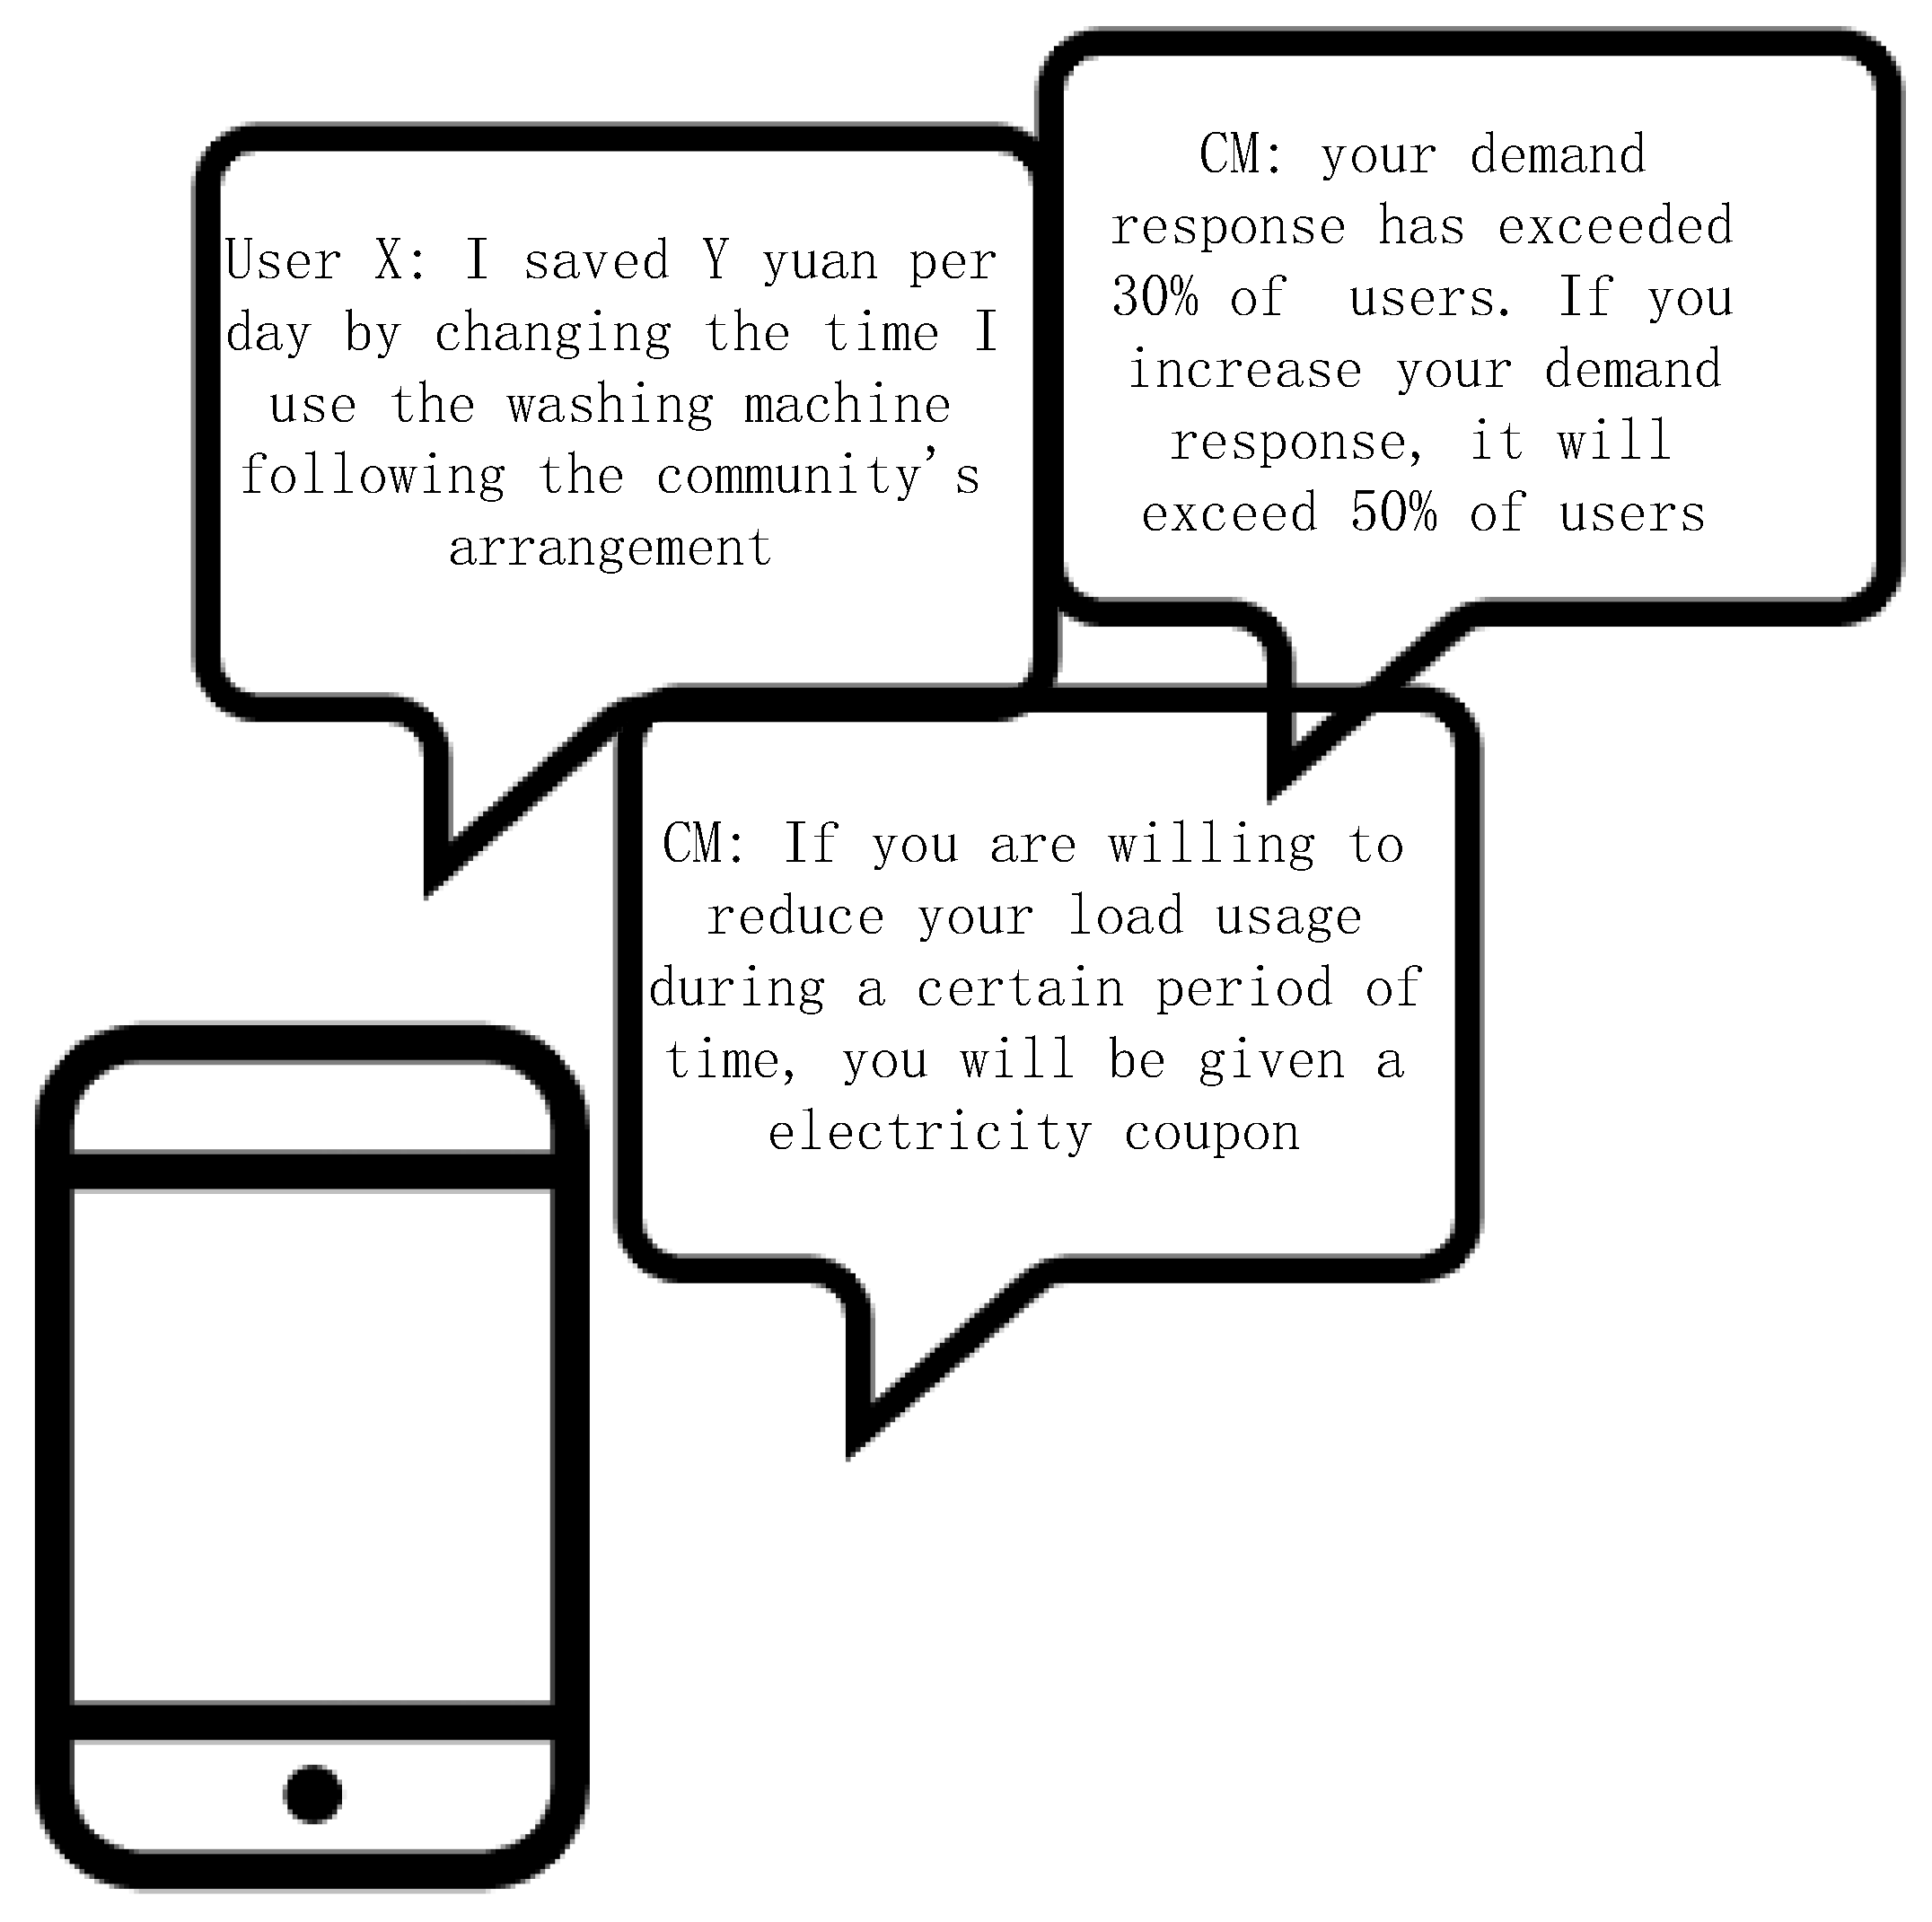
2. The Herd Mentality of Community Users
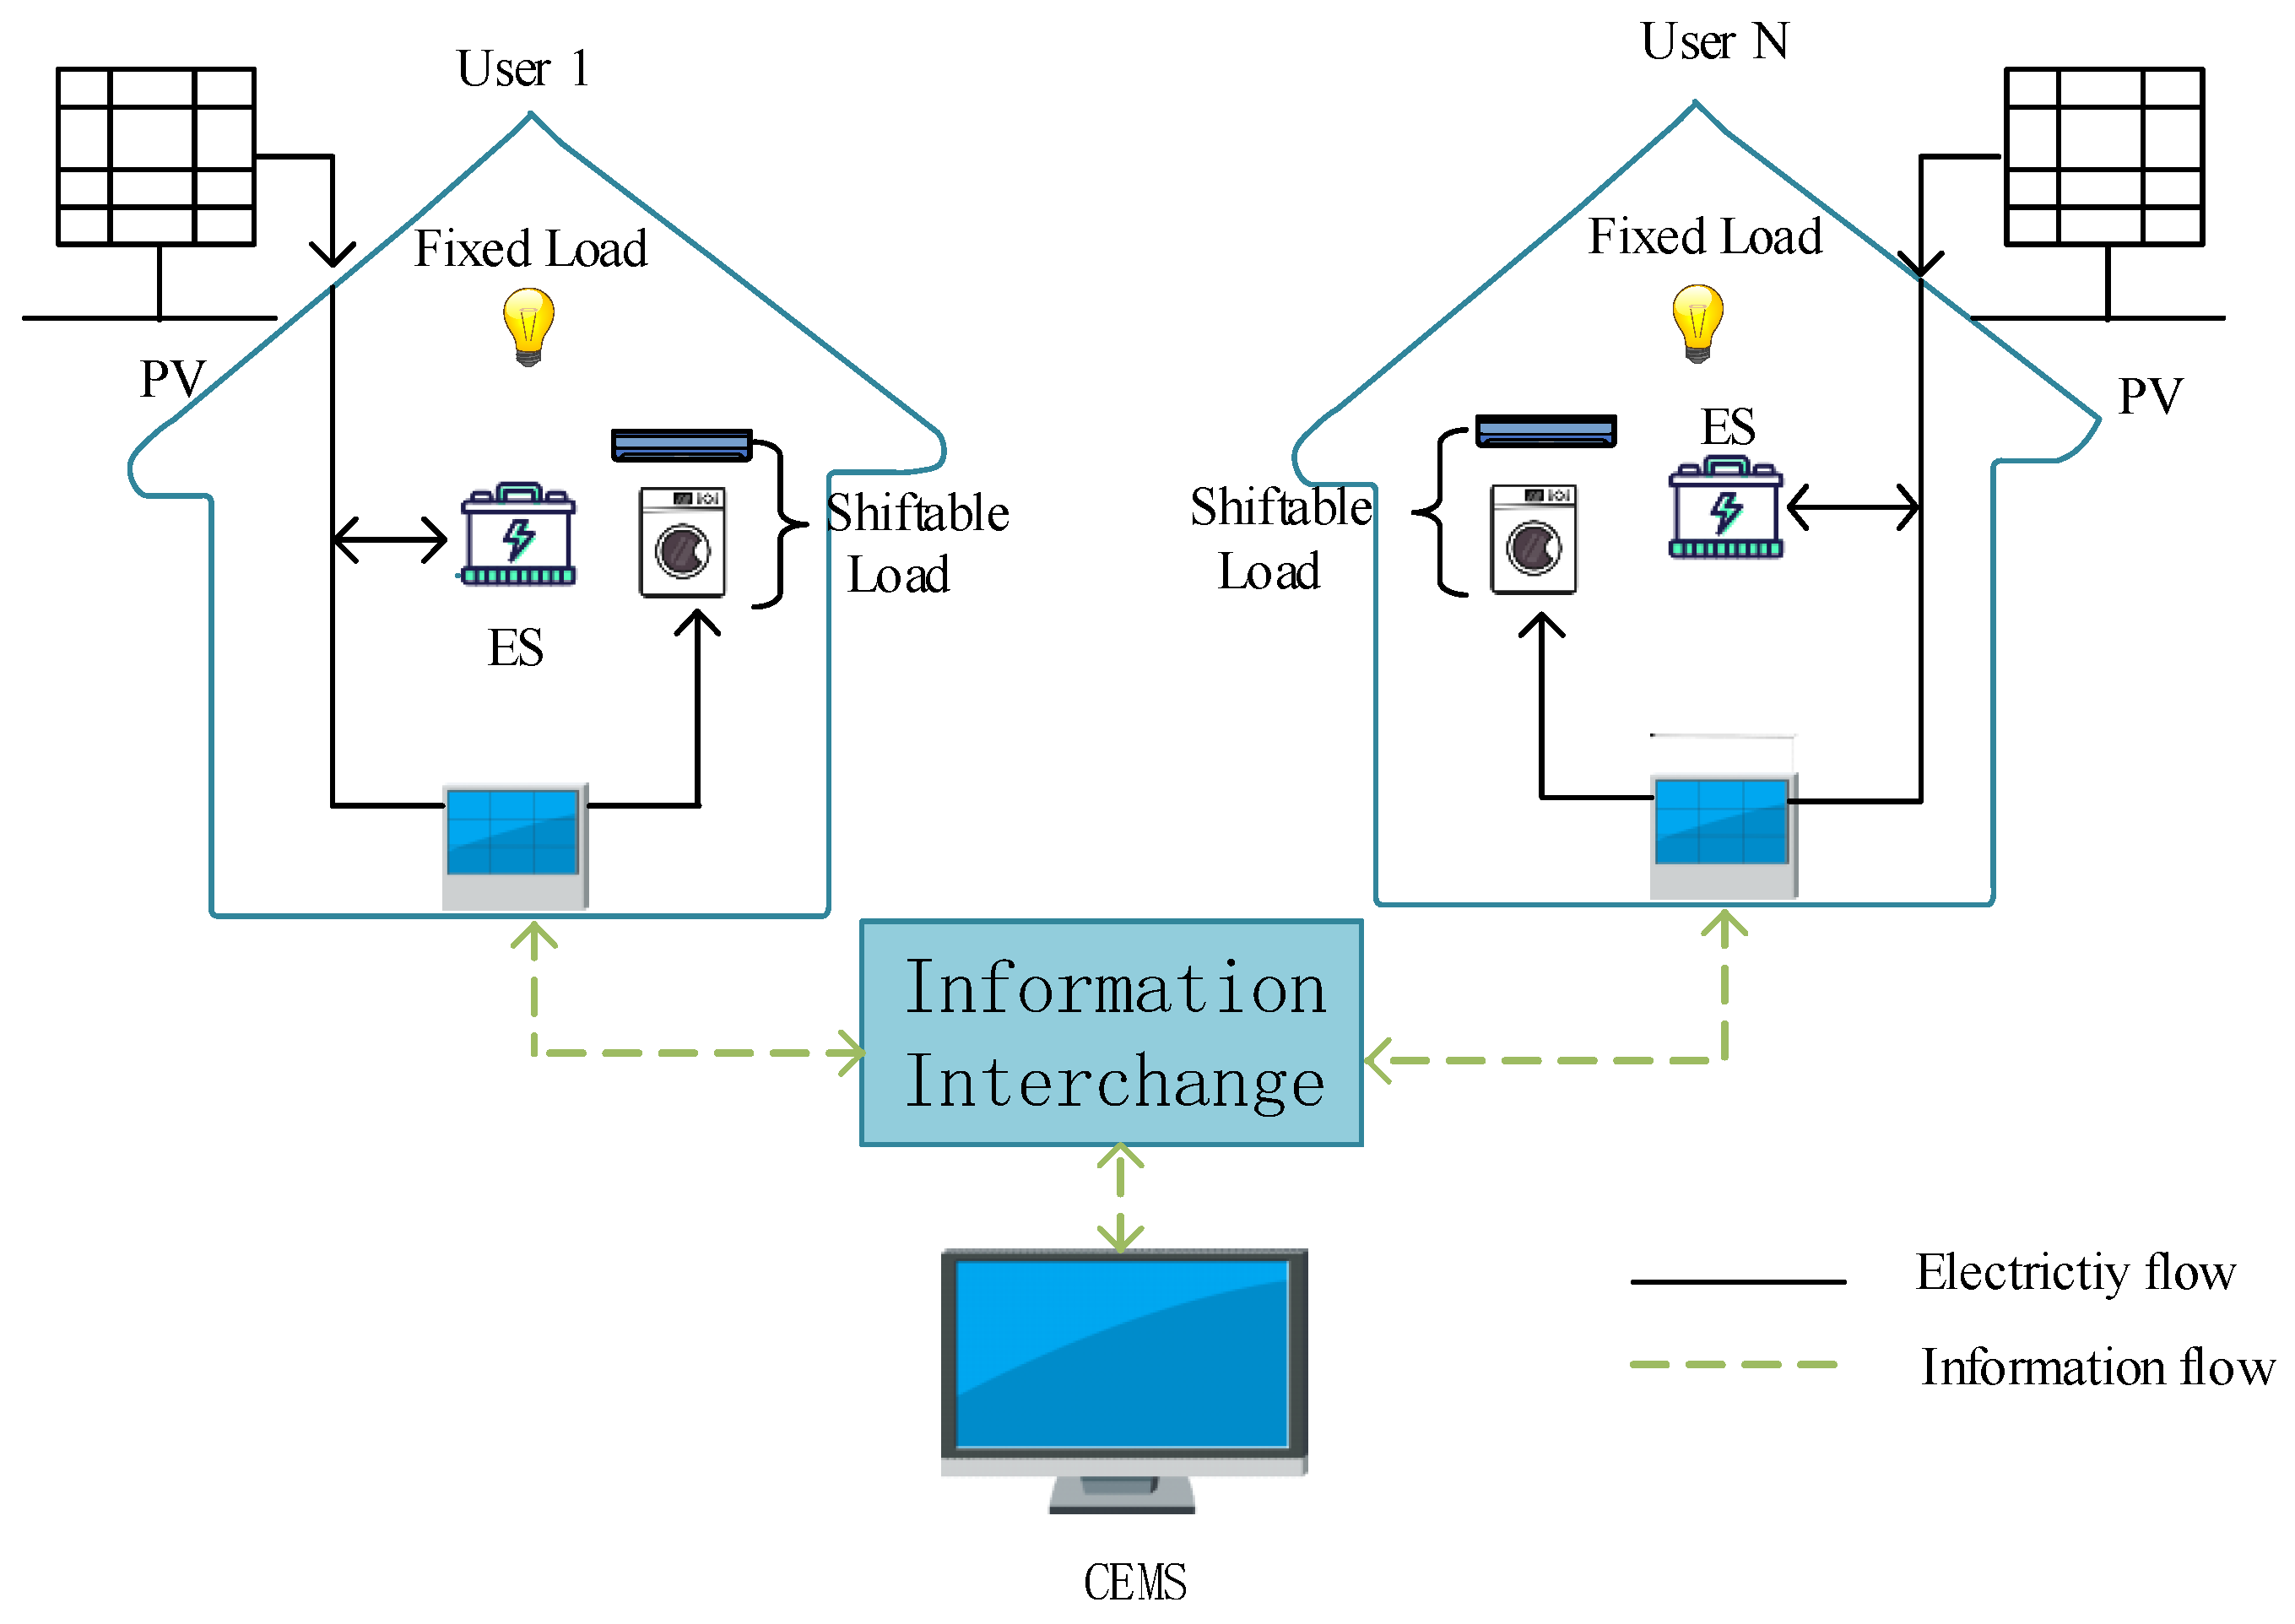
3. Community Structure Guided by Herd Mentality
4. Community Energy System Model
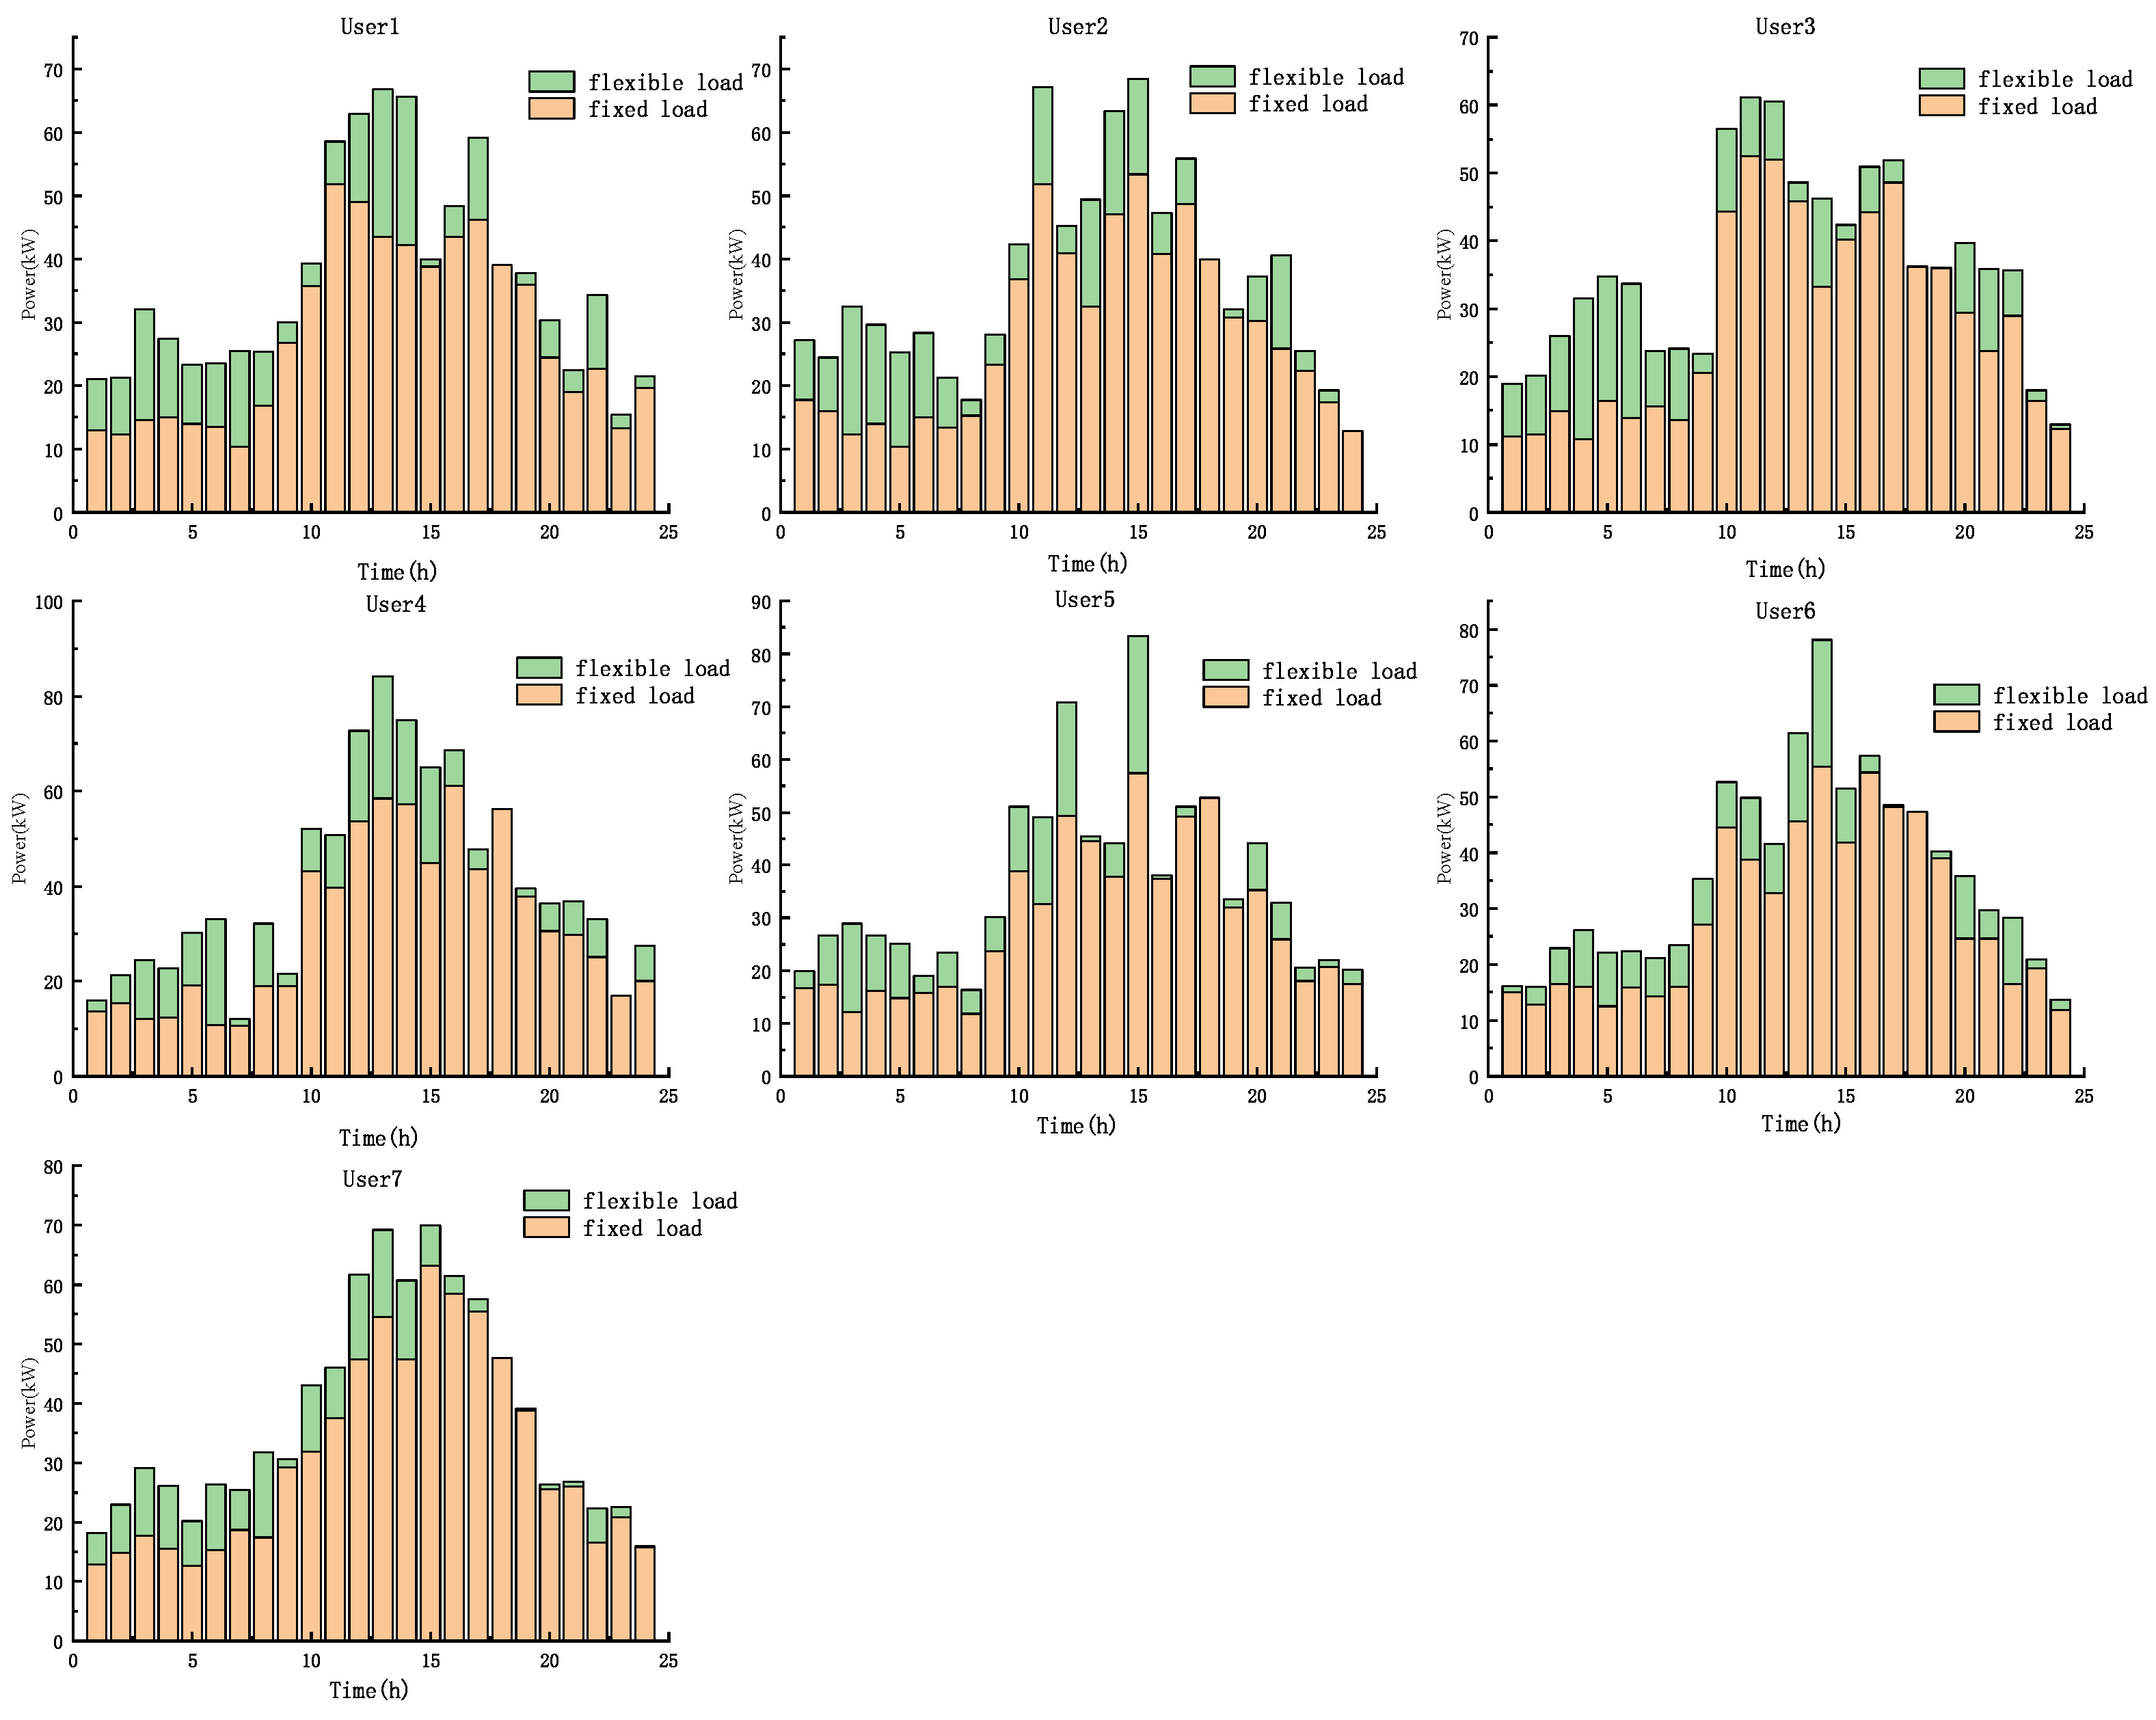
4.1. Community User Model
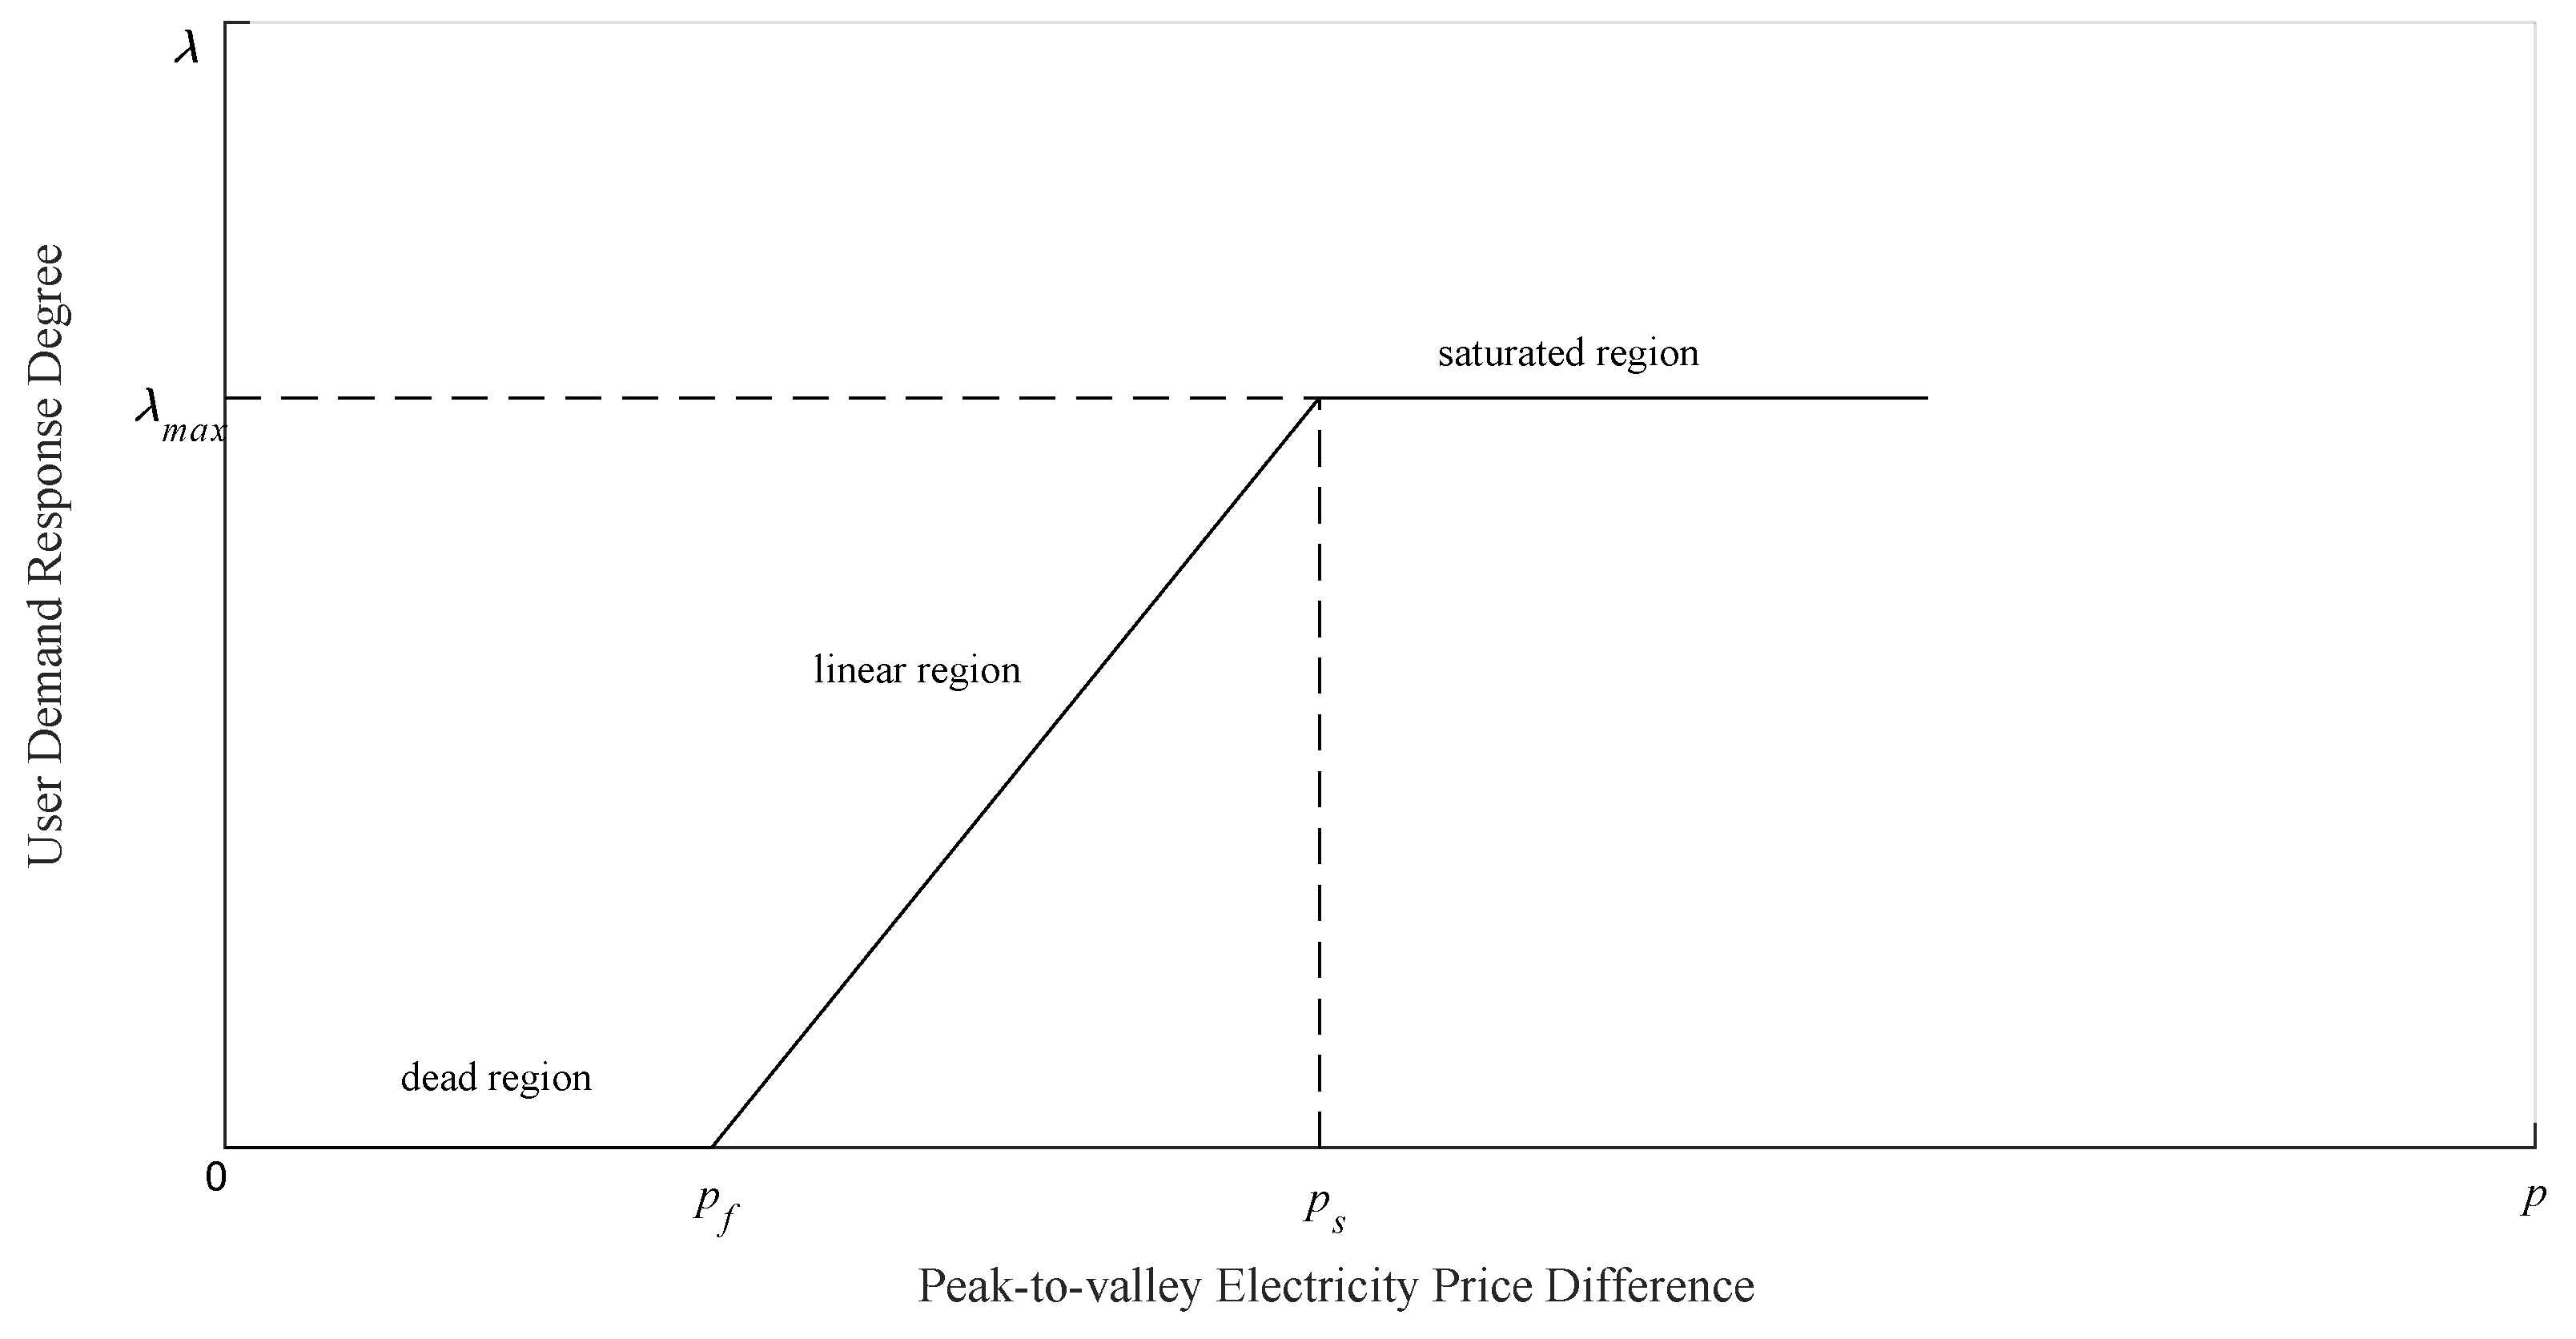
4.2. User Herd Mentality Model
5. Case Study
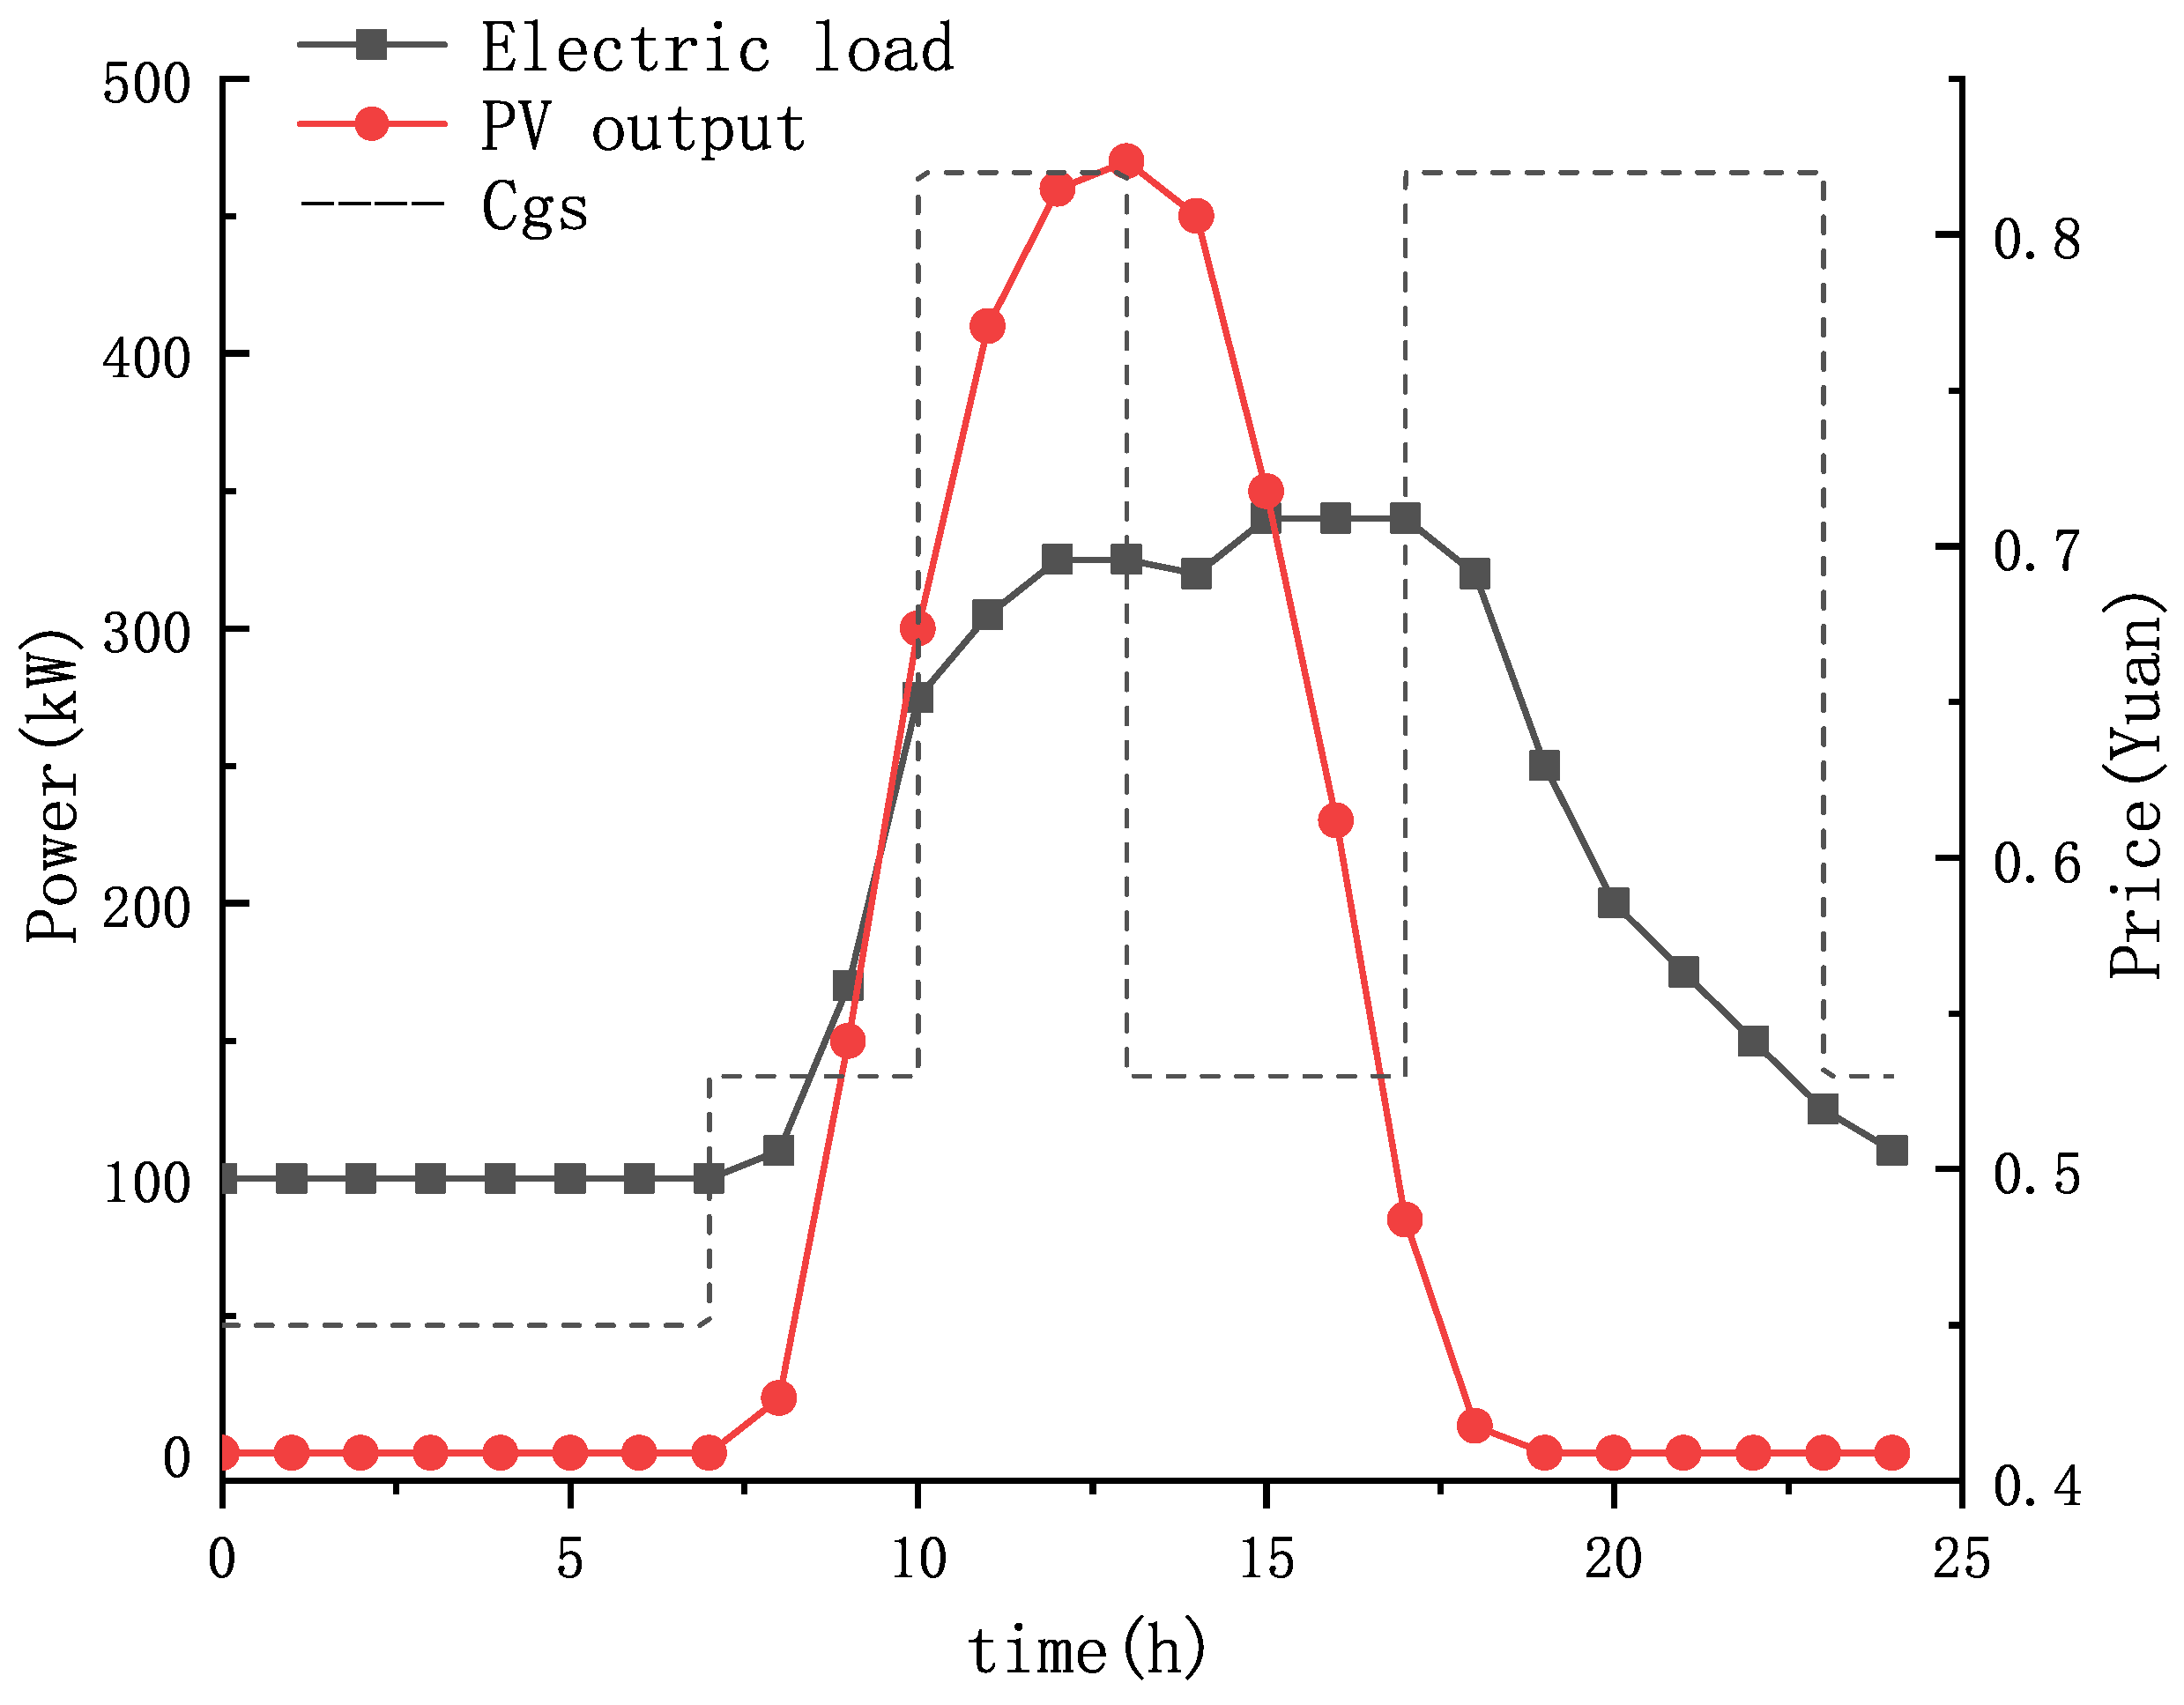
5.1. Basic Data
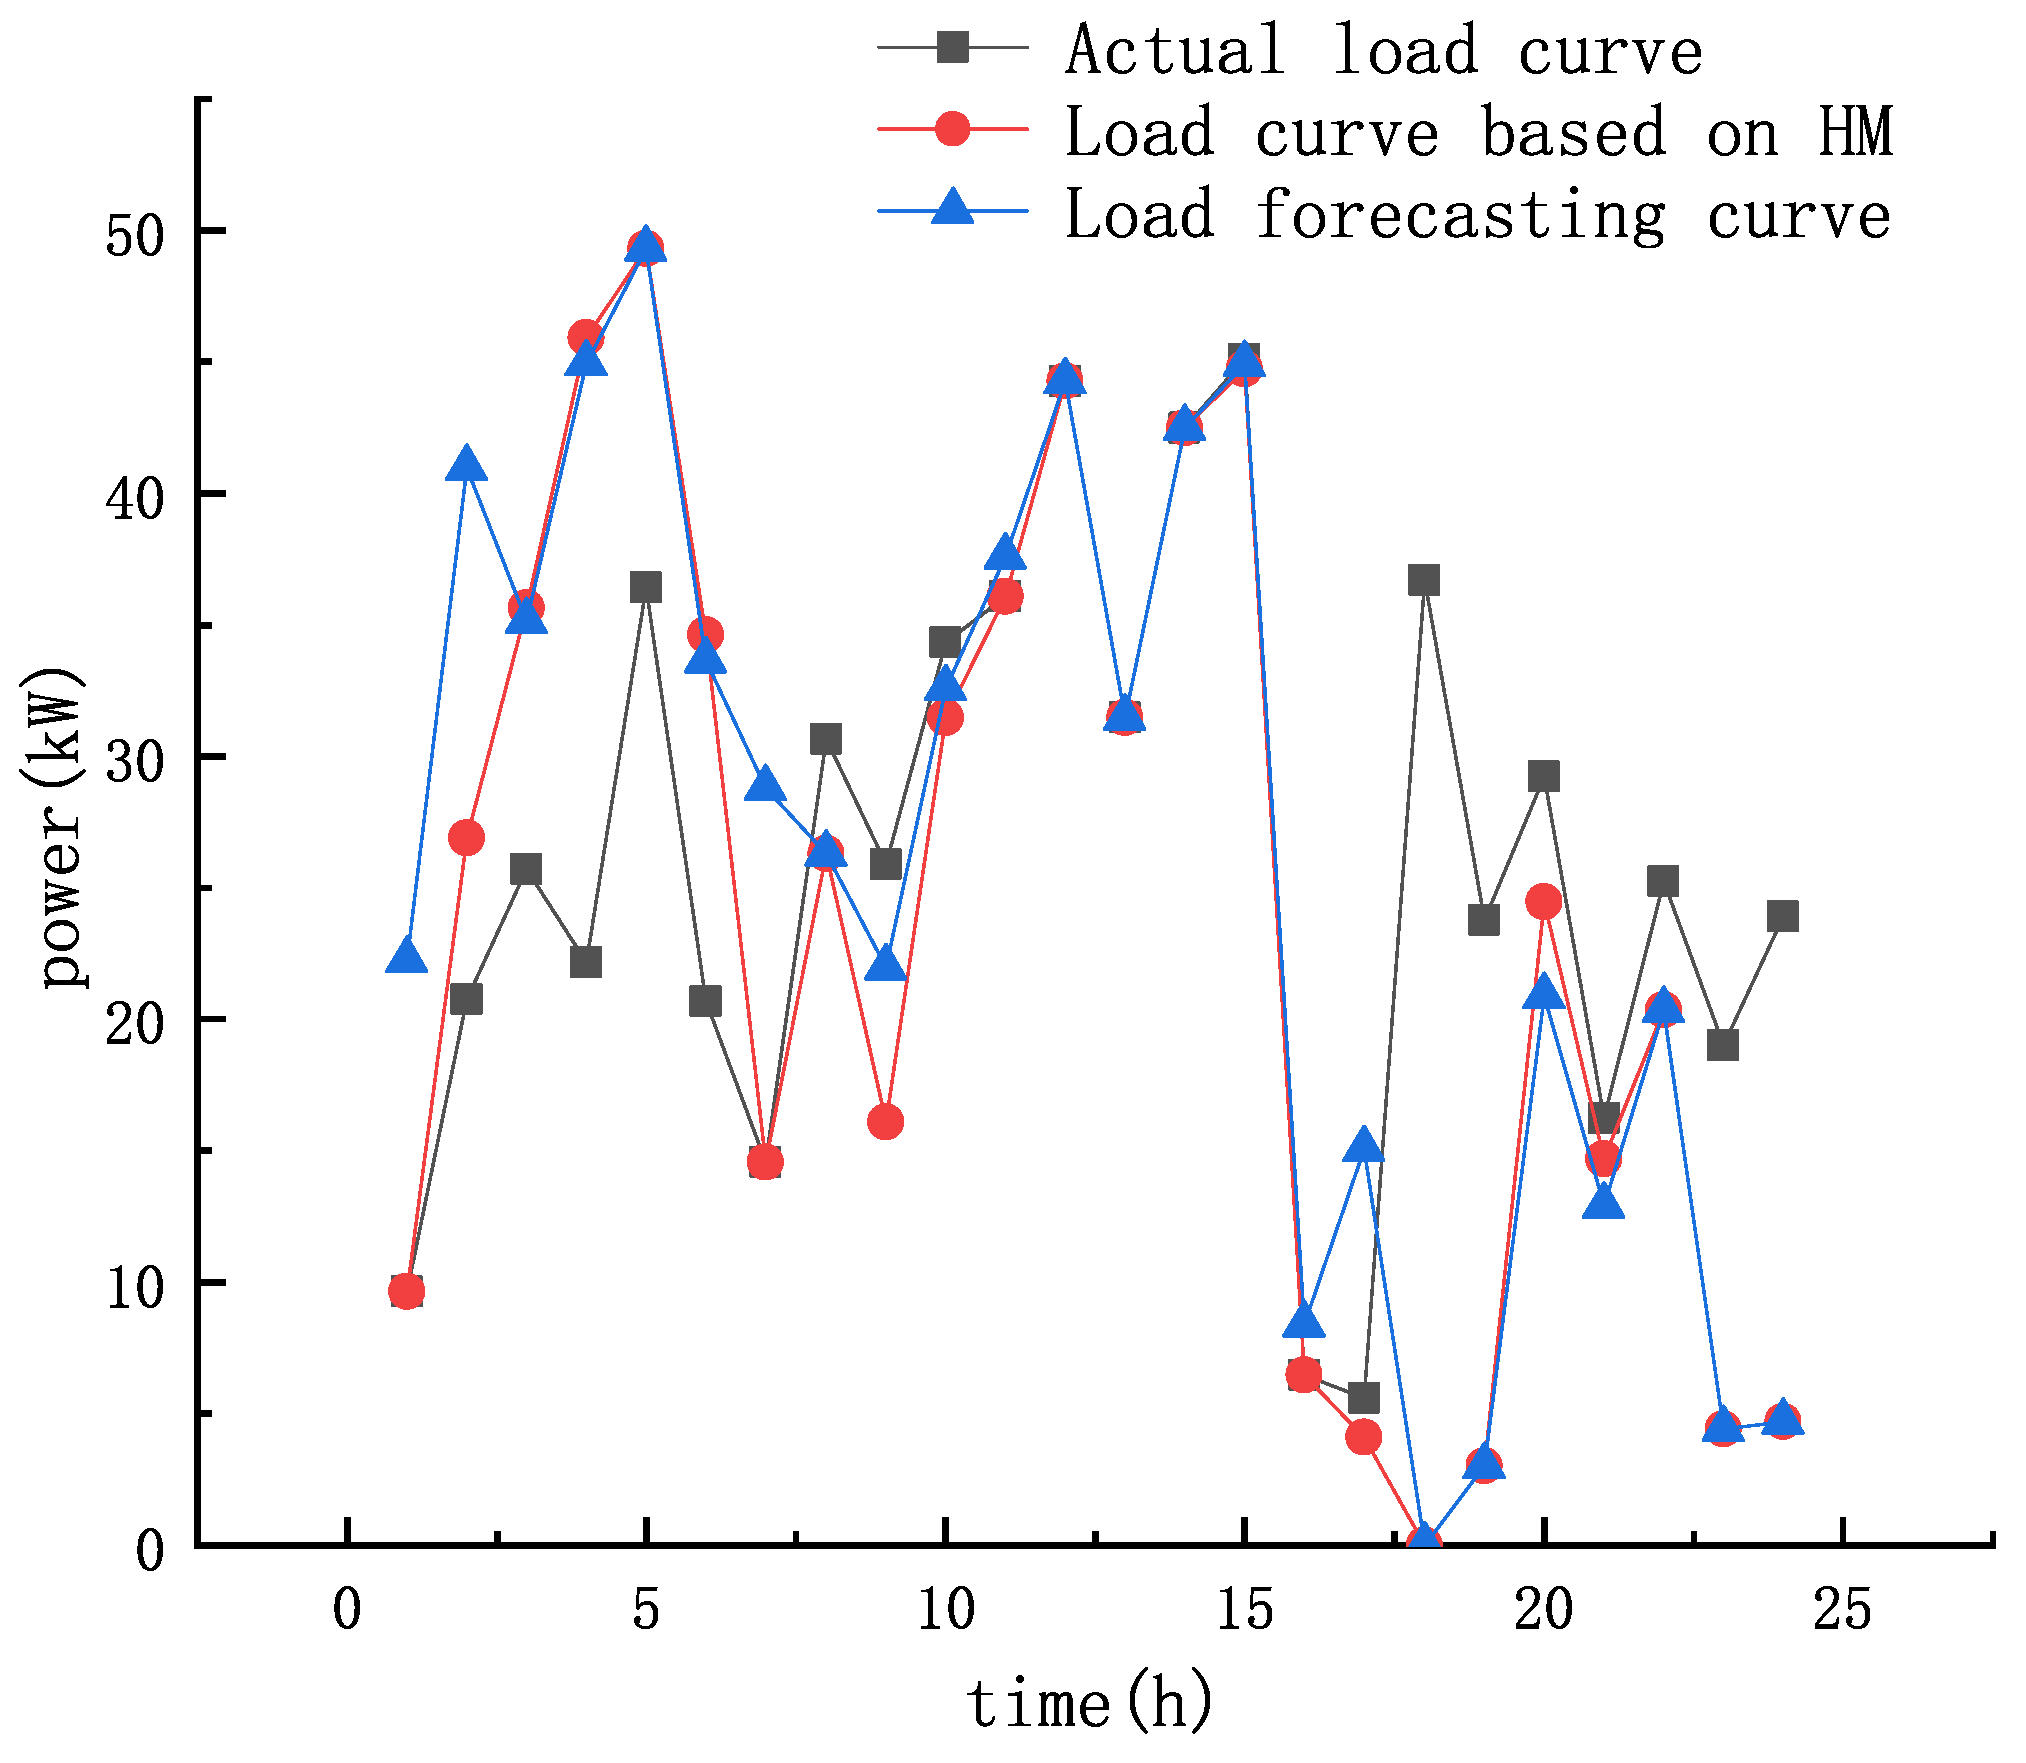
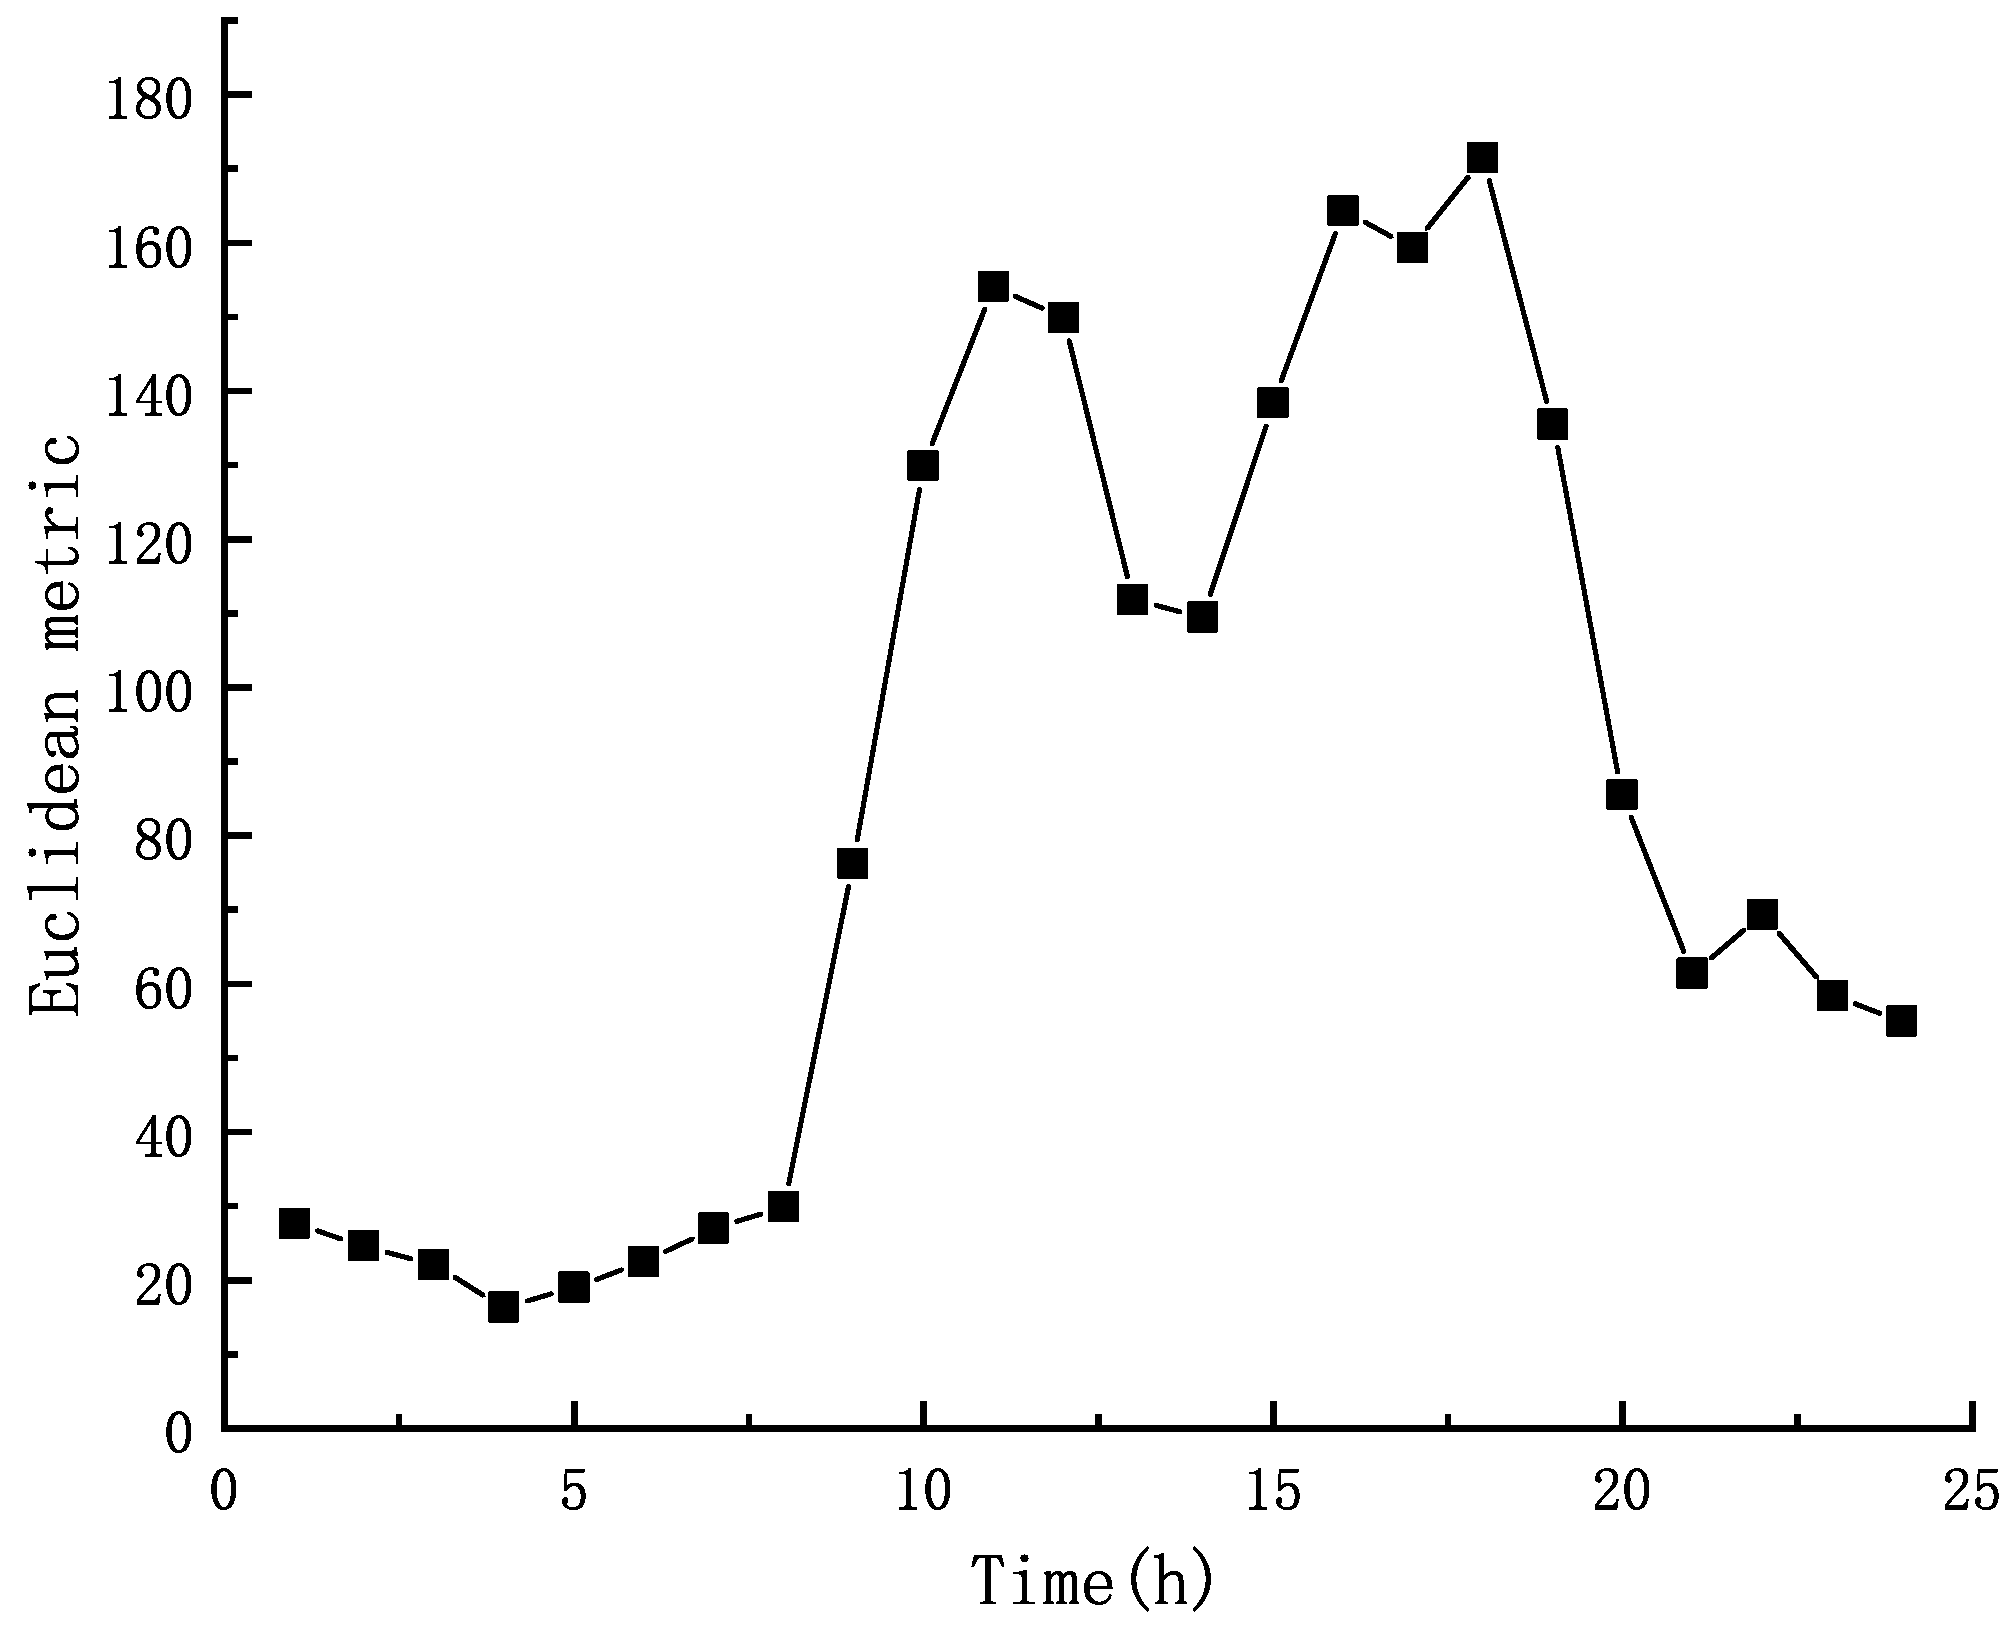
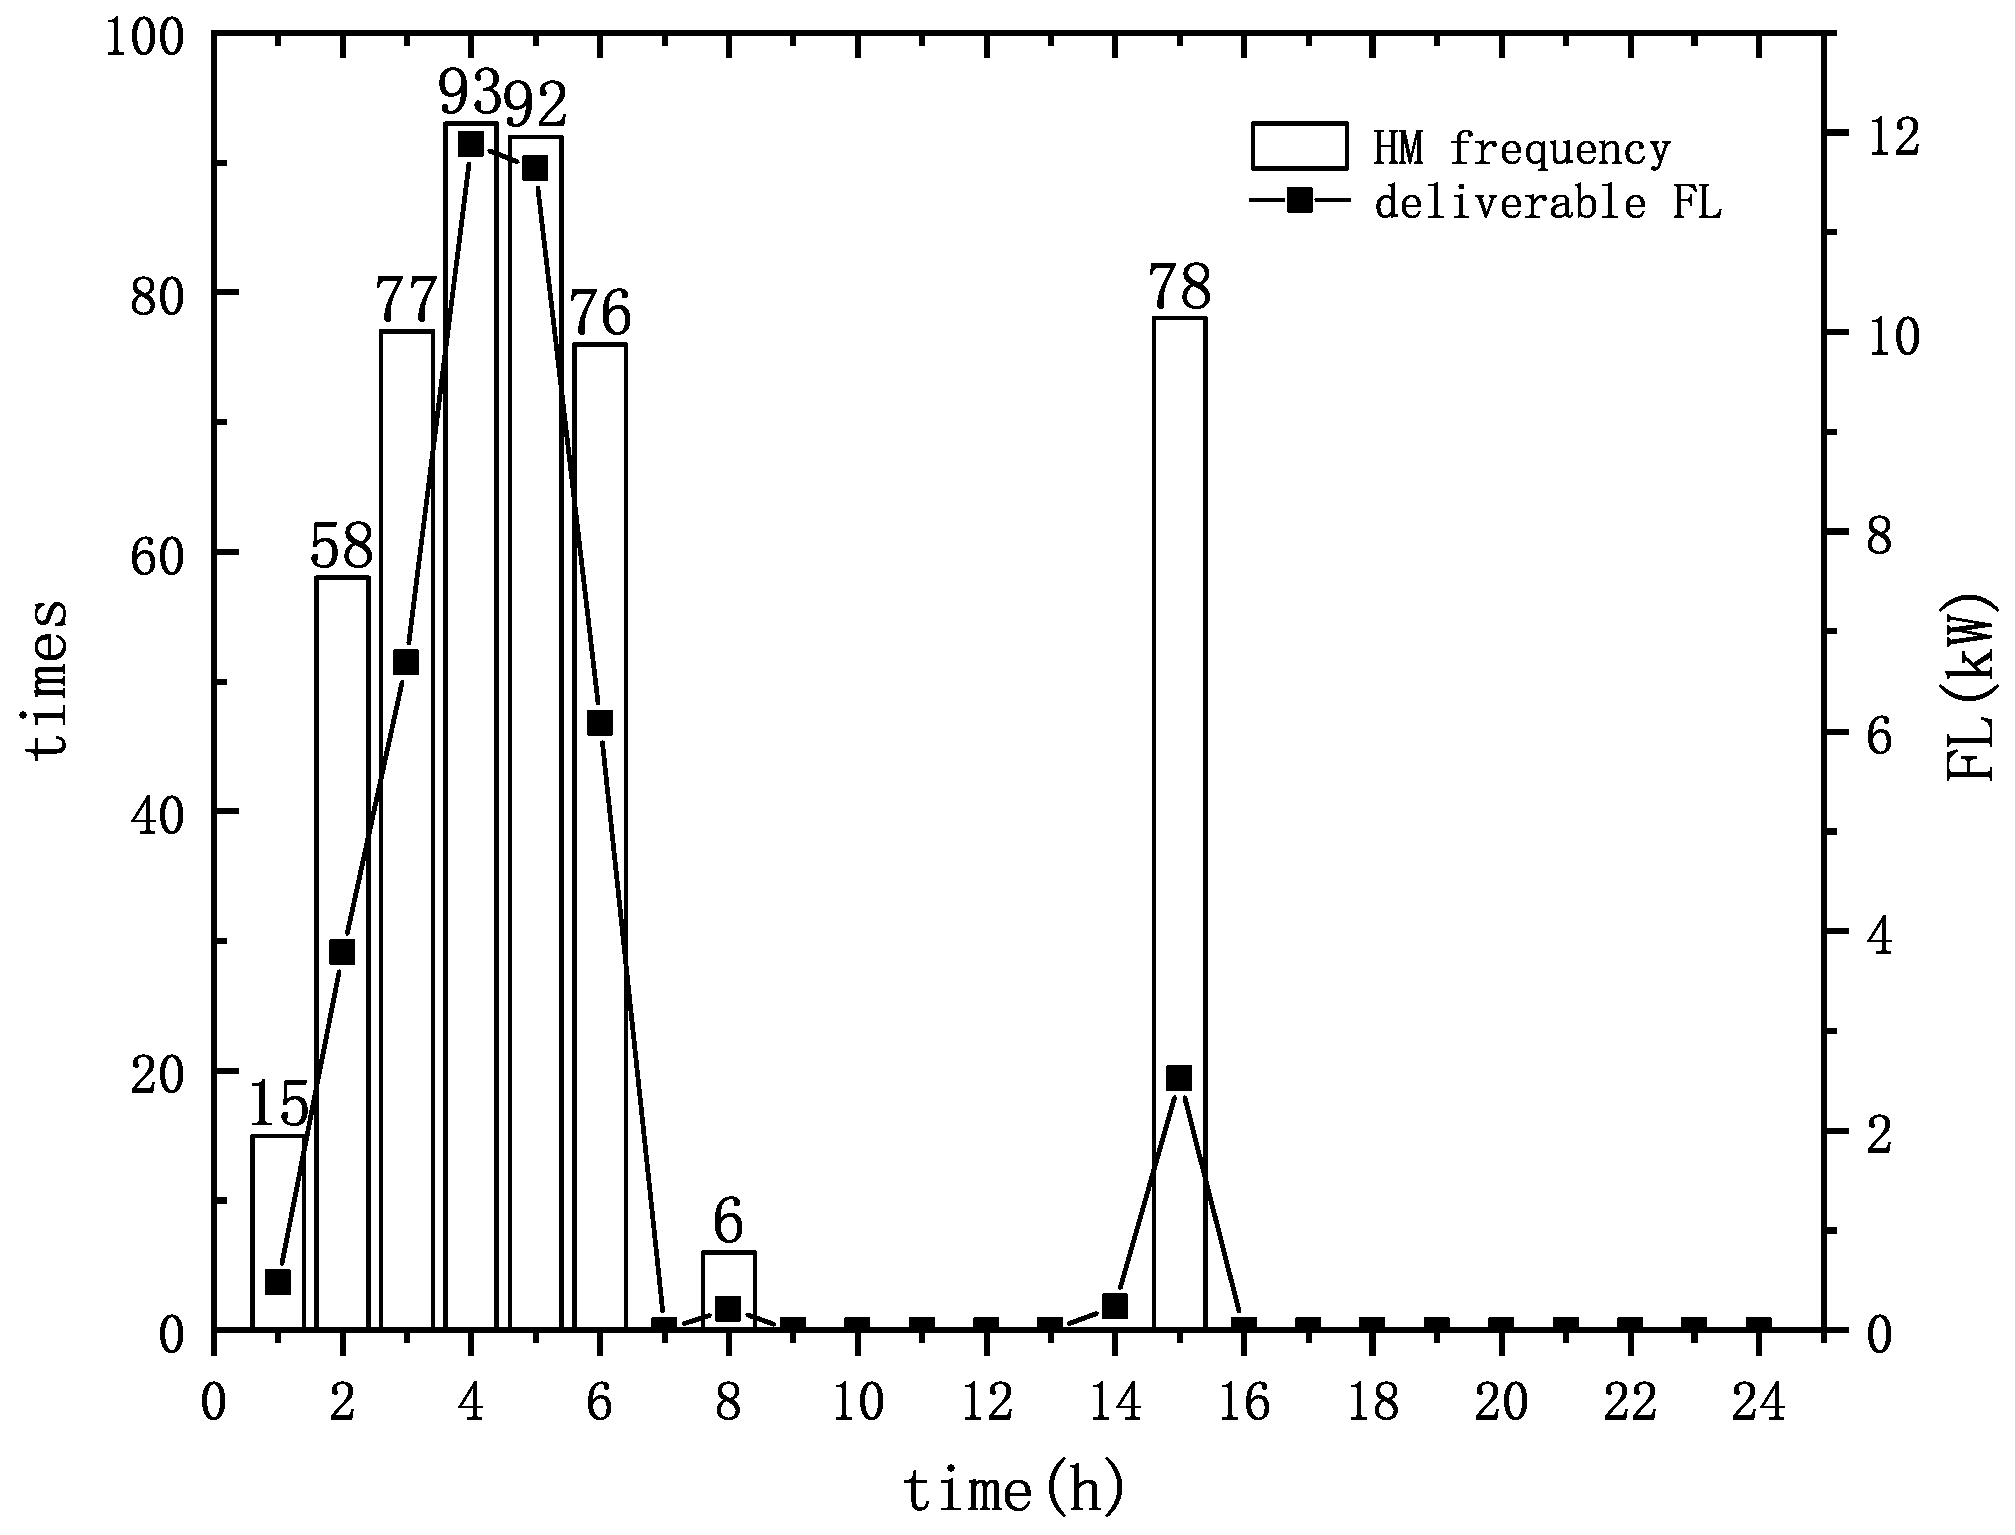
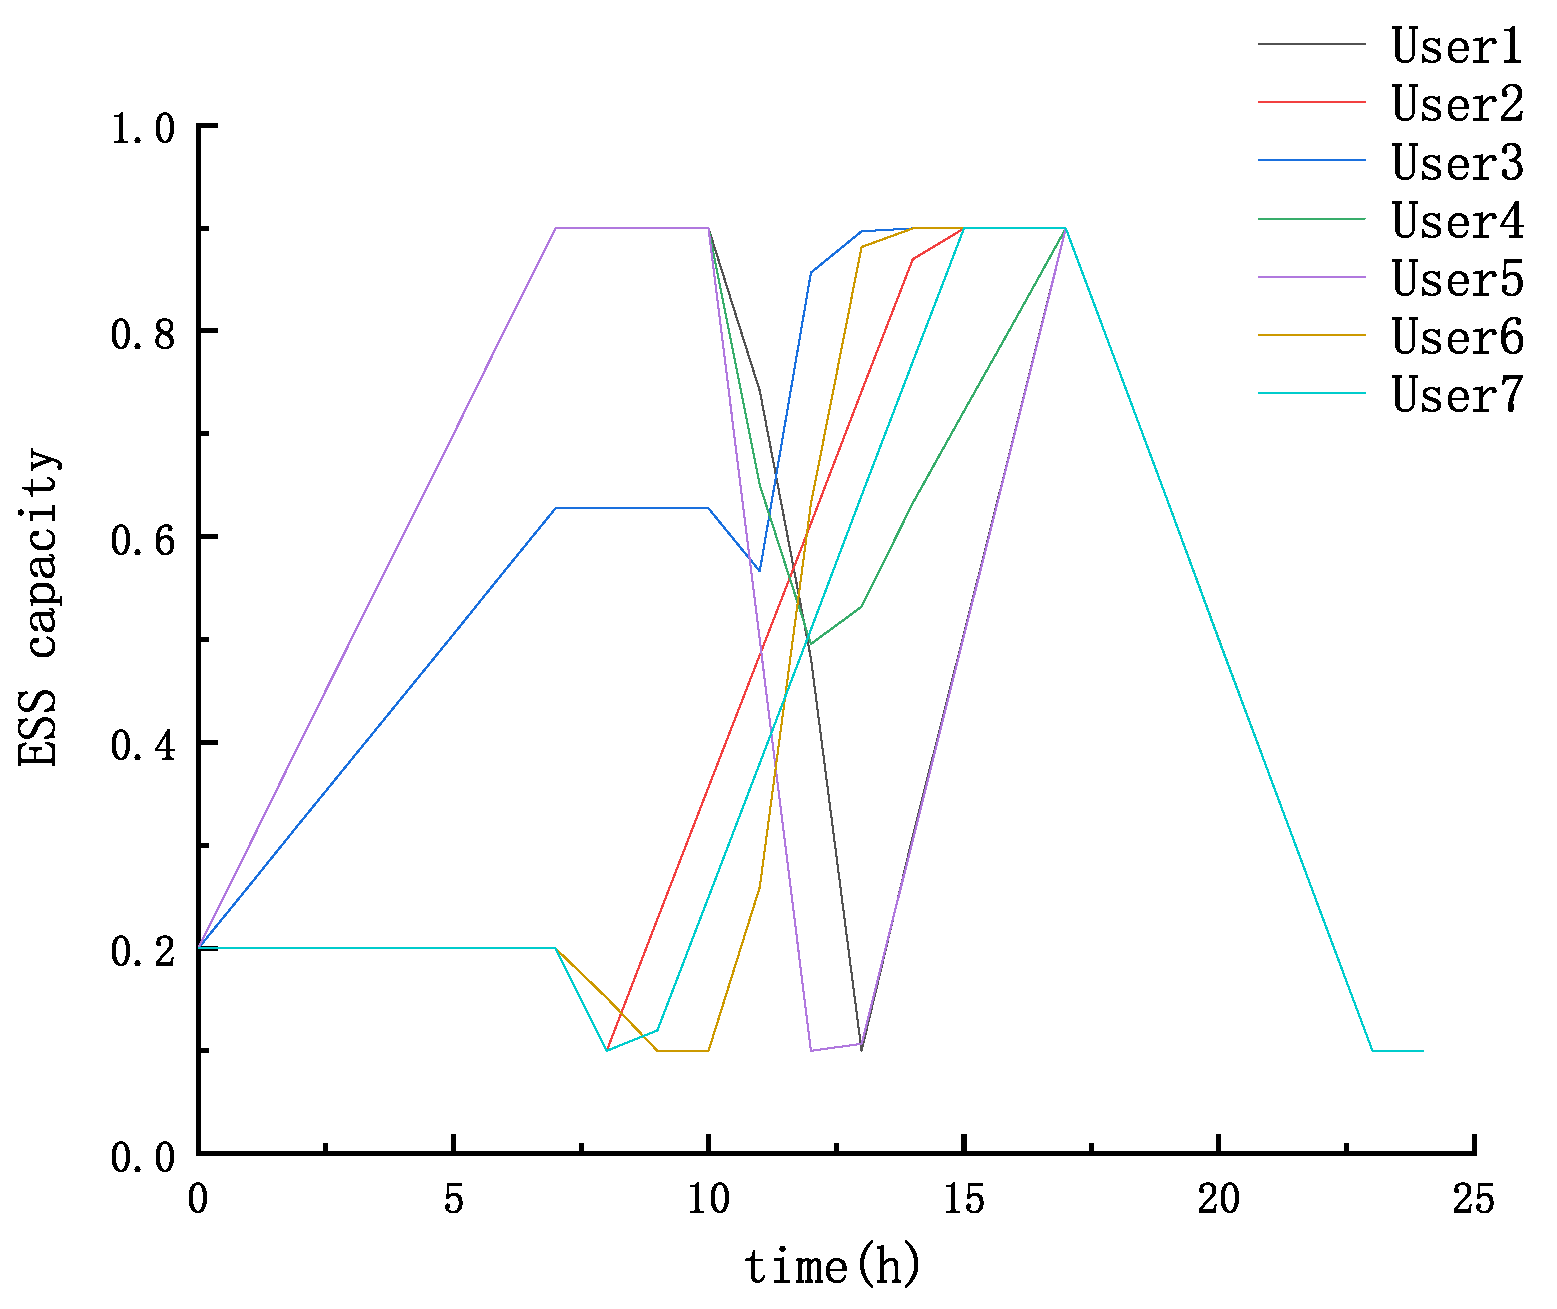
5.2. Analysis of Flexible Load Scheduling Results Considering Herd Mentality
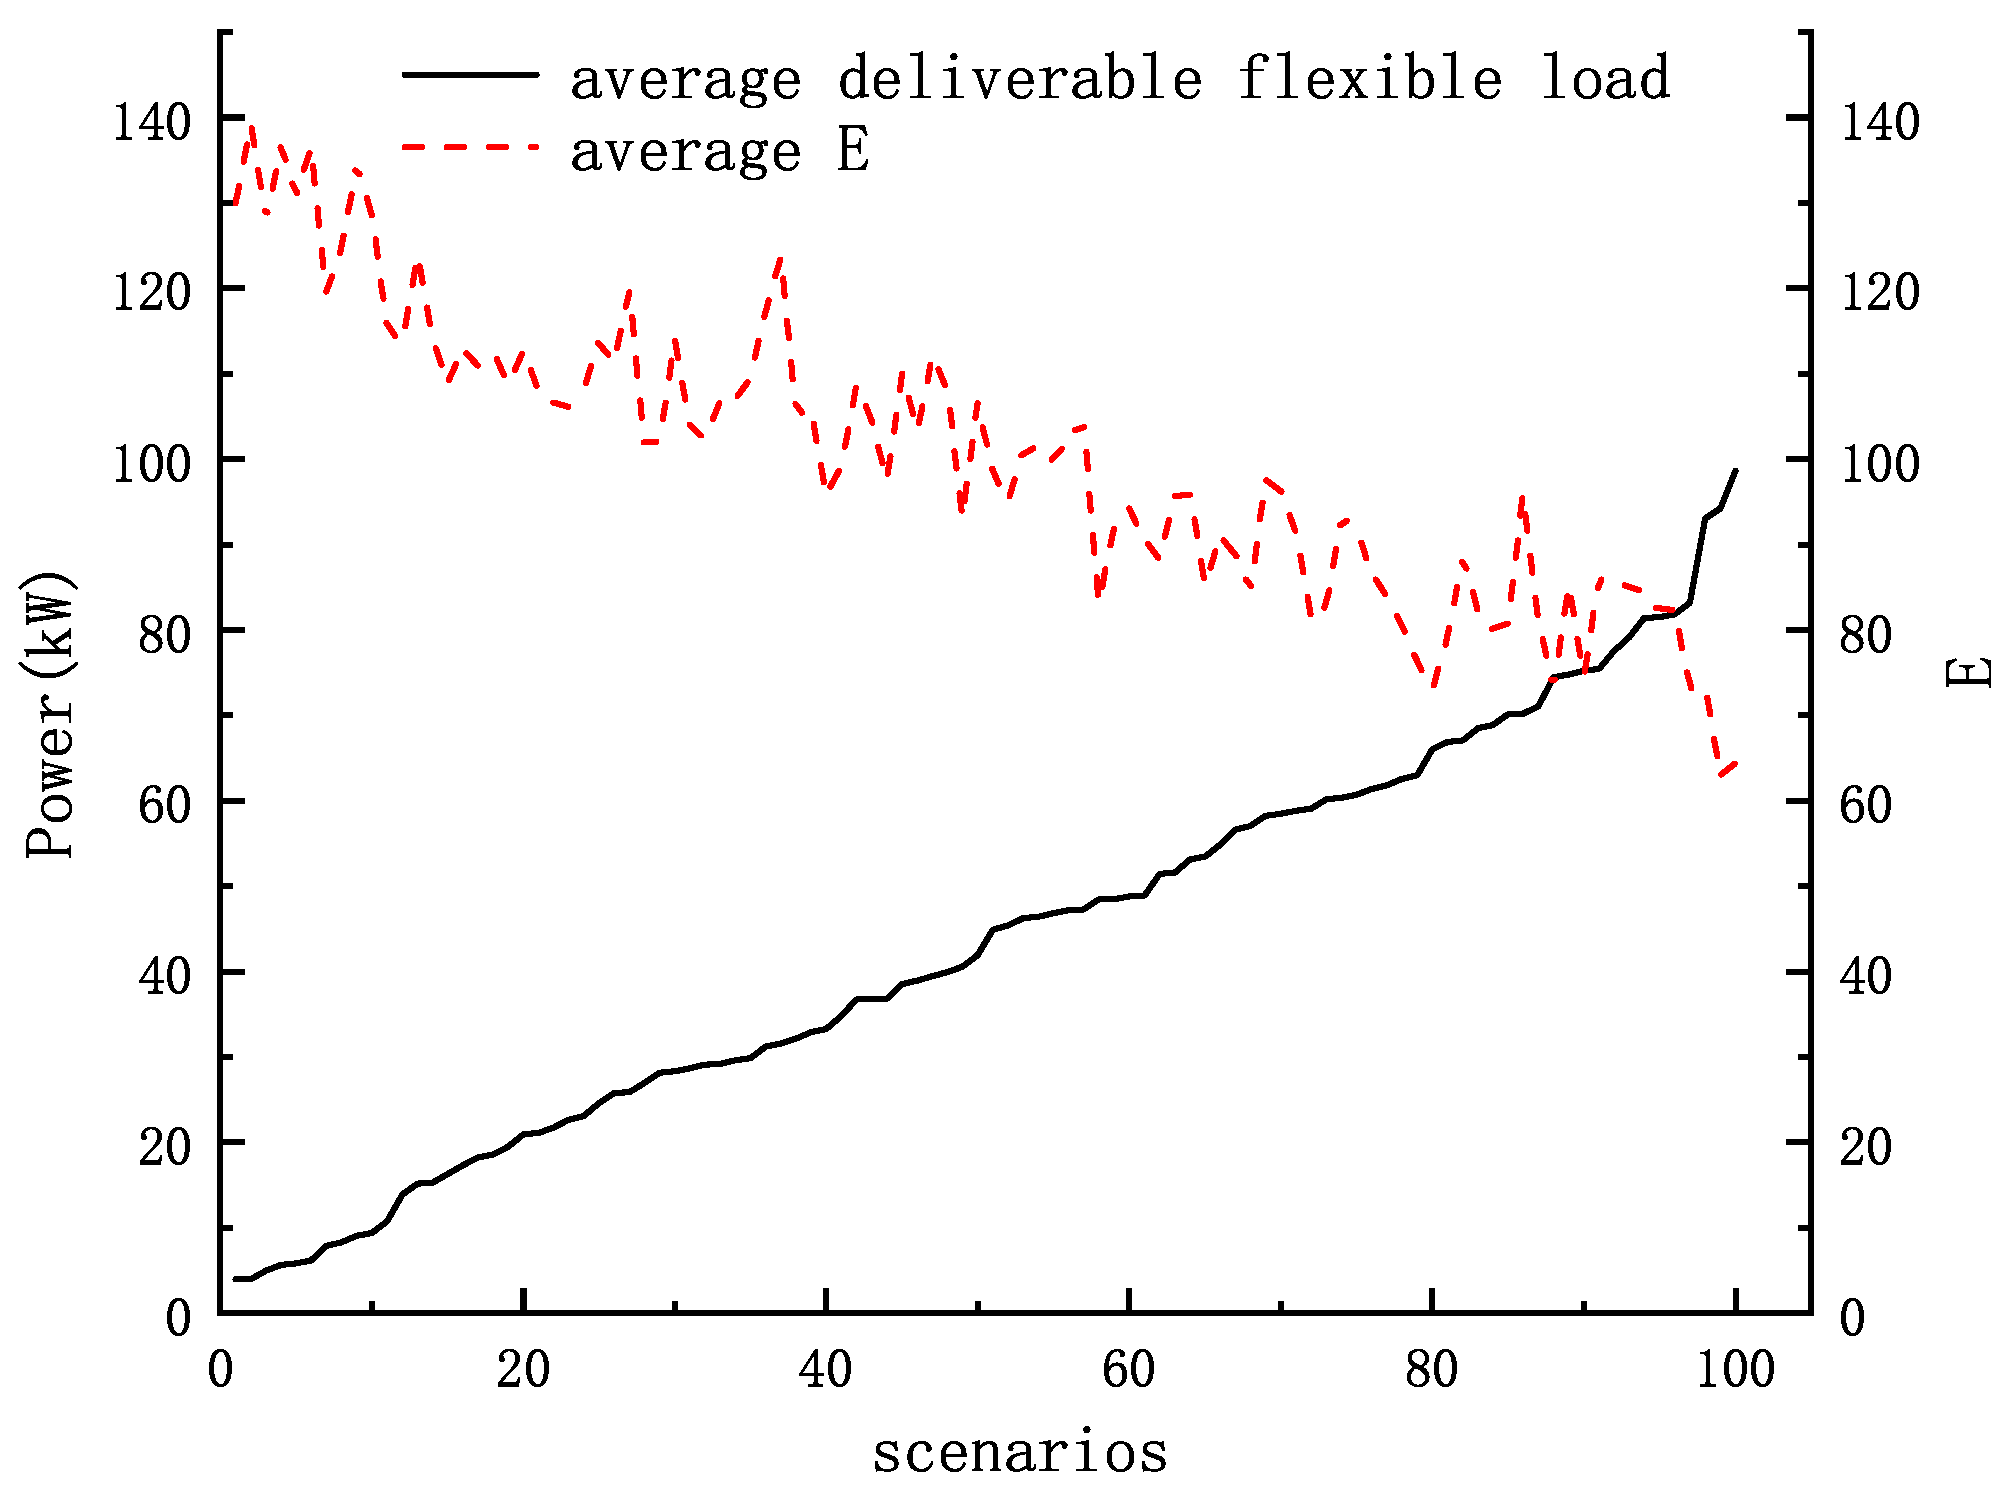
5.3. Analysis of Random Flexible Load Scheduling Results Considering Influence of Herd Mentality
6. Conclusions and Prospect
Author Contributions
Funding
Conflicts of Interest
Abbreviations
| DFR | Distributed Flexible Resources |
| CM | Community Manager |
| DR | demand Response |
| HM | Herd Mentality |
| SWF | Social Welfare Function |
| PV | Photovoltaic |
| CV | Comfomsit Value |
| ES | Energy Storage |
| FL | Flexible Load |
| Unit Time | |
| Total User’s Utility | |
| Utility Gained by Users Engaged in Other Activities | |
| Electricity Charges at time t | |
| Energy Consumption Utility at time t | |
| Community Penalty Utility at time t | |
| Community Herd Mentality Utility at time t | |
| Time of Use Price at time t | |
| Penalty Price at time t | |
| User n Personal Benefits | |
| Herd Mentality Utility Coefficient Normalized at time t | |
| d | Flexible Load Changed Due to Herd Mentality |
| Electric Load at time t | |
| PV Forecast at time t | |
| Deliverable Flexible Load at time t | |
| Non-deliverable Flexible Load at time t | |
| Shiftable Load at time t | |
| Charge load at time t | |
| Discharge load at time t | |
| E | Preference Coefficient |
| M | Herd Mentality Coefficient |
| Q | Total Shiftable Load in a Period |
| Up Limit of Flexible Load | |
| Lower Limit of Flexible Load | |
| Up Limit of Shiftable Load | |
| Lower Limit of Shiftable Load | |
| ES Loss | |
| ES State | |
| ComfomsitValue | The Utility of User’s Herd Mentality |
| Deliverable Flexible Load | Flexible Load Used under the Influence of |
| Community Information | |
| Non-deliverable Flexible Load | Flexible Load Used by Users according to Preference |
Appendix A

| ITEMs |
|---|
| 1. age |
| 2. Education |
| 3. gender |
| 4. When I see that most of the neighbors are involved in demand response, what is your choice? |
| 5. The more people in the community who participate in demand response, |
| the more I want to participate, do you agree? |
| 6. Do you choose to stand your ground when your opinion is contrary to most people’s? |
| 7. When you know that some neighbors are used to charging electric cars in the early morning |
| but you are used to charging in the afternoon, what is your choice? |
| 8. In daily consumption, I like to be consistent with most of the people around me, |
| do you agree with this point of view? |
| 9. Are you affected by your neighbour’s energy usage information? |
| 10. When you learned that your neighbors were involved in demand response, |
| would you consider participating? |
| 11. Do you share information about your energy use with people? |
| Constructs | Items | Frequency | Percentage |
|---|---|---|---|
| gender | Male | 102 | 48.6% |
| Female | 108 | 51.4% | |
| Education | Junior high school and below | 33 | 15.7% |
| High school | 71 | 33.8% | |
| Undergraduate | 67 | 31.9% | |
| Graduate and above | 39 | 18.6% | |
| Age | under 20 | 24 | 11.4% |
| 20–30 | 34 | 16.2% | |
| 30–40 | 48 | 22.9% | |
| 40–50 | 42 | 20% | |
| 50–60 | 51 | 24.3% | |
| over 60 | 11 | 5.2% |


References
- Assad, U.; Hassan, M.A.S.; Farooq, U.; Kabir, A.; Khan, M.Z.; Bukhari, S.S.H.; Jaffri, Z.U.A.; Oláh, J.; Popp, J. Smart Grid, Demand Response and Optimization: A Critical Review of Computational Methods. Energies 2022, 15, 2003. [Google Scholar] [CrossRef]
- Haider, H.T.; See, O.H.; Elmenreich, W. A review of residential demand response of smart grid. Renew. Sustain. Energy Rev. 2016, 59, 166–178. [Google Scholar] [CrossRef]
- Blohm, A.; Crawford, J.; Gabriel, S.A. Demand Response as a Real-Time, Physical Hedge for Retail Electricity Providers: The Electric Reliability Council of Texas Market Case Study. Energies 2021, 14, 808. [Google Scholar] [CrossRef]
- Lin, J.; Dong, J.; Dou, X.; Liu, Y.; Yang, P.; Ma, T. Psychological insights for incentive-based demand response incorporating battery energy storage systems: A two-loop Stackelberg game approach. Energy 2022, 239, 122192. [Google Scholar] [CrossRef]
- Schöne, N.; Greilmeier, K.; Heinz, B. Survey-Based Assessment of the Preferences in Residential Demand Response on the Island of Mayotte. Energies 2022, 15, 1338. [Google Scholar] [CrossRef]
- Yang, X.; Fu, G.; Liu, F.; Tain, Y.; Xu, Y.; Chai, Z. Potential Evaluation and Control Strategy of Air Conditioning Load Aggregation Response Considering Multiple Factors. Power Syst. Technol. 2022, 46, 699–714. [Google Scholar]
- Shahgoshtasbi, D.; Jamshidi, M. A new intelligent neuro–fuzzy paradigm for energy-efficient homes. IEEE Syst. J. 2014, 8, 664–673. [Google Scholar] [CrossRef]
- Goh, H.H.; Zong, L.; Zhang, D.; Dai, W.; Lim, C.S.; Kurniawan, T.A.; Goh, K.C. Orderly Charging Strategy Based on Optimal Time of Use Price Demand Response of Electric Vehicles in Distribution Network. Energies 2022, 15, 1869. [Google Scholar] [CrossRef]
- Lu, Q. multi-type demand response in dynamic electricity price. Energy 2022, 240, 122504. [Google Scholar] [CrossRef]
- Miao, M.; Lou, S.; Zhang, Y.; Chen, X. Research on the Optimized Operation of Hybrid Wind and Battery Energy Storage System Based on Peak-Valley Electricity Price. Energies 2021, 14, 3707. [Google Scholar] [CrossRef]
- Zhao, D.; Wang, H.; Ran, T. Multi-time scale dispatch approach for an AC/DC hybrid distribution system considering the response uncertainty of flexible loads. Electr. Power Syst. Res. 2021, 199, 107394. [Google Scholar] [CrossRef]
- Wang, Z.; Sun, Y.; Wang, B. Policy cognition is more effective than step tariff in promoting electricity saving behaviour of residents. Energy Policy 2020, 139, 111338. [Google Scholar] [CrossRef]
- Iliopoulos, N.; Onuki, M.; Esteban, M. Shedding Light on the Factors That Influence Residential Demand Response in Japan. Energies 2021, 14, 2795. [Google Scholar] [CrossRef]
- Good, N. Using behavioural economic theory in modelling of demand response. Appl. Energy 2019, 239, 107–116. [Google Scholar] [CrossRef]
- Lin, J.; Dong, J.; Liu, D.; Zhang, Y.; Ma, T. From peak shedding to low-carbon transitions: Customer psychological factors in demand response. Energy 2022, 238, 121667. [Google Scholar] [CrossRef]
- Hobman, E.V.; Frederiks, E.R.; Stenner, K.; Meikle, S. Uptake and usage of cost-reflective electricity pricing: Insights from psychology and behavioural economics. Renew. Sustain. Energy Rev. 2016, 57, 455–467. [Google Scholar] [CrossRef] [Green Version]
- Chen, C.; Li, J.; Shuai, J. Linking social-psychological factors with policy expectation: Using local voices to understand solar PV poverty alleviation in Wuhan, China. Energy Policy 2021, 151, 112160. [Google Scholar] [CrossRef]
- Khemakhem, S.; Rekik, M.; Krichen, L. A collaborative energy management among plug-in electric vehicle, smart homes and neighbors’interaction for residential power load profile smoothing. J. Build. Eng. 2020, 27, 100976. [Google Scholar] [CrossRef]
- Snow, S.; Chadwick, K.; Horrocks, N.; Chapman, A.; Glencross, M. Do solar households want demand response and shared electricity data? Exploring motivation, ability and opportunity in Australia. Energy Res. Soc. Sci. 2022, 87, 102480. [Google Scholar] [CrossRef]
- Restrepo, J.D.C.; Morales-Pinzón, T. Effects of feedback information on the household consumption of water and electricity: A case study in Colombia. J. Environ. Manag. 2020, 262, 110315. [Google Scholar] [CrossRef]
- Nilsson, A.; Bergstad, C.J.; Thuvander, L.; Andersson, D.; Andersson, K.; Meiling, P. Effects of continuous feedback on households’ electricity consumption: Potentials and barriers. Appl. Energy 2014, 122, 17–23. [Google Scholar] [CrossRef]
- Yan, S.; Zhao, C.; Zhang, M. Does haze pollution promote the consumption of energy-saving appliances in China? An empirical study based on norm activation model. Resour. Conserv. Recycl. 2019, 145, 220–229. [Google Scholar]
- Guo, Z.; Zhou, K.; Zhang, C.; Lu, X.; Chen, W.; Yang, S. Residential electricity consumption behavior: Influencing factors, related theories and intervention strategies. Renew. Sustain. Energy Rev. 2018, 81, 399–412. [Google Scholar] [CrossRef]
- Shu, Y.; Zhang, Y.; Zhao, D. Who exhibits more energy-saving behavior in direct and indirect ways in China? The role of psychological factors and socio-demographics. Energy Policy 2016, 93, 196–205. [Google Scholar]
- Boyd, R.; Richerson, P. Culture and evolutionary process. Am. J. Sociol. 1985, 19, 426–435. [Google Scholar]
- Brian, S. Dynamics of conformist bias. Monist 2005, 88, 260–269. [Google Scholar]
- Kinjo, K.; Ebina, T. Optimal program for autonomous driving under Bentham-and Nash-type social welfare functions. Procedia Comput. Sci. 2017, 112, 61–70. [Google Scholar] [CrossRef]
- Alipour, M.; Stewart, R.A.; Sahin, O. Beyond the Diffusion of Residential Solar Photovoltaic Systems at Scale: Allegorising the Battery Energy Storage Adoption Behaviour. Energies 2021, 14, 5015. [Google Scholar] [CrossRef]
- Ma, L.; Liu, N.; Zhang, J.; Tushar, W.; Yuen, C. Energy management for joint operation of CHP and PV prosumers inside a grid-connected microgrid: A game theoretic approach. IEEE Trans. Ind. Inform. 2016, 12, 1930–1942. [Google Scholar] [CrossRef]
- Zhang, K.; Song, Y.; Yan, Z.; Yu, Y. Energy storage capacity optimisation for load aggregators considering the probability of demand response resources’ breach. CIRED-Open Access Proc. J. 2017, 2017, 2731–2735. [Google Scholar] [CrossRef]


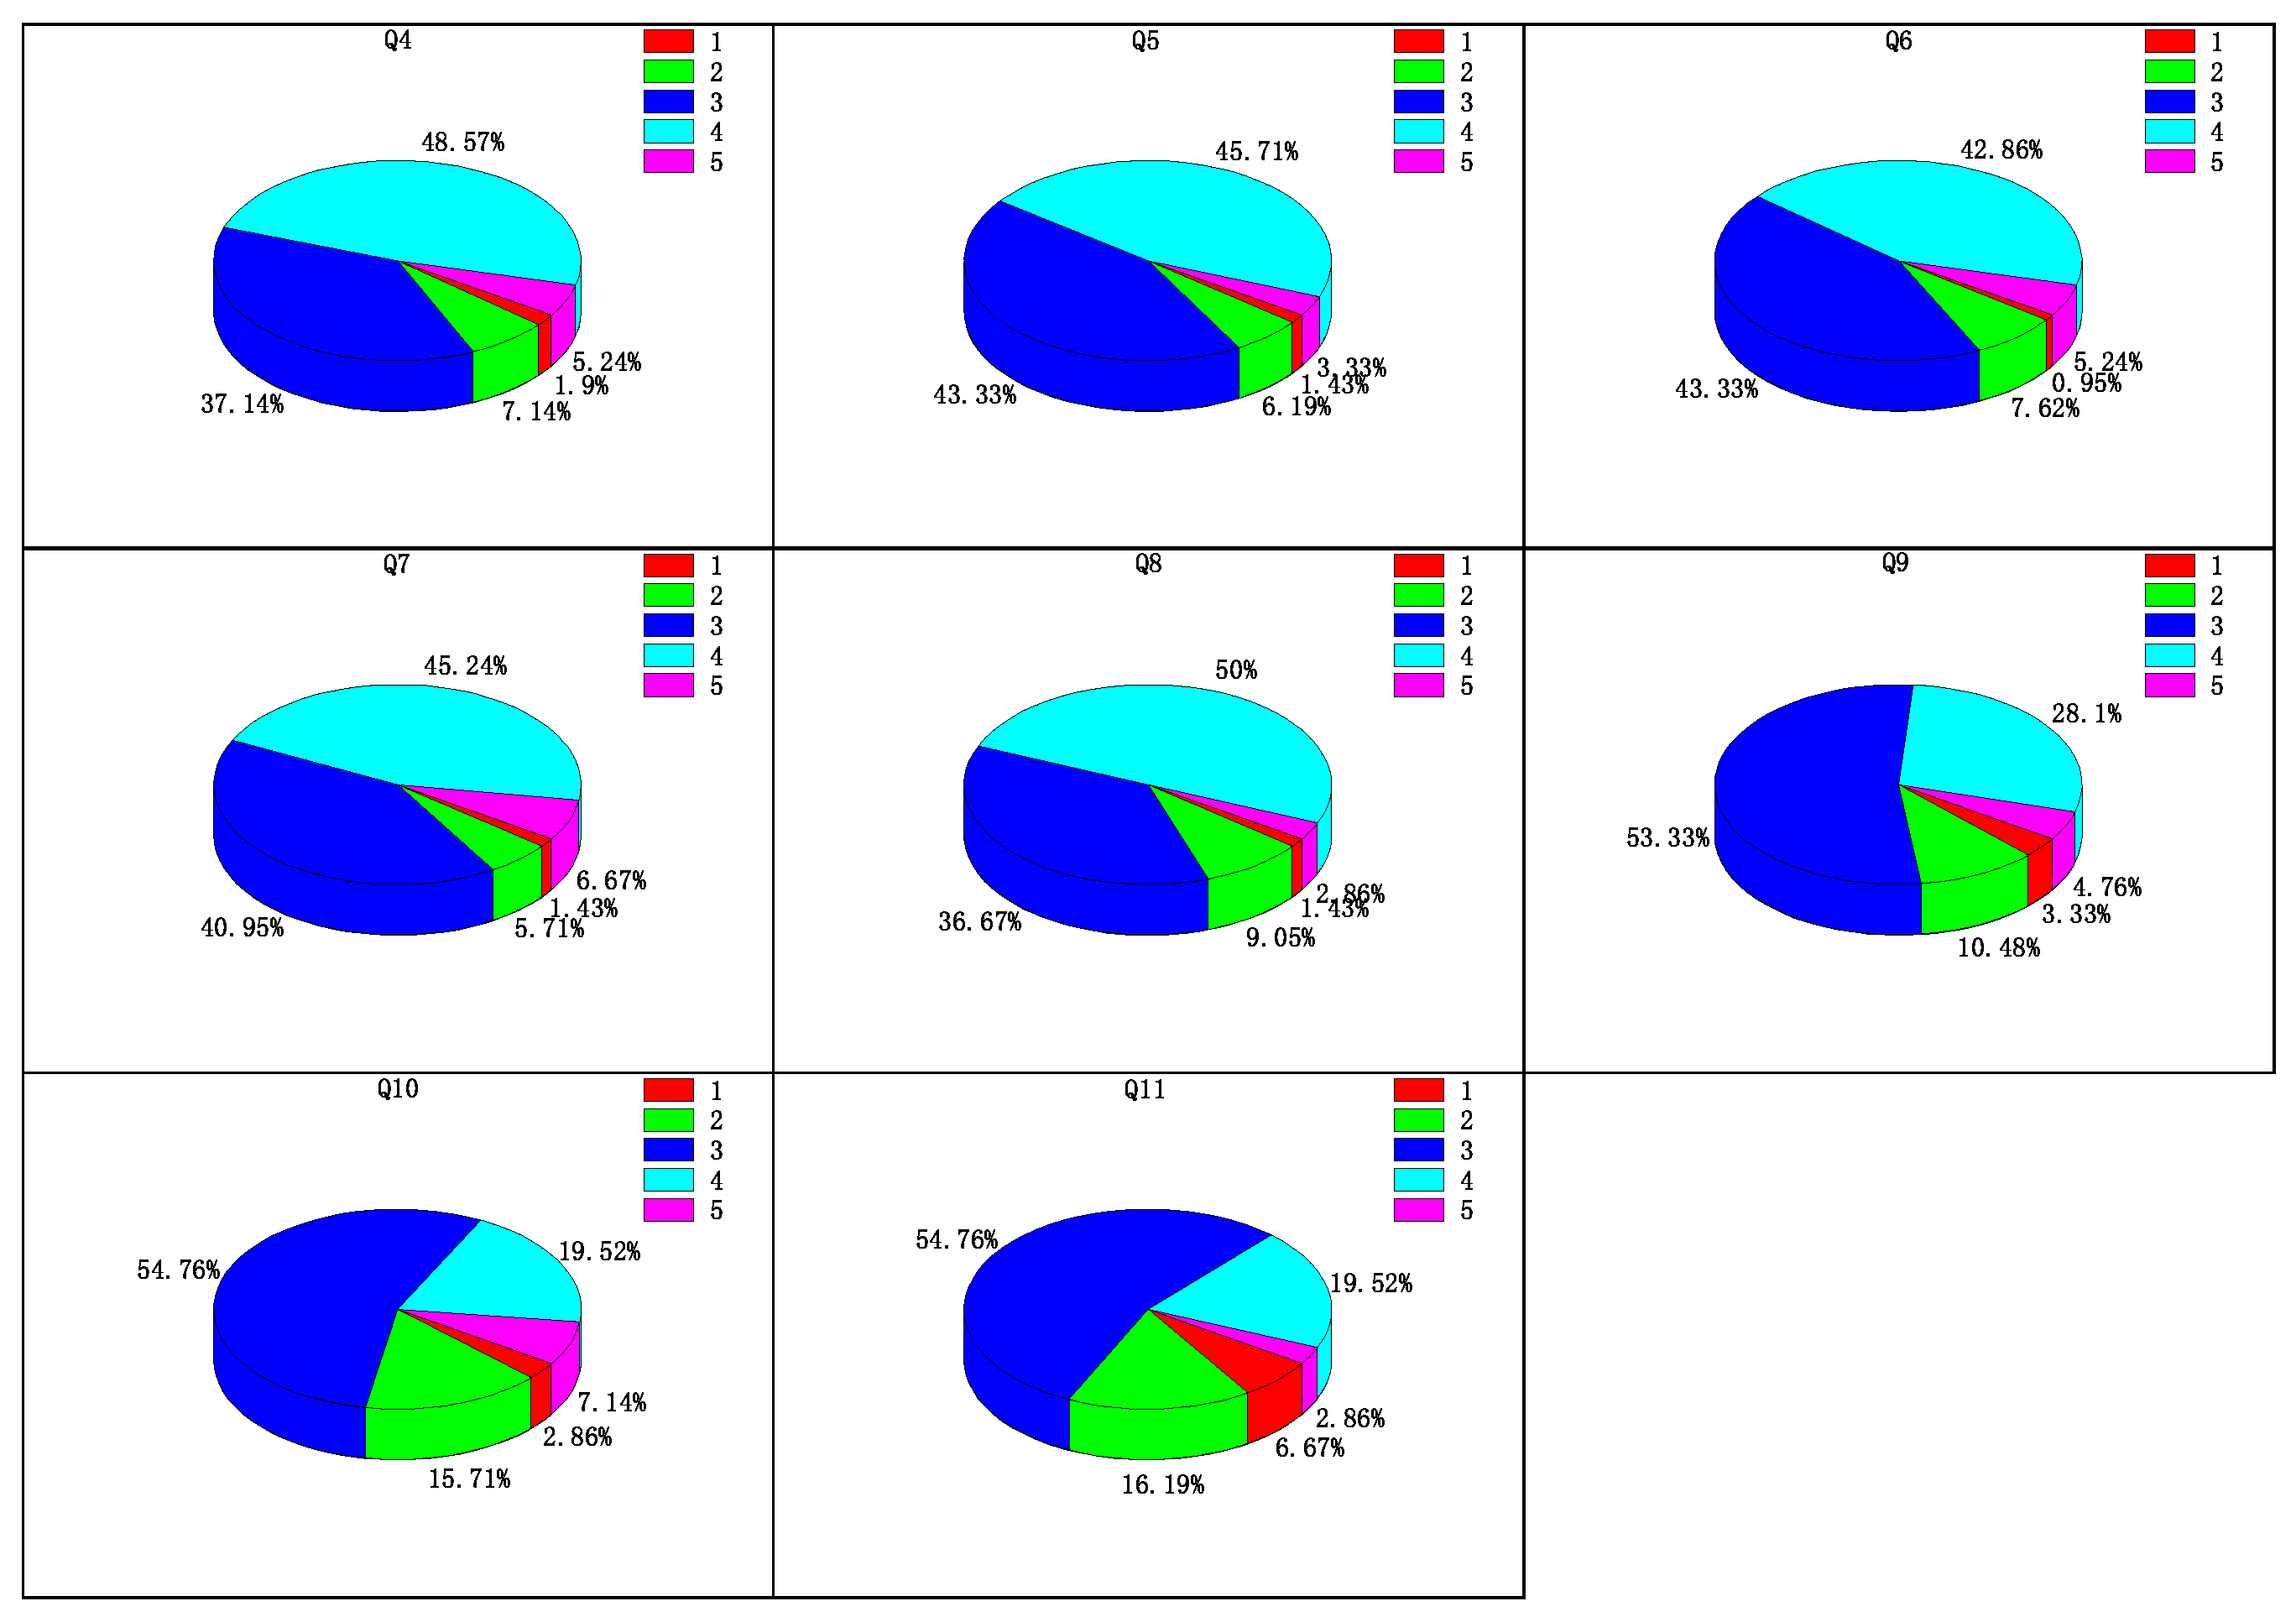
| Constructs | Items | CITC | Cronbach’s |
|---|---|---|---|
| Herd mentality [22] | Q4 | 0.652 | 0.816 |
| Q5 | 0.682 | 0.808 | |
| Q6 | 0.669 | 0.811 | |
| Q7 | 0.666 | 0.812 | |
| Q8 | 0.604 | 0.828 | |
| Information impact [23,24] | Q9 | 0.539 | 0.666 |
| Q10 | 0.590 | 0.608 | |
| Q11 | 0.550 | 0.644 |
| Parameter | Value |
|---|---|
| Initial ES | 20% |
| Lower limit of ES | 10% |
| upper limit of ES | 90% |
| ES capacity | 40 kW |
Publisher’s Note: MDPI stays neutral with regard to jurisdictional claims in published maps and institutional affiliations. |
© 2022 by the authors. Licensee MDPI, Basel, Switzerland. This article is an open access article distributed under the terms and conditions of the Creative Commons Attribution (CC BY) license (https://creativecommons.org/licenses/by/4.0/).
Share and Cite
Huang, Q.; Jiang, A.; Zeng, Y.; Xu, J. Community Flexible Load Dispatching Model Based on Herd Mentality. Energies 2022, 15, 4546. https://doi.org/10.3390/en15134546
Huang Q, Jiang A, Zeng Y, Xu J. Community Flexible Load Dispatching Model Based on Herd Mentality. Energies. 2022; 15(13):4546. https://doi.org/10.3390/en15134546
Chicago/Turabian StyleHuang, Qi, Aihua Jiang, Yu Zeng, and Jianan Xu. 2022. "Community Flexible Load Dispatching Model Based on Herd Mentality" Energies 15, no. 13: 4546. https://doi.org/10.3390/en15134546