Article

Implementation of a Multiterminal Line Commutated Converter HVDC Scheme with Auxiliary Controller on South Africa’s 765 kV Corridor

Discipline of Electrical, Electronic and Computer Engineering, University of KwaZulu Natal, Durban 4001, South Africa
*
Author to whom correspondence should be addressed.
Energies 2022, 15(12), 4356; https://doi.org/10.3390/en15124356
Submission received: 21 April 2022 / Revised: 19 May 2022 / Accepted: 21 May 2022 / Published: 14 June 2022
(This article belongs to the Special Issue Smart Grid Control and Optimization)

Abstract

:
The deployment of a 765-kV transmission line on Eskom’s South African Grid marks the beginning of a new era in power industries. The integration of renewable energies by independent power producers (IPPs) leads to an infrastructural change in the stability performance of the entire grid. These developments are expected to bring about a multiterminal direct current (MTDC) system for practical implementation on this grid. Therefore, this study focuses on the dynamic response of the South African transmission grid during a system disturbance. In the carrying out of this study, the South African grid was modeled on PSCAD, and its performance was evaluated. The impact of the MTDC link on the grid’s interarea oscillation was also investigated. An additional current order controller for the MTDC link was developed, and its impact on the MTDC power transfer was analyzed. The results show a better system performance and reduced interarea power swings with the inclusion of the MTDC link.

1. Introduction

The South African economy has undergone some sustainable economic growth and increasing prosperity since their independence [1,2]; however, the electric power deficits experienced by the national grid over the last decade are becoming a big challenge [3]. These problems arise from the inadequate planning for load growth and failure to integrate new generating plants to compensate for the ever-increasing load demand. The decommissioning of aged, synchronous generators furthermore compounds these problems, making the power utilities operate the grid as close as possible to the maximum transmission capacity. Another problem faced is the weak tie-lines due to long-distance transmission, making the voltage and power control more critical with increased transmission losses. This congested transmission grid is very susceptible to voltage collapse; therefore, load shedding is often introduced to avert this risk of total system collapse [3,4,5].
Due to the abundance of coal reserves, the electricity generated in the country is mainly from fossil fuels [6,7,8]. This means of generation is well-known to be a significant contributor to greenhouse gases and plays a significant role in the depletion of the ozone layer. Renewable energy sources present a viable promising solution to a more environmentally friendly generation, transmission and even consumer side. It offers the benefit of an increase in the economic growth rate in the country. Thus, South African governments welcome the integration of renewable energy by independent power producers (IPPs) into the national grid [9,10,11]. However, renewable energy integration requires better grid code compliance and a stable transmission medium [12]. Therefore, a high-voltage direct current (HVDC) system is often used for the interlink between the source and the grid before being distributed using AC lines; some examples are the ±533 kV 1920 MW Cahora Bassa interlinking Mozambique and South Africa [13], ±800 kV 6000 MW NER-Agra Multiterminal HVDC [14], ±500 kV 4.5 GW Zhangbei VSC-HVDC Power Transmission Project [15], etc.
Both AC and DC transmissions come with their capabilities and limitations; an AC transmission allows quick and easy voltage transformation from one voltage level to another. However, its susceptibility to a cascading problem during systems disturbance makes the DC transmission system a more viable option. Other advantages of the DC transmission systems are bidirectional power controllability, enhanced system stability, reduced losses, asynchronous interconnection and reduced right of way [16,17].
The DC systems are gaining more publicity and are expected to have rapid growth in both the short and long run. Many researchers have compared their mechanisms, structures, topologies and other control measures [18]. Studies on the leveled cost, expected growth, configurations and deployment are all mentioned in [18,19]. On power system interarea oscillations, the convectional solution is by careful coordination of the generator’s power system stabilizer and the automatic voltage regulators. Other secondary controllers such as the governor are added for better reliability of these generating plants. Elizondo et al., in [20], gave comprehensive literature on the problems arising, from small signal stability to the future trend. On the South African grid, Minnaar et al., in [21], recorded different types of faults that occurred along the South African transmission network. They further conducted a reliability check of the grid based on the probabilistic fault performance parameters with respect to the season, time of day and climate. They found that most of the fault on this grid is due to bird streamers, with 38% occurrence, lightning with 26% and fires with 22%. Additionally, in [5], Corsi et al. applied a coordinated automatic real-time secondary voltage regulator (SVR) to the South African transmission grid, thereby providing improved power quality and controllability and stability to the grid. The study on the impact of the HVDC link on the South African grid during a three-phase short circuit was further carried out by Mbangula et al. [22]. This study investigated the rotor angle stability of the South African transmission grid, focusing only on a two-terminal converter technology. Oni et al. discussed the modeling of a multiterminal HVDC (MTDC) system in [23] and evaluated the performance analysis using a single machine infinite bus system and four area machine networks in [24] and [25], respectively. They found out that the MTDC network significantly improves during a system disturbance. However, those studies in the literature did not focus on the impact of a complementary controller on the MTDC link or analyze the dynamic study of the MTDC link on the South African network, especially on the 765-kV corridor. Additionally, there is limited literature on the analysis of this 765-kV corridor of the Eskom South grid. Besides, the current Line Commutated Converter (LCC) HVDC on Eskom is a ±533 kV Cahora Bassa HVDC link; therefore, it will be a novel contribution to the body of knowledge to analyze this transmission network with the usage of a MTDC scheme. Another contribution is the implementation of a complementary controller for better damping of the oscillations during fault on the AC grid.
Therefore, this study focuses on the performance evaluation of the South African transmission grid when interconnected with a three-terminal LCC HVDC system. In carrying out this study, a comprehensive dynamic system model was developed to facilitate the analysis of the system and form the basis for postulating an appropriate and optimal operating point. This research was also carried out to identify the potential usage of the MTDC network on the South African grid and investigate the performance analysis of the MTDC link and the complementary controller on the entire grid operating performance. Given the complexity of the grid network, five of the eight grids were modeled on PSCAD, and the impact of a substantial three-phase short circuit fault was analyzed on the grid elements. Synchronous damping of the oscillations, bus voltage and converter response during the steady-state and post-fault conditions are presented in this paper. Highlighted below are the contribution of this manuscript.

2. Challenges and Possibility of SA Grid

The South African power utility is one of the world’s largest electrical power utilities in Africa, covering the generation, transmission and distribution of power all over the South African region and in the neighboring Southern African region. The only DC line on this network is the 1300-km ±533 kV Cahora Bassa HVDC line that interlinks the Sango substation near the Zambezi River in Mozambique and the Apollo substation in the South African Central grid [13,26]. Other electric power transfer is mainly via long AC lines using either 756-kV, 400-kV or 275-kV transmission lines. The entire grid is characterized by long weak tie-lines and, therefore, has low Short Circuit Ratios (SCR), thus becoming a matter of necessity to analyze the various possible interaction effects between the AC and MTDC networks. At low SCR values, transient DC quantities are likely to exhibit a commutation failure, especially at the inverter AC station. Other challenges are the AC/DC interaction during overvoltage, harmonic oscillations during load shedding, converter commutation failures, low mechanical inertias, recovery during system disturbance and voltage stability [27,28,29]. Therefore, considering these effects requires careful design and control measures to appropriately fit the operational scenarios of the MTDC network incorporated into the South African grid.
The impact of cold weather during the winter season leaves the entire grid in limbo, causing different transient load demands (see Figure 1). Another finding is the exponential growth rate of the load demands in the country’s central grid. Figure 2 shows the provincial load demands during the peak season, with the Central grid standing at 10,231 MW, followed by the Eastern grid with 6160 MW at the 2017 peak load demand. Additionally, the exponential load growth in the Central grid alone is expected to record an increase of ≈5.2 GW in the year 2028, as published by Eskom in their transmission development plan (TDP 2019–2028), as shown in Table 1 [30]. While these problems may persist, the investigation into the usage of the MTDC system on this network cannot be overemphasized, as this will bring more knowledge on the reduction of active and reactive powers to losses, improved stability margins and the ease of renewable energy integration. The South African generation capacity is mainly coal-based due to the many coal reserves. Moreover, the plan to integrate an additional power of 17,800 MW of renewable energy by 2030 will require an alternative and efficient means of transmission for this renewable source that is expected to represent about 20% of the country’s installed capacity.

3. Network Modeling

The South African grid is divided into seven geographical operating units consisting of generation, transmission and a distribution network. In the carrying out of this study, six out of the eight grids were modeled with transmission voltage levels of 765 kV and 400 kV, as shown in Figure 3. The networks used are the Northern, Central, North-West, Southern and Western grids. Table A1 in the Appendix A highlights the generators used and their respective installed capacities.
The synchronous generator control model consists of the IEEE Type AC4A alternator-supplied rectifier excitation system and a single input power system stabilizer (PSS1A) to control the generator stator voltage. Three network configurations were considered. The first configuration explores the steady-state analysis of the network without the inclusion of the MTDC network; the second scenario analyses the impact of the MTDC on the network. The third network implements an auxiliary complementary controller to generate a new DC current order (Idcnew) for the MTDC link. Details and diagrams of the excitation systems and the PSS used were well-explained in [24]. A performance analysis was carried out on PSCAD/EMTDC. This simulation tool was used for its best electromagnetic transient studies and because its main application is in the implementation of the AC/DC network.

3.1. MTDC Link with Complementary Controller

The MTDC system used in this study is a three-terminal LCC HVDC link with two rectifiers and one inverter, as shown in Figure 4. LCC HVDC system was utilized due to its advantage over VSC HVDC for long-distance and bulk power transfer. It also has excellent overcurrent capability, with well-established technology and robust devices, as well as a proven circuit. Furthermore, from the research carried out by Minnaar et al. in [21], the South African transmission grid has long-distance transmission lines and is prone to overhead line faults. Therefore, a LCC HVDC system is preferred in these applications because of its resilience to DC-side short-circuit faults. The LCC HVDC system can also operate well during a low DC voltage and DC fault [31].
The first rectifier used in this study is connected at the MAT_PS substation at a distance of 1540 km from the inverter station at Hera Substation. The second rectifier is connected at the KOE_PS substation with a 540-km distance interval from the inverter station. Both rectifiers export power to the Hera substation in the Central grid.
The configurations used for the MTDC controller were addressed in [23], with adjustments made to the Proportional and Integra (PI) voltage-dependent current order limiter (VDCOL) and the overall power controller to obtain the desired VI characteristics. The two rectifier stations are in current control mode and, thus, commutate by varying the firing angle α or by controlling the AC voltage by using on-load tap changers (OLTC). The inverter station defines the voltage level of the entire MTDC link. The defining of the voltage level is done with the extinction angle of γ = γo control. The maximum value (γmax) is preselected from the constant extinction angle (γo) and the measured γmeas, which, when subtracted from pi, gives the firing angle (αI) for the inverter station (data in Table A2 in Appendix A). The data for this controller has been provided in Table A3 in Appendix A.
An additional supplementary controller is added for a better DC power control during system disturbances. This auxiliary controller uses the measured differential changes in the AC power to generate the additional DC current for the three converters. The DC current (Idc) is then added to Iord from the overall current controller.

3.2. Transmission Line Data

The tower geometric configuration used for the transmission line modeling is shown in Figure 5a,b. The parameters are shown in Table A4 in the Appendix A.

3.3. Converter Harmonic Filter Design

The first filter used for the converter design is the C-type filter in Figure 6a. The design is a second-order filter with a minimum power loss at the fundamental frequency (f). This capability is due to the parallel RLC configuration, which further resonates at the fundamental frequency. Thus, the fundamental current transferred through the damping resistors is significantly reduced. Additionally, this type of filter accomplished the further suppression of high-frequency harmonics due to the inherent flat impedance characteristic above the tuned frequency. The second filter is the high-pass filter capable of suppressing fifth-order harmonic currents (Figure 6b). The branch impedance of this filter decreases with the increasing frequency. Losses are minimized in this type of filter with a higher resistance.
The parameters for these filters are determined using Equations (1)–(6) [32], and the parameters are indicated in Table A5 in the Appendix A.
C = Q c 2 π f V 2
L = V 2 2 π f Q c ( h o 2 1 )
C 1 = Q c 2 π f h V 2 ( h 2 1 )
R 1 = q V 2 h Q c
Z = ( 1 R + 1 j w L ) 1
q = R 2 π f L
where h is the harmonic order, Qc is the filter reactive power, V is the system voltage, w is the natural frequency and q is the quality factor. C and C1 are the series and common capacitance, respectively, f is the fundamental frequency, L is the inductance, Z is the total impedance and R and R1 are the series and parallel resistance, respectively.

4. MTDC Controller Setup

4.1. Rectifier Controller

The rectifier side of the LCC_HVDC system is controlled using the current control strategy, as shown in Figure 7. The rectifier controls the current on the DC side. The VDCOL is employed to limit the DC current order. The DC current deviation between the DC current order and the DC filter current is used to generate the rectifier’s adjustment signal, i.e., firing angle. The control principle of the rectifier controller is derived as
a r e c t = π ( K p _ r e c + K i _ r e c t s ) ( I o r d I d c _ f i l t e r )
where Kp_rect and Ki_rect are the proportional and integral gains of the DC current controller of the rectifier.

4.2. Inverter Controller

The inverter side of the LCC-HVDC system is controlled using the constant extinction angle control strategy. A block diagram of the constant extinction angle control strategy is depicted in Figure 7. Based on the deviation of the measured firing angle ( γ m e a s ) from the reference firing angle ( γ 0 ), the adjustment signal ( a i n v ) is generated by a PI-based controller. The control principle of the constant extinction angle control strategy for the inverter is given in Equations (8)–(10):
a i n v = max ( a γ , a i d c )
a γ = π ( K p _ γ + K i _ γ s ) ( γ 0 γ m e a s + C E C )
a i d c = π ( K p _ i d + K i _ i d s ) ( I o r d I d c + I m a r g i n )
where Kp_y and Ki_y are the proportional and integral gains of the constant extinction angle controller, K_id and Ki_id are the proportional and integral gains of the DC current controller, CEC is the current error control that drives the DC current control and extinction angle control and Imargin is the margin current for the DC side of the inverter that is usually zero. When there is a voltage drop resulting from a disturbance or fault, the firing angle is increased, which causes a significant deviation that may lead to instability. During this period, the constant extinction controller will reduce the adjustment signal to control the downward ramping of the DC voltage until it becomes stable.

4.3. Supplementary Controller

To improve the performance of the DC power controller, a supplementary (auxiliary) controller is proposed. The proposed controller uses the measured deviation of the AC side’s active power to generate a new current reference for the rectifier and inverter of the LCC-HVDC system, as shown in Figure 8. The control principle of the auxiliary control is based on the fourth-order lead–lag compensator that is derived as
I d c _ n e w = I o r d G 4 1 + sT 5 · N V d c
where
N = G 1 ( sT 1 ) 1 + sT 1 · G 2 ( 1 + sT 2 ) 1 + sT 3 · G 3 1 + sT 4 · Δ P
where G1, G2, G3 and G4 are the gains of the compensator, while T1, T2, T3, T4 and T5 are the time constants of the compensator.
The overall power controller shown in Figure 9 helps to generate the current order for the three converters. It also helps to balance the power and current order of the entire converter by ensuring that the DC current summation across the converters equals zero (∑Idc = 0).

5. Simulation Result

The grid was modeled on PSCAD/EMTDC, and the system’s response was evaluated following a 270-ms three-phase fault on the transmission lines between Hera and Grootvlie (He_Gr) substations. The fault was applied (10%) to the transmission line from the Grootvlie bus. The type of fault was carried out following different scenarios of fault analysis on the system. It was found that this fault location produced the most critical clearing time for the entire network. Therefore, the system’s response during this particular system disturbance was used as the base case.
The generator power output, rotor angle, generator speed and bus voltage were presented graphically on a subplot during the dynamic analysis. Following this severe disturbance at the He_Gr transmission line at t = 2 s simulation time, a 20-μs solution time and 100-μs channel plot step were used to compute the results. The parameter depicted on a subplot was for a better illustration of the system performance before, during and after the disturbance. The DC power, voltage and the firing angle for the converters were illustrated on a plot. For the synchronous generator plot, MED_PS and MAT_PS were chosen to represent the Northern grid generating plant and GRT_PS, KRIE_PS and TUT_PS were selected to represent the North-East grid, while KOE_PS and ANK_PS represent the generators from the Western grid. Furthermore, a strategic busbar was chosen from the main generating substation for the bus voltage to evaluate the voltage profile.
The dynamic stability response of the network with and without the MTDC network is given in Figure 10, Figure 11, Figure 12, Figure 13, Figure 14, Figure 15 and Figure 16. 
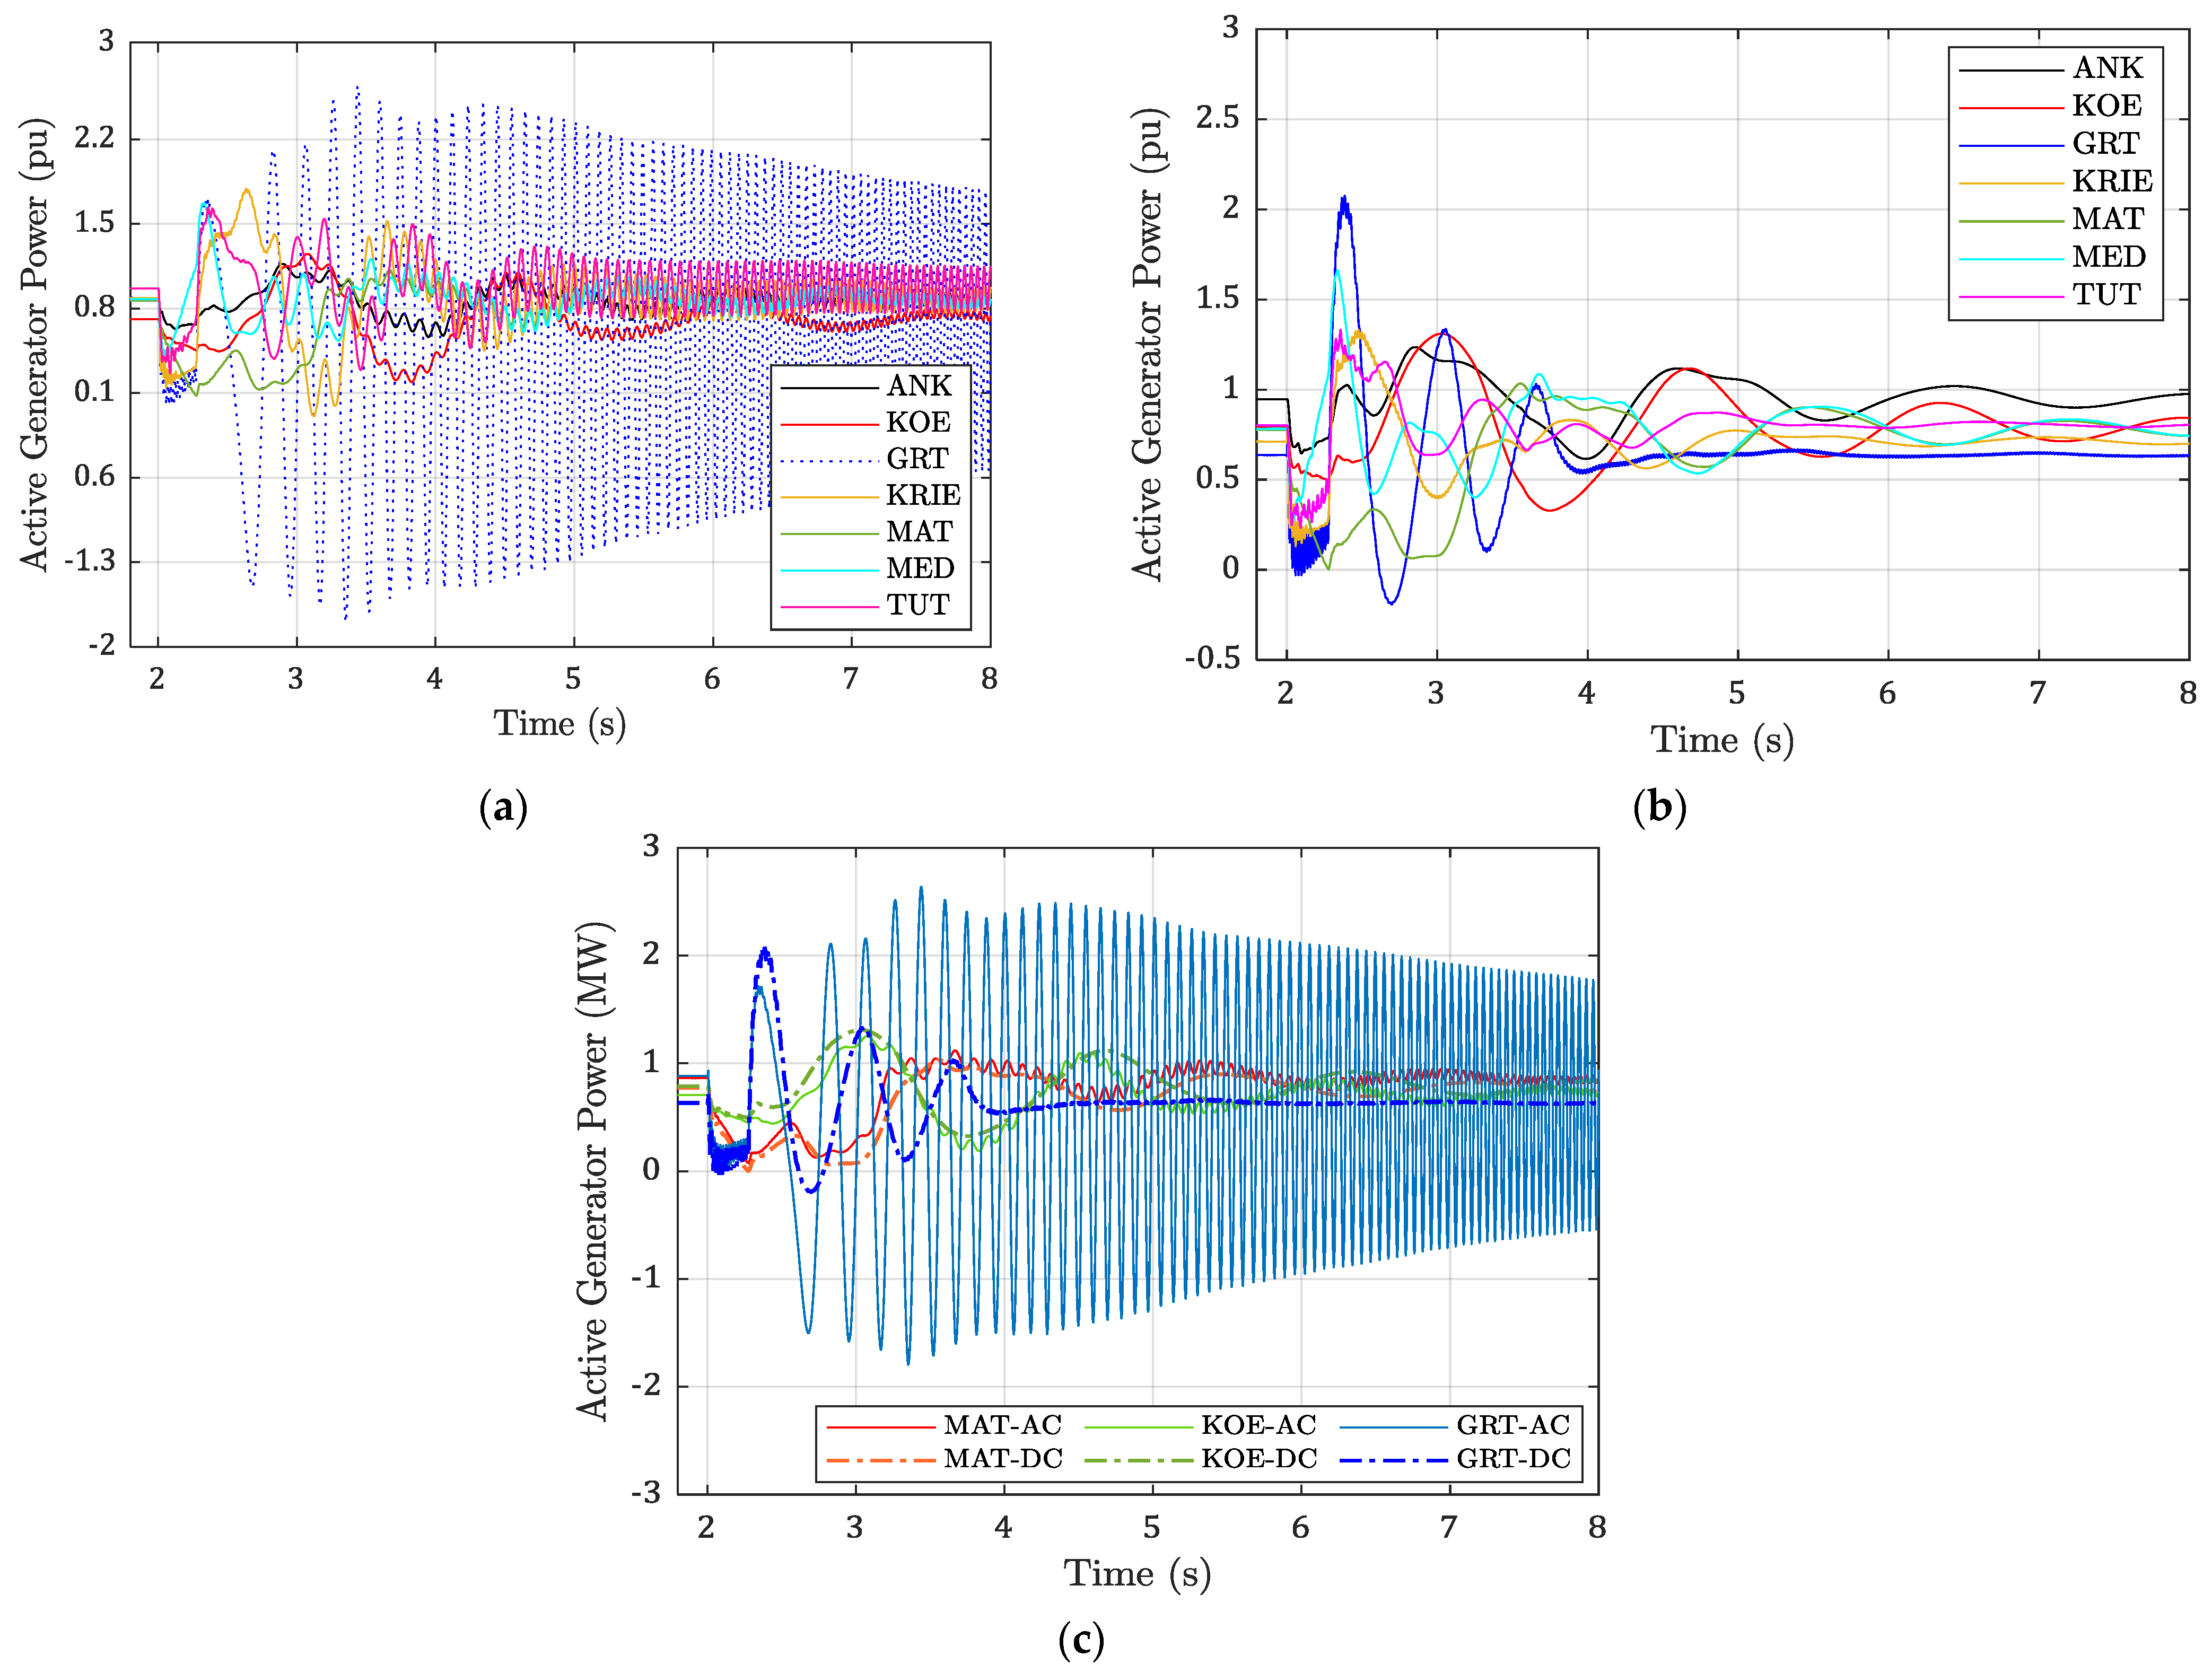
Figure 10a,b depict the generator active power plots without and with a MTDC link. Each generator power supply is represented on a per unit (pu) scale on these plots. The combination of both scenarios is shown in Figure 10c. The GRT_PS is already out of step on this plot, with its active power swinging between ≈±2 pu values. The results in Figure 12a with GRT_PS, a generating plant at the North-East grid, has proximity to the short circuit’s fault. Thus, the generator loses synchronism during the first swing. Since a disturbance applied to the network has the critical clearing time of the system, the results showed that, following the disturbance, the first swing in the rated active power in the line has a larger amplitude of 2 pu. However, other generating plants were able to maintain stability with a very poor damping factor causing an interarea oscillation, especially at the Western grid. This impact can be observed in the oscillations shown in Figure 11a. However, following the same disturbance with the MTDC system, the results in Figure 11b show that positive damping has been added to the generators’ oscillations on the network. Therefore, implementing the MTDC model on the grid provided a better performance than the first case study. MAT_PS and GRT_PS with the worst post-fault conditions were able to maintain a stable operating point after the third cycle.
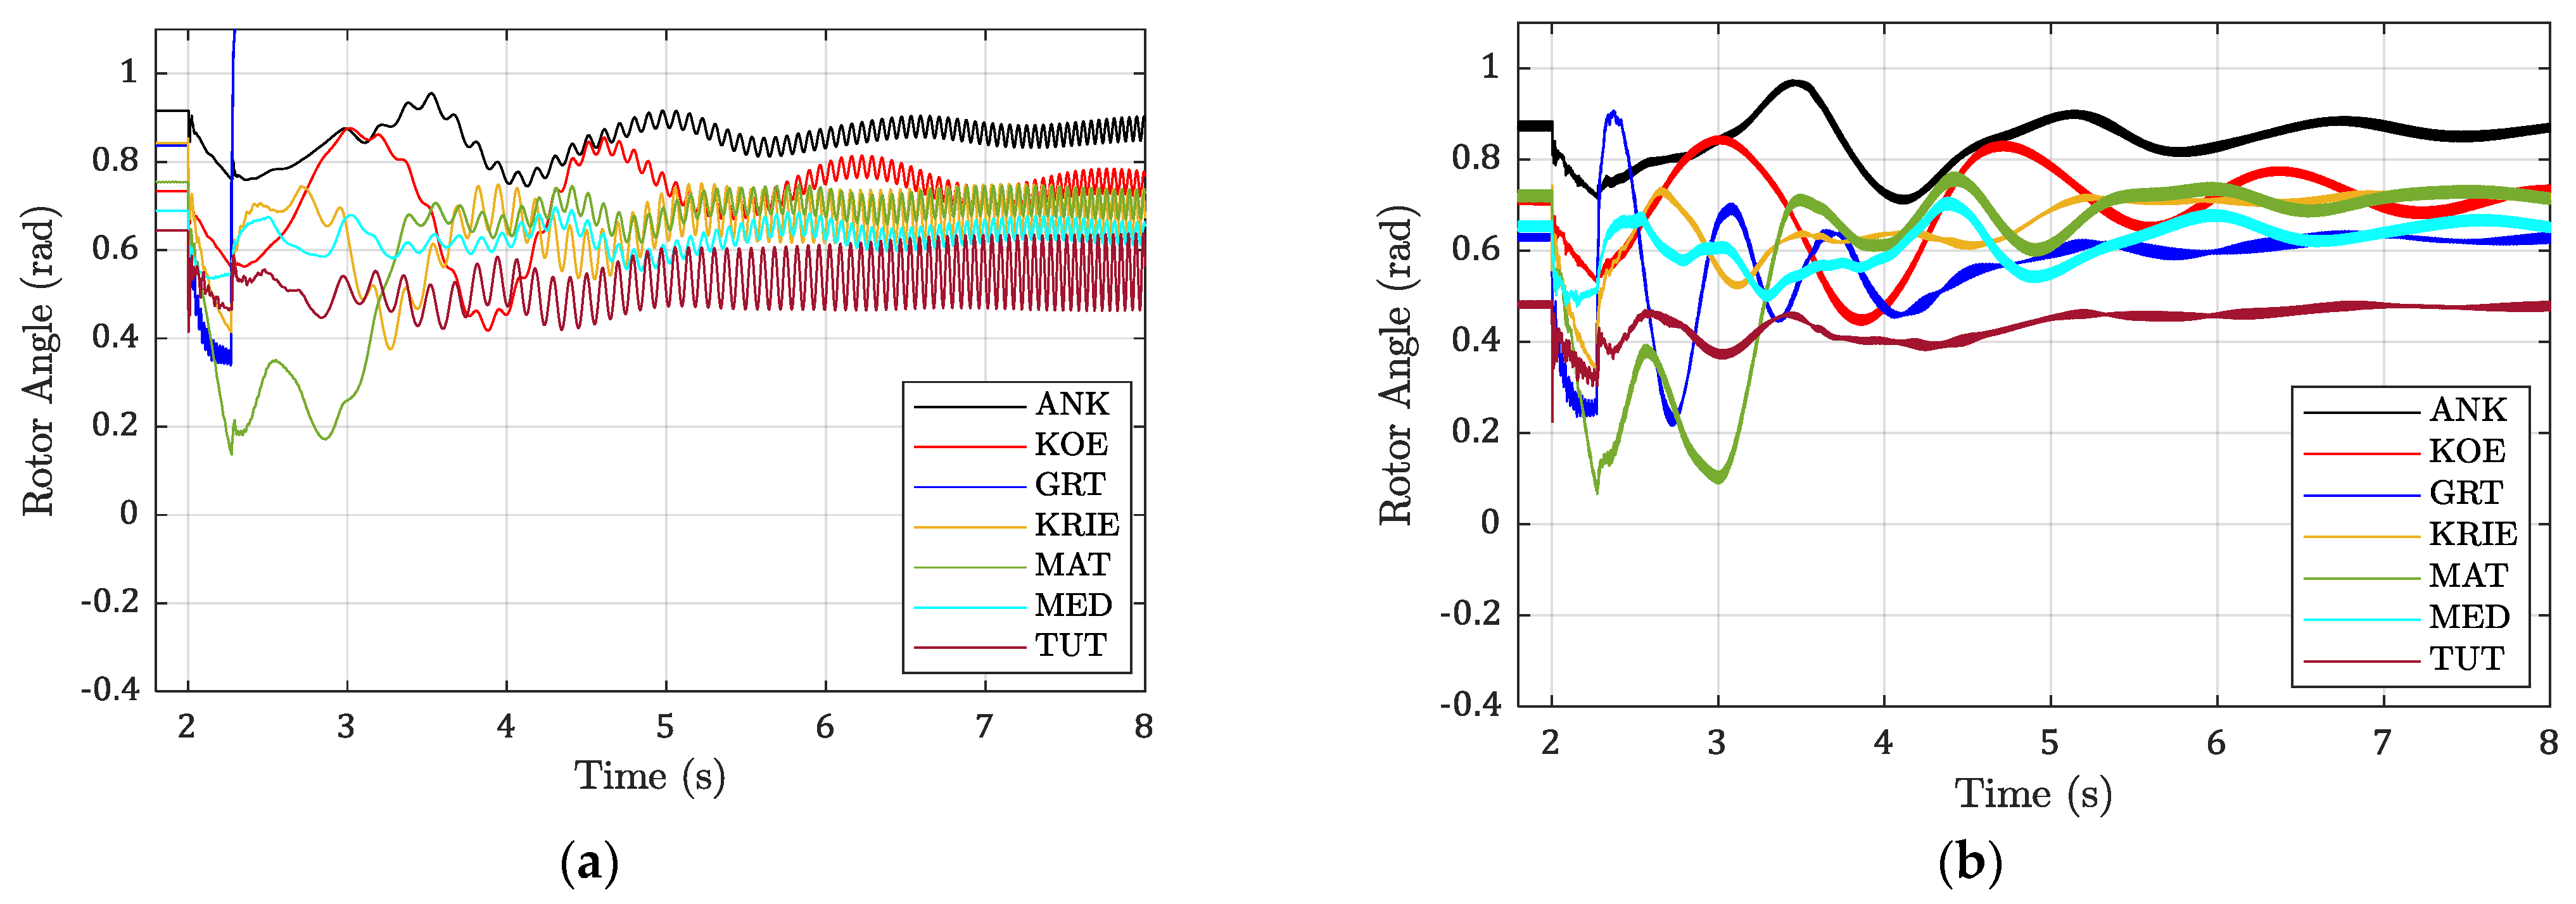
Figure 11a,b show the generator rotor angle (δ) dynamics in radian. In Figure 11a, the GRT_PS synchronous generator was out of step from the rest of the synchronous machine. It recorded a rapid increase in the rotor angle, while other generators witnessed a steady increase with the continuous oscillation.
These generators, having yielded their excitation and AVR controls, remained unstable even after clearing the fault due to insufficient decelerating torque to reduce the rotor speed, i.e., the generators exhibited positive damping (TD) torque but with a negative synchronizing torque (TS), causing a non-oscillatory instability. The unstable state involving the rotor angle speed is usually referred to as electromechanical oscillations. The control systems are intended to restore the power system to stable conditions and to align the mechanical torque with the electromagnetic torque of each generator, thereby ensuring the stability of the rotor speeds and that of the rotor angles. The inclusion of the MTDC link on the network enhanced the stability condition, as seen in Figure 11b. The generators experienced few rotor angle oscillations but were able to maintain a stable post-fault condition when the fault was cleared. The turbine governor adjusts the mechanical torque, and the voltage regulator tries to restore the voltage. The first oscillation of the rotor angle is of interest, which may indicate whether or not the generator would remain synchronized. The second observation on these plots is the interarea oscillations between the Northern grid generators (MED_PS and MAT_PS) and the Western Gird generators (ANK_PS and KOE_PS). These interarea swings are due to the long and weak transmission lines of the two grids.
The generator angular speed response is shown in Figure 12a,b. In the first plot (without the MTDC link), GRT_PS recorded a sharp angular acceleration up to 1.033 pu at the time t = 2.34. The generator’s post-fault condition experienced unexpanded kinetic energy, resulting in a continuous increase of the rotor speed and, thus, led to a loss of synchronism. Other generators were in stable condition but with insufficient damping torque. Figure 12b shows a better generator speed with quickly damped oscillations. The rotor angle eventually settled on a normalized new reference value. However, MAT_PS and MED_PS had the worst post-fault conditions.
A specific busbar was selected and monitored for voltage profile variation. Figure 13a,b show this voltage profile without and with the MTDC link, respectively. GRT bus has the lowest dip of 0.16 pu in Figure 13a,b. These dips occurred due to high fault impedance generated from the fault proximity. It is followed by KRIE bus and TUT bus, accordingly. Additionally, the system without the inclusion of MTDC in Figure 13a experienced high-voltage oscillations between the range of 0.7–1.1 pu. The dynamic voltage response in Figure 13b with the implementation of the MTDC link shows a steady and stable post-fault condition. However, the MED busbar recorded the worst post-voltage profile due to the high impedance of the line from the generator to the load.
Finally, the firing angle for the converters is shown in Figure 14. The pre-fault values were 29.75°, 21.97° and 150.21° for rectifier 1, rectifier 2 and the inverter station, respectively. Additionally, the DC power is shown in Figure 15 following a three-phase short-circuit fault on the Gr_He transmission line. The plot shows the converters’ DC power with and without a supplementary controller. This analysis evaluated the contributional impact of the supplementary controller on the active power transfer across the multiterminal converters. At simulation time 
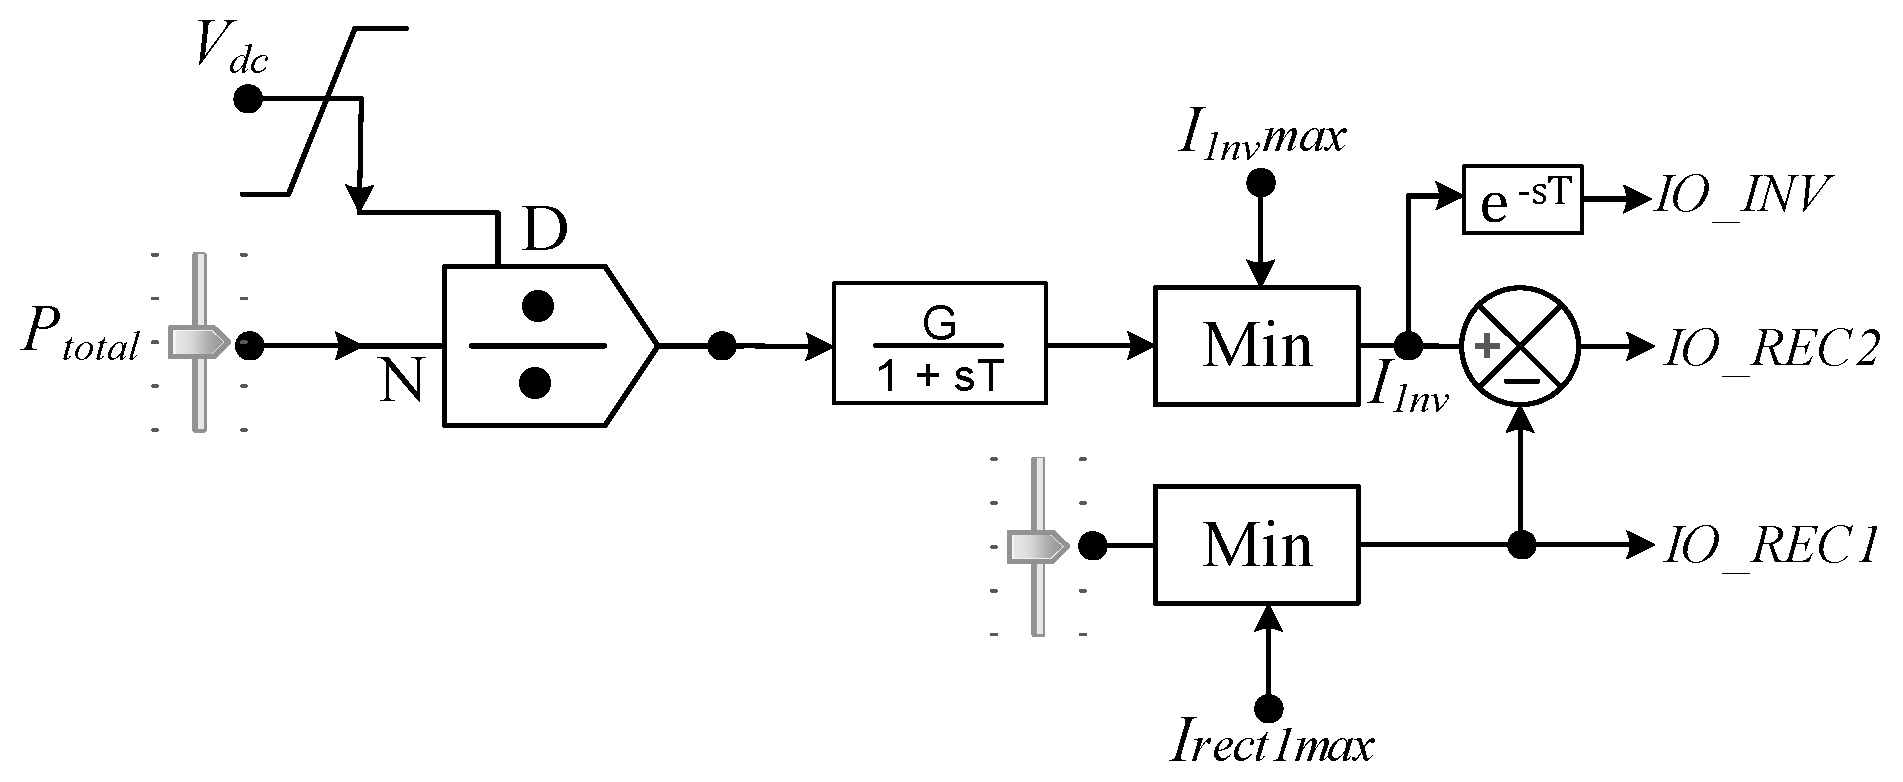
t = 2 s, the power transfer dips to −8 MW, meaning a reverse transfer into the rectifier link. However, with the VDCOL, the corresponding lower voltage of 0.1 pu is selected, reducing the excessive fault current transfer into the inverter station.
The subsequent power oscillation is limited by the action of the VDCOL and the inverter extinction angle controller, where the mode shifts between the voltage and the current controller during the fault. The supplementary controller produces better power oscillation damping for the MTDC link. Rectifiers 1 and 2 and auxiliary inverter power (ARP1, ARP2 and AIP) showed more significant damping than rectifiers 1 and 2 and the inverter (RP1, RP2 and IP) without the additional controller. The voltage level of the converter is a pu of 600 kV. The DC voltage is subject to the VDCOL controller and depends on the OLTC of the converter transformer. The proper settings of these two controllers see minimum post-fault voltage oscillations.
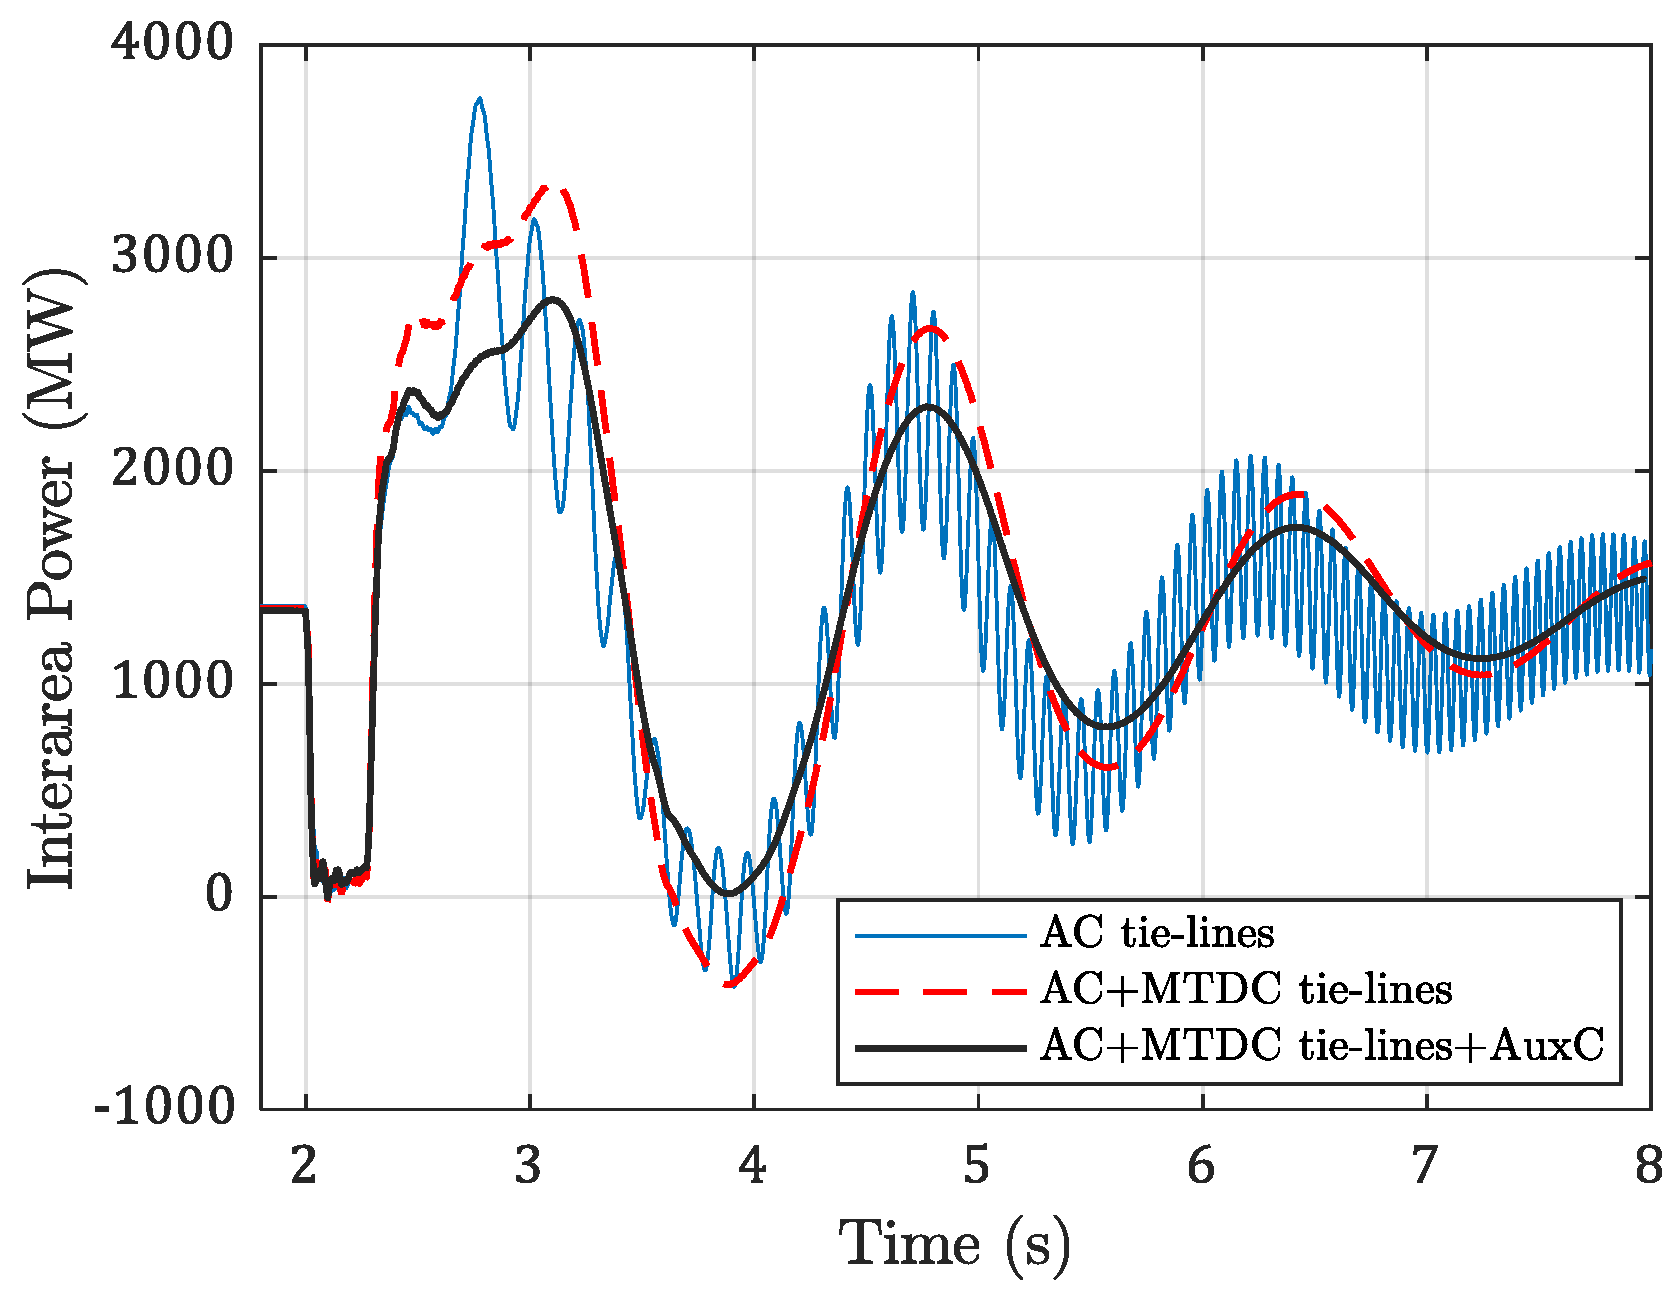
Figure 16 shows the interarea power transfer between the transmission line linking the North-East and the Central grids. The transmission lines considered for the first scenario are Merc_Herm, Merc_Mid and Grt_Hera. In contrast, during the second scenario, the interarea power transfer corresponds to the power across the AC lines (Merc_Herm, Merc_Mid and Grt_Hera), plus the DC power across the rectifier 1 station. This plot shows the impact of the negatively damped torque (Td) during the first scenario. With very poor damping, the active power underwent a post-fault harmonic and was thus unable to meet the steady operating condition. The implementation of the MTDC link provided an enhancement in the damping of the interarea power oscillations, as the network recorded a significant positive damping torque, thus providing a more stable post-fault condition. The impact of the supplementary controller on the damping of the interarea power during the disturbance is also shown on this plot.

6. Conclusions

The detailed response of South Africa’s transmission grid during a dynamic RMS simulation was presented in the paper. Additionally, the benefits of implementing a +600-kV three-terminal line commutated converter link were compared on the network’s voltage, interarea oscillation and rotor angle stability. The initial response during a system disturbance showed the loss of a synchronizing effect from both the AVR and PSS, which caused the generator to lose synchronism with subsequent oscillations. A negative damping torque for the rotor angle and negative synchronizing torque for the interarea oscillations was observed during the first scenario. While GRT_PS was already out of step, the other generators experienced a harmonic power oscillation amplitude as a continuous increase in the rotor angle degree. Additionally, the additional impedance added to the system, which resulted in a more weakened grid strength due to weak tie-lines, generated some harmonics responses in the voltage profile. The modeling of the MTDC link on the grid provided a better system performance, because the MTDC controller provided a robust and enhanced improvement for the AC network. The results further showed that positive damping was added to the inertial swing mode of all the generators and the interarea oscillations. Thus, they showed the benefits of incorporating an MTDC link into a weak AC grid.
The voltage profile was significantly improved and so was the minimization of the generator oscillations. Among all the benefits, the power carrying capacity at a reduced loss stood out. Therefore, the study provided the significant knowledge needed to implement an LCC MTDC link with complementary controllers on the South African network. Adopting this research into the network grid thus helped reduce the transmission losses with an enhanced system stability margin. Finally, the auxiliary controller should be considered, as it showed a good potential for the mitigation of an excessive active power dip of the MTDC link during the system disturbance.

Author Contributions

Conceptualization, O.O., A.S. and R.P.C.; methodology, O.O., A.S. and R.P.C.; software, O.O.; validation, O.O., R.P.C., A.S. and A.A.; formal analysis, O.O. and A.A.; investigation, O.O.; writing—original draft preparation, O.O., A.S., R.P.C. and A.A.; writing—review and editing, O.O., A.S., R.P.C. and A.A.; visualization, O.O.; supervision, A.S. and R.P.C.; project administration, A.S. and R.P.C. and funding acquisition, A.S. and R.P.C. All authors have read and agreed to the published version of the manuscript.

Funding

This research study received no external funding. The APC was funded by the University of KwaZulu Natal (UKZN) Centre for Power and Energy Systems and UKZN Research and Postgraduate Supports.

Informed Consent Statement

Not applicable.

Acknowledgments

The authors acknowledge the facility support from UKZN Centre for Power and Energy Systems.

Conflicts of Interest

The authors declare no conflict of interest.

Appendix A

Table A1. Synchronous generator.
GeneratorInstalled Capacity (MW)
Med_PS2000
Mat_PS3000
Krie_PS1770
Tut_PS700
Koe_PS2300
Ank_PS2000
Grt_PS600
Table A2. Multiterminal high-voltage direct current data.
ParameterRectifier 1Rectifier 2Inverter
Rated power (MW)200020004000
DC current (kA)0.890.6771.57
α for rectifier, γ0 for inverter14.81815
Transformer per 6 pulse thyristor
Rating (MVA)100010002000
Voltage AC/DC (kV)400/600400/600400/600
Leakage reactance (pu)0.180.180.18
PI Controller
Proportional Gain1.09891.53631.5363
Integral time constant (s)0.010920.015240.01524
VDCOL
Threshold input0.4–1.00.4–0.90.4–0.9
Threshold output0.55–1.50.55–1.00.55–1.0
Table A3. Auxiliary controller.
GainTime Constant
T1T2T3T4T5
G1110 s
G20.25 0.6 s0.22 s
G31 0.012 s
G41 0.12 s
Table A4. AC transmission line data.
400 kV Line765 kV Line
No of sub conductor46
Bundle spacing0.380.32 m
DC-resistance Ohm/m0.06740.0718
GMR (Equivalent radius)11.569.04 mm
Outer diameter28.6227 mm
Table A5. Filter design.
AC filterRectifier 1Rectifier 2Inverter
C-type Filter
C4.001.985.50
C142.0221.8058.00
L0.2420.460.173
R51.5100.736.79
Rp100100100
High Pass Filter
R80 Ω7380
C3.9 μf1.54
L0.0232 H0.0580.023
Table A6. MTDC transmission line (T-model) data.
R (Ω)L (H)C (μF)
Rectifier 1 to Inverter14.500.6126
Rectifier 2 to Inverter5.400.5826

References

  1. Du Plessis, S.; Smit, B. Economic Growth in South Africa since 1994; Stellenbosch University: Stellenbosch, South Africa, 2006. [Google Scholar]
  2. Lundahl, M. Growth or Stagnation: South Africa Heading for the Year 2000; Routledge: London, UK, 2019. [Google Scholar]
  3. Wright, J.G.; Calitz, J.R. Setting up for the 2020s: Addressing South Africa’s Electricity Crises and Getting Ready for the Next Decade; Version 1.1; CSIR: New Delhi, India, 2020. [Google Scholar]
  4. Molepo, J. Blackout: The Eskom Crisis, James-Brent Styan: Book review. J. Public Adm. 2018, 53, 795–798. [Google Scholar]
  5. Corsi, S.; De Villiers, F.; Vajeth, R. Secondary voltage regulation applied to the South Africa transmission grid. In IEEE PES General Meeting; IEEE: Piscataway, NJ, USA, 2010; pp. 1–8. [Google Scholar]
  6. Gilani, I.H.; Amjad, M.; Khan, S.S.; Khan, I.; Larkin, S.; Raw, B.; Abbas, Z. PEMFC application through coal gasification along with cost-benefit analysis: A case study for South Africa. Energy Explor. Exploit. 2021, 39, 1551–1587. [Google Scholar] [CrossRef]
  7. Adeleke, O.; Akinlabi, S.A.; Jen, T.-C.; Dunmade, I. Sustainable utilization of energy from waste: A review of potentials and challenges of Waste-to-energy in South Africa. Int. J. Green Energy 2021, 18, 1550–1564. [Google Scholar] [CrossRef]
  8. Uhunamure, S.E.; Shale, K. A SWOT analysis approach for a sustainable transition to renewable energy in South Africa. Sustainability 2021, 13, 3933. [Google Scholar] [CrossRef]
  9. Longe, O.M.; Myeni, L.; Ouahada, K. Renewable Energy Solution for Electricity Access in Rural South Africa. In Proceedings of the 2019 IEEE International Smart Cities Conference (ISC2), Casablanca, Morocco, 14–17 October 2019; IEEE: Piscataway, NJ, USA, 2019; pp. 772–776. [Google Scholar]
  10. Calitz, J.R.; Wright, J.G. Statistics of Utility-Scale Solar PV, Wind and CSP in South Africa in 2018; CSIR: Pretoria, South Africa, 2019. [Google Scholar]
  11. Larmuth, J.; Cuellar, A. An updated review of South African CSP projects under the renewable energy independent power producer procurement programme (REIPPPP). In AIP Conference Proceedings; AIP Publishing LLC: Melville, NY, USA, 2019; Volume 2126, p. 040001. [Google Scholar]
  12. Al-Shetwi, A.Q.; Hannan, M.; Jern, K.P.; Mansur, M.; Mahlia, T. Grid-connected renewable energy sources: Review of the recent integration requirements and control methods. J. Clean. Prod. 2020, 253, 119831. [Google Scholar] [CrossRef]
  13. Goosen, P.; Reddy, C.; Jonsson, B.; Holmgren, T.; Saksvik, O.; Bjorklund, H. Upgrade of the Apollo HVDC converter station. In Proceedings of the 6th Southern Africa Regional Conference, Capr Town, South Africa, 17–21 August 2009; Citeseer: University Park, PA, USA, 2009; pp. 1–6. [Google Scholar]
  14. Barman, S.; Paul, A.R.; Bahirat, H.J. Control strategy for ±800 kV 6000 MW NER-Agra Multi-Terminal HVDC Project. In Proceedings of the 2018 20th National Power Systems Conference (NPSC), Tiruchirappalli, India, 14–16 December 2018; IEEE: Piscataway, NJ, USA, 2018; pp. 1–6. [Google Scholar]
  15. Pang, H.; Wei, X. Research on key technology and equipment for Zhangbei 500 kV DC grid. In Proceedings of the 2018 International Power Electronics Conference (IPEC-Niigata 2018-ECCE Asia), Niigata, Japan, 20–24 May 2018; IEEE: Piscataway, NJ, USA, 2018; pp. 2343–2351. [Google Scholar]
  16. Oni, O.E.; Davidson, I.E.; Mbangula, K.N. A review of LCC-HVDC and VSC-HVDC technologies and applications. In Proceedings of the 2016 IEEE 16th International Conference on Environment and Electrical Engineering (EEEIC), Florence, Italy, 7–10 June 2016; IEEE: Piscataway, NJ, USA, 2016; pp. 1–7. [Google Scholar]
  17. Reed, L.; Morgan, M.G.; Vaishnav, P.; Armanios, D.E. Converting existing transmission corridors to HVDC is an overlooked option for increasing transmission capacity. Proc. Natl. Acad. Sci. USA 2019, 116, 13879–13884. [Google Scholar] [CrossRef] [Green Version]
  18. Alassi, A.; Bañales, S.; Ellabban, O.; Adam, G.; MacIver, C. HVDC transmission: Technology review, market trends and future outlook. Renew. Sustain. Energy Rev. 2019, 112, 530–554. [Google Scholar] [CrossRef]
  19. Oni, O.E.; Davidson, I.E. Technical performance and cost analysis of a 600 kv HVDC link on South Africa’s EHV network. In Proceedings of the 2017 IEEE PES PowerAfrica, Accra, Ghana, 27–30 June 2017; IEEE: Piscataway, NJ, USA, 2017; pp. 88–94. [Google Scholar]
  20. Elizondo, M.A.; Fan, R.; Kirkham, H.; Ghosal, M.; Wilches-Bernal, F.; Schoenwald, D.; Lian, J. Interarea oscillation damping control using high-voltage dc transmission: A survey. IEEE Trans. Power Syst. 2018, 33, 6915–6923. [Google Scholar] [CrossRef]
  21. Minnaar, U.; Gaunt, C.; Nicolls, F. Characterisation of power system events on South African transmission power lines. Electr. Power Syst. Res. 2012, 88, 25–32. [Google Scholar] [CrossRef]
  22. Mbangula, K.; Davidson, I.; Tiako, R. Improving power system stability of South Africa’s HVAC network using strategic placement of HVDC links. CIGRE Sci. Eng. J. (CSE) 2016, 5, 71–78. [Google Scholar]
  23. Oni, O.E.; Swanson, A.G.; Carpanen, R.P. Modelling and control of multiterminal LCC HVDC. In Proceedings of the 2018 IEEE PES/IAS PowerAfrica, Cape Town, South Africa, 28–29 June 2018; IEEE: Piscataway, NJ, USA, 2018; pp. 274–279. [Google Scholar]
  24. Oni, O.E.; Swanson, A.G.; Carpanen, R.P. Impact of LCC–HVDC multiterminal on generator rotor angle stability. Int. J. Electr. Comput. Eng. 2020, 10, 22. [Google Scholar] [CrossRef]
  25. Oni, O.E.; Swanson, A.G.; Carpanen, R.P. Small signal stability analysis of a four-machine system with placement of multiterminal high voltage direct current link. J. Energy South. Afr. 2020, 31, 73–87. [Google Scholar] [CrossRef]
  26. Oni, O.E.; Davidson, I.E. Harmonic distortion of LCC-HVDC and VSC-HVDC link in eskom’s cahora bassa HVDC scheme. In Proceedings of the 2016 IEEE International Conference on Renewable Energy Research and Applications (ICRERA), Birmingham, UK, 20–23 November 2016; IEEE: Piscataway, NJ, USA, 2016; pp. 484–489. [Google Scholar]
  27. Ndwandwe, B.; Akuru, U.B.; Ramphele, L.; Thango, B.A.; Memane, N.P.; Okoro, O.I. Power Transformer Design Implementation for Large-Scale Solar Power Plant Grid Integration. In Proceedings of the 2021 International Conference on Electrical, Computer and Energy Technologies (ICECET), Cape Town, South Africa, 9–10 December 2021; IEEE: Piscataway, NJ, USA, 2021; pp. 1–5. [Google Scholar]
  28. Madiba, T.; Bansal, R.; Mbungu, N.; Bettayeb, M.; Naidoo, R.; Siti, M. Under-frequency load shedding of microgrid systems: A review. Int. J. Model. Simul. 2022, 42, 653–679. [Google Scholar] [CrossRef]
  29. Adebiyi, A.A.; Lazarus, I.J.; Saha, A.K.; Ojo, E.E. An Experimental Analysis of the Impact of a Grid-Tied Photovoltaic System on Harmonic Distortion. In Proceedings of the International Conference on Power Electronics and Renewable Energy Systems; Springer: Berlin/Heidelberg, Germany, 2022; pp. 431–444. [Google Scholar]
  30. Eskom. The Eskom Transmission Development Plan (2019–2028). Available online: http://www.eskom.co.za/Whatweredoing/TransmissionDevelopmentPlan/Pages/Transmission_Development_Plans.aspx (accessed on 25 October 2018).
  31. Jovcic, D. VSC HVDC Applications and Topologies, Performance and Cost Comparison with LCC HVDC. In High Voltage Direct Current Transmission; John Wiley & Sons, Inc.: Hoboken, NJ, USA, 2019; Chapter 12; pp. 137–163. [Google Scholar]
  32. PSCAD. Passive Filter Design. Available online: https://www.pscad.com/webhelp/ol-help.htm#Opening_Screen.htm (accessed on 20 April 2022).
Figure 1. Impact of the load demand during the winter season.
Energies 15 04356 g001
Figure 2. South African provincial load demand [30].
Energies 15 04356 g002
Figure 3. Extract of the South African grid.
Energies 15 04356 g003
Figure 4. Three-terminal LCC HVDC topology.
Energies 15 04356 g004
Figure 5. Tower geometry for the overhead lines: (a) 400-kV geometry and (b) 765-kV geometry.
Energies 15 04356 g005
Figure 6. (a) C-type filter, (b) high-pass filter and (c) capacitor bank.
Energies 15 04356 g006
Figure 7. Current and voltage controller.
Energies 15 04356 g007
Figure 8. Auxiliary controller.
Energies 15 04356 g008
Figure 9. Overall power controller.
Energies 15 04356 g009
Figure 10. Active power for the synchronous generator (a) without the MTDC link, (b) with the MTDC link and a (c) comparative plot of the active power of three generators in each grid.
Energies 15 04356 g010
Figure 11. Rotor angle for the synchronous generator (a) without the MTDC link and (b) with the MTDC link.
Energies 15 04356 g011
Figure 12. Angular speed for the synchronous generator (a) without the MTDC link and (b) with the MTDC link.
Energies 15 04356 g012
Figure 13. Bus voltage profile (a) without the MTDC link and (b) with the MTDC link.
Energies 15 04356 g013
Figure 14. Firing angle in deg.
Energies 15 04356 g014
Figure 15. MTDC power where RP1 is rectifier 1 power, and ARP1 is rectifier 1 power with the auxiliary control.
Energies 15 04356 g015
Figure 16. Interarea power transfer across the northern and north-east borders.
Energies 15 04356 g016
Table 1. Load progression in the Central grid.
YearZonal DemandGrid Peak
West RandJohannesburgEast RandVaal
2019374936003248183811,439
2020384136873314195711,751
2021396637943476197212,204
2022411338323579200612,634
2023421338963629202512,901
2024433439663717206313,299
2025450841413813209313,702
2026472142673889211114,033
2027494243983985213514,547
2028513845424100216515,057
Publisher’s Note: MDPI stays neutral with regard to jurisdictional claims in published maps and institutional affiliations.

