Article

Experimental Study on the Microstructure of Coal with Different Particle Sizes

1
Institute of Environmental and Bioengineering, Henan University of Engineering, Zhengzhou 451191, China
2
Institute of Resources and Environment, Henan Polytechnic University, Jiaozuo 454000, China
3
Institute of Geosciences and Engineering, North China University of Water Resources and Electric Power, Zhengzhou 450046, China
*
Author to whom correspondence should be addressed.
Energies 2022, 15(11), 4043; https://doi.org/10.3390/en15114043
Submission received: 13 April 2022 / Revised: 14 May 2022 / Accepted: 20 May 2022 / Published: 31 May 2022
(This article belongs to the Collection Flow and Transport in Porous Media)

Abstract

:
In the study of coal pore structure, the traditional test method does not consider the influence of coal particle size. During the crushing process, coal samples are affected by crushing stress. While the particle size changes, the change characteristics of pore structure and macromolecular structure are a matter for which systematic research is still lacking. In this paper, mercury injection and liquid nitrogen were used to characterize the pore structure of coal. It was found that the porosity, total pore volume and total specific surface area of the coal increased with the decrease of particle size. However, during this process, the pore volume of macropores and mesopores decreases, while the micropores and transition pores increase significantly, indicating that while the particle size decreases, macropores and mesopores are broken into micropores and transition pores. In addition, the pore structure of samples with a particle size less than 200 mesh changes significantly. With the decrease of coal particle size, the areas of the D peak and G peak of the Raman spectrum increase, indicating that the ordering degree of coal increases. Finally, the statistical results of the peak area of the Fourier infrared spectrum show that alcohol, phenol, ammonia hydroxyl and fatty hydrocarbon CH2 and CH3 are greatly reduced, while the out-of-plane deformation vibration of alkyl ether and aromatic structure C–H are significantly increased, which also indicates the transformation of the coal macromolecular structure to an aromatic structure with strong stability.

1. Introduction

The pore structure of coal is the main factor affecting the occurrence and migration of coal and gas [1,2,3], and the fracture and pore structure of coal will be transformed under the action of tectonic stress [4,5]. Jiang et al. [6] observed by scanning electron microscopy that the coal samples close to the fault had more well-developed macropores and fractures, and the connectivity between pores and fractures was superior. Godyń et al. [7] selected coal samples at different distances from the reverse fault to carry out low-temperature liquid nitrogen adsorption testing. It was concluded that, with the increase of the influence degree of the reverse fault, the specific surface area and pore volume of the sample increased to a certain extent.
The traditional test methods of coal pore structure, such as mercury injection and liquid nitrogen, all provide only a general range of sample particle size. However, in the process of coal sample crushing, the crushing stress of coal samples with different particle sizes differs [8,9,10]. Tectonic stress can transform the pore structure of coal. Similarly, crushing stress can also transform the pore structure of coal and even affect the structure of coal at the macromolecular level [11,12,13,14].
In view of the above problems, scholars have previously carried out relevant research and achieved some understandings. Wang et al. [15] used fractal theory to study the pore characteristics of briquettes pressed by coal particles with different particle sizes. It was found that with the gradual reduction of briquette particle size, the pore radius in briquettes gradually decreased, the total number of pores gradually increased, the fractal dimension gradually increased and the uniformity of pore distribution increased. Yi et al. [16] found that with the decrease of particle size, the surface area and pore volume of micropores and mesopores increased, while the adsorption capacity of coal for nitrogen increased. The main reason for this increase was the increase of pores with a pore diameter of about 10 nm. Boylu et al. [17] conducted experiments with coal samples of different coal ranks and mesh numbers and found that the test data of coke pore structure were greatly affected by the particle size of the experimental sample. Zhang et al. [18] found that the change of particle size could directly affect the complexity of the gas diffusion path in coal samples, after which it affected the adsorption equilibrium time. Yuan et al. [19] carried out a methane high-pressure isothermal adsorption test for high-grade coal with different particle sizes. The results showed that the pore connectivity of large-size coal samples was improved under the influence of methane adsorption, while the pore distribution of small-size coal samples was more concentrated following methane adsorption.
Tian et al. [20] analyzed the FTIR spectrum and found that the absorption intensity of hydroxyl functional groups increased with the decrease of the average particle size of coal samples. Li et al. [21] found that, with the decrease of pulverized coal particle size, the content of the C element gradually increased, the surface of the pulverized coal became rougher and the hydroxyl functional groups on the surface of the pulverized coal increased, while the aromatic C=C and CH3 functional groups decreased.
It can be seen from the above studies that the particle size of coal samples has an impact on the pore structure, diffusion, adsorption characteristics and macromolecular level of coal [22,23,24]. However, in the aspect of coal pore structure, the research methods used have been relatively simple, and the overall understanding of the variation law of each pore diameter section of coal samples with different particle sizes cannot be formed. In terms of the molecular structure of coal, qualitative analysis is mainly used, and there is a lack of quantitative research. Based on this, in the present study, taking coal samples collected from a mine in southern Henan as an example, the continuous characterization of the macropore, mesopore and small hole of the pore structure is described through mercury injection and liquid nitrogen. The Raman spectrum and Fourier infrared spectrum are analyzed to study the transformation effect of particle size on the pore structure and macromolecular structure of coal. The semi-quantitative analysis of the effect of stress on the transformation of coal macromolecular structure was realized by fitting the peaks of the Fourier infrared spectrum and Raman spectrum. Coal with different particle sizes represents different stress, i.e., different in situ stress can alter the pore structure of coal, thus affecting the adsorption, storage and migration of coal gas. This is of great significance to coal seam gas drainage and coal and gas outburst prevention.

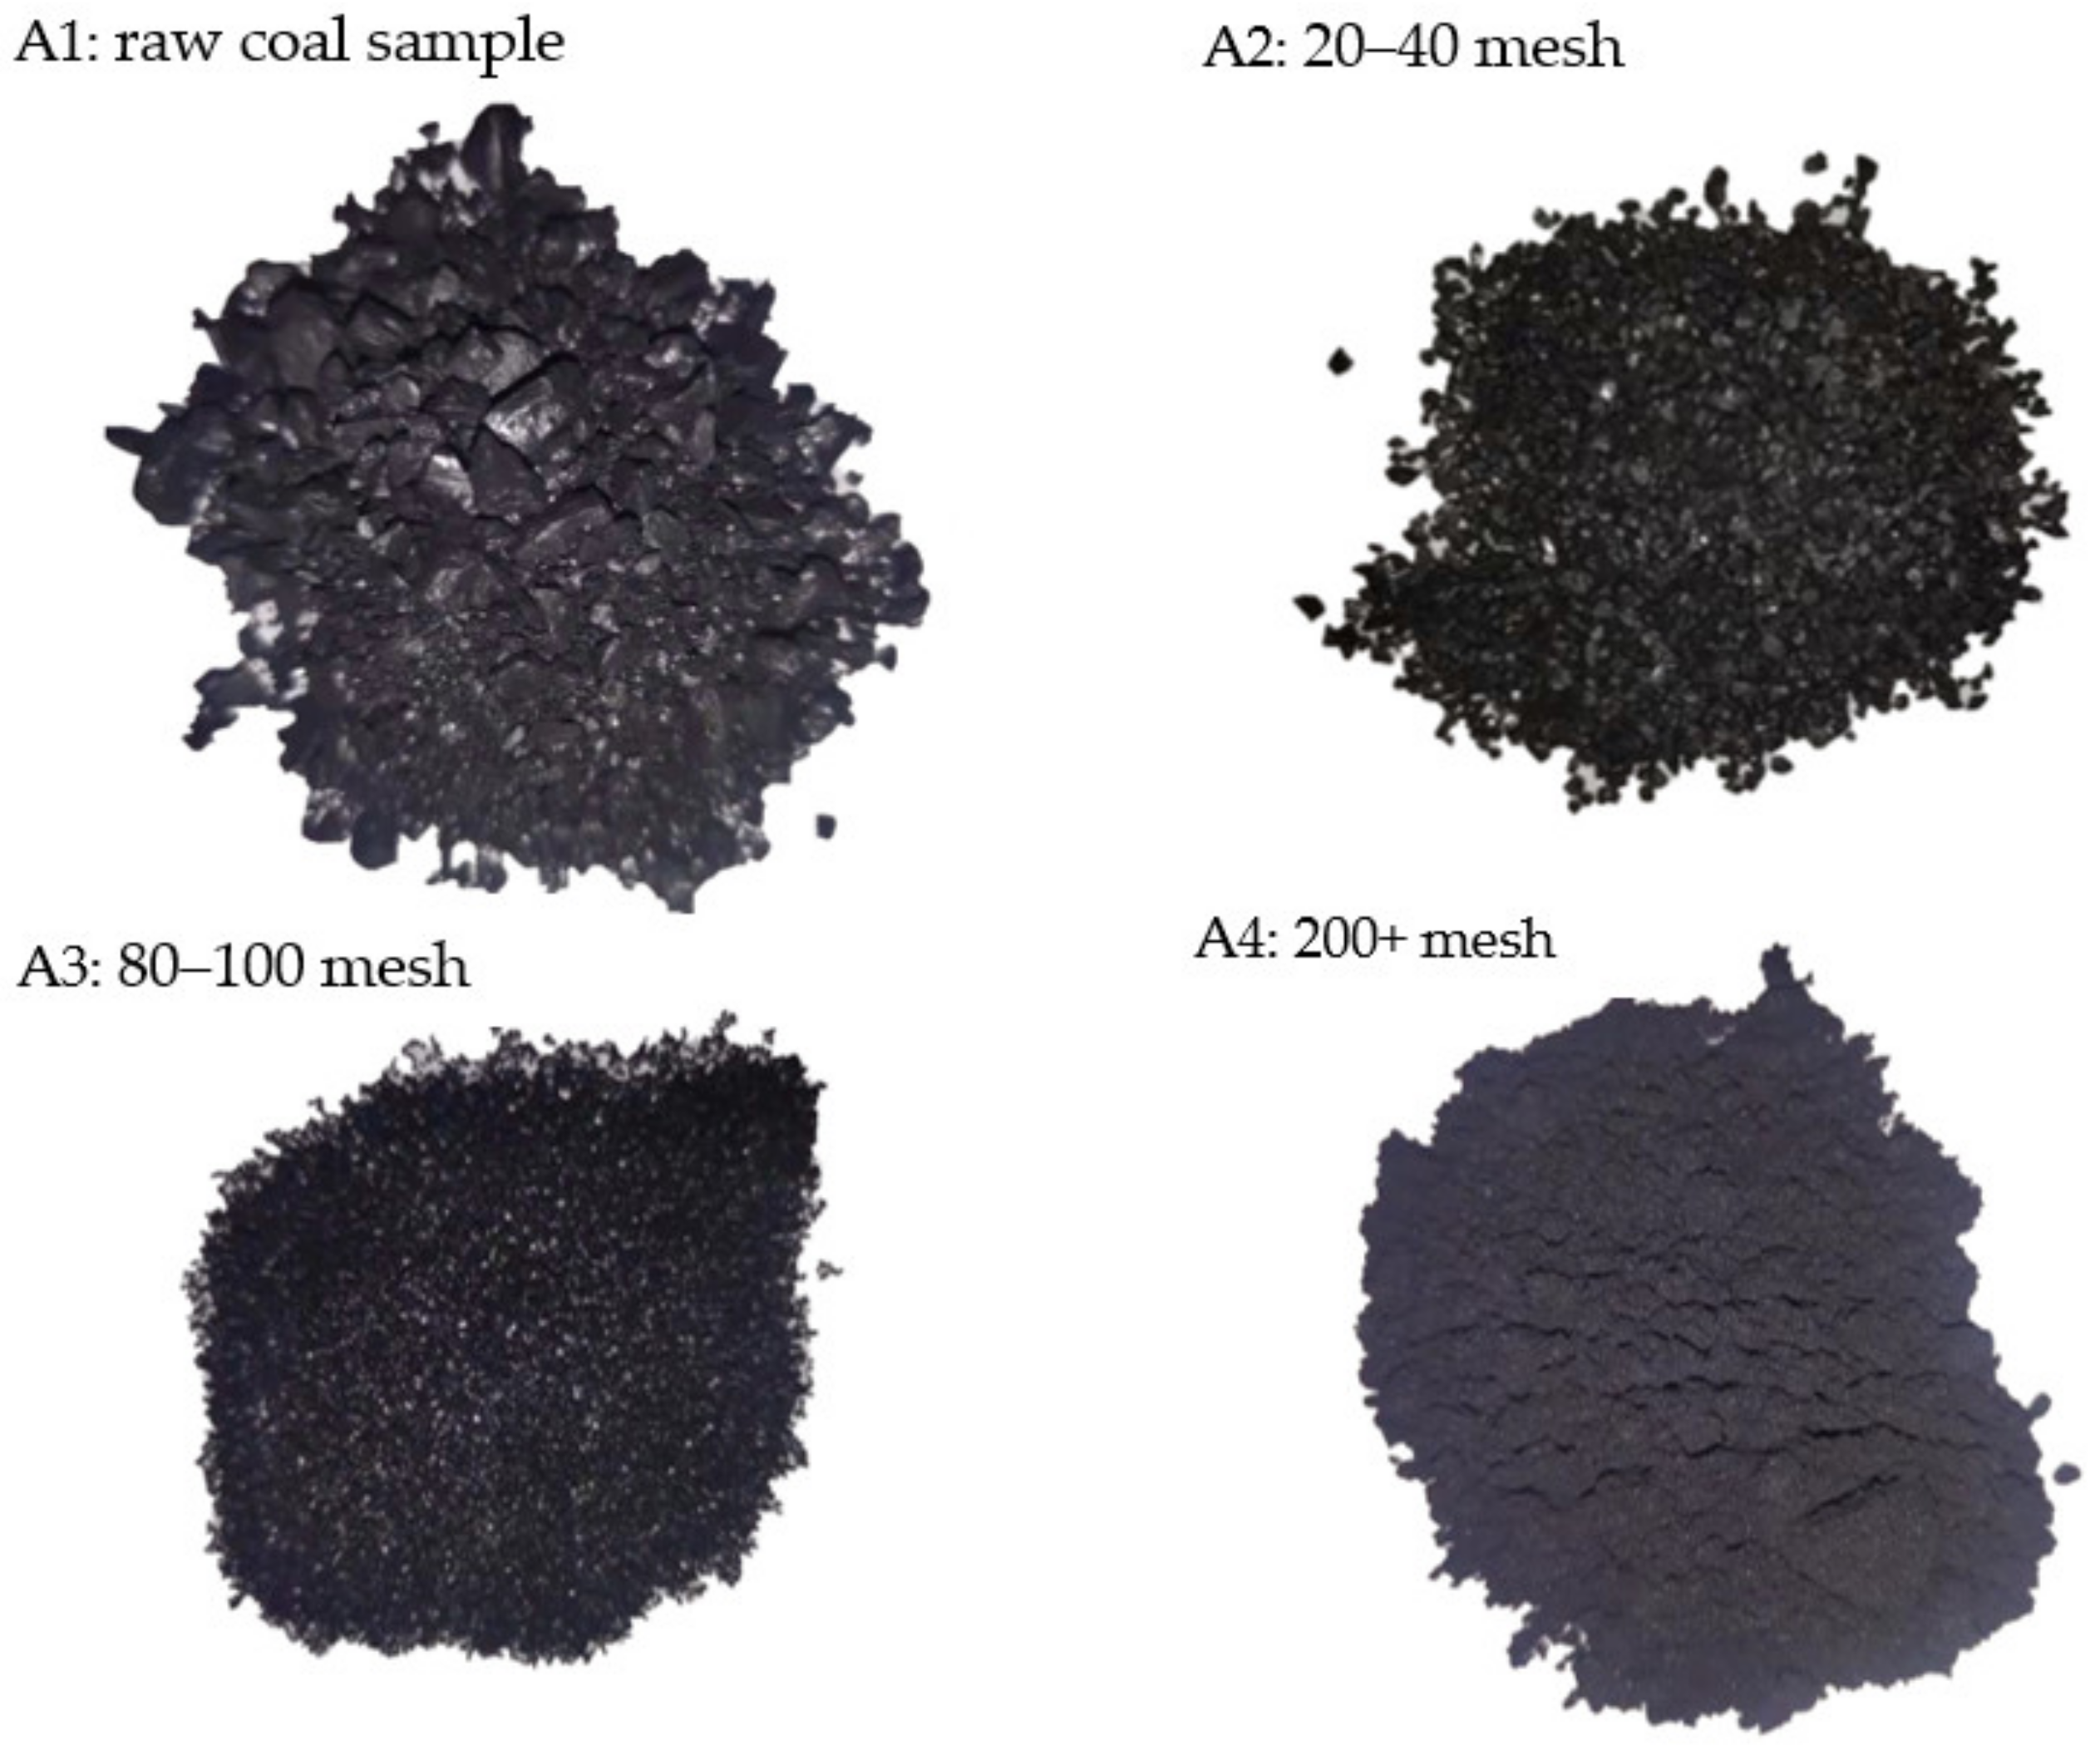
2. Experimental Sample

The coal sample was collected from the No. 1_5 coal seam of a mine in southern Henan. The No. 1_5 coal seam is located in the lower part of the Taiyuan formation, located 46.52–67.17 m away from No. 2_1 coal seam, with an average distance of 60.00 m. The whole mine field is developed, with a coal thickness of 0.26–3.9 m, with an average of 1.52 m, coal seam minability index of 0.83 and coal thickness variation coefficient of 48.07%. It is a relatively stable and highly minable coal seam. The coal seam structure is complex, generally containing one to three layers of gangue. The roof of the coal seam is L5 limestone, and the floor is mudstone or L4 limestone. The floor elevation is −17 to −800 m, and the buried depth is 137–1145 m. The gas content in the mine is generally low, and the highest measured gas content in the coal seam is 5.25 cm3/g.
The raw coal samples collected were marked as A1. Coal samples with different particle sizes were ground by ball mill and separated by a sample separator. The coal samples broken into 20–40 mesh, 80–100 mesh and 200+ mesh were marked as A2, A3 and A4, respectively (Figure 1), and the coal quality test (Table 1) was carried out. The coal type is 1/3 coking coal.

3. Results and Discussion

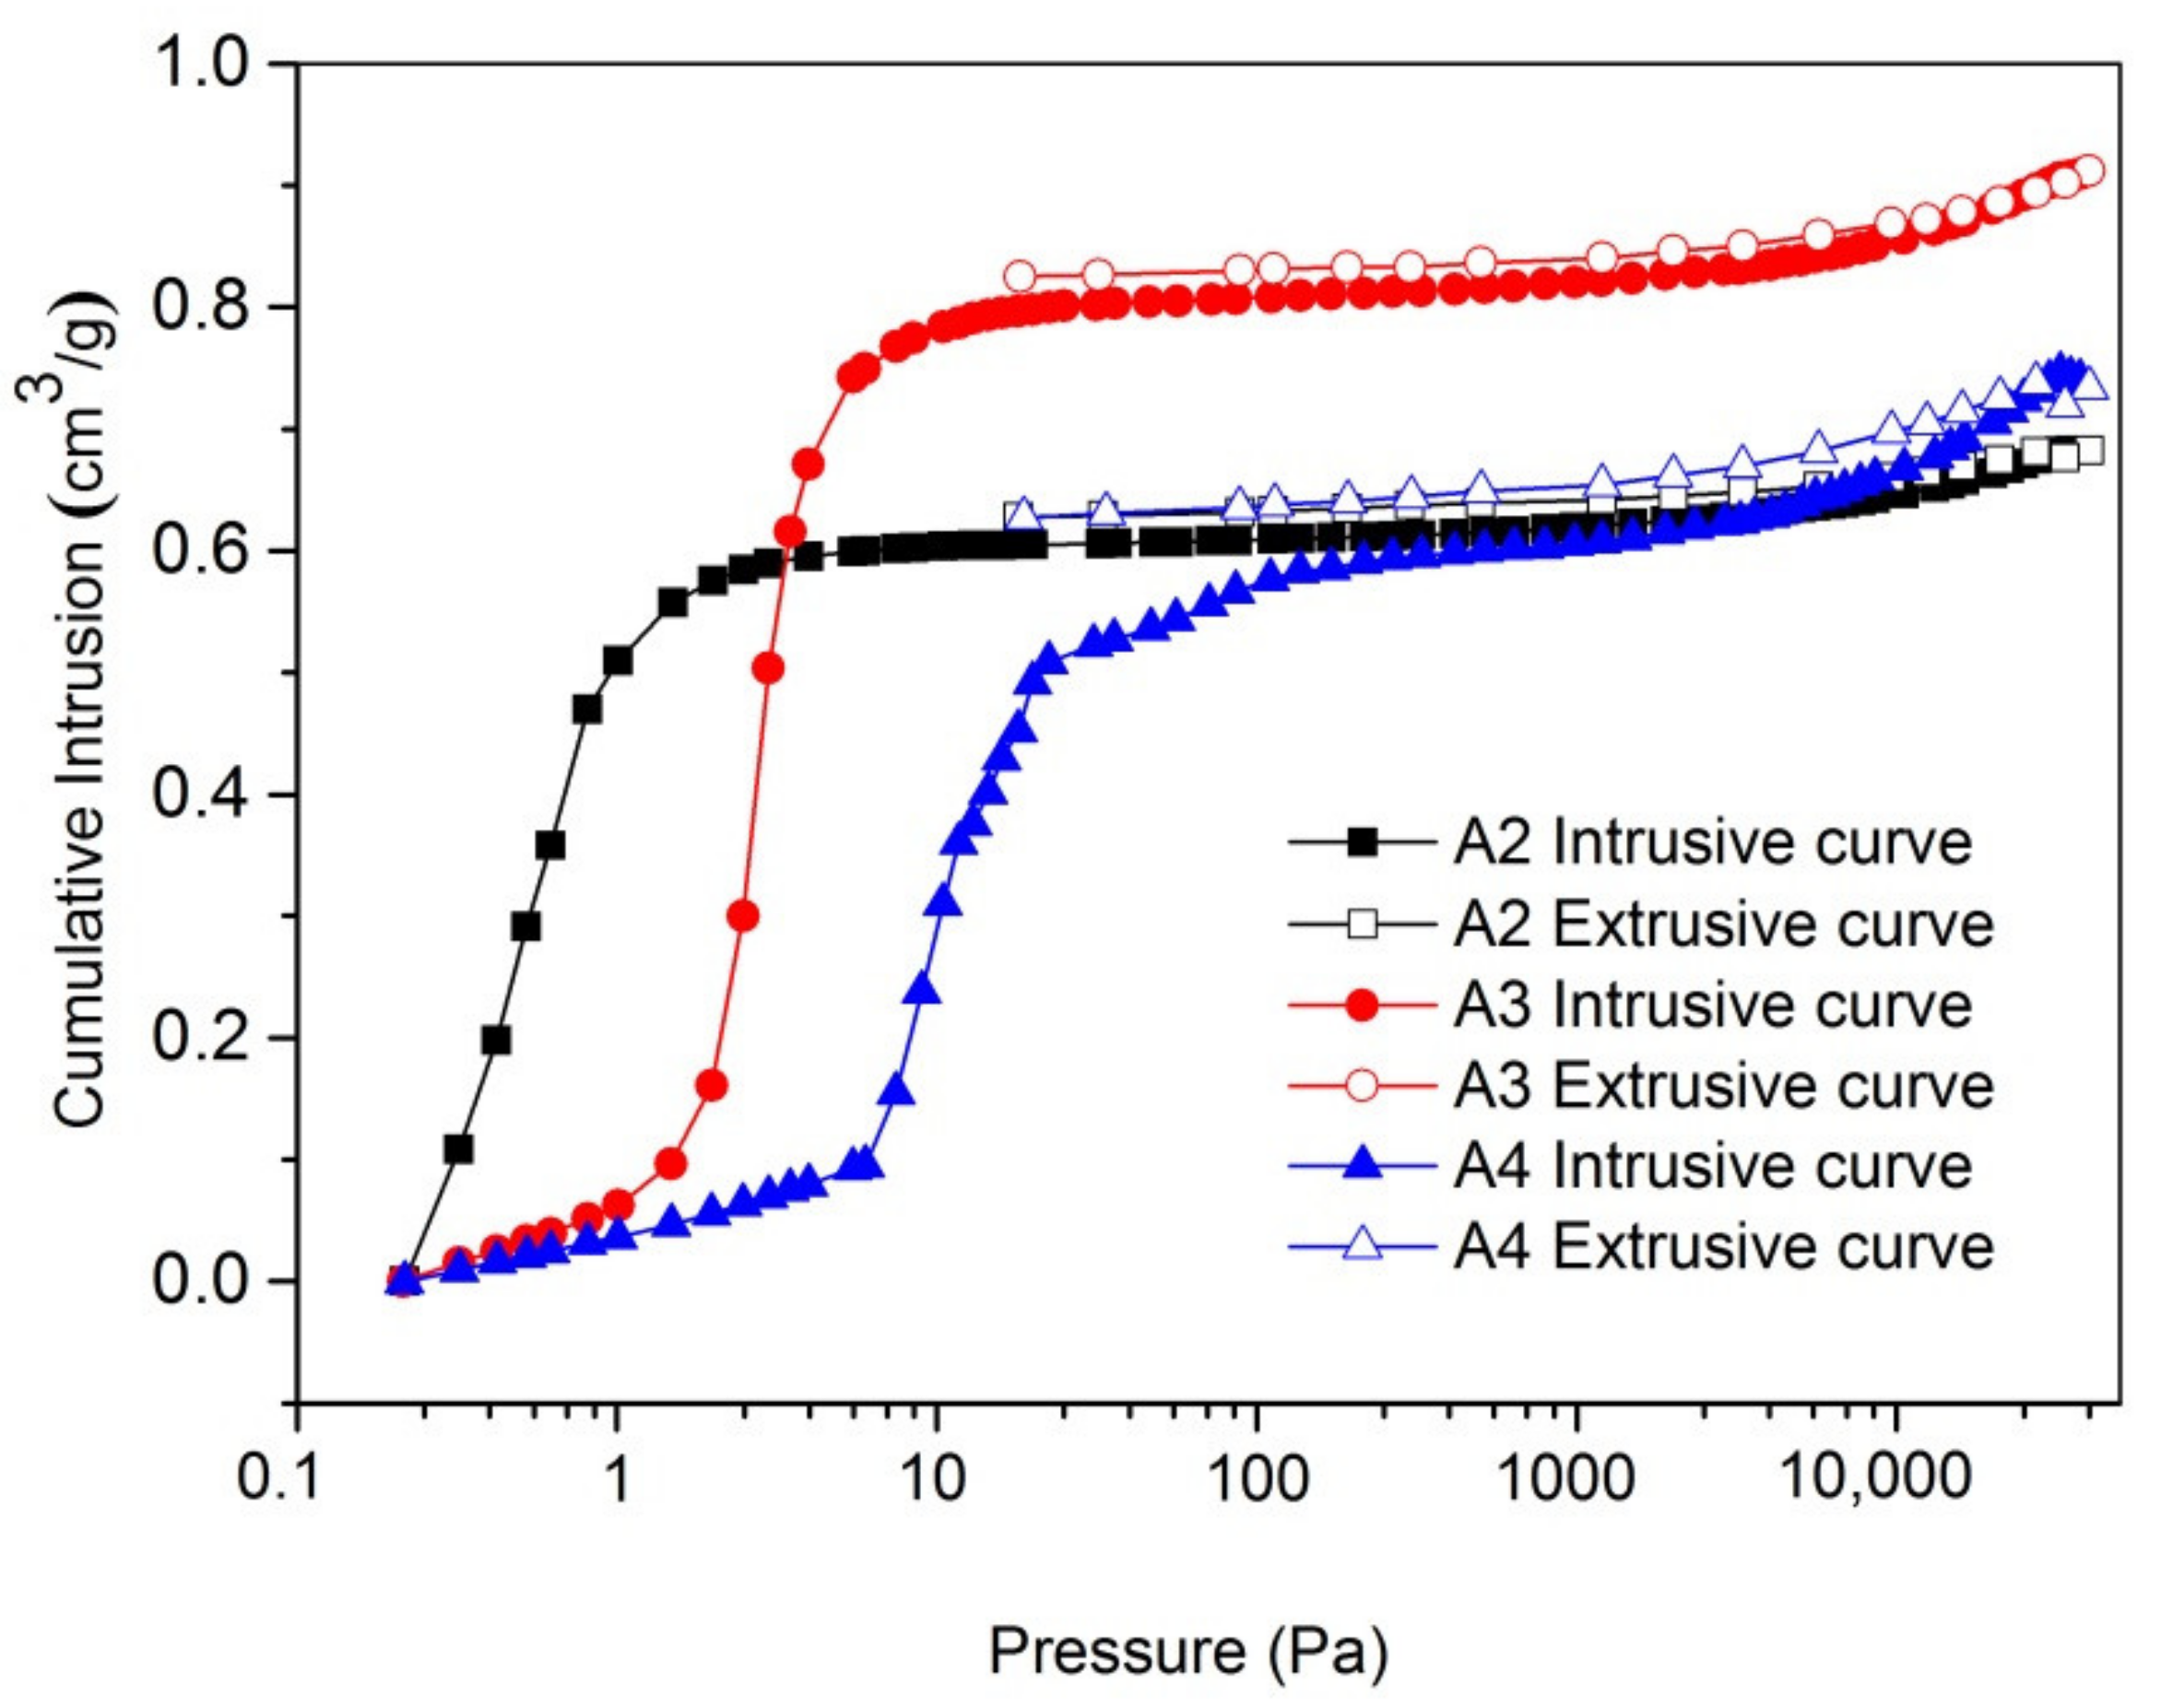
3.1. Mercury Injection Test

The mercury injection test adopts an American Micromeritics AutoPore IV 9510, the maximum pressure can reach 228 MPa and the analytical pore size range is 5 nm–800 μm. Powder or block samples can be analyzed. In this round of testing, samples A2, A3 and A4 were tested, before which they were dried to a constant weight at 105 °C.

3.1.1. Mercury Inlet Mercury Withdrawal Curve

The mercury injection and mercury removal curves of coal samples with different particle sizes are shown in Figure 2. It can be seen that, with the decrease of coal sample particle size, the slope of the mercury injection curve gradually decreases in the low-pressure area, indicating that the number of large pores in the coal samples decreases and the number of small pores increases. The smaller the particle size of the coal sample is, the greater the pressure value required for the curve to reach the near level will be and the more obvious the advance and retreat mercury lag ring will be, which also indicates that the pore size becomes smaller, and a large number of micropores have been formed.

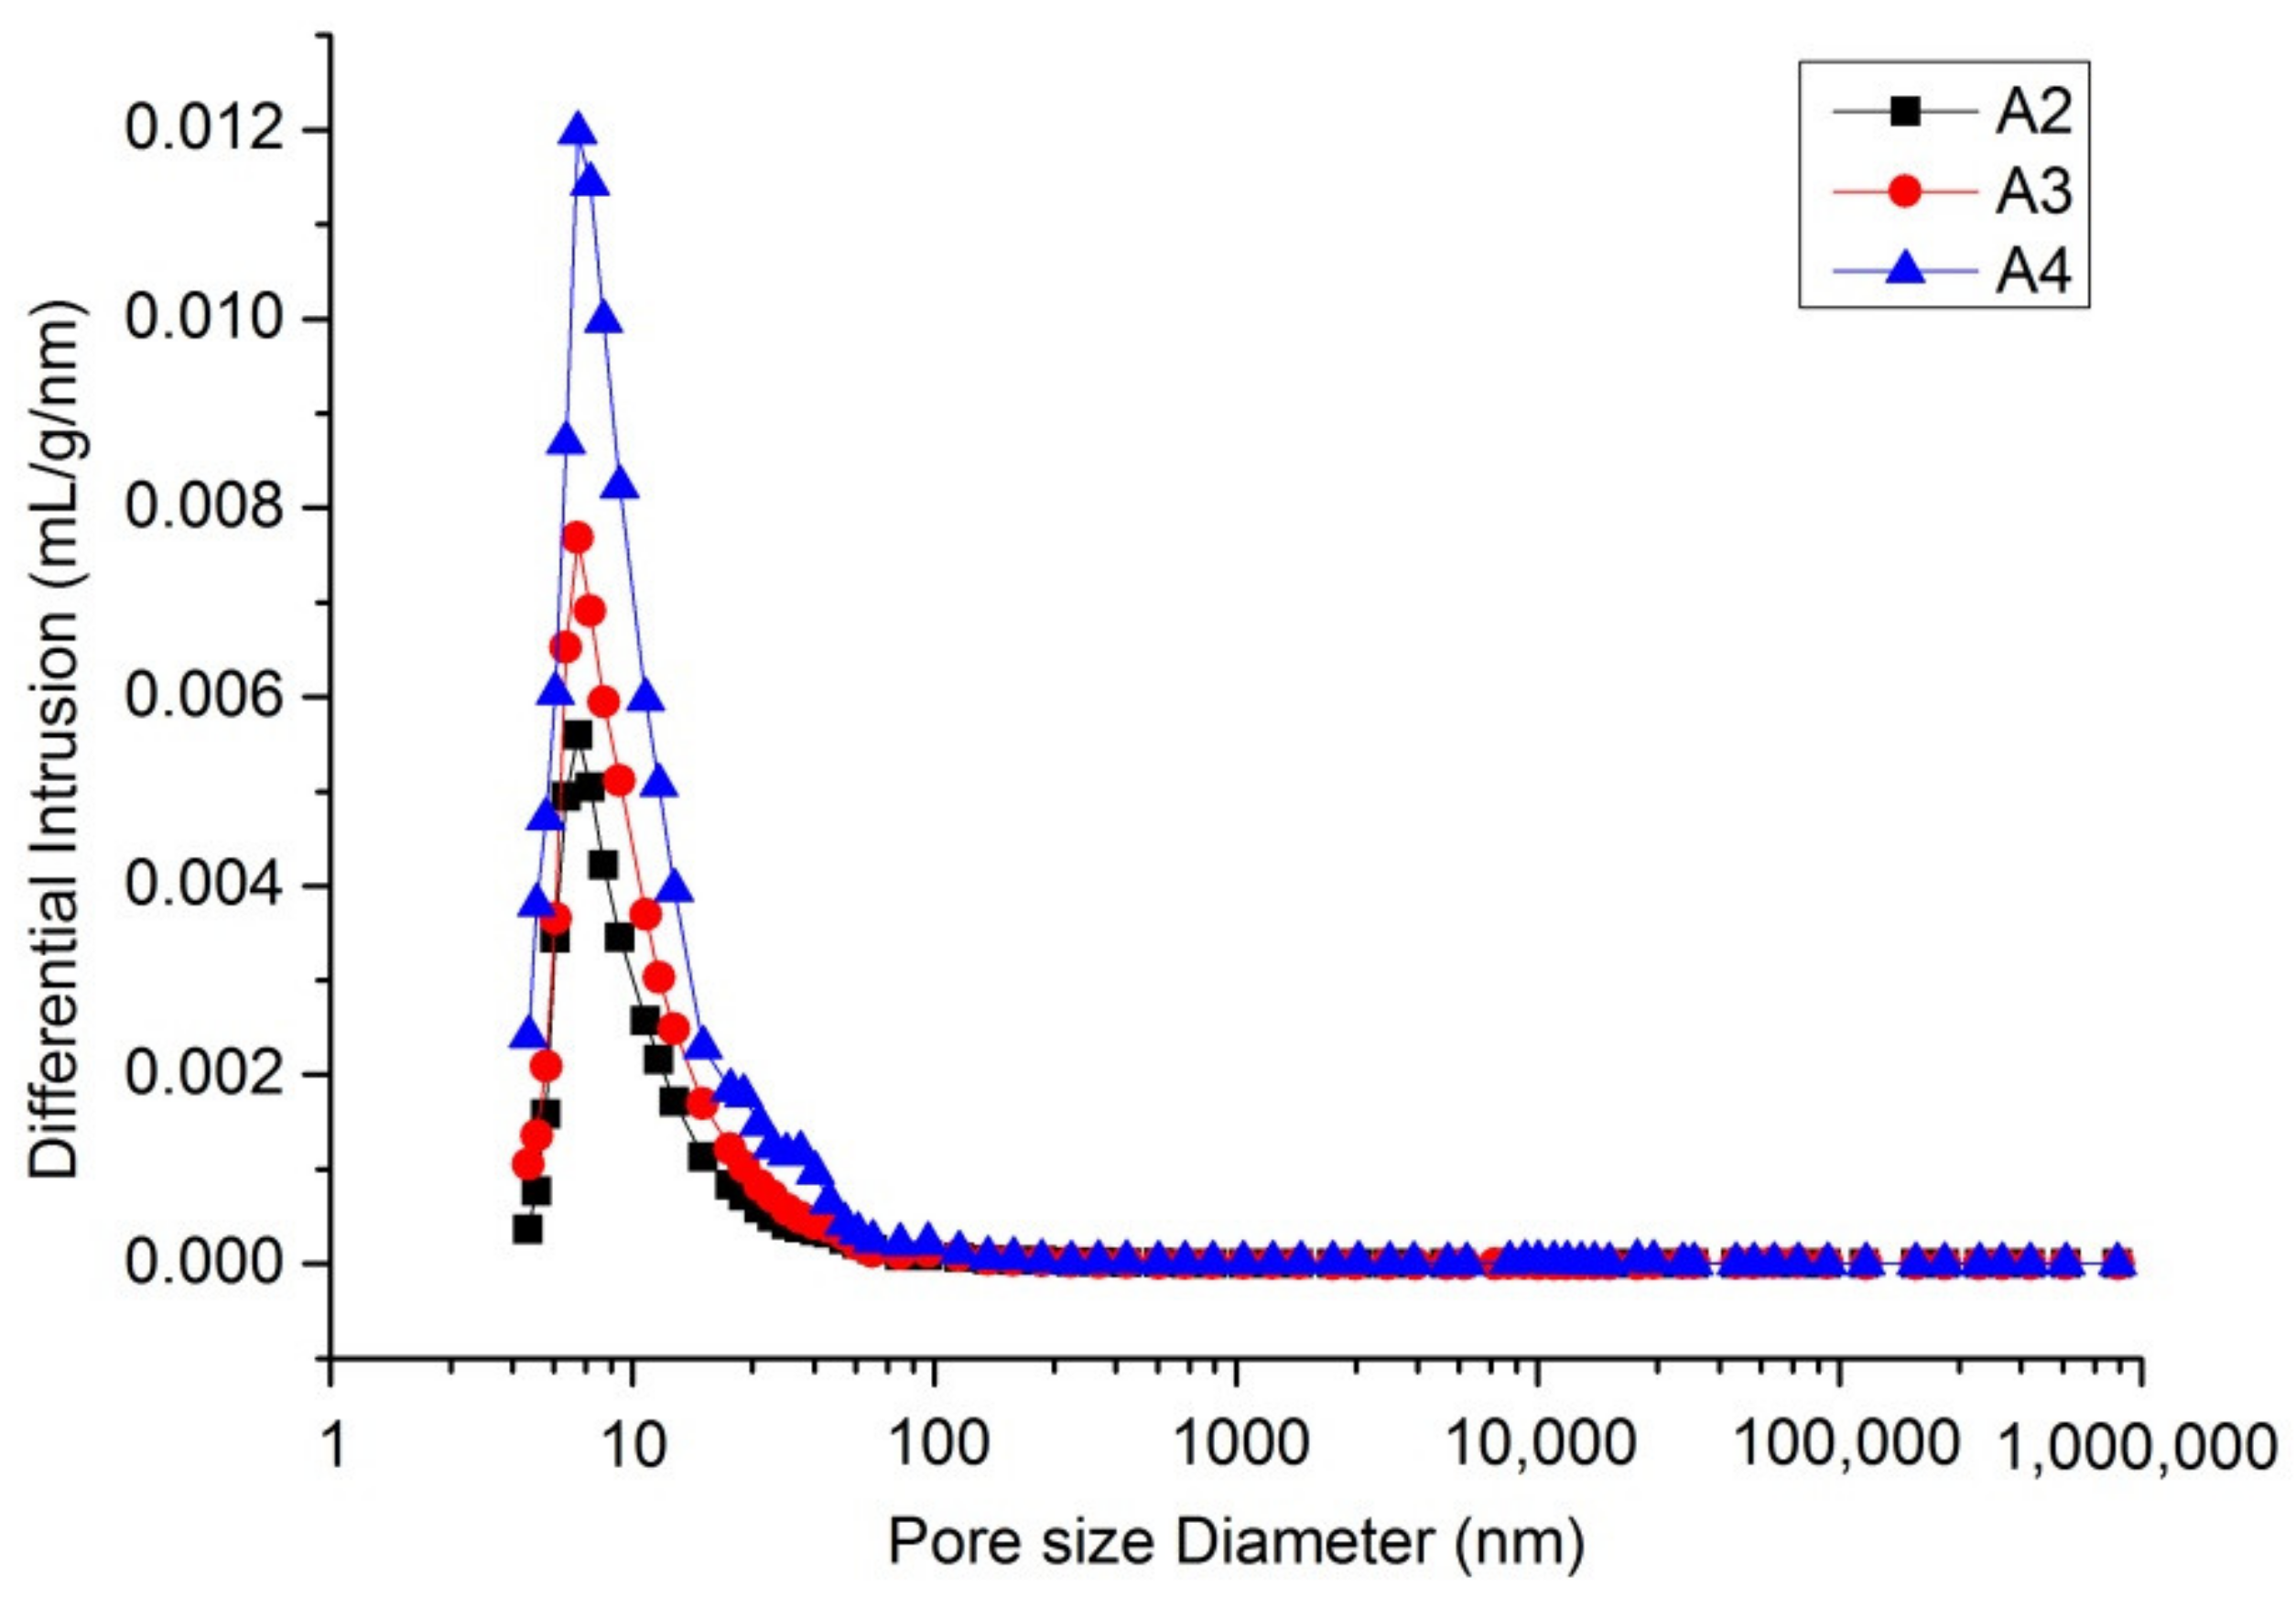
3.1.2. Pore Volume Comparison

The volume differential of mercury injection can represent the pore volume of a coal sample. It can be seen from Figure 3 that, with the decrease of coal sample particle size, the volume differential of mercury injection gradually increases and mainly focuses on the stage of micropore and transition pore, while the pore volume of mesopore and macropore decreases (Table 2).

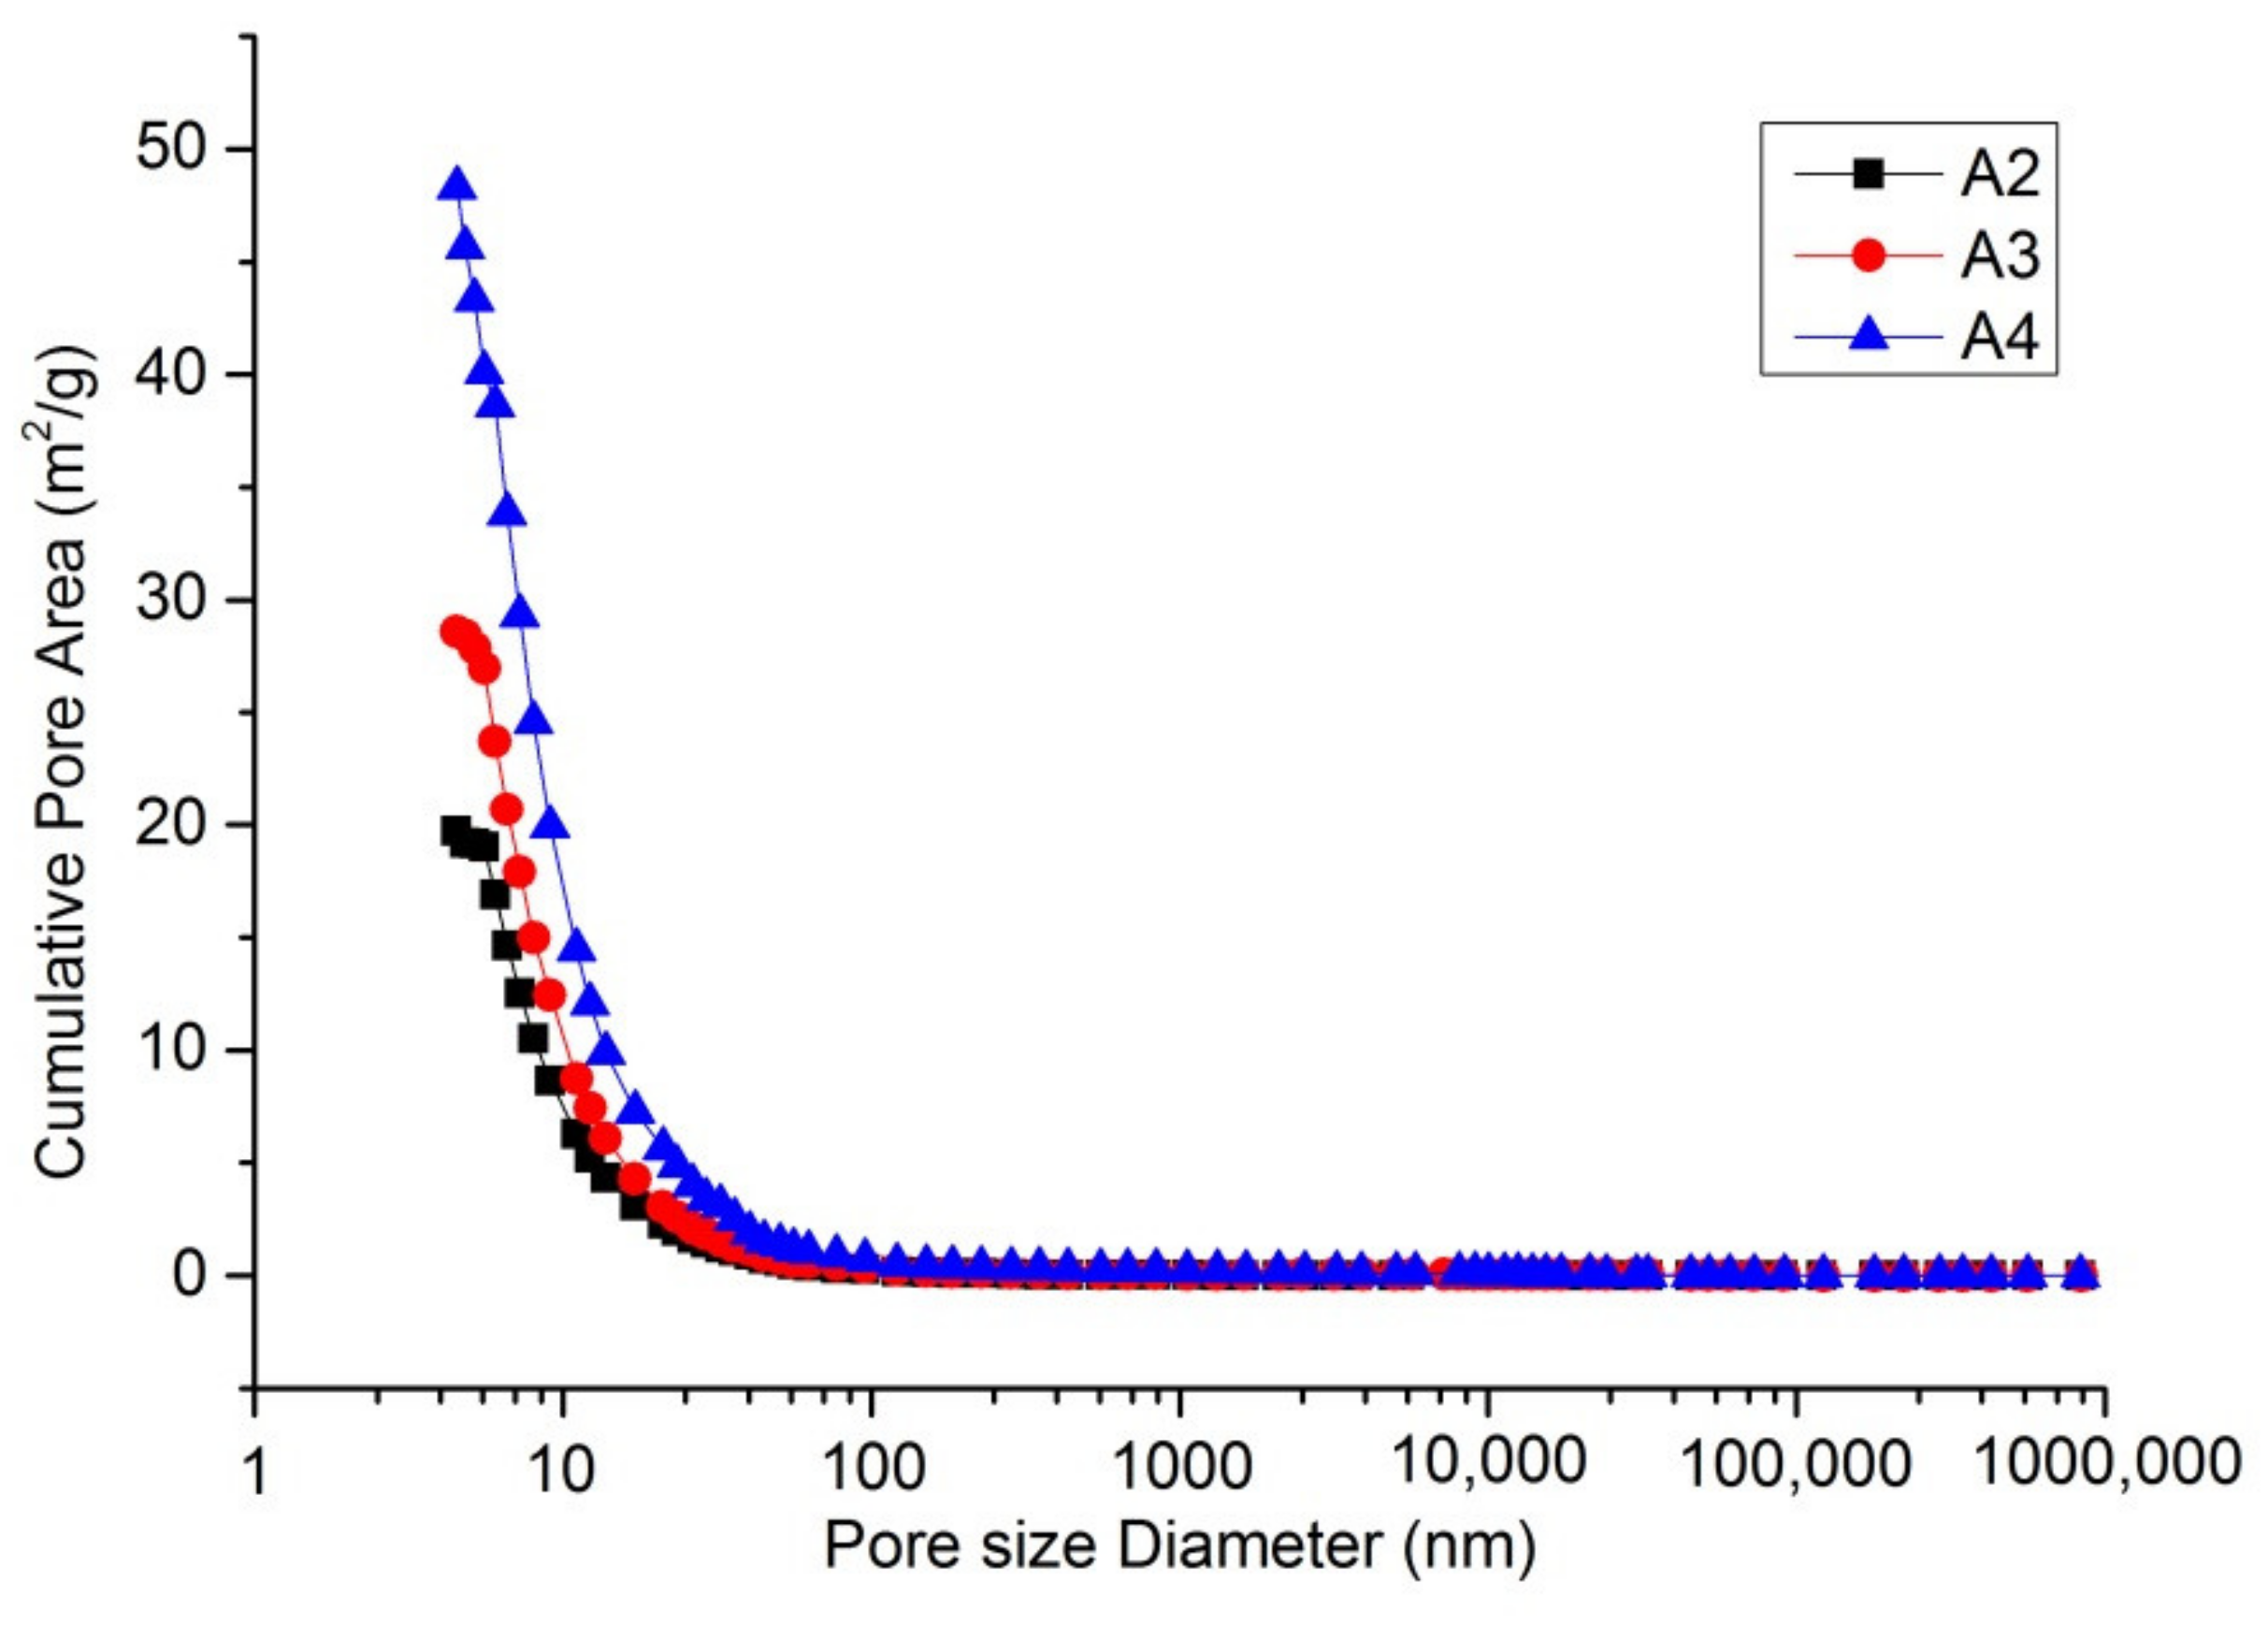
3.1.3. Comparison of Specific Surface Area

Both specific surface area and pore volume are parameters that reflect pore structure. Pore volume is reflected from the perspective of volume, while specific surface area can reflect the number of pores under the pore size from the side. They complement one another and can more comprehensively reflect the micropore characteristics of the sample. It can be seen from the figure that the cumulative pore size ratio decreases with the increase of coal surface area ratio below 100 nm. The difference is that the cumulative specific surface area increases with the decrease of coal particle size (Figure 4). The specific surface areas of micropores, transition pores and mesopores increase, and the porosity also increases gradually (Table 2).

3.2. Liquid Nitrogen Adsorption Test

The liquid nitrogen adsorption test is an important test method by which to study the micropore characteristics of particles. Together with the mercury injection method, it forms a research system from mesopore to micropore. At present, liquid nitrogen adsorption is mainly applied to analyze the specific surface area and pore structure of porous materials. It uses the adsorption characteristics of solid materials and gas molecules as “measuring tools” to measure the surface area and pore structure of materials. It can test the specific surface area, total pore volume, pore size distribution, adsorption–desorption curve and other data of materials [25,26]. The instrument used in this liquid nitrogen adsorption test was a Micromeritics ASAP 2460. Particle samples A2, A3 and A4 of the coal samples with different particle sizes were used for testing, and the sample quality was greater than 100 mg. Prior to the test, the samples were heated at 110 °C for 8 h to ensure that the impurities in the sample evaporate and discharge after heating for a long time.

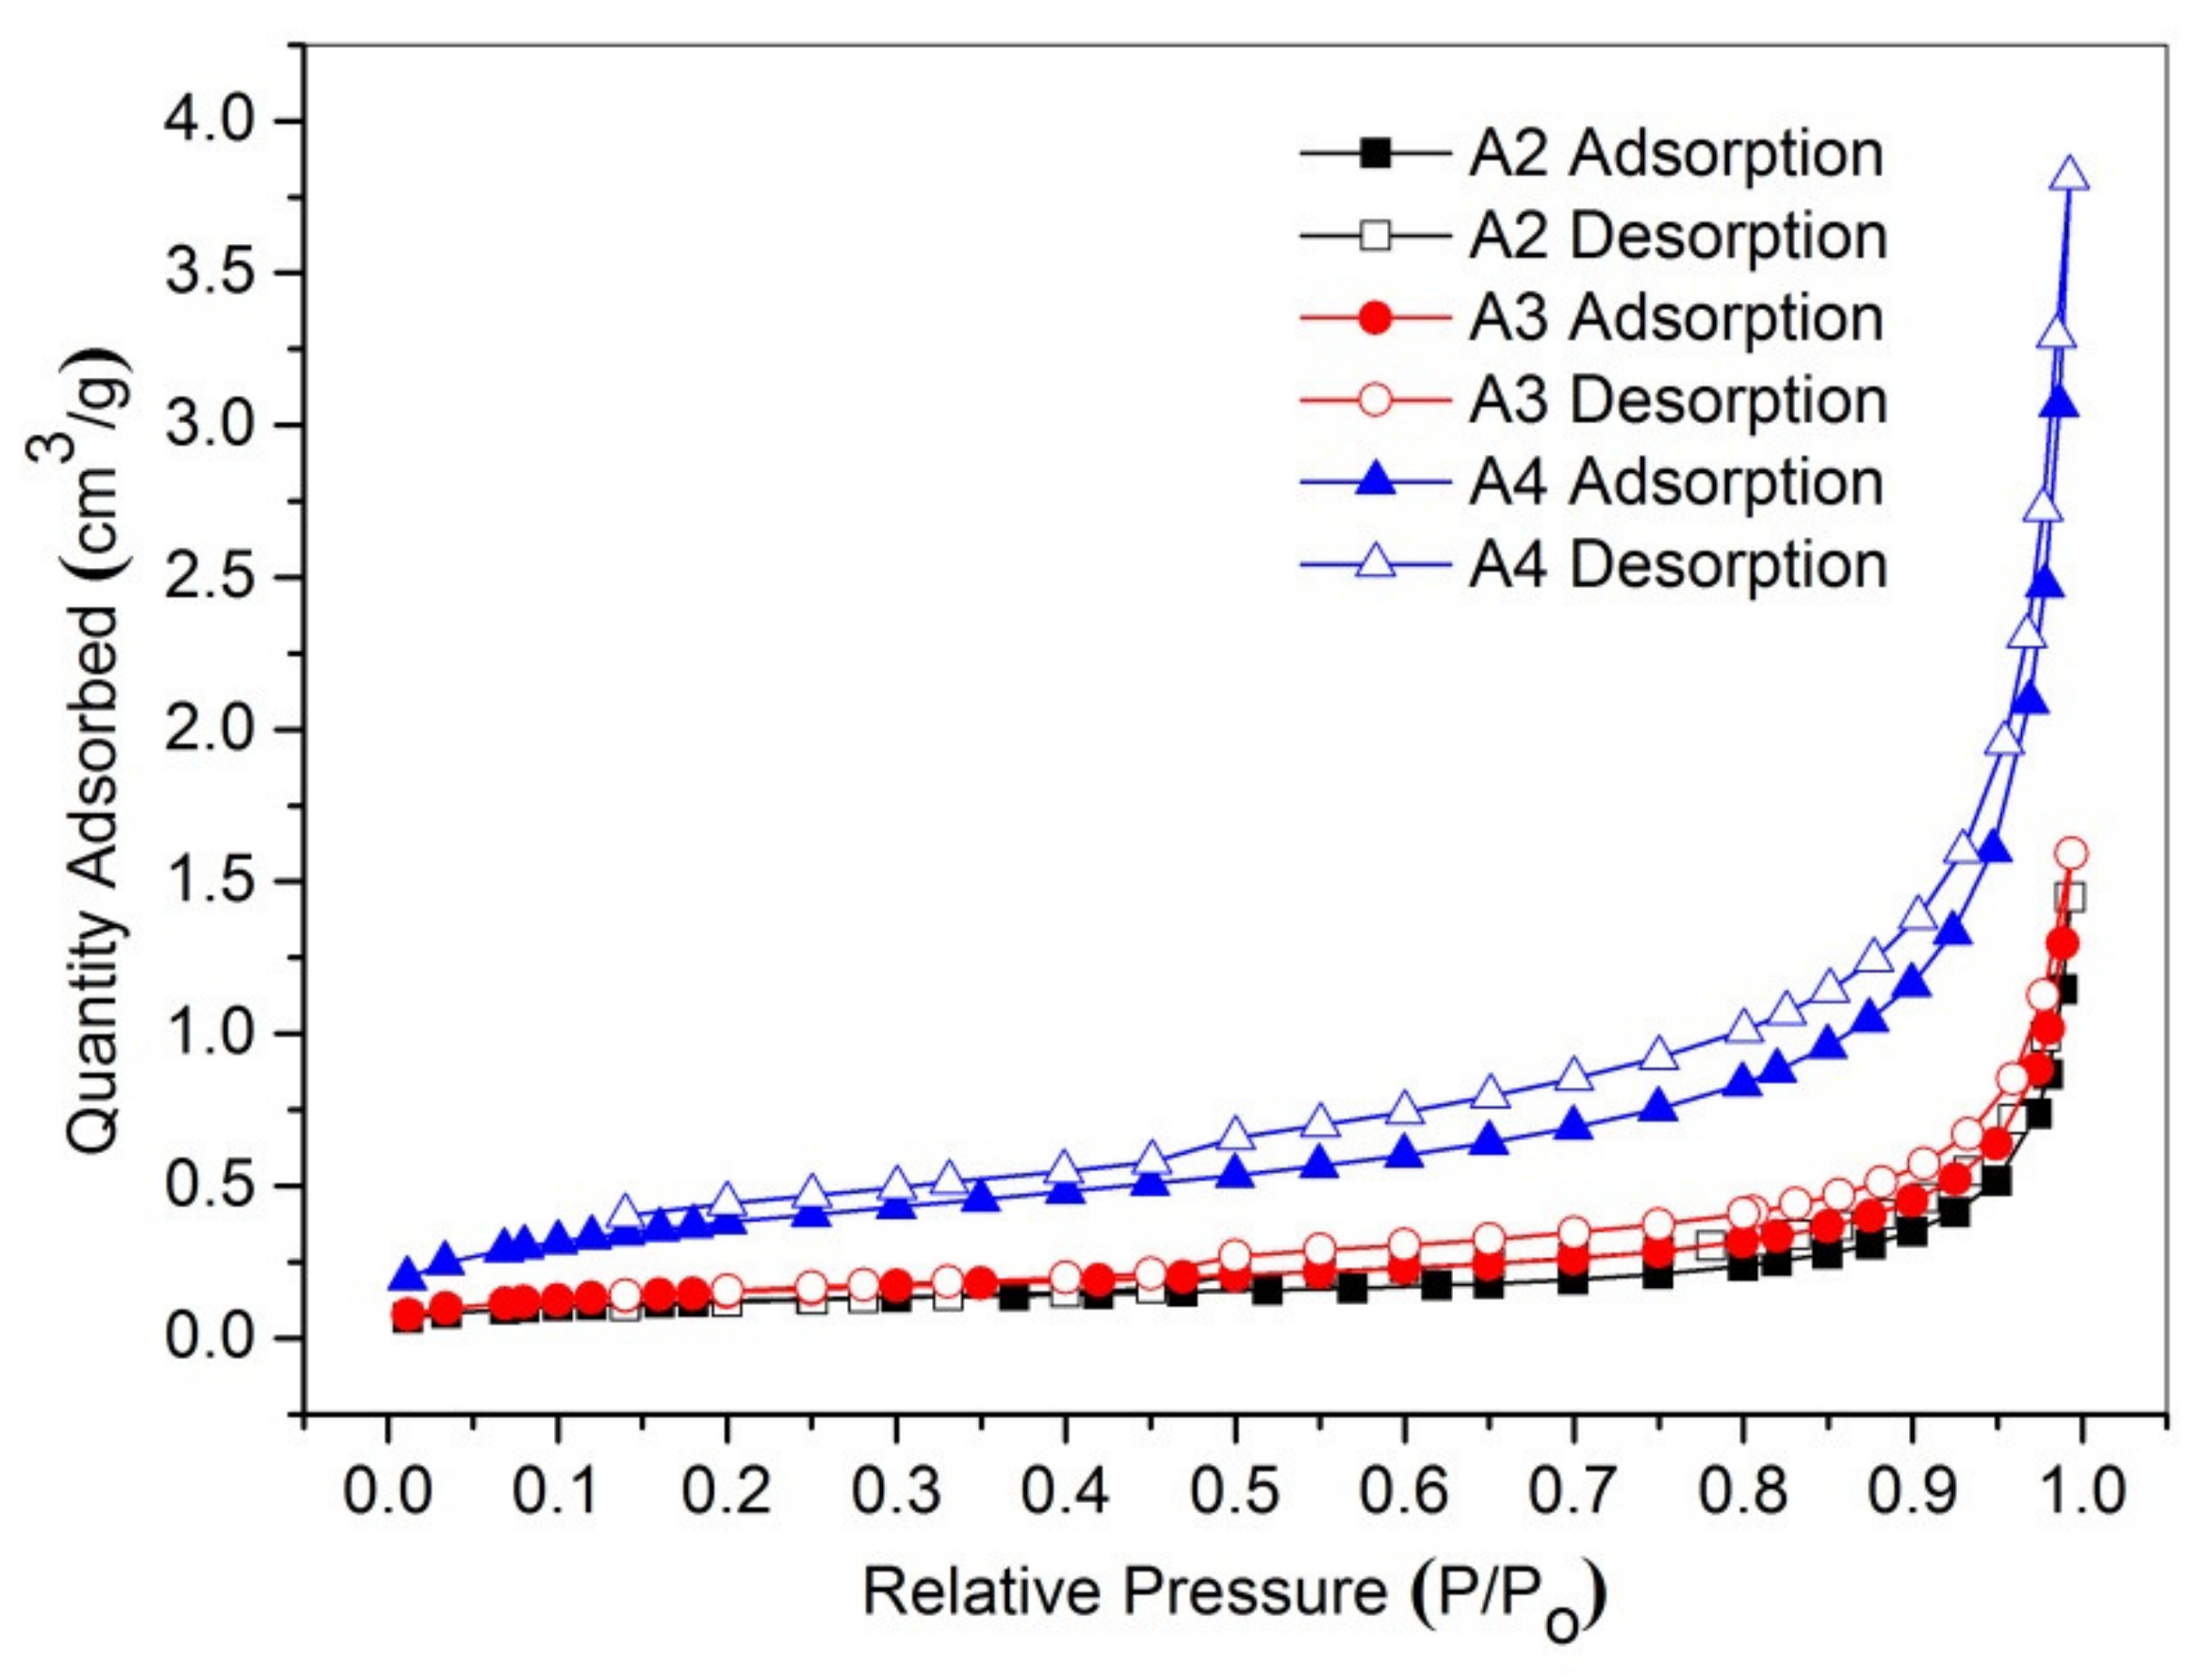
3.2.1. Isothermal Adsorption–Desorption Curve

The isothermal adsorption–desorption curves of liquid nitrogen for coal samples with different particle sizes are shown in Figure 5. This figure shows the characteristics of the type IV isothermal adsorption curve, which mainly undergoes single-layer to multi-layer adsorption. The first half of the curve (0.005 < relative pressure P/P0 < 0.45) is a low-pressure area, which mainly undergoes monolayer adsorption of micropores, but the adsorption capacity is low due to the small number of micropores. When the relative pressure is 0.45–0.9, the isotherm is relatively flat, the monolayer adsorption is roughly completed and an adsorption saturation phenomenon occurs, because the mesopore in the coal is filled with nitrogen. With the continuous increase of relative pressure, the isotherm rises sharply, which is attributed to capillary condensation. At this time, it can be considered that the number of adsorption layers tends to be infinite, i.e., multi-layer adsorption occurs. The results of the adsorption capacity test showed that the total adsorption capacity gradually increased with the decrease of particle size. Particularly for samples with a particle size smaller than 200 mesh, the adsorption capacity increases significantly. The maximum adsorption capacity of coal sample A2 is 1.45 cm3/g, that of coal sample A3 is 1.59 cm3/g and that of coal sample A4 is 3.81 cm3/g, an increase of more than twofold. Therefore, from the adsorption–desorption isotherm, it can be determined that the structure of micropores (<10 nm) and transition pores (10–100 nm) in the coal body have been modified by grinding, and the number has increased significantly.

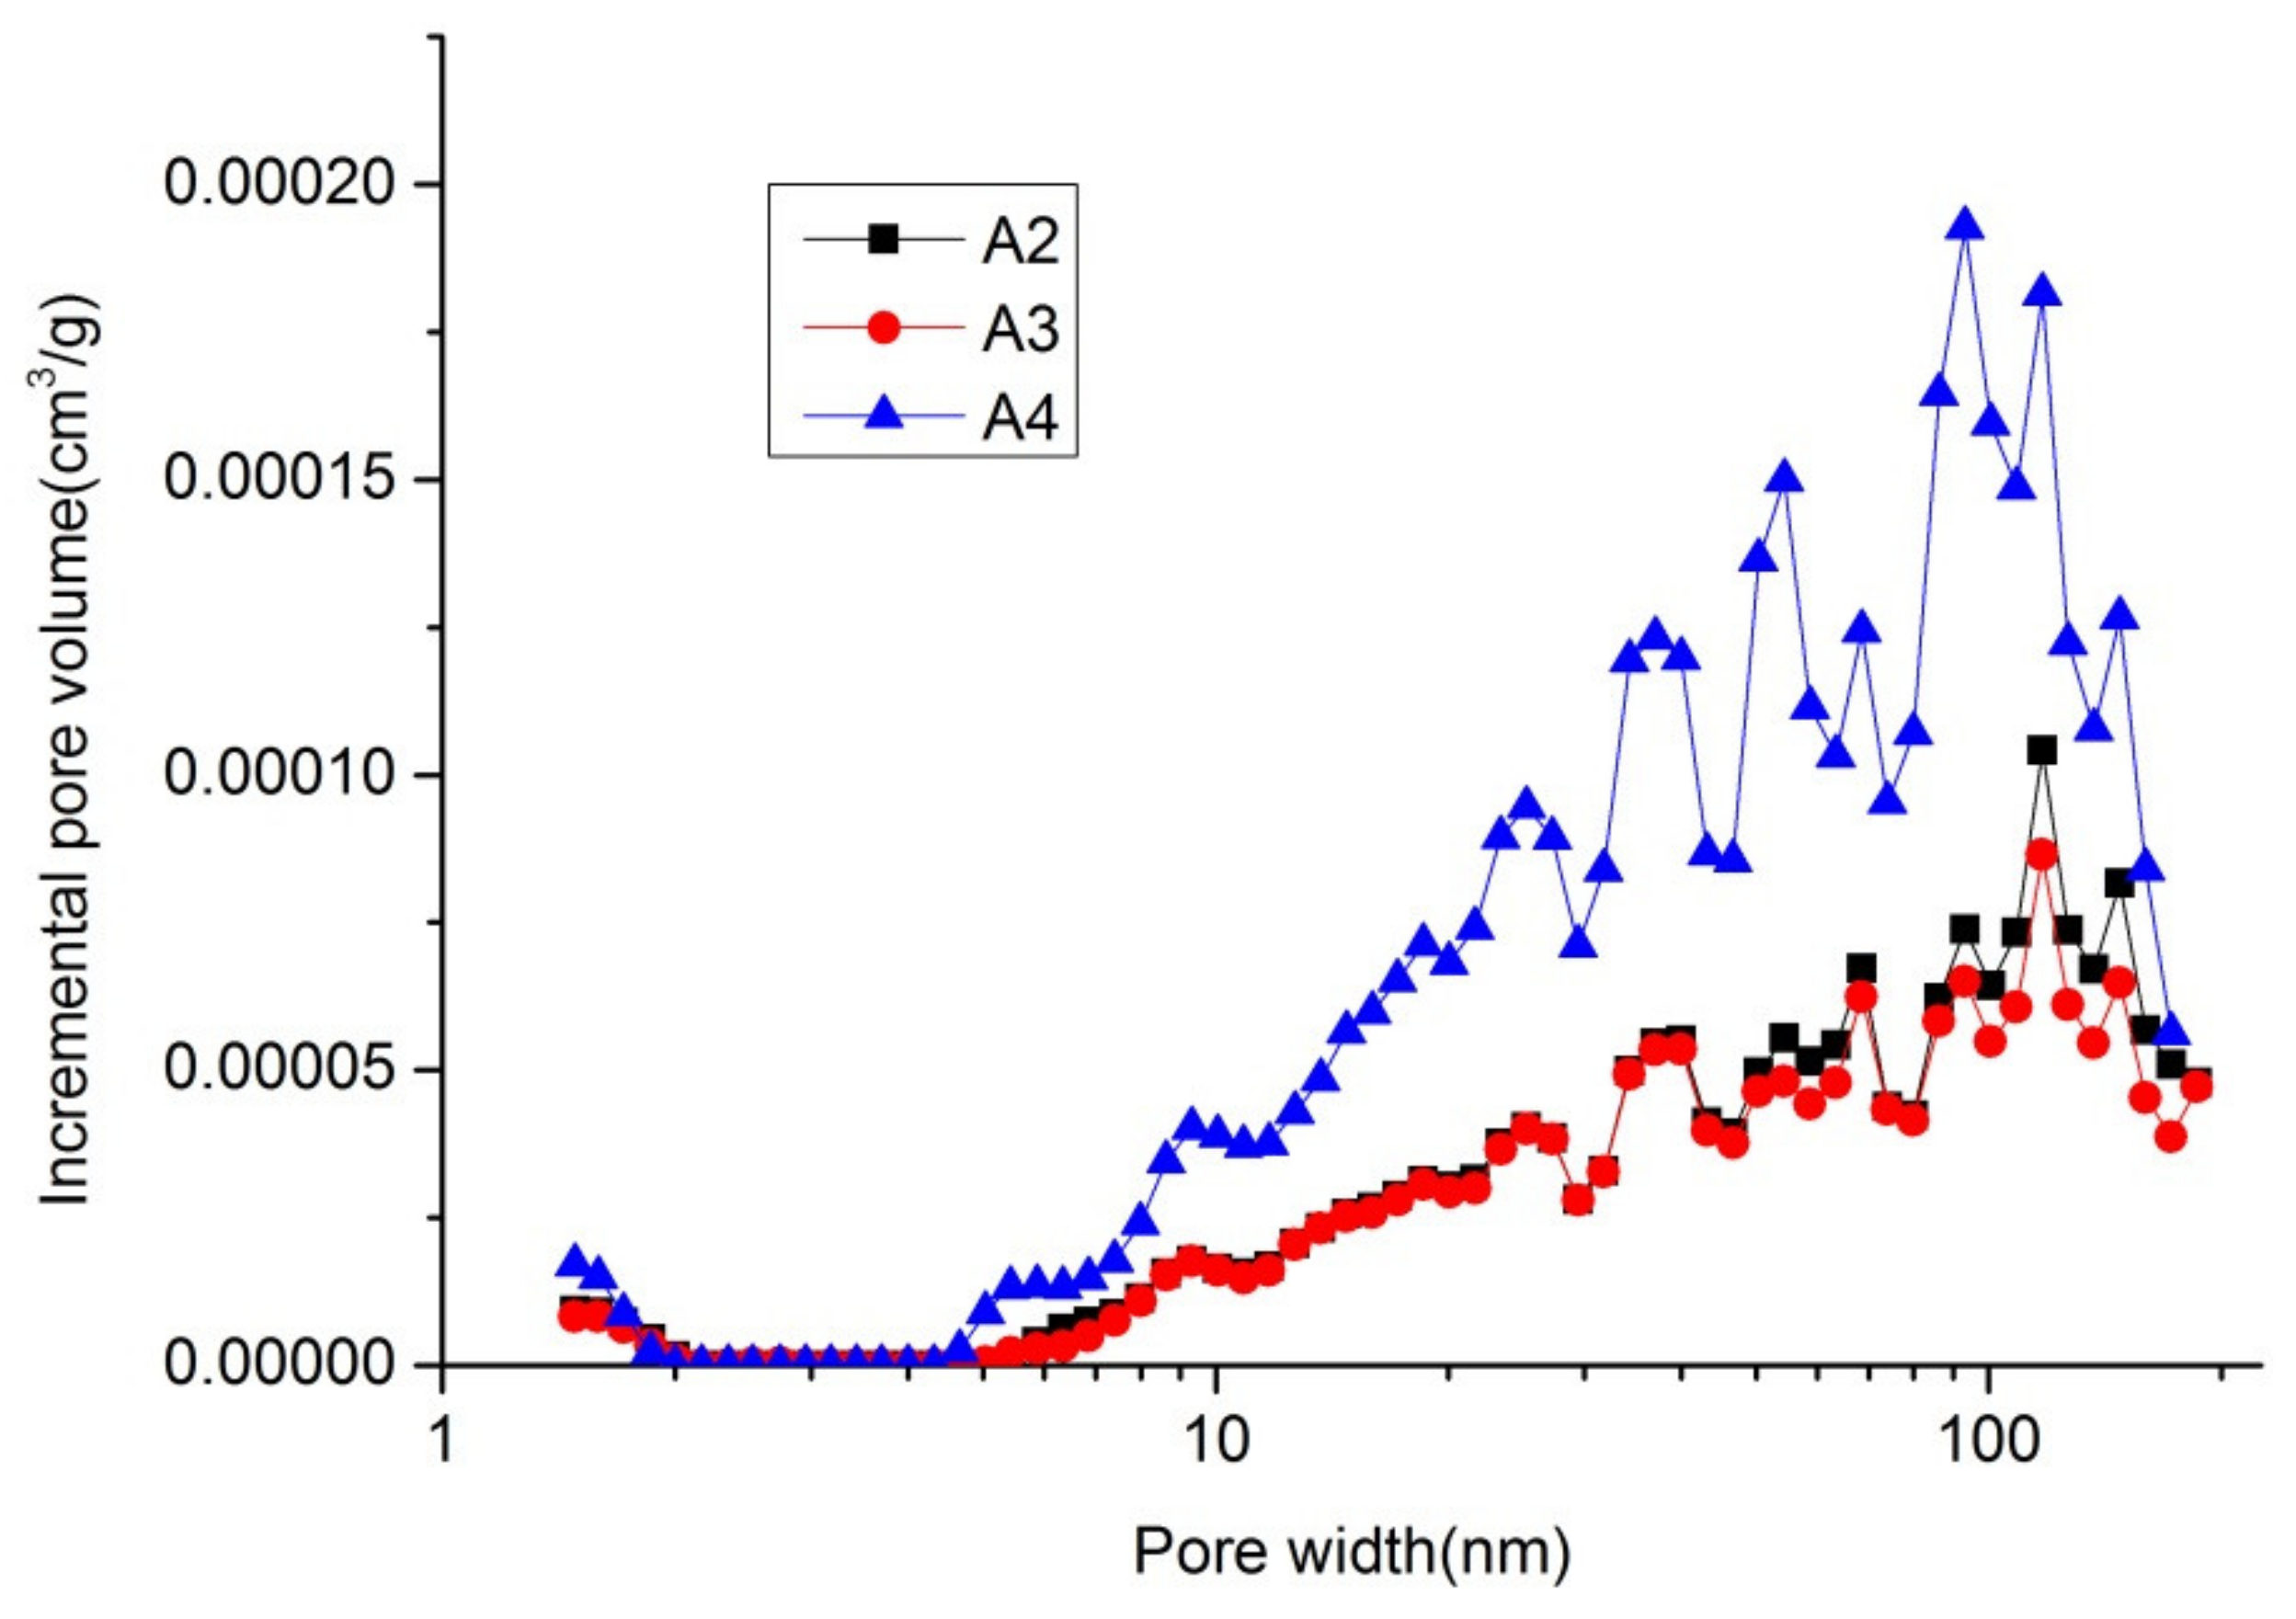
3.2.2. Pore Volume Comparison

The comparison of pore volume can be seen from the pore volume distribution diagram of the coal sample (Figure 6). With the decrease of particle size of the coal sample, the pore volume of the coal sample has been greatly improved. Especially for coal samples smaller than 200 mesh, the pore volume increases significantly by more than twofold. In addition, the peak value of the pore volume tends to shift to a small pore size. According to the statistical results of pore volume distribution (Table 2), compared with coal sample A2, the microporous pore volume of coal sample A4 increases by six times and the transition pore increases by more than two times, while the medium and large pores decrease. The test results are consistent with the mercury injection data.

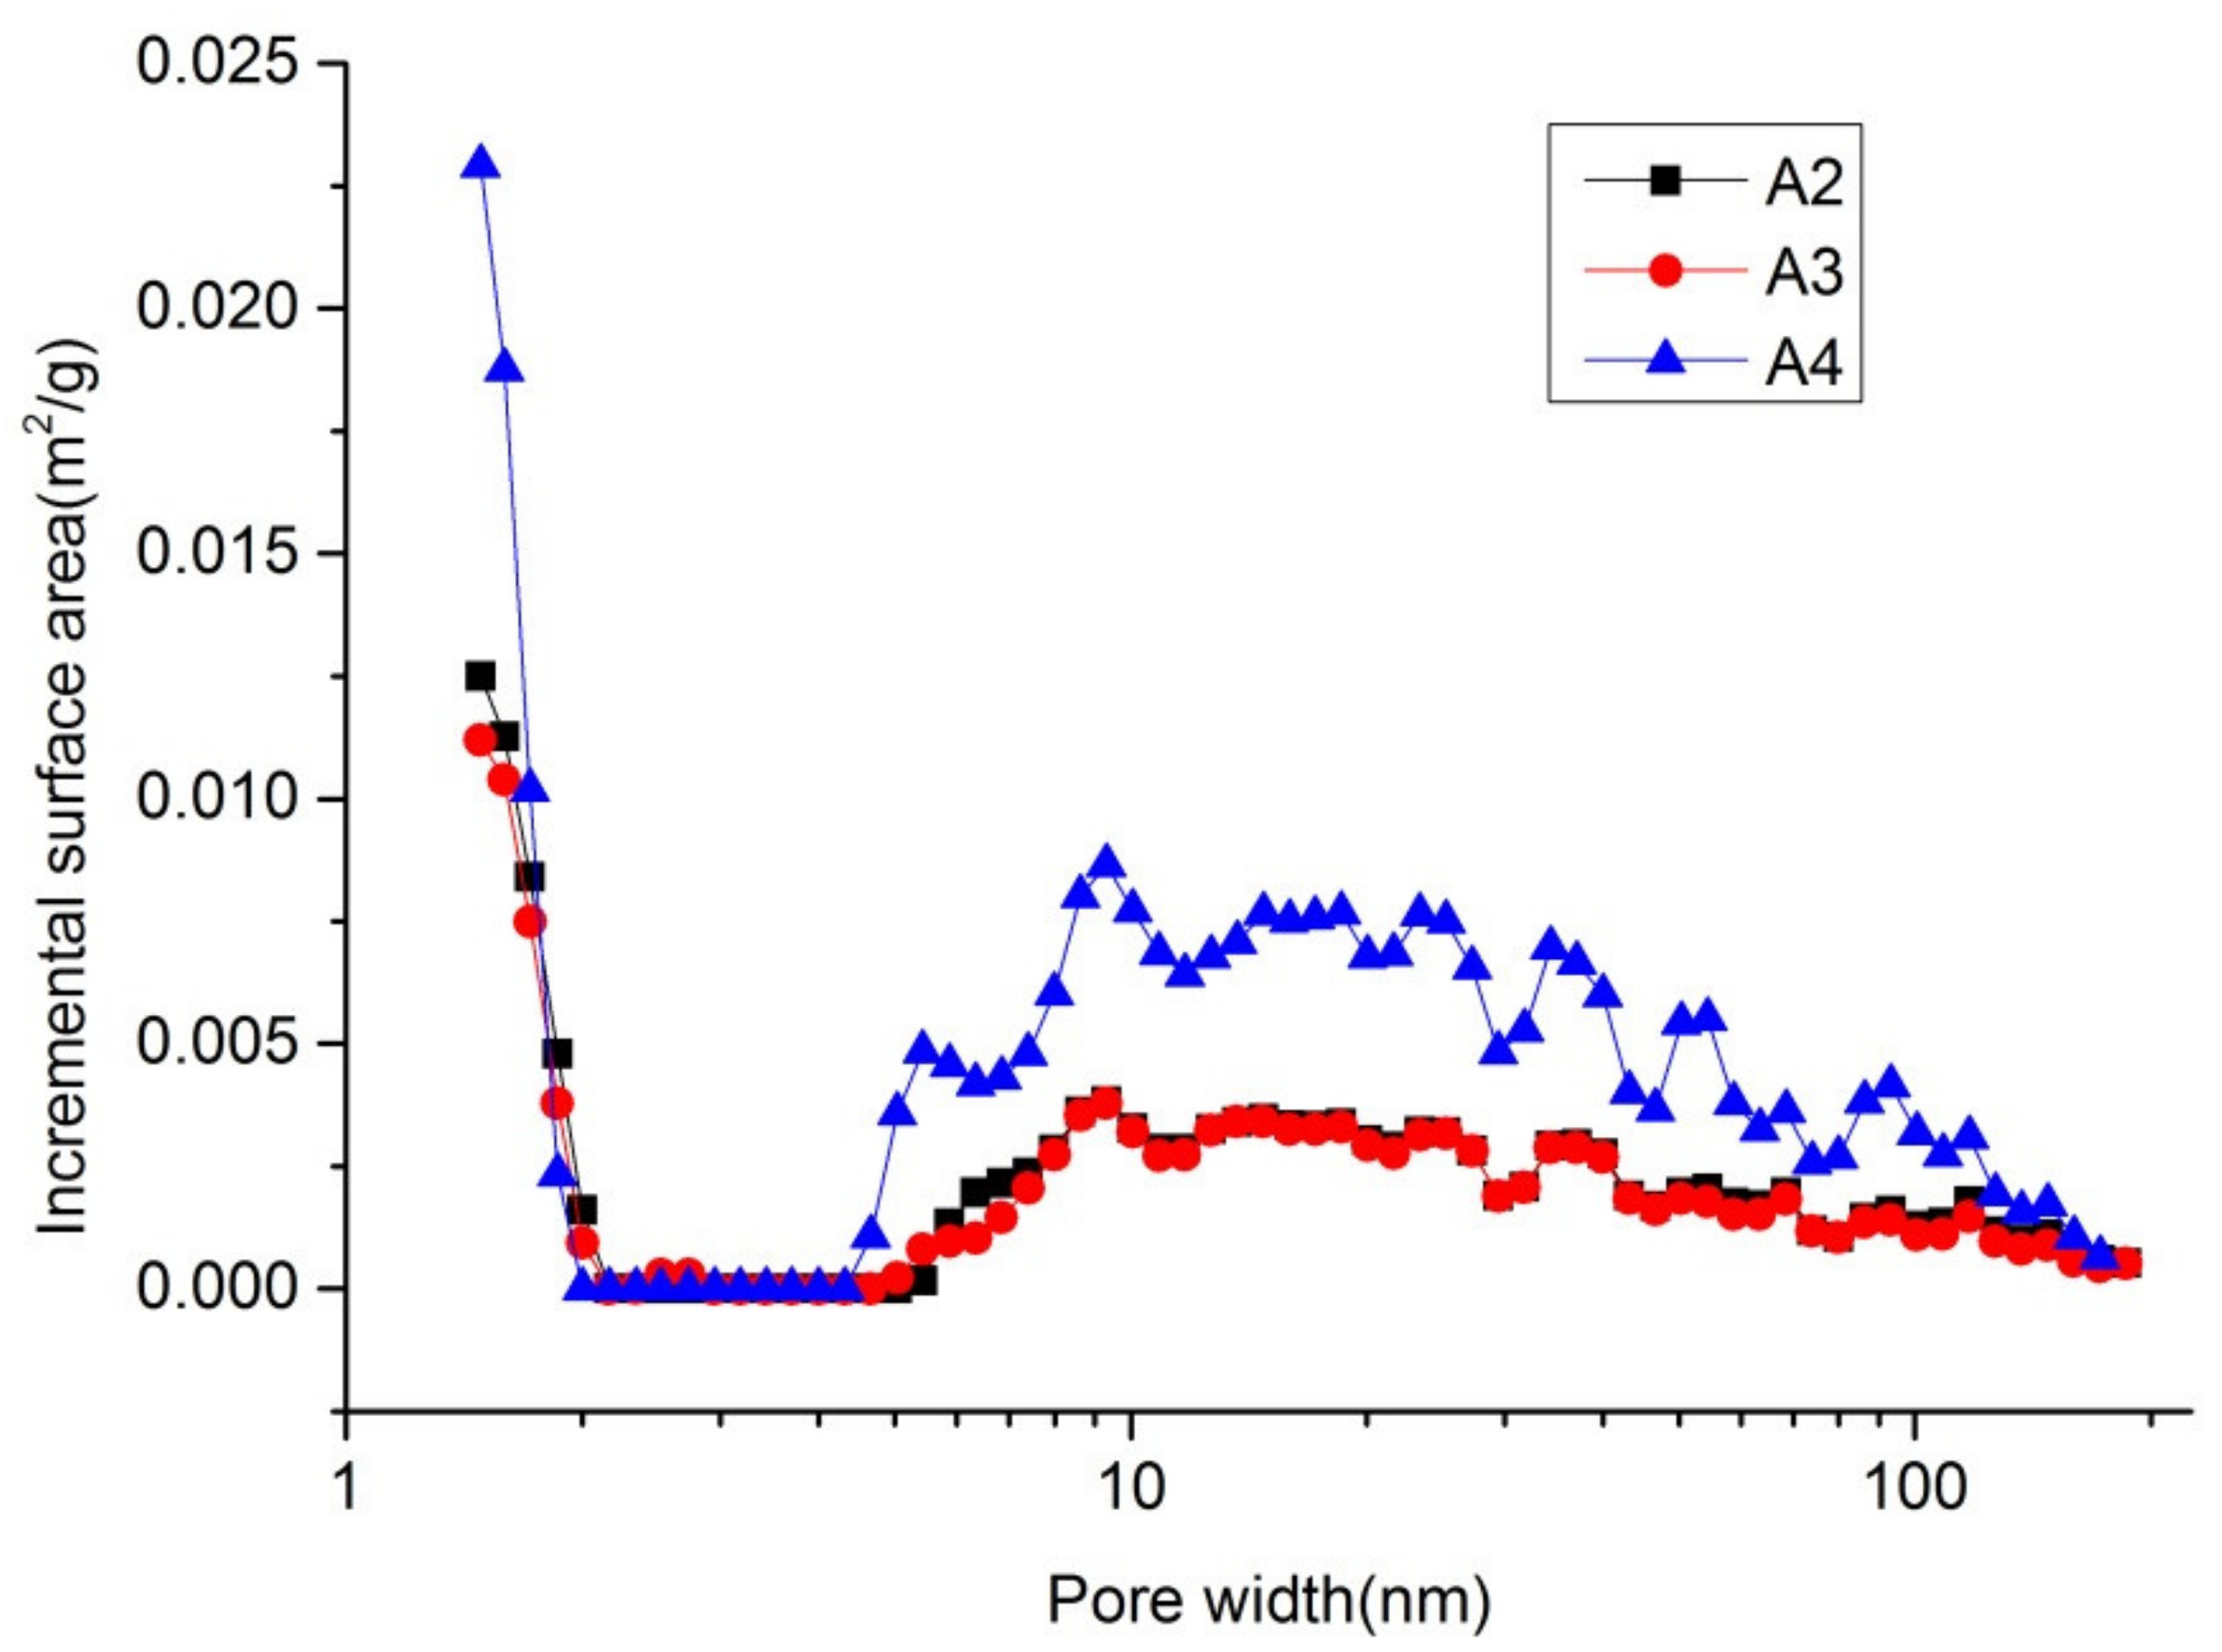
3.2.3. Comparison of Specific Surface Area

As can be seen from the distribution diagram of pore specific surface area of coal samples (Figure 7), the pore specific surface area of coal increases greatly with the decrease of particle size of the coal sample. The statistical results of specific surface area distribution of coal samples with different particle sizes (Table 3) show that, compared with coal sample A2, the total specific surface area of coal sample A4 increases by about four times, while the specific surface area of micropores increases significantly, by about five times. Compared with coal samples with three particle sizes, the specific surface area of samples with particle sizes smaller than 200 mesh increases significantly.

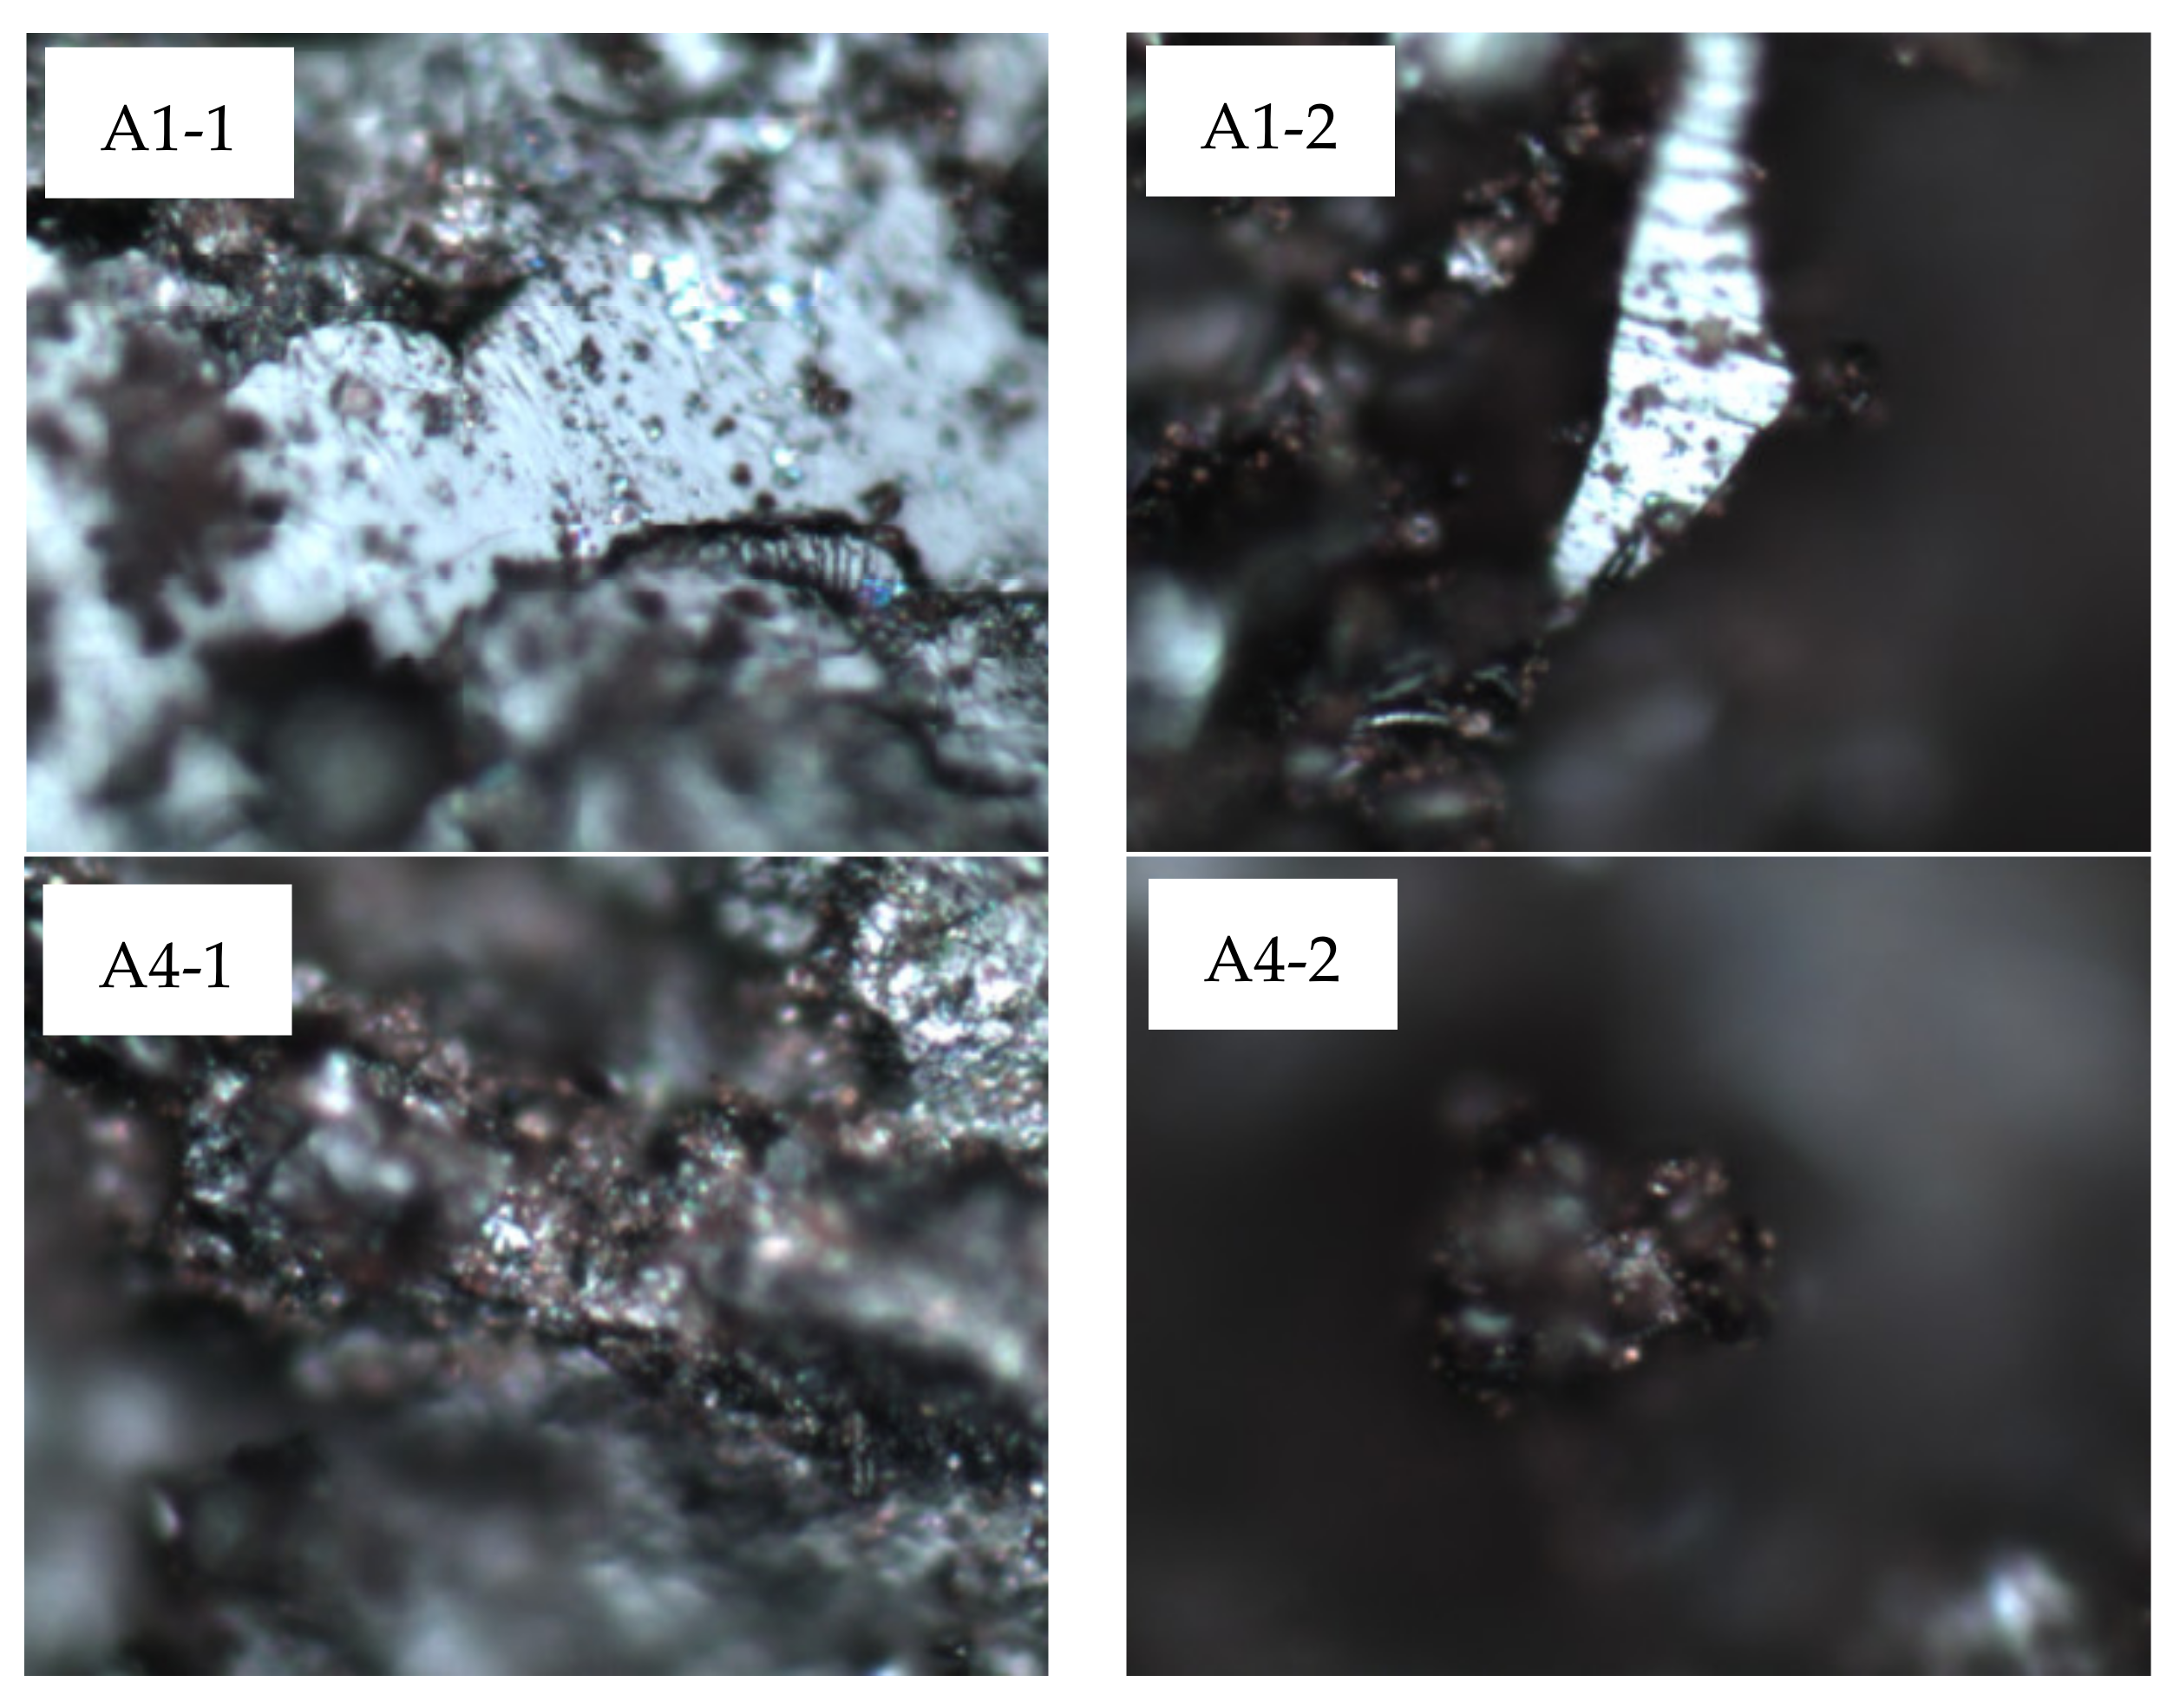
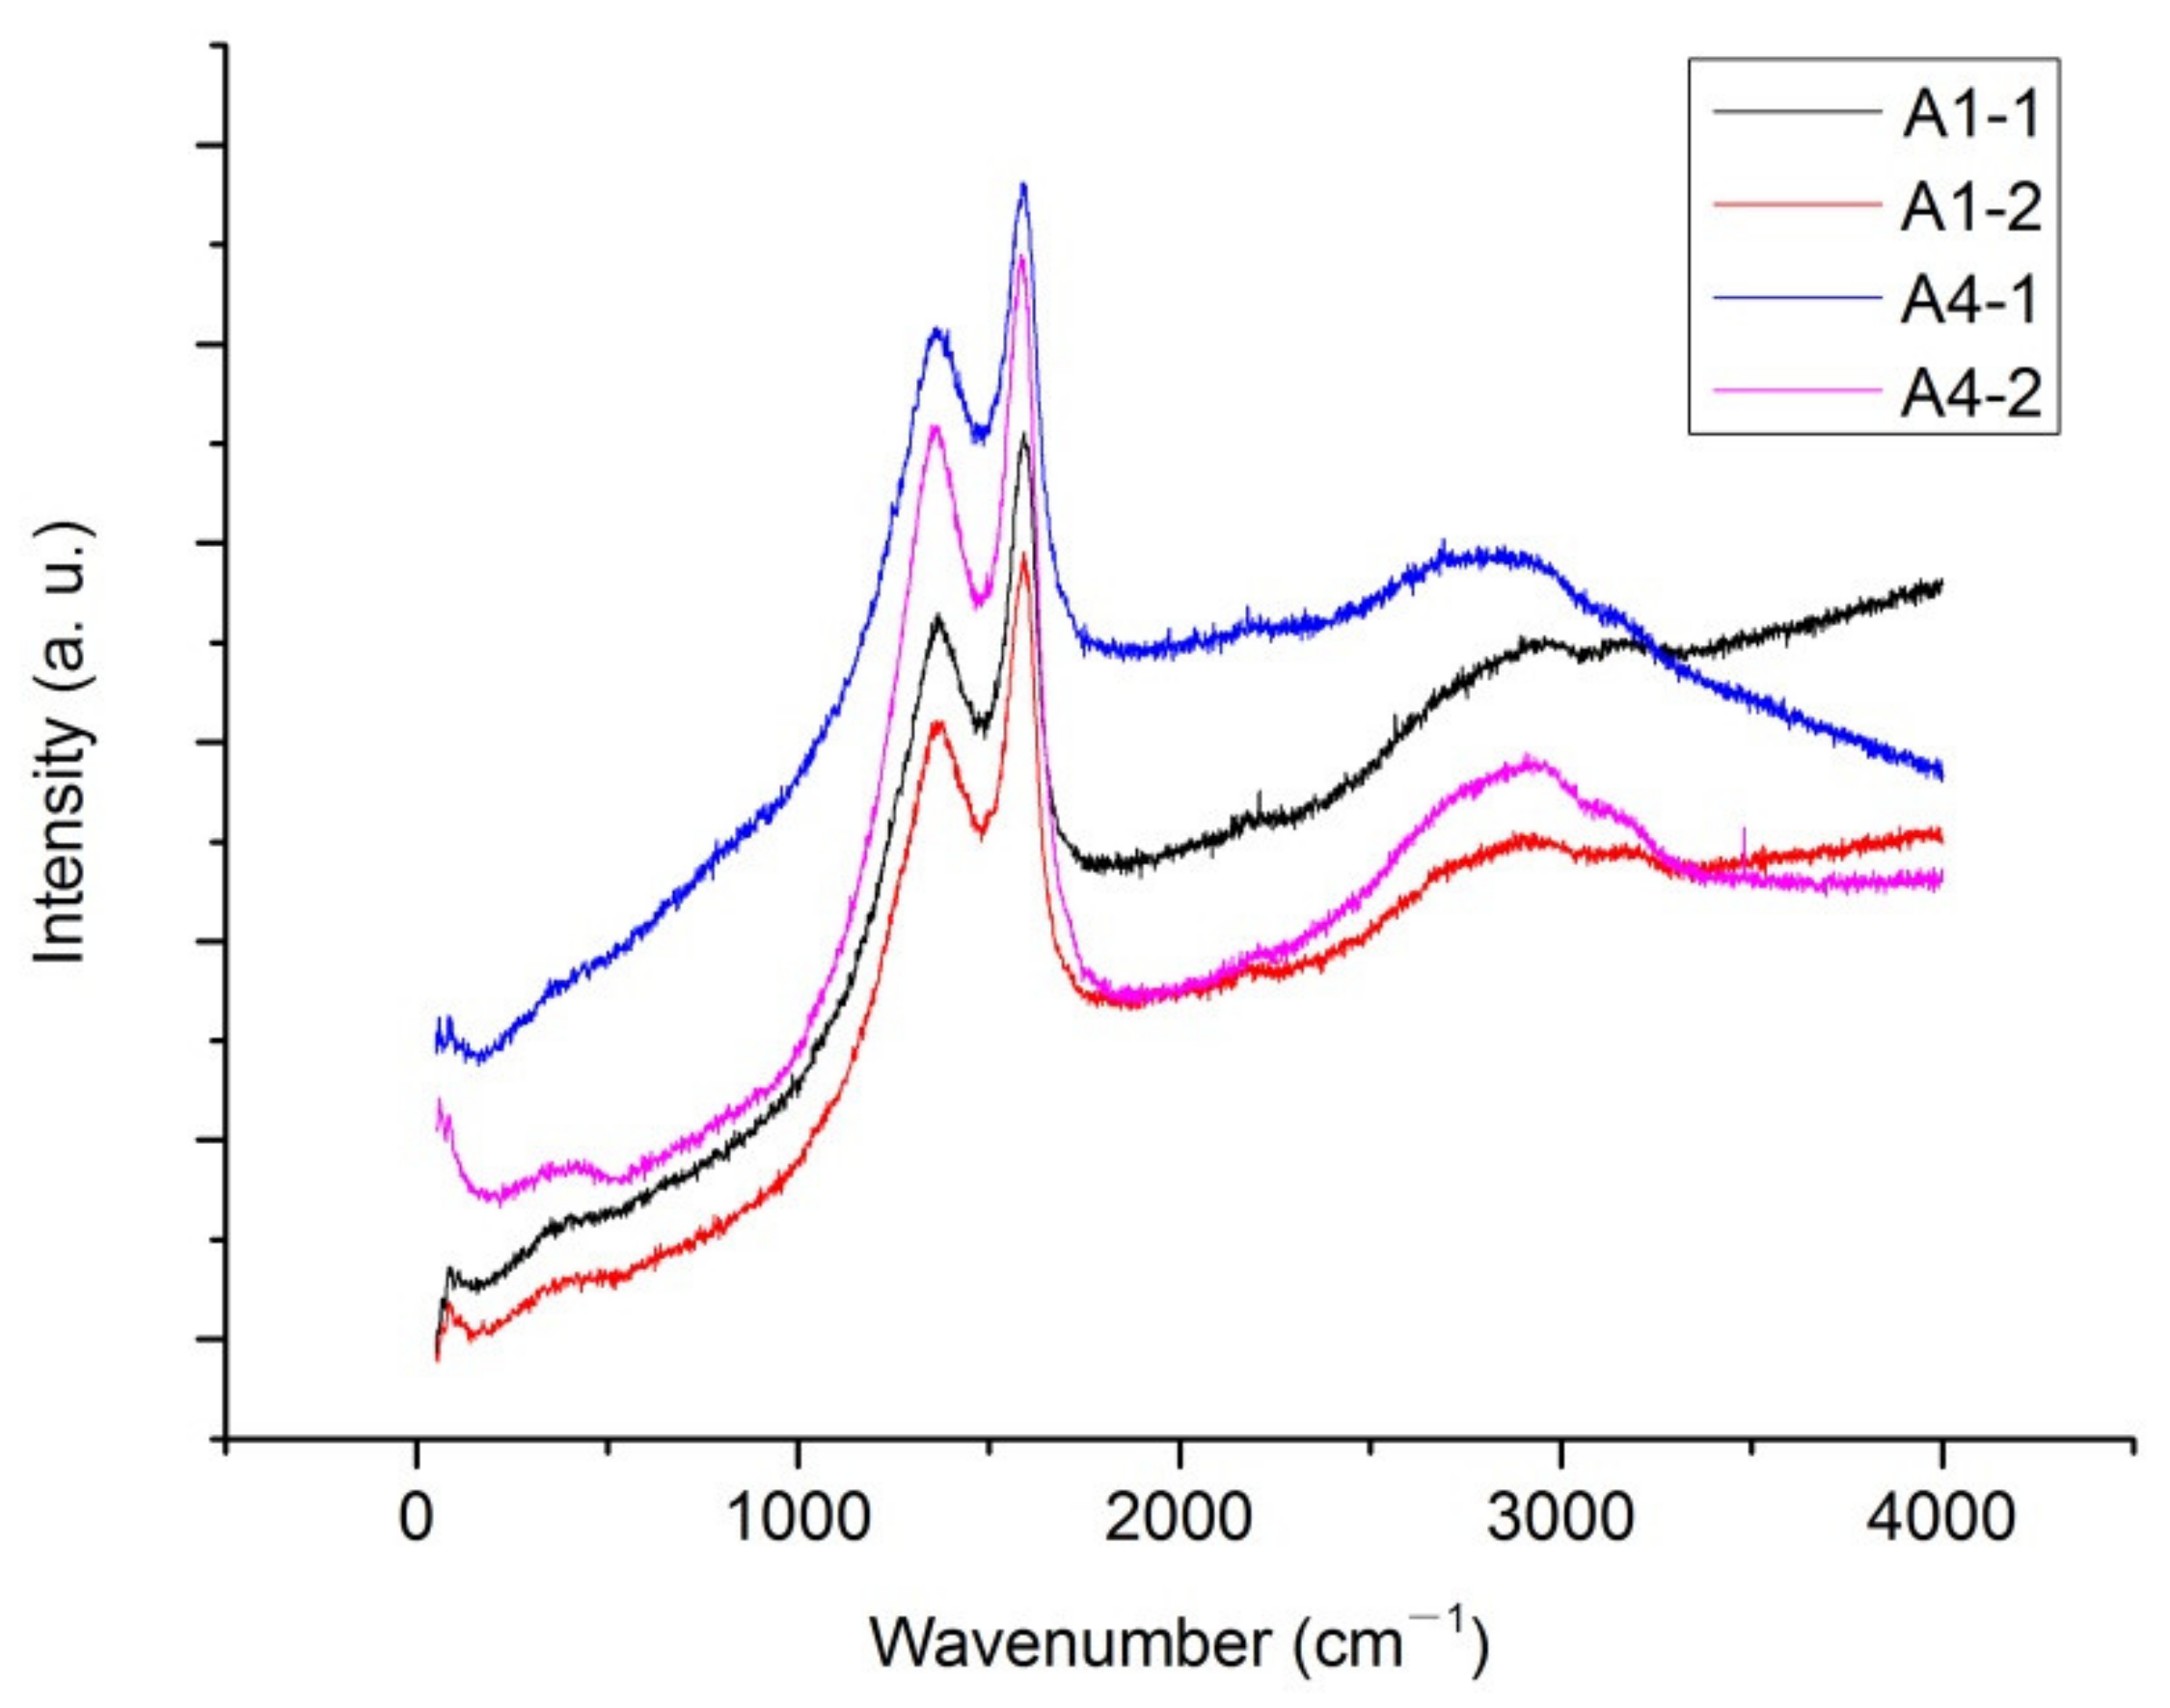
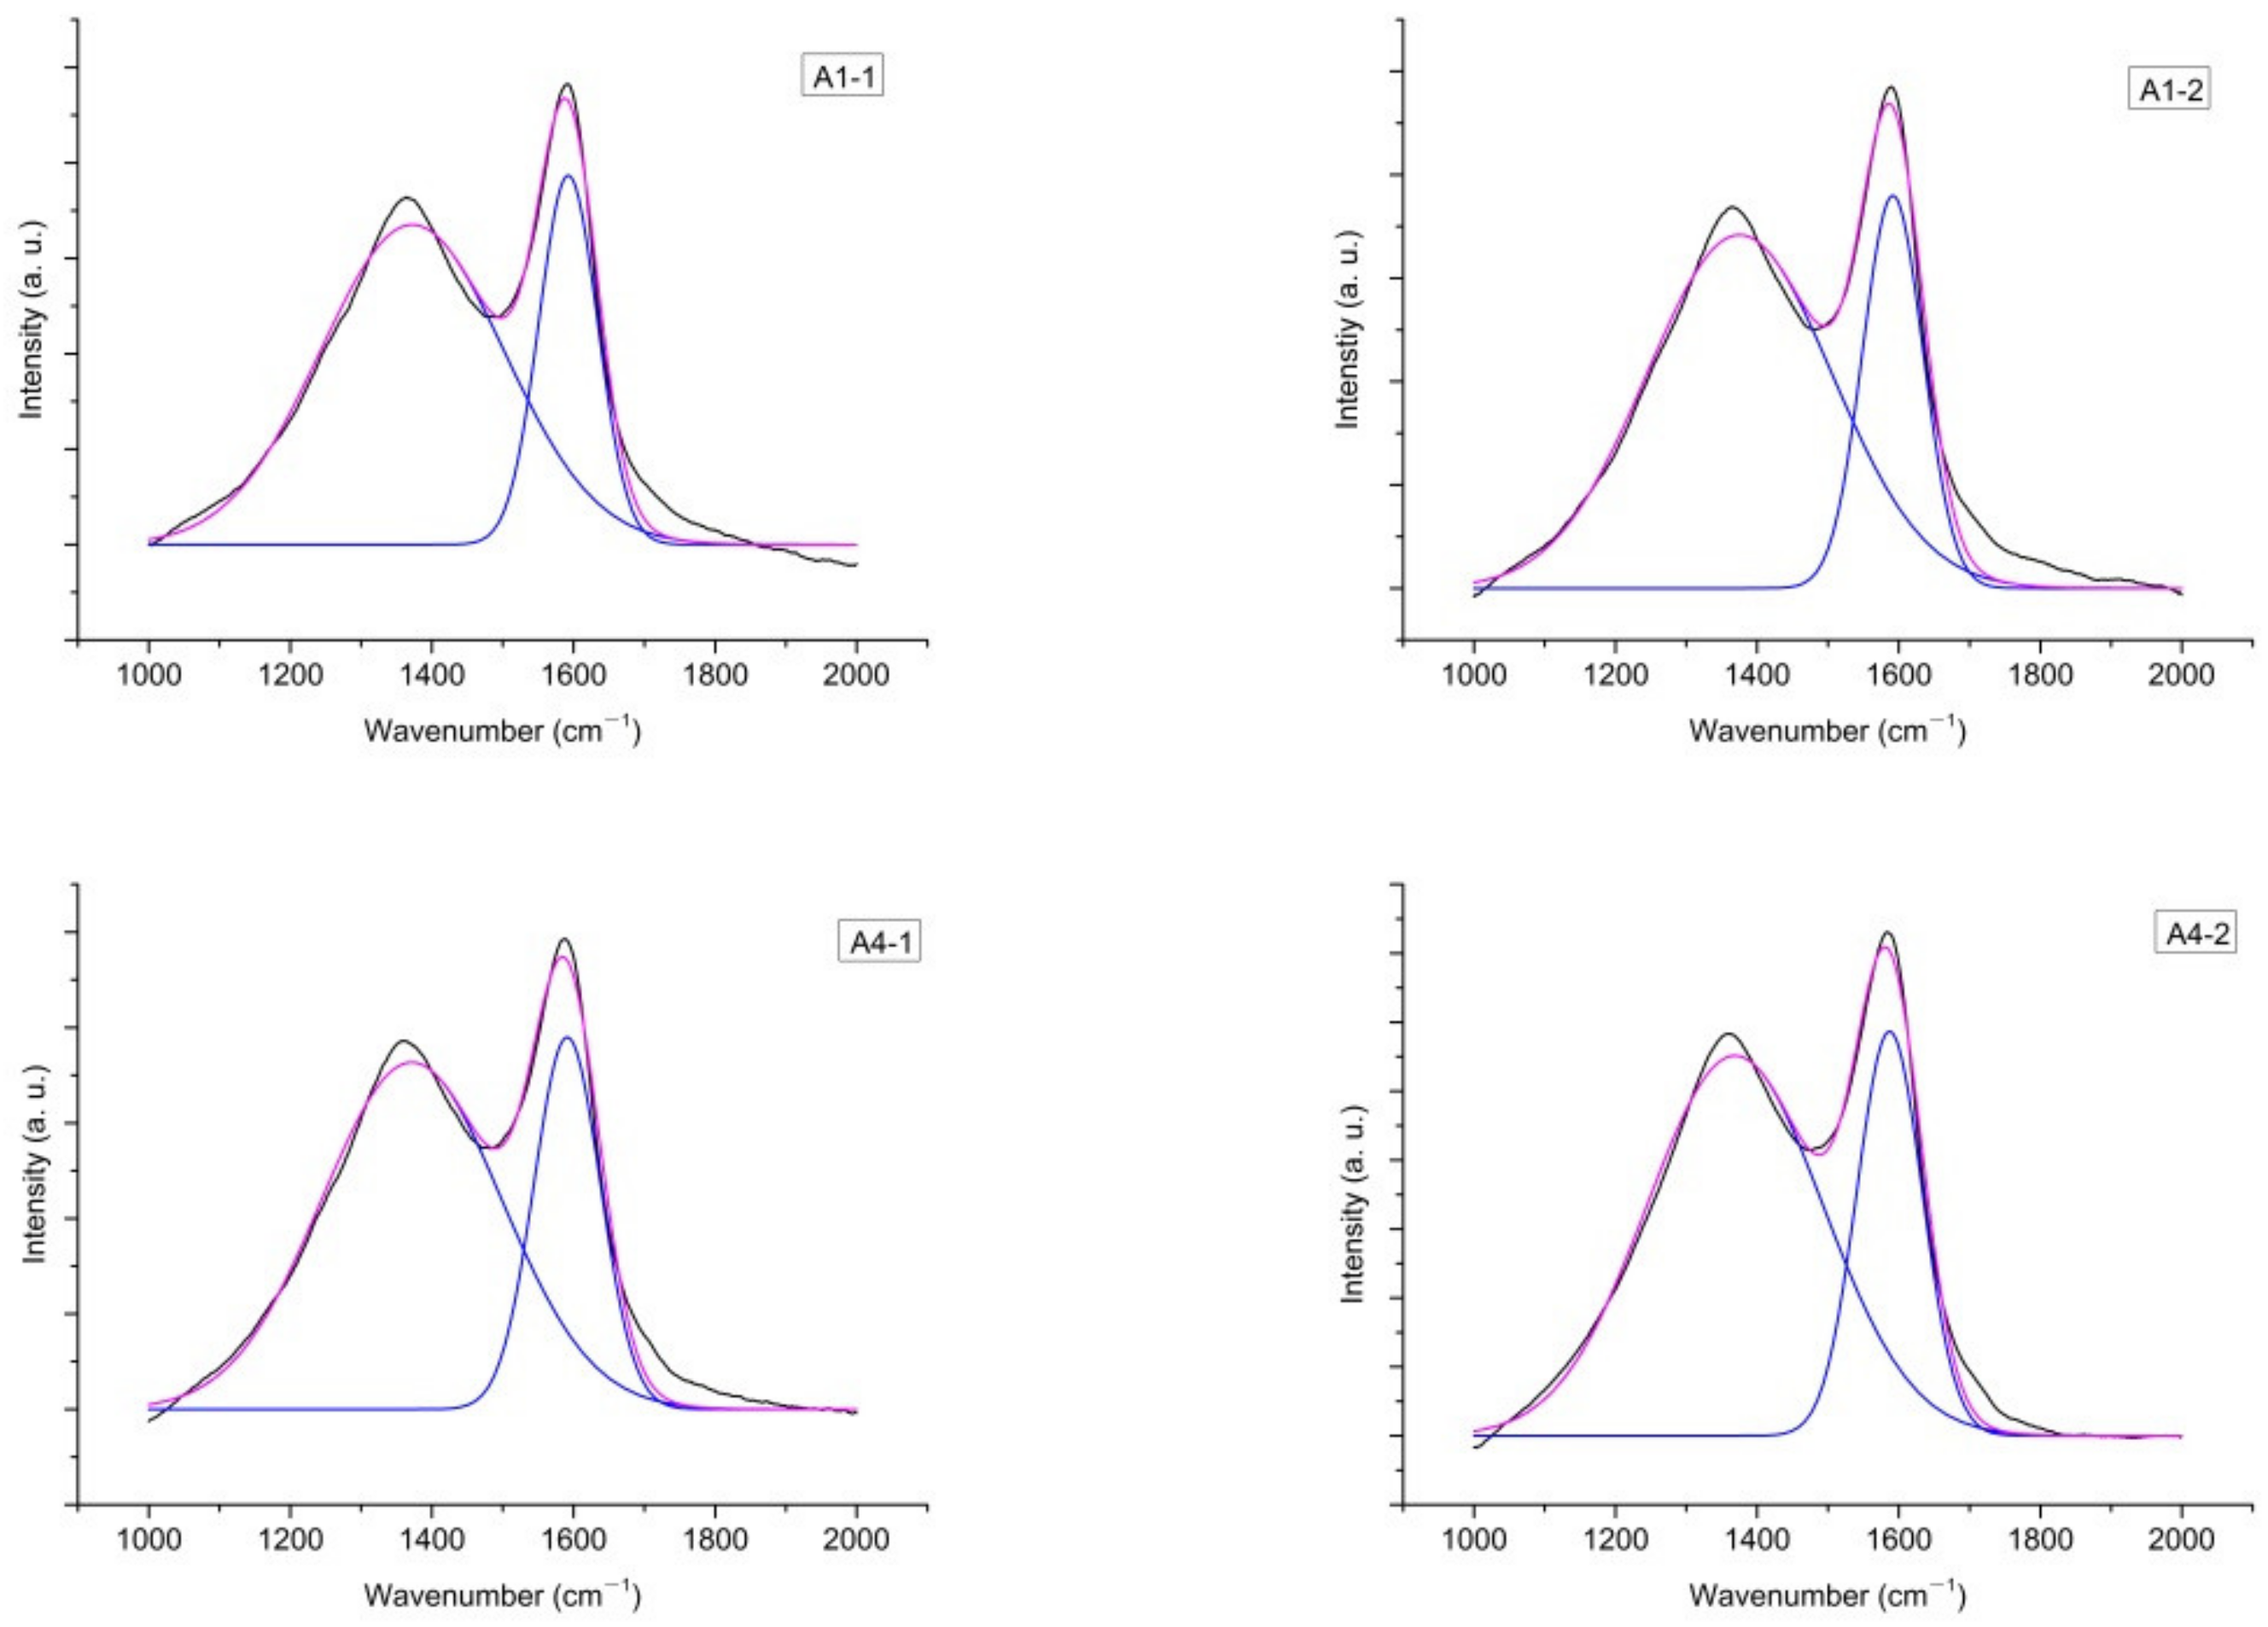
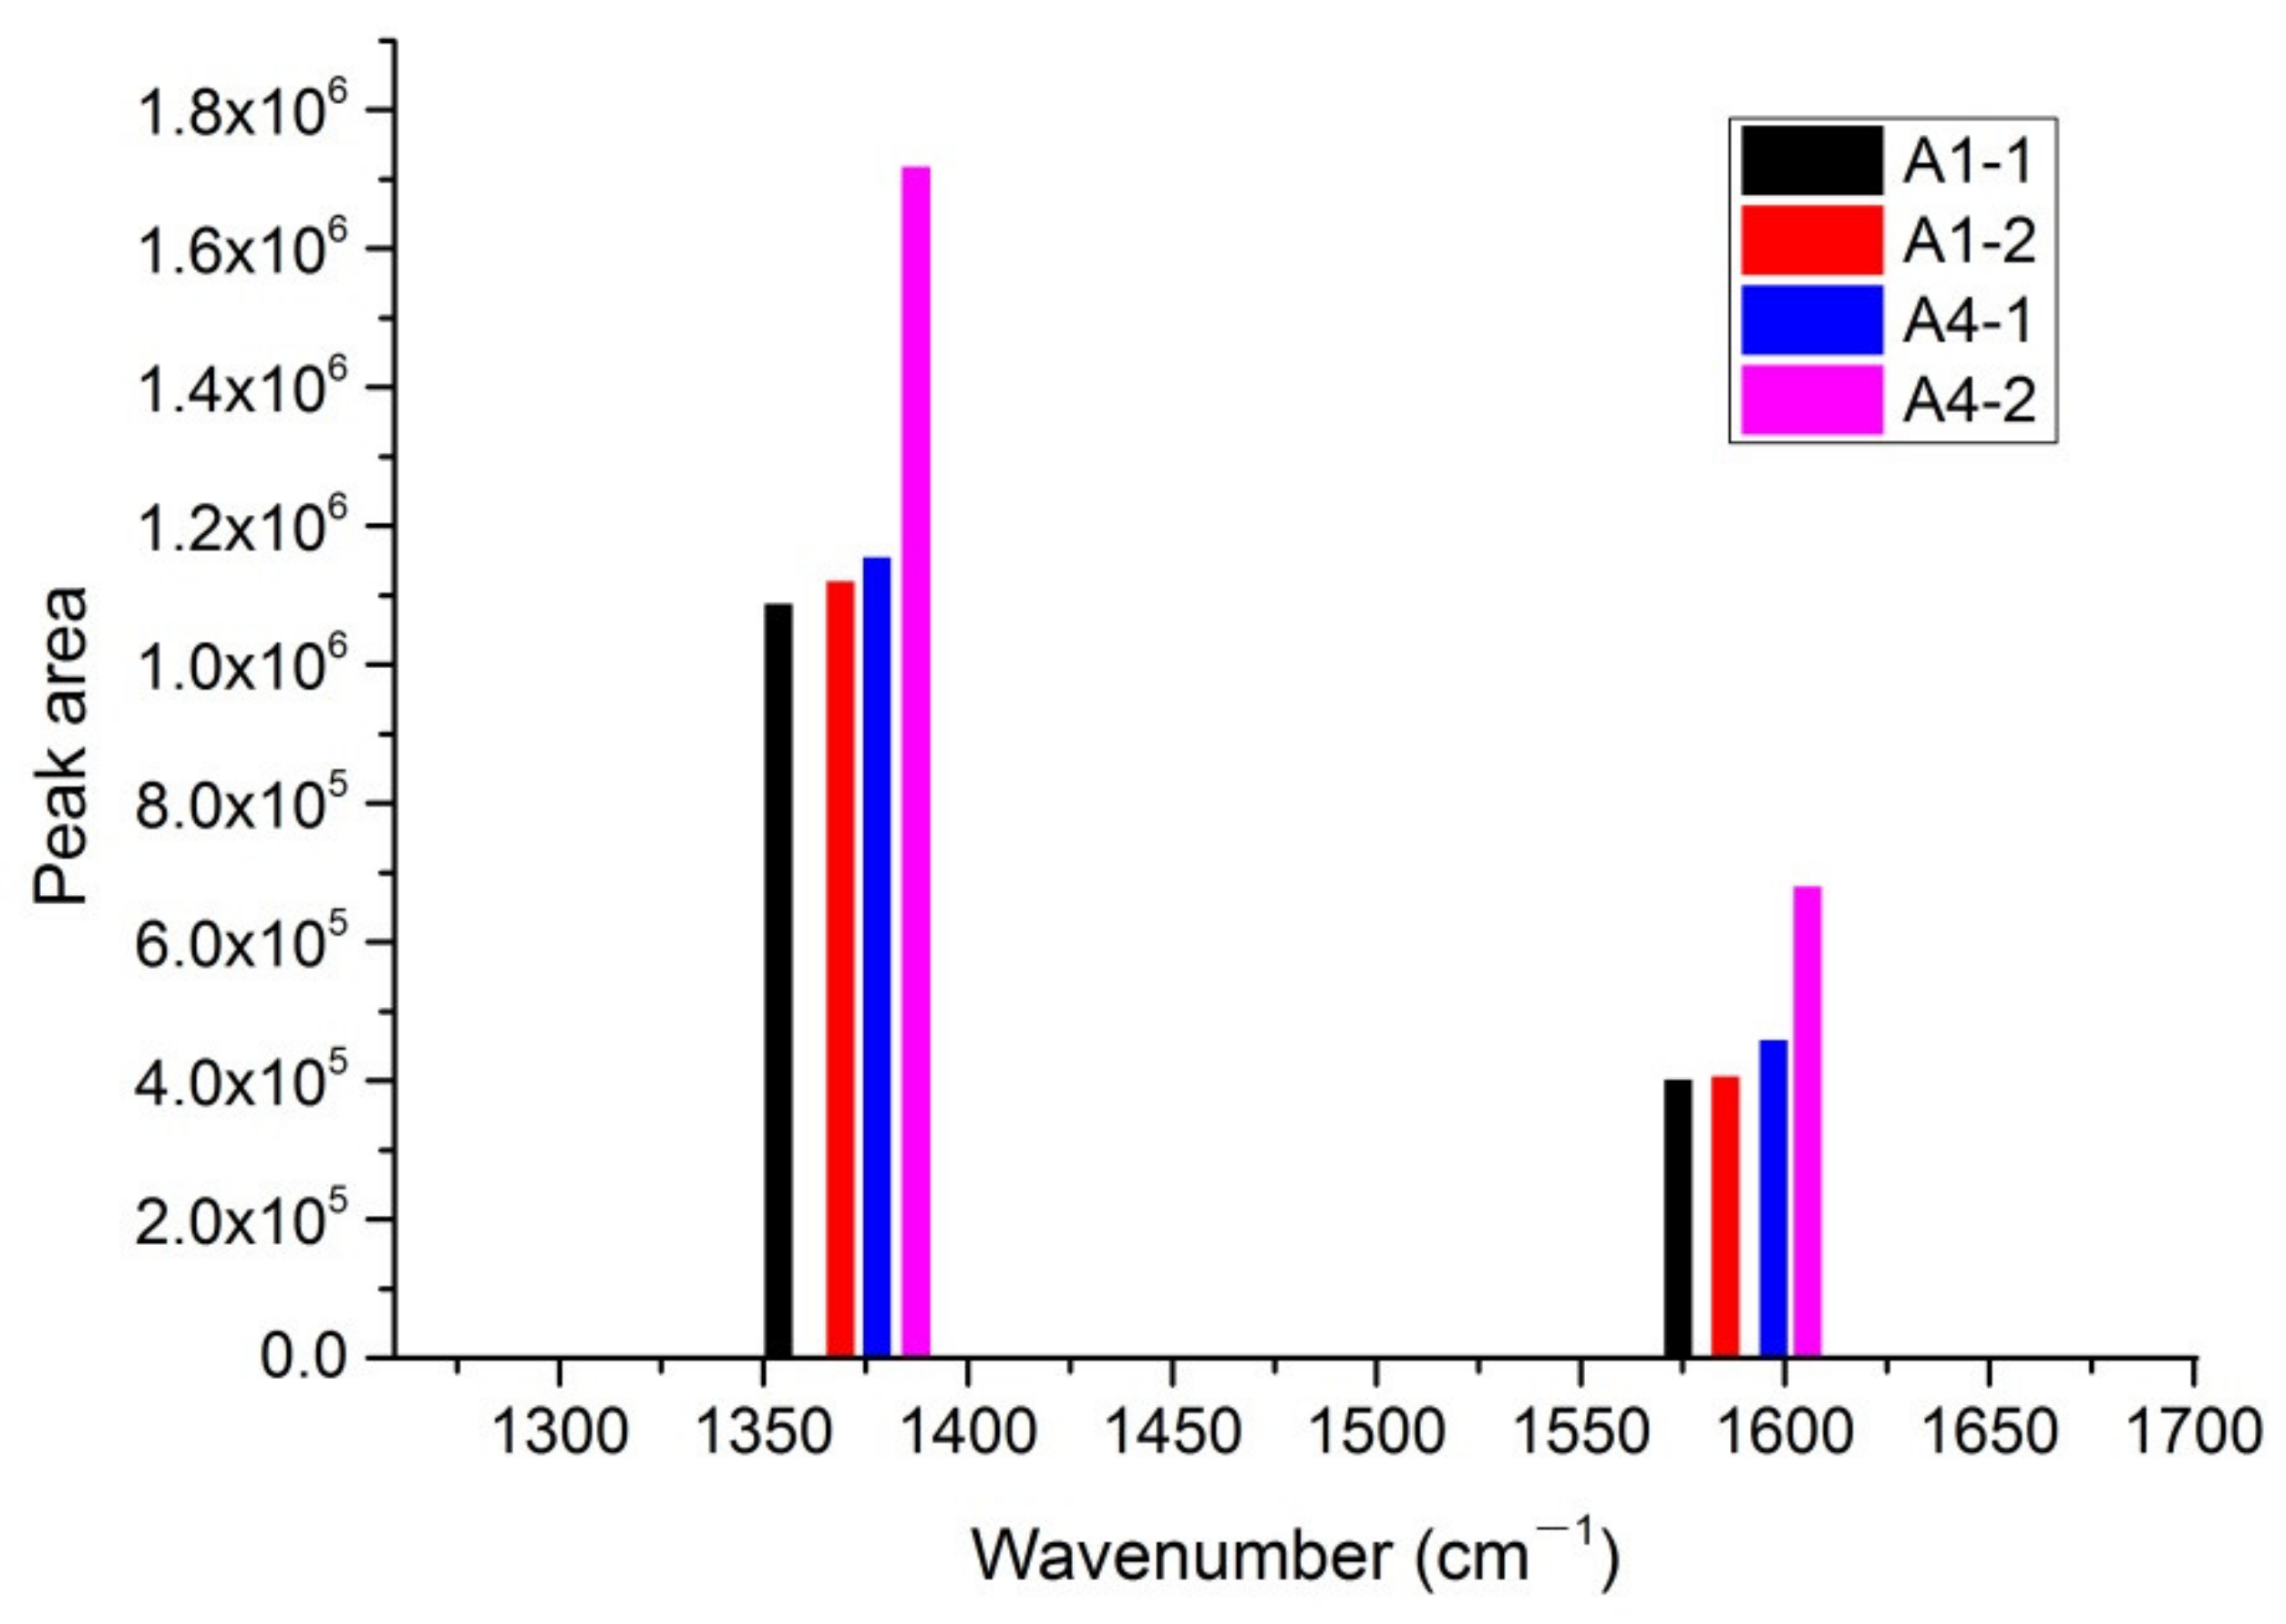
3.3. Raman Spectrum Analysis

Raman spectroscopy is a nondestructive and rapid detection technology, which can be used to reveal the disorder of amorphous structure and the order of the microcrystalline structure in coal samples [27,28]. The Raman effect originates from molecular vibration, lattice vibration and rotation. Therefore, the relevant information of molecular vibration energy level, lattice vibration energy level and rotation energy level structures can be obtained from the Raman spectrum [29].
The equipment used this time was a Horiba Evolution Raman spectrometer, and a 532 nm laser was selected for testing. The prepared block sample A1 and powder sample A4 were selected for comparative study, and two test points in each coal sample were selected for testing (Figure 8).
The generation of characteristic Raman bands of coal samples is closely related to the internal structure composition and molecular ordering degree of organic matter molecules. The generation of the D peak is attributed to the presence of lattice defects or heteroatoms in the structural units of coal macromolecules, also known as a disordered peak. The area of the D peak depends on the defects in the macromolecular structure of coal, and the area of the D peak is positively correlated with the structural defects. The G peak is the only graphite-like characteristic peak in the Raman spectrum curve. The G peak band is related to the stretching vibration of C=C in the molecular structure and represents the degree of ordering in the molecular structure. The area of the G peak is related to the total amount of aromatic rings and the enrichment degree of aromatic carbon in the macromolecular structure of coal. The larger the total amount of aromatic rings is, the higher the enrichment of aromatic carbon will be and the larger the area of the G peak will be [30].
The peak position and curve trend of the Raman spectrum of coal samples with different particle sizes are basically the same (Figure 9). In the wavenumber range of 1000–1800 cm−1 of the laser Raman spectrum, there are two obvious Raman vibration peaks, namely the D peak and G peak. The peak position of the D peak is 1350 cm−1, while that of the G peak is 1600 cm−1.
In order to quantitatively study the influence of crushing and grinding on the chemical composition and functional groups of coal, the Raman spectrum peak splitting Gaussian fitting was carried out using OriginPro software, and the Raman peak splitting fitting diagram and Raman peak splitting fitting parameters of coal samples at different positions were obtained. The R2 of all fitting results is greater than 0.98, thus indicating that the accuracy and reliability of the fitting data are high (Figure 10).
Based on the fitting results of the area and half peak area of the five peaks, the quantitative analysis of the influence of the height and half peak area of the five peaks on the surface structure of coal is based on the fitting results of the area and half peak area of the five peaks (Figure 11, Table 4). Compared with coal sample A2, the D peak area of coal sample A4 increases by about 50%. This shows that the defect of coal increases, and the amorphous carbon content increases. The G peak area of coal sample A4 also increases significantly, and the peak intensity increases by nearly twofold, indicating that the content of aromatic carbon increased. The results reveal that the fragmentation and grinding in the sample preparation process promote the ordering of the coal macromolecular structure.

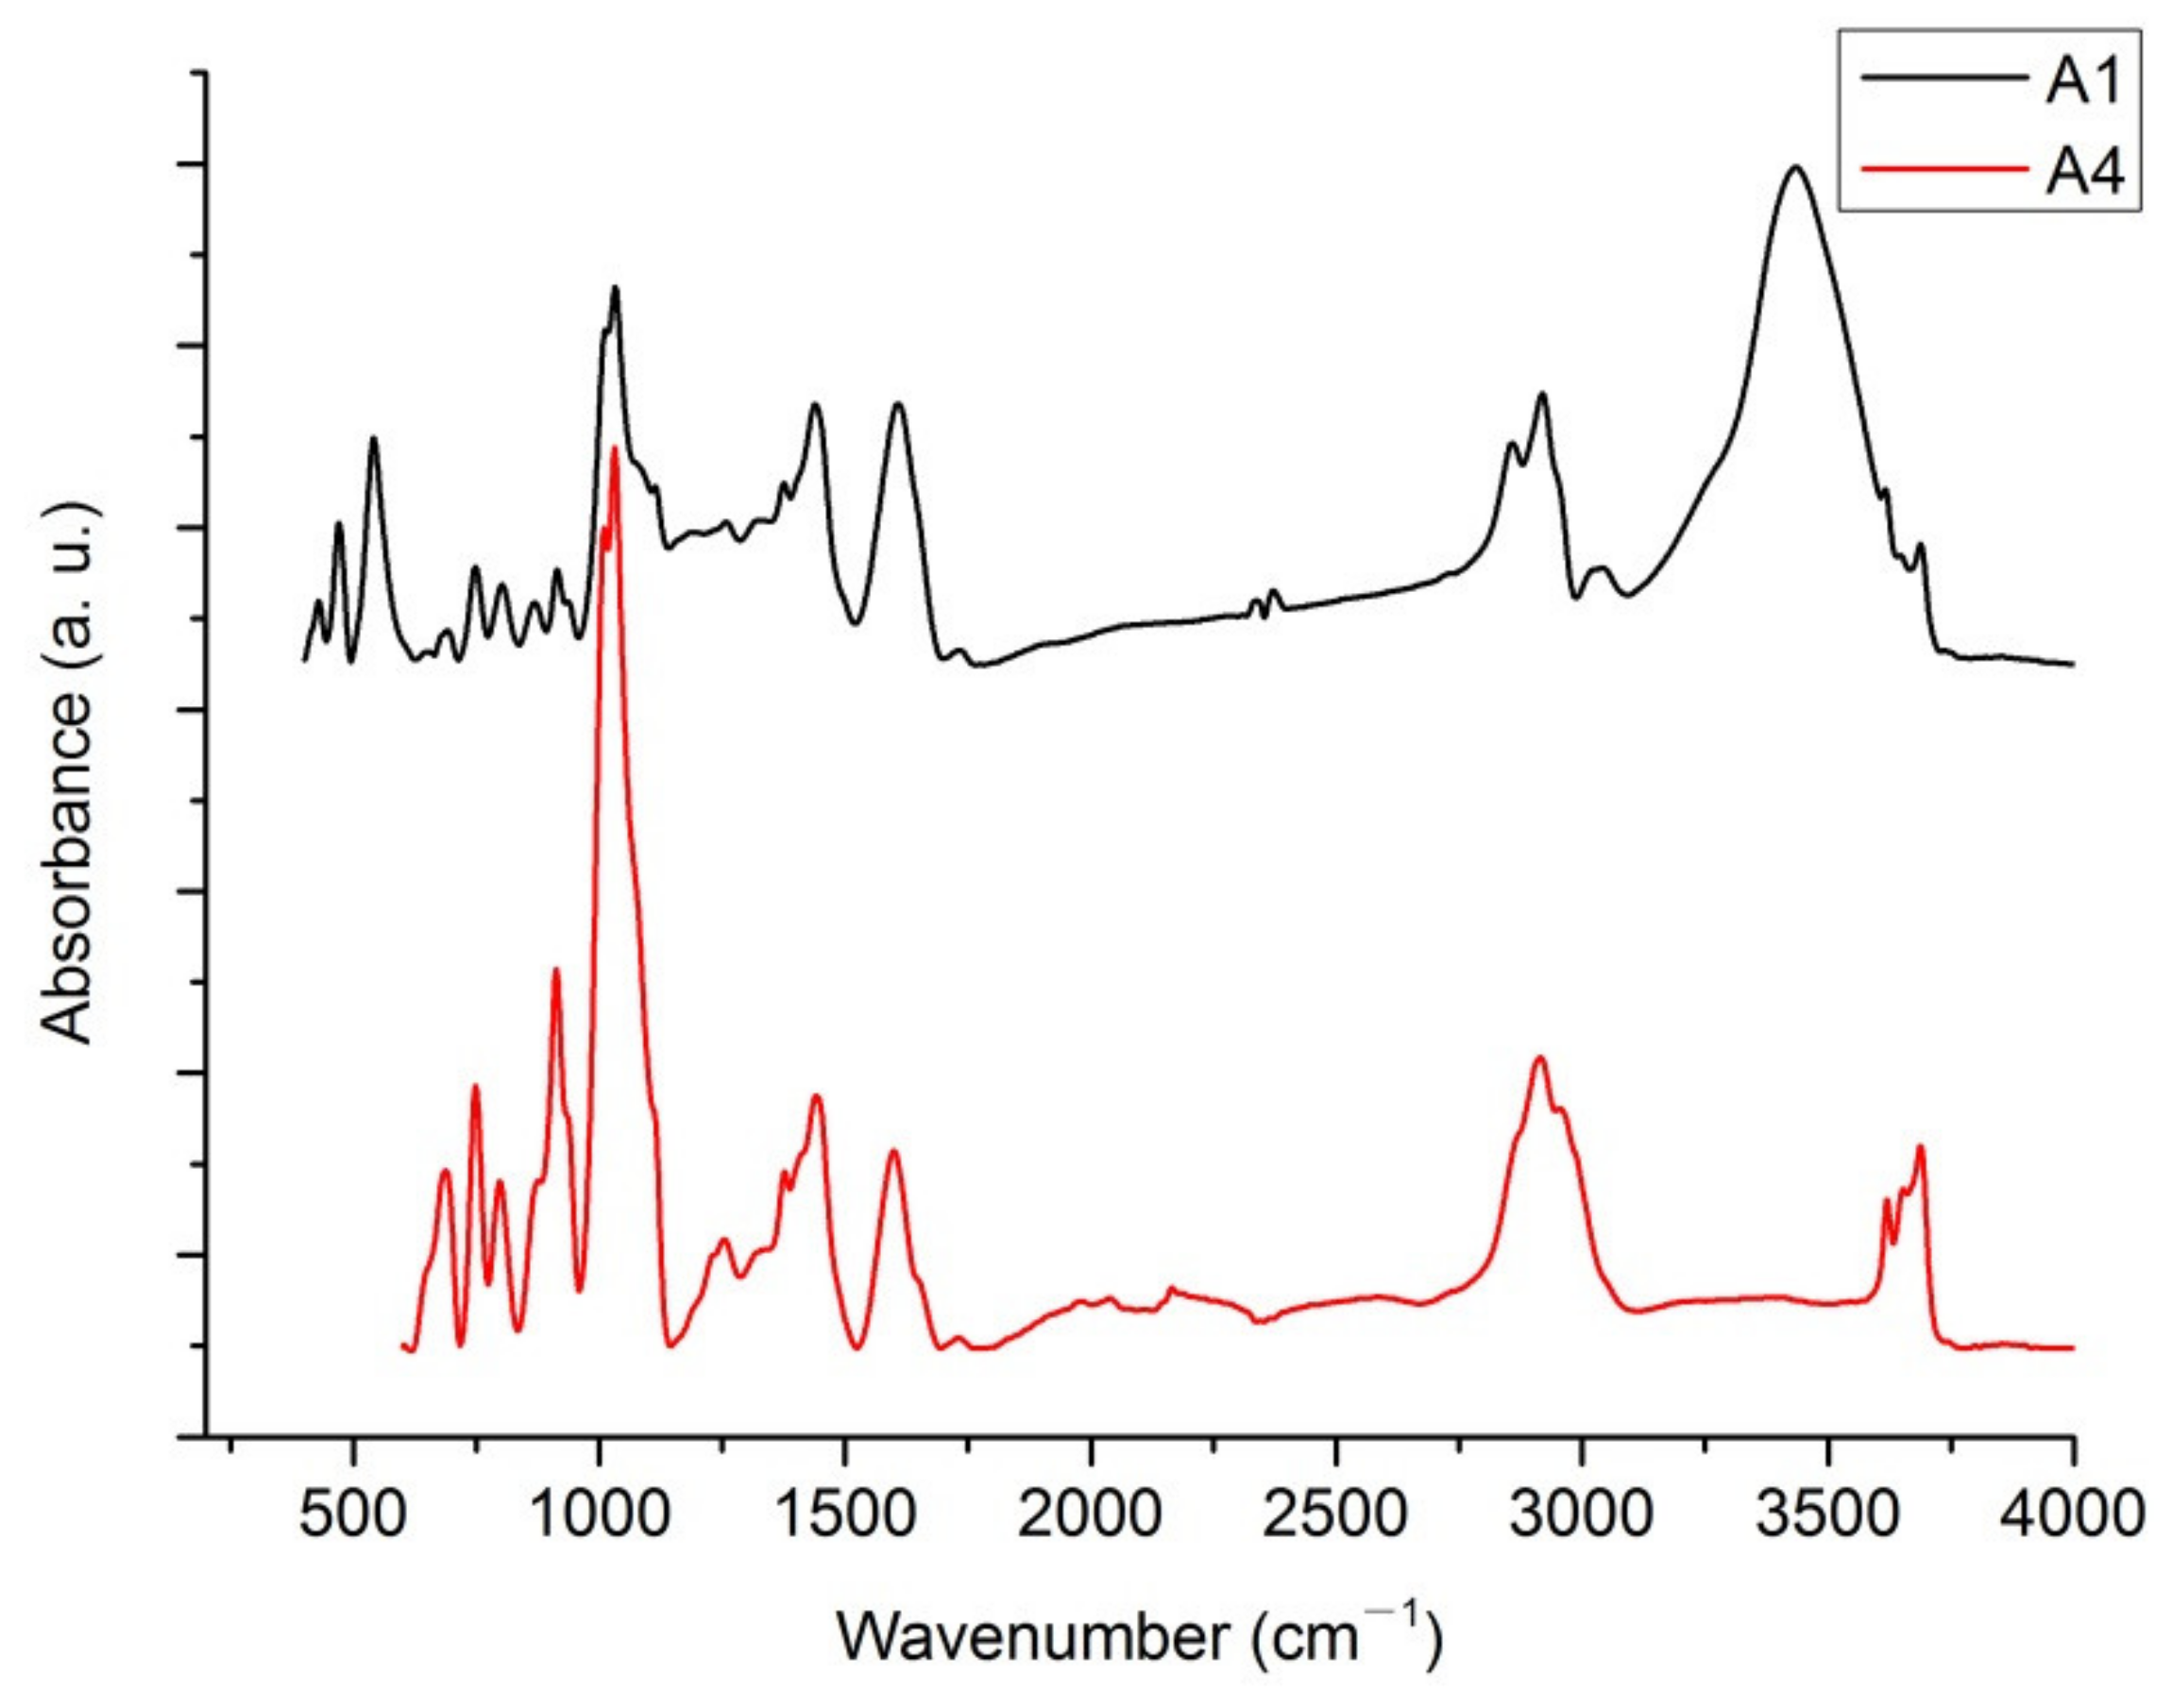
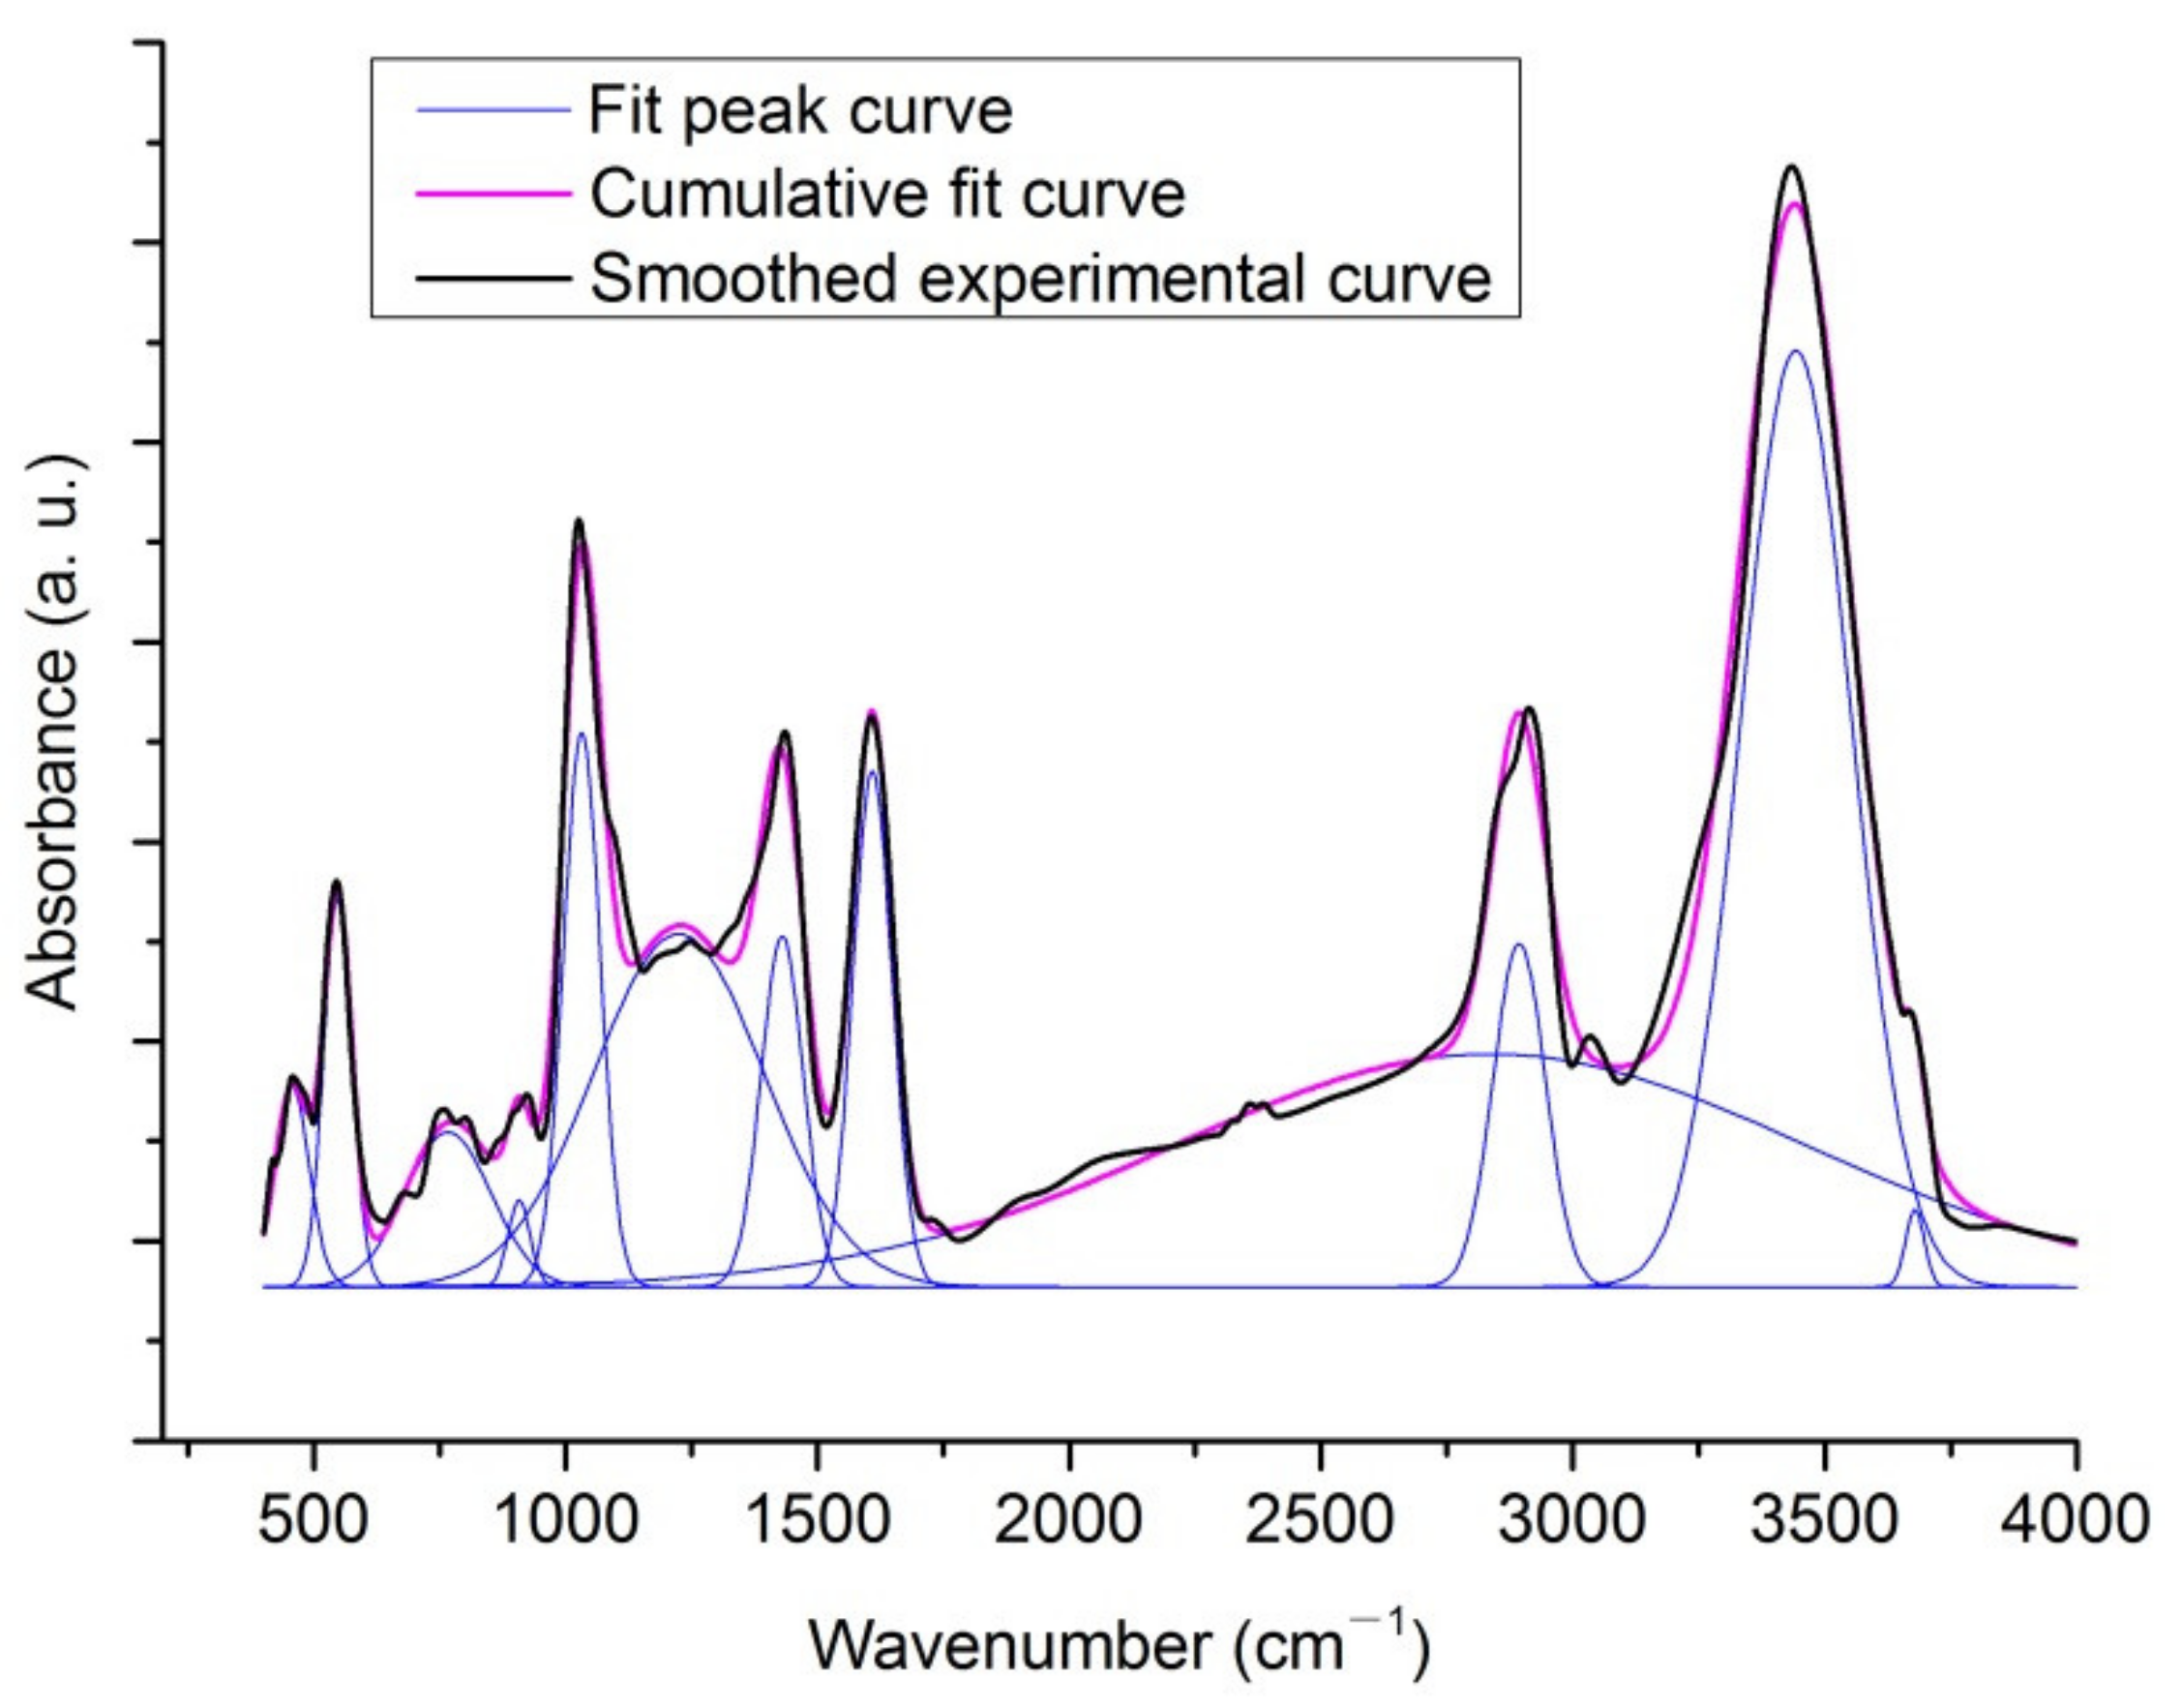
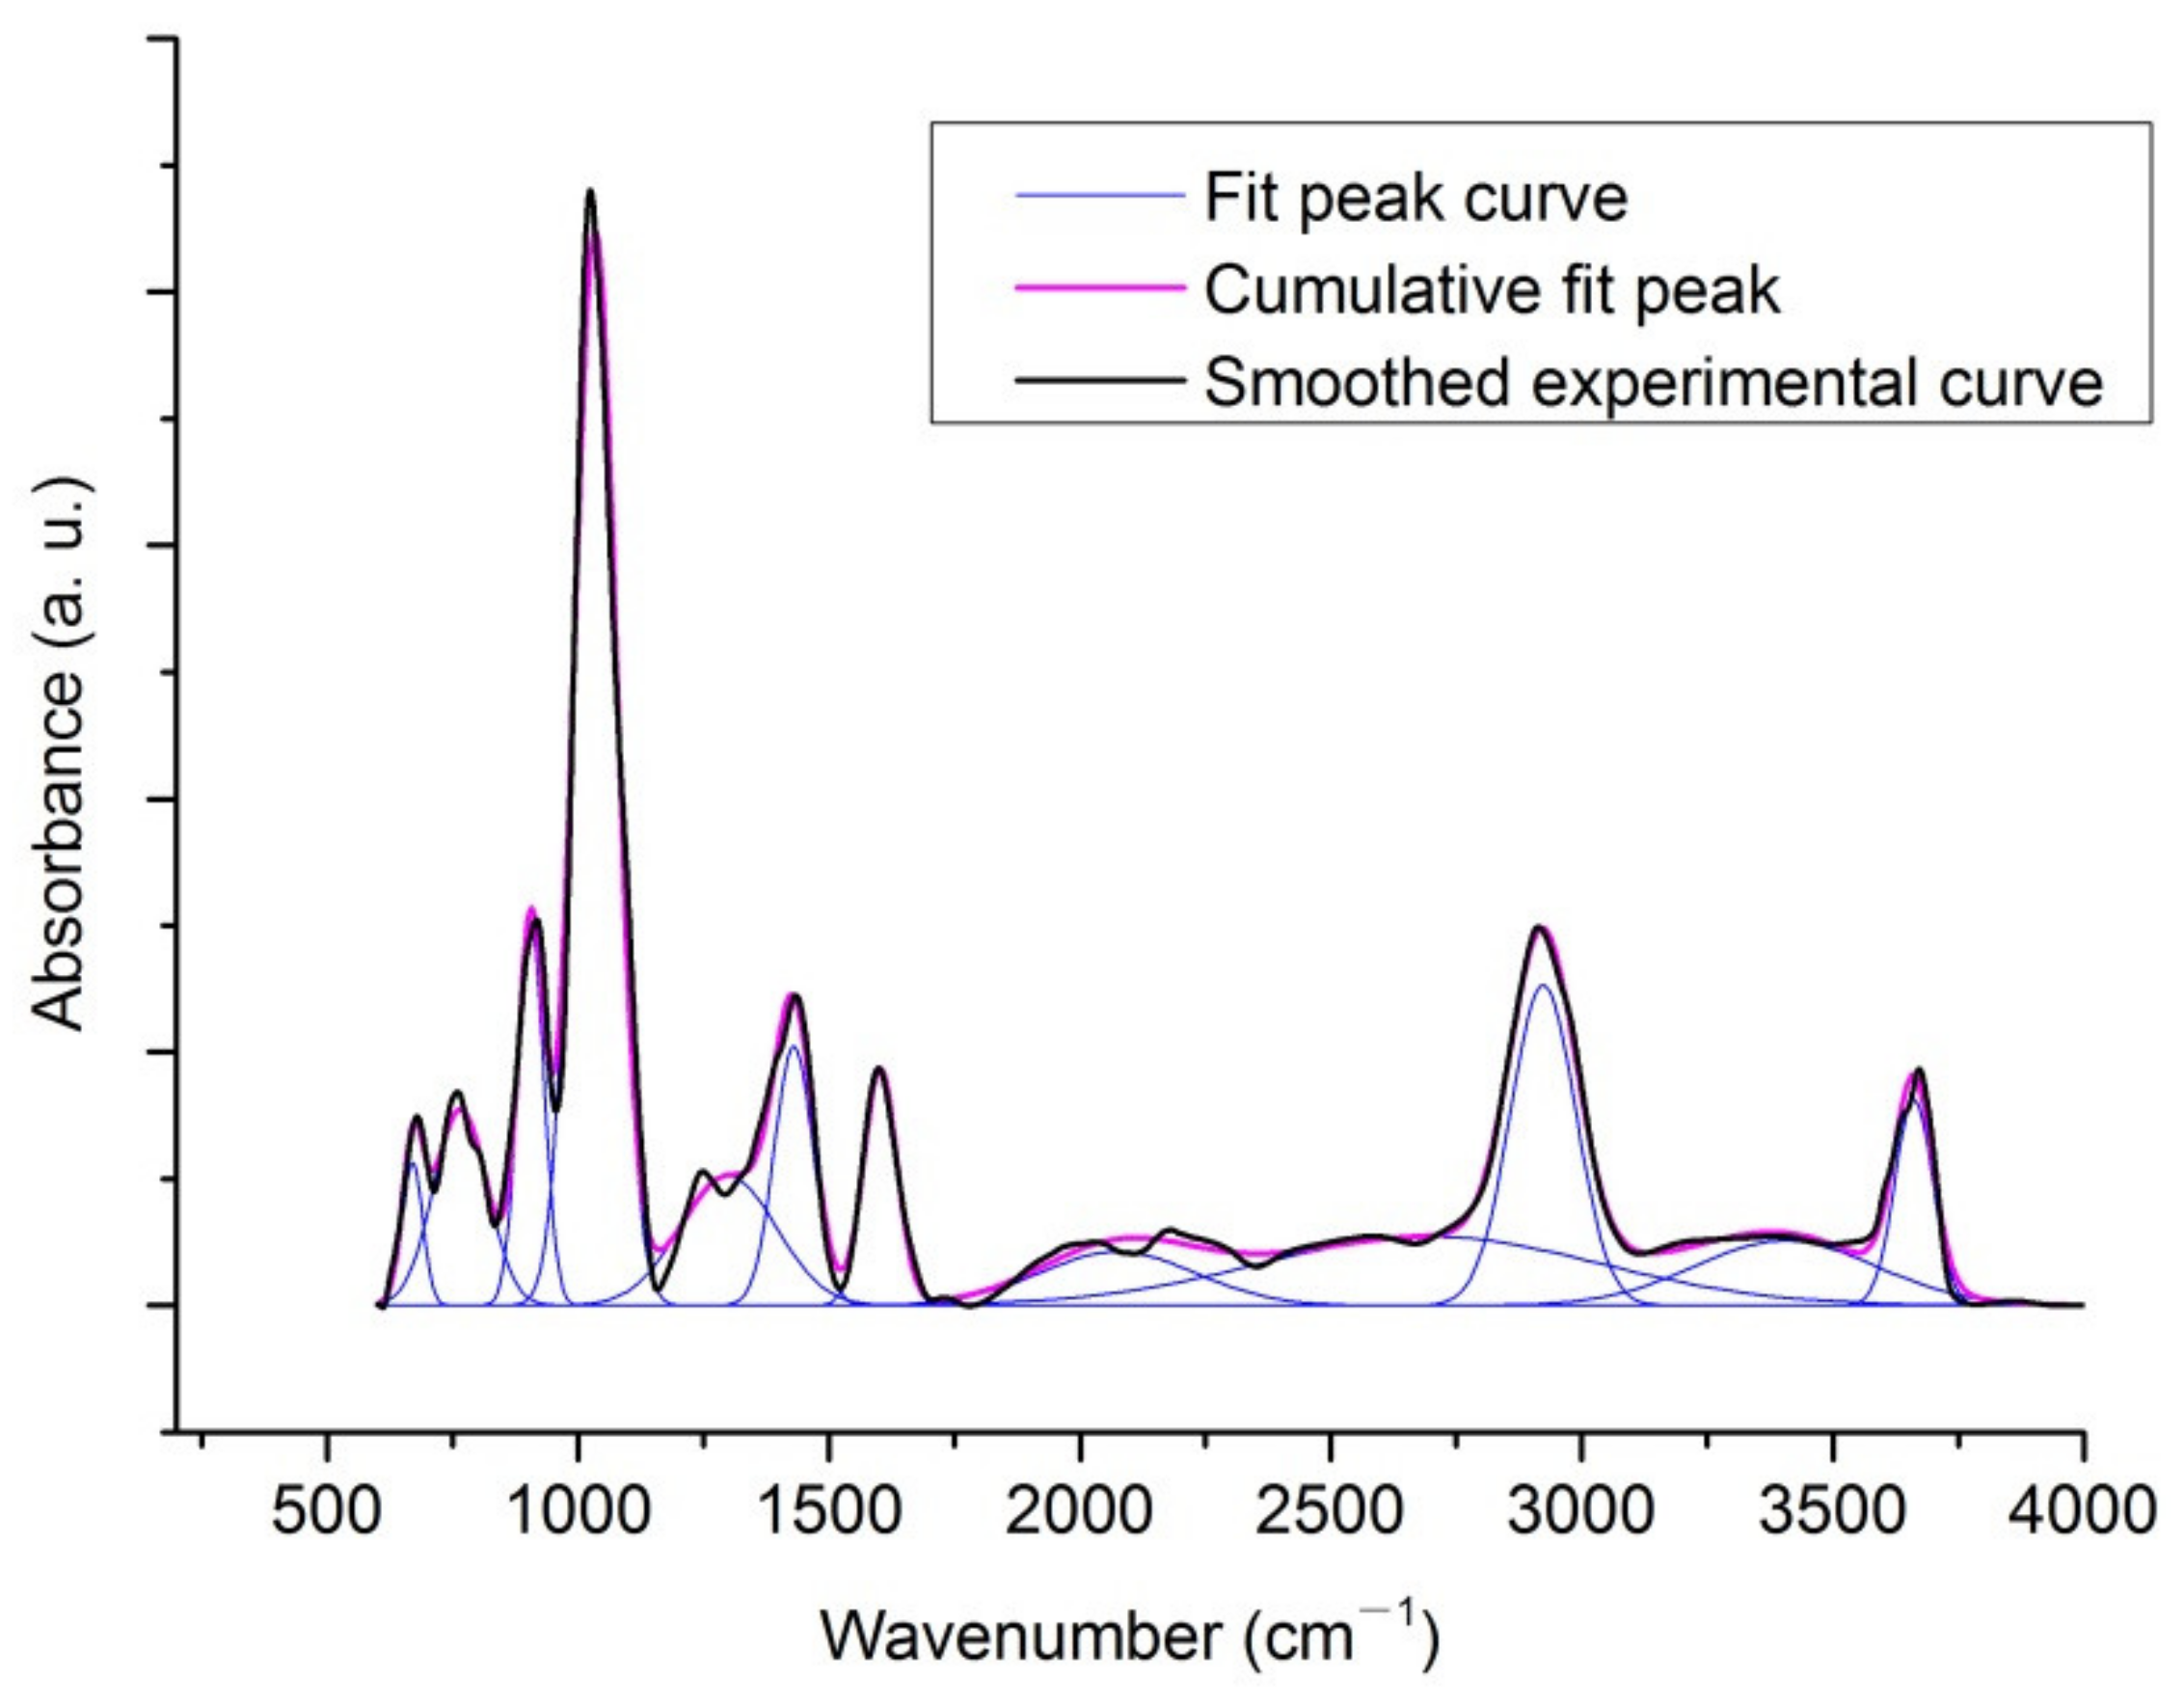
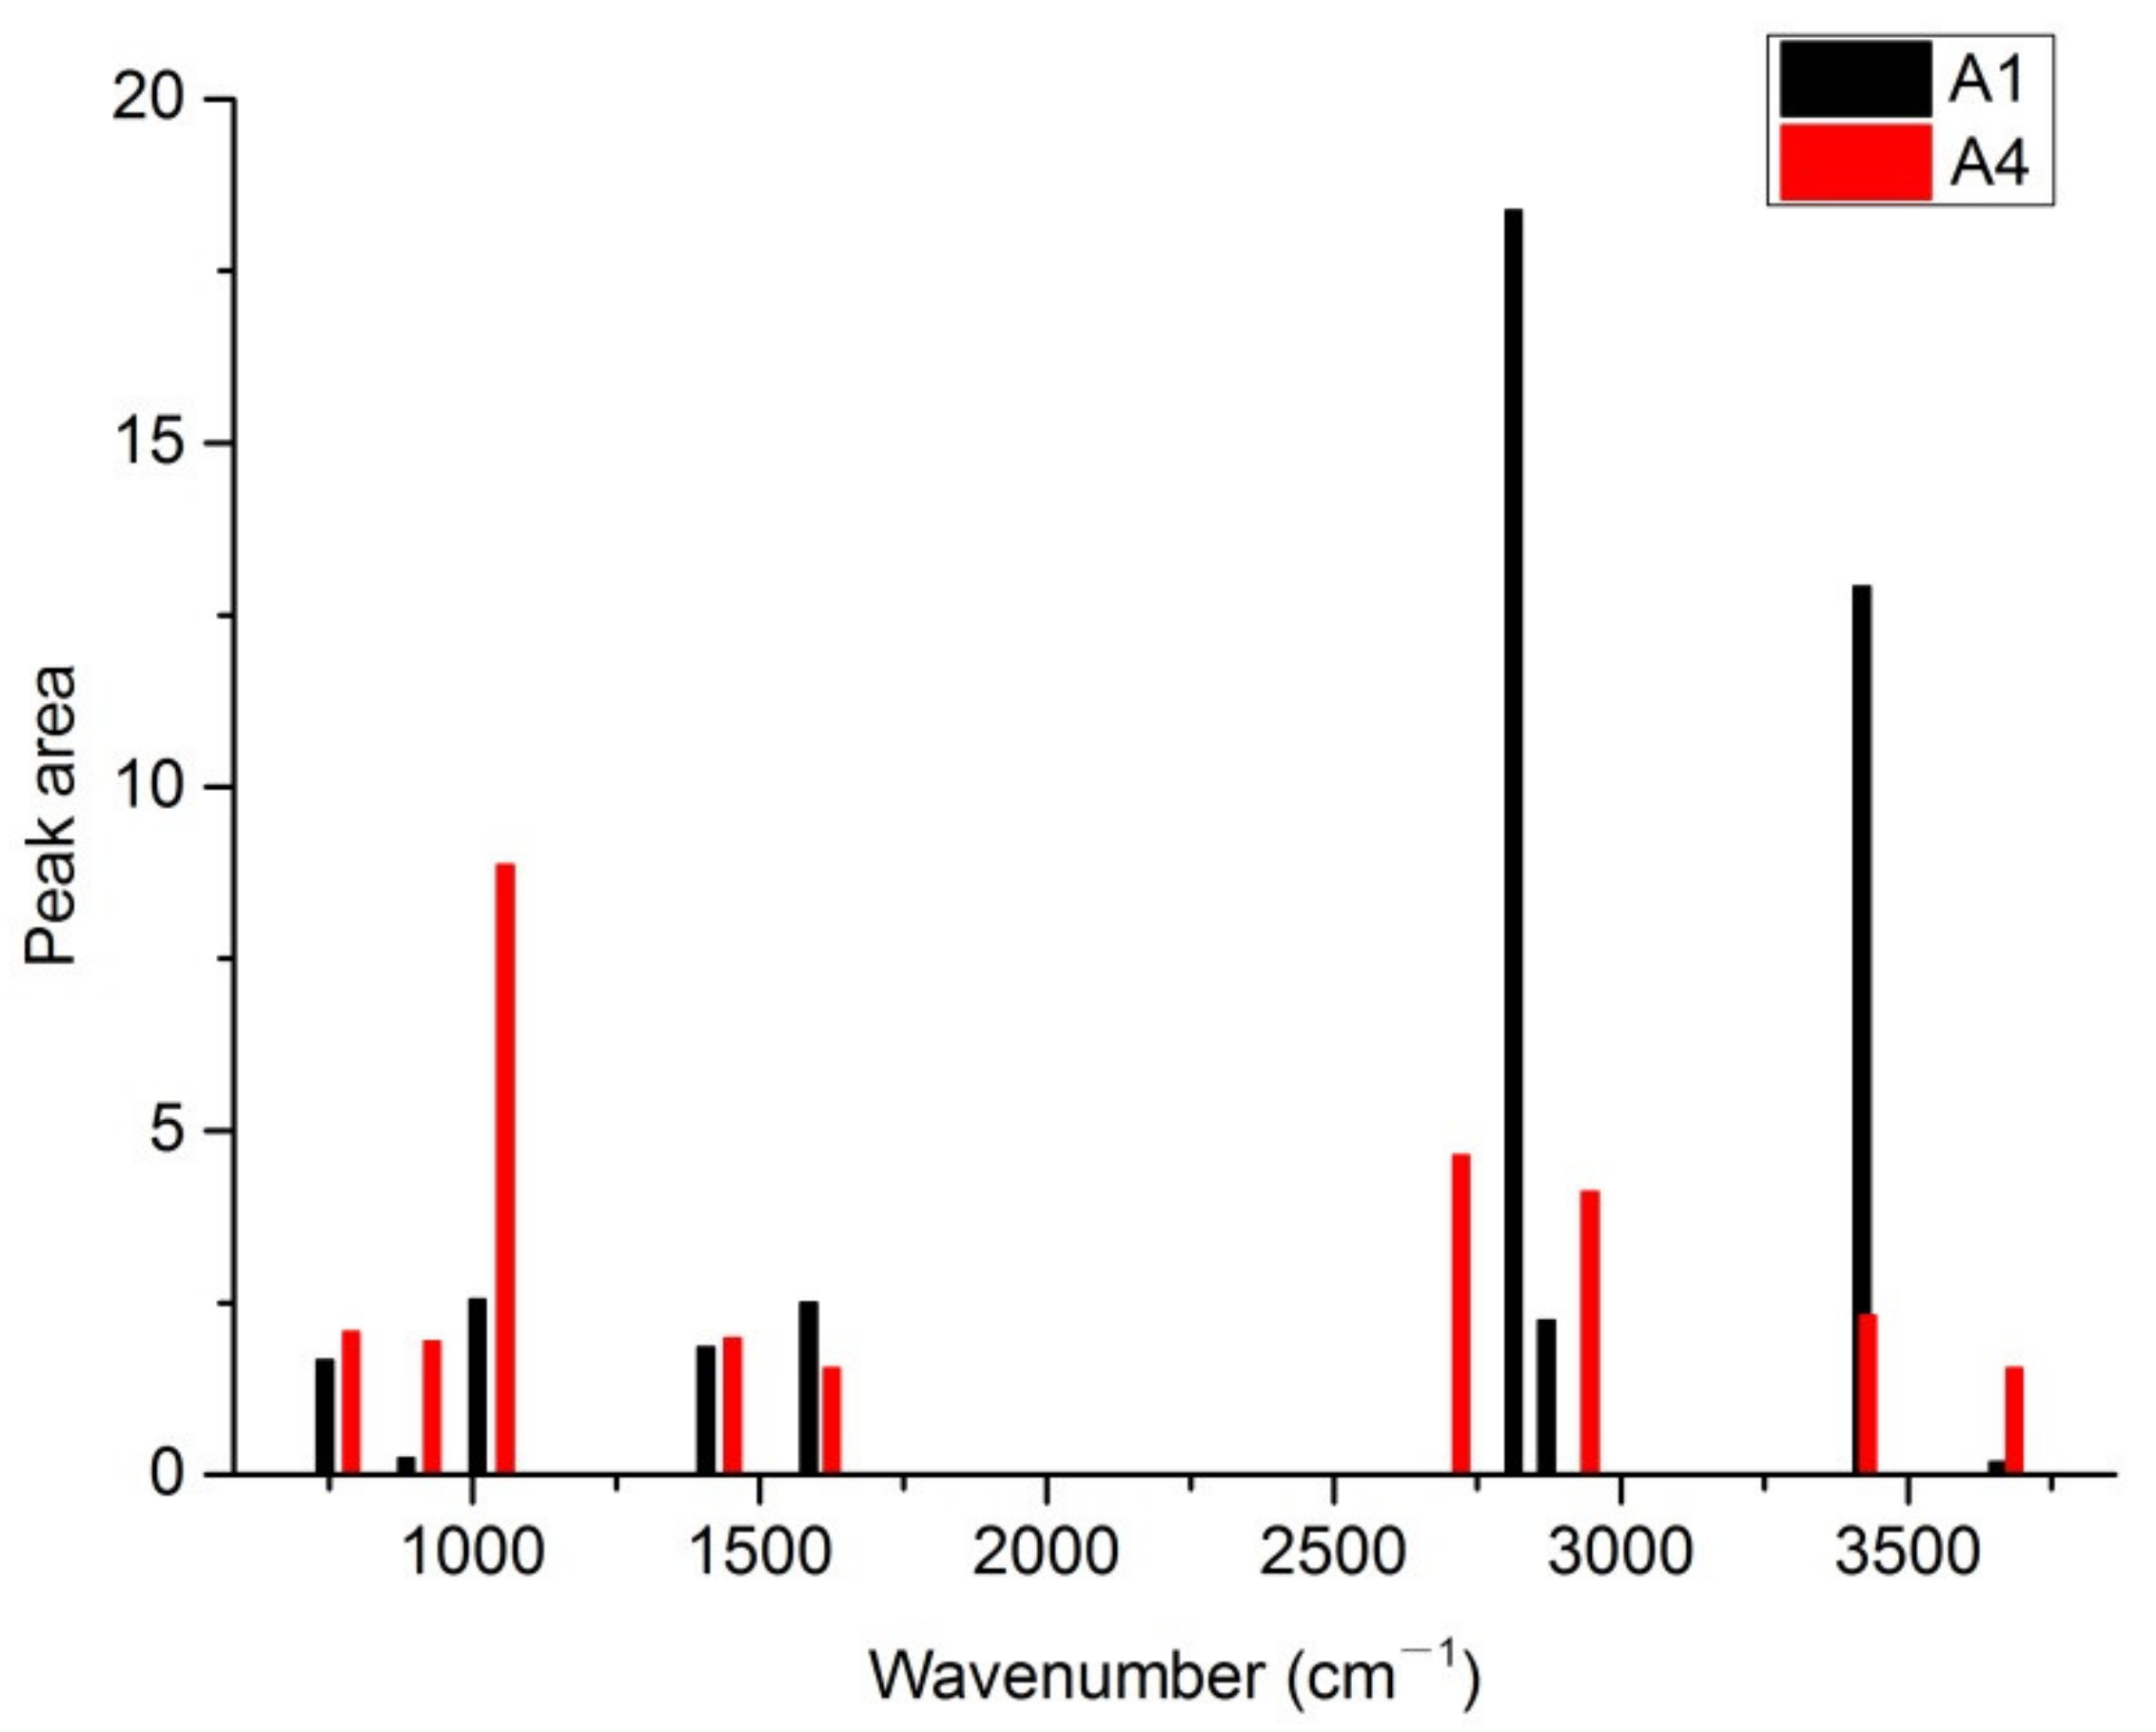
3.4. Fourier Infrared Spectroscopy

Fourier infrared spectrum analysis mainly determines the types of functional groups in coal samples and roughly reflects their content [31,32]. Through the determination of functional groups, we can understand whether the sample preparation process will affect the structure and form of functional groups of coal and alter the chemical properties of coal. The spectrometer used in this experiment was a NICOLET IS 10. Block coal sample A1 and powder coal sample A4 were taken for testing and comparison. The wavenumber range is 4000–400 cm−1, the scanning times are 32 and the resolution is 4 cm−1. As can be seen from the Fourier infrared spectrum curve (Figure 12), the peak position and curve trend of the infrared spectrum of the two coal samples are generally consistent, thus indicating that there is no substantial difference between the functional groups.
According to the calibration position of the peak point in the figure, coal is a complex organic matter with a rich functional group structure [33]. In the range of 3697–3684 cm−1, there are free hydroxyl groups. In the range of 3624–3613 cm−1, there is an intramolecular hydrogen bond. In the range of 3500–3200 cm−1, there are alcohol, phenol and ammonia hydroxyl groups. In the range of 3050–3030 cm−1, CH stretching vibration of aromatics occurs. In the range of 2922–2918 cm−1, there is asymmetric stretching vibration of aliphatic hydrocarbons CH2 and CH3. In the range of 2858–2847 cm−1, there are symmetrical stretching vibrations of aliphatic hydrocarbons CH2 and CH3. At the 1600 cm−1 wave number, there is C=C stretching vibration of aromatic structure. At the 1460 cm−1 wave number, there are fat symmetric and asymmetric deformation vibrations. Finally, in the range of 900–700 cm−1, there is out-of-plane deformation vibration of aromatic structure C–H (Table 5).
Next, Fourier infrared spectrum peak splitting Gaussian fitting was carried out by using OriginPro software (Figure 13, Figure 14 and Figure 15). The statistical data show that (Table 6) alkyl ether (1050–1030 cm−1) and aromatic structure C–H out-of-plane deformation vibration (900–700 cm−1) increase significantly. The alcohol, phenol and ammonia hydroxyl groups (3500–3200 cm−1) and symmetrical stretching vibration (2858–2847 cm−1) of aliphatic hydrocarbons CH2 and CH3 decrease significantly. It can be considered that the sample preparation process exerts an impact on the relative content of coal chemical components and increases the order of coal structure.

4. Conclusions

(1)
With the decrease of coal particle size, the porosity, total pore volume and total specific surface area of coal gradually increase, and the pore size decreases. The pore volume of macropores and mesopores decreases, while that of transition pores and micropores increases. This shows that, during the process of sample preparation, large and medium holes are damaged into transition holes and small holes under the action of crushing and grinding stress.
(2)
The pore specific surface area of coal increases with the decrease of particle size. This matched with the area theory, that is, the work consumed when the material is broken is directly proportional to the newly generated surface area. The results of the experiments can explain that with the decrease of particle size, the contact area between coal and air increases, the chemical reaction activity of coal increases and the time required for complete combustion decreases. In terms of activated carbon adsorption, small particles have faster adsorption speed, but small particles have small volume and reach adsorption equilibrium faster.
(3)
Compared with the 20–40 and 80–100 mesh coal samples, the increase of total pore volume and total specific surface area of coal samples with particle sizes smaller than 200 mesh is particularly apparent.
(4)
With the decrease of particle size, the D and G peak areas of the Raman spectrum increase. Meanwhile, the hydroxyl groups of alcohols, phenols and ammonia and the aliphatic hydrocarbons CH2 and CH3 in Fourier infrared spectroscopy decreased significantly, and the out-of-plane deformation vibration of alkyl ether and aromatic structure C–H increased significantly, thus indicating the transformation of coal macromolecular structure toward stability and order.

Author Contributions

Conceptualization, Z.S. and J.L.; methodology, J.L. and B.L.; validation, Z.S., B.L. and J.R.; data curation, J.L. and F.C.; writing—original draft preparation, J.L.; writing—review and editing, J.L. and M.X.; supervision, Z.S.; funding acquisition, J.L., F.C. and Z.S. All authors have read and agreed to the published version of the manuscript.

Funding

We would like to express appreciation to the following financial support: the National Natural Science Foundation of China, grant numbers 41972177, 41872169 and 42172189; the Postdoctoral Science Foundation China, grant number 2018M642747; tackling key scientific and technological problems in Henan Province, grant number, 222102320346; and the National Natural Science Foundation of Henan Province, grant number 202300410099.

Institutional Review Board Statement

Not applicable.

Informed Consent Statement

Not applicable.

Data Availability Statement

Not applicable.

Conflicts of Interest

The authors declare that they have no conflicts of interest to report regarding the present study.

References

  1. Cai, J.; Wei, W.; Hu, X.; Liu, R.; Wang, J. Fractal characterization of dynamic fracture network extension in porous media. Fractals 2017, 25, 1750023. [Google Scholar] [CrossRef]
  2. Andersen, P.Ø.; Qiao, Y.; Standnes, D.C.; Evje, S. Cocurrent spontaneous imbibition in porous media with the dynamics of viscous coupling and capillary backpressure. SPE J. 2019, 24, 158–177. [Google Scholar] [CrossRef]
  3. Li, B.; Ren, J.; Liu, J.; Liu, G.; Lv, R.; Song, Z. Diffusion and Migration Law of Gaseous Methane in Coals of Different Metamorphic Degrees. Int. J. Heat Technol. 2019, 37, 1019–1030. [Google Scholar] [CrossRef] [Green Version]
  4. Cai, J.; Hu, X. Petrophysical Characterization and Fluids Transport in Unconventional Reservoirs; Elsevier: Amsterdam, The Netherlands, 2019. [Google Scholar]
  5. Cai, J.; Wood, D.A.; Hajibeygi, H.; Iglauer, S. Multiscale and multiphysics influences on fluids in unconventional reservoirs: Modeling and simulation. Adv. Geo-Energy Res. 2022, 6, 91–94. [Google Scholar] [CrossRef]
  6. Jiang, B.; Zhao, Y.; Lin, B.; Liu, T. Effect of faults on the pore structure of coal and its resultant change on gas emission. J. Pet. Sci. Eng. 2020, 195, 107919. [Google Scholar] [CrossRef]
  7. Godyń, K.; Kožušníková, A. Microhardness of coal from near-fault zones in coal seams threatened with gas-geodynamic phenomena, Upper Silesian Coal Basin, Poland. Energies 2019, 12, 1756. [Google Scholar] [CrossRef] [Green Version]
  8. Blunt, M.J.; Bijeljic, B.; Dong, H.; Gharbi, O.; Lglauer, S.; Mostaghimi, P.; Paluszny, A.; Pentland, C. Pore-scale imaging and modelling. Adv. Water Resour. 2013, 51, 197–216. [Google Scholar] [CrossRef] [Green Version]
  9. Cai, J.; Zhang, L.; Wei, W. Modelling of Flow and Transport in Fractal Porous Media; Elsevier: Amsterdam, The Netherlands, 2020. [Google Scholar]
  10. Wood, D.A. Techniques used to calculate shale fractal dimensions involve uncertainties and imprecisions that require more careful consideration. Adv. Geo-Energy Res. 2021, 5, 153–165. [Google Scholar] [CrossRef]
  11. Coetzee, G.H.; Sakurovs, R.; Neomagus, H.W.; Everson, R.C.; Mathews, J.P.; Bunt, J.R. Particle size influence on the pore development of nanopores in coal gasification chars: From micron to millimeter particles. Carbon 2017, 112, 37–46. [Google Scholar] [CrossRef]
  12. Xue, Y.; Dang, F.; Li, R.; Liu, F. Numerical Investigation of the Effect of Sorption Time on Coal Permeability and Gas Pressure. Comput. Model. Eng. Sci. 2018, 115, 345–358. [Google Scholar]
  13. Azam, S.; Mishra, D.P. Effects of particle size, dust concentration and dust-dispersion-air pressure on rock dust inertant requirement for coal dust explosion suppression in underground coal mines. Process Saf. Environ. Prot. 2019, 126, 35–43. [Google Scholar] [CrossRef]
  14. Fang, L.; Wu, M.; Wu, B.; Li, H.; He, C.; Sun, F. A Fluid-Structure Interaction Simulation of Coal and Gas Outbursts Based on the Interaction between the Gas Pressure and Deformation of a Coal-Rock Mass. Comput. Model. Eng. Sci. 2022, 130, 1649–1668. [Google Scholar] [CrossRef]
  15. Wang, Z.; Cheng, Y.; Qi, Y.; Wang, R.; Wang, L.; Jiang, J. Experimental study of pore structure and fractal characteristics of pulverized intact coal and tectonic coal by low temperature nitrogen adsorption. Powder Technol. 2019, 350, 15–25. [Google Scholar] [CrossRef]
  16. Yi, M.; Cheng, Y.; Wang, Z.; Wang, C.; Hu, B.; He, X. Effect of particle size and adsorption equilibrium time on pore structure characterization in low pressure N2 adsorption of coal: An experimental study. Adv. Powder Technol. 2020, 31, 4275–4281. [Google Scholar] [CrossRef]
  17. Boylu, F.; Dincer, H.; Ateşok, G. Effect of coal particle size distribution, volume fraction and rank on the rheology of coal–water slurries. Fuel Process. Technol. 2004, 85, 241–250. [Google Scholar] [CrossRef]
  18. Zhang, L.; Aziz, N.I.; Ren, T.; Nemcik, J.; Tu, S. Influence of coal particle size on coal adsorption and desorption characteristics. Arch. Min. Sci. 2014, 59, 807–820. [Google Scholar] [CrossRef] [Green Version]
  19. Yuan, W.; Pan, Z.; Li, X.; Yang, Y.; Zhao, C.; Connell, L.D.; Li, S.; He, J. Experimental study and modelling of methane adsorption and diffusion in shale. Fuel 2014, 117, 509–519. [Google Scholar] [CrossRef]
  20. Tian, B.; Qiao, Y.; Tian, Y.; Liu, Q. Investigation on the effect of particle size and heating rate on pyrolysis characteristics of a bituminous coal by TG–FTIR. J. Anal. Appl. Pyrolysis 2016, 121, 376–386. [Google Scholar] [CrossRef]
  21. Li, L.; Tahmasebi, A.; Dou, J.; Lee, S.; Li, L.; Yu, J. Influence of functional group structures on combustion behavior of pulverized coal particles. J. Energy Inst. 2020, 93, 2124–2132. [Google Scholar] [CrossRef]
  22. Golparvar, A.; Zhou, Y.; Wu, K.; Ma, J.; Yu, Z. A comprehensive review of pore scale modeling methodologies for multiphase flow in porous media. Adv. Geo-Energy Res. 2018, 2, 418–440. [Google Scholar] [CrossRef] [Green Version]
  23. Hao, W.; Zhou, Y.; Yao, Y.; Wu, K. Imaged based fractal characterization of micro-fracture structure in coal. Fuel 2019, 239, 53–62. [Google Scholar]
  24. Rabbani, A.; Babaei, M.; Shams, R.; Wang, Y.; Chung, T. Deepore: A deep learning workflow for rapid and comprehensive characterization of porous materials. Adv. Water Resour. 2020, 146, 103787. [Google Scholar] [CrossRef]
  25. Ren, J.; Song, Z.; Li, B.; Liu, J.; Lv, R.; Liu, G. Structure feature and evolution mechanism of pores in different metamorphism and deformation coals. Fuel 2021, 283, 119292. [Google Scholar] [CrossRef]
  26. Zhang, J.; Li, X.; Jiao, J.; Liu, J.; Chen, F.; Song, Z. Comparative Study of Pore Structure Characteristics between Mudstone and Coal under Different Particle Size Conditions. Energies 2021, 14, 8435. [Google Scholar] [CrossRef]
  27. Lupoi, J.S.; Fritz, L.P.; Hackley, P.C.; Solotky, L.; Weislogel, A.; Schlaegle, S. Quantitative evaluation of vitrinite reflectance and atomic O/C in coal using Raman spectroscopy and multivariate analysis. Fuel 2018, 230, 1–8. [Google Scholar] [CrossRef]
  28. Nikitin, A.P.; Dudnikova, Y.N.; Mikhaylova, E.S.; Ismagilov, Z.R. Raman characteristics of Kuznetsk basin coal and coal-based sorbents. Coke Chem. 2019, 62, 379–384. [Google Scholar] [CrossRef]
  29. Potgieter-Vermaak, S.; Maledi, N.; Wagner, N.; Heerden, J.H.; Grieken, R.V.; Potgieter, J.H. Raman spectroscopy for the analysis of coal: A review. J. Raman Spectrosc. 2011, 42, 123–129. [Google Scholar] [CrossRef]
  30. Košek, F.; Edwards, H.G.M.; Jehlička, J. Raman spectroscopic vibrational analysis of the complex iron sulfates clairite, metavoltine, and voltaite from the burning coal dump Anna I, Alsdorf, Germany. J. Raman Spectrosc. 2020, 51, 1454–1461. [Google Scholar] [CrossRef]
  31. Gómez, Y.R.; Hernández, R.C.; Guerrero, J.E.; Ospino, E.M. FTIR-PAS coupled to partial least squares for prediction of ash content, volatile matter, fixed carbon and calorific value of coal. Fuel 2018, 226, 536–544. [Google Scholar] [CrossRef]
  32. Ghosh, A.K.; Bandopadhyay, A.K. Formation of thermogenic gases with coalification: FTIR and DFT examination of vitrinite rich coals. Int. J. Coal Geol. 2020, 219, 103379. [Google Scholar] [CrossRef]
  33. Kruszewski, Ł.; Fabiańska, M.J.; Segit, T.; Kusy, D.; Motyliński, R.; Ciesielczuk, J.; Deput, E. Carbon-nitrogen compounds, alcohols, mercaptans, monoterpenes, acetates, aldehydes, ketones, SF6, PH3, and other fire gases in coal-mining waste heaps of Upper Silesian Coal Basin (Poland)—A re-investigation by means of in situ FTIR external database approach. Sci. Total Environ. 2020, 698, 134274. [Google Scholar]
Figure 1. Coal samples with different particle sizes.
Energies 15 04043 g001
Figure 2. MIP (mercury intrusion porosimetry) intrusive and extrusive curves of the coal samples under different granule diameter conditions.
Energies 15 04043 g002
Figure 3. Pore volume distribution profiles of coal specimens with distinct granule diameters from the MIP measurement.
Energies 15 04043 g003
Figure 4. Pore area distribution profiles of coal specimens with distinct granule diameters from the MIP measurement.
Energies 15 04043 g004
Figure 5. Isothermal adsorption–desorption curves of liquid nitrogen of coal specimens with distinct granule diameters.
Energies 15 04043 g005
Figure 6. Pore volume distribution curves of coal specimens with distinct granule diameters from the liquid nitrogen measurement.
Energies 15 04043 g006
Figure 7. Pore area distribution curves of coal specimens with distinct granule diameters from the liquid nitrogen measurement.
Energies 15 04043 g007
Figure 8. Raman photos of coal samples with different particle sizes. Note: (A1-1,A1-2) are the two measuring points of raw coal sample A1. (A4-1,A4-2) are two measuring points of 200+ mesh coal sample A4.
Energies 15 04043 g008
Figure 9. Comparison of Raman curves of coal samples with different particle sizes.
Energies 15 04043 g009
Figure 10. Raman peak curve of coal samples with different particle sizes. Note: subfigures (A1-1,A1-2) are Raman curves of different test positions on sample A1; subfigures (A4-1,A4-2) are Raman curves of different test positions on sample A4. The black curve represents experimental curve; the pink curve represents cumulative fit peak; the blue curve represents fit peak curve.
Energies 15 04043 g010
Figure 11. Comparison histogram of Raman peaks of coal samples with different particle sizes.
Energies 15 04043 g011
Figure 12. Comparison of Fourier infrared spectra of coal samples with different particle sizes.
Energies 15 04043 g012
Figure 13. Peak fitting of Fourier infrared spectrum of coal sample A1.
Energies 15 04043 g013
Figure 14. Peak fitting of Fourier infrared spectrum of coal sample A4.
Energies 15 04043 g014
Figure 15. Comparison histogram of Fourier infrared peaks of coal samples with different particle sizes.
Energies 15 04043 g015
Table 1. Coal quality test results.
Analysis ItemsW%A%V%Qgr, ad/(MJ·kg−1)
Min~Max0.56–0.6514.83–28.8828.86–31.8024.39–29.69
Average0.5922.0329.9527.01
Note: W% is moisture; A% is ash; V% is volatile; Qgr, AD/(MJ·kg−1) is the high calorific value on dry basis.
Table 2. Pore structural parameters of coal specimens with distinct granule diameters from the MIP measurement.
SamplesA2A3A4
Total Intrusion Volume (cm3/g)0.68230.90010.7341
Micropore Volume (cm3/g)0.01780.02120.0288
Transition Pore Volume (cm3/g)0.03910.05410.0899
Mesopore Volume (cm3/g)0.01890.01530.1237
Macropore Volume (cm3/g)0.60650.80950.4917
Total Pore Area (m2/g)18.746623.596233.3126
Micropore Area (m2/g)10.081311.141813.3825
Transition Pore Area (m2/g)8.381112.065819.2319
Mesopore Area (m2/g)0.26030.31390.4618
Macropore Area (m2/g)0.02390.07470.2364
Porosity (%)47.0851.9863.05
Table 3. Comparison of liquid nitrogen test parameters of coal samples with different particle sizes.
SamplesA2A3A4
Total Intrusion Volume (cm3/g)0.0022340.0024910.005969
Micropore Volume (cm3/g)0.0001620.0002840.000799
Transition Pore Volume (cm3/g)0.0011140.0012630.002956
Mesopore and macropore Volume (cm3/g)0.0009580.0009440.002214
Total Pore Area (m2/g)0.3786710.5424421.460699
Micropore Area (m2/g)0.1968070.333610.949212
Transition Pore Area (m2/g)0.1452450.172670.409911
Mesopore and macropore Area(m2/g)0.0366190.0361620.101576
Average pore diameter (nm)23.59518.37216.345
Table 4. Comparison of Raman peak characteristics of coal samples with different particle sizes.
Sample Test PointsPeak AreaPeak Area PercentagePeakPeak StrengthHalf Height Width of Peak
A1-11,087,35073.01372.33351304.8
400,88627.01592.5386697.4
A1-21,119,96073.31375.13418307.8
406,23526.71591.73797100.5
A4-11,154,51071.51371.63635298.4
458,51128.51591.13897110.5
A4-21,717,36071.61368.85514292.6
679,53628.41587.15865108.9
Table 5. Spectral absorption strength of functional groups of coal.
Functional GroupWavenumber (cm−1)
Free hydroxyl3697–3684
Intramolecular hydrogen bond3624–3613
Alcohol, phenol, ammonia hydroxyl3500–3200
Aromatics CH stretching vibration3050–3030
Asymmetric stretching vibration of aliphatic hydrocarbons CH2 and CH32922–2918
Symmetric stretching vibration of aliphatic hydrocarbons CH2 and CH32858–2847
Aromatic structure C=C stretching vibration1600
Symmetrical and asymmetric deformation vibration of fat1460
Alkyl ether1050–1030
Out-of-plane deformation and vibration of aromatic structure C–H900–700
Table 6. Comparison of Raman peak characteristics of coal samples with different particle sizes.
SamplesPeak AreaPeak Area PercentagePeakPeak StrengthHalf Height Width of Peak
A10.871.59456.60.010081.1741
1.352.62547.10.019365.4788
1.663.22766.20.0077201.2475
0.240.46907.50.004351.5074
2.544.921031.70.027885.9453
7.4914.521224.30.0177398.3262
1.853.591429.70.017599.0818
2.504.851608.70.025890.9040
18.3734.502836.50.01171481.1985
2.244.342893.40.0172122.3358
12.9125.053442.90.0469258.6879
0.180.353679.00.003943.6252
A40.571.70670.30.011247.7637
2.076.14765.40.0155125.5807
1.935.75905.80.030260.2716
8.8626.341033.60.084798.2243
2.447.251298.60.0102223.9512
1.985.881429.30.020490.9637
1.544.581601.70.018677.8324
1.654.912074.50.0042366.3688
4.6313.762697.70.0054799.7617
4.1112.222922.90.0253152.8310
2.316.873406.10.0051424.5600
1.544.593661.40.016289.3714
Publisher’s Note: MDPI stays neutral with regard to jurisdictional claims in published maps and institutional affiliations.

