Article

Experimental and Numerical Simulation of Water Adsorption and Diffusion in Coals with Inorganic Minerals

1
School of Emergency Management and Safety Engineering, China University of Mining & Technology (Beijing), Beijing 100083, China
2
School of Mines Safety, North China Institute of Science & Technology, Langfang 065201, China
*
Authors to whom correspondence should be addressed.
Energies 2022, 15(12), 4321; https://doi.org/10.3390/en15124321
Submission received: 27 April 2022 / Revised: 2 June 2022 / Accepted: 7 June 2022 / Published: 13 June 2022
(This article belongs to the Collection Flow and Transport in Porous Media)

Abstract

:
The study on the adsorption and micropore filling of water vapor in coal is significant for predicting coalbed methane content in coal seams. The primary purpose of this study is to explain the effects of coal pore structure and its surface chemistry on water vapor monolayer adsorption, micropore filling, and diffusion coefficient. First, X-ray diffraction (XRD) and mercury intrusion porosimetry (MIP) analyzed inorganic mineral components of two kinds of coal samples and pore fissures structures. Then, we divide pores and fissures according to the theory of fractal dimensions. Furthermore, we carried out the water vapor adsorption and desorption experiments on two kinds of coal; in particular, we set 14 points of relative pressure between 0 and 0.2. Guggenheim–Anderson–de Boer (GAB), Frenkel–Halsey–Hill (FHH), and Freundlich models were used to analyze the data of water vapor adsorption to obtain the boundary pressure points of the monolayer, multilayer adsorption, and capillary condensation. Finally, the parameters of the models were obtained by fitting the adsorption data of water vapor according to the combined GAB, Freundlich, DA, and bidisperse adsorption (BDA) models to analyze the interaction mechanism between coal and water. We explain why the strongly adsorbed water minerals, such as pyrite, illite, and nacrite coal, can improve water vapor’s adsorption and diffusion capacity in coal pore fissures.

1. Introduction

Coal and gas outburst is one of the most serious disasters in the coal mining industry [1]. Measures for gas extraction and mining of protective seams are generally used to prevent coal and gas outbursts [2]. Coal seams that do not have the conditions to implement mining protection measures usually utilize gas extraction measures combined with hydraulic fracturing, coal seam water injection, and other hydraulic measures to prevent and control coal and gas outbursts to increase coal seam permeability [3,4,5]. The water is sucked into the pores and fissures of the coal by capillary force [6]. Coal seams that have undergone hydration measures will inevitably retain some water. Coal seam gas content is one of the critical indicators for predicting coal and gas outburst and estimating coalbed methane production [7,8,9,10]. The prediction of coal seam gas content is influenced by temperature, pressure, porosity, and water content [2,11]. Laboratory measurements of coal seam gas content are usually performed on dry coal for isothermal adsorption testing, but the actual coal seam often contains some moisture, thus affecting the accuracy of the gas content measurement [11,12,13,14]. In addition, underground coal mine water injection to increase the water content of coal seams is usually used to achieve the effect of coal dust control [15]. However, the mechanism of coal–water interaction is not fully understood. Therefore, it is essential to study the interaction mechanism between coal and water to improve the safety and environment of the working face of coal mines.
Coal is a typical non-homogeneous porous medium associated with various inorganic minerals. Inorganic minerals in adsorbents affect the adsorption energy between coal pore fractures and water [16]. The fluid intrusion method combined with fractal theory analysis is often used to characterize the pore structure of a porous medium and non-homogeneity [9,16]. The monolayer, multilayer adsorption, and capillary condensation processes of water vapor are usually described with the water vapor adsorption isotherm in coals to analyze the adsorption mechanism of coal to water [17,18,19]. Adsorption models are used to predict the adsorption equilibrium and isotherm parameters, including Guggenheim–Anderson–de Boer (GAB), Frenkel–Halsey–Hill (FHH), Freundlich, and Dubinin, and Astakhov (DA) et al. [19,20,21,22,23,24]. These adsorption models are proposed based on the unimolecular, multimolecular, and adsorption potential energy models. They are used to analyze the interaction between the surface properties of the adsorbent and the adsorbate. The monolayer adsorption with water on the coal pore fissure surface is often completed in the low relative pressure region. The processes of water vapor adsorption are accompanied by microporous filling, which usually occurs in the low relative pressure region of coal adsorption of water vapor. Most scholars focus on pressure regions with relative pressures higher than 0.2 or set fewer test pressure points in low-pressure zones (relative pressures less than 0.2) [16,25]. The coal seam is generally considered a double-porous medium for studying the diffusion and seepage flow of coal seam gas [26,27]. Using a dispersed model, Dubinin investigated the widely distributed activated carbon with microporous size [28]. While assuming that coal is a dual-pore medium model, there are fewer studies of its adsorption process using a dual-pore adsorption water vapor model of coal. The physicochemical properties of the coal pore fissure surface influence the strength of adsorbed water and the diffusion of water vapor in coals. However, few studies combine the double-dispersion model and analyze how inorganic minerals in pore fractures of coal affect the interaction energy of coal–water and the adsorption and diffusion of water vapor in coal.
In order to reveal the adsorption mechanism between water molecules and the pore surface of coal, and the diffusion of water vapor in coals, experiments on water vapor adsorption by coal were conducted. X-ray diffraction and mercury intrusion porosimetry (MIP) were also carried out. The bidisperse model BDA, GAB, DA, FHH, and Freundlich models of adsorption water vapor were applied to fit the experimental data of coal adsorption water vapor to obtain fitting parameters with the adsorbed water vapor data. The influence of the dual pore stage of coal pores and fractures on the adsorbed water was analyzed. We would expect results to further explain the mechanism of water occurrence in coal seams.

2. Materials and Methods

2.1. Coal Samples

Two types of bituminous coals collected from the Pingshuo (PS) jinggongyi and Liyazhuang (LYZ) coal mines in the Shanxi Province were used for MIP, XRD, and water vapor adsorption tests. The proximate analysis of coal samples is listed in Table 1. According to the Chinese coal industry classification standards, the industrial analysis parameters are shown in Table 1.

2.2. XRD

X-ray diffraction (XRD) tests were performed in a Bruker D8ADVANCE (Bruker, Germany) measuring instrument. The test parameters were set to 40 mA and 40 KV for tube current and tube voltage, 1.5406 Å for Cu target wavelength, 5°–90° for scanning angle, and 1.5°/min for scanning speed.

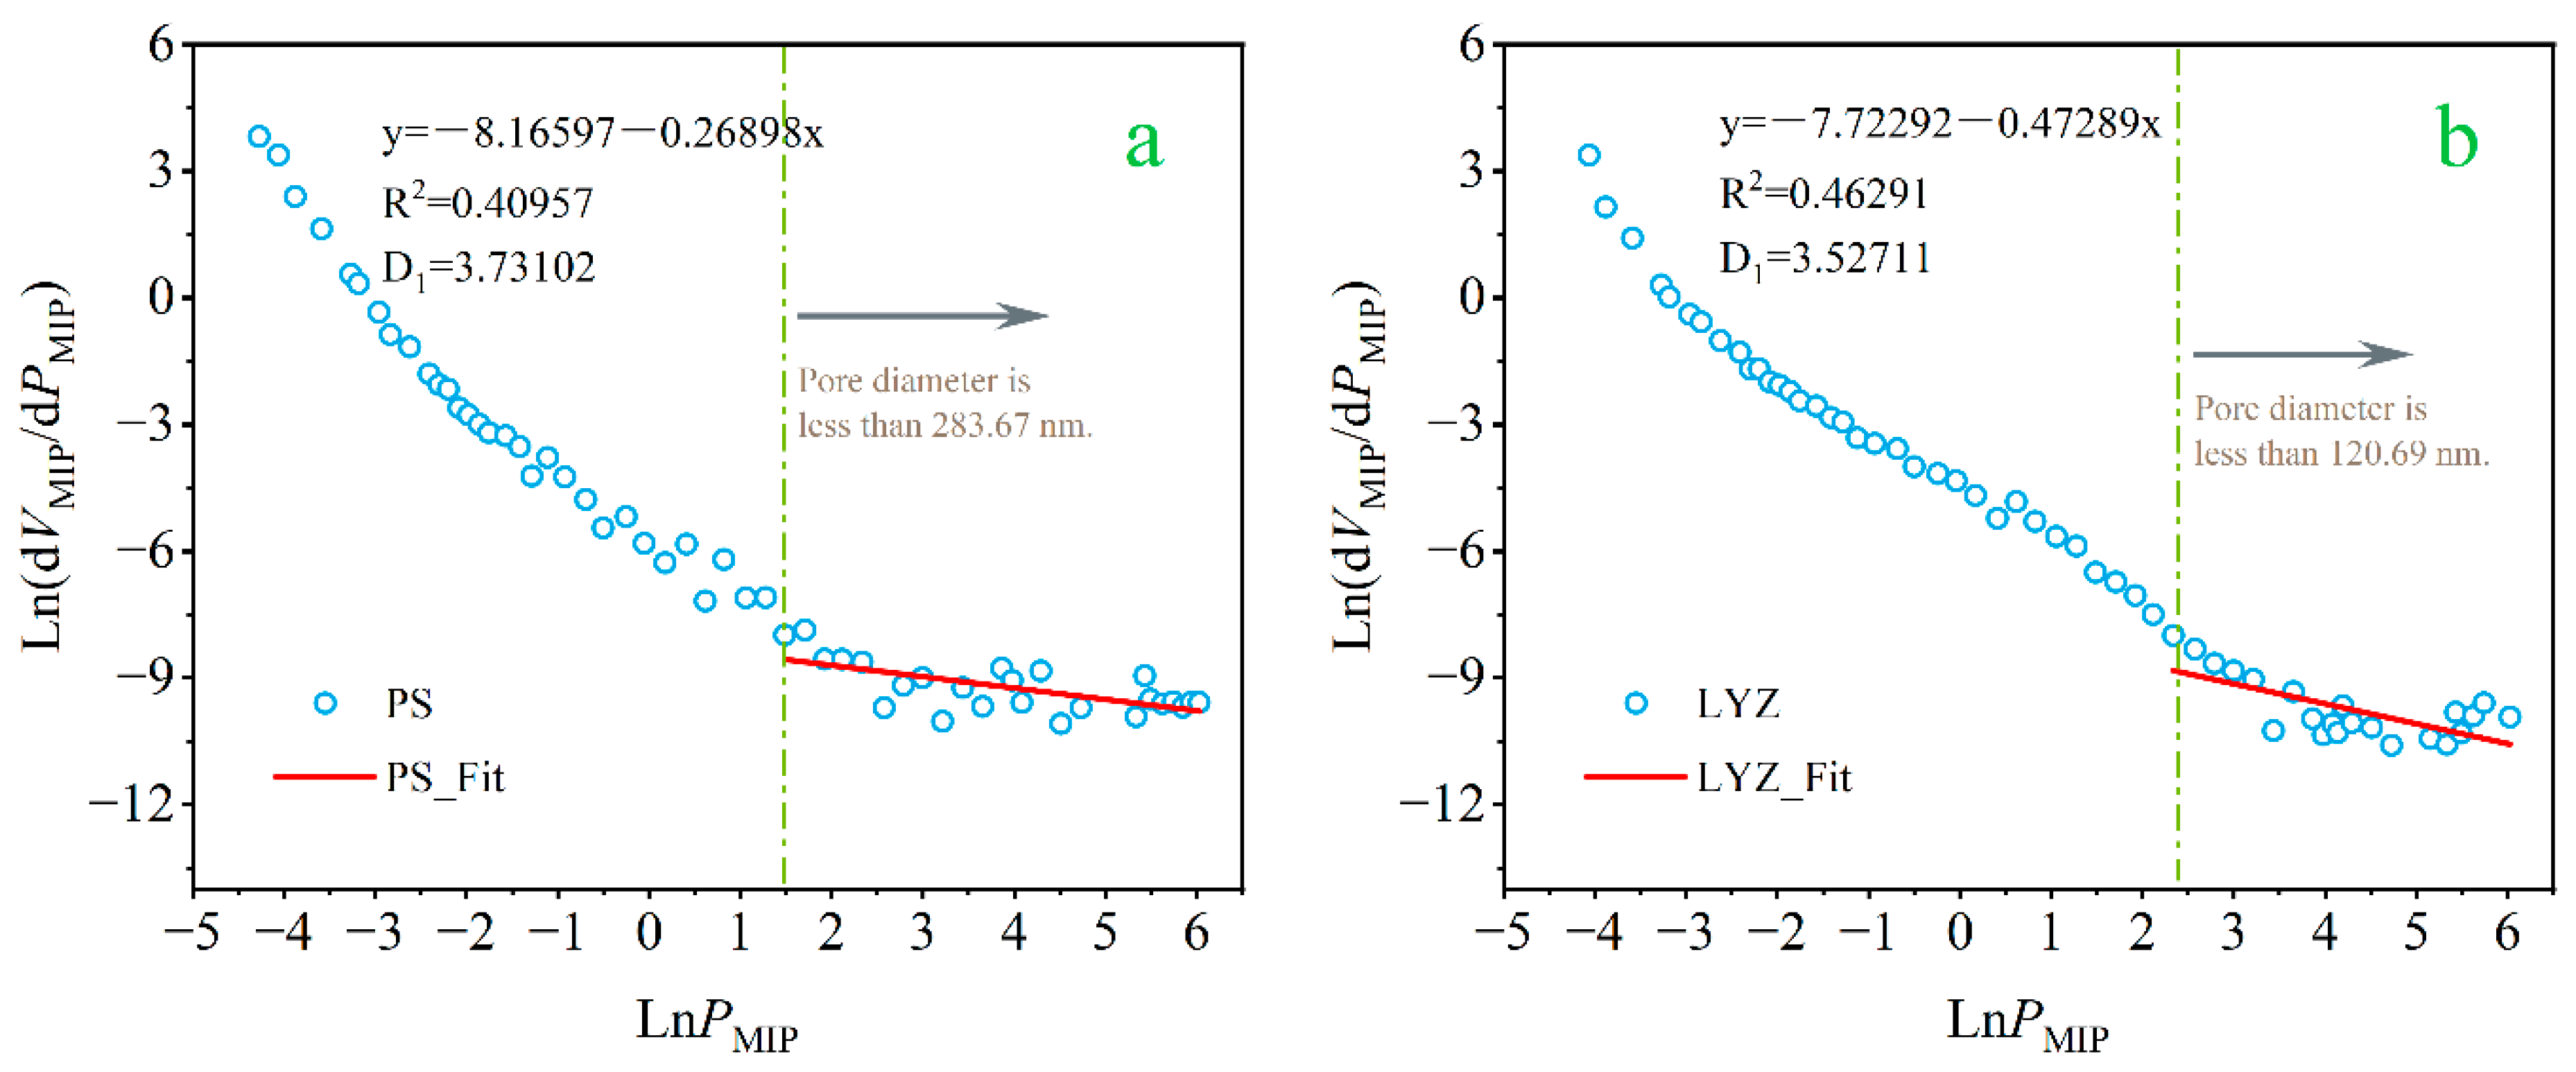
2.3. MIP and Mercury Injection Fractal Model

The total porosity, specific surface area (SSA), and pore size distribution of the coal samples were used for mercury intrusion high-pressure (MIP) analysis (An AutoPore IV 9500 analytical instrument) (Micromeritics Instrument Corp., Norcross, GA, USA). The fractal dimensions were calculated using mercury injection data and the Menger model [26]. The formula is shown in Equation (1).
In ( d V M I P d P M I P ) = A M I P + ( B M I P 4 ) In P M I P
where VMIP is mercury volume, mL/g; PMIP is the pressure of injected mercury; dVMIP/PMIP represents the increment of pore volume corresponding to the current incoming mercury pressure point relative to the previous incoming mercury pressure point; AMIP is a constant; according to the Equation (1), the slope of the curve made from In(dVMIP/dPMIP) to InPMIP is D, Fractal dimensions D = BMIP + 4; when 1 < D < 2, 2 < D < 3, and 3 < D < 4, D represents the stage of mercury entering the fissure, the stage of mercury entering the pore, and the stage of matrix compression, respectively [29].

2.4. Vacuum Vapor Sorption

The coal sample was dried by degassing in a vacuum; the temperature was set to 40 °C, and the drying time was set to 120 h. The coal was then sealed and stored in a bottle, and, finally, water vapor adsorption experiments were performed. The BeishiDe 3H-2000PW (BeishiDe instruments, Beijing, China) fully automatic weight-based vacuum vapor sorption (VVS) analyzer was used to determine the coal sample for coal adsorption and desorption of water vapor isotherms. Water vapor relative pressure was controlled between 0.01 and 0.95. The mass change of the coal sample was continuously monitored and recorded by an ultra-sensitive microbalance with an accuracy of 1 ug. During the test, the equilibrium chamber temperature was set at 30 °C, and the water bath provided a constant test temperature. The sample volume change in 20 min was less than 0.1 mg, defined as a continuous weight state.
In this experiment, 25 relative pressure points were set. The unique feature of our study is that 14 data detection points were set in the pressure range of 0 < p/p0 < 0.2 to study the micro-pore filling process of water vapor in coal samples under low relative pressure and the mechanism of the water vapor diffusion process on the surface of coal pore fissures.

3. Results and Discussion

3.1. Inorganic Minerals Associated with Coal

Rietveld full-spectrum fitting refinement was carried out using XRD data, and a mass fraction quantified the mineralogical fractions of the samples to determine the mineral content (Figure 1). Figure 1 shows that the green line represents the fitted line (Cal), the black line represents the original plot (Obs), and the gray line represents the calculated plot (Obs-Cal). The lower the value of Rwp, the better the refinement result. The two coals mainly include inorganic minerals, such as clay minerals, pyrite, calcium carbonate, and quartz, with clay minerals, such as illite, kaolinite, and nacrite. The LYZ coal sample contains some pyrite, nacrite, and illite, while the PS coal sample has none of these minerals. The standard card numbers for nacrite and kaolinite are PDF#16-060 and PDF#78-2110. The three principal peaks of nacrite (Al2Si2O5(OH)4) are 12.321, 20.347, and 21.498, and the three principal strength peaks of kaolinite (Al4(OH)8(Si4O10)) are 12.041, 20.377, and 21.229. Kaoline absorbs water and has an average free expansion rate of 28% [30,31,32]. Nacrite has water absorption properties similar to kaoline [33]. Illite has a strong water absorption because of hydrogen bonding of the potassium ions embedded between the layered silicate layers, with an average swelling rate of 89% [34,35]. Pyrite has a strong interaction with water molecules, and its surface structure affects water absorption of more than 1 nm [36].

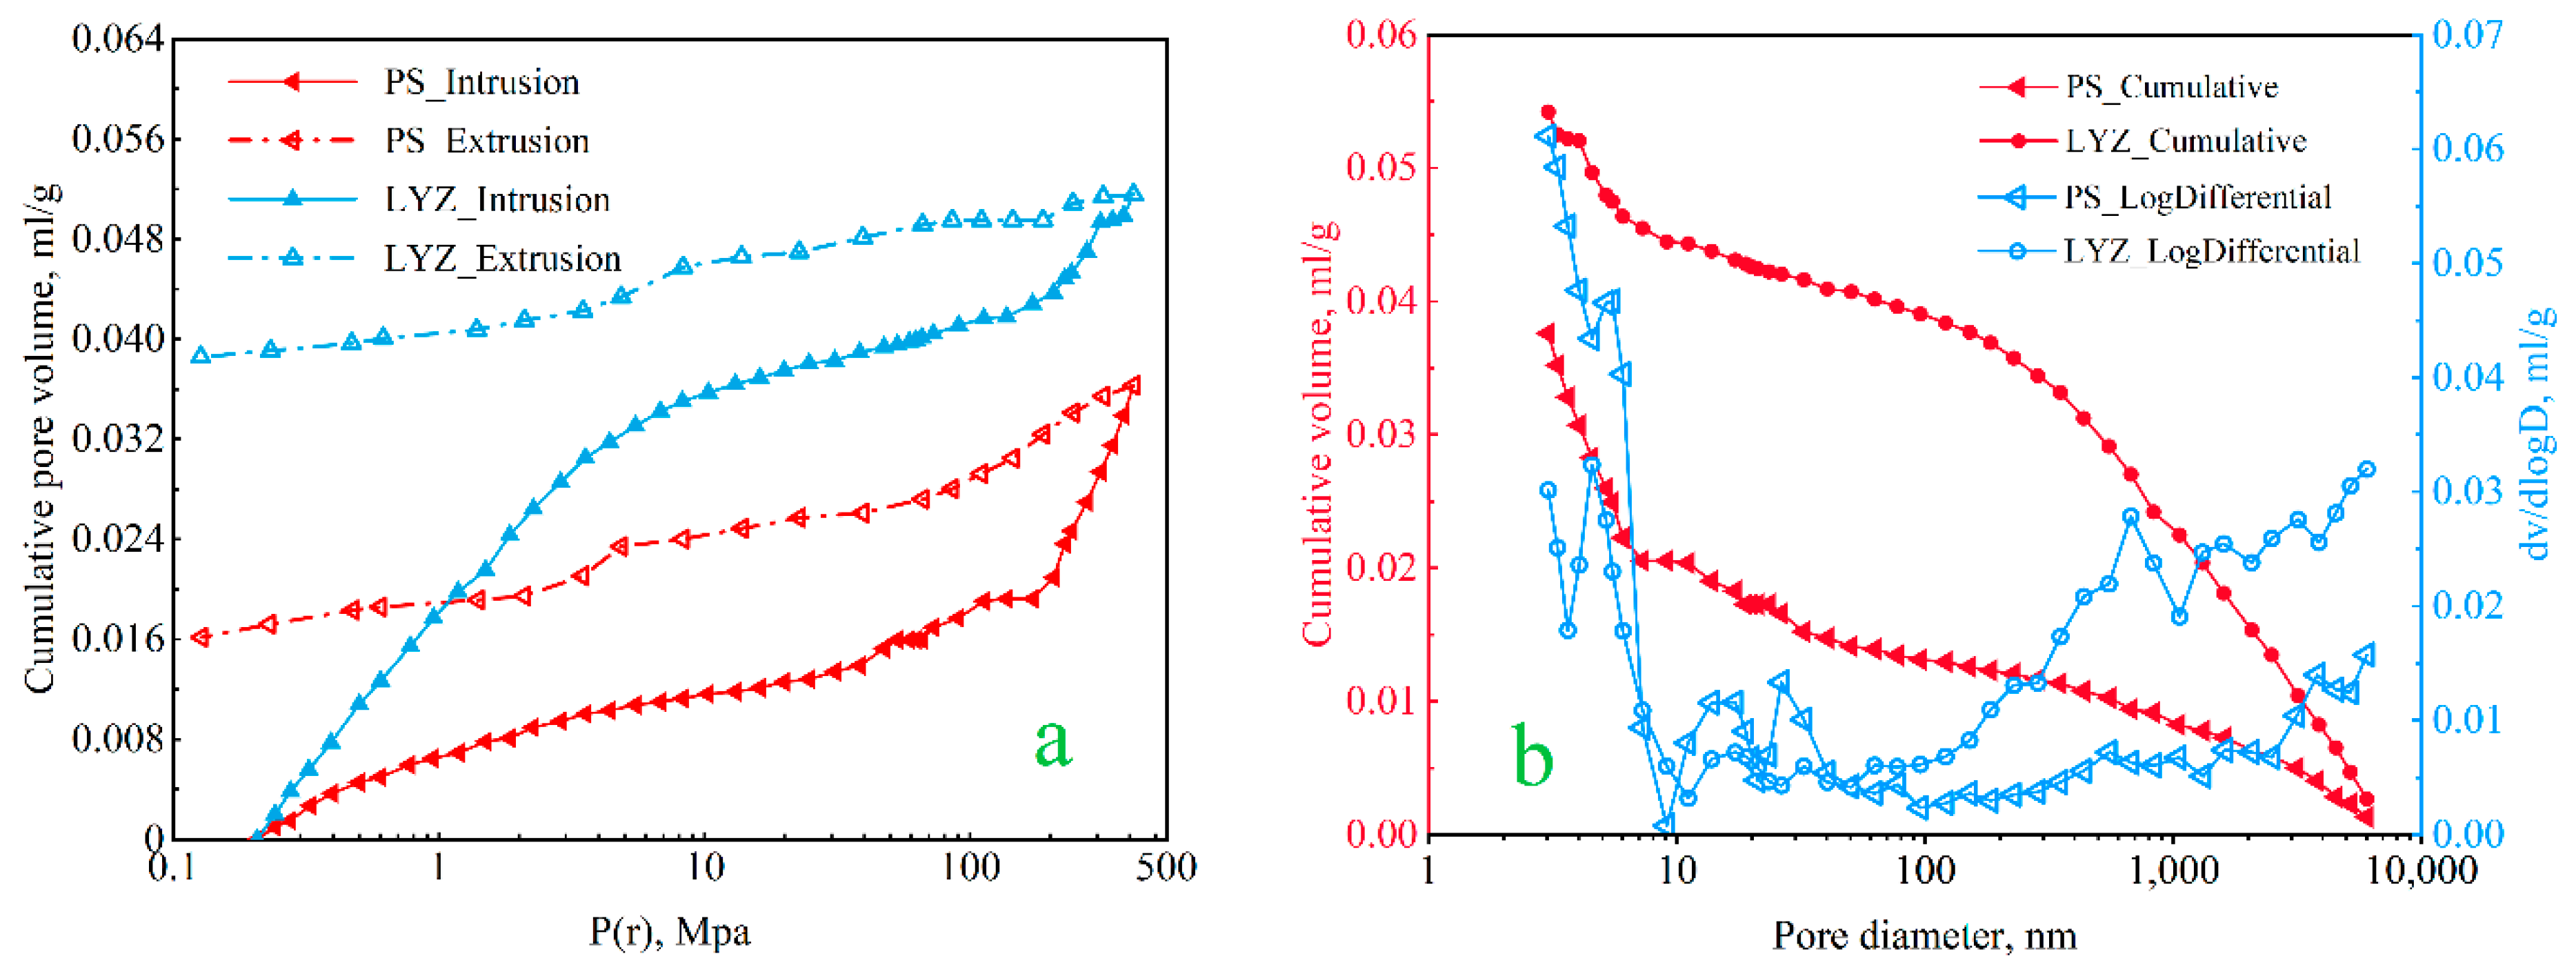
3.2. Pore Fracture Structure of Coal and Its Dual Pore Division

According to pure chemistry′s international pore structure classification standard, a pore size of less than 2 nm is called micropore, a pore size between 2 and 50 nm is called mesopore, and a pore size greater than 50 nm is called macropore [37]. The amount of intruded mercury, around six μm pore diameter, was used as a boundary to distinguish the inter and intra-grain pores of the tested coal samples [38,39]. At 413.05 MPa, the maximum intrusion mercury volumes of PS and LYZ coal samples were 0.0363 and 0.0515 mL/g, respectively. There is a significant hysteresis loop between the intrusion and extrusion mercury curves of both coal samples, shown in Figure 2a. The possible reason is that the high-pressure section of the mercury injection pressure destroys the pore fissures of the coal, making the original closed or semi-open pore into an open or continuous pore [40,41]. The hysteresis loop′s width reflects the pores′ connectivity [26]. The connectivity of pore fissures of the LYZ coal sample is greater than that of PS. Figure 2b shows the pore volume distribution curve; the LYZ pore volume distribution curve is higher than PS in the region of greater than 100 nm, while less than 100 nm shift occurs, the pore volume distribution curve of LYZ is lower than the PS coal sample.
Guo et al. [42] considered that the fractal dimension change could classify the pore fracture system according to the relationship between In d V M I P / d P M I P and In P M I P . The fractal dimension 3 < D < 4 is the matrix compression stage, and the point of abrupt change of compression coefficient is used to define the fissures and pore boundary. We classify matrix compression system and fracture system for PS and LYZ coal samples based on fractal theory, as shown in Figure 3. The fractal point of PS is 283.67 nm, and the fractal point of LYZ is 120.69 nm. Section 3.3.3 presents the BDA model with coal dual pore characteristics to analyze the data of adsorption water vapor in coal.

3.3. Water Vapor Adsorption–Desorption Isotherm and Adsorption Model

3.3.1. Water Vapor Adsorption Isotherm

Figure 4 shows the isotherms of water vapor adsorption. Figure 5 displays the variation curves of relative humidity versus coal sample mass with adsorption time at 30 °C for two coal samples. During the adsorption of water vapor on coal samples, the mass of coal samples increased non-linearly with the increase of relative humidity, and the mass of coal samples reached the maximum when the relative humidity was close to 1; the mass of coal samples decreased with the decrease of relative humidity during desorption (Figure 4 and Figure 5). Figure 5c shows that as the adsorption time increases, the humidity decreases, and the mass of the coal sample increases until the adsorption–desorption equilibrium is reached. The relative humidity of Figure 5d fluctuates around the relative pressure of 0.4, indicating that the adsorbed water vapor does not reach equilibrium, and the instrument automatically increases the humidity until the mass of the coal sample changes by less than 0.1 ug within 20 min, indicating the adsorption–desorption equilibrium is reached.
The curve slope for the PS coal sample is significantly larger than that for the LYZ when p/p0 < 0.2 (Figure 4). The possible reason is that the interaction energy between the pore fracture surface and water of the PS coal sample is larger than that of the LYZ coal sample. In this stage, p/p0 > 0.2, and the adsorption isotherms of the two coal samples are almost parallel. The maximum water absorption of PS and LYZ coal samples were 1.34 and 1.25 mmol/g, respectively. The capacity of water vapor adsorption of the PS coal sample is larger than LYZ. Still, the opposite result with the pore capacity measured by MIP, probably because the MIP experiment only gets the pores above 3 nm pores less than 3 nm, were not counted (Figure 2). The adsorption–desorption curves of PS and LYZ have a hysteresis loop, which may be because of the micropore filling of water vapor, surface chemistry on the surface of pore fissures, expansion and contraction of some of the pore fissures, and the action of capillary condensation of water [43,44,45,46,47].

3.3.2. Freundlich Model and FHH Model

The Freundlich and FHH models describe the transition from monolayer adsorption and multilayer adsorption to capillary condensation for water vapor adsorption on porous media [21,25,48,49,50]. This section combines the two models to determine the relative pressure points corresponding to the turning points.
  • FHH model
The FHH model (Frenkel–Halsey–Hill) [23,49,50] is based on the assumption that the adsorption potential varies with the surface distance and is derived from the potential energy function and thermodynamic equations. The model treats the adsorbed liquid film as a flat liquid in a solid potential energy field, and the liquid film is homogeneous and consistent with the liquid state. Equation (2) is the linear equation of the FHH model [16].
ln m F H H = 1 n F H H ln B F H H + 1 n F H H ln ( ln ( p 0 / p ) )
where n F H H is the amount of water vapor absorbed, mmol/g; m F H H is the constant related to the adsorbent at a specific adsorption temperature, g/mmol; and B F H H represents the adsorption potential of the adsorbent on the adsorbent surface, the thickness of the monolayer adsorption film, and the monolayer adsorption amount information, dimensionless. The FHH model is often used to determine the cut-off point for the three different states of water vapor: monolayer, multilayer adsorption, and capillary condensation [16].
Figure 6 shows our coal adsorption water vapor data plotted with ln ( ln ( p 0 / p ) ) as the horizontal coordinate and ln m F H H as the vertical coordinate. We divide the adsorbed water vapor isotherms of the two coals into four regions with three dividing points in Table 2. One is the turning point from multilayer adsorption to capillary coalescence in the relatively high-pressure section; two is the turning point from monolayer adsorption to multilayer adsorption; and three is the turning point between the microporous filling and monolayer adsorption. As shown in Figure 6, we divide the water vapor adsorption data into two regions using the cut-off point, the region p/p0 < 0.1 we call the low relative pressure region. The low relative pressure zone is divided into two linear phases. Matthias Thommes believes there can be no precise cut-off relative pressure to determine the monolayer multilayer adsorption and microporous filling processes [51]. The following sections will focus on the relative pressure point at which the water vapor micropore filling and monolayer adsorption are completed.
2
Freundlich model
The Freundlich adsorption isotherm model assumes that the adsorbent surface is inhomogeneous, the adsorption energy varies from location to location, and is suitable for adsorption with medium coverage and can be used for both physical and chemical adsorption, with a linear form of the Freundlich model [22].
ln m Freu   =   ln μ + 1 n Freu ln p / p 0
where p/p0 is the relative pressure; m F r e u represents adsorption volume, mmol/g; n F r e u is adsorption strength, g/mmol; and μ is adsorption capacity, mmol/g. It is believed that the Freundlich model can reflect the transition of water molecules from multilayer adsorption to capillary condensation under high humidity conditions [25,48].
Figure 7 is a diagram based on In m F r e u as the vertical axis and In p / p 0 as the horizontal coordinate, and these two different regions represent two different adsorption methods. A value of n greater than 1 is the high-intensity adsorption zone, which is in the low relative pressure stage. Values less than 1 are a low-intensity adsorption zone in the high relative pressure segment. The high and low strength division of the PS coal sample is p/p0 = 0.751, and the high and low strength division of the LYZ coal sample is p/p0 = 0.702. The value of n F r e u (1.248) for PS, shown in Table 3, is less than that of LYZ n F r e u (2.950), which is probably due to the presence of pyrite, illite, and nacrite in LYZ compared to PS (Figure 2). The Freundlich constant μ predictively represents the water adsorption capacity in the solid and weak adsorption states. Although PS has 0.13 more adsorbed water capacity than LYZ for strongly adsorbed water, the amount of adsorbed water vapor of the PS coal sample occupies 80.36% of the total adsorbed water capacity. At the same time, LYZ only accounts for 48.87%, indicating that some areas in the pore fissures of the LYZ coal sample swell to adsorb more water at high humidity. Combining the FHH model with the Freundlich model, the multilayer adsorption to capillary coalescence relative pressure p/p0 cut-off points for PS and LYZ coal samples with adsorbed water vapor is 0.751–0.800 versus 0.702–0.751. The following section will combine the GAB model with the FHH model to determine the cut-off point from monolayer to multilayer adsorption.

3.3.3. Water Vapor Adsorption Isotherm Model and Its Fitting Parameters

1
GAB model
The GAB model extends the BET theory and applies to a broader range of relative humidity [21,52,53]. Its equation is shown in Equation (4):
m G A B = m G A B 0 c k ( p / p 0 ) [ 1 k ( p / p 0 ) ] [ 1 + ( c 1 ) k ( p / p 0 ) ]
where m G A B is the equilibrium adsorption amount at specific humidity, mmol/g; m G A B 0 represents single-molecule adsorption capacity, mmol/g; c is the adsorption energy constant of the first layer of water molecules; k is the multilayer adsorption energy constant, indicating that the interaction between adsorbed water molecules, it is different from the interaction between water molecules in the bulk phase; and p/p0 represents the relative pressure [21,52,53].
2
DA model
Dubinin and Astakhov proposed the DA equation, which describes a non-uniform microporous system [20,54,55].
m D A = m D A 0 exp [ ( A E ) n ]
where [20],
A = 2.3026 R T log p 0 / p
The linearizing of Equation (5) is:
log m D A = log m D A 0 ( 2.3026 R T E ) n D A ( log p 0 p ) n D A
where mDA0 is the ultimate adsorption capacity, mmol/g; E is the characteristic adsorption energy of the gas, which is also regarded as the potential chemical difference as a measure of the affinity of the adsorbent surface, J/mole; R is a gas constant; T is temperature, K; and mDA represents the dispersion of microporous distribution, the larger the value, the smaller the micropores, mmol/g.
3
BDA model
M.M. Dubinin [28] considered that a porous medium with a wide distribution of microporous sizes could be approximated by Equation (8).
m = m 1 exp [ ( A E 01 ) 3 ] + m 2 exp [ ( A E 02 ) 2 ]
Coal has the typical characteristics of a double-pore medium [26]. According to Figure 3, we consider the capacity of coal pore fissures for water vapor adsorption as a process of water vapor adsorption by two different types of pores. Drawing on Equation (8) and considering the non-homogeneous characteristics of coal, we use an empirical double DA model to fit the water vapor adsorption data as Equation (9).
m D u D A = m D u D A 01 exp [ ( A E 1 ) n D u b A 01 ] + m D u D A 02 exp [ ( A E 2 ) n DuD   AO2 ]
where m D u D A is the amount of adsorbed water vapor, mmol/g; m D u D A 01 and m D u D A 02 are the limiting adsorption capacities of two different types of micropores, mmol/g; and E1 and E2 are two different types of pore and adsorbent affinities, J/mole. It is worth noting that, at present, we have not found an empirical form of Equation (9) within the scope of the literature we looked for. This paper refers to Equation (9) as the BDA model.
Figure 8 and Table 4 show the fitting effect, fitting parameters, and statistical parameters of the three models fitting the adsorption isotherms of the two coals. Combining the GAB model with the FHH model, the relative pressures p/p0 corresponding to the completion of monolayer adsorption by PS and LYZ are 0.518–0.501 and 0.401–0.648. The smaller the residual sum of the squares of the error (SSE) value, the smaller the root mean square error (RMSE) value, and the larger value of R2 represents a better fit. Table 4 displays the values of the goodness-of-fit coefficients SSE, R2, and RMSE for the three models, indicating the BDA model is the optimal model to describe the coal sorption isotherm. The fit of the DA model was the worst, especially for the range of 0.3 < p/p0 < 0.7 (Figure 8). The GAB model is a hypothesis based on the multilayer adsorption model, which adds the assumption of the interaction energy between water molecules but cannot describe the process of micropores filling with water vapor [51]. A smaller value of the DA model parameter, nDA, represents a larger pore size. As an extension of the DA model, the BDA model values also characterize the pore structure information. The interaction energy E2 of coal pore fracture surface with water molecules in the PS coal sample is greater than the E2 of LYZ using the BDA model fit, and the interaction energy E1 of coal pore fracture surface with water molecules in the LYZ coal sample is greater than the E1 of PS. In the next section, we analyze the effect on the water vapor diffusion coefficient in the context of the interaction energy between the dual pore stage of coal pore fractures and water.

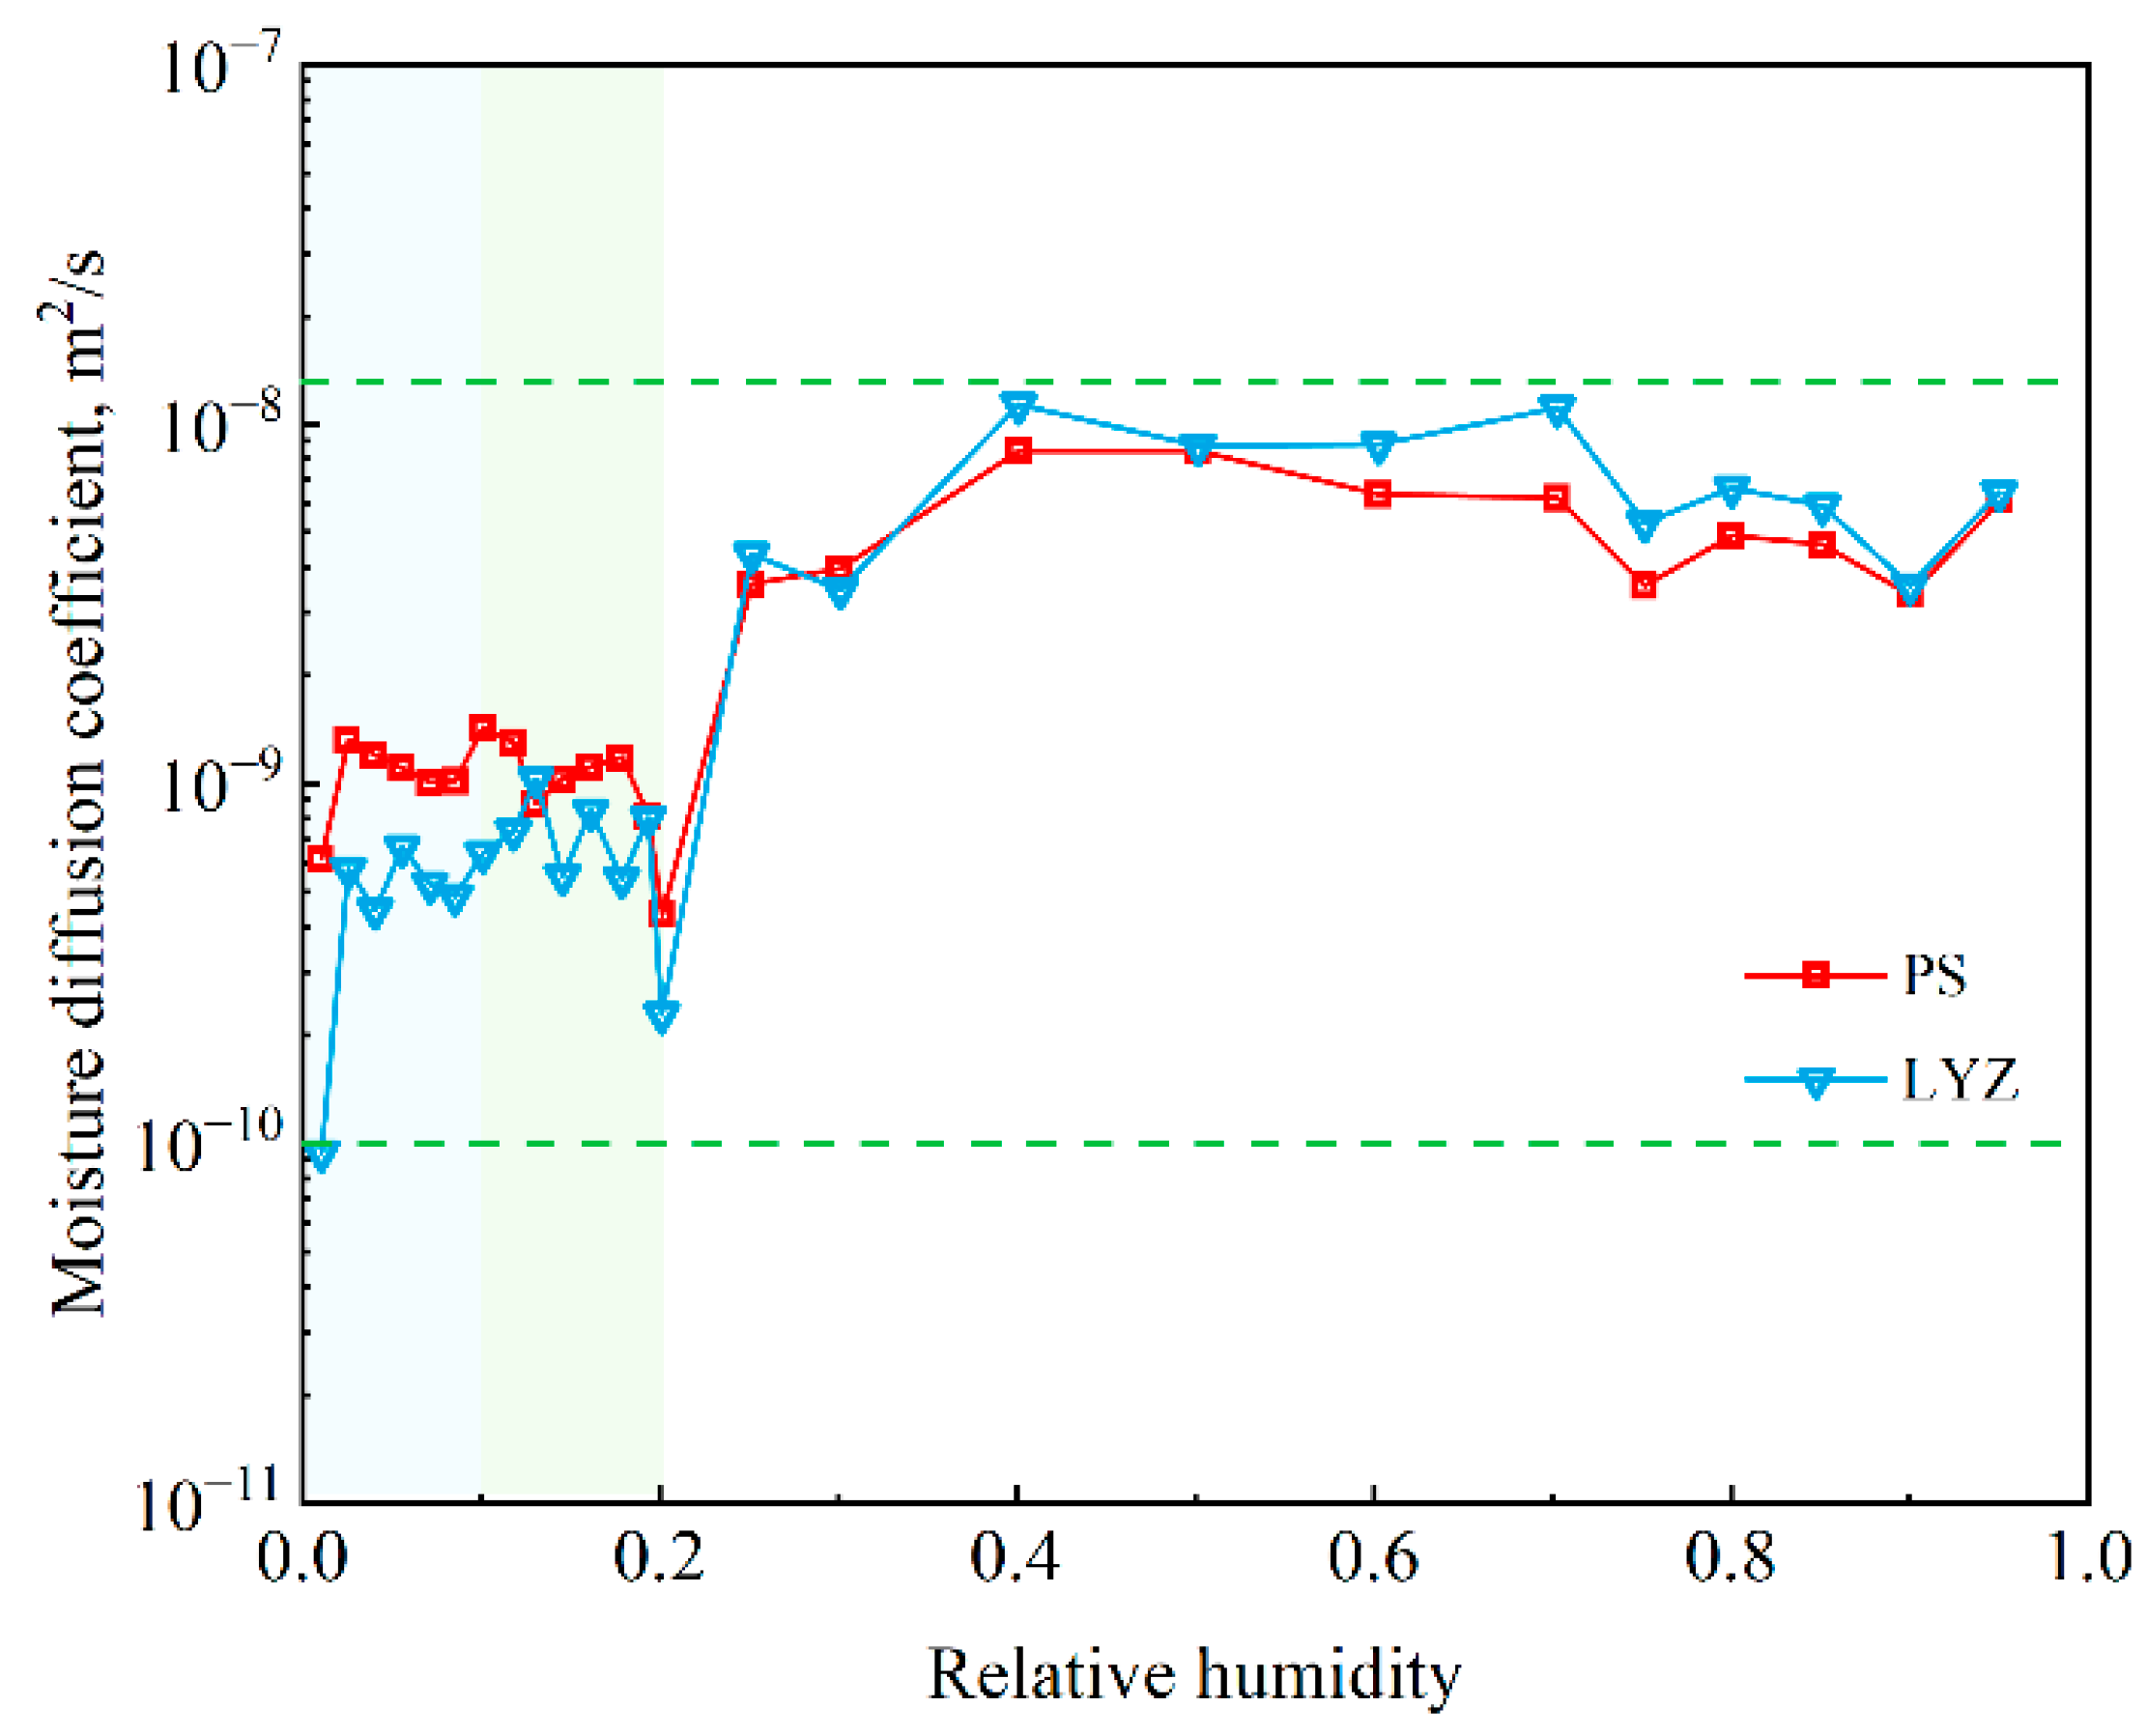
3.4. Diffusion of Water Vapor in Coal Pore Fissures

The moisture diffusion coefficient indicates the ability of moisture diffusion in the coal rock medium and determines the migration process of moisture within the coal rock. Hence, an accurate assessment of the moisture diffusion coefficient is essential for further understanding hydraulic measures. Here we study the average diffusion coefficient at each relative pressure, so we use a unipore model study of diffusion in coals. The uinpore diffusion model proposed by Crank is shown in Equation (10) [56].
M t M = 1 6 π 2 n = 1 1 n 2 exp ( D pore n 2 π 2 t L 2 )
where M t is the amount of adsorption at time t, mmol/g; M represents the ultimate adsorption capacity, mmol/g; t is time, s; L is the diffusion path length, m; and D pore is diffusion coefficient, m2/s.
When the time, t, is less than 600 s or M / M is less than 0.5, Equation (10) can be approximated as:
M t M = 6 D pore t π L 2
The diffusion coefficient, D pore , is calculated from the slope of the line 6 ( D pore / π L 2 ) 1 / 2 by fitting the relationship between M / M and t 1 / 2 .
Based on the data of the curve of the amount of water vapor adsorbed by coal with time in Figure 4 and Figure 5, we obtained the curve of the water diffusion coefficient with relative pressure in Figure 9 by fitting Mt/M and t1/2 to Equation (11). The diffusion coefficient of water vapor varied between 1.031 × 10⁻¹⁰ and 1.403−8 m2/s in PS and LYZ coal samples at relative pressure 0 < p/p0 < 1. The diffusion coefficients of the two coal samples showed a fluctuation curve of increasing, then decreasing, and then rising with increasing relative pressure. We divided the relative pressure into two regions based on the variation of the diffusion coefficient with p/p0 = 0.2. At the relative pressure range (0 < p/p0 < 0.2), the water vapor diffusion coefficient of PS coal was greater than that of LYZ.
According to parameter E2 fitted by the BDA model (Table 4), the possible reason is the interaction energy, E2, between the coal fracture surface and water molecules of the PS coal sample in the macropore stage is greater than that of LYZ. The c-value of the monolayer adsorption energy PS of GAB is greater than that of LYZ, so the diffusion coefficient of PS in the low-pressure section is greater than that of LYZ. At the relative pressure stage p/p0 > 0.2, the diffusion coefficient of LYZ is larger than that of PS. The possible reason is that pyrite, illite, and nacrite in the LYZ coal samples adsorb more water due to the expansion of some areas caused by the exothermic adsorption of water (Figure 1). Meanwhile, pyrite, illite, and nacrite containing strong water adsorption can significantly enhance the interaction between coal pore fissure surface and water molecules, thus absorbing more water.

3.5. Effect of Water on Methane Content in Coal

The interaction energy between coal and water is greater than coal and methane [13,57]. The adsorption behavior of water vapor on carbon-containing materials is significantly different from that of adsorption of the nonpolar gas methane. Hydrogen bonding plays a major role in coal absorbing water [58], while the coal–methane interaction is mainly by van der Waals forces [59]. When the coal seam includes a portion of water, each water molecule can displace 0.2 methane molecules [21]. Coal contains hydrophilic inorganic minerals [16], such as illite, kaolinite, pyrite, and other inorganic minerals. Therefore, water molecules displace methane adsorption sites from the oxygen-containing functional groups and hydrophilic inorganic mineral surfaces. Meanwhile, the capillary condensation of water may block the channel, making the adsorbed methane sites unavailable [60]. As a result, the coal seam gas content measured is a bit smaller because of moisture [2,11]. In addition, the electrostatic interaction between water molecules is very strong, making it a liquid at room temperature [61]. When the surface of the mesopore and macropore in the coal seam is partially occupied with liquid water, the water content of the coal seam was increased; this reduces the rate of gas diffusion and decreases the dust concentration, which enhances the safety of the mining working face and optimizing the work environment of the mining face in the process of the coal seam being mined. In this paper, only two coal samples were studied, and the next step will be to study water vapor adsorption by coals with different degrees of metamorphism.

4. Conclusions

In this paper, we investigated the mechanism of the pore fissure structure of coal and its surface physicochemical properties affecting water vapor adsorption on coals. MIP, XRD, and VVS experiments were carried out on two coals. Water vapor adsorption data were analyzed using GAB, DA, FHH, Freundlich, and BDA models. The main conclusions are as follows.
  • Combining the FHH model with the GAB model can determine the cut-off pressure point between monolayer and multilayer water vapor adsorption in coal. The transition pressure points p/p0 from monolayer to multilayer adsorption of PS and LYZ are 0.518–0.501 and 0.401–0.648. The cut-off pressure points of coal adsorption water vapor from multilayer adsorption to capillary coalescence should be determined by combining the FHH model with the Freundlich model. The points for PS and LYZ are 0.751–0.800 and 0.702–0.751.
  • The DDA model is optimal for fitting the water vapor adsorption of coal with inorganic minerals. The model can characterize the strong adsorption characteristic energy with double-pore characteristics. Strong water adsorption minerals, such as illite, nacrite, and pyrite, can improve the ability of coal to adsorb water and increase the diffusion coefficient of water vapor in coal pore fissures.

Author Contributions

Y.X.: Conceptualization, Methodology, Investigation, Data Curation, Formal analysis, Validation, Writing—Original Draft. X.C.: Supervision, Resources, Funding acquisition. W.Z.: Formal analysis, Writing—Review and Editing. P.C.: Supervision, Writing—Review and Editing. All authors have read and agreed to the published version of the manuscript.

Funding

The authors are grateful to China’s National Natural Science Foundation (No.52174181, No. 51574124, and No. 51904311). Supported by Beijing Natural Science Foundation (8222070). The Fundamental Research Funds for the Central Universities (2022YQAQ02).

Institutional Review Board Statement

Not applicable.

Informed Consent Statement

Not applicable.

Data Availability Statement

The data supporting the findings can be found in the figures, tables, and manuscript.

Conflicts of Interest

The authors declare that they have no known competing financial interest or personal relationship that could have influenced the work reported in this paper.

References

  1. Shu, L.; Wang, K.; Liu, Z.; Zhao, W.; Zhu, N.; Lei, Y. A novel physical model of coal and gas outbursts mechanism: Insights into the process and initiation criterion of outbursts. Fuel 2022, 323, 124305. [Google Scholar] [CrossRef]
  2. XOДOT, B.B. Coal and Gas Outburst; China Industry Press: Beijing, China, 1966. [Google Scholar]
  3. Yang, W.; Lin, M.; Walton, G.; Lin, B.; Sinha, S.; Lu, C.; Li, G. Blasting-enhanced water injection for coal and gas out-burst control. Process Saf. Environ. Prot. 2020, 140, 233–243. [Google Scholar] [CrossRef]
  4. Guanhua, N.; Hongchao, X.; Zhao, L.; Lingxun, Z.; Yunyun, N. Improving the permeability of coal seam with pulsating hydraulic fracturing technique: A case study in Changping coal mine, China. Process. Saf. Environ. Prot. 2018, 117, 565–572. [Google Scholar] [CrossRef]
  5. Lecampion, B.; Bunger, A.; Zhang, X. Numerical methods for hydraulic fracture propagation: A review of recent trends. J. Nat. Gas Sci. Eng. 2018, 49, 66–83. [Google Scholar] [CrossRef] [Green Version]
  6. Cai, J.; Jin, T.; Kou, J.; Zou, S.; Xiao, J.; Meng, Q. Lucas-Washburn Equation-Based Modeling of Capillary-Driven Flow in Porous Systems. Langmuir 2021, 37, 1623–1636. [Google Scholar] [CrossRef] [PubMed]
  7. Wang, L.; Cheng, L.-B.; Cheng, Y.-P.; Liu, S.; Guo, P.-K.; Jin, K.; Jiang, H.-N. A new method for accurate and rapid measurement of underground coal seam gas content. J. Nat. Gas Sci. Eng. 2015, 26, 1388–1398. [Google Scholar] [CrossRef]
  8. Liu, Y.; Du, Y.; Li, Z.; Zhao, F.; Zuo, W.; Wei, J.; Mitri, H. A rapid and accurate direct measurement method of underground coal seam gas content based on dynamic diffusion theory. Int. J. Min. Sci. Technol. 2020, 30, 799–810. [Google Scholar] [CrossRef]
  9. Zhao, D.; Gao, T.; Ma, Y.; Feng, Z. Methane Desorption Characteristics of Coal at Different Water Injection Pressures Based on Pore Size Distribution Law. Energies 2018, 11, 2345. [Google Scholar] [CrossRef] [Green Version]
  10. Qin, X.; Singh, H.; Cai, J. Sorption characteristics in coal and shale: A review for enhanced methane recovery. Capillarity 2022, 5, 1–11. [Google Scholar] [CrossRef]
  11. Nie, B.; Liu, X.; Yuan, S.; Ge, B.; Jia, W.; Wang, C.; Chen, X. Sorption charateristics of methane among various rank coals: Impact of moisture. Adsorption 2016, 22, 315–325. [Google Scholar] [CrossRef]
  12. Wang, F.; Yao, Y.; Wen, Z.; Sun, Q.; Yuan, X. Effect of water occurrences on methane adsorption capacity of coal: A comparison between bituminous coal and anthracite coal. Fuel 2020, 266, 117102. [Google Scholar] [CrossRef]
  13. Merkel, A.; Gensterblum, Y.; Krooss, B.M.; Amann, A. Competitive sorption of CH4, CO2 and H2O on natural coals of different rank. Int. J. Coal Geol. 2015, 150–151, 181–192. [Google Scholar] [CrossRef]
  14. Ahamed, M.A.A.; Perera, M.S.A.; Matthai, S.K.; Ranjith, P.G.; Dong-yin, L. Coal composition and structural variation with rank and its influence on the coal-moisture interactions under coal seam temperature conditions—A review article. J. Pet. Sci. Eng. 2019, 180, 901–917. [Google Scholar] [CrossRef]
  15. Wang, K.; Ma, X.; Jiang, S.; Wu, Z.; Shao, H.; Pei, X. Application study on complex wetting agent for dust-proof after gas drainage by outburst seams in coal mines. Int. J. Min. Sci. Technol. 2016, 26, 669–675. [Google Scholar] [CrossRef]
  16. Shen, W.; Li, X.; Lu, X.; Guo, W.; Zhou, S.; Wan, Y. Experimental study and isotherm models of water vapor adsorption in shale rocks. J. Nat. Gas Sci. Eng. 2018, 52, 484–491. [Google Scholar] [CrossRef]
  17. Li, A.; Han, W.; Fang, Q.; Memon, A.; Ma, M. Experimental investigation of methane adsorption and desorption in water-bearing shale. Capillarity 2020, 3, 45–55. [Google Scholar] [CrossRef]
  18. Liu, S.; Zhang, D.; Lun, Z.; Zhao, C.; Wang, H. Occurrence of water within different rank coals: A review. Energy Sources Part A Recovery Util. Environ. Eff. 2020, 1–19. [Google Scholar] [CrossRef]
  19. Shen, W.; Li, X.; Cihan, A.; Lu, X.; Liu, X. Experimental and numerical simulation of water adsorption and diffusion in shale gas reservoir rocks. Adv. Geo-Energy Res. 2019, 3, 165–174. [Google Scholar] [CrossRef]
  20. Dubinin, M.M.; Astakhov, V. Development of the concept of volume filling of micropores in the adsorption of gases and vapors by microporous adsorbents. Bull. Acad. Sci. Ussr Div. Chem. Sci. 1971, 20, 13–16. [Google Scholar] [CrossRef]
  21. Day, S.; Sakurovs, R.; Weir, S. Supercritical gas sorption on moist coals. Int. J. Coal Geol. 2008, 74, 203–214. [Google Scholar] [CrossRef]
  22. Freundlich, H. Of the adsorption of gases. Section II. Kinetics and energetics of gas adsorption. Introductory paper to section II. Trans. Faraday Soc. 1932, 28, 195–201. [Google Scholar] [CrossRef]
  23. Halsey, G. Physical Adsorption on Non-Uniform Surfaces. J. Chem. Phys. 1948, 16, 931–937. [Google Scholar] [CrossRef]
  24. Yang, R.; Jia, A.; Hu, Q.; Guo, X.; Sun, M. Particle size effect on water vapor sorption measurement of organic shale: One example from Dongyuemiao Member of Lower Jurassic Ziliujing Formation in Jiannan Area of China. Adv. Geo-Energy Res. 2020, 4, 207–218. [Google Scholar] [CrossRef]
  25. Sang, G.; Liu, S.; Elsworth, D. Water Vapor Sorption Properties of Illinois Shales under Dynamic Water Vapor Conditions: Experimentation and Modeling. Water Resour. Res. 2019, 55, 7212–7228. [Google Scholar] [CrossRef]
  26. Guo, H.J.; Yuan, L.; Cheng, Y.P.; Wang, K.; Xu, C. Experimental investigation on coal pore and fracture characteristics based on fractal theory. Powder Technol. 2019, 346, 341–349. [Google Scholar] [CrossRef]
  27. Ye, D.; Liu, G.; Gao, F.; Xu, R.; Yue, F. A multi-field coupling model of gas flow in fractured coal seam. Adv. Geo-Energy Res. 2021, 5, 104–118. [Google Scholar] [CrossRef]
  28. Dubinin, M.; Stoeckli, H. Homogeneous and heterogeneous micropore structures in carbonaceous adsorbents. J. Colloid Interface Sci. 1980, 75, 34–42. [Google Scholar] [CrossRef] [Green Version]
  29. Zhao, W. Diffusion Dynamics of Rapid Desorption of Gas from Pulverized Coal and Its Influence on Transporting Coal and Rock in Outbursts. Ph.D. Thesis, China University of Mining and Technology, Beijing, China, 2018. [Google Scholar]
  30. Cherif, M.M.; Amal, M.; Ramdane, B. Effect of swelling mineral on geotechnical characteristics of clay soil. MATEC Web Conf. 2018, 149, 02067. [Google Scholar] [CrossRef]
  31. Wade, L.G. Organic Chemistry, 2nd ed.; Prentice Hall: Englewood Cliffs, NJ, USA, 1991. [Google Scholar]
  32. Johnston, C.T. Clay mineral—Water interactions. In Surface and Interface Chemistry of Clay Minerals; Elsevier: Amsterdam, The Netherlands, 2018; pp. 89–124. [Google Scholar] [CrossRef]
  33. Ben Haj Amara, A.; Plançon, A.; Ben Brahim, J.; Ben Rhaiem, H. XRD Study of the Stacking Mode in Natural and Hydrated Nacrite. Mater. Sci. Forum 1998, 278–281, 809–813. [Google Scholar] [CrossRef]
  34. Shamburger, J.; Patrick, D.; Lutton, R. Design and Construction of Compacted Shale Embankments. In Survey of Problem Areas and Current Practices; Federal Highway Administration: Washington, DC, USA, 1975; Volume 1. [Google Scholar]
  35. Schuttlefield, J.D.; Cox, D.; Grassian, V.H. An investigation of water uptake on clays minerals using ATR-FTIR spectroscopy coupled with quartz crystal microbalance measurements. J. Geophys. Res. 2007, 112. [Google Scholar] [CrossRef] [Green Version]
  36. Liu, Y.; Chen, J.; Li, Y.; Zhang, J.; Kang, D. First-principles study on the adsorption structure of water molecules on a pyrite (100) surface. Physicochem. Probl. Miner. Process. 2021, 57, 121–130. [Google Scholar] [CrossRef]
  37. Wang, Z.Y.; Cheng, Y.P.; Wang, G.; Ni, G.H.; Wang, L. Comparative analysis of pore structure parameters of coal by using low pressure argon and nitrogen adsorption. Fuel 2022, 309, 122120. [Google Scholar] [CrossRef]
  38. Hulston, J.; Chaffee, A.L.; Bergins, C.; Strauß, K. Comparison of Physico-Chemical Properties of Various Lignites Treated by Mechanical Thermal Expression. Coal Prep. 2005, 25, 269–293. [Google Scholar] [CrossRef]
  39. He, Q.; Cao, Y.; Miao, Z.; Ren, X.; Chen, J. Estimation of Pores Distribution in Lignite Utilizing Hg, H2O, CO2, and N2 as Molecular Probes. Energy Fuels 2017, 31, 13259–13265. [Google Scholar] [CrossRef]
  40. Bustin, R.M.; Bustin, A.M.; Cui, A.; Ross, D.; Pathi, V.M. Impact of shale properties on pore structure and storage characteristics. In Proceedings of the SPE Shale Gas Production Conference, Fort Worth, TX, USA, 16–18 November 2008. [Google Scholar] [CrossRef]
  41. Clarkson, C.R.; Solano, N.; Bustin, R.M.; Bustin, A.M.M.; Chalmers, G.R.L.; He, L.; Melnichenko, Y.B.; Radliński, A.P.; Blach, T.P. Pore structure characterization of North American shale gas reservoirs using USANS/SANS, gas adsorption, and mercury intrusion. Fuel 2013, 103, 606–616. [Google Scholar] [CrossRef]
  42. Guo, J.; Kang, T.; Kang, J.; Zhao, G.; Huang, Z. Effect of the lump size on methane desorption from anthracite. J. Nat. Gas Sci. Eng. 2014, 20, 337–346. [Google Scholar] [CrossRef]
  43. Rouquerol, F.; Rouquerol, J.; Sing, K. Adsorption by Powders and Porous Solids; Elsevier: Amsterdam, The Netherlands, 2014. [Google Scholar]
  44. Everett, D.H.; Powl, J.C. Adsorption in slit-like and cylindrical micropores in the henry’s law region. A model for the microporosity of carbons. J. Chem. Soc. Faraday Trans. 1 Phys. Chem. Condens. Phases 1976, 72, 619–636. [Google Scholar] [CrossRef]
  45. Yang, Z. 100 Questions on Physisorption; Chemical Industry Press: Beijing, China, 2017. [Google Scholar]
  46. Mccutcheon, A.L.; Barton, W.A. Contribution of Mineral Matter to Water Associated with Bituminous Coals. Energy Fuels 1999, 13, 160–165. [Google Scholar] [CrossRef]
  47. Mccutcheon, A.L. Kinetics of water adsorption/desorption on bituminous coals. Energy Fuels 2001, 15, 1387–1395. [Google Scholar] [CrossRef]
  48. Hatch, C.D.; Wiese, J.S.; Crane, C.C.; Harris, K.J.; Kloss, H.G.; Baltrusaitis, J. Water Adsorption on Clay Minerals as a Function of Relative Humidity: Application of BET and Freundlich Adsorption Models. Langmuir 2012, 28, 1790–1803. [Google Scholar] [CrossRef]
  49. Frenkel, J. Kinetic Theory of Liquids; Oxford University Press: New York, NY, USA, 1946; p. 36. [Google Scholar]
  50. Hill, T.L. Theory of Physical Adsorption. In Advances in Catalysis; Frankenburg, W.G., Komarewsky, V.I., Rideal, E.K., Eds.; Academic Press: Cambridge, MA, USA, 1952; Volume 4, pp. 211–258. [Google Scholar]
  51. Thommes, M.; Kaneko, K.; Neimark, A.V.; Olivier, J.P.; Rodriguez-Reinoso, F.; Rouquerol, J.; Sing, K.S.W. Physisorption of gases, with special reference to the evaluation of surface area and pore size distribution (IUPAC Technical Report). Pure Appl. Chem. 2015, 87, 1051–1069. [Google Scholar] [CrossRef] [Green Version]
  52. Ann-marie; cadden, Moisture Sorption Characteristics of Several Food Fibers. J. Food Sci. 1988, 53, 1150–1155. [CrossRef]
  53. van den Berg, C.; Bruin, S. Water activity and its estimation in food systems: Theoretical aspects. In Water Activity: Influences on Food Quality; Rockland, L.B., Stewart, G.F., Eds.; Academic Press: Cambridge, MA, USA, 1981; pp. 1–61. [Google Scholar]
  54. Jin, Y.; Huang, Z. Adsorption and Pore Size Distribution; National Defense Industry Press: Beijing, China, 2015. [Google Scholar]
  55. Dubinin, M.M. Fundamentals of the theory of adsorption in micropores of carbon adsorbents: Characteristics of their adsorption properties and microporous structures. Pure Appl. Chem. 1989, 27, 457–468. [Google Scholar]
  56. Zhao, W.; Wang, K.; Cheng, Y.; Liu, S.; Fan, L. Evolution of gas transport pattern with the variation of coal particle size: Kinetic model and experiments. Powder Technol. 2020, 367, 336–346. [Google Scholar] [CrossRef]
  57. Zeng, Q.; Wang, Z.; McPherson, B.J.; McLennan, J.D. Modeling Competitive Adsorption between Methane and Water on Coals. Energy Fuels 2017, 31, 10775–10786. [Google Scholar] [CrossRef]
  58. Charriere, D.; Behra, P. Water sorption on coals. J. Colloid Interface Sci. 2010, 344, 460–467. [Google Scholar] [CrossRef]
  59. Lu, S.; Zhang, Y.; Sa, Z.; Si, S. Evaluation of the effect of adsorbed gas and free gas on mechanical properties of coal. Environ. Earth Sci. 2019, 78, 218. [Google Scholar] [CrossRef]
  60. Pajdak, A. Studies on the influence of moisture on the sorption and structural properties of hard coals. Int. J. Greenh. Gas Control 2020, 103, 103193. [Google Scholar] [CrossRef]
  61. Sung, B.; Kim, J.; Stambaugh, C.; Chang, S.J. Direct measurement of activation time and nucleation rate in capillary-condensed water nanomeniscus. Appl. Phys. Lett. 2013, 103, 213107. [Google Scholar] [CrossRef]
Figure 1. PS and LYZ coal samples that were refined with Rietveld full-spectrum fitting. (a) XRD of PS sample, (b) XRD of LYZ sample.
Energies 15 04321 g001
Figure 2. (a) Intrusion/extrusion mercury curve of PS and LYZ coal samples, (b) Volume distribution of PS and LYZ coal samples.
Energies 15 04321 g002
Figure 3. Fractal characteristics of mercury injection data of PS and LYZ coal samples.
Energies 15 04321 g003
Figure 4. Water vapor ad/desorption isotherms for the two coal samples at 30 °C.
Energies 15 04321 g004
Figure 5. Changes in the quality and relative humidity of the adsorption/desorption in three coal samples with time.
Energies 15 04321 g005
Figure 6. The linear effect of PS and LYZ coal samples’ adsorbed water vapor data processed by the FHH model.
Energies 15 04321 g006
Figure 7. Water vapor adsorption isotherms for PS and LYZ recovered from linear fits of the Freundlich model.
Energies 15 04321 g007
Figure 8. DA, GAB, and BDA model fitting curves for PS and LYZ coal sample’s adsorbed water vapor data.
Energies 15 04321 g008
Figure 9. The water vapor diffusion coefficient variation in coal pore fissure under different relative humidity.
Energies 15 04321 g009
Table 1. Basic parameters of coal.
Coal SamplesMad (%)Ad (%)Vdaf (%)FCad (%)
PS2.25517.64131.24448.860
LYZ1.41328.49820.17250.264
Note: Mad—moisture; Ad—ash; Vdaf—Volatile; FCad—fixed carbon.
Table 2. FHH Modeling Parameters of Adsorption Isotherms of PS and LYZ coal samples.
ModelCoal SamplesModel CoefficientsThe Goodness of Fit Index
BFHHnFHHp/p0R2SSERMSE
FHH
BFHH, nFHH
PS1.7934−8.02380.8000.974590.000330.01291
3.2430−3.05140.5010.997580.000160.00727
2.0158−1.38750.2010.971460.005140.04141
LYZ4.2426−6.28610.7510.924000.002810.03062
3.9457−2.06500.4010.992640.001170.01979
1.7760−0.81620.1610.979770.009230.04296
Note: RMSE = root-mean-square error; SSE = sum of squares of the error.
Table 3. Freundlich Modeling Parameters of Adsorption Isotherms of PS and LYZ coal samples.
ModelCoal SamplesModel CoefficientsThe Goodness of Fit Index
μnFreup/p0R2SSERMSE
Freundlich
μ, nFreu
PS1.403471.247880.7510.992150.0701000.064220
0.342940.90663-0.996910.0001930.006950
LYZ1.274112.950030.7020.997020.0383000.047470
1.332780.79614-0.99430.0004610.010740
Note. RMSE = root-mean-square error; SSE = sum of squares of the error.
Table 4. DA, GAB, and BDA modeling parameters of adsorption isotherms of PS and LYZ coal samples.
Coal SamplesModelsModel CoefficientsThe Goodness of Fit Index
SSER2RMSE
PSDAmDA0EnDA---
1.37853108.490.9046---0.01190.99680.0218
GABmGAB0ckp/p0--
0.77367.59480.51320.518--0.00280.99920.0107
BDAmDuDA01E1nDuDA1mDuDA02E2nDuDA2
5.06407648.832.2150.31063364.10.56920.00170.99950.0083
LYZDAmDA0EnDA---
1.33752380.750.8812---0.00480.99870.0138
GABmGAB0ckp/p0--
0.79993.88600.51940.648--0.00230.99930.0096
BDAmDuDA01E1nDuDA1mDuDA02E2nDuDA2
2.60918913.212.73220.53842368.90.75260.00210.99940.0091
Note. RMSE = root-mean-square error; SSE = sum of squares of the error.
Publisher’s Note: MDPI stays neutral with regard to jurisdictional claims in published maps and institutional affiliations.

