Article

Insulation Degradation Analysis Due to Thermo-Mechanical Stress in Deep-Sea Oil-Filled Motors †

1
College of Electrical Engineering, Zhejiang University, Hangzhou 310027, China
2
Institute of Ocean Engineering and Technology, Ocean College, Zhejiang University, Zhoushan 316021, China
*
Author to whom correspondence should be addressed.
This paper is an extended version of our paper published in IEEE 4th Student Conference on Electric Machines and Systems (SCEMS), Huzhou, China, 1–3 December 2021.
Energies 2022, 15(11), 3963; https://doi.org/10.3390/en15113963
Submission received: 31 March 2022 / Revised: 28 April 2022 / Accepted: 24 May 2022 / Published: 27 May 2022
(This article belongs to the Special Issue Energy, Electrical and Power Engineering 2021-2022)

Abstract

:
With the wide application of motors in deep sea exploration, deep-sea motors require a higher power density and a longer lifetime. Motor lifetime mainly depends on the thermo-mechanical stress (TMS) load on its stator insulation. Unlike normal motors, deep-sea motors are usually filled with oil to compensate for the high pressure generated by seawater, which leads to high additional viscous drag loss. This, combined with the high pressure, will greatly change the TMS distribution and further influence motor insulation lifetime. Thus, the insulation degradation analysis of deep-sea oil-filled (DSOF) motors due to TMS has become important. This paper presents a TMS analytical model of DSOF motor insulation, considering the joint effects of high pressure and motor temperature. The CFD method is adopted to perform motor thermal analysis, considering temperature effects on viscous drag loss. The FEA method is adopted for thermo-mechanical analysis and to verify the analytical model accuracy. Rainflow counting and the Miner fatigue method are adopted to evaluate motor lifetime. Results show that compared with motors working in normal environments, TMS on DSOF motor insulation can be reduced by up to 59.5% due to high pressure and the insulation lifetime can be increased by up to 16.02%. Therefore, this research can provide references for high power density DSOF motor design.

1. Introduction

Stator insulation systems (SISs) play a key role in affecting motor service life. The differences in thermal expansion coefficients among insulation components, including ground insulation, copper wires, coatings and epoxy fillings in stators, will induce thermo-mechanical stress (TMS) in the SIS. TMS is considered to be a critical factor causing insulation degradation [1]. Deep-sea motors usually adopt oil-filled methods to balance the seawater pressure, which brings two challenges to TMS assessment compared to motors running under normal conditions. One is that the oil filled in the air gap will lead to high additional temperature-dependent viscous drag loss and changing motor heat dissipation conditions, which will greatly influence the motor thermal distribution. The other is that the motor SIS is subjected to high pressure caused by seawater, which combined with the thermal distribution will change the TMS distribution greatly. In order to analyze the insulation degradation of a DSOF motor due to the TMS, these two challenges have to be considered.
In recent years, many researchers have addressed the thermal analysis issue of motors working on land, but few studies have focused on DSOF motors. The motor loss and heat dissipation conditions in DSOF motors are quite different from normal motors. The viscous loss induced by oil may account for more than 50% of the total loss [2]. Additionally, the thermal conductivities and heat transfer coefficients are tightly related to the fluid and temperature fields of DSOF motors. Therefore, numerical analyses such as the finite element method (FEM) and computational fluid dynamics (CFD) method should be adopted for the motor thermal analysis instead of analytical calculation. The advantage of the CFD method in calculating viscous drag loss compared with analytic methods has been demonstrated on a motor test rig [3]. The necessity of coupled field analysis by taking the viscous loss component into consideration in DSOF motor design has been illustrated in [4]. Reference [5] constructs a three-dimensional fluid-thermal coupled model of an oil-filled motor to obtain the heat transfer coefficients, fluid flow characteristics and temperature distribution. However, most of the published literature ignores the influence of temperature on the gap oil viscosity and the viscous loss. This paper focuses on this issue by using the viscosity user-defined function (UDF) to improve the accuracy of the DSOF motor temperature field calculation, based on which TMS analysis and lifetime assessment of the DSOF motor are performed.
TMS has been extensively studied in various industrial fields. The mismatch of materials’ thermal expansion coefficients can induce TMS in electronic assemblies not only by temperature cycling during normal operation, but also due to the high temperatures experienced during fabrication, shipping and storage [1]. References [6,7] present a degradation model investigating the thermo-mechanical fatigue in insulated gate bipolar transistor modules and apply it to degradation estimation as well as to the accurate lifetime assessment of power modules. References [8,9] analyze the failure of a ceramic ball grid array package used for an FPGA chip caused by TMS and both analytical modeling and numerical simulations are performed to analyze the TMS, which is validated to be the main factor causing FPGA chip failure. In the paper [10], fatigue life evaluation for multiple epoxy laminate composites considering the stress versus cycle life has been investigated. Reference [11] focuses on the thermo-mechanical fatigue of silicon and molybdenum (SiMo) alloyed ductile iron by performing FEA and testing the stresses of the specimen. In IEEE Standard-56, TMS is regarded as one of the aging factors of motor insulation [12]. As for electric motors, researchers have derived the TMS analytical equation of a single wire in epoxy-impregnated traction motor stator windings and established 3D FEA models to demonstrate it [13]. Reference [14] analyzes cooling methods to reduce the mechanical stress, which will cause fatigue and the degradation of motor insulation, induced by the thermal loading on motor windings impregnated with epoxy, and builds an experimental set-up to validate the numerical analysis results. Some researchers have performed thermo-structural simulations on a segmented stator winding geometry numerically to quantify the TMS induced in the motor windings due to high temperature [5]. However, the work on insulation degradation analysis caused by TMS in electric motors is far from sufficient, especially for motors working in the deep sea. For DSOF motors, the SIS bears a high pressure varying with the operating depth, which can reach more than 100 MPa for the working depth of 10,000 m. The high pressure will change the TMS distribution and further affect the motor lifetime. This paper seeks to address the insulation TMS distribution issue considering a high-pressure environment based on the accurate thermal calculation results of DSOF motors.
This paper will take the brushless DC (BLDC) motor as the target due to its outstanding performance and wide application in deep-sea equipment. The main contributions of this paper are as follows:
1. Considering the deep-sea high-pressure effects and structural characteristics of the DSOF motor SIS, an analytical model of TMS for stator insulation in DSOF motors is proposed. The effects of slot dimension and copper fill factor on the TMS are investigated, and the analytical model shows that TMS in DSOF motor stator insulation is closely related to the external seawater pressure, the motor temperature rises and the motor structure dimensions.
2. To obtain the DSOF motor temperature rises for the further TMS analysis, a 3D CFD model of a DSOF motor is established considering the sensitivity of oil viscosity to temperature. Two UDFs are compiled for the temperature field calculation. In addition, the influence of viscosity on the heat transfer coefficient of the motor is analyzed, and the importance of the viscous loss and viscosity UDFs in the temperature field in respect of the accurate calculation of the DSOF motor is demonstrated.
3. Based on the calculation results of the motor temperature distribution, the analytical TMS model is used to obtain the stator insulation TMS variation trend with the seawater pressure. It is found that the seawater pressure can decrease the TMS to 59.5% at most. Then, based on the DSOF motor model, numerical analysis is carried out to obtain the coupled TMS through thermal-mechanical simulation, which further demonstrates the accuracy of the proposed analytical model.
4. The TMS spectra of dangerous points on the stator insulation are synthesized. By counting the rainflow of the TMS spectra, combining the S-N curve of stator insulation materials and using Miner fatigue theory, the lifetime of the DSOF motor is predicted. The research can afford a new perspective for high power density DSOF motor design. Figure 1 shows the flow chart of fatigue lifetime evaluation of DSOF motors.
This paper is organized as follows. Section 2 derives the analytical model of TMS in DSOF motor SISs by considering deep-sea high pressure, motor temperature rises and structure dimensions. Section 3 focuses on the temperature field calculation of DSOF motors based on fluid-thermal coupling analysis. In Section 4, the temperature results obtained by CFD analysis are applied to further calculate the TMS. Thermal-structure simulations are conducted to verify the accuracy of the proposed TMS analytical model. In addition, the motor insulation degradation and lifetime prediction are investigated based on the TMS analysis results. Conclusions are given in Section 5.

2. Analytical Model

Figure 1 shows the flow chart of fatigue lifetime evaluation of DSOF motors. The derivation of the TMS analytical model is performed first. For a DSOF motor, the SIS is adhered to stator laminations and compressed copper wires. The polymer coating and copper have similar thermal expansion coefficients, which are quite different from those of the stator core and epoxy impregnation. Thus, high TMS will be introduced into the stator insulation when the motor temperature rises. Moreover, the high density of the copper wires and irregular shape of the stator slots will make derivation of the TMS analytical model very complex. In order to facilitate the task while ensuring the model accuracy, the derivation is implemented by a combination of preliminary derivation and post-modification. That is, we disregard the effect of stator slots and windings in the preliminary derivation and investigate them in the post-modification.

2.1. Preliminary Derivation of TMS Analytical Model

The stator model ignoring the stator slots and windings is shown in Figure 2, where the outer layer is the stator core layer and the inner layer is the impregnation insulation layer. The preliminary aim is to obtain the TMS analytical model of the inner layer. In a deep-sea high-pressure environment, the inner and outer surfaces of the model are subjected to the same pressure due to the oil-filled method.
Since the geometry of motor stator, the operating temperature distribution and the pressure constraints are all symmetrical about the central axis, the derivation of the TMS analytical model can be performed based on a cylindrical coordinate system. According to the strain–stress theory, strain-displacement correlations and Lamé equations for spatially axisymmetric hollow cylinders [15,16,17], the stress components of the inner layer can be obtained provided the pressure in the common boundary is known. The two layers have equal radial displacements at the common boundary. Accordingly, the outer surface pressure of the insulation layer can be determined. As shown in Figure 2, P s i and P s o are the internal and external pressures of the stator core layer, respectively. r s i and r s o are the stator core layer inner and outer radii. As for the insulation layer, P e i and P e o are its internal and external pressures, respectively. r e i and r e o are its inner and outer radii, respectively. The pressure at the common surface is P m , which is equal to P e o and P s i . The radius of the common boundary is r m , which is equal to r e o and r s i . By means of Lamé equations, the stresses at the outer surface of the insulation layer and the stresses at the inner surface of the stator core layer are obtained, which can be further substituted into the strain–stress equation. Then, the radial displacements of the insulation layer and stator core layer at the common boundary, u e o and u s i , can be obtained by means of strain-displacement correlation as follows:
u e o = r e o E e 2 P e i P e o R e 2 + 1 R e 2 1 μ e P e i R e 2 P e o R e 2 1 P e o + r e o α e T
u s i = r s i E s P s i R s 2 + 1 2 R s 2 P s o R s 2 1 μ s P s i R s 2 P s o R s 2 1 P s i + r s i α s T
where
R e = r e o r e i
R s = r s o r s i
R e denotes the ratio of the insulation layer outer radius to its inner radius. R s denotes the ratio of the stator layer outer radius to its inner radius. E e is Young’s modulus, μ e is Poisson’s ratio and α e is the coefficient of thermal expansion of the insulation layer. E s , μ s and α s denote the same properties of the stator core layer. T denotes model temperature rise. Considering a seawater pressure P equal to P e i and P s o , and with Equation (1) equal to Equation (2), the pressure P m can be expressed as
P m = V i o P V n T V m
where
V i o = 2 μ e R e 2 1 + R s 2 2 μ s R s 2 1 · E e E s
V m = 1 2 μ e R e 2 + μ e + 1 R e 2 1 + μ s + 1 R s 2 2 μ s + 1 R s 2 1 · E e E s
V n = E e α s α e
V i o , V m and V n are the coefficients related to the motor dimensions and material properties. Substituting Equation (3) and insulation layer parameters into the Lamé equations then using the von Mises theory, the average TMS on the stator insulation layer, σ a , can be expressed as
σ a = ς ( r ) · V m V i o P + V n T 2 V m 2
where
ς ( r ) = 2.25 r e o 2 r e o r e i R e 2 1 r e i r e o 1 r 2 d r
ς (r) is a function of the stator insulation layer radius. The preliminary TMS analytical model notes that there is a minimum value of average TMS on the SIS as the deep-sea pressure increases. The TMS will first decrease to a minimum value, and then increase with the deep-sea pressure rising.

2.2. Post-Modification

Subsequently, the influence of the stator slot dimension and copper fill factor on the TMS of the motor SIS are explored using Ansys software to refine the analytical model.

2.2.1. The Effect of Slot Dimension

For investigating the influence of slot dimension on the TMS, three stator models A 1 , A 2 and A 3 with stator teeth widths of 9, 13.4 and 16 mm are analyzed, respectively. The results are presented in Figure 3. The black line is the preliminary analytical model solution, while the others are from the simulation results. The minimum TMS points of the three model simulation results show no difference from the analytical solution, but the slopes are inconsistent and the difference will become larger when the stator slots become narrower. Consequently, the slot shape factor (SSF), s, denoting the ratio of the stator slot width to the stator yoke height is introduced to weigh the slot shape. Interestingly, the SSF only affects the changing rate of the TMS, not the minimum value. Therefore, the slope-modified coefficient Q s is introduced to refine the preliminary derivation model.
To further quantify the influence of SSF, another six FEA models A 4 to A 9 with different SSFs are constructed and simulated. The correlation of the modified coefficient Q s with s is shown in Figure 4. Remarkably, the slope-modified coefficient Q s will increase to a stable value of 0.9123 as the slot shape factor grows.

2.2.2. The Effect of Copper Fill Factor

For investigating the effects of the influence of the copper wire fill factor on the average TMS of the SIS, FEA simulations are performed on three stator FEA models with same SSF of 0.96 and different copper fill factors (CFFs), f, of 0, 0.3 and 0.4 are simulated. The results are presented in Figure 5. The black line still represents the analytical solution of the preliminary model, while others are from the simulation results. The three model simulation results of deep-sea pressure corresponding to the minimum TMS agree with the analytical solution, while the curve slope shows some inconsistencies. When the CFF becomes larger, the TMS changing rate will decrease, and the decrease rate will become smaller. Meanwhile, the lowest point moves upwards, and the slope closer to the minimum is gentler. Therefore, another slope-modified coefficient Q f is introduced to improve the preliminary derivation model.
To further explore the influence of CFF, five FEA models with different CFFs are investigated. The variation in the slope-modified coefficient Q f with f is shown in Figure 6. Notably, the slope-modified coefficient Q f will decrease to a stable value of 0.7913 as the CFF grows.
Eventually, the modified TMS analytical model can be expressed as
σ a = Q s Q f ς ( r ) · V m V i o P + V n T 2 V m 2
In Equation (5), the average TMS for the DSOF motor SIS is not only related to the material properties and dimensions of the motor, but also to the temperature change and the ambient pressure. When the motor material, dimensions and temperature rise are fixed, the TMS on the insulation will first decline to a minimum value and then increase as the DSOF motor work depth increases. By means of the analytical model, the external pressure corresponding to the minimum TMS based on the DSOF motor temperature rise can be predicted.

3. Temperature Distribution of DSOF Motors Based on Fluid-Thermal Coupling Analysis

DSOF motor thermal analysis needs to focus on heat sources and heat dissipation. For heat sources, except copper loss, iron loss and eddy current loss, additional viscous loss generated by oil filled in the air gap has to be considered. For heat dissipation, direct contact with oil and seawater makes the heat removal of DSOF motors quite different from normal ones. Thus, the key to the thermal analysis of DSOF motors is the accurate calculation of viscous loss and heat transfer coefficients. Viscous loss is closely related to rotation speed and oil viscosity. For an oil-filled motor, the inner and outer radii of the air gap are r 1 and r 2 , respectively, and according to the boundary conditions of the gap oil and fluid momentum equation, the mechanical loss consumed by the force of oil acting on the rotor surface can be determined. This mechanical loss, namely viscous loss, is defined as Equation (6) [18,19]:
P oil = 4 π μ ω 2 L r 2 2 r 1 2 δ ( r 2 + r 1 )
where μ denotes fluid dynamic viscosity (Pa · s), ω denotes rotor angular velocity, L is rotor axial length and δ is the air gap width. It can be noted that viscous loss has a linear relation with dynamic viscosity for a motor with determined dimensions and rotational speed. Obviously, viscosity has a critical impact on viscous loss.

3.1. Viscous Drag Loss at Different Temperature

Viscosity has a close relation with fluid temperature. The distance between fluid molecules will expand and the fluid viscosity will decrease significantly as the temperature increases [20,21]. Hence, viscous loss calculation needs to take the temperature into account. The experience formula describing the viscosity variations with temperature, namely the Poisson formula, is shown in Equation (7) [22,23]:
μ t = v ρ = μ 0 e λ ( t t 0 )
where μ t denotes the dynamic viscosity at temperature t, μ 0 denotes the dynamic viscosity at temperature t 0 , and λ is the viscosity-temperature coefficient (VTC) of the liquid, reflecting the viscosity decreasing rate. Clearly, the viscosity has an e-exponential correlation with the temperature. Unlike no-oil motors, the empirical value of VTC 0.035 cannot be directly adopted for DSOF motors [24]. It is necessary to introduce CFD numerical calculation methods. A 24-slot and 8-pole DSOF motor (Sanao Electrical, Shanghai, China) with 2.62 KW rated power and 5000 rpm operating speed was adopted as the research subject. Its 3D CFD model was established as presented in Figure 7. Figure 8 shows the meshing details, comprising a total of 3,533,129 meshing cells.
According to the CFD fluid field model of the motor, oil viscosities at different temperatures are obtained and the corresponding viscous losses are determined. For subsequent motor temperature analysis, the temperature and corresponding viscous loss are fitted and compiled into a UDF, namely a viscous loss UDF. The relation between the viscous loss and temperatures is presented as Equation (8), where pink P oil is viscous loss and T is the temperature of the gap oil.
P oil = 3.576 × 10 5 T 4 1.064 × 10 2 T 3 + 1.154 × 10 T 2 54.356 T + 1050.62

3.2. The Need for a Viscous Loss UDF and Viscosity UDF

Viscosity changing with temperature not only affects the heat source (viscous loss) but also the heat dissipation of the DSOF motor. Therefore, the function of viscosity changing with temperature should be compiled into a viscosity UDF and adopted in the temperature field numerical calculation. By fitting with a polynomial, the relation between the oil viscosity and temperature is expressed as follows:
μ = 1.201 × 10 10 T 5 + 5.387 × 10 8 T 4 9.284 × 10 6 T 3 + 7.735 × 10 4 T 2 3.162 × 10 2 T + 0.533
where μ is the oil viscosity. Then, the viscosity UDF is compiled and added to the CFD analysis. After fully investigating the heat source and the dissipation condition, a thermal analysis of the DSOF motor is performed. CFD analysis both with and without the UDFs is carried out for investigating the influence of the UDFs. The temperature results of each motor component are compared in Table 1. The initial temperature is set to 293 K.
It is noted that motor component temperatures with viscous UDF and viscosity UDF are lower than those without the UDFs. Temperature rises of the rotor, permanent magnets and stator of the DSOF motor have decreased by 17.96%, 18.06% and 17.17%, respectively, indicating that viscosity indeed affects the heat transfer coefficient and heat source of the DSOF motor, and further demonstrating the necessity of viscous and viscosity UDFs in the accurate thermal calculation of DSOF motors.

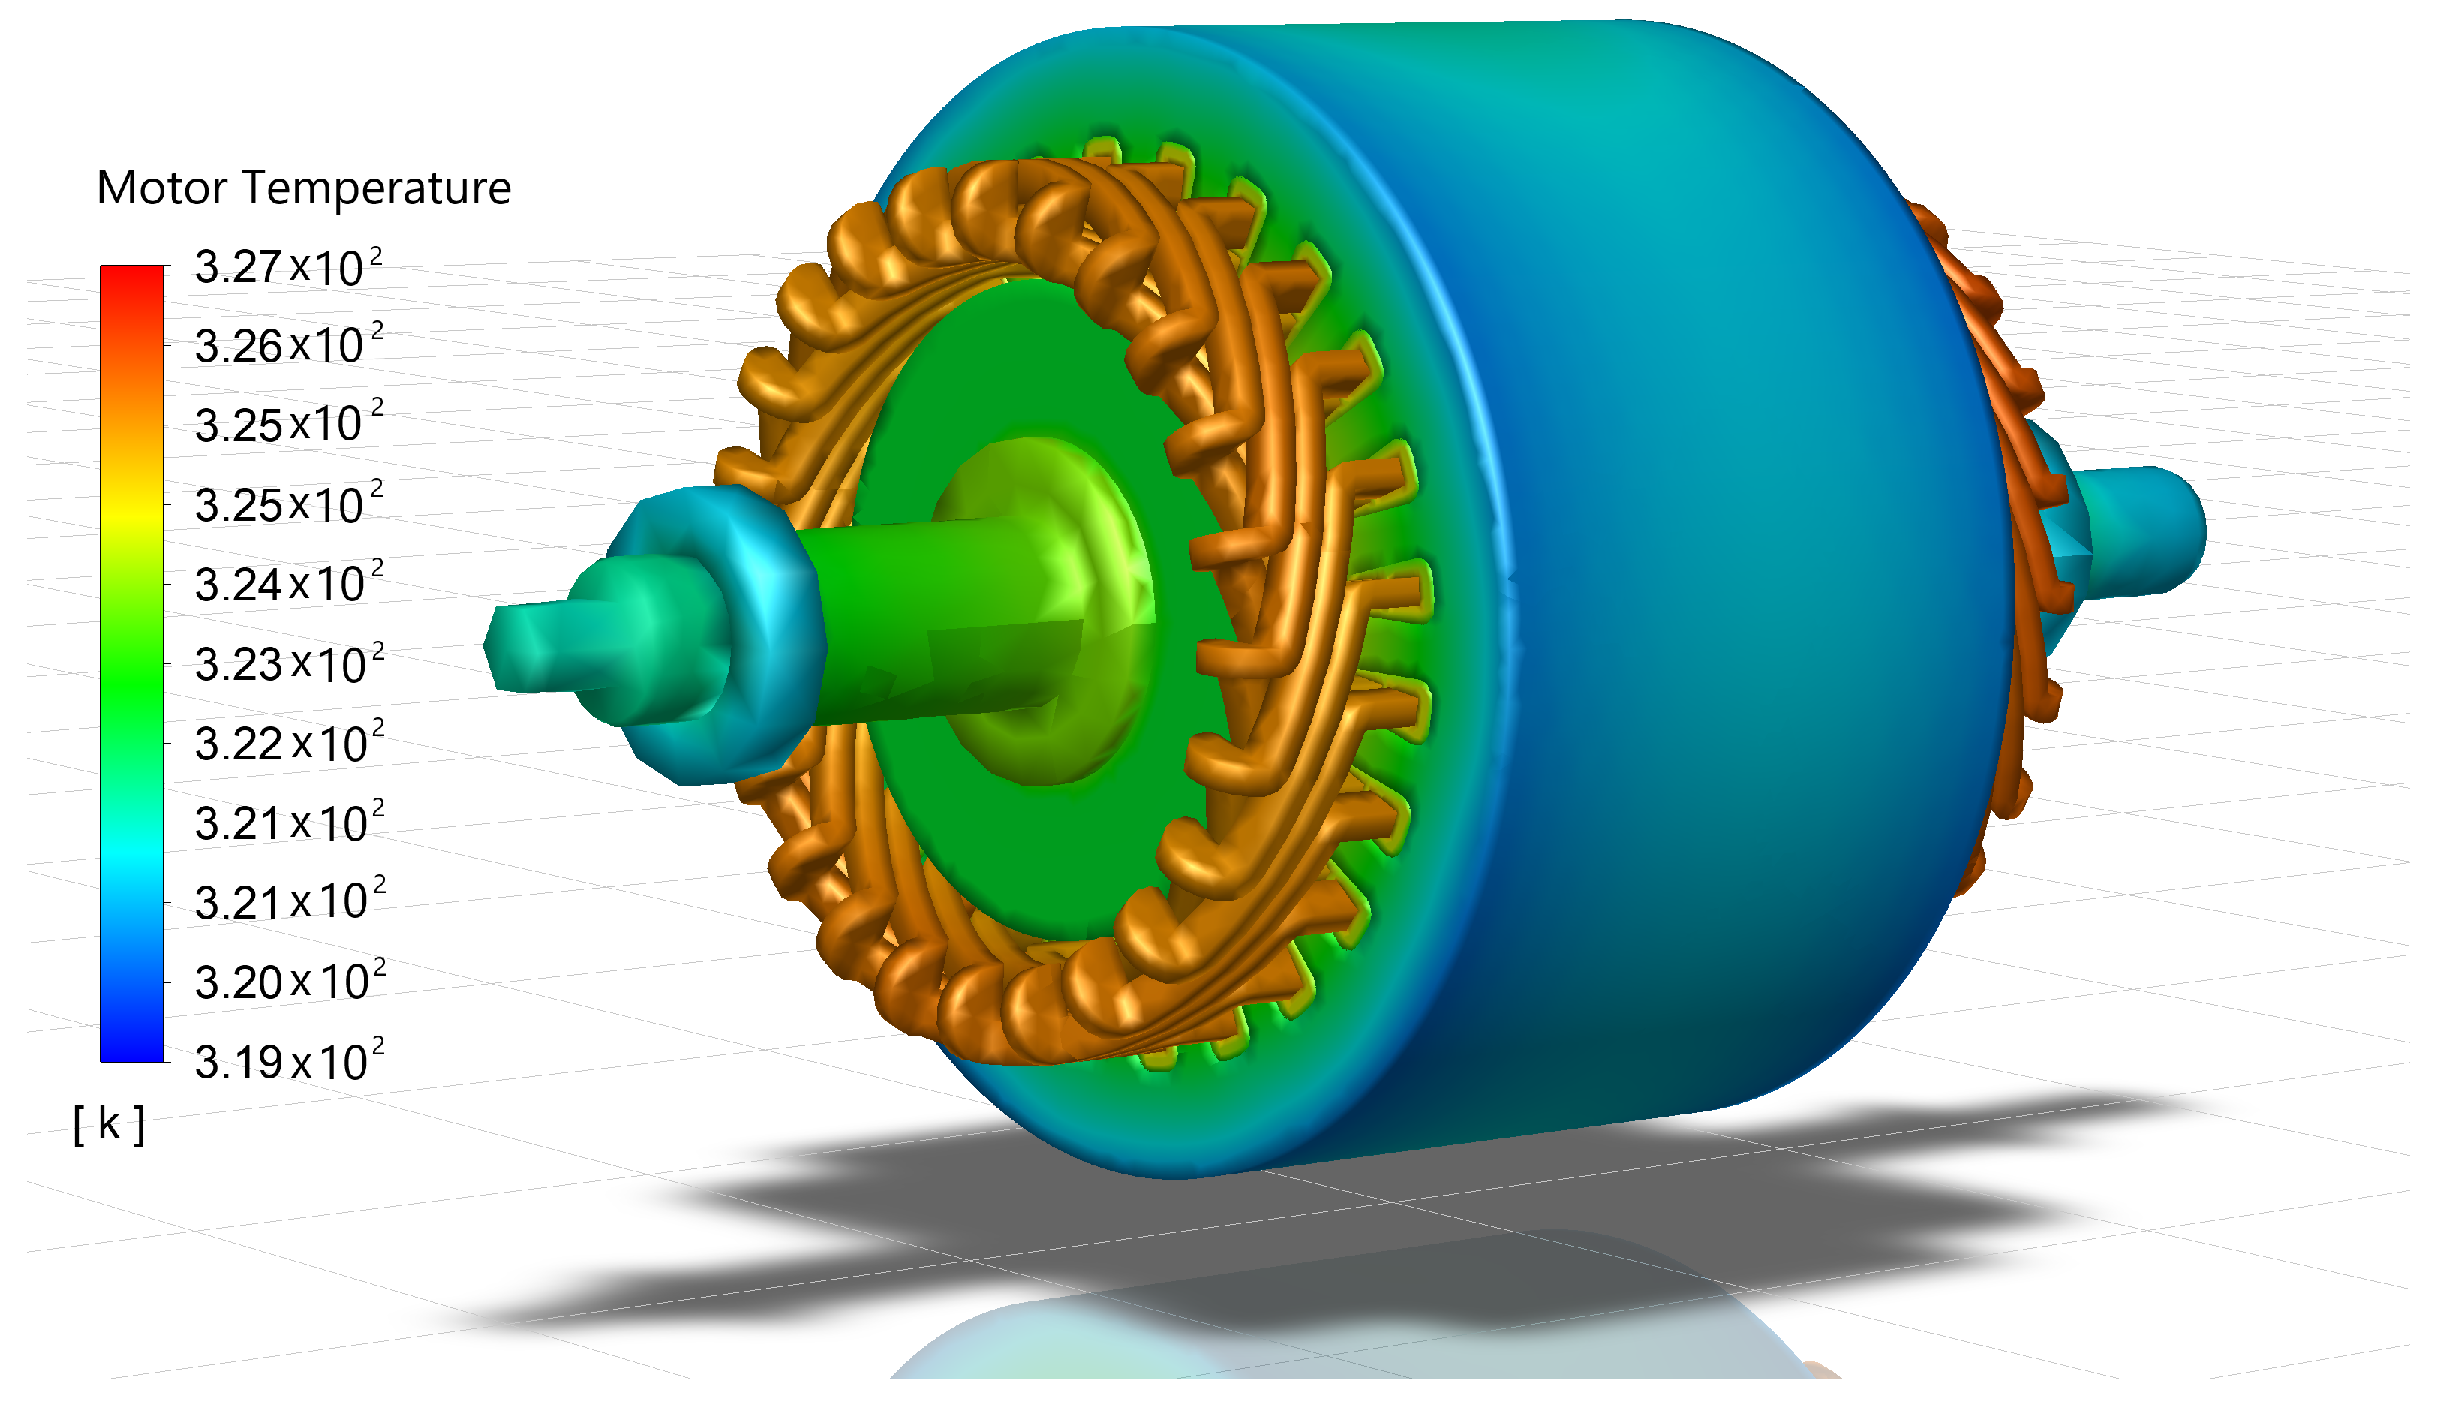
3.3. Temperature Distribution of DSOF Motor

The temperature distribution of the whole DSOF motor is shown in Figure 9. The motor maximum temperature is 327 K and minimum temperature is 321 K. It is noted that the temperature rises of all motor components are almost the same.
Figure 10 shows cross-section temperature contour details of the DSOF motor. Obviously, for the stator components, the maximum temperature difference is only 4 K. Therefore, the temperature distribution of the SIS can be regarded as uniform and spatially axisymmetric. The thermal analysis results will subsequently be used for the following TMS analysis of the DSOF motor.

4. Thermo-Mechanical Simulation and Lifetime Analysis of the DSOF Motor

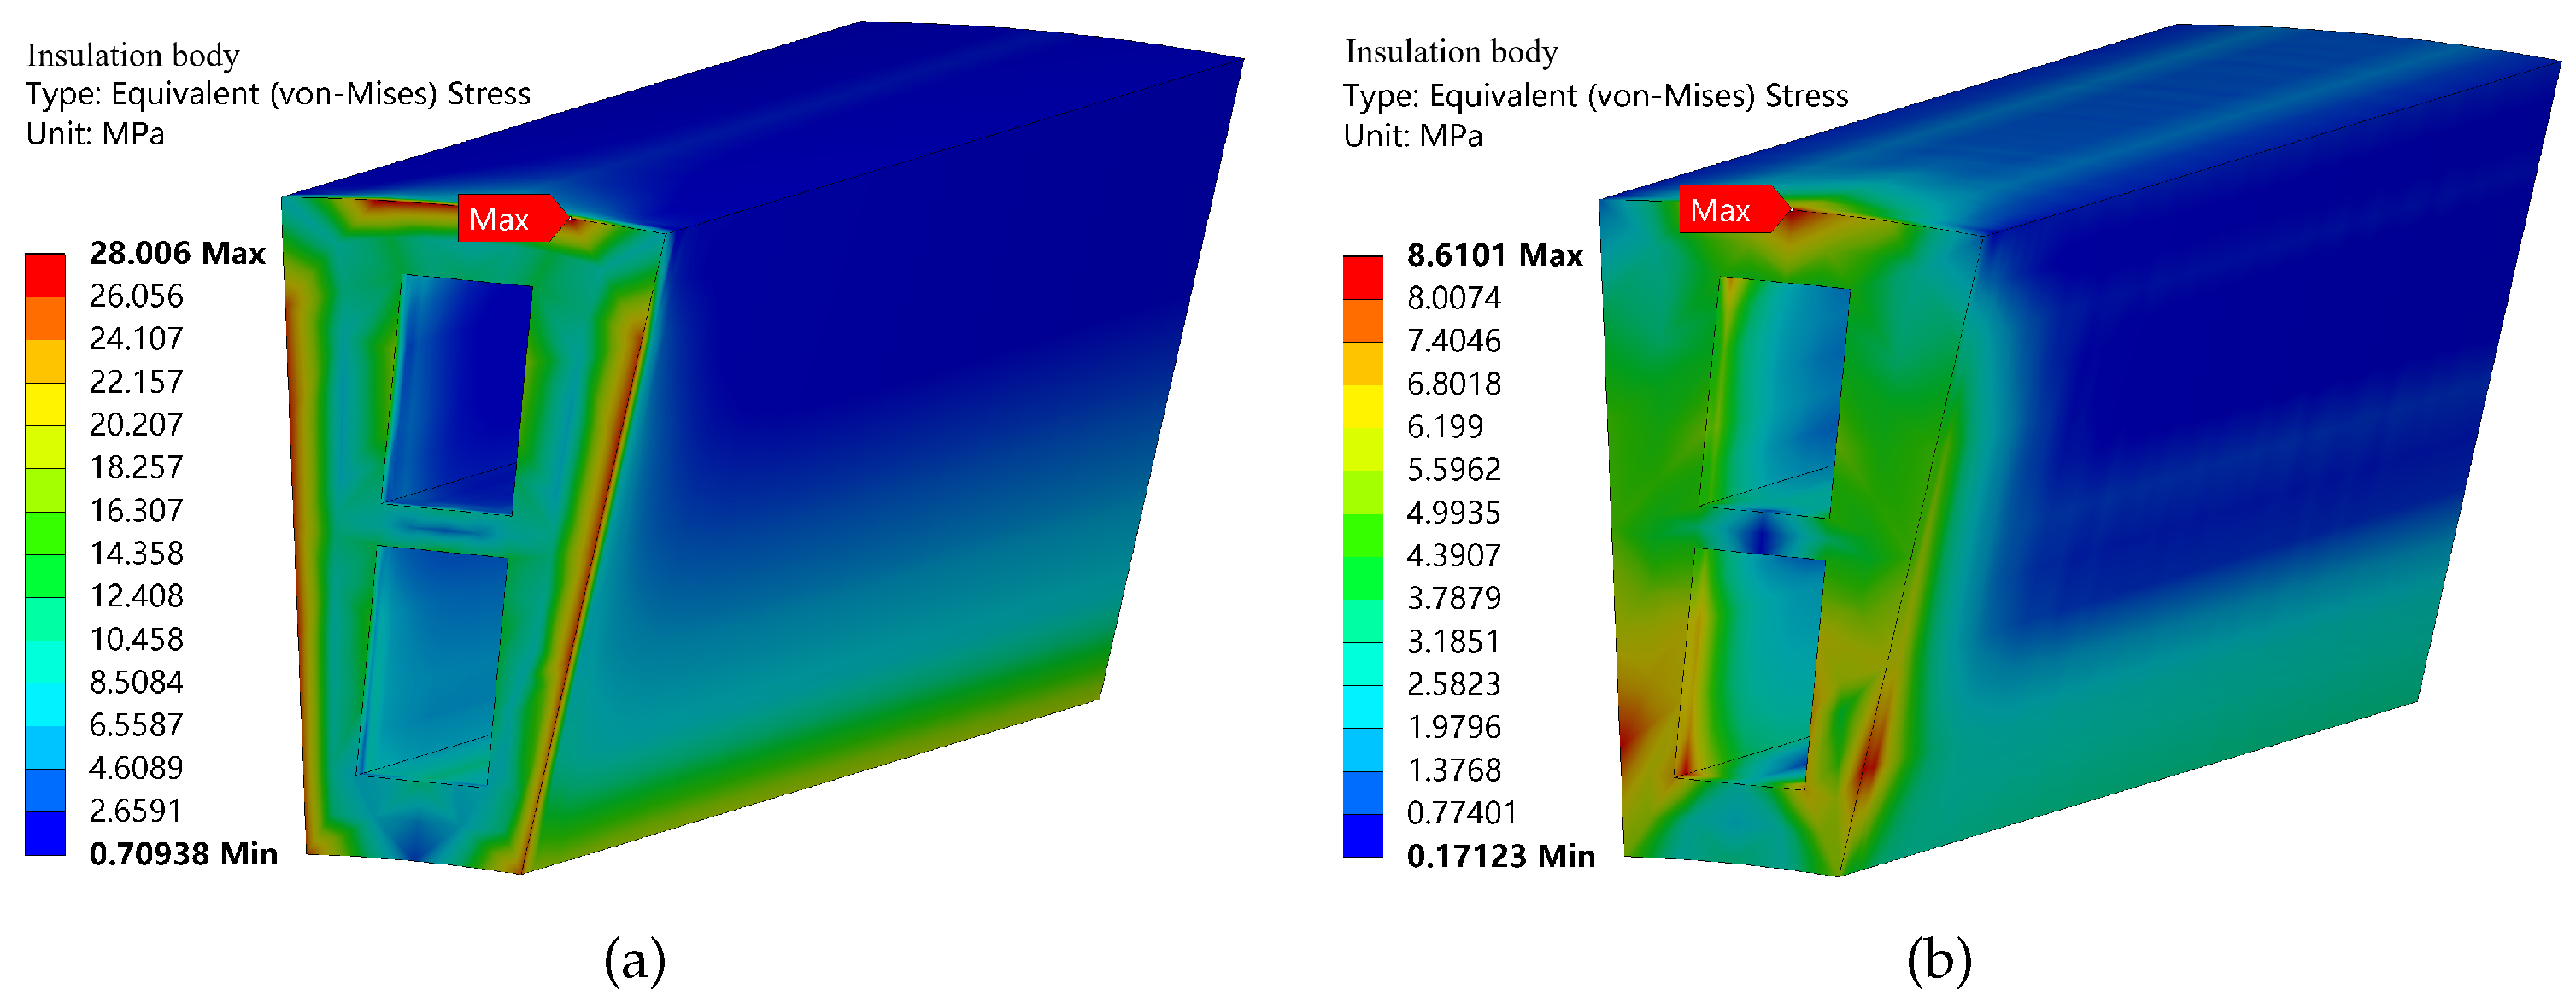
4.1. Thermo-Mechanical Simulation

Before analyzing the TMS of the DSOF motor by means of the analytical model proposed in Section 2, thermal-mechanical simulations are conducted to verify the model accuracy. The relevant material properties are listed in Table 2.
According to previous thermal processing results and the proposed TMS analytical model, the optimal working environment pressure for the DSOF motor is 20 MPa, where the TMS on the stator insulation system is the smallest. Therefore, thermal-mechanical simulations of the motor under normal pressure and 20 MPa are compared for further investigation. Figure 11 presents the simulation results.
It is noted that the TMS at the stator insulation component is decreased when the seawater pressure changes from normal pressure to 20 MPa. For the stator insulation body, the most critical regions, where the maximum TMS is located, are on the top boundaries of the free ends. One is 8.61 MPa under the external pressure of 20 MPa, decreased by 69.25% compared to the other under normal pressure. Additionally, the average TMS in the SIS of the DSOF motor is further researched, and its variations with seawater pressure and temperature rise are illustrated in Figure 12. Obviously, the average TMS can be affected by both temperature rise and environment pressure, and the varying trends are consistent with the analytical model.
Analytical solutions and simulation results of the external pressure variation corresponding to the minimum TMS with DSOF motor temperature rise are illustrated in Figure 13, where the analytical results agree well with the numerical ones and the maximum error rate is 4%, proving the accuracy of the TMS analytical model in this study.
For the targeted DSOF motor, the TMS in the motor SIS influenced by the deep-sea water pressure is then obtained as shown in Figure 14.
As working depth becomes larger, the average TMS in the DSOF motor insulation system will first decrease from 4.2 MPa to 1.7 MPa and then increase, and the stress can be reduced by up to 59.5%. These results indicate that the seawater pressure can ease stator insulation degradation and extend the DSOF motor service life. For further investigating the influence of the deep-sea working environment on the fatigue process of the DSOF motor, the insulation degradation analysis is then carried out.

4.2. Insulation Degradation Analysis

For replicating a typical DSOF motor operating cycle, an actual-use heating rate value of 0.02 °C/s and temperature change range of 5 °C relative to steady-state temperature are adopted [25]. Thus, for transient thermal loads of the targeted motor, the copper heating rate and thermal cycle are set to 0.02 °C/s and 350 s. Figure 15 shows the motor stator cycling temperature distribution results. Accordingly, the TMS spectra of the most dangerous point, where the maximum TMS is located, of the stator insulation are analyzed under normal pressure and 20 MPa, as shown in Figure 16. The stress spectra can be used for motor stator insulation fatigue lifetime prediction.
The mean amplitude and the number of TMS cycles are calculated by a rainflow cycle counter. The results are shown in Figure 17, where (a) represents the TMS results under normal pressure and (b) illustrates the TMS results under 20 MPa pressure. Obviously, there are 10 typical cycles in each case.
By applying the Goodman equation to the rainflow counting results of the TMS spectra, the equivalent zero-mean stress amplitudes are obtained [26]. Then, combining the S-N curve of the insulation material and Miner fatigue theory, the cumulative damage of the dangerous point in the stator insulation is obtained as 6.08 × 10 5 under normal pressure and 5.24 × 10 5 under 20 MPa. It is assumed that when fatigue damage reaches 1, fatigue failure occurs. Thus, the number of cycles to the insulation fatigue failure is 16,436 under normal pressure and 19,069 under 20 MPa. As presented in Figure 16, the cycle time is 0.97 h. By multiplying the number of cycles to failure, the stator insulation lifetimes are 15,943 h and 18,497 h under normal pressure and 20 MPa, respectively. It is noted that compared with motors working in normal conditions, the lifetime of a motor running in a deep-sea environment will increase by 16.02% at most, which indicates that deep-sea high-pressure can slow down the degradation of stator insulation under TMS.

5. Conclusions

This paper has made an effort to analyze the insulation degradation for deep-sea oil-filled (DSOF) motors due to TMS. This was done by first proposing a TMS analytical model of DSOF motor stator insulation, considering the two key factors; namely, deep-sea pressure and motor temperature rise. Then, CFD analysis was performed by investigating the thermal effects on oil viscosity and viscous drag loss to obtain the motor temperature rise. Based on the temperature rise, thermo-mechanical simulations on a DSOF motor were performed to quantify the TMS and verify the proposed TMS analytical model. According to the TMS analysis results, the DSOF motor lifetime was finally evaluated and compared for two different working pressure conditions. The thermo-mechanical simulation results were compared with the analytical solutions obtaining a 4% deviation rate, which demonstrates the accuracy of the proposed TMS analytical model. Results show that the TMS in the DSOF motor insulation system will first decrease then increase as the DSOF motor working depth becomes larger. Compared to the normal pressure working conditions, the TMS on the motor stator insulation can be reduced by 59.5% at most under seawater pressure, and DSOF motor insulation lifetime can be increased by 16.02% at most, which indicates that the seawater pressure can ease stator insulation degradation and extend the DSOF motor service life. This research can provide references for high power density DSOF motor design. In the future, the relevant accelerated aging experiments for a DSOF motor will be carried out to further verify the proposed model. The high power density DSOF motor design will be conducted based on this research.

Author Contributions

Conceptualization and methodology, J.Z.; software and writing—original draft preparation, R.W.; supervision, Y.F.; investigation, Y.L. All authors have read and agreed to the published version of the manuscript.

Funding

This research was funded by the National Natural Science Foundation of China under Grant No. 51977192, the Ningbo Science and Technology Innovation 2025 Major Project (No. 20211ZDYF020218), and the Zhejiang Provincial Ten-Thousand-Talent Plan under Grant No. 2019R52003.

Institutional Review Board Statement

Not applicable.

Informed Consent Statement

Not applicable.

Data Availability Statement

Not applicable.

Conflicts of Interest

The authors declare no conflict of interest.

References

  1. Silwal, B.; Sergeant, P. Thermally induced mechanical stress in the stator windings of electrical machines. Energies 2018, 11, 2113. [Google Scholar] [CrossRef] [Green Version]
  2. Osada, M.; Zhang, G.; Carneiro, F.; Muromachi, M.; Yoshimoto, S.; Yamamoto, A. Effect of insulating liquid viscosity on output force of a high-power synchronous electrostatic motor. Int. J. Mech. Sci. 2022, 220, 107149. [Google Scholar] [CrossRef]
  3. Bell, S.B.; Blair, A.C.; Wagner, L.N.; Zou, V.; Buendia, A.R.; Ashrafzadeh, F. Survey of computational fluid dynamics software for rotational purposes. In Proceedings of the ASME 2019 International Mechanical Engineering Congress and Exposition, Salt Lake City, UT, USA, 11–14 November 2019; Volume 59421, p. V005T07A014. [Google Scholar]
  4. Min, F.; Hai, Y.; Zhaoyang, Y.; Wenliang, W.; Chunxu, M. Coupling calculation of 3d whole domain steady flow and temperature field for underwater oil-filled brushless dc motors. In Proceedings of the 2019 22nd International Conference on Electrical Machines and Systems (ICEMS), Harbin, China, 11–14 August 2019; pp. 1–6. [Google Scholar]
  5. Torres, R.A.; Dai, H.; Jahns, T.M.; Sarlioglu, B.; Lee, W. Cooling design of integrated motor drives using analytical thermal model, finite element analysis, and computational fluid dynamics. In Proceedings of the 2021 IEEE Applied Power Electronics Conference and Exposition (APEC), Phoenix, AZ, USA, 14–17 June 2021; p. 1509. [Google Scholar]
  6. Czerny, B.; Khatibi, G.; Liedtke, M.; Nicolics, J. Thermomechanical reliability investigation of insulated gate bipolar transistor module. In Proceedings of the 2018 41st International Spring Seminar on Electronics Technology (ISSE), Zlatibor, Serbia, 16–20 May 2018. [Google Scholar]
  7. Chen, Y.; Li, B.; Wang, X.; Yan, Y.; Wang, Y.; Qi, F. Investigation of heat transfer and thermal stresses of novel thermal management system integrated with vapour chamber for igbt power module. Therm. Sci. Eng. Prog. 2019, 10, 73–81. [Google Scholar] [CrossRef]
  8. Shao, S.; Niu, Y.; Wang, J.; Liu, R.; Park, S.; Lee, H.; Yip, L.; Refai-Ahmed, G. Design guideline on board-level thermomechanical reliability of 2.5 d package. Microelectron. Reliab. 2020, 111, 113701. [Google Scholar] [CrossRef]
  9. Reddy, V.V.; Ume, I.C.; Williamson, J.; Sitaraman, S.K. Evaluation of the quality of bga solder balls in fcbga packages subjected to thermal cycling reliability test using laser ultrasonic inspection technique. IEEE Trans. Compon. Packag. Manuf. Technol. 2021, 11, 589–597. [Google Scholar] [CrossRef]
  10. Panduranga, R.; Shivakumar, K. Mode-ii total fatigue life model for unidirectional im7/8552 carbon/epoxy composite laminate. Int. J. Fatigue 2017, 94, 97–109. [Google Scholar] [CrossRef]
  11. Lekakh, S.N.; Buchely, M.; O’Malley, R.; Godlewski, L.; Li, M. Thermo-cycling fatigue of simo ductile iron using a modified thermo-mechanical test. Int. J. Fatigue 2021, 148, 106218. [Google Scholar] [CrossRef]
  12. IEEE Std 56–2016; IEEE Guide for Insulation Maintenance of Electric Machines-Redline. IEEE: New York, NY, USA, 2016; pp. 1–233.
  13. Huang, Z.; Reinap, A.; Alaküla, M. Degradation and fatigue of epoxy impregnated traction motors due to thermal and thermal induced mechanical stress-part i: Thermal mechanical simulation of single wire due to evenly distributed temperature. In Proceedings of the 8th International Conference on Power Electronics, Machines and Drives PEMD, Glasgow, UK, 19–21 April 2016. [Google Scholar]
  14. Silwal, B.; Mohamed, A.H.; Nonneman, J.; Paepe, M.D.; Sergeant, P. Assessment of different cooling techniques for reduced mechanical stress in the windings of electrical machines. Energies 2019, 12, 1967. [Google Scholar] [CrossRef] [Green Version]
  15. Yeo, W.; Purbolaksono, J.; Aliabadi, M.; Ramesh, S.; Liew, H. Exact solution for stresses/displacements in a multilayered hollow cylinder under thermo-mechanical loading. Int. J. Press. Vessel. Pip. 2017, 151, 45–53. [Google Scholar] [CrossRef]
  16. Evci, C.; Gülgeç, M. Functionally graded hollow cylinder under pressure and thermal loading: Effect of material parameters on stress and temperature distributions. Int. J. Eng. Sci. 2018, 123, 92–108. [Google Scholar] [CrossRef]
  17. Salifu, S.; Desai, D.; Kok, S.; Ogunbiyi, O. Thermo-mechanical stress simulation of unconstrained region of straight x20 steam pipe. Procedia Manuf. 2019, 35, 1330–1336. [Google Scholar] [CrossRef]
  18. Li, J. Loss and Temperautre Field Analysis for Deep-Sea Brushless dc Motor. Ph.D. Thesis, Harbin Institute of Technology, Harbin, China, 2011. [Google Scholar]
  19. Asami, F.; Miyatake, M.; Yoshimoto, S.; Tanaka, E.; Yamauchi, T. A method of reducing windage power loss of a high-speed motor using a viscous vacuum pump. Precis. Eng. 2017, 48, 60–66. [Google Scholar] [CrossRef]
  20. Kelkar, M.S.; Maginn, E.J. Effect of temperature and water content on the shear viscosity of the ionic liquid 1-ethyl-3-methylimidazolium bis (trifluoromethanesulfonyl) imide as studied by atomistic simulations. J. Phys. Chem. B 2007, 111, 4867–4876. [Google Scholar] [CrossRef] [PubMed]
  21. Miller, R.; Griffiths, P.; Hussain, Z.; Garrett, S.J. On the stability of a heated rotating-disk boundary layer in a temperature-dependent viscosity fluid. Phys. Fluids 2020, 32, 024105. [Google Scholar] [CrossRef]
  22. Chen, W.; Fan, C. Non-newtonian fluid machanics. Chin. J. Nat. 1985, 8, 243–247. [Google Scholar]
  23. Ramos, E.A.; Treviño, C.; Lizardi, J.J.; Méndez, F. Non-isothermal effects in the slippage condition and absolute viscosity for an electroosmotic flow. Eur. J. Mech.-B/Fluids 2022, 93, 29–41. [Google Scholar] [CrossRef]
  24. Kacem, R.; Alzamel, N.; Ouerfelli, N. Sensitivity of viscosity arrhenius parameters to polarity of liquids. Russ. J. Phys. Chem. A 2017, 91, 1654–1659. [Google Scholar] [CrossRef]
  25. Huang, Z.; Reinap, A.; Alaküla, M. Degradation and fatigue of epoxy impregnated traction motors due to thermal and thermal induced mechanical stress-part ii: Thermal mechanical simulation of multiple wires due to evenly and unevenly distributed temperature. In Proceedings of the 8th International Conference on Power Electronics, Machines and Drives PEMD, Glasgow, UK, 19–21 April 2016. [Google Scholar]
  26. Griffo, A.; Tsyokhla, I.; Wang, J. Lifetime of machines undergoing thermal cycling stress. In Proceedings of the 2019 IEEE Energy Conversion Congress and Exposition (ECCE), Baltimore, MD, USA, 29 September–3 October 2019; pp. 3831–3836. [Google Scholar]
Figure 1. Flow chart of DSOF motor fatigue lifetime prediction.
Energies 15 03963 g001
Figure 2. Cross-section of simplified DSOF motor stator model subjected to both internal and external pressures.
Energies 15 03963 g002
Figure 3. Average TMS of different slot shape factor variations with deep-sea pressure.
Energies 15 03963 g003
Figure 4. Slope-modified coefficient versus slot shape factor.
Energies 15 03963 g004
Figure 5. Average TMS of different copper fill factor variations with deep-sea pressure.
Energies 15 03963 g005
Figure 6. Slope-modified coefficient versus copper fill factor.
Energies 15 03963 g006
Figure 7. 3D CFD model of the DSOF motor.
Energies 15 03963 g007
Figure 8. Meshing results of the DSOF motor.
Energies 15 03963 g008
Figure 9. DSOF motor temperature distribution.
Energies 15 03963 g009
Figure 10. DSOF motor cross-section temperature field contour.
Energies 15 03963 g010
Figure 11. TMS in the DSOF motor stator insulation under seawater pressure. (a) Normal pressure. (b) Deep-sea pressure 20 MPa.
Energies 15 03963 g011
Figure 12. Average TMS in the SIS of the DSOF motor variation with seawater pressure and temperature rise.
Energies 15 03963 g012
Figure 13. Comparison of analytical solution and numerical results of external pressure at the minimum TMS.
Energies 15 03963 g013
Figure 14. TMS in the SIS of the DSOF motor variation with seawater pressure based on the thermal results.
Energies 15 03963 g014
Figure 15. Motor stator temperature.
Energies 15 03963 g015
Figure 16. TMS spectra of stator insulation under normal pressure and 20 MPa.
Energies 15 03963 g016
Figure 17. Results from rainflow cycle counter of the maximum TMS of stator insulation. (a) Normal pressure. (b) Deep-sea pressure 20 MPa.
Energies 15 03963 g017
Table 1. Thermal analysis with and without viscous loss and viscosity UDFs.
ComponentTemperature (K)
MinimumMaximumAverage
No UDFsWith UDFsNo UDFsWith UDFsNo UDFsWith UDFs
Windings331.7325.1332.7326.1332.2325.6
Rotor332.1325.2333.8326.4333.0325.8
Magnets333.9326.5335.2327.6334.7327.2
Shaft327.2321.2331.9325.0330.8324.1
Stator326.0320.3331.2324.6328.3322.2
Table 2. Relevant material properties of the motor stator.
PropertiesElectrical SheetPolymer CoatingEpoxy Impregnation
Young’s modulus (MPa)2 × 10 5 7.4 × 10 3 3.5 × 10 3
Poisson’s ratio0.290.420.34
Coefficient of thermal expansion (1/K)1.2 × 10 5 1.6 × 10 5 5 × 10 5
Thermal conductivity (W/m·K)280.20.21
Heat capacity (J/kg·K)4401090400
Density (kg/ m 3 )765015301180
Publisher’s Note: MDPI stays neutral with regard to jurisdictional claims in published maps and institutional affiliations.

