1. Introduction
There is a general trend in the European Union and Poland to quit traditional heating methods derived from non-renewable energy sources like coal or peat to renewable sources. There is an increasing global trend in the use of renewable energy sources—solar, wind, geothermal energy.
1.1. Energy Market in Poland and the European Union
The amount of electricity produced from renewable sources increased from 835,623 GWh in 2013 to 968,798 GWh, of which 345,502 GWh came from hydropower, 320,519 GWh from wind energy and 110,115 GWh from photovoltaics [
1].
In Poland, as shown in
Table 1, the highest increase in the number of renewable energy installations can be observed in the case of photovoltaic panels. In 2011, the amount of energy produced by photovoltaic installations was 0.2 GWh, and, in 2020, it would amount to almost 2000 GWh. The energy produced by photovoltaic installations constitutes a small part of the total renewable energy in Poland; however, the increase in energy produced by them in recent years has been significant. This is mostly due to the installation of domestic photovoltaic panel systems, the price of which has fallen significantly in recent years. Domestic photovoltaic installations produce energy locally and can be used for the household’s internal energy consumption. One method of using renewable energy for heating purposes is to use heat pumps powered by electricity that is produced locally by photovoltaic panels or wind turbines. In the European Union countries in 2013–2019, 15 M heat pumps were added, including 14.6 M air pumps and 0.44 M geothermal pumps [
2]. The type of heat pump used depends mainly on the climate and local thermal conditions; in Italy—the country with the largest number of operating heat pumps—mostly air source heat pumps are used (2019—19.6 M air heat pumps, 0.014 M ground heat pumps), in Poland where we are dealing with a moderate climate, i.e., winters with temperatures below zero and relatively warm summers, both types of heat pumps are used equally (2019—0.112 M air pumps, 0.060 M ground pumps) [
3]. Heating and cooling of households accounts for approximately 52% of total energy consumption in the European Union [
4]. One of the reasons for the upward trend in the number of installed and used heat pumps—in addition to rising energy prices—is the EU goal of reducing greenhouse gas emissions, and one way to reduce emissions is to minimize the consumption of non-renewable energy for building heating.
When using heat pumps as the basic source of heating for households, it is necessary to determine the operating parameters which are strongly dependent on the parameters of the heat source—the outside air for air-source heat pumps and the ground temperature for ground-source heat pumps, and in particular on the efficiency expressed by the COP (Coefficient of Performance) [
5,
6,
7], i.e., the ratio of the generated heat to the energy consumed by the heat pump. This is a very important issue from an operational point of view. This paper describes a numerical simulation of heat pump efficiency and compares the simulated results with measured data from an existing SOPSAR installation. The SOPSAR system—as described later on in the article—is the Solar Assisted Heat Pump and Storage system, designed to minimise usage of the grid energy for building heating purposes. The SOPSAR system is a product of the Czamara company. The Energy Department of the Cracow University of Technology and the Elfran company assisted in the development of the system. The COP model of the heat pump was verified using measurement data of the SOPSAR system provided by Czamara for the purposes of the RESHeat project.
1.2. Modern Energy-Efficient Construction Challenges
Modern technology represents an opportunity in the fight against climate changes. The use of increasingly advanced Renewable Energy solutions for energy saving makes it possible to achieve the goal of a low primary energy ratio. Technological progress gives also a chance to abandon the high values of heat transfer coefficients which generate high costs in relation to the potential profits from energy savings. The role of architecture should not be reduced to providing specific heat transfer coefficients that limit the freedom of design of building facades. It should become a conscious set of energy-active solutions. These solutions affect the form, functional layout and construction of the building [
8]. These include striving for a compact building form, using appropriate roof slope inclination to harness solar energy on façades and roofs, or ventilating the house by using the stack effect. To reduce the use of additional systems with cooling and ventilation systems in residential buildings, external shading elements controlled by intelligent systems can be used, as glazing is not only a source of heat loss, but also a source of heat gain and the availability of daylight. Green walls and roofs can be introduced to purify the air, lower the ambient temperature and reduce noise levels. The choice of solutions depends on climate conditions, the site topography, the size and function of the development and the available land (especially for underground thermal energy storage units). Architectural decisions that accompany technological ones should be appropriate for the given case.
1.3. nZEB Building Concept
nZEBs (nearly zero-energy buildings) were introduced in the EU directive in 2010 and means: “a building that has a very high energy performance, …” The nearly zero or very low amount of energy required should be covered to a very significant extent by energy from renewable sources, including energy from renewable sources produced on-site or nearby”. The application of the nZEB model became mandatory for new public buildings from 31 December 2018, and for all buildings (including residential), it became mandatory at the end of 2020 [
9].
1.4. Primary Enery Usage Reduction in nZEB Buildings
One of the methods to reduce primary energy consumption in nearly zero-energy buildings (nZEB) is the use of energy-efficient equipment and renewable energy. Fadejev et al. [
10] described in their paper the performance of a solar-assisted ground source heat pump with thermal storage. A similar solution is used in the SOPSAR system, where solar energy from PV-T panels is used to regenerate the ground and to increase its temperature. The use of a solar heat pump in the system presented by Fadejev resulted in a 15% higher energy efficiency compared to district heating.
Gondal [
11] compares different methods of energy harvesting in nZEB buildings. One method was the use of photovoltaic panels to power systems. Using photovoltaic panels to directly power the heat pump reduced the use of grid energy by 87%. The SOPSAR system utilizes sun-tracking photovoltaic panels which are powering the heat pump and the excess energy is fed back into the external grid. The aim of this system is to reduce the use of electricity from the electric grid to almost zero.
Li et al. [
12] describes a public building where the nZEB model was applied. To achieve low energy consumption in the building, two GSHPs and an absorption chiller were used. The first heat pump worked under an average COP of 3.9 in winter and 3.0 in summer. The second heat pump worked under an average COP of about 5.4 in summer and 5.0 in winter. The heat pump in the SOPSAR system worked under an average COP of 3.4 and the whole system including photovoltaic panels and heat accumulators worked under an average COP of up to 6.
Zhou et al. [
13] describe a GSHP installed in a public building. This is one of the most popular methods in China for using renewable energy in public buildings. The COP achieved by the heat pump in this building ranged from 3 to 2.6 in the coldest months. In addition to heating, the system was used for domestic hot water which requires the heat pump to operate at a high temperature of the heat sink. The COP achieved by the heat pump in the SOPSAR system is in a similar range of 2.4 to 4. Zhou describes the effect of the ground temperature and its decrease with prolonged operation of the heat pump and its effect on the COP of the system. The author used TRNSYS software to model the heat demand and the ground temperature trend. To regenerate the ground, the heat pump was integrated into the cooling system of the building during the summer period and the energy was returned to the ground probes. Chu et al. [
14] described a system used to provide heating for a public building. This system—similar to SOPSAR—was characterised by a constant heat sink temperature and a constant water flow. During tests carried out over four days, the heat pump was operated continuously. The COP dropped from a value of 3.02 on day one to 2.71 on day four. A similar drop in COP was observed in the SOPSAR system; however, there the heat pump was run periodically depending on the heating demand, allowing the soil around the ground probes to regenerate.
1.5. COP Optimisation Methods
Pieper et al. [
15] compared existing COP simulation techniques and proposed a COP estimation method designed for a two-stage heat pump using ammonia as a refrigerant that meets the following assumptions:
Suitable for modelling a two-stage heat pump;
Simplicity in the application of linear modelling;
High accuracy considering heat source temperature, heat sink temperature and heat pump load;
Applicable to both heat pumps and chillers.
The RESHeat simulation method must meet similar objectives to the solutions described in the article above. The simulation model must provide sufficient accuracy with varying heat source and heat sink temperatures and must be refrigerant dependant; however, the solution must be able to simulate a single stage heat pump using various HFC refrigerants.
Girard et al. [
16] described solar thermal collectors as a method for achieving higher performance of ground source heat pump by increasing source temperature and by thus increasing COP of the heat pump. The energy model developed in this article allowed for simulating working performance of SGSHP (solar assisted ground source heat pump) in different climate conditions. A development of the simulation presented in this paper will simulate the entire RESHeat system consisting of a heat pump with ground storage tanks supported by PV-T panels and solar collectors.
Chen [
17] tries to find optimal parameters of SGSHP allowing for achieving maximum COP for a given system. The article considers an optimal operating temperature of a solar collector to be investigated to maximize COP. Other factors considered are: optimal operating temperatures of the working fluid in the heat exchangers, optimal relations of the heat exchanger areas and optimal design of heat exchangers. The concepts presented in this paper will be used to determine the optimum operating parameters of the RESHeat system i.e., source temperature, which is directly impacted by the amount of heat generated in the PV-T panels and solar panels and the size of the heat storage tanks used in the system.
The articles presented above have covered different simulation methods and parameters affecting the COP of a heat pump. The method presented in this paper attempts to combine the advantages of these methods, i.e., it allows the simulation of the COP for varying operating parameters, different refrigerants and produces a simple calculation algorithm—a linear equation that will be used in the further simulation of the whole RESHeat system where the heat pump is one of the keys but not the only component of the system.
2. Materials and Methods
A heat pump is an inverse heat engine implementing a counter clockwise thermodynamic Linde cycle, which can be defined as a device that transfers heat from a low temperature source to a high temperature sink. Air source heat pumps, which are most common, extract heat from the outside air and transfers it to a circulating liquid or heats the domestic hot water.
2.1. Heat Pump Thermodynamics
To transfer energy from the lower temperature source to a higher temperature sink while maintaining the second law of thermodynamics, the refrigerant needs to undergo several phase transitions in a closed-loop cycle [
18].
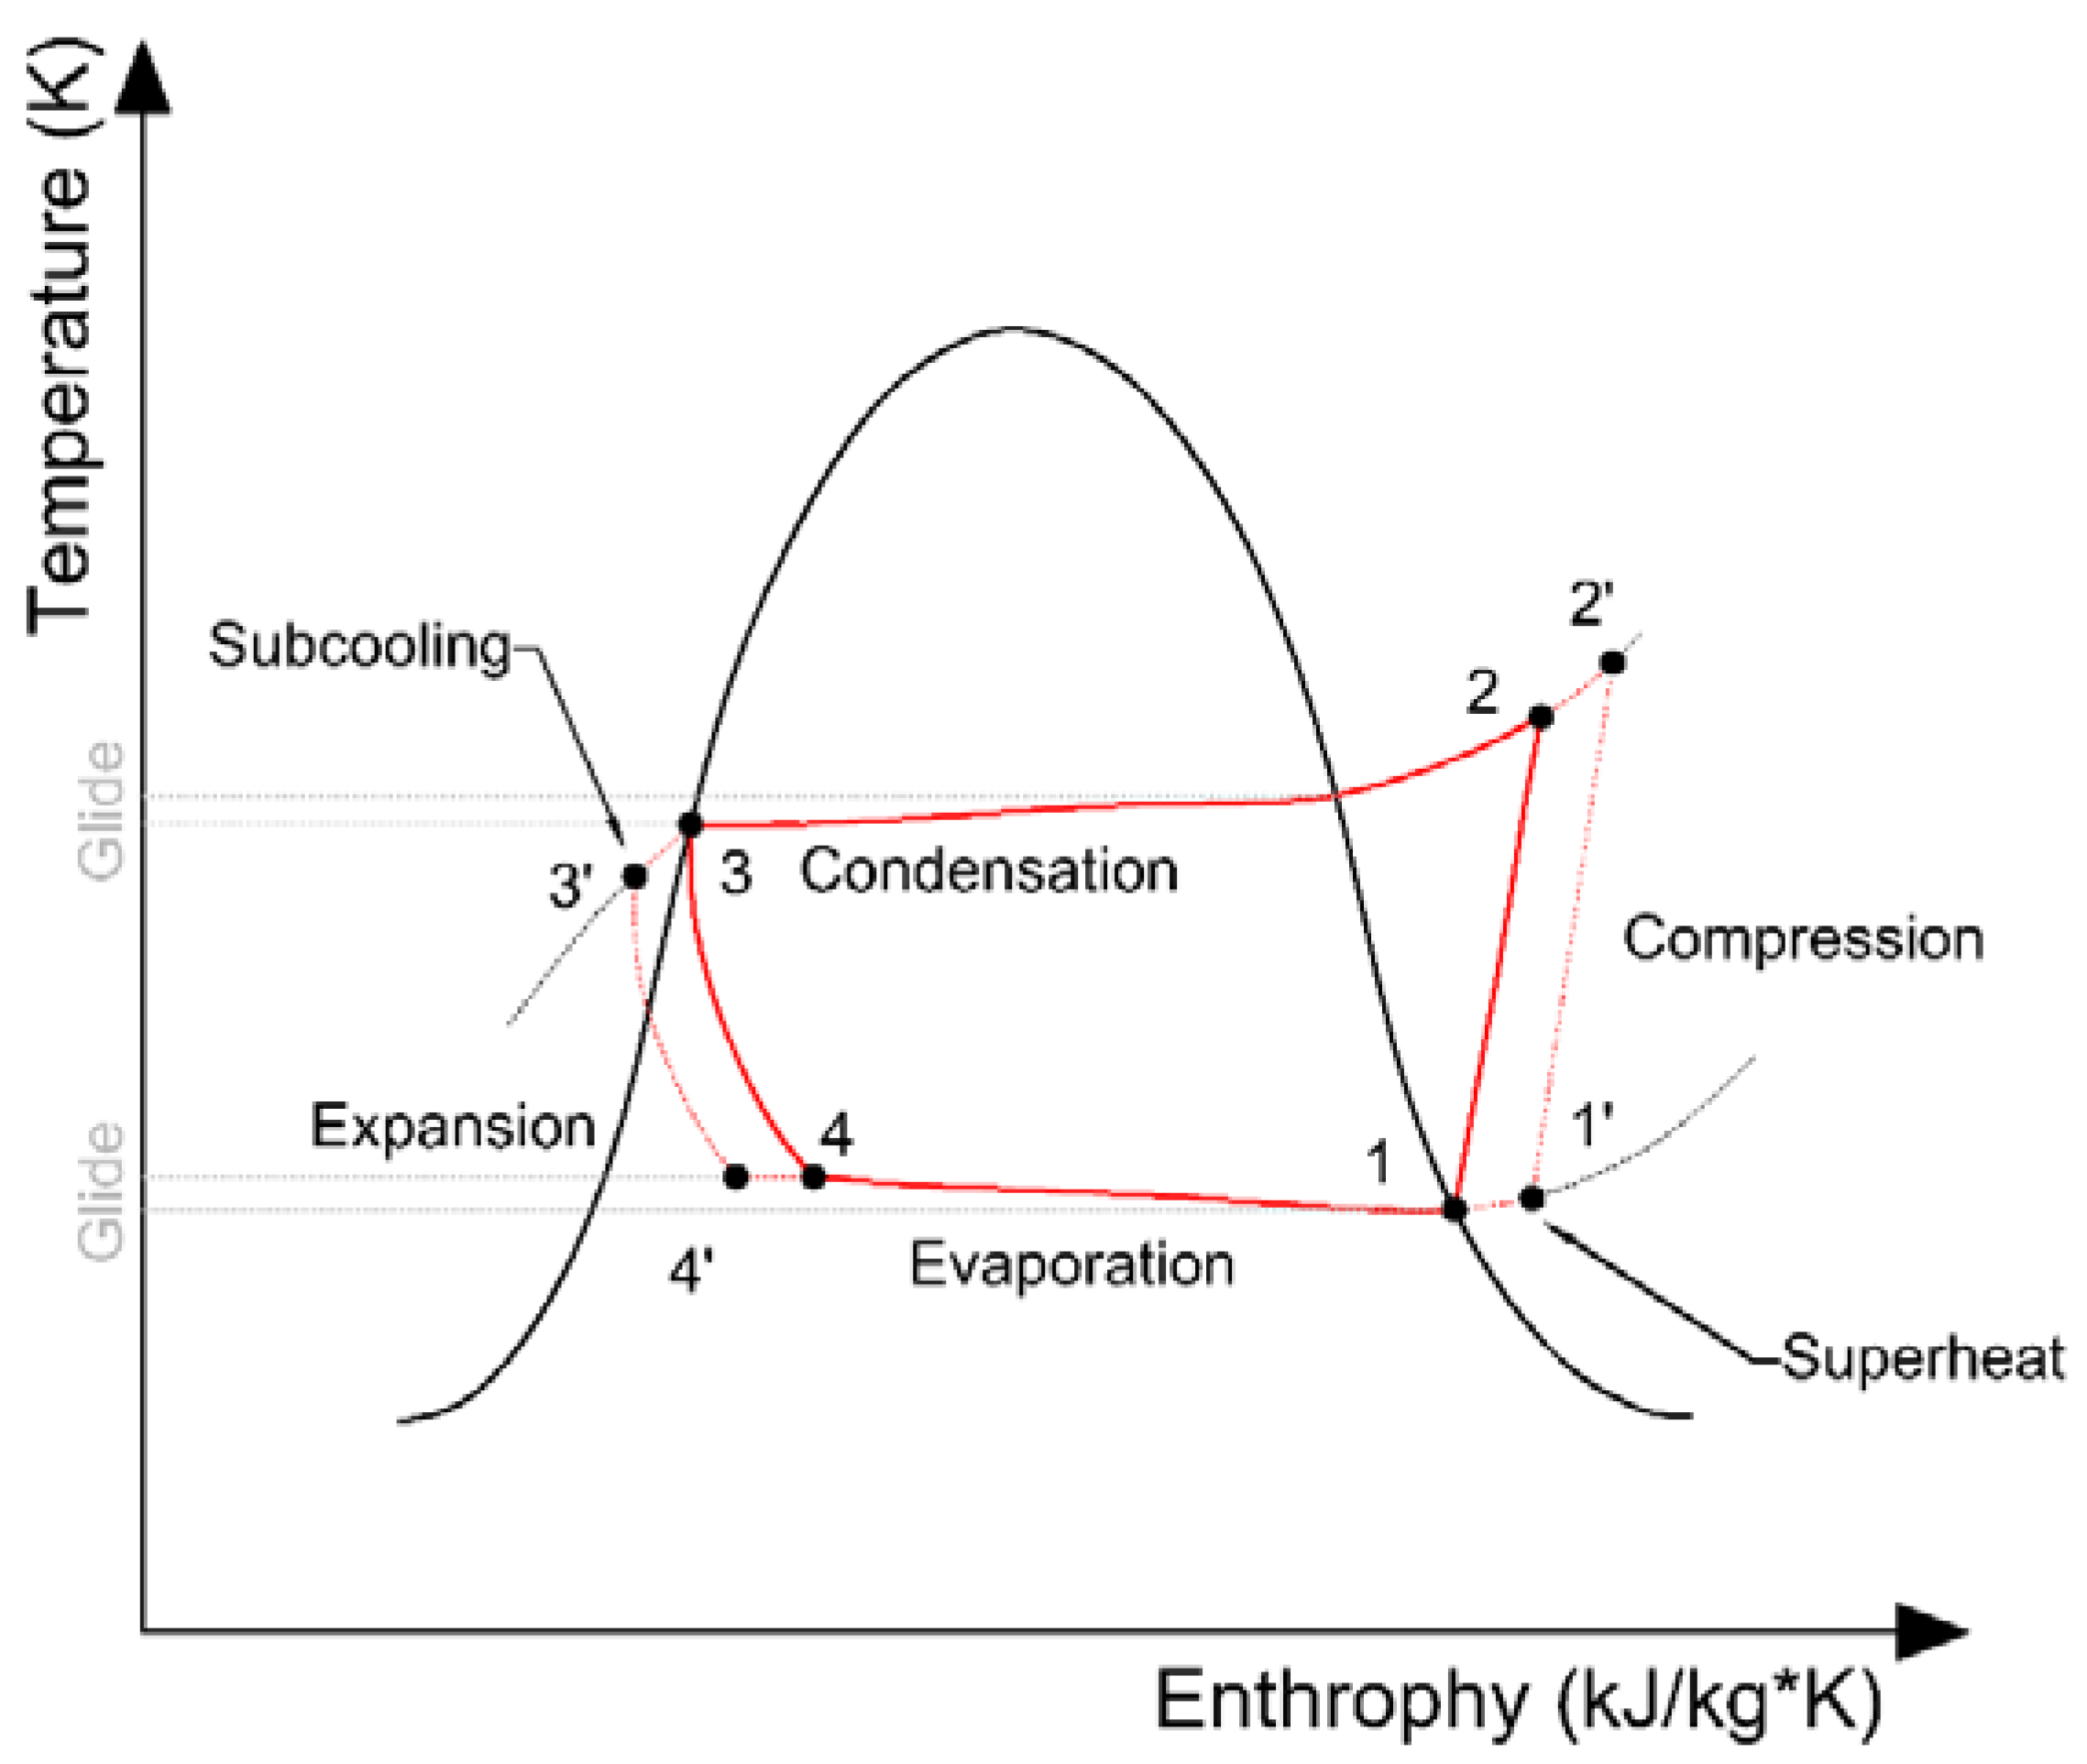
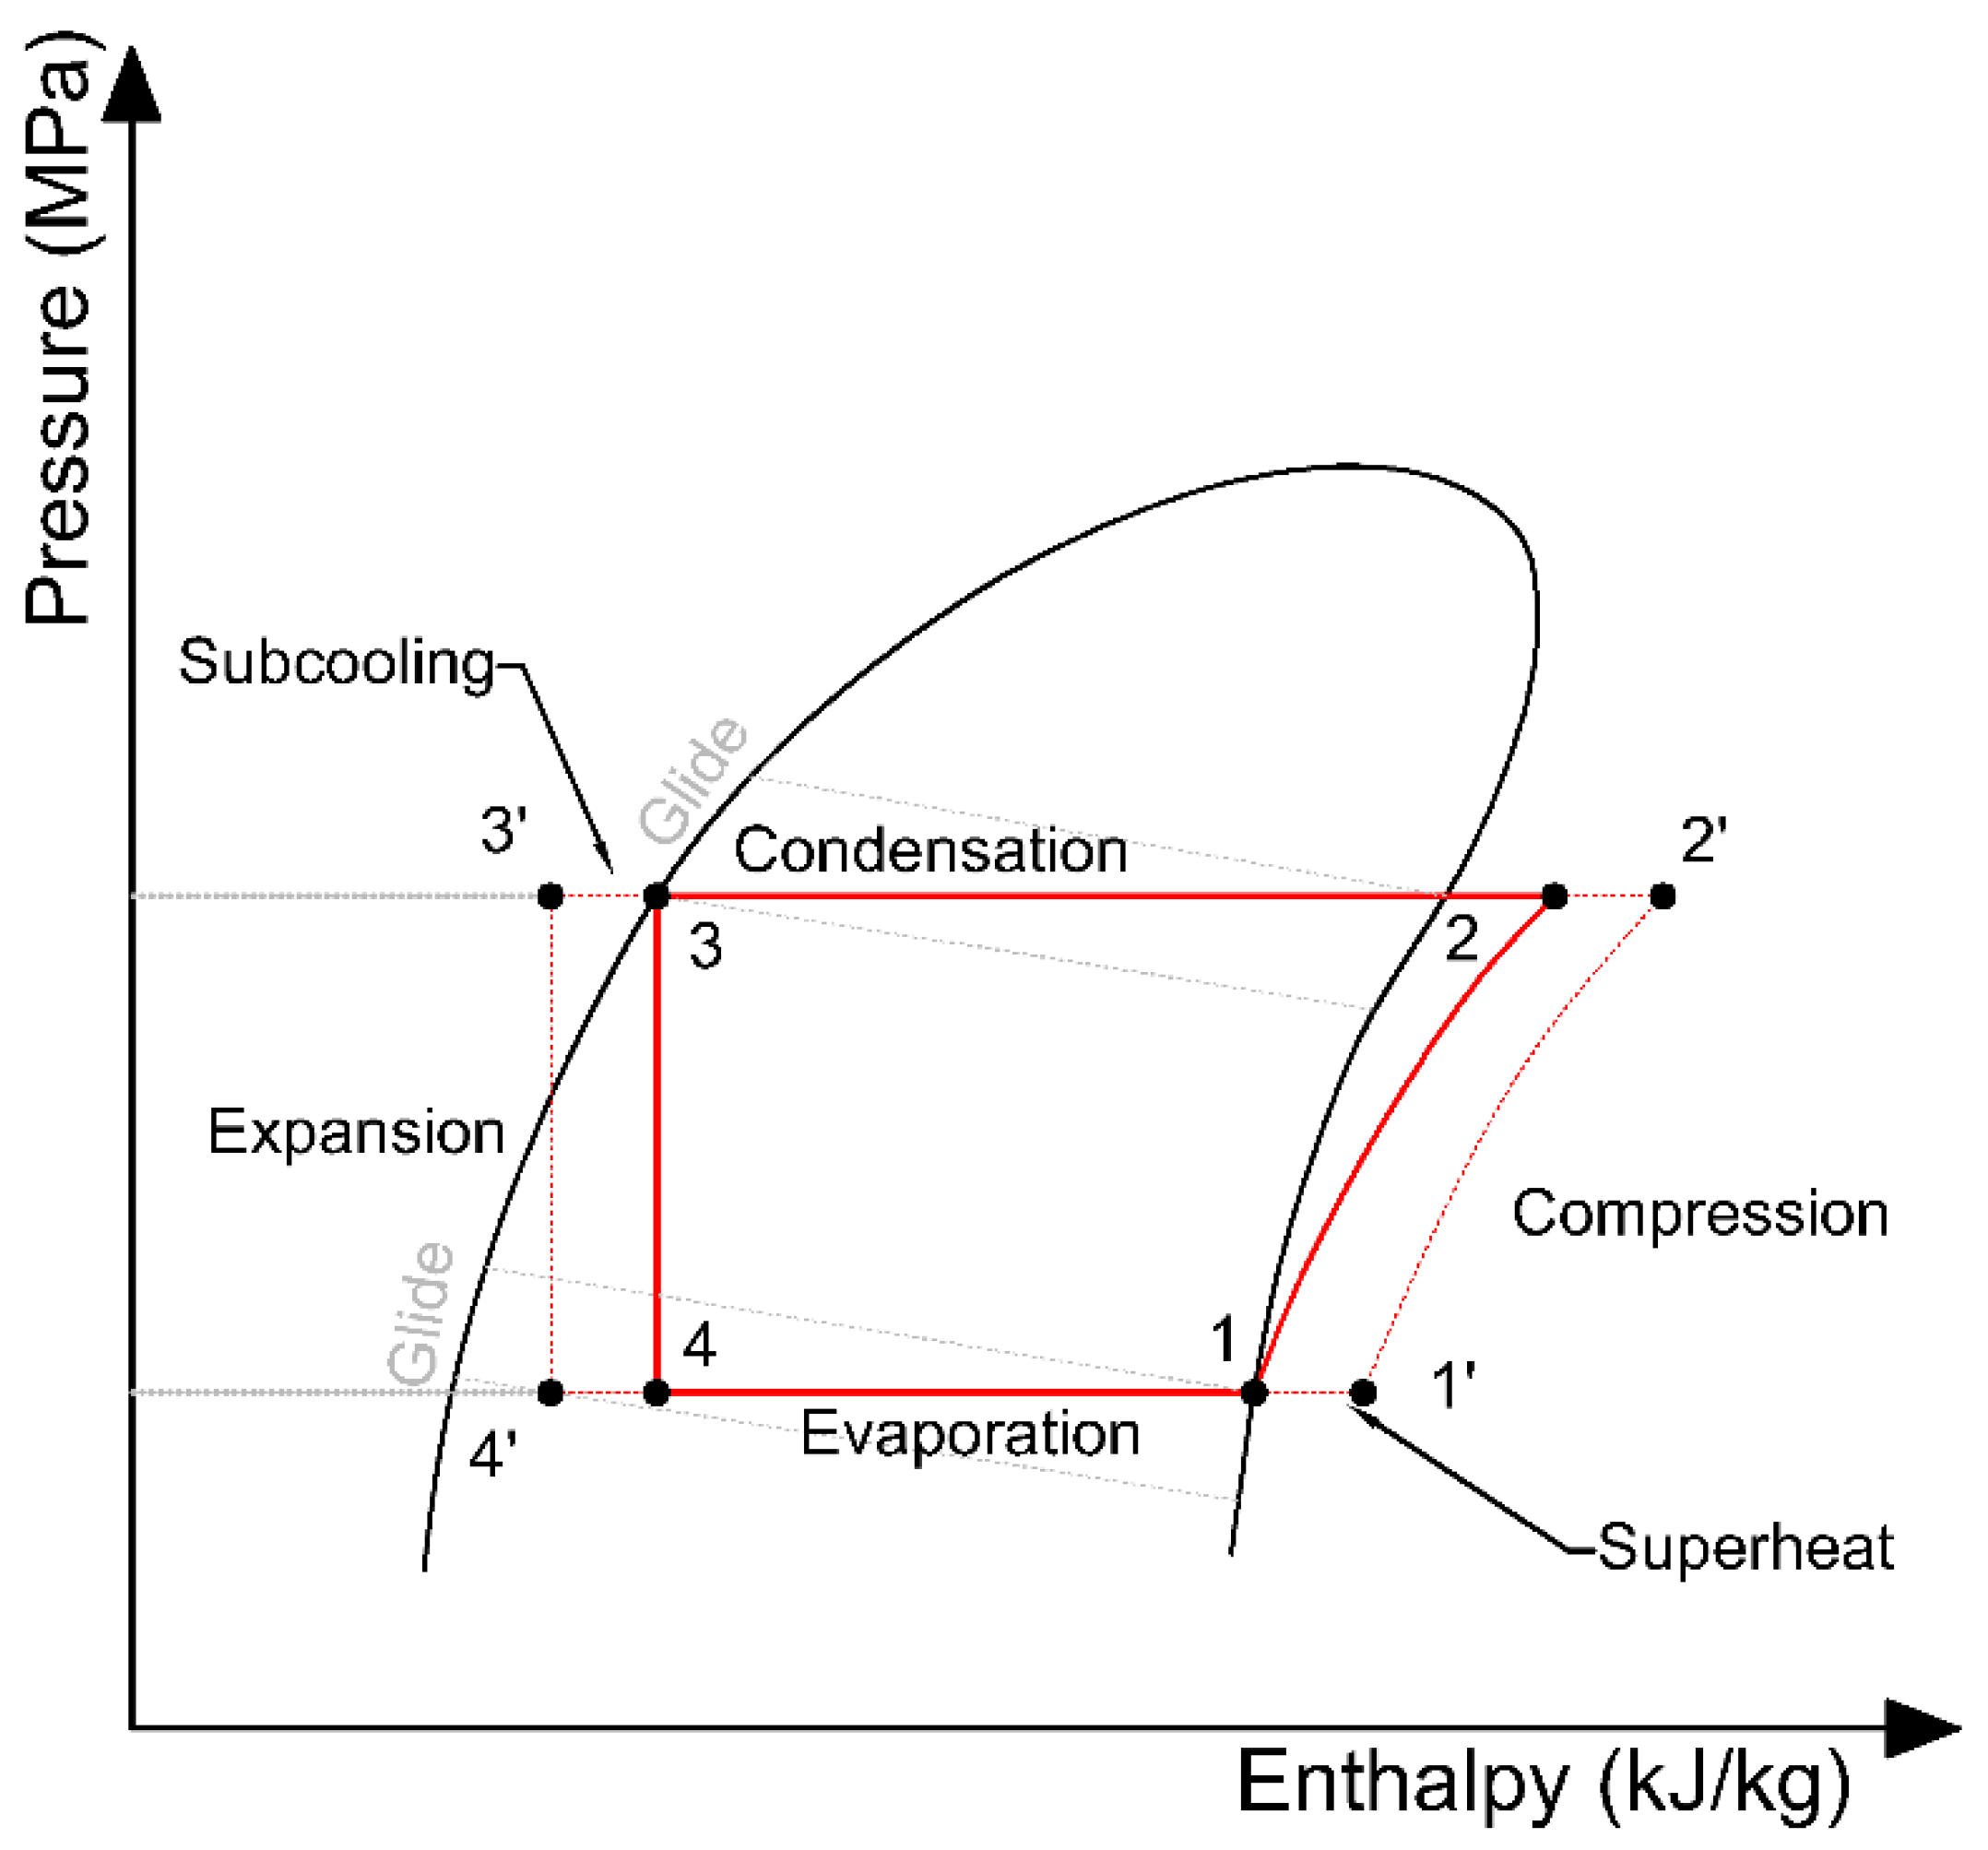
In a typical single-stage heat pump as shown in
Figure 1 and
Figure 2, there are four major thermodynamic transformations:
Compression (1–2);
Condensation (2–3);
Expansion (3–4);
Evaporation (4–1).
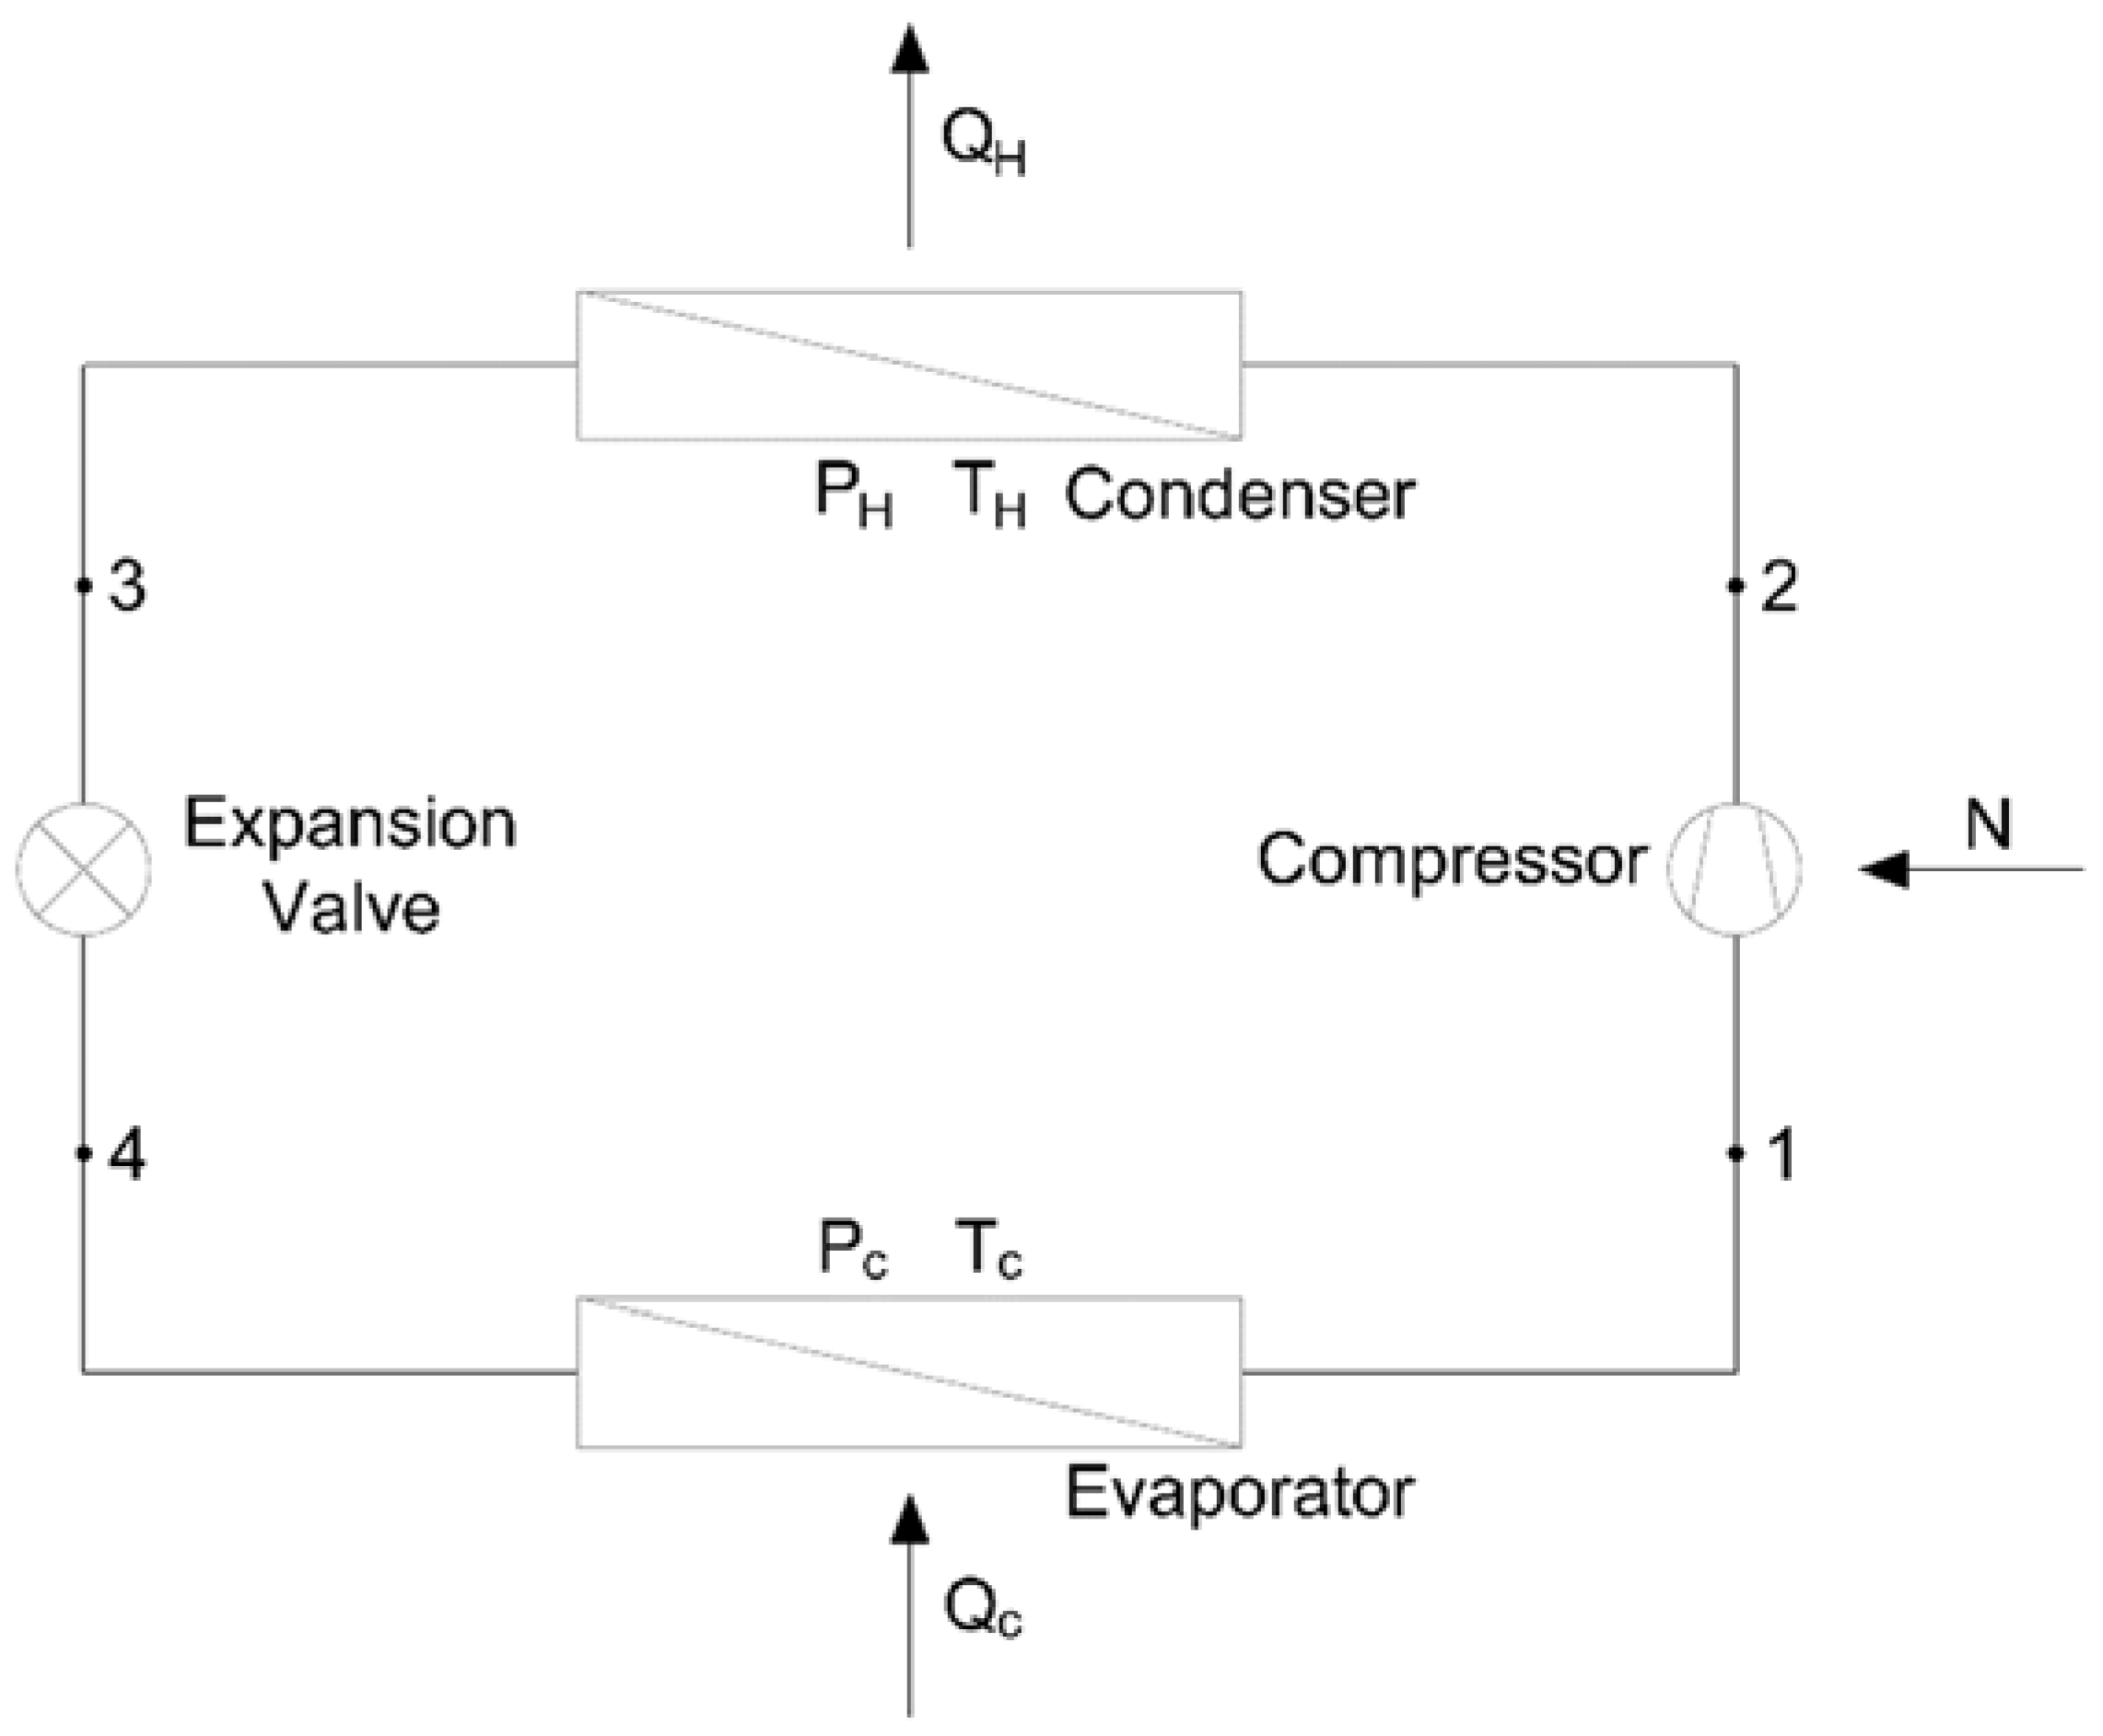
Thermodynamic properties of refrigerant need to be determined in all of the governing points above to determine the energy performance of the heat pump. Below, a simple implementation of the refrigeration system with the characteristic points listed above is shown.
Figure 3 shows the elements of the system including energy balance inputs and outputs (Q
H, Q
C, N).
2.2. COP
COP is the quotient between the energy supplied (N) in the compressor, and the energy given off in the condenser (QH). The main parameter allowing optimisation of the heat pump efficiency is the temperature of the heat source, by increasing it, it is possible to increase the COP indicator of the heat pump and reduce the electricity consumption.
2.3. Carnot COP Coefficient
The counter-clockwise Carnot cycle is a theoretical representation of the most efficient refrigerant cycle operating between the two temperatures. It establishes the highest possible COP for the given temperatures. The COP for the Carnot cycle can be calculated as follows [
18]:
2.4. Lorenz COP Coefficient
Based on the Second Law of Thermodynamics, it is known that the COP for a reversible heat pump operating between two finite energy sources can be defined as the COP of the Lorenz cycle [
6]:
As seen in Equation (2), the COP of the Lorenz cycle is determined by the logarithmic mean of the heat sink divided by the logarithmic mean difference of the heat sink and heat source, hereinafter referred as T
Lift = T
H − T
C. Assuming that the heat sink and heat source have constant heat capacity, the logarithmic mean temperatures were calculated as seen in Equation (3) [
20]:
The COP of the Lorenz cycle calculated using the logarithmic averages of the heat source and heat sink determine the maximum COP achievable for a heat pump operating between these reservoirs. The efficiency of the Lorenz circuit can be defined as the coefficient between the actual COP of the heat pump and the COP of the Lorenz circuit, as seen in Equation (4) [
20]:
The average Lorenz cycle efficiency for a SOPSAR installation was determined as 0.4.
2.5. COP Based on Thermodynamic Properties Obtained in Python’s CoolProp
In order to determine the COP coefficient, the thermodynamic parameters of the refrigeration medium were defined at the characteristic points of the counter-clockwise Linde cycle [
21]. All governing points are shown in
Figure 1. In the above thermodynamic system, the individual COPs components can be defined as [
22]:
By using the CoolProp package and determining the thermodynamic parameters of the characteristic points of the cycle, the parameters of the H
2 point can be calculated with sufficient accuracy using the following equation [
22]:
where D
2 is a point located on saturation point (x = 1) of condensation temperature. The COP for the system can be defined as:
In order to determine the thermodynamic values at characteristic points, the CoolProp library in the Python programming environment was used, which allows the following parameters of governing points to be determined:
H—enthalpy (kJ/kg)
S—entropy (kJ/kg·K)
P—pressure (Pa)
T—temperature (K)
The CoolProp calculation package allows you to determine one of the above-mentioned values by giving a pair of any other two defining parameters.
2.6. SOPSAR System
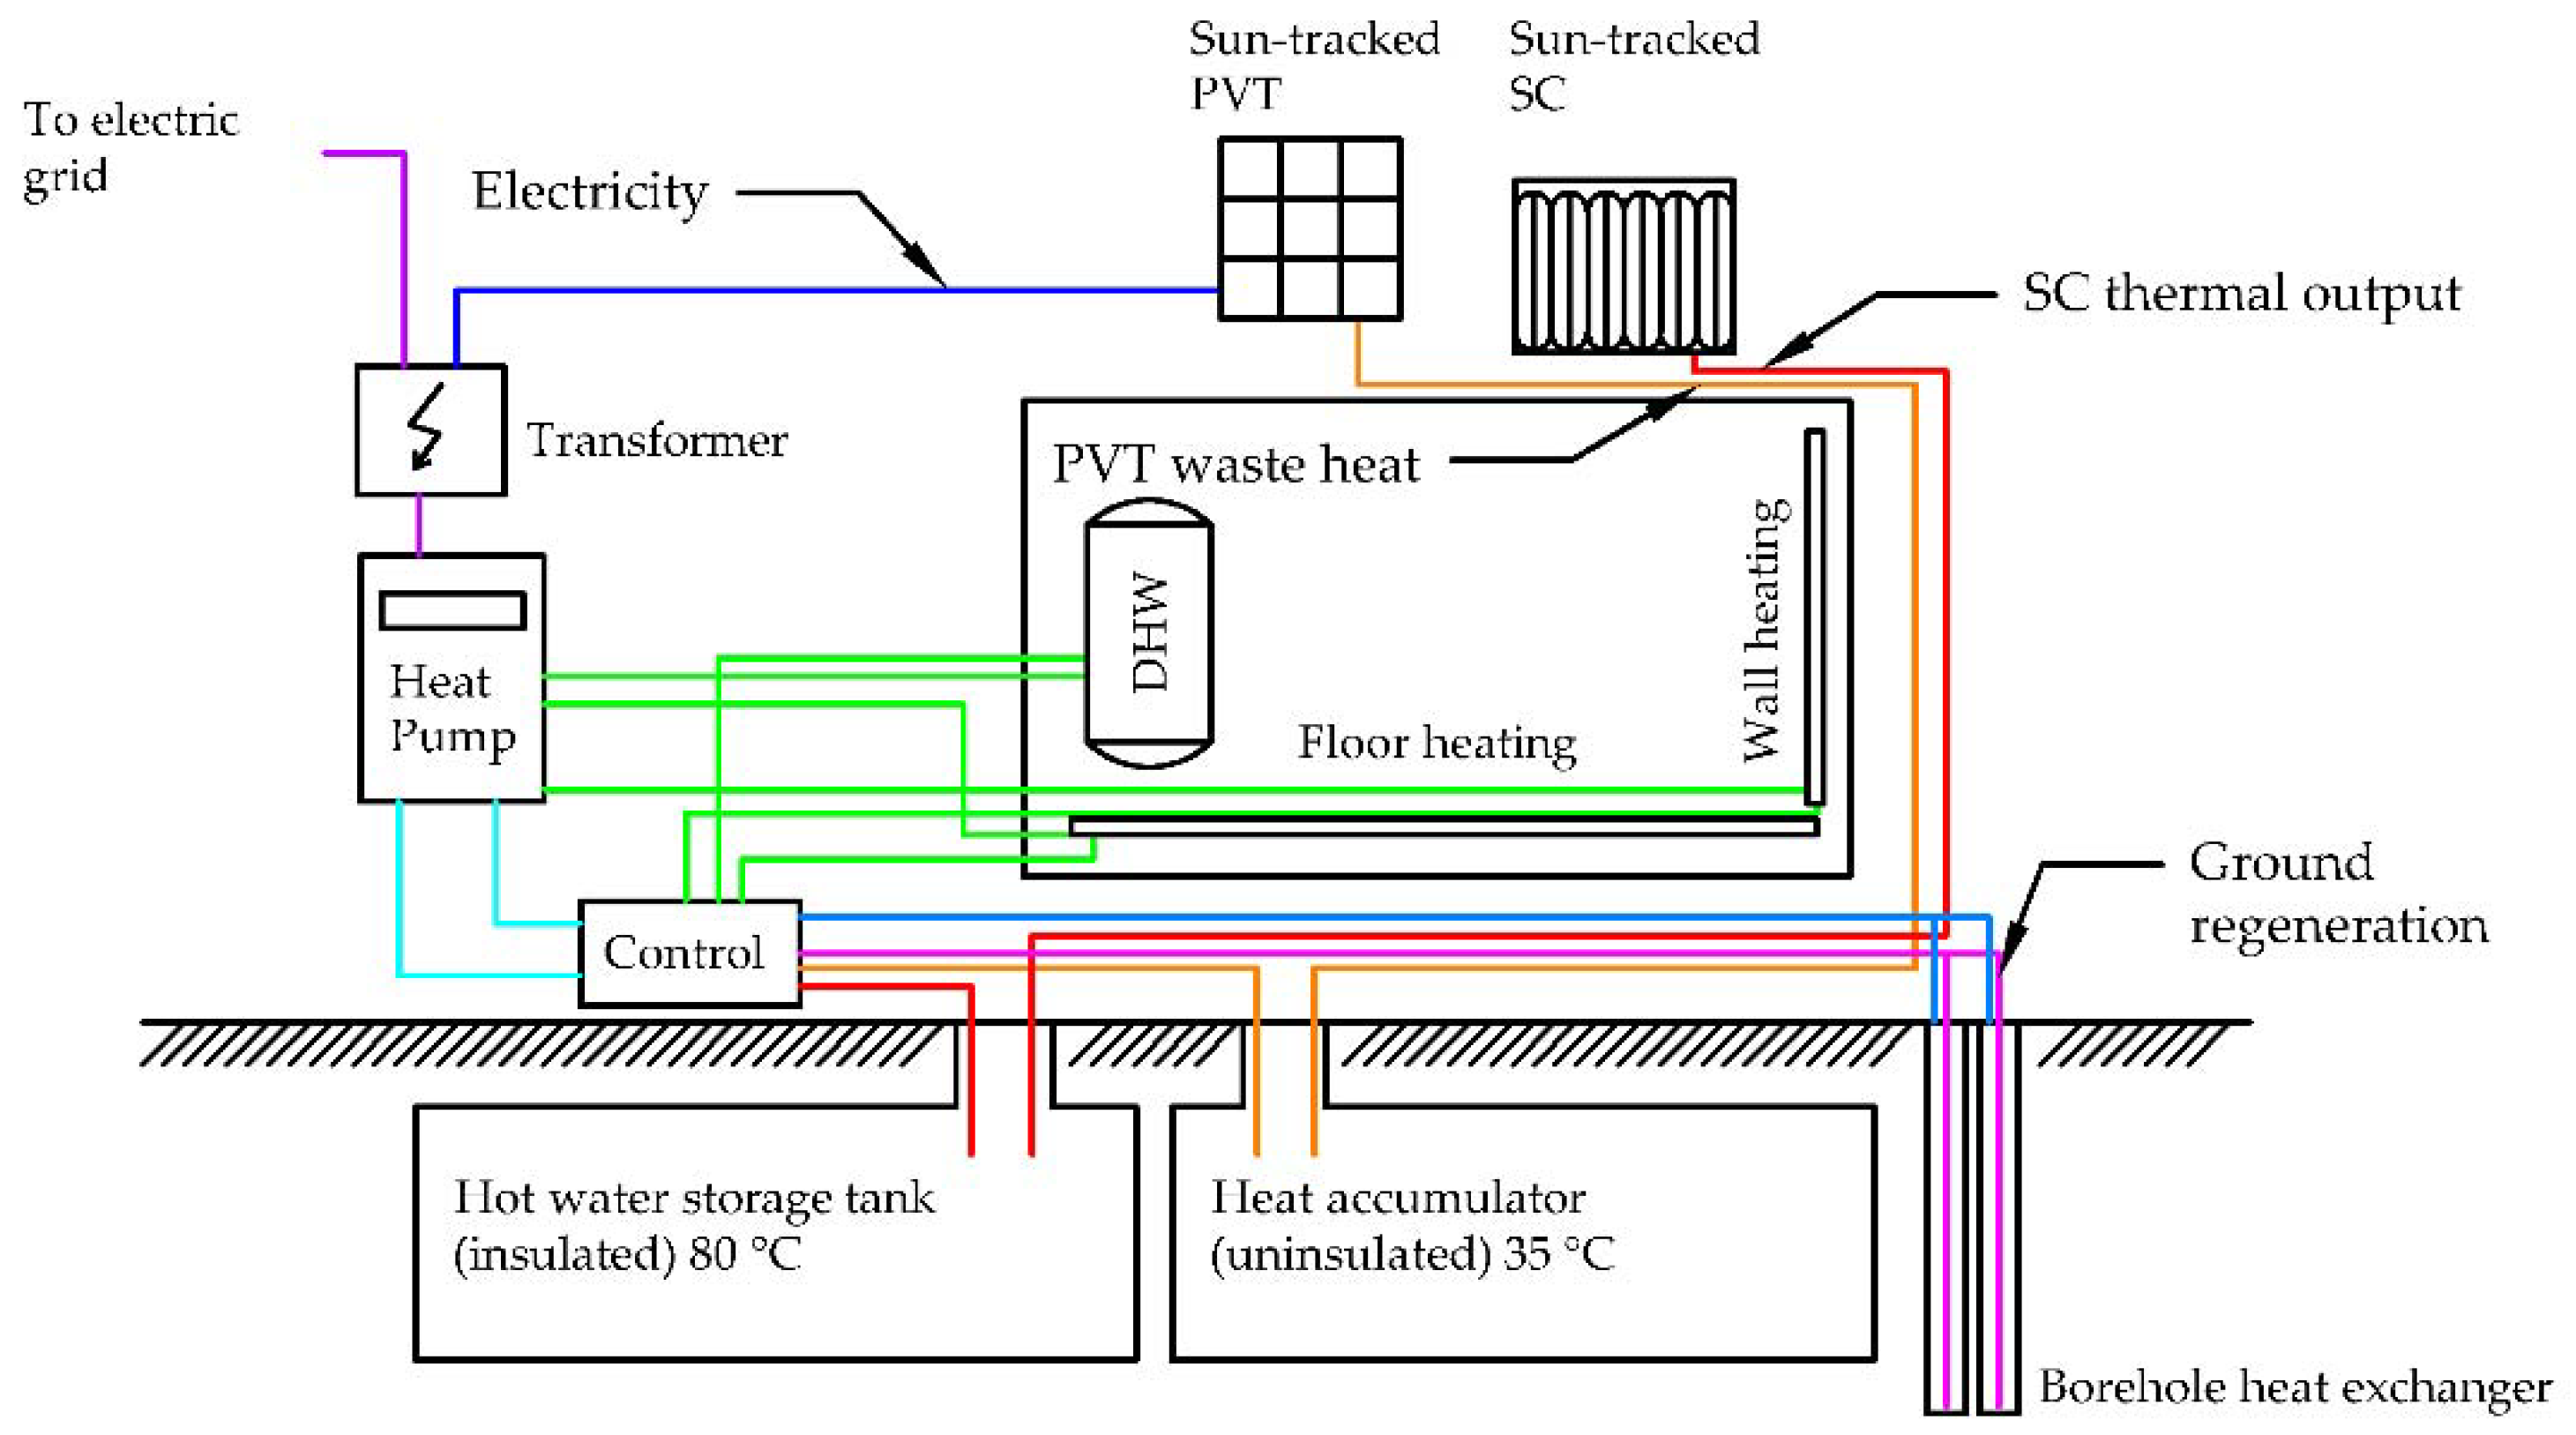
Due to changes in legislation forcing an increase in the share of renewable energy for residential heating, a system using PV-T cells, vacuum collectors, coupled to a water-to-water heat pump was developed. The system was realised by the Czamara company with a help of Energy Department of Cracow University of Technology and Elfran under the SOPSAR project (financed by the National Centre for Research and Development—‘Fast Track’ programme for small and medium enterprises). The RESHeat system is a development of the SOPSAR system which aims to commercialise it. The proposed RESHeat system enables combined cooling, heat and power (CCHP) generation, including seasonal energy storage in the ground. Waste heat from PV-T panels and heat from solar collectors equipped with sun-tracking are stored in underground tanks.
The
Figure 4 shows a schematic of the RESHeat system consisting of a heat pump, energy generation systems—photovoltaic panels, solar panels and borehole heat exchangers, as well as energy storage systems such as ground heat accumulating tanks.
The RESHeat system aims to:
Use solar heat as the primary energy source;
Produce heat and electricity using photovoltaic (PV-T) panels;
Seasonal energy storage in the ground;
Supply heat and cold to a building through a heat pump;
Supply electricity to a building through a PV panel system;
Use of waste heat from intelligent solar collectors or PV-T panels for regeneration of the ground;
Maintain the heat pump’s high COP for subsequent heating seasons by using regeneration of the ground.
The commercialised RESHeat system should consist of similar equipment as shown above, included in the SOPSAR system. The numerical method described in the previous paragraph was developed for RESHeat project as part of a whole system numerical approach. The main focus of this model was to determine the impact of heat source improvement for COP performance.
3. Results
The simulation parameters are shown in the
Table 2. Some of the parameters were determined based on measurements from the SOPSAR system; others were determined based on typical heat pump operating parameters.
The parameters shown in the
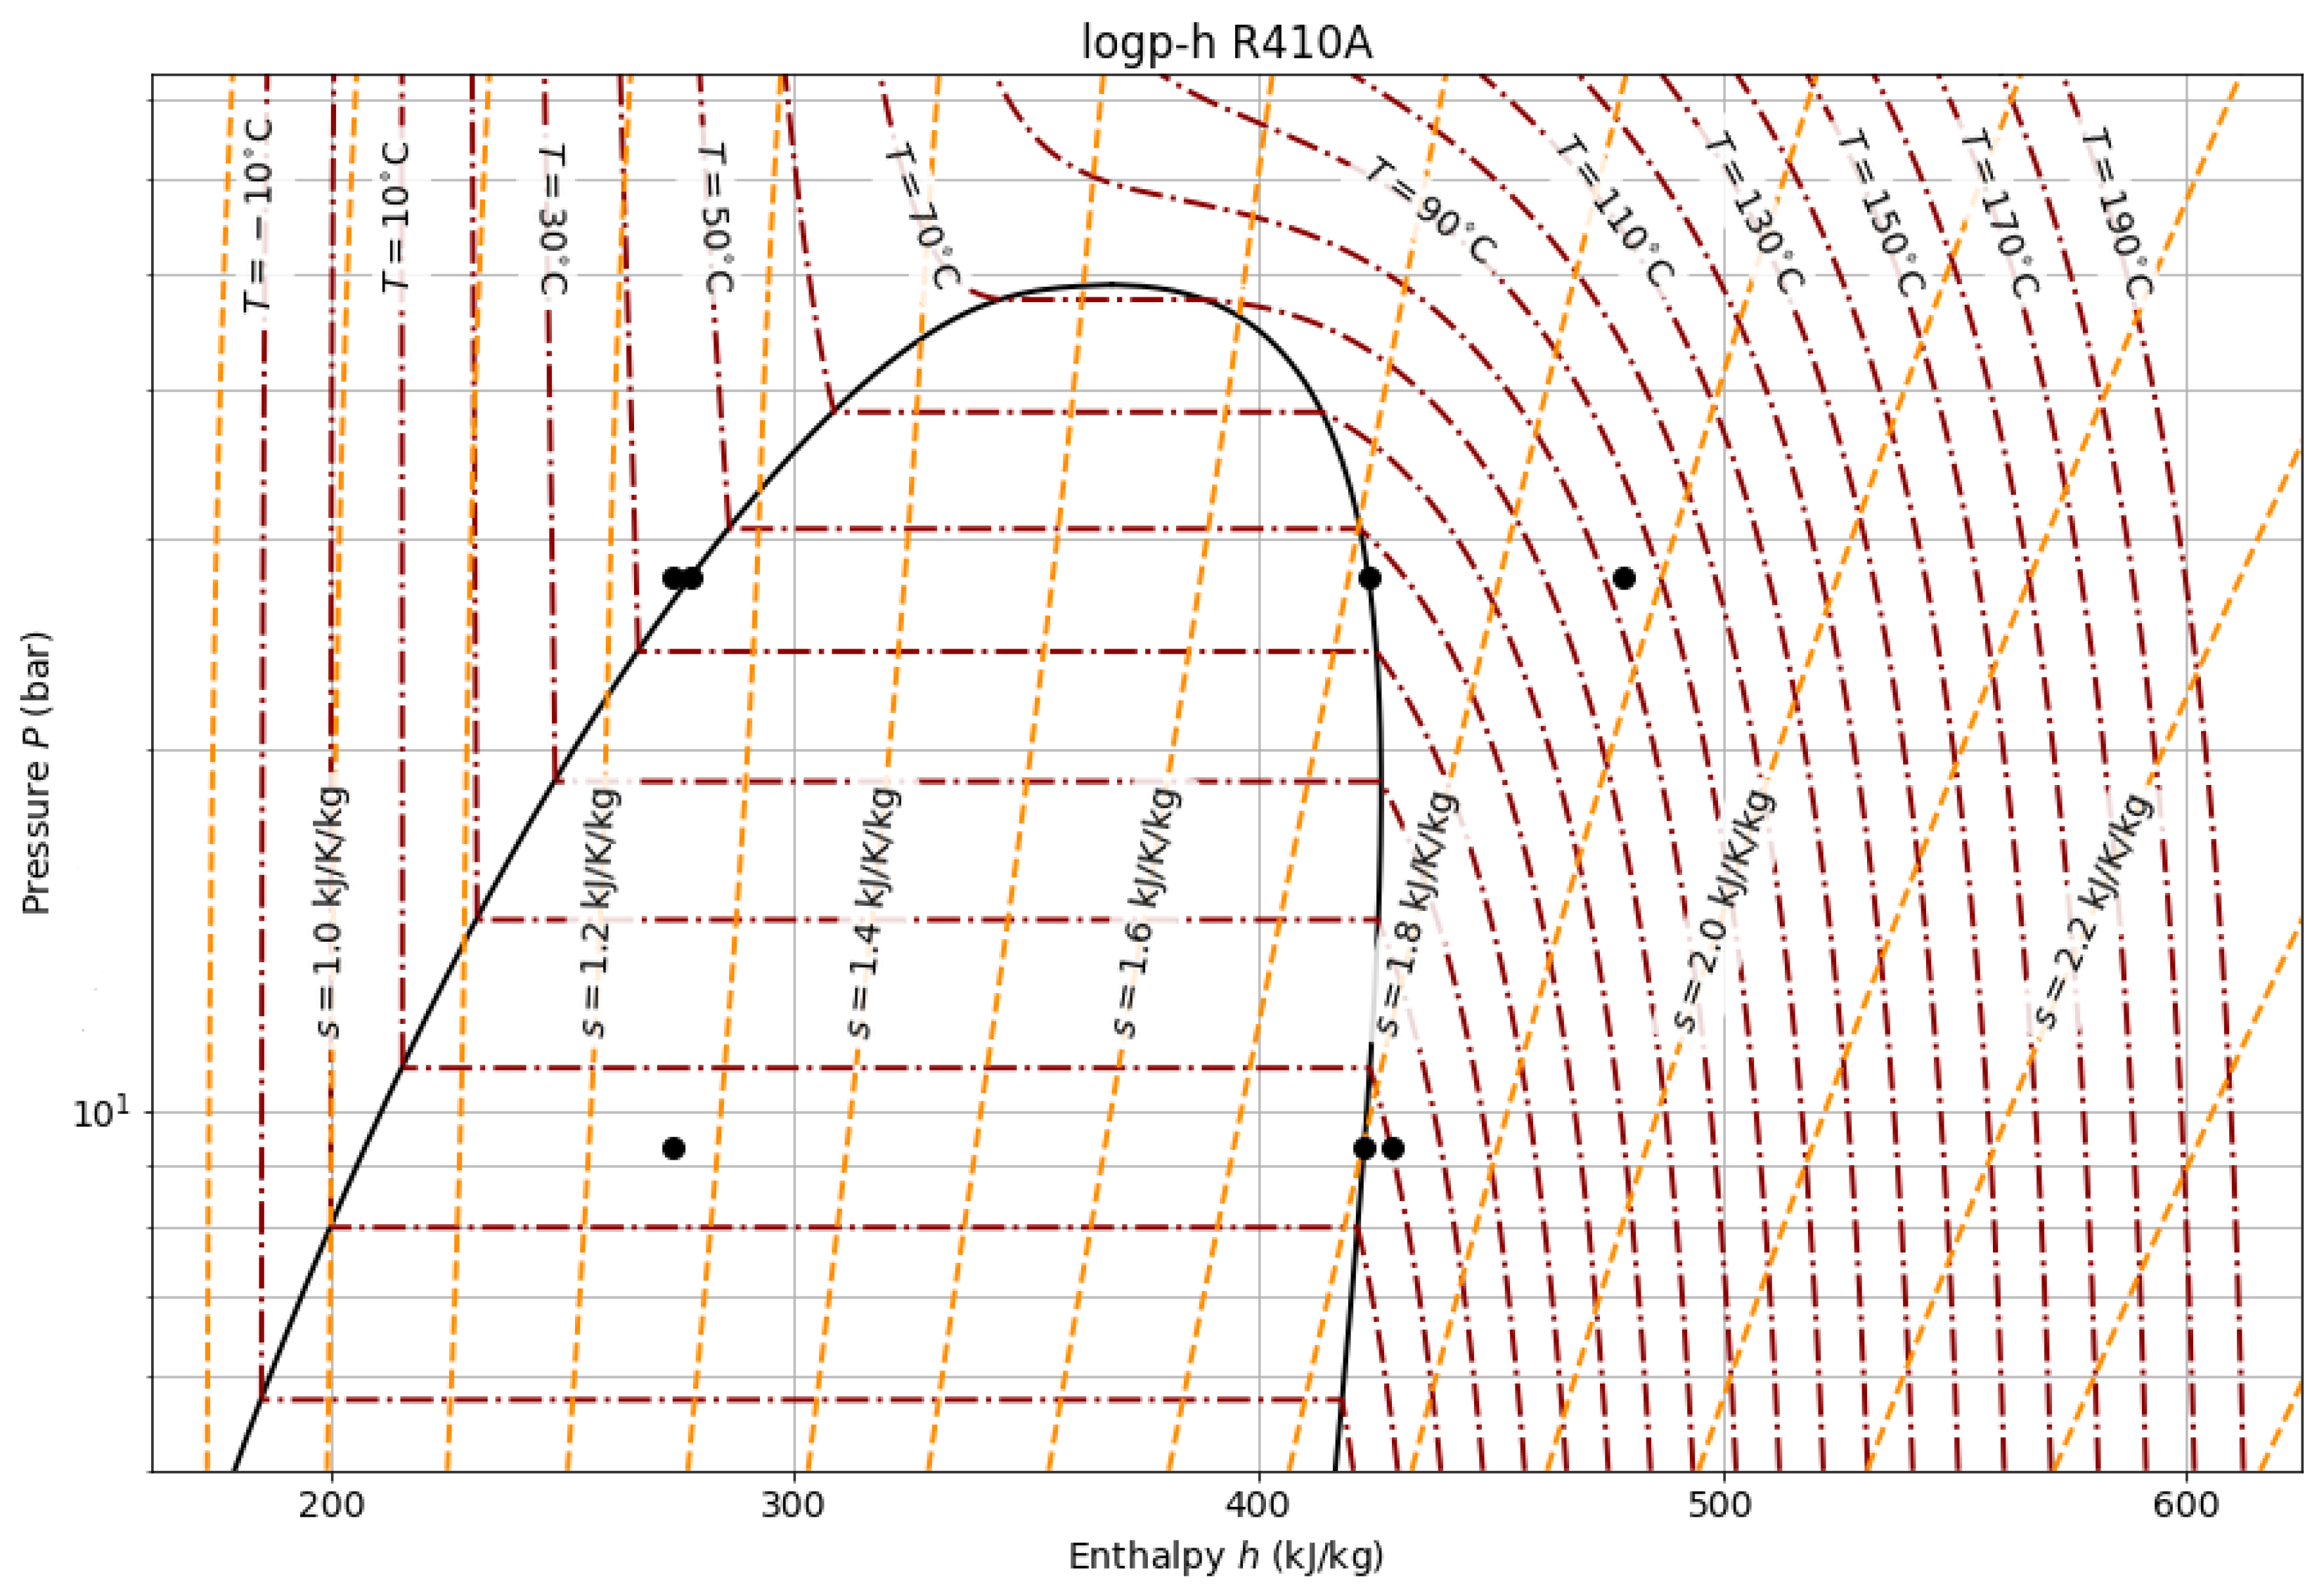
Table 2 above were chosen to represent the parameters at which the SOPSAR system operated during the period when the measured data were collected. The heat sink temperatures were selected based on the required domestic hot water temperature, and the heat source temperatures reflect the ground temperature and their drop due to heat pump operation. Subcooling, superheating and pinch-point were selected based on a typical single stage heat pump similar to this used in SOPSAR. The main constraint of the study was the limited temperature range of the collected measurement data. Simulations were carried out within the temperature range of the SOPSAR system. For every pair of source and sink temperatures, the governing point thermodynamic properties were obtained, and COP was calculated. Below in
Figure 5, the effect of a simulation carried out for one pair of heat sink and source temperatures is shown. The numerical simulation script allows for obtaining the thermodynamic parameters for all characteristic points of the refrigeration circuit as in the log p-h diagram shown in
Figure 5.
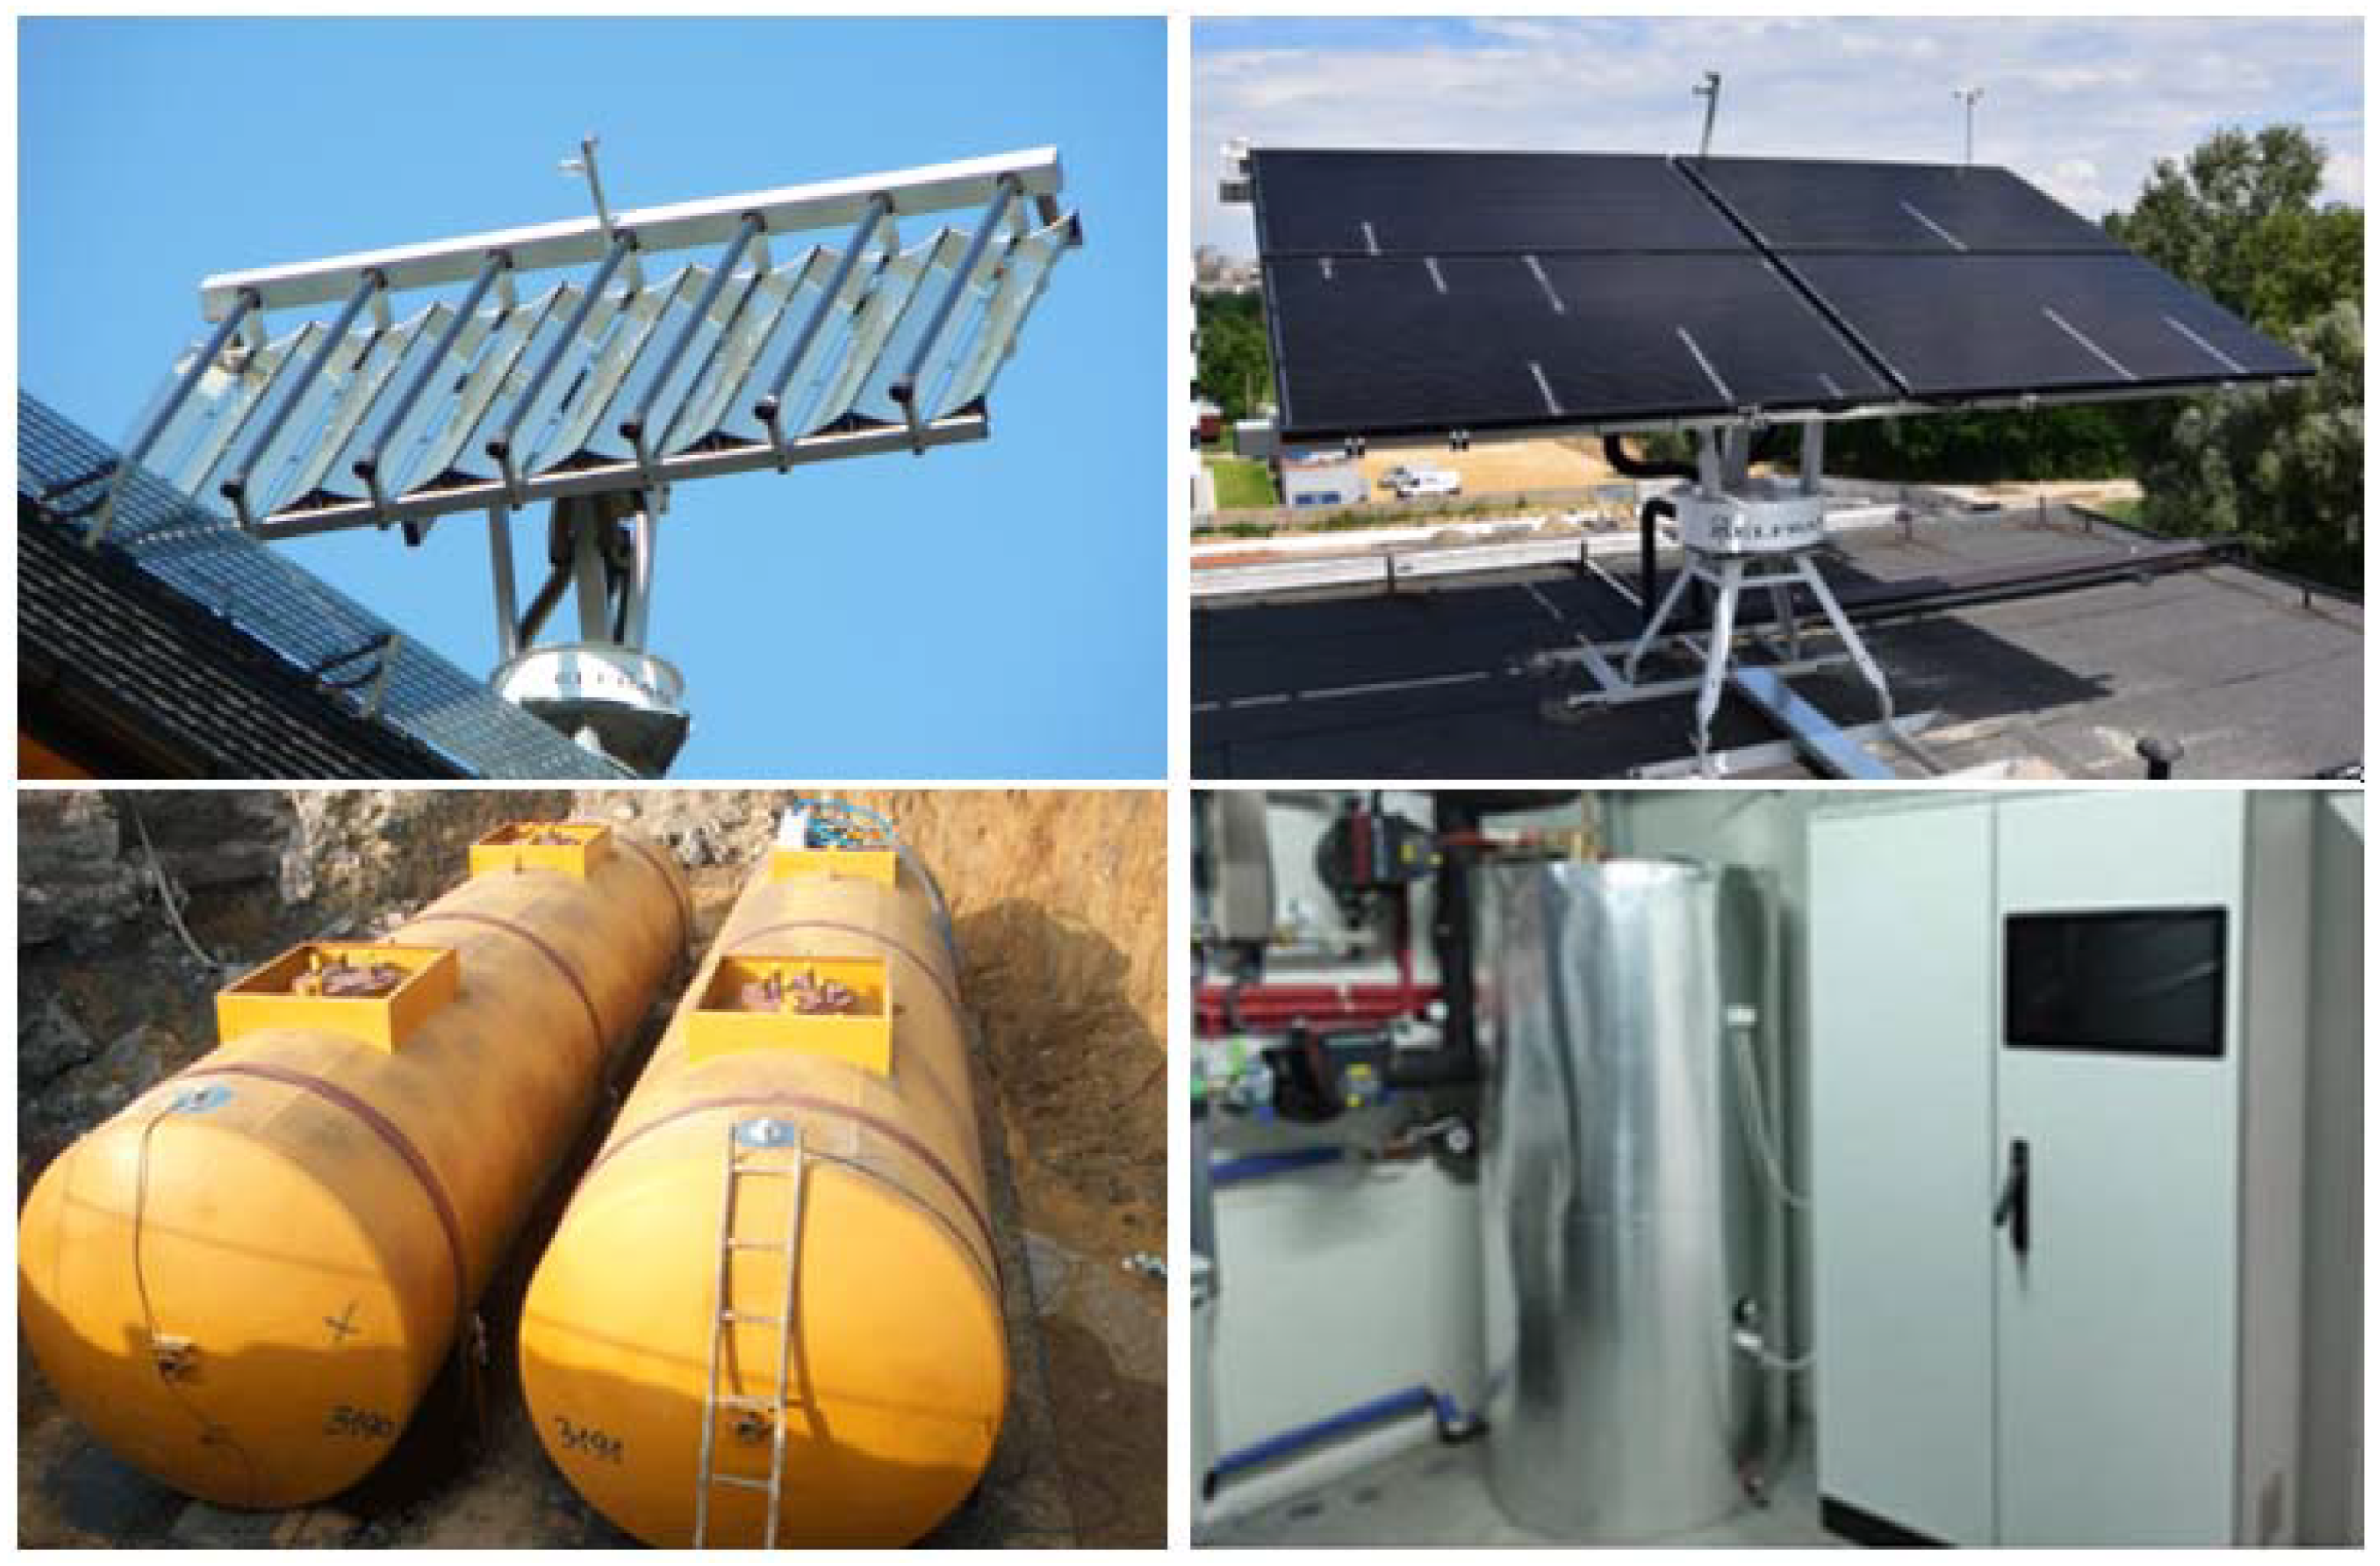
The numerical model was tuned using data obtained in the SOPSAR system installed in Limanowa, Poland the components of which are shown in the
Figure 6. The data from SOPSAR system were gathered from June to September 2020.
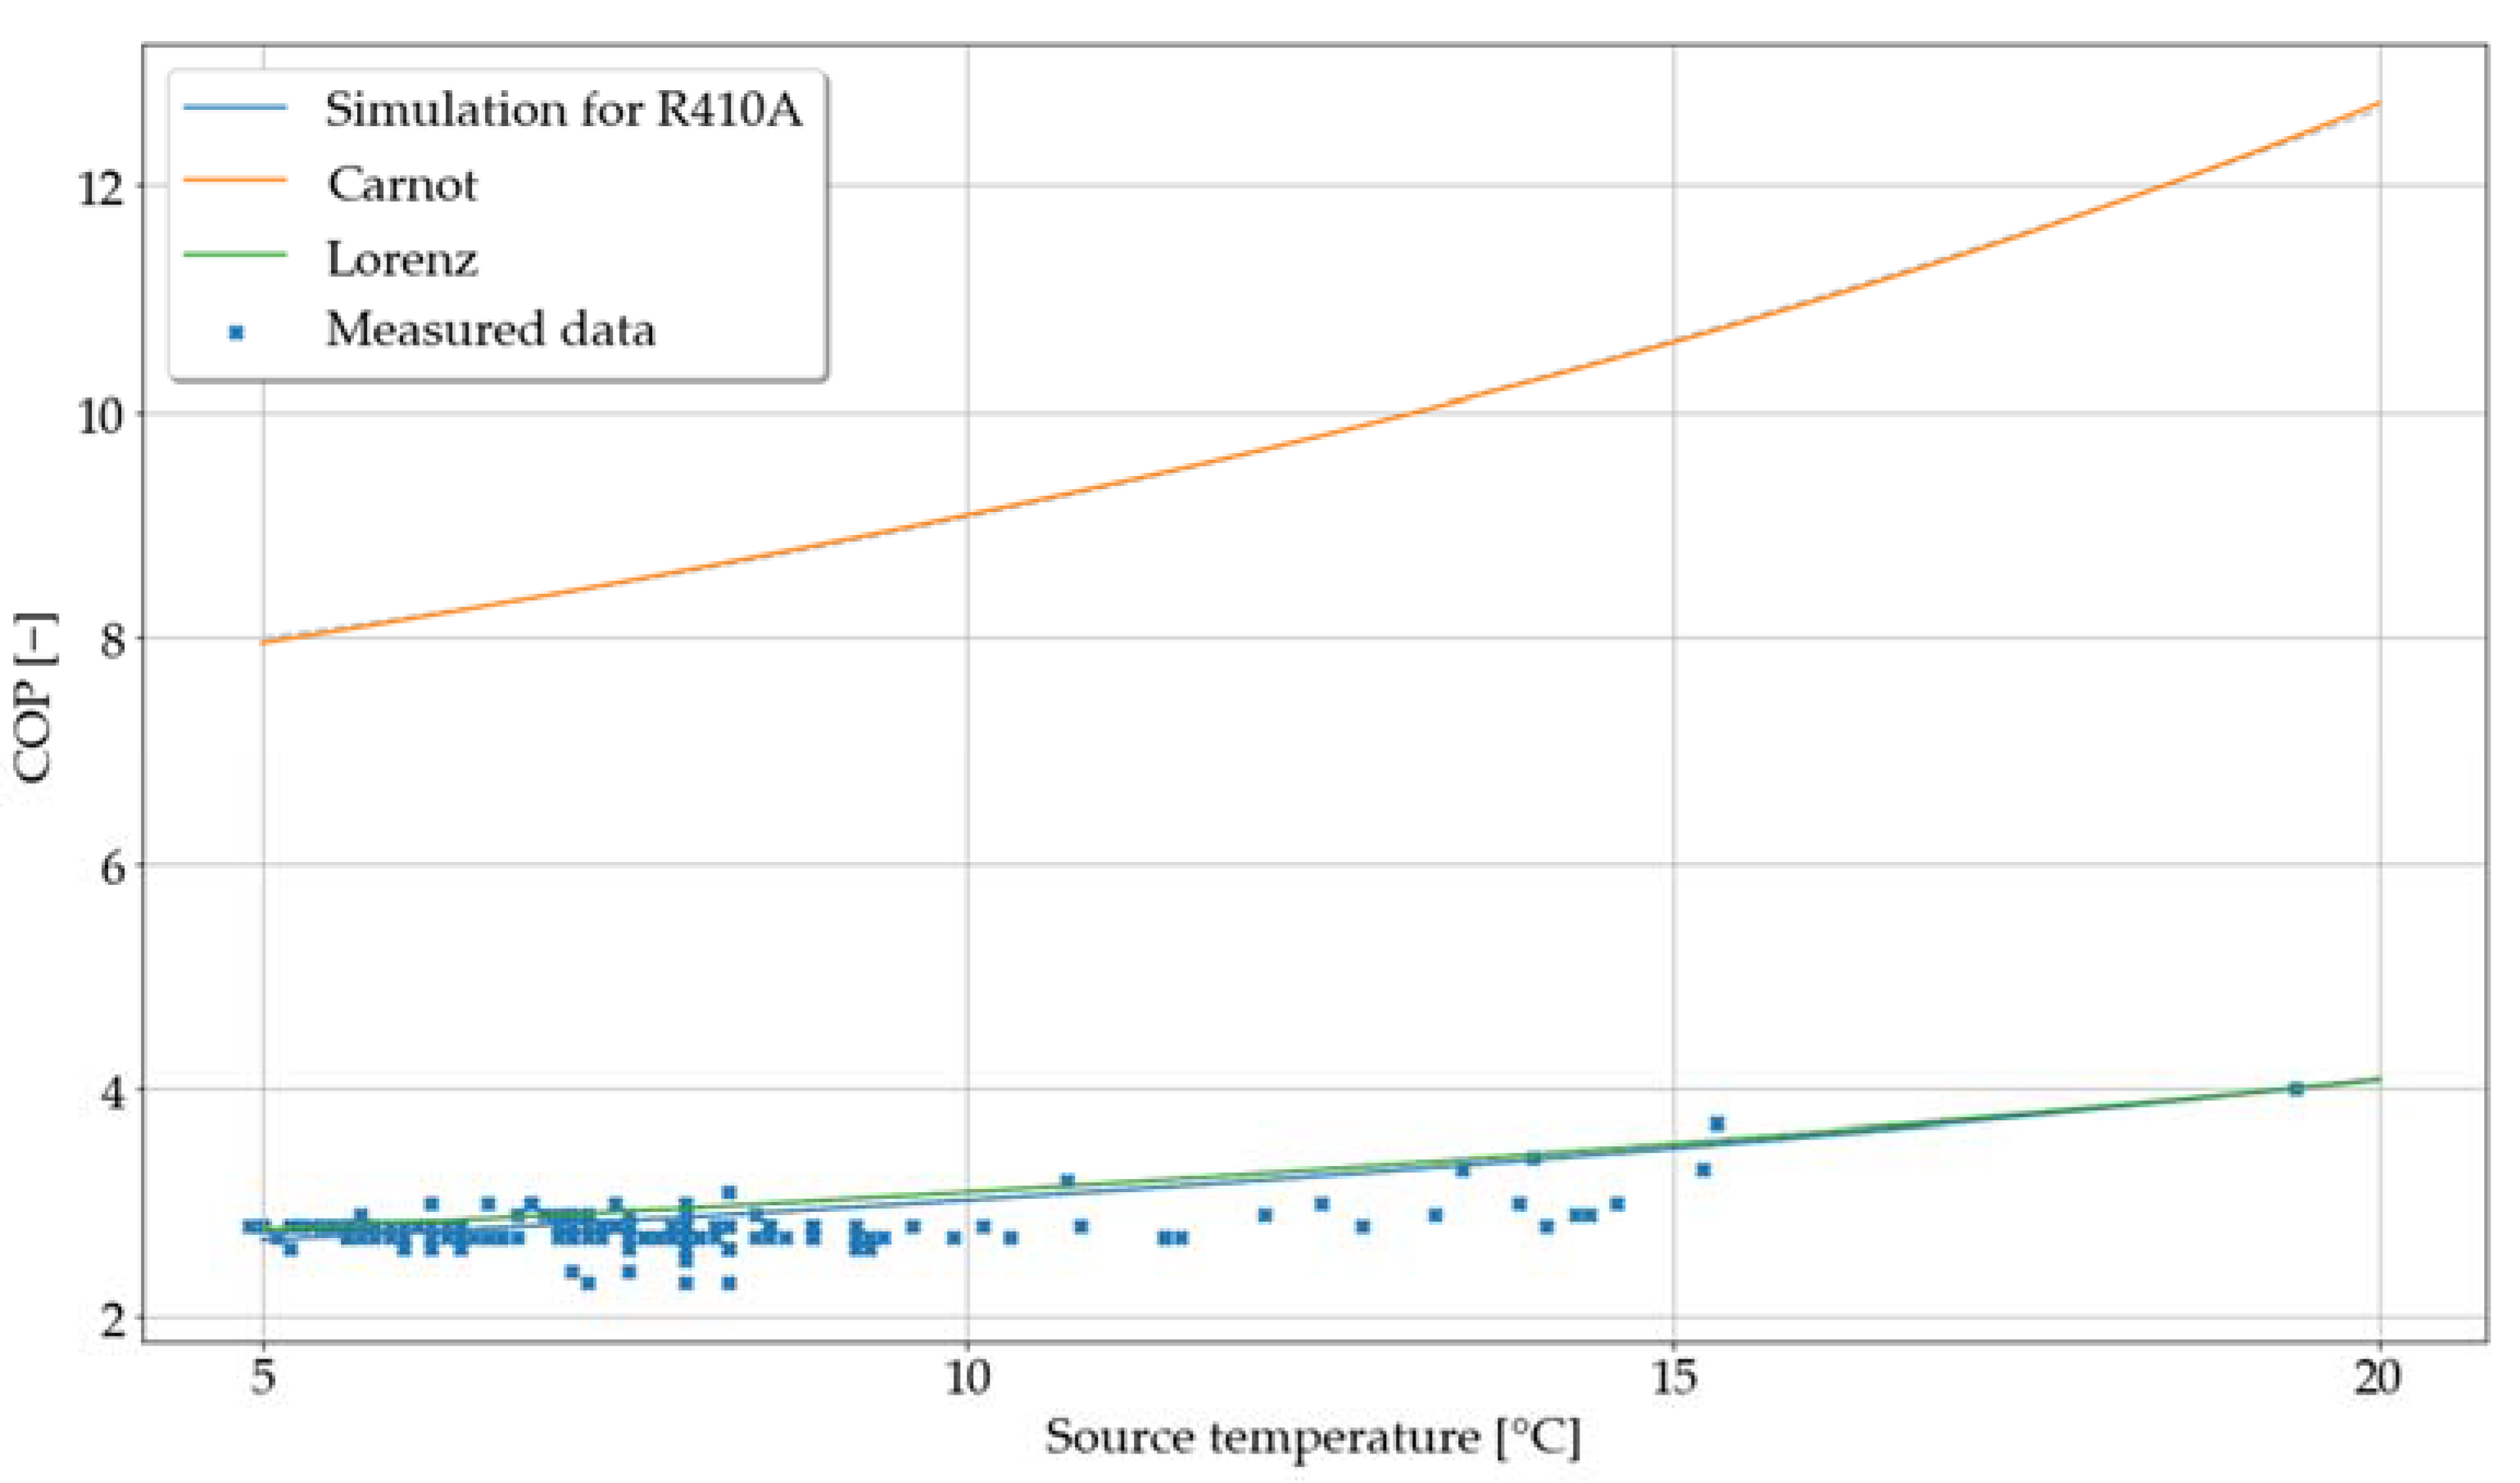
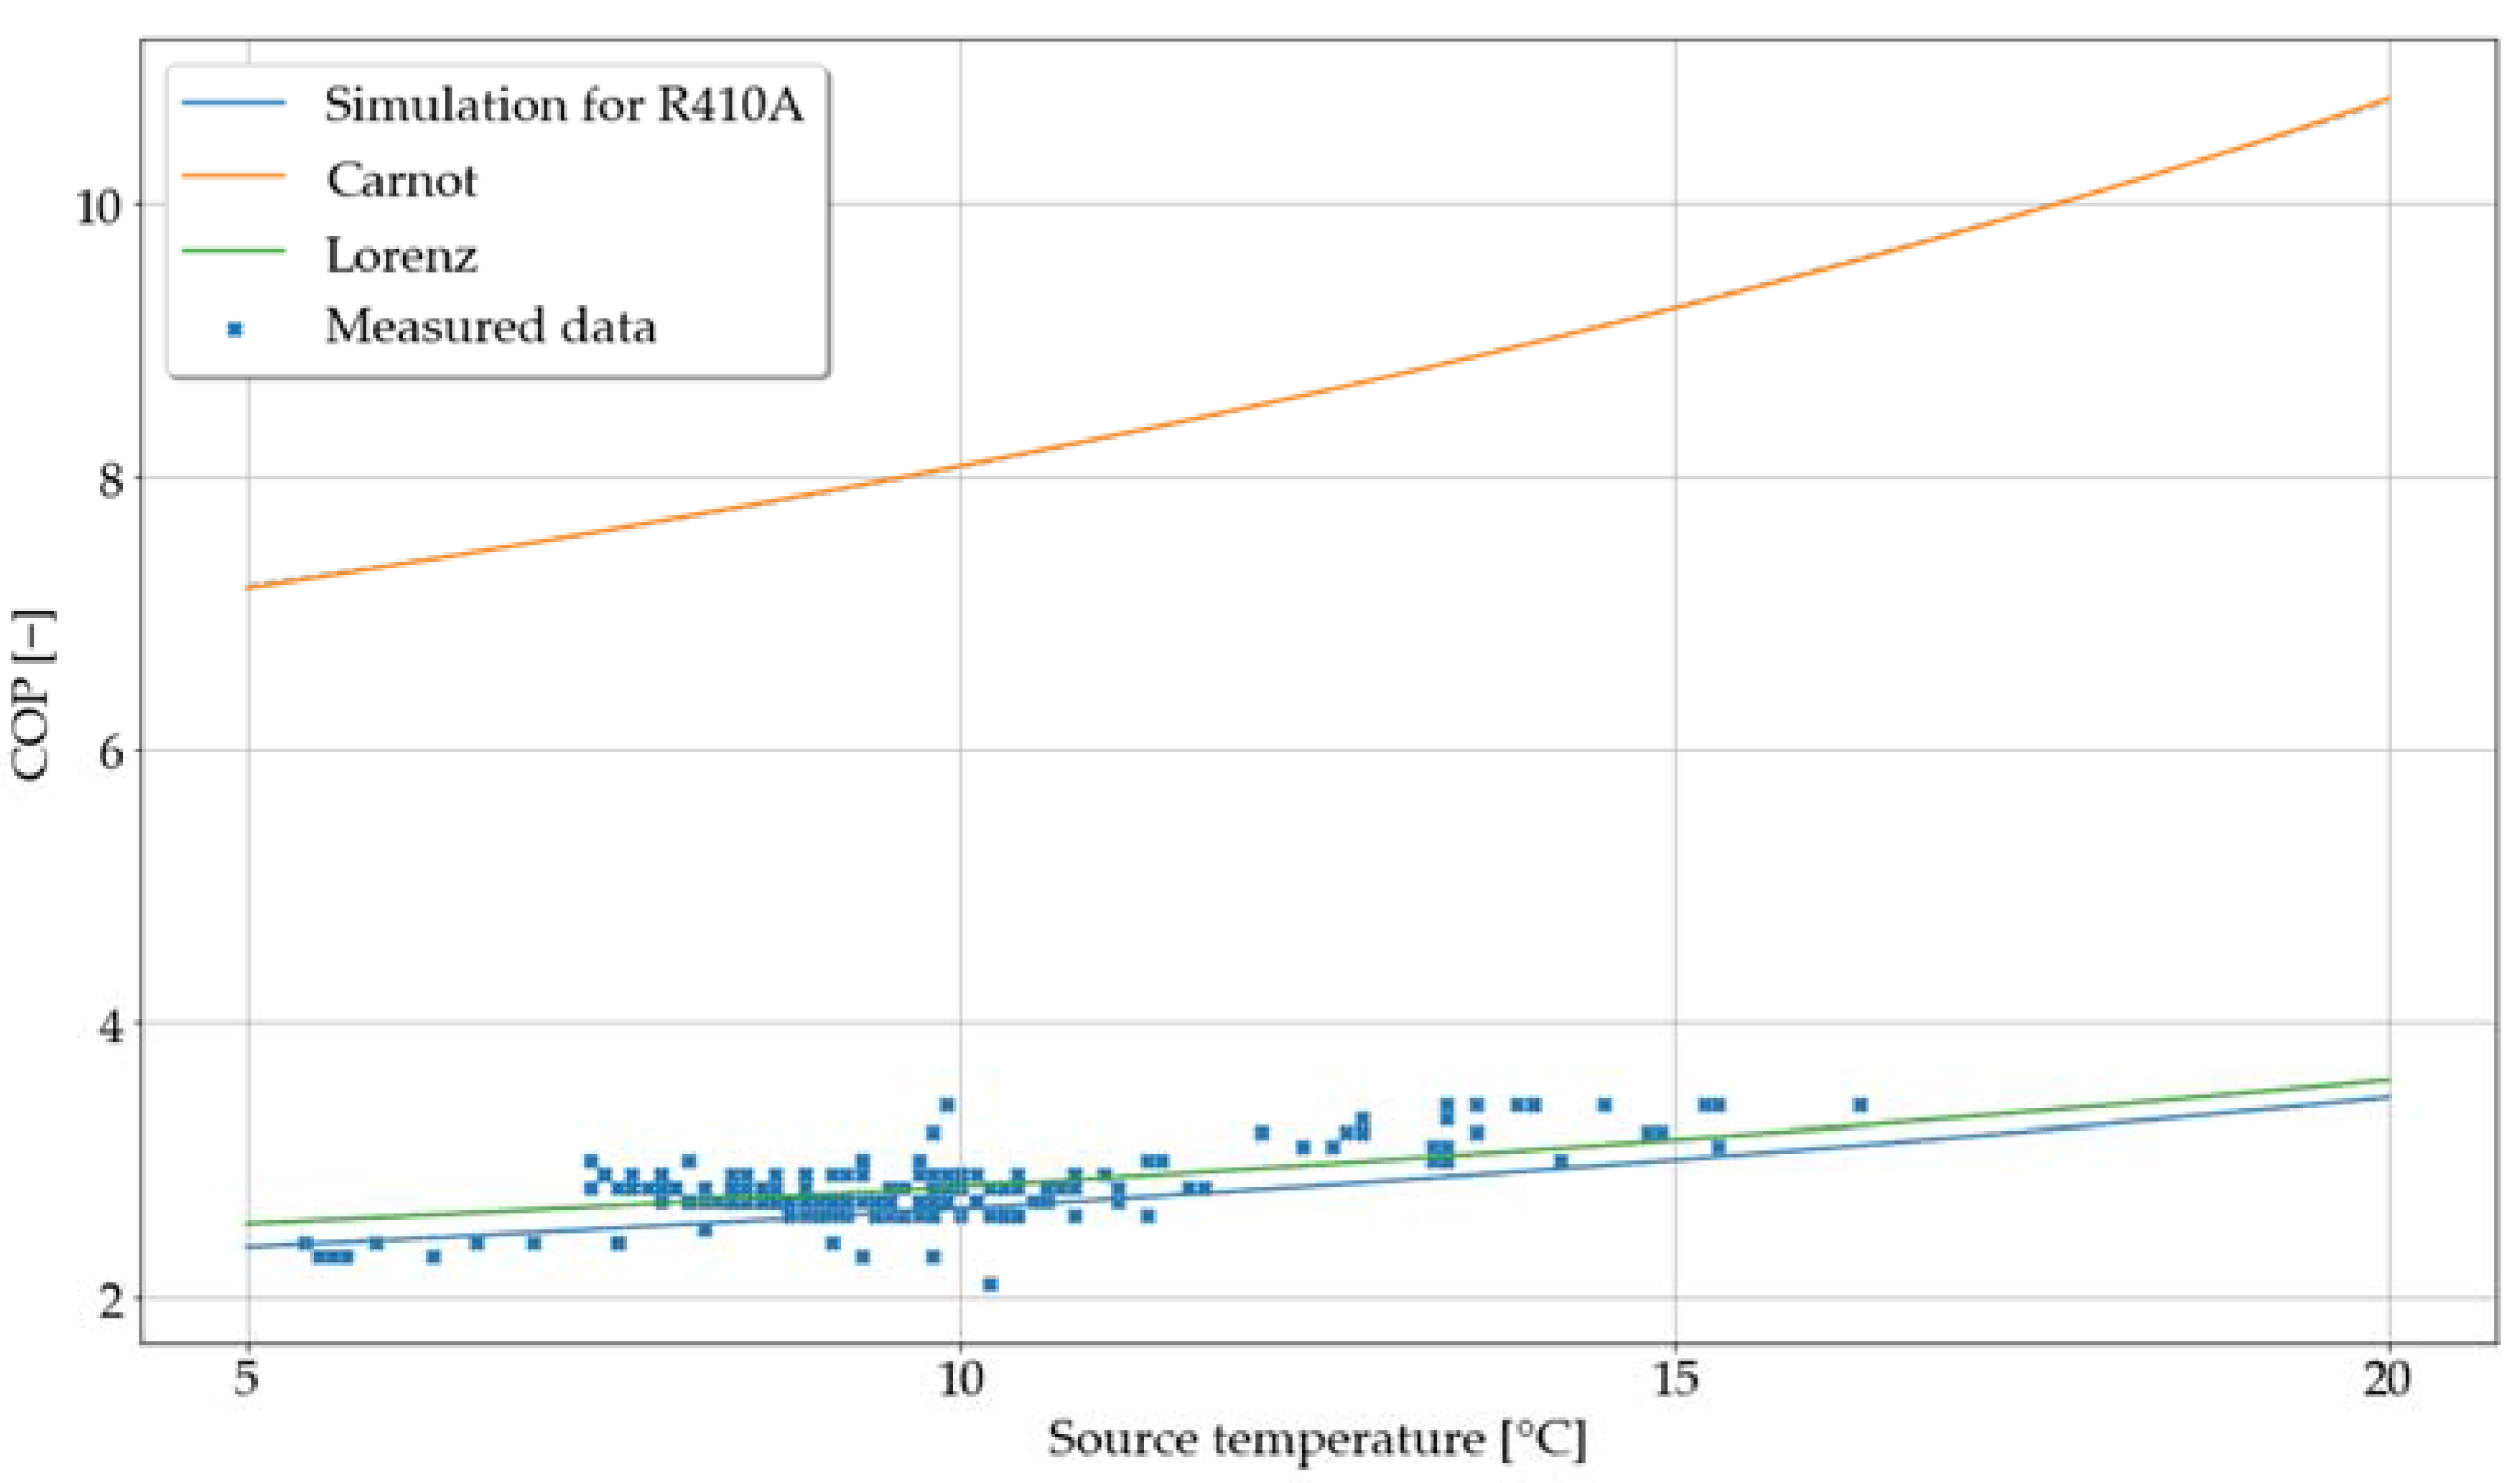
Using the above approach, the COP was determined for two temperatures of a heat sink and several temperatures of heat source, which allowed for creating COP graphs. The SOPSAR data shown in the
Figure 7 and
Figure 8 were filtered for sink temperatures equal to 45 °C and 50 °C. Equations (8) and (9) show a linear approximation that can be used for future simulations of the heat pump performance for these temperature ranges.
The large scatter of measurement points obtained in the SOPSAR system is caused by inaccuracies in the metering equipment—temperature sensors, flow meters and energy meter. Some of the incorrect measurements were removed at the data processing stage. The above graphs show the COP determined with the use of the three previously mentioned methods and also present measurement data from the SOPSAR system. The COP calculated by the Carnot method represents the maximum possible performance for given temperatures. This index does not take into account the type of the circulating medium and its thermodynamic properties, and the irreversible processes occurring during the refrigeration cycle are not taken into account. The Lorenz COP corrected by a coefficient of Lorenz efficiency equals 0.4, showing the approximate value of the COP for real working conditions. The last method considers the thermodynamic properties of a specific refrigerant and the processes taking place in the elements of the heat pump system as shown in
Figure 5. Based on the numerical model, for the average sink temperature equal 45 °C, the following COP(t) formula was obtained from graph shown in
Figure 7:
The RMSD for the equation given above is 0.21, which is 8% of the average COP.
For the average sink temperature equal to 50 °C, the following formula of COP(t) was obtained from graph shown in
Figure 8:
The RMSD for this equation is 0.24, which is 8% of the average COP. Both formulas can be used for further simulations of heat pump assuming that the R410A refrigerant was used, sink temperature equals 45 °C or 50 °C, and source temperatures range from 5 °C to 20 °C. The RMSD error of 8% was caused by, as mentioned before, inaccuracies of the measuring apparatus; however, the obtained solution is sufficiently accurate for the purpose of energy consumption simulation and operating cost analysis, which will be carried out in further studies.
4. Conclusions
The method presented in this article allowed us to obtain a simple second-degree linear model of COP, which can be used in further analyses. With the use of the Python numerical model presented in this article, two linear equations were developed for a specific range of heat sink and heat source temperatures and refrigerant specified in simulation. The main limitation of those equations is that they can only be used for temperatures and refrigerant for which they were specified. Using the Python numerical script, you can prepare linear equations for other refrigerants and other temperature ranges. In the simulation, it was determined that the COP for the sink temperature of 45 °C and source temperature of 5 °C is equal to 2.7. For the same sink temperature and source temperature of 15 °C, COP is equal to 3.5. For sink temperature of 50 °C and source temperature of 5 °C, the COP equals 2.4 and 3.0 for source temperature of 15 °C. Both linear equations have been determined within the range of recorded measurement SOPSAR data and agree with the measured COP for the existing installation. The linear model can be used in conjunction with weather data, ground temperature, heating loads and typical hot water usage to simulate yearly energy usage. COP calculated with this method is sufficiently accurate for determining yearly energy usage and performing cost and benefit analysis. Its simplicity allows fast implementation in other numerical approaches, which require quantification of energy used for domestic needs. During the development of the model, the main challenge was to correctly represent the operation of the system taking into account the efficiency and energy losses in the system. Some difficulties were also caused by the proper preparation of measurement data of the SOPSAR system, identification of incorrect measurements and periods of starting and halting the system where erroneous measurements occurred. The numerical model and linear equations presented in the article will be used for the autonomous RESHeat system in which the heat pump will be one of the essential parts. The model of the RESHeat system, which is the continuation of SOPSAR, is still in development. In addition to simulating the efficiency of the heat pump, it will take into account heat demand for space heating, domestic hot water heating, periodic variability of the ground temperature, ground temperature degradation in winter and the impact of waste heat on the regeneration of ground temperature in the summer period. Determining the COP for a heat pump operating in such a system is crucial to determine the impact of regeneration and accumulation of heat in the ground on pump performance and to analyse the costs and benefits of implementing such solutions in a given system. Further research will include the effect of heat pump operation on the ground temperature, and the potential to regenerate it using waste heat from PV-T panels. The biggest challenge will be to integrate the two simulations, ground and heat pump, into a single solution to account for the mutual influence (feedback loop) on the annual ground temperature profile and its effect on system efficiency.
Author Contributions
Conceptualization, F.B.; software, F.B.; investigation, M.C., T.W. and M.K.-W.; resources, M.C.; data curation, F.B.; writing—original draft preparation, F.B.; writing—review and editing, T.W. and M.K.-W.; visualization, F.B. All authors have read and agreed to the published version of the manuscript.
Funding
This research is funded from the RESHeat project that has received funding from the European Union’s Horizon 2020 research and innovation programme under Grant No. 956255 RESHeat—Renewable energy system for residential building heating and electricity production (RESHeat, Grant No. 956255).
Institutional Review Board Statement
Not applicable.
Informed Consent Statement
Not applicable.
Data Availability Statement
The data presented in this study are available on request from the corresponding author. The data are not publicly available due to privacy protection of F.H.U. Czamara.
Conflicts of Interest
The authors declare no conflict of interest. The funders had no role in the design of the study; in the collection, analyses, or interpretation of data; in the writing of the manuscript, or in the decision to publish the results.
Nomenclature
| COP | COP for heat pump Carnot cycle, (-) |
| T | Temperature, (K) |
| Logarithmic mean temperature, (K) |
| h | Enthalpy, (kJ/kg) |
| H | Enthalpy, (kJ) |
| Q | Energy flow (kJ) |
| s | Entropy, (kJ/kg·K) |
| N | Energy input for heat pump, (kJ) |
| V | Volumetric flow, (m3/h) |
Subscripts
| C | Source |
| H | Sink |
| Car | Carnot cycle |
| I | Inflow |
| O | Outflow |
| Lorenz | Lorenz cycle |
Abbreviations
| COP | Coefficient of Performance |
| nZEB | Nearly zero-energy building |
| PV-T | Photovoltaics thermal panels |
| GSHP | Ground source heat pump |
| SGSHP | Solar assisted ground source heat pump |
| COP(t) | COP function of temperature |
| M | Million |
| RMSD | Root mean square deviation |
References
- Eurostat. Gross Production of Electricity and Derived Heat from Non-Combustible Fuels by Type of Plant and Operator. 2021. Available online: https://appsso.eurostat.ec.europa.eu (accessed on 25 September 2021).
- Statista. Annual Amount of Heat Pumps in Operation in the European Union (EU) from 2013 to 2019. 2020. Available online: https://www.statista.com/statistics/739745/heat-pumps-in-operation-eu/ (accessed on 25 September 2021).
- Eurobserv’er. Heat Pumps Barometer. 2020. Available online: https://www.eurobserv-er.org/pdf/eurobserver-heat-pumps-barometer-2020 (accessed on 23 May 2021).
- Nowak, T. Heat Pumps—Integrating Technologies to Decarbonise Heating and Cooling, EHPA. 2018. Available online: www.ehpa.org/fileadmin/red/03._Media/Publications/ehpa-white-paper-111018.pdf (accessed on 30 September 2021).
- Conrad, J.; Greif, S. Modelling Load Profiles of Heat Pumps. Energies 2019, 12, 766. [Google Scholar] [CrossRef] [Green Version]
- Shimada, Y.; Uchida, Y.; Takashima, I.; Chotpantarat, S.; Widiatmojo, A.; Chokchai, S.; Charusiri, P.; Kurishima, H.; Tokimatsu, K. A Study on the Operational Condition of a Ground Source Heat Pump in Bangkok Based on a Field Experiment and Simulation. Energies 2020, 13, 274. [Google Scholar] [CrossRef] [Green Version]
- Shin, D.U.; Jeong, C.-H. Energy Savings of Simultaneous Heating and Cooling System According to Indoor Set Temperature Changes in the Comfort Range. Energies 2021, 14, 7691. [Google Scholar] [CrossRef]
- Anna, B. Architektura Energoaktywna po 2021. T. 1, Zagadnienia Architektoniczno—Budowlane; Oficyna Wydawnicza Politechniki Wrocławskiej: Wrocław, Poland, 2020. [Google Scholar]
- Magrini, A.; Lentini, G.; Cuman, S.; Bodrato, A.; Marenco, L. From nearly zero energy buildings (NZEB) to positive energy buildings (PEB): The next challenge—The most recent European trends with some notes on the energy analysis of a forerunner PEB example. Dev. Built Environ. 2020, 3, 100019. [Google Scholar] [CrossRef]
- Fadejev, J.; Simson, R.; Kurnitski, J.; Kesti, J.; Mononen, T.; Lautso, P. Geothermal Heat Pump Plant Performance in a Nearly Zero-energy Building. Energy Procedia 2016, 96, 489–502. [Google Scholar] [CrossRef]
- Gondal, I.A. Prospects of shallow geothermal systems in HVAC for NZEB. Energy Built Environ. 2021, 2, 425–435. [Google Scholar] [CrossRef]
- Li, H.; Xu, W.; Yu, Z.; Wu, J.; Sun, Z. Application analyze of a ground source heat pump system in a nearly zero energy building in China. Energy 2017, 125, 140–151. [Google Scholar] [CrossRef]
- Zhou, S.; Cui, W.; Zhao, S.; Zhu, S. Operation analysis and performance prediction for a GSHP system compounded with domestic hot water (DHW) system. Energy Build. 2016, 119, 153–163. [Google Scholar] [CrossRef]
- Chu, G.; Wang, Y.; Chu, M. Measurement and Analysis of a GSHP System Operation in Winter. Procedia Eng. 2016, 146, 573–578. [Google Scholar] [CrossRef] [Green Version]
- Pieper, H.; Krupenski, I.; Markussen, W.B.; Ommen, T.; Siirde, A.; Volkova, A. Method of linear approximation of COP for heat pumps and chillers based on thermodynamic modelling and off-design operation. Energy 2021, 230, 120743. [Google Scholar] [CrossRef]
- Girard, A.; Gago, E.J.; Muneer, T.; Caceres, G. Higher ground source heat pump COP in a residential building through the use of solar thermal collectors. Renew. Energy 2015, 80, 26–39. [Google Scholar] [CrossRef]
- Chen, J. Optimal Performance Characteristics of a Solar-Driven Heat Pump at Maximum COP. Energy Convers. Manag. 1994, 35, 1009–1014. [Google Scholar] [CrossRef]
- Dincer, I.; Rosen, M.A. Energy, Environment and Sustainable Development; Elsevier: Oxford, UK, 2020. [Google Scholar]
- Duarte, M.V.; Pires, L.C.; Silva, P.D.; Gaspar, P.D. Experimental comparison between R409A and R437A performance in a heat pump unit. Open Eng. 2017, 7, 77–90. [Google Scholar] [CrossRef]
- Jensen, J.K.; Ommen, T.; Reinholdt, L.; Markussen, W.B.; Elmegaard, B. Heat pump COP, part 2: Generalised COP estimation of heat pump processes. In Proceedings of the 13th IIR Gustav Lorentzen Conference on Natural Refrigerants (GL 2018), Valencia, Spain, 18–20 June 2018. [Google Scholar]
- Byrne, P.; Miriel, J.; Lénat, Y. Modelling and simulation of a heat pump for simultaneous heating and cooling. Build. Simul. 2012, 5, 219–232. [Google Scholar] [CrossRef] [Green Version]
- Patwardhan, V.R.; Patwardhan, V.S. A simplified procedure for the estimation of (COP)R for heat pumps. Heat Recovery Syst. CHP 1987, 7, 435–440. [Google Scholar] [CrossRef]
- Ocłoń, P. Renewable Energy Utilization Using Underground Energy Systems; Springer Nature: Cham, Switzerland, 2021. [Google Scholar]
| Publisher’s Note: MDPI stays neutral with regard to jurisdictional claims in published maps and institutional affiliations. |
© 2022 by the authors. Licensee MDPI, Basel, Switzerland. This article is an open access article distributed under the terms and conditions of the Creative Commons Attribution (CC BY) license (https://creativecommons.org/licenses/by/4.0/).


