1. Introduction
With the rapid development of global industrialization, the excessive use of fossil fuels leads to the increasingly serious problem of environmental pollution. In order to reduce the dependence on fossil fuels and environmental pollution, countries around the world are vigorously developing green and sustainable energy [
1,
2,
3]. Energy storage and conversion technologies are needed to realize the effective utilization of green and sustainable energy. Among them, electrochemical energy technologies such as the lithium-ion battery and the fuel cell are considered to be the most feasible [
4,
5]. Especially, the proton exchange membrane fuel cell (PEMFC) is attracting more and more attention. Because of its advantages of zero-emission, low noise, and high energy conversion efficiency, it has been applied to many fields, such as fuel cell electric vehicles (FCEV). However, PEMFC is a complex electrochemical system, its performance and durability ate still major challenges to large-scale commercialization.
The fuel cell performance is related to the internal state [
6,
7,
8]. To overcome the challenges mentioned above, it is necessary to use electrochemical diagnostic analysis tools to understand the changes in the internal states of fuel cells [
9,
10,
11]. As one of the electrochemical diagnostic analysis tools, electrochemical impedance spectroscopy (EIS) has been widely used in the measurement and diagnosis of electrochemical systems due to its advantages of high accuracy, wide frequency band, simple operation, and no damage [
12]. The electrochemical impedance spectroscopy is sensitive to the internal and external conditions of the electrochemical system [
13,
14,
15,
16,
17,
18]. It can provide general information on kinetics for the electrochemical system [
19,
20,
21]. Thus, as an effective tool, EIS is often used to study the characteristics of fuel cells or establish the relationship between internal states and operating conditions [
22,
23,
24].
EIS analysis methods include the equivalent circuit modeling method, physical model method, and relaxation time distribution method, etc. The physical model method is based on the mathematical modeling of the different electrochemical process mechanisms inside the fuel cell to study the impedance characteristics of the system [
25]. However, it is difficult to obtain an accurate physical model of the fuel cell [
13]. The relaxation time distribution method can extract characteristic time constants from the impedance spectroscopy to distinguish different electrochemical processes without a priori knowledge of the impedance. However, it is difficult to select an appropriate regularization factor required for data processing in this method, and the impedance of each process can be analyzed but difficult to be quantified. The equivalent circuit modeling method is the most commonly used in EIS analysis, the equivalent circuit model is usually composed of basic circuit elements such as series of parallel resistances and capacitance to fit the measured electrochemical impedance spectroscopy. It can combine the internal state of the fuel cell with model parameters to describe the changing trend of the impedance under different working conditions without the complicated mechanism processes. Yan et al. [
26] investigated the impedance characteristics of a stack under different operating temperatures with the equivalent circuit model (ECM) and found that high-frequency resistance (HFR) and diameter of the two overlapping arcs gradually decreased with the increase in operating temperatures; Keller et al. [
27] experimented to study the EIS sensitivity to relative humidity (RH) of supplied gas in the fuel cell and found that both activation and concentration polarizations increased with the RH of the anode and cathode decreasing. In another study, Malevicha et al. [
28] studied the effects of the RH of the anode and cathode on the electrochemically active surface area of the fuel cell.
In addition, the equivalent circuit model can also be used for the fault diagnosis of the fuel cell. Specifically, the fault diagnosis is carried out by measuring the impedance spectroscopy under different working conditions with the auxiliary equipment during the operation, and then using the equivalent circuit modeling method to analyze the model parameters as fault characteristic variables to identify the fault. Rubio et al. [
29] established the relationship between the parameters of ECM and the internal states of PEMFC, and realized to diagnose flooding and drying fault of the PEMFC; furthermore, by connecting an inductance element in parallel on the RC circuit, the carbon monoxide poisoning fault of the anode catalyst can be also detected. Through EIS measurement and equivalent circuit modeling, Legros et al. [
30] found that PEMFC flooding mainly affected the mass transfer impedance and cathode Warburg impedance, and further proved the feasibility of using EIS for flooding fault diagnosis by acoustic emission technology. Kurz et al. [
31] and Kadyk et al. [
32] both effectively diagnosed the flooding and membrane drying of the fuel cell based on the equivalent circuit models, and the former further concluded that the virtual part of the fuel cell impedance at 0.5 Hz, and the real part of the impedance at 1 kHz, could distinguish the flooding and membrane drying.
Whether it is internal state analysis or fault diagnosis of the fuel cell, the premise and key point of analysis based on the equivalent circuit modeling method is to establish an accurate equivalent circuit model to describe the electrochemical process of fuel cells. Now, there are many articles based on the equivalent circuit modeling method. However, the equivalent circuit models used by them are different, and the comparative analysis of the performance and applicability of different models in a comprehensive way is still lacking. As a result, there is no great progress in the development of the equivalent circuit model. Therefore, this paper makes a systematical comparison of the performance and applicability of four typical equivalent circuit models for the first time, and studies the fitting accuracy of each model under different working conditions, the changing trend of the model parameters with the changes in external working conditions and the goodness of fit (GOF) in depth. The work presented in this paper can effectively promote the application of the equivalent circuit model in the state analysis, estimation, and diagnosis of the fuel cell.
3. Model Structures
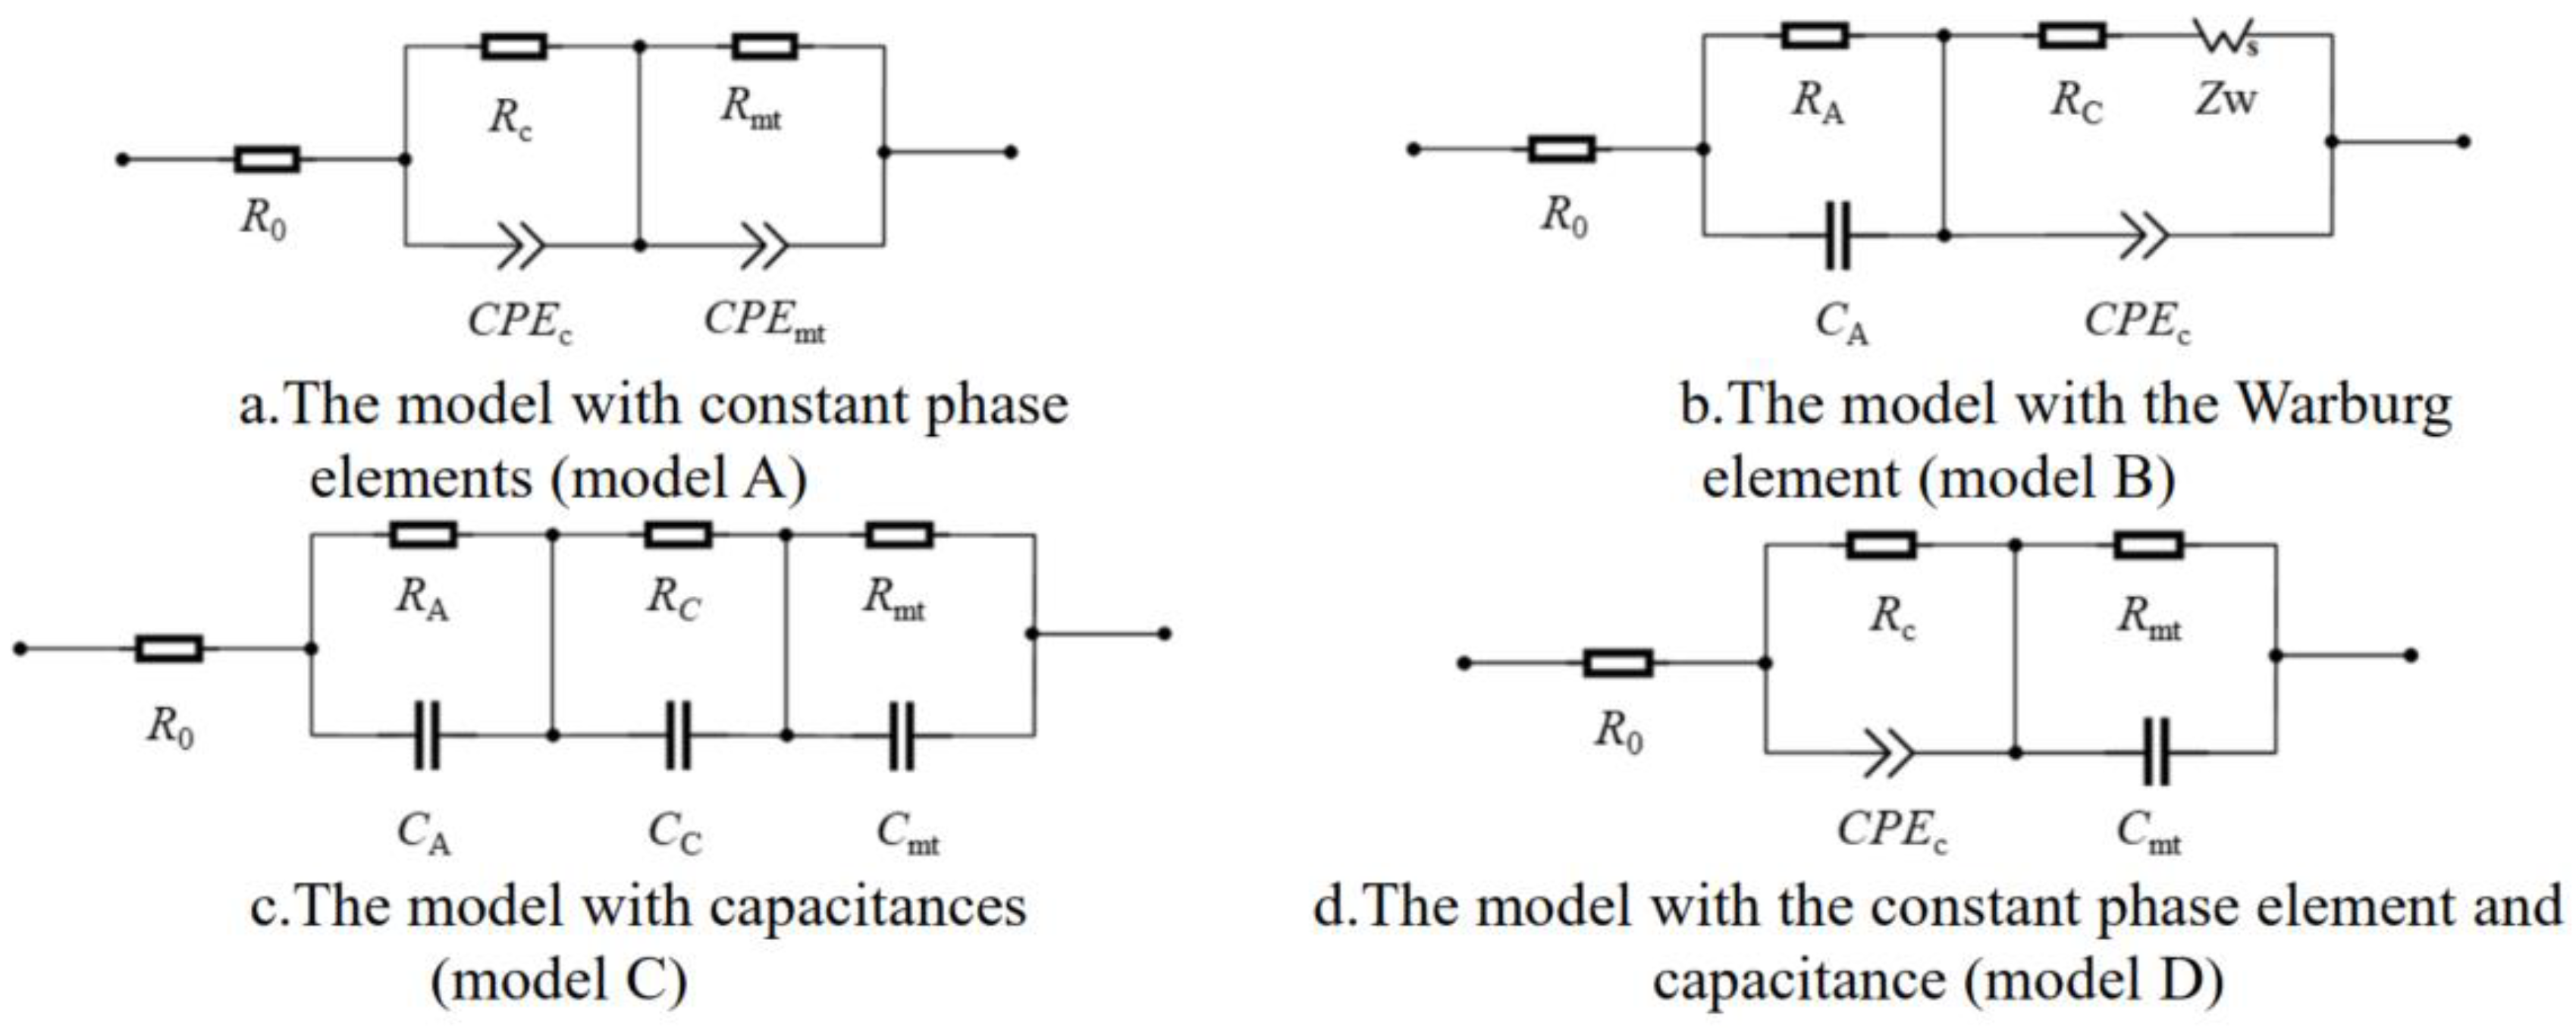
Equivalent circuit models normally consist of resistances, capacitances, constant phase elements, inductors, and Warburg elements. These models are phenomenon-based and are extensively used in electrochemical systems. In general, four typical ECMs have been reported in the literature to interpret electrochemical impedance spectroscopy. The description of these models is shown in
Figure 3.
(1) The model with constant phase elements (hereafter referred to as model A) consists of three circuits in series. The first circuit is resistance
R0. The second and third circuits are the same, both of which are resistance and constant phase element in parallel.
RC and
CPEC in parallel reflect the cathodic activation loss, where
RC represents the resistance of charge transfer caused by the oxygen reduction reaction (ORR), the
CPEC is related to the electrochemical process in the cathode with a rough catalyst layer and uneven catalyst distribution [
35], which is expressed by the following formula:
where
TCPEc is the term of distributed capacitance,
φ is a constant which is lower than 1.
CPEC is equivalent to the capacitance when
φ = 1.
Rmt and
CPEmt are parallel to describe the mass transfer loss.
Rmt is the resistance of mass transfer of oxygen diffusion in the catalyst layer. In this model, it is considered that the anode activation loss is very small and can be ignored [
26].
(2) The model with the Warburg element (hereafter referred to as model B) consists of a serial resistance, an anode model, and a cathode model.
R0 represents the sum of proton and electron transport resistances in the fuel cell. The anode model includes the charge transfer resistance of the hydrogen oxidation reaction (HOR),
RA, and the capacitance of the catalyst layer,
CA. The cathode model includes charge transfer resistance of the oxygen reduction reaction,
RC, a constant phase element
CPEC, and a finite length Warburg diffusion element,
ZW.
ZW relates to the mass transfer loss in the gas diffusion layer, including the resistance of the gas diffusion layer
Rd and the time constant
Td =
l2/
D, which is given by the following formula [
13]:
where
l is the effective diffusion thickness,
D is the effective diffusion coefficient of reactants, and 0 <
p < 1 is a constant.
(3) The model with capacitances (hereafter referred to as model C) consists of three parallel RC circuits and a resistance in series, where the first two RC circuits correspond to the activation loss of the anode and cathode. Compared to the model with constant phase elements, capacitances are used instead of the constant phase element in this circuit. The third RC circuit is related to the mass transfer loss of the fuel cell, the impedance elements are Rmt and Cmt. R0 is used to describe the resistance of the membrane or electrolyte.
(4) The model with the constant phase element and capacitance (hereafter referred to as model D) is composed of three circuits. This model is similar to the model with constant phase elements in that both activation and mass transfer loss of the anode in the fuel cell is ignored. However, a slight difference is that the resistance and capacitance in parallel in model A are used to describe the cathodic mass transfer loss of the fuel cell, while model D uses the resistance and constant phase element in parallel to describe that.
In this paper, ZView software developed by Scribner Associates Inc in North Carolina, USA is used to fit the measured electrochemical impedance spectroscopy based on different equivalent circuit models. Consider that the units of model parameters are different. To compare and analyze the changes in the model parameters with the changes in the external working conditions, the normalization method will be adopted in this paper, which is given by the following formula:
where
K is the normalization parameter,
xi is the value of the model parameter,
is the average value of the corresponding model parameter.
4. Results and Discussion
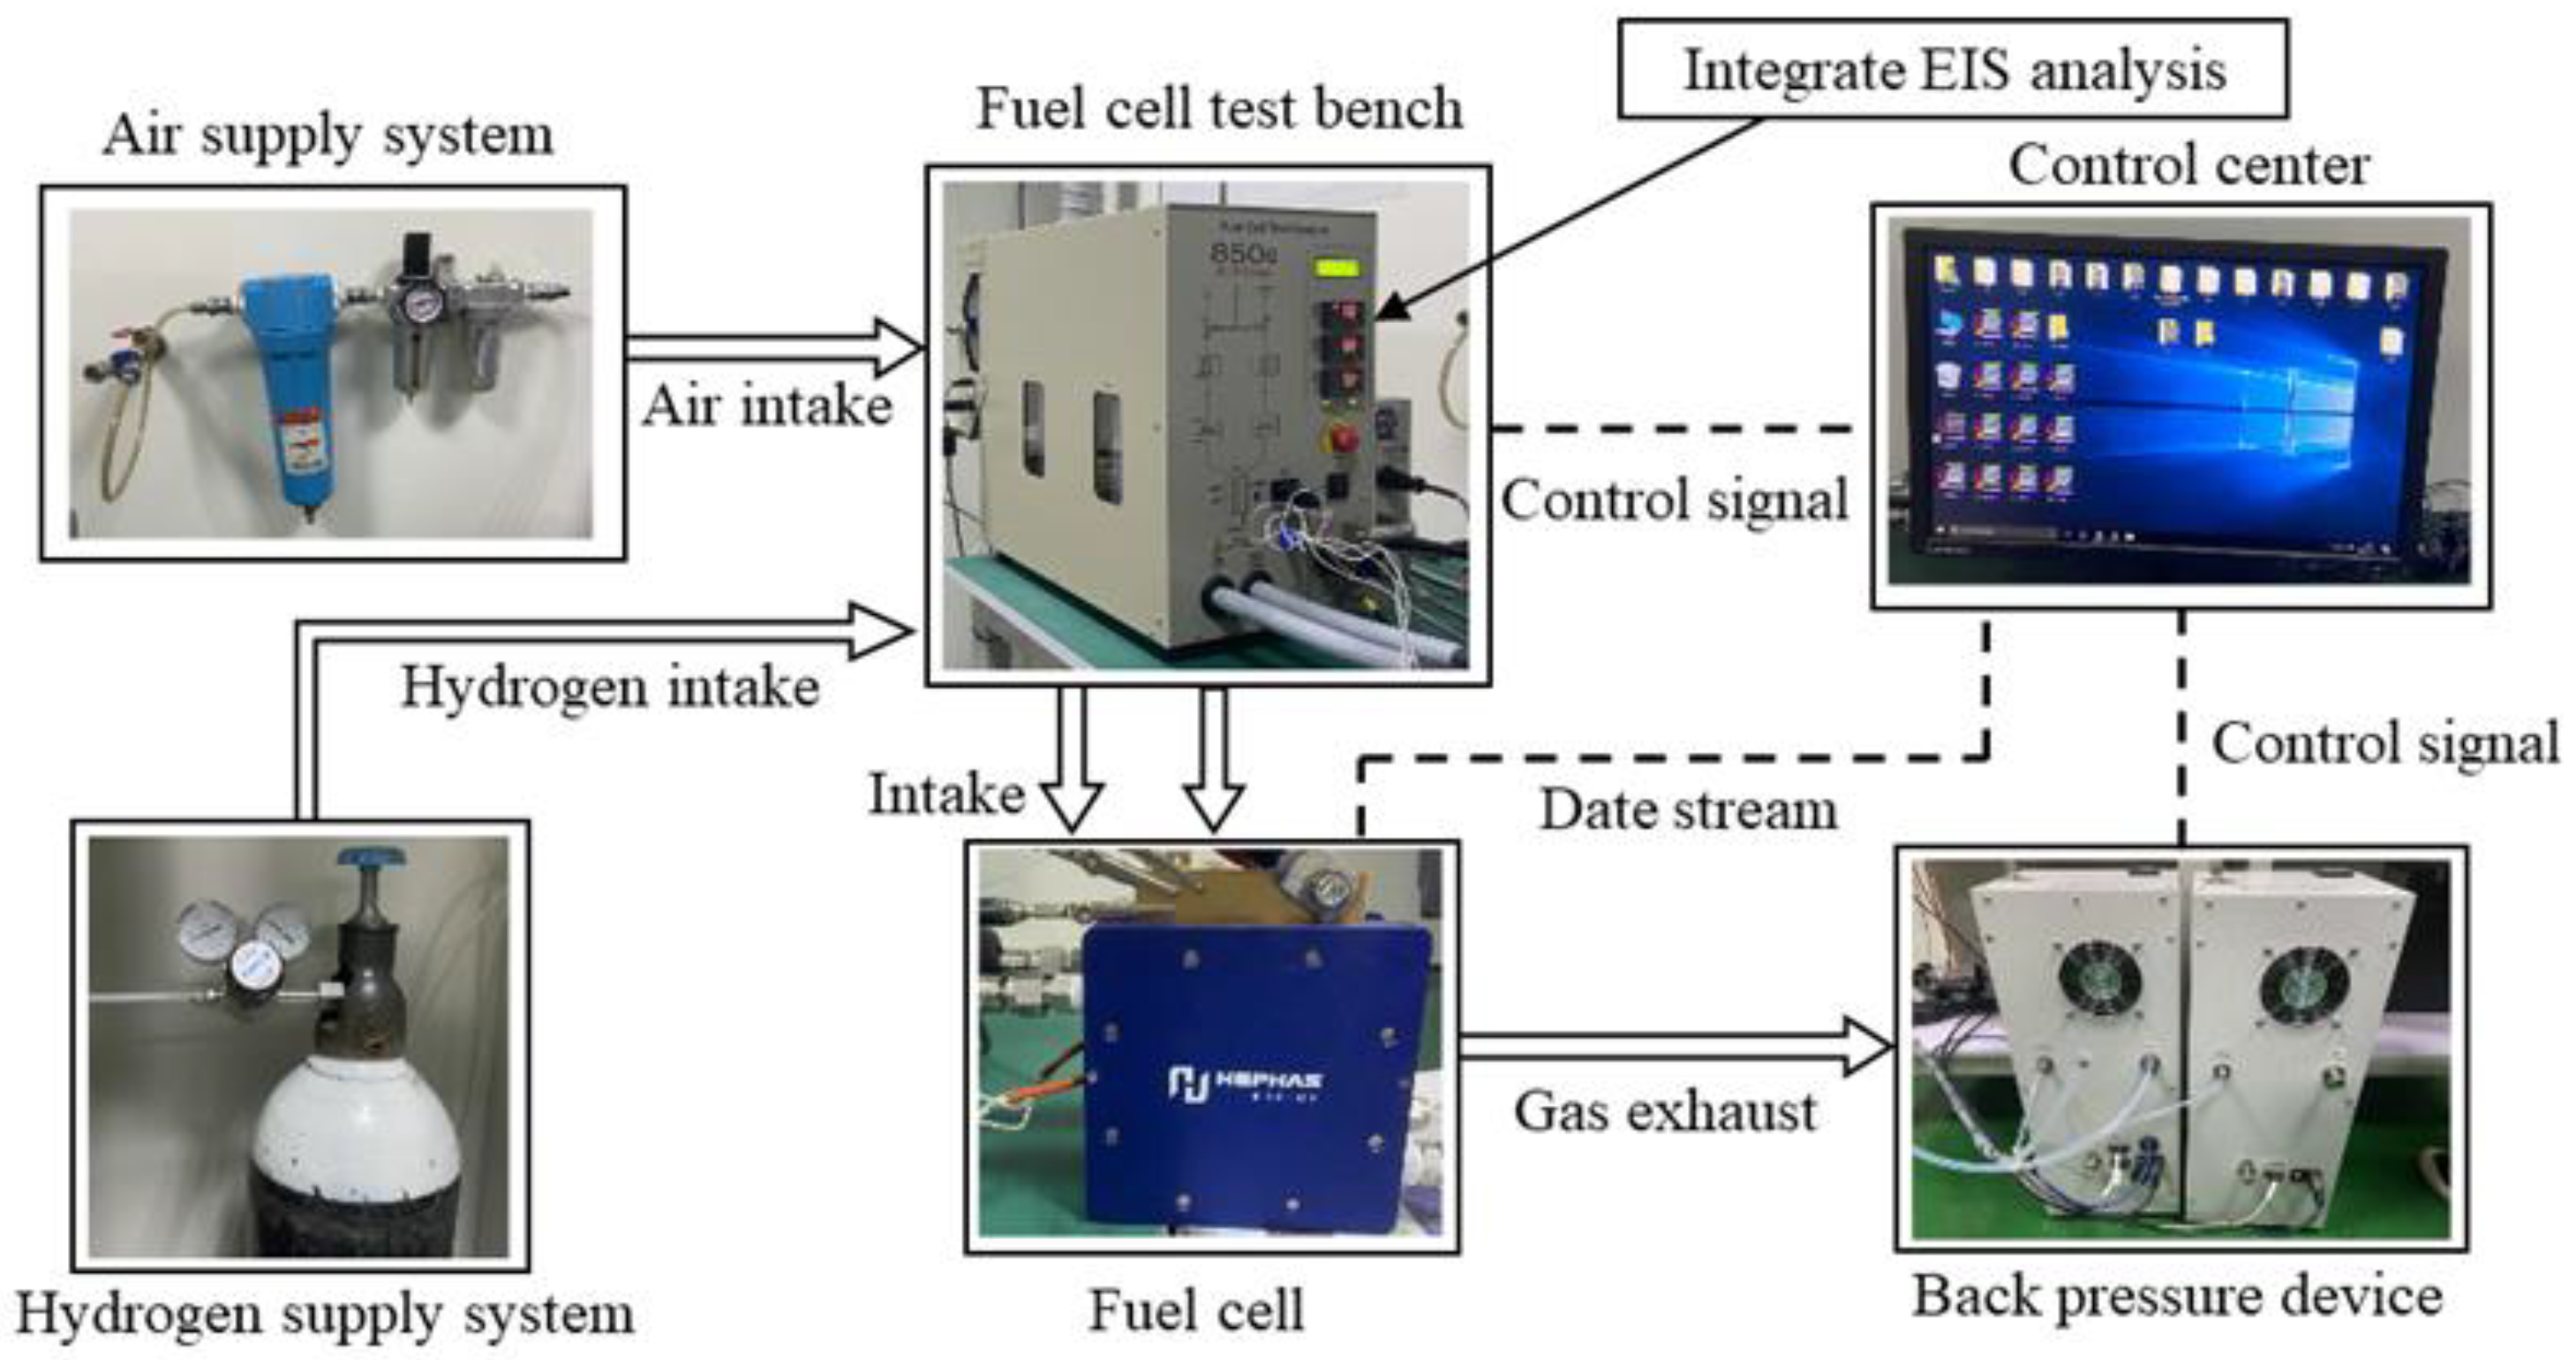
The EIS of the fuel cell under different inlet pressure, air stoichiometry, and humidity are measured through the experiment. The four typical equivalent circuit models are selected for comprehensive comparison and analysis from the perspective of the fitting accuracy under different working conditions, the changing trend of the model parameters with the changes in external working conditions, and the goodness of fit.
Furthermore, the chi-square test is used to evaluate the fitting accuracy of each equivalent circuit model. It can show the deviation between the measured value of the electrochemical impedance and the model value. If the chi-square value is larger, the deviation degree will be greater; otherwise, the deviation will be smaller. The calculation formula of the chi-square test is as follows:
where
f0 is the measured value of the electrochemical impedance, and
fe is the calculation value of the equivalent circuit model.
4.1. Fitting Accuracy of the Models
4.1.1. Comparison under Different Inlet Pressure
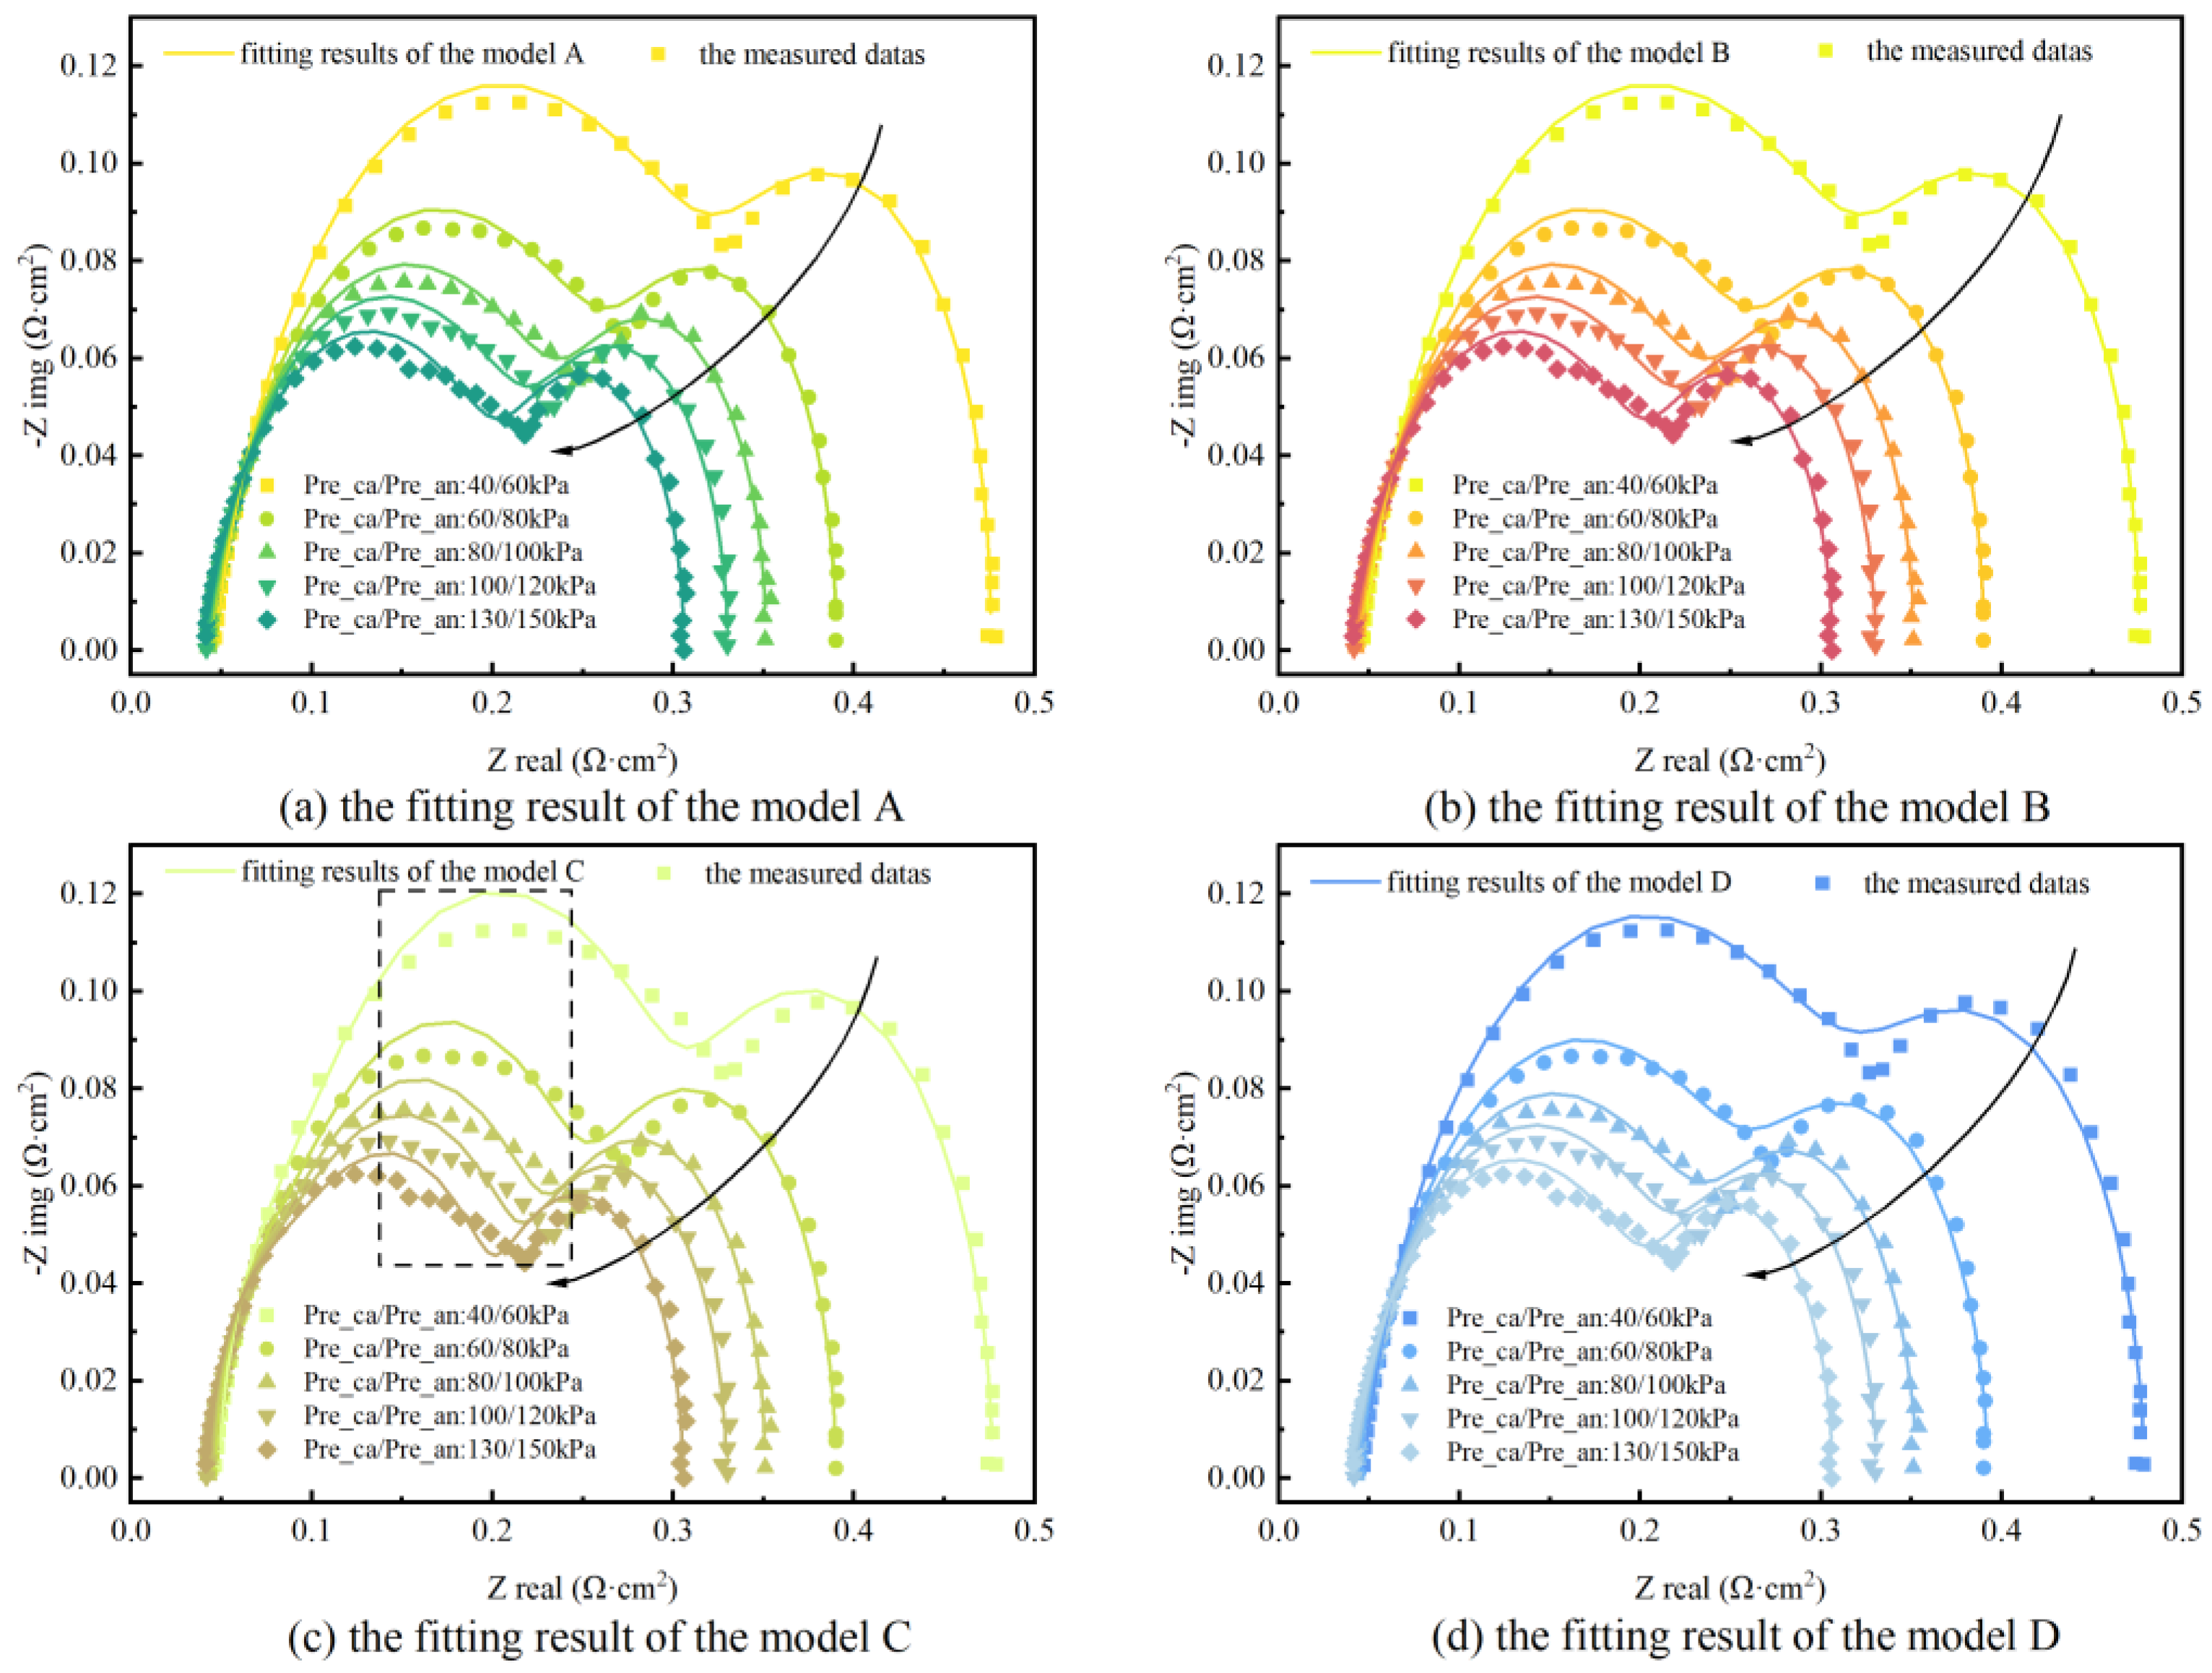
The fitting results of the equivalent circuit models under different inlet pressures are shown in
Figure 4. It can be seen that the electrochemical impedance spectroscopy of the fuel cell is sensitive to the change in inlet pressure. On the premise of keeping the inlet pressure difference between cathode and anode unchanged, with the increase in the inlet pressure, the ohmic impedance in the high-frequency region remains unchanged. However, the activation and mass transfer impedances decrease significantly. This is mainly because with the increase in the inlet pressure, the partial pressure of hydrogen and oxygen also increases. According to formula 5, the increase in the molar concentration of reactants in the catalyst layer can improve the exchange current density of the fuel cell, thus improving the kinetic characteristics.
where
n is the number of electrons transferred in the reaction,
F is the Faraday constant,
c*
R is the concentration of reactants at the three-phase interface of the catalyst layer,
f1 is the rate at which the reactants decay to the product, Δ
G++ represents the change in Gibb’s free energy,
R is the gas constant, and
T is the temperature.
In addition, the mass transfer in the flow channels is improved with the increase in inlet pressure, which is beneficial to overcome the adhesion effect in the porous medium, and accelerate the diffusion of the reaction gas.
The equivalent circuit models fit the measured impedance well. However, the fitting results of model C deviate slightly from the measured data near the middle frequency compared to other models. The main reason is that the middle frequency impedance is related to the electrochemical process of the catalyst layer in the fuel cell, and the charge distribution on the surface of the catalyst layer is not uniform. The capacitance used in model C cannot describe the charge state accurately. Therefore, a constant phase element is used instead of capacitance in some papers.
Further,
Table 2 shows the chi-square values of the model fitting results under different inlet pressure. It can be seen that the chi-square values are around 10
−3, which shows a good fitting result. In the four equivalent circuit models, the fitting accuracy of model A and model D are the same, and the difference between them is only 0.8%. Model B has the highest fitting accuracy, which is 24.7% higher than that of model C. It is generally considered that the contribution of the anode activation to the impedance is negligible due to the fast HOR kinetics [
36]. Therefore, the anode model is not considered in the model A and D. However, D. Malevich et al. [
37] also reported that the charge transfer resistance and diffusion resistance of the electrochemical reaction at the anode cannot be ignored when the fuel cell operates at a current density of 0.6 A·cm
−2. Perhaps, for this reason, model B with the anode activation loss has the best fitting result.
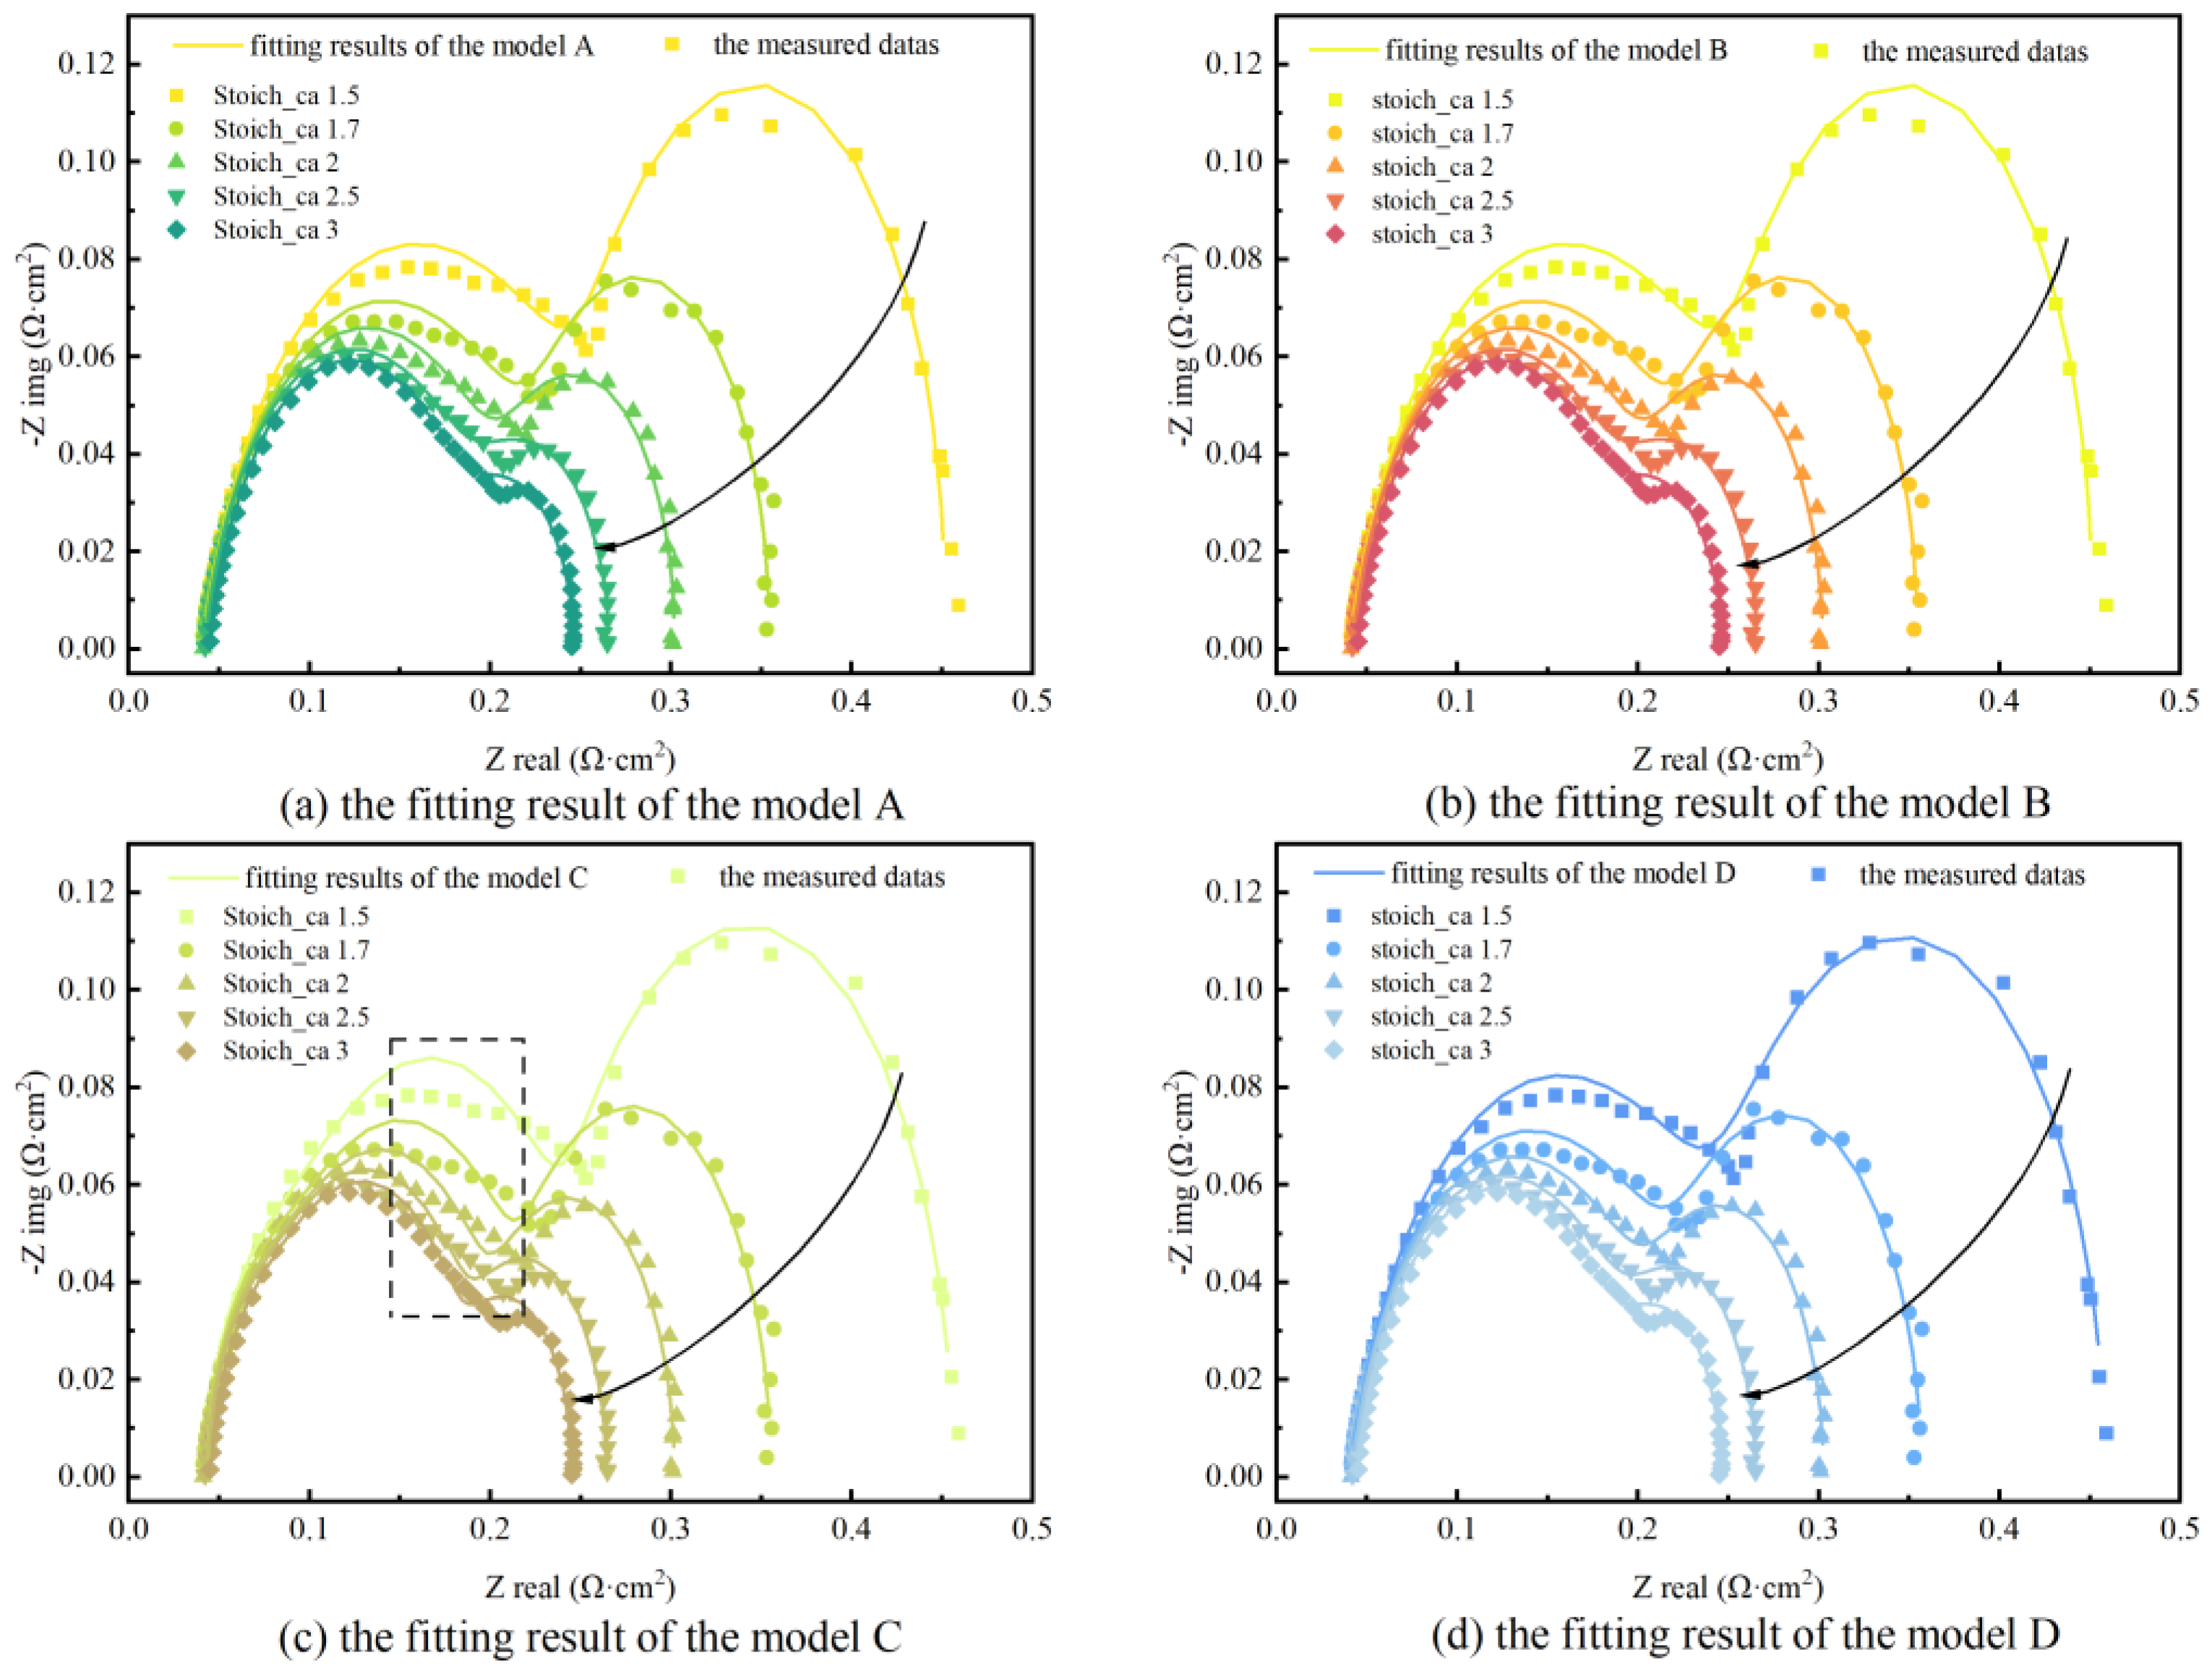
4.1.2. Comparison under Different Air Stoichiometry
Figure 5 shows the fitting results of each equivalent circuit model under different air stoichiometry. Air stoichiometry has a significant impact on the mass transfer impedance of the fuel cell. With the decrease in air stoichiometry, the liquid water formed at the cathode cannot be completely blown away, which affects the oxygen transport in the gas diffusion layer, increasing mass transfer loss. It can be found from the figure that the low-frequency arc becomes larger gradually as the air stoichiometry decreases. Meanwhile, the decrease in air stoichiometry leads to the decrease in oxygen molar concentration in the catalyst layer and the increase in activation loss, and the overall ohmic impedance changes little.
Model A–D can fit the measured data of the electrochemical impedance well. However, it can also be seen that the fitting accuracy of model C in the middle frequency needs to be improved. This can also be verified by the chi-square test of four equivalent circuit models under different air stoichiometry. The chi-square values of the fitting results of four equivalent circuit models under different air stoichiometry are shown in
Table 3. The average chi-square values of the fitting results corresponding to A–D are 1.86 × 10
−3, 1.71 × 10
−3, 2.22 × 10
−3, 1.88 × 10
−3, respectively. It can be seen that the fitting accuracy of model B is the best and that of model C is the worst. The main reason is that air stoichiometry can not only affect the mass transfer process of the fuel cell, but also can affect the activation process. For the activation loss of the fuel cell, a constant phase element compared to a capacitance can more accurately reflect the electrochemical reaction process in the fuel cell. Moreover, the anode activation loss has a certain influence on the measurement results in this experiment; therefore, model B can better fit the measurement data. The chi-square values of model A and model D are almost the same under the same air stoichiometry. The difference between model A and model D is that model A uses a constant phase element for the mass transfer process, while model D uses a capacitance.
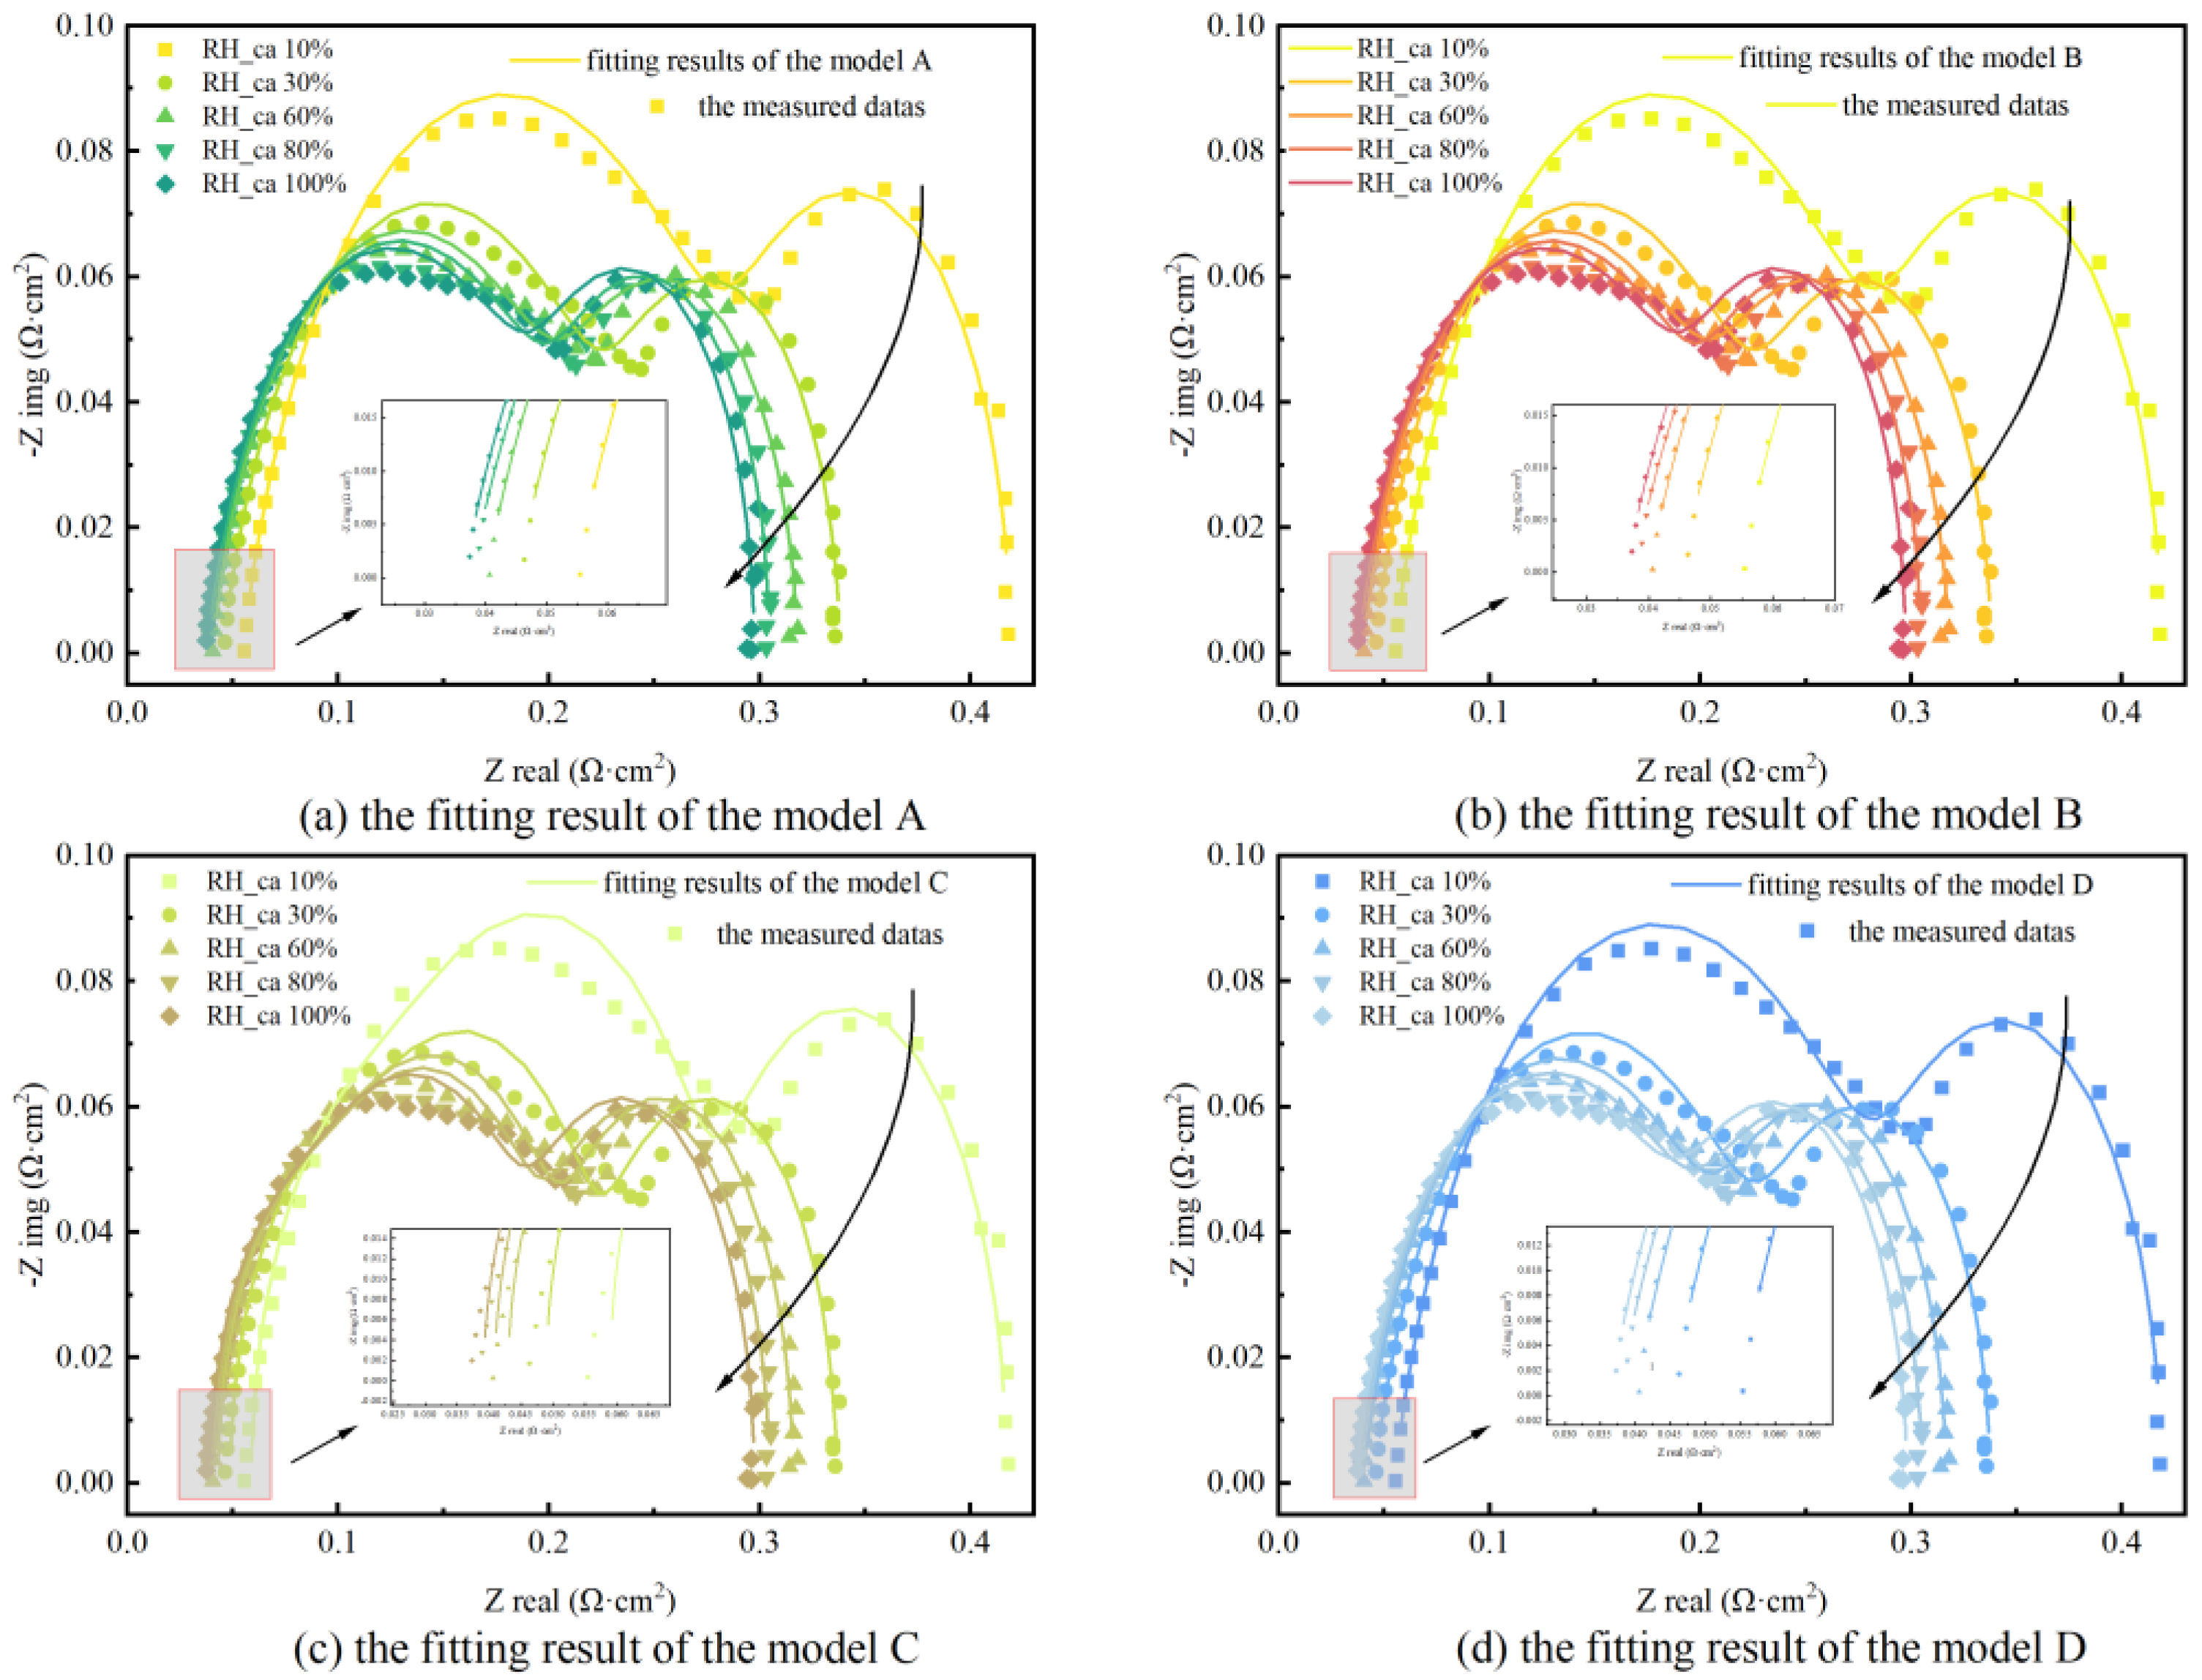
4.1.3. Comparison under Different Air Humidity
The fitting results of each equivalent circuit model under different air humidity are shown in
Figure 6. It is found that the high-frequency intercept with the real axis and the impedance in middle and low-frequency regions gradually decreases when the air humidity varies from 10% to 80%. The main reason is that the conductivity of the membrane in the fuel cell is related to the water content in the membrane, as the air humidity increases, the water content in the membrane increases; thus, the conductivity of the membrane will increase and the ohmic resistance will decrease. In addition, the electrochemically active surface area (ESA) of the fuel cell is a function of the cathode humidity. The decrease in air humidity leads to a decrease in ESA and an increase in the difficulty of the cathode electrochemical reaction [
28]. However, the air humidity is not as large as possible. Usually, 100% air humidity will cause excess water to block the flow channel and the pores of the diffusion layer. If it cannot be removed in time, flooding will occur. This may cause the increase in charge transfer loss and mass transport loss.
The fitting values of four equivalent circuit models and measured values under different air humidity are very close, especially model B. According to the chi-square values of the four equivalent circuit models under different air humidity listed in
Table 4, the minimum average chi-square value is 1.37 × 10
−3 from model B, which indicates that the fitting data of model B are most close to the measured data. The average chi-square values of other models are 2.06 × 10
−3, 2.35 × 10
−3 and 2.07 × 10
−3, respectively, corresponding to model A, model C, and model D. According to the literature [
38], if the chi-square value of the model is lower than 1 × 10
−2, the fitting accuracy of the model is within the acceptable range. The fitting accuracy of the four models meets the above conditions. It can also be found that the fitting accuracy of model A and model D is still similar under different air humidity, and that of model C is the worst. Because the interface inside the fuel cell is actually in a non-ideal state that cannot be described by the capacitance. This indicates that the fitting accuracy of the model is related to the structure of the model, and has nothing to do with the external working conditions.
4.2. The Model Goodness of Fit
In general, the fitting accuracy of the model increases with the increase in the model complexity, but it also brings a common problem of overfitting when the model is too complex. Therefore, the key point of the model selection is to find the optimal balance between the complexity and fitting accuracy. Akaike information criterion (AIC) is a standard to measure the model goodness of fit. It comprehensively evaluates the complexity of the model and accuracy of the fitting results by adding a penalty term of the model complexity. It is given by the following formula [
39]:
where
k is the number of model parameters,
n is the number of data samples, and
SSR is the residual sum of squares.
As the complexity of the model increases, the AIC value decreases, but when the complexity continues to increase, and the accuracy cannot be further improved significantly, the AIC value will increase. Therefore, the goal of the model selection is the smallest AIC.
The complexity of the model is related to the model parameters. The numbers of the parameters in both model A and C are seven, that in model D is six. The number of parameters in model B is at most nine, which means that the complexity of model B is the highest. Average AIC values of the fitting results of the four equivalent circuit models under different inlet pressure, air stoichiometry, and air humidity are listed in
Table 5 and compared under the same working condition. It can be seen from the table that the average AIC value of model C is the largest under each working condition, which indicates that the GOF of model C is the worst. This is mainly due to the lowest fitting accuracy of model C. Model B has the highest fitting accuracy. However, it only has the smallest average AIC under different air humidity. The reason is that model B has the most complex structure and the problem of the overfitting occurs under different inlet pressure and air stoichiometry. Meanwhile, compared to model B, the average AIC value of model A is smaller. This indicates that model A is a preferred choice for the electrochemical impedance spectroscopy analysis under different inlet pressure and air stoichiometry. In addition, the average AIC value of model A is slightly smaller than that of model D under the same working condition, mainly because model A and model D have similar structures. Further, from the point of view of the most suitable working conditions for each equivalent circuit model. The average AIC values of the model A and D are the lowest under different inlet pressures. Model B and C have the lowest average AIC value under different air humidity.
4.3. Changing Trend of the Model Parameters
4.3.1. Changing Trend under Different Inlet Pressure
Figure 7 shows the parameter variations of the four equivalent circuit models under different inlet pressures. It can be seen from the figure that
R0,
RC, and
Rmt in model A and D;
R0 and
RA in model B; and
R0 and
Rmt in model C gradually decrease with the increase in inlet pressure. The main reason is that when the inlet pressure increases, it is conducive to overcome the adhesion effect in the porous medium and improve the mass transfer. The resistance of mass transfer gradually decreases. Meanwhile, with the increase in inlet pressure, the molar concentration of hydrogen and oxygen increases and improves the electrochemical reaction; thus, the resistance of charge transfer is reduced. However,
RC in model B and
RA and
RC in model C do not show a monotonic relationship with the inlet pressure, which may be related to the structure of the model and the fitting algorithm. In addition, the structure of model A and model D are similar, and the variation range of
Rc in model A and model D is almost the same. After normalization,
Rc in model A and model D decreases from 34.5% and 32.8% at 40/60 Pa (the left side represents the cathode inlet pressure, and the right side represents the anode inlet pressure) to −21% and −20.23% at 130/150 Pa, respectively.
At the same time, it can be also found that the CPEc−T and CPEmt−T in model A, the CA in model B, the Cmt in model C, and the CPEc and Cmt in model D have a linear relationship with the inlet pressure. This is because the redistribution of charge at the interface inside the fuel cell also leads to the change in capacitance. However, due to the complexity of the mechanism of charge transfer and distribution in the fuel cell, the variation in the fitting parameters from the capacitance or constant phase element is random, which needs to be further studied and analyzed.
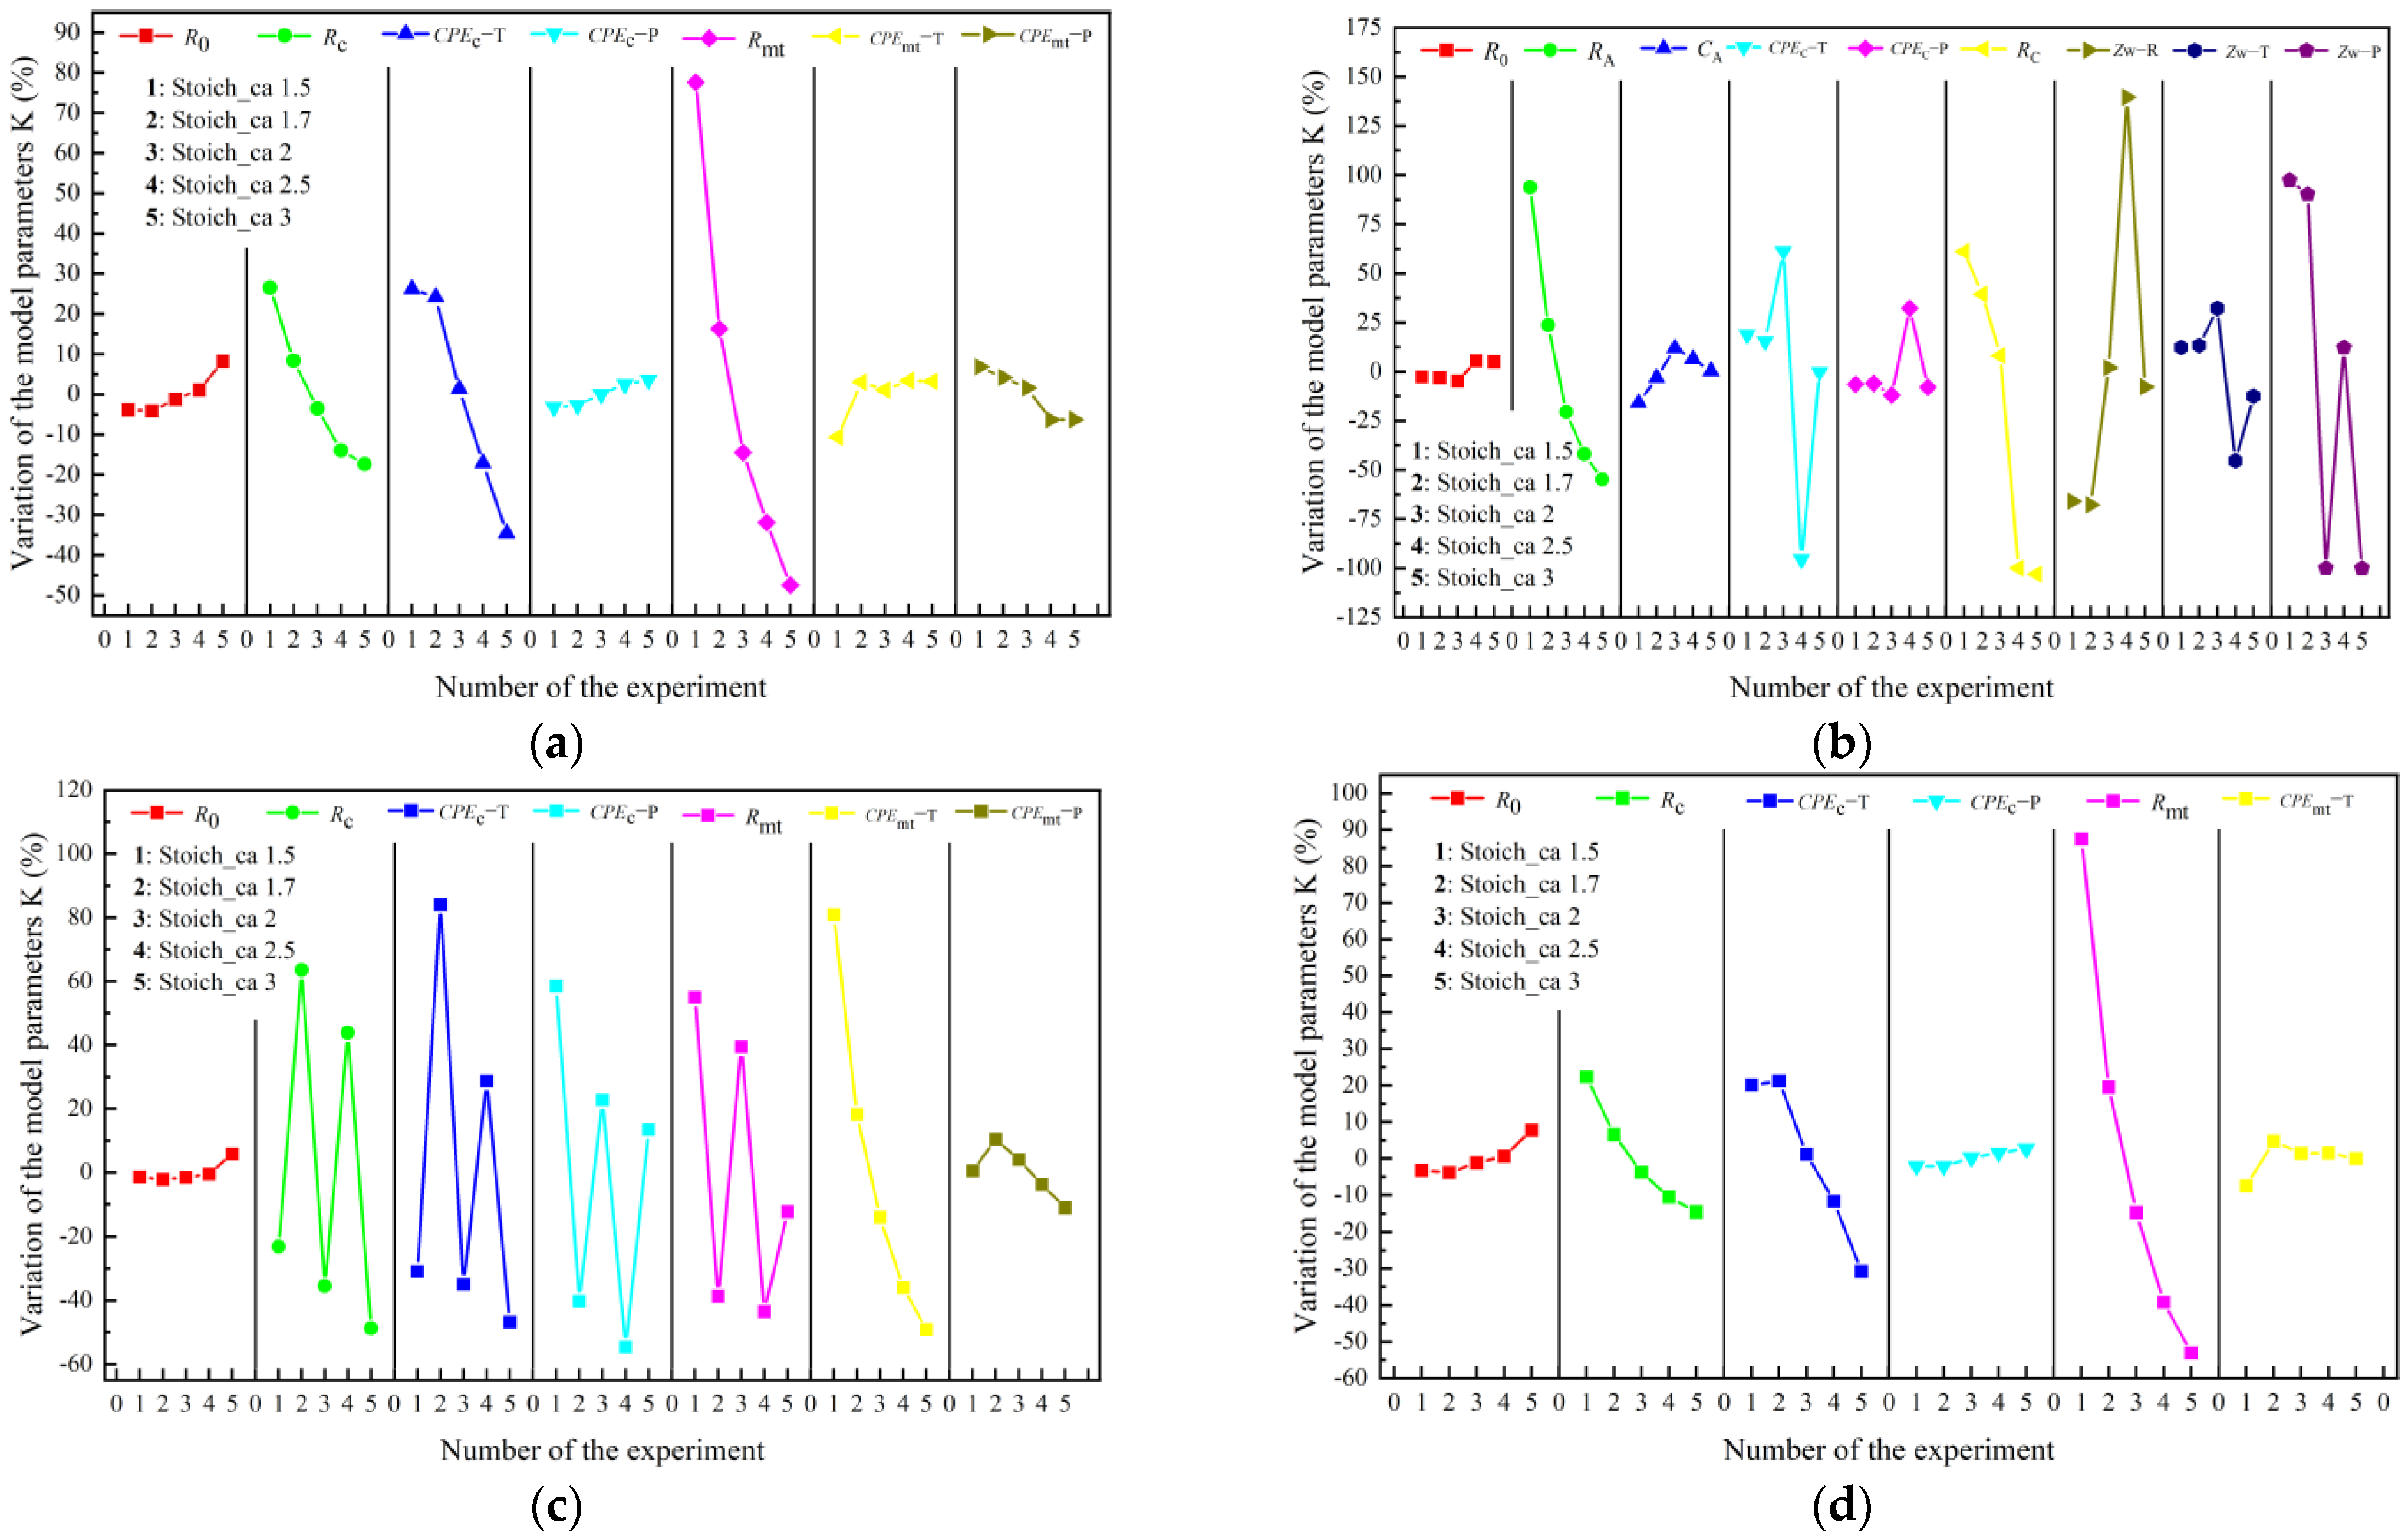
4.3.2. Changing Trend under Different Air Stoichiometry
When air stoichiometry increases, the air velocity increases and blows away the excess liquid water, thus improving the convection in the channel. The transport capacity of the oxygen in the gas diffusion layer is enhanced, and the resistance of mass transfer is reduced. The parameter variations of each equivalent circuit model under different air stoichiometry are shown in
Figure 8. It can be seen from the figure that
Rmt in model A,
Rmt in model C, and
Rmt in model D show a monotonic decreasing trend, and their changing ranges are roughly the same, ranging from 80% to 40%. In addition,
Rc in model A,
RA, and
RC in model B, and
Rc in model D also show a linear relationship with the air stoichiometry, the reason is that with the increase in air stoichiometry, the molar concentration of oxygen in the catalyst layer increases, and the resistance of charge transfer will decrease. In addition, literature studies have shown that the process of charge transfer in the fuel cell is also affected by mass transfer. Pivac et al. studied the effect of air stoichiometry on the fuel cell and reported similar results [
34]. However, the change in resistance of charge transfer is smaller than that of mass transfer. For example, the variation in
Rc in model A is 43.9%, while that of
Rmt is 125.1%. This is also consistent with the fact that the air excess coefficient has a greater influence on the mass transfer loss than the activation loss. For the fitting parameters from the capacitance or constant phase element, there is also a linear relationship between the
CPEc−T and
CPEc−P in model A and air stoichiometry, and so do these of model D.
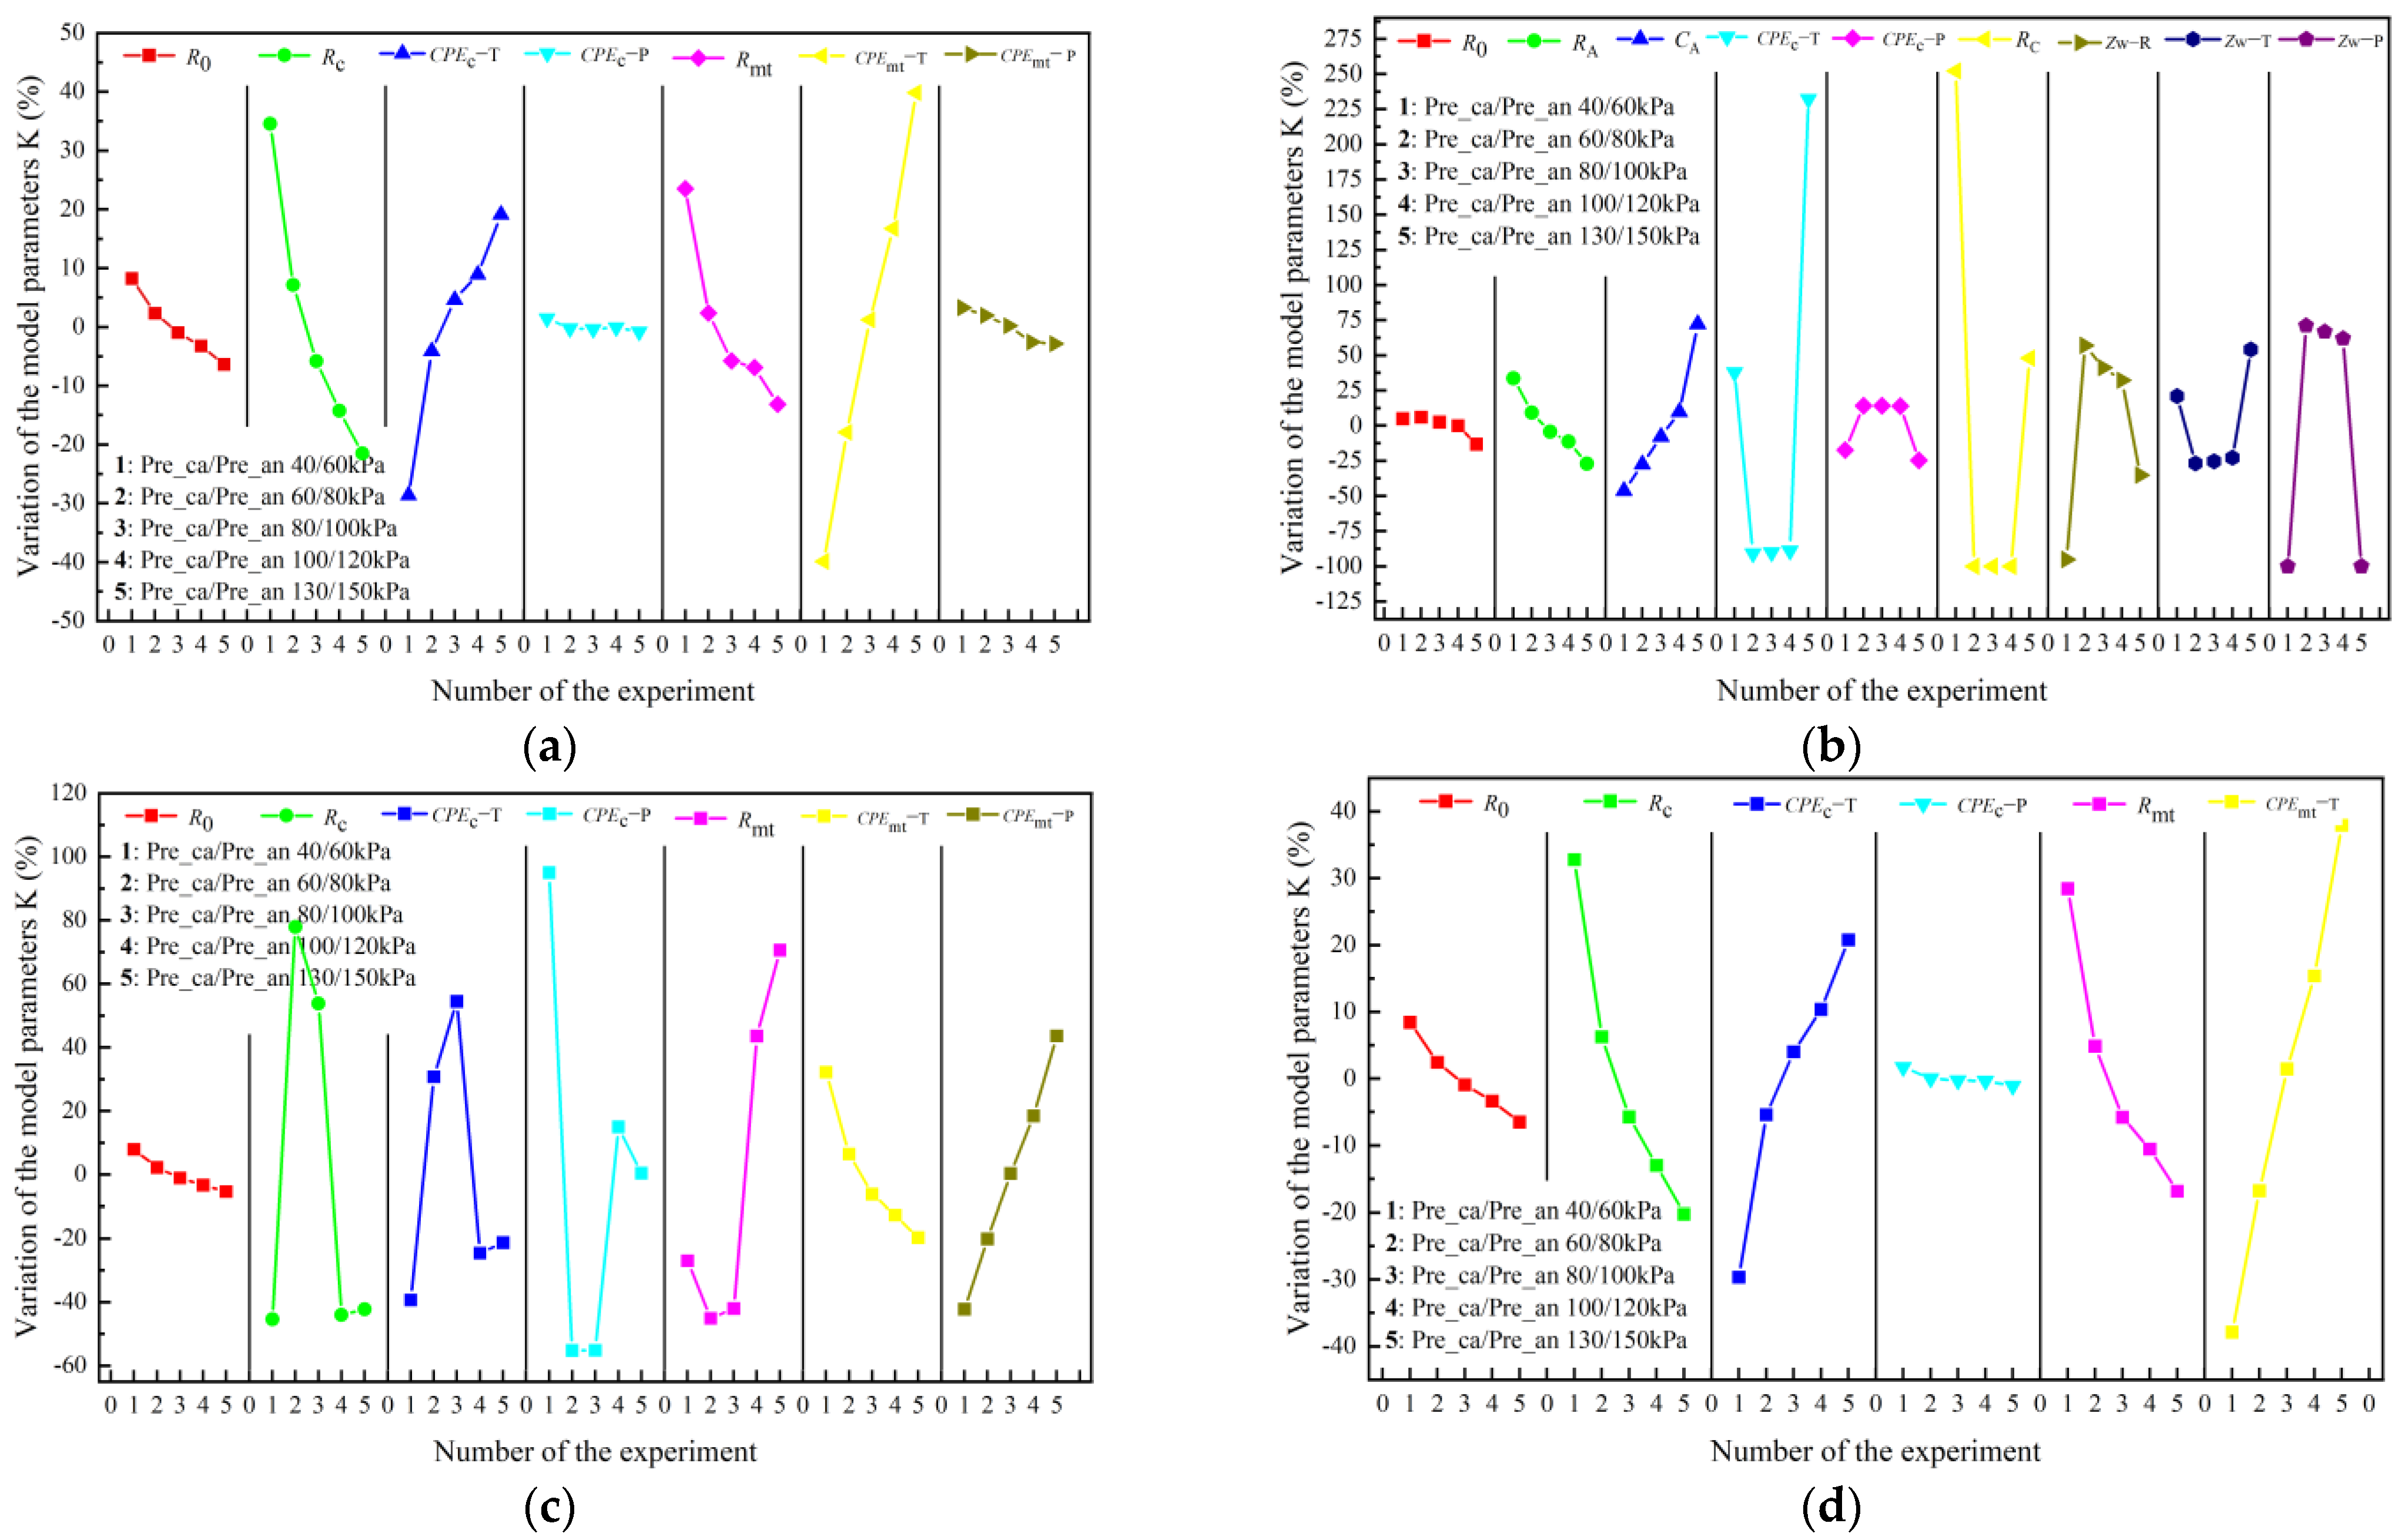
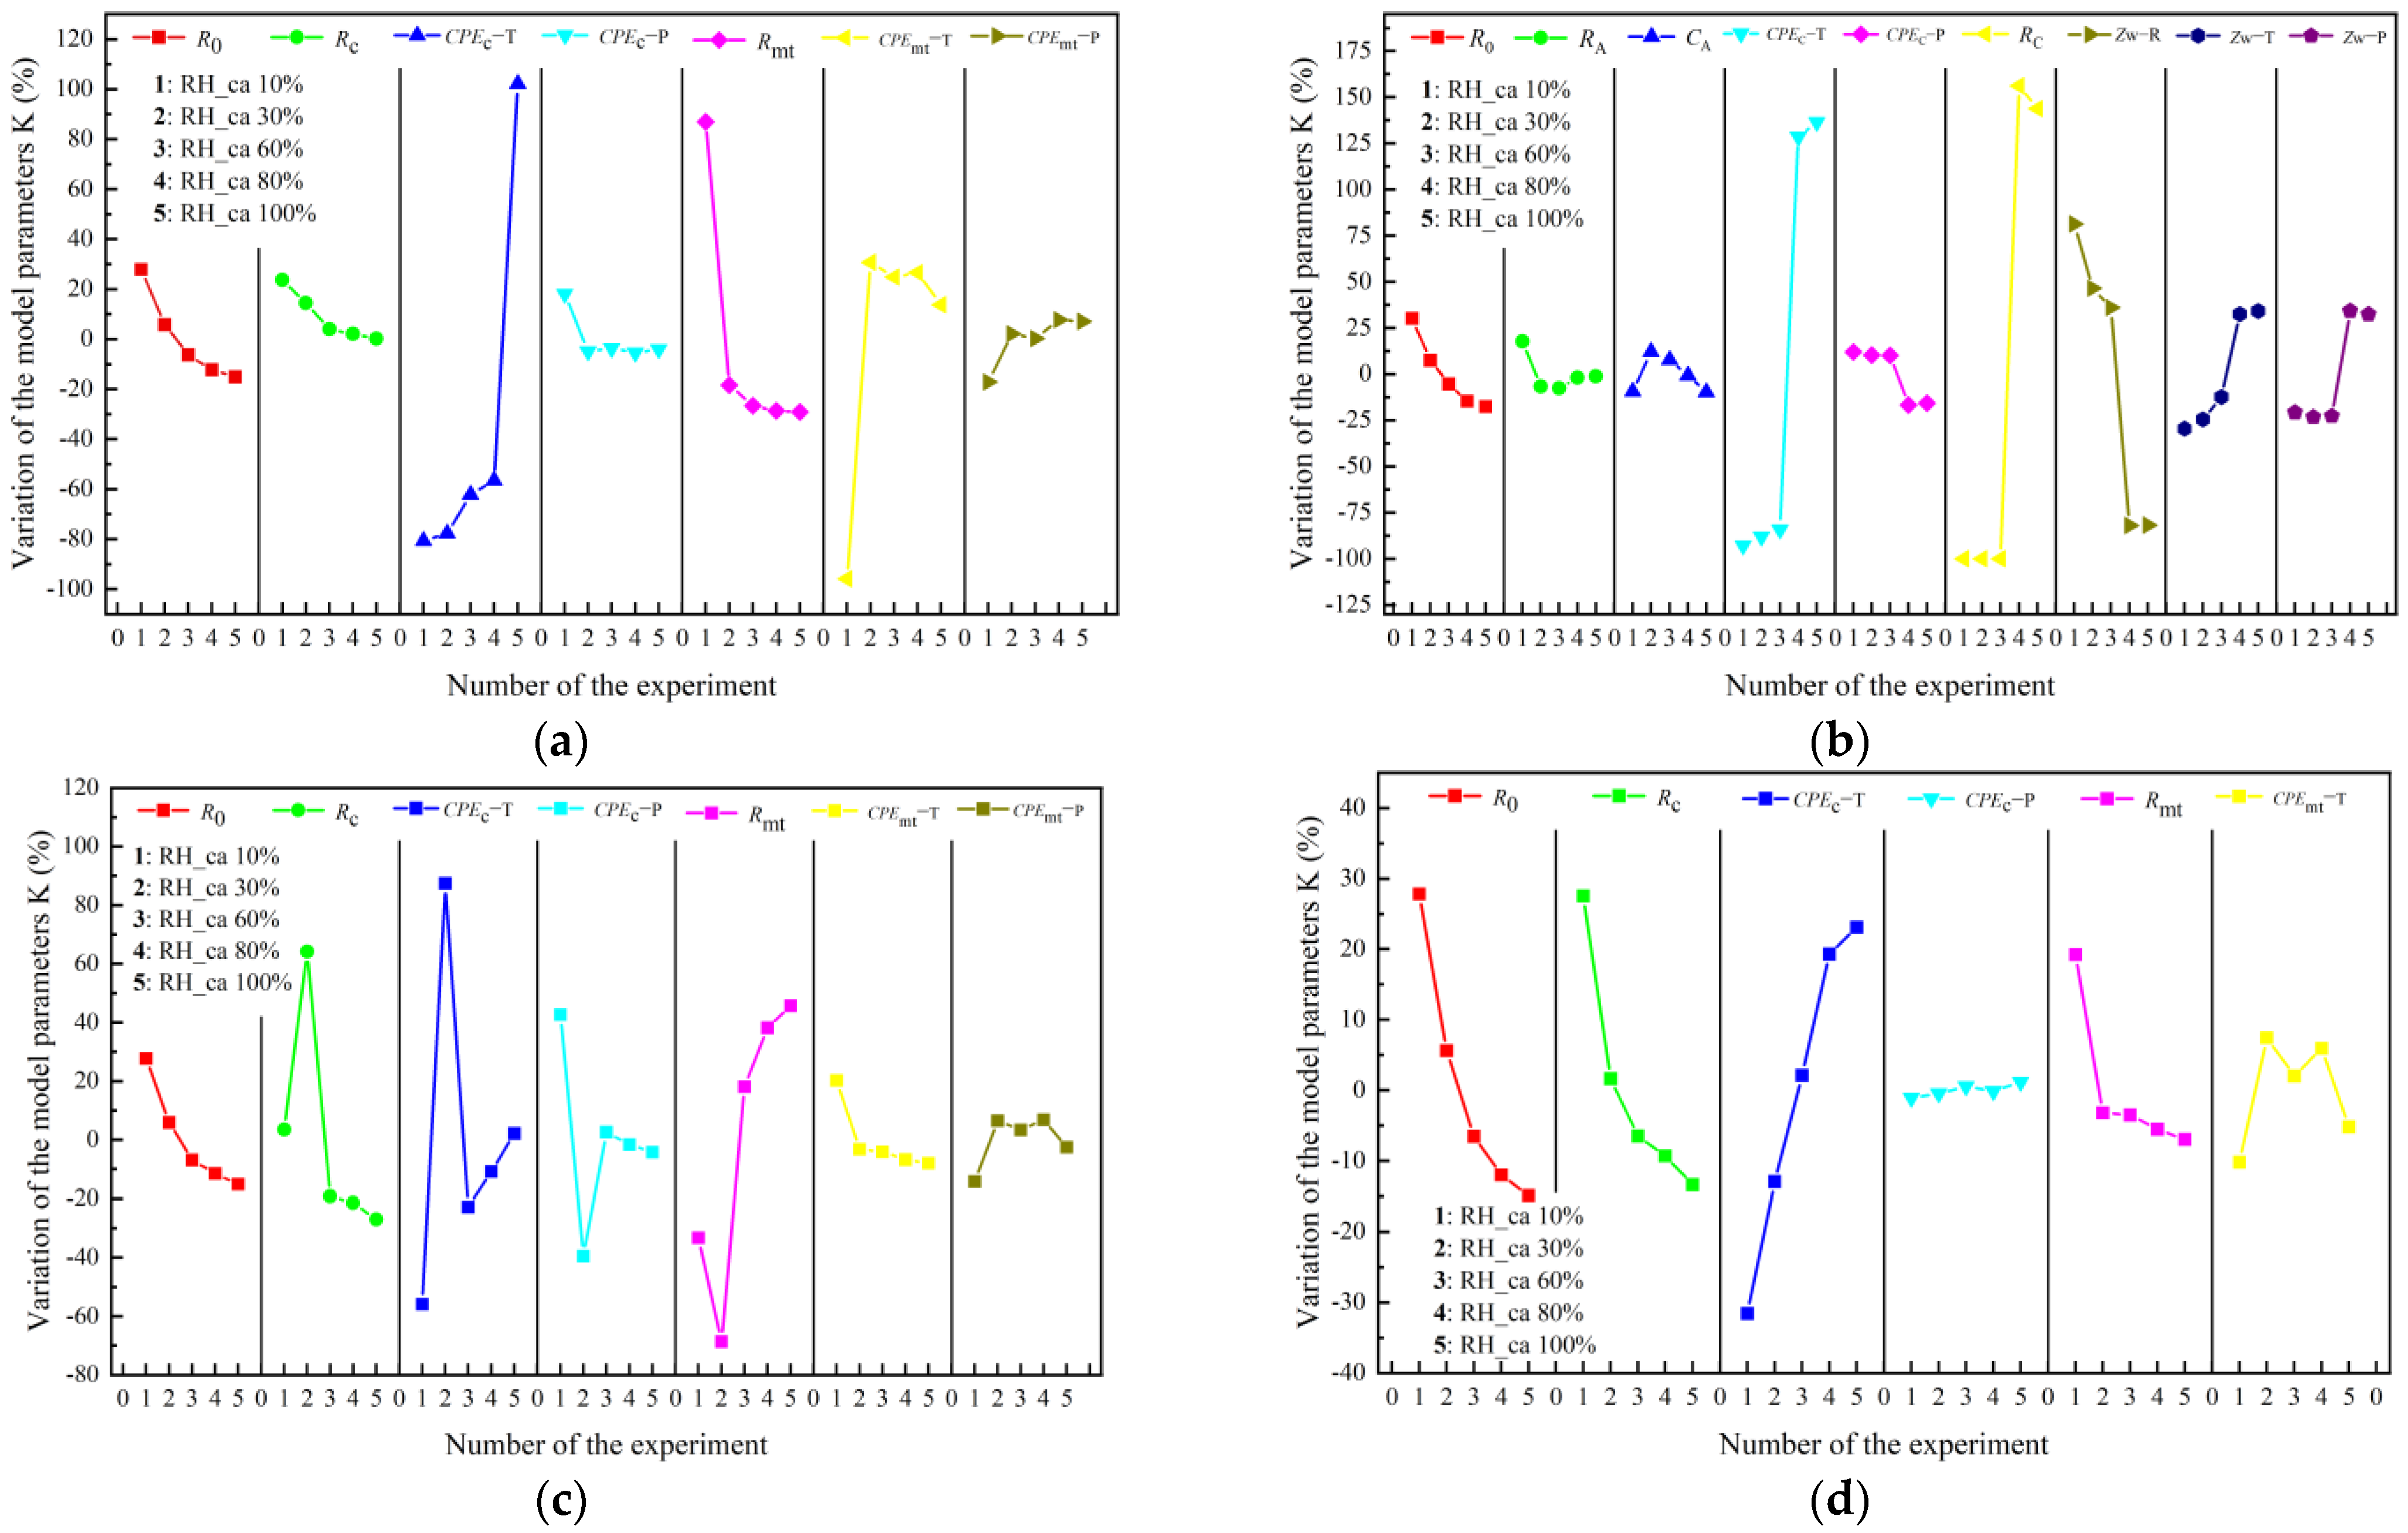
4.3.3. Changing Trend under Different Air Humidity
Figure 9 shows that the parameter change trend of the four equivalent circuit models under different air humidity. It can be seen that
R0 in model A–D gradually decreases with the increase in air humidity. This is because the ohmic resistance is mainly determined by the membrane conductivity. As the air humidity increases, the reaction gas brings more water to the membrane, causing the membrane conductivity to increase. At the same time, the water content in the membrane is beneficial to the transport of the oxygen; therefore, the
Rmt in the model A and D, and
Zw−T in the model B gradually decrease as the air humidity increases. However, the higher water content in the membrane will cause flooding of the gas diffusion layer and increase oxygen transport resistance. In addition,
Rc in model A and
Rc in model D also show monotonic decreasing changes with air humidity increasing. The reason is that with the increase in air humidity, the proton mobility is enough to affect the oxygen reduction reaction, which will decrease the resistance of charge transfer in the fuel cell. However,
RA and
RC in the model B and C do not show the monotonic trend. For the fitting parameters from the capacitance or constant phase element, the
CPEc−T in the model A and B has a monotonic trend with the change in air humidity.
5. Conclusions
In this paper, four typical equivalent circuit models for fitting electrochemical impedance spectroscopy of the fuel cell are comprehensively compared and studied. The impedance data of the fuel cell under different inlet pressure, operation temperature, air stoichiometry, and air humidity are measured through experiment. The fitting accuracy under different working conditions, the changing trend of the model parameters with the changes in external working conditions, and the model goodness of fit are analyzed. The main conclusions are as follows:
(1) The fitting accuracy mainly depends on the model structure. The fitting accuracy of the model with the Warburg element is the best under each working condition, and that of the model with capacitances is the lowest. The fitting accuracy of the model with constant phase elements and the model with the constant phase element and capacitance is the same due to the similar structures.
(2) The model selection should consider not only the fitting accuracy, but also the complexity of the model. AIC was used to comprehensively evaluate the accuracy and complexity of the model. The average AIC value of model A is the lowest under different inlet pressure and air stoichiometry, and under different air humidity, that of model B is the lowest.
(3) Some model parameters in the models tend to show a monotonic trend with the change in the working conditions, but the parameters with monotonic changes are differences between the models, which may be caused by the structure of the model and the fitting algorithm. Therefore, different parameters can be selected to represent the state of the fuel cell for different models.
The above conclusions can provide an important reference for the internal state analysis, estimation, and diagnosis of the fuel cell based on the equivalent circuit modeling analysis.


