Article

Prediction and Optimization of the Cost of Energy Resources in Greek Public Hospitals

by
Paraskevi N. Zaza
1,
Anastasios Sepetis
2 and
Pantelis G. Bagos
1,*
1
Department of Computer Science and Biomedical Informatics, University of Thessaly, 35131 Lamia, Greece
2
Business Administration Department, University of West Attica, 12244 Egaleo, Greece
*
Author to whom correspondence should be addressed.
Energies 2022, 15(1), 381; https://doi.org/10.3390/en15010381
Submission received: 9 November 2021 / Revised: 28 December 2021 / Accepted: 30 December 2021 / Published: 5 January 2022

Abstract

:
The continuous operation and the specialized conditions needed for safely delivering healthcare services make hospitals among the most expensive buildings. Several studies in different countries have investigated the potential role and contribution of macroscopic indices of hospitals in total energy requirements. In this work, we tried to investigate the energy requirements of Greek hospitals in terms of cost. We collected data from all public hospitals in Greece over a 2 year period (2018–2019) and evaluated the contribution of various factors in the total energy cost. The data revealed large variability by region and by hospital, even regarding structures of the same category and size. The analysis also showed that structural and operational data of each hospital differently influence the hospitals’ energy requirements. Using regression methods, we developed two models for calculating annual energy costs. One only contains hospital structural data (number of beds, type of hospital, number of employees, and the non/use of alternative energy sources such as natural gas), and it reached an R² of 0.84. The second model contains not only structural but also operational data from each hospital (number of the internal patients, number of surgeries and number of medical imaging tests), and it reached an R² of 0.87. The former model is easier to compute since it only relies on data that can be easily gathered, but the latter has slightly better performance. These tools can help the Ministry of Health and hospitals’ management to identify the factors that contribute to the energy cost in order to plan targeted interventions, be well-prepared regarding budgeting, and be able to progressively measure, monitor, and improve the environmental footprint of hospitals by investing in renewable energy resources.

Graphical Abstract

1. Introduction

The World Health Organization (WHO) and the European Union (EU) healthcare system are in favor of the Sustainable Development Goals, and the implementation of public environmental, social, and corporate governance (ESG) policies in hospitals is a new research field. Transforming Europe’s economy into a greener, social, and more resilient and circular system is one of the commitments of the European Union. Healthcare systems are among the largest industries worldwide, as well as one of the most expensive ones. The public expenditure on healthcare and long-term care in countries that belong to the Organization for Economic Co-operation and Development (OECD) is set to reach almost 9% of gross domestic product (GDP) in 2030 and as much as 14% by 2060. Europe’s healthcare sector accounts for 10% of GDP, 15% of public expenditure, and 8% of the EU’s workforce [1]. The WHO suggests that the 2030 agenda for Sustainable Development Goals is an opportunity for governments and the international community for long-term commitment in order to improve health as a central element of development. The 17 accompanying Sustainable Development Goals (SDGs) set out the priority areas of action. Goal 3 (to ensure healthy lives and promote wellbeing for all at all ages) and Target 3.8 on universal health coverage (UHC) highlight the importance of ensuring that all people and communities have access to quality health services without risking financial hardship [2,3].
The benefits of the Sustainable Development Goals and sustainable finance in the healthcare system are more important than ever before. For the Ministries of Health and hospital administrations, sustainable financing by integrating environmental, social, and governance (ESG) factors into investment decision making should be at the top of their priorities. We proceeded with this study in the context of these points and because we believe that this category of hospital expenditure, i.e., the cost of energy resources, should be considered separately from the other categories of hospital expenditure due to their different effects on the environment, health, and the economy, as well as due to the different types of interventions required in order to monitor, control, predict, and optimize them.
Hospitals are complex buildings with huge energy requirements compared to other types of buildings of the same scale such as schools, universities, office buildings, and banks [4]. Unlike other buildings, hospitals operate on a continuous basis and are occupied by thousands of people, many of whom are vulnerable to environmental conditions that require specific temperature conditions and indoor air parameters, especially in operating rooms and treatment rooms. In many studies, it has been documented that the thermal requirement of hospitals is much higher than that of other commercial buildings [5,6]. Thermal costs include heating and cooling, and the balance between these two may vary depending on the environmental conditions [5,7], but these costs may nevertheless reach 50% of the total energy requirements of a hospital [7]. High energy intensity in healthcare facilities, particularly in hospitals, along with energy costs and associated environmental concerns make energy analysis crucial for this type of facility.
The electricity consumption of hospitals also exceeds that of many other building types due to the additional use of specialized medical equipment, laboratories, sterilization, and so on in addition to required laundries, restaurants, and food preparation facilities. Depending on the hospital size and the clinical needs of the target population, the provided services can widely vary between hospitals nominally classified as general (i.e., non-specialist). Even within hospitals, different departments vary in their electricity consumption depending on the necessary loads of the available equipment in use. For instance, wards, day clinics, and some other departments have lower consumption intensities compared to operating theatres, laboratories, and departments such as imaging and radiotherapy [8]. Predicting the loads of electrical appliances is also an important part of modeling the energy flows in buildings. In hospitals, these loads have an additional and significant impact on the overall energy requirements for heating and cooling mentioned earlier, especially for rooms used for diagnostics and medical care [9]. In general, refrigeration accounts for more than half of total electrical energy consumption, whereas user influence seems limited, since around 80% of total plug load energy consumption can be attributed to the base load [10].
Mathematical models have been proposed for developing efficiency indices that allow for management to compare the energy consumption of buildings with similar functions and detecting which ones have less efficient energetic behaviors, thus providing a reference for programming investments to optimize energy consumption [11]. Furthermore, effective energy-conservation measures have been proposed, such as the addition of thermal insulation of exposed external walls, the use of energy-efficient lamps, the use of solar collectors for sanitary hot water production, the replacement of old inefficient boilers, and the regular maintenance of central heating boilers [12]. Moreover, the use of renewable sources such as solar thermal energy, solar photovoltaic energy, and solid biomass and ground source heat pumps for heat, cooling, and electricity generation has been discussed in the literature [13].
Several studies in different countries have investigated the potential role and contribution of macroscopic indices of hospitals in total energy requirements. The countries include Spain [14,15], Germany [16], China [7], and USA [5]. In general, the total energy requirement is, as expected, dependent on the size of the building, the number of beds, the number of employees, the climate and the geographic location, the number of in-patients and out-patients, the number of ICUs, and the number of surgeries and tests performed, among other factors.
In this work, we tried to investigate the energy requirements of Greek hospitals in terms of cost. We collected data for all public hospitals in Greece over a 2 year period (2018–2019) and evaluated the contribution of the aforementioned factors in the total energy cost. The particular years were chosen because they were years with normal operating conditions, in contrast to those of 2020 and 2021 in which hospital operations all over the world were significantly changed due to COVID-19. The ultimate objective of the present study, apart from determining the contribution of the abovementioned characteristics to the total energy requirements of hospitals, was the creation of a suitable model that, based on the values of the operational and descriptive characteristics, is able to estimate the amount of specific costs on an annual basis. In this way, the Ministry of Health and the hospital management will be able to:
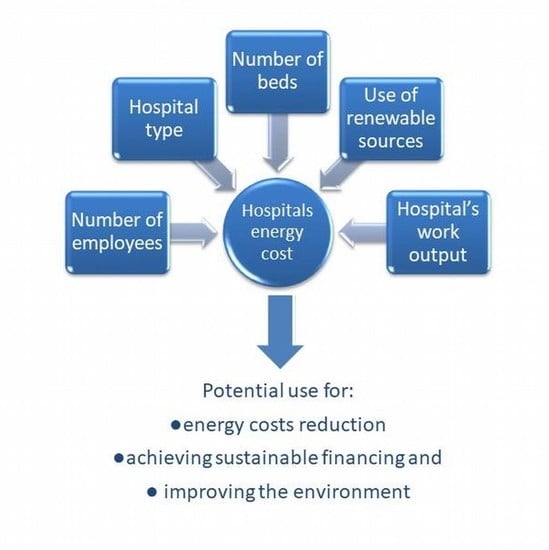
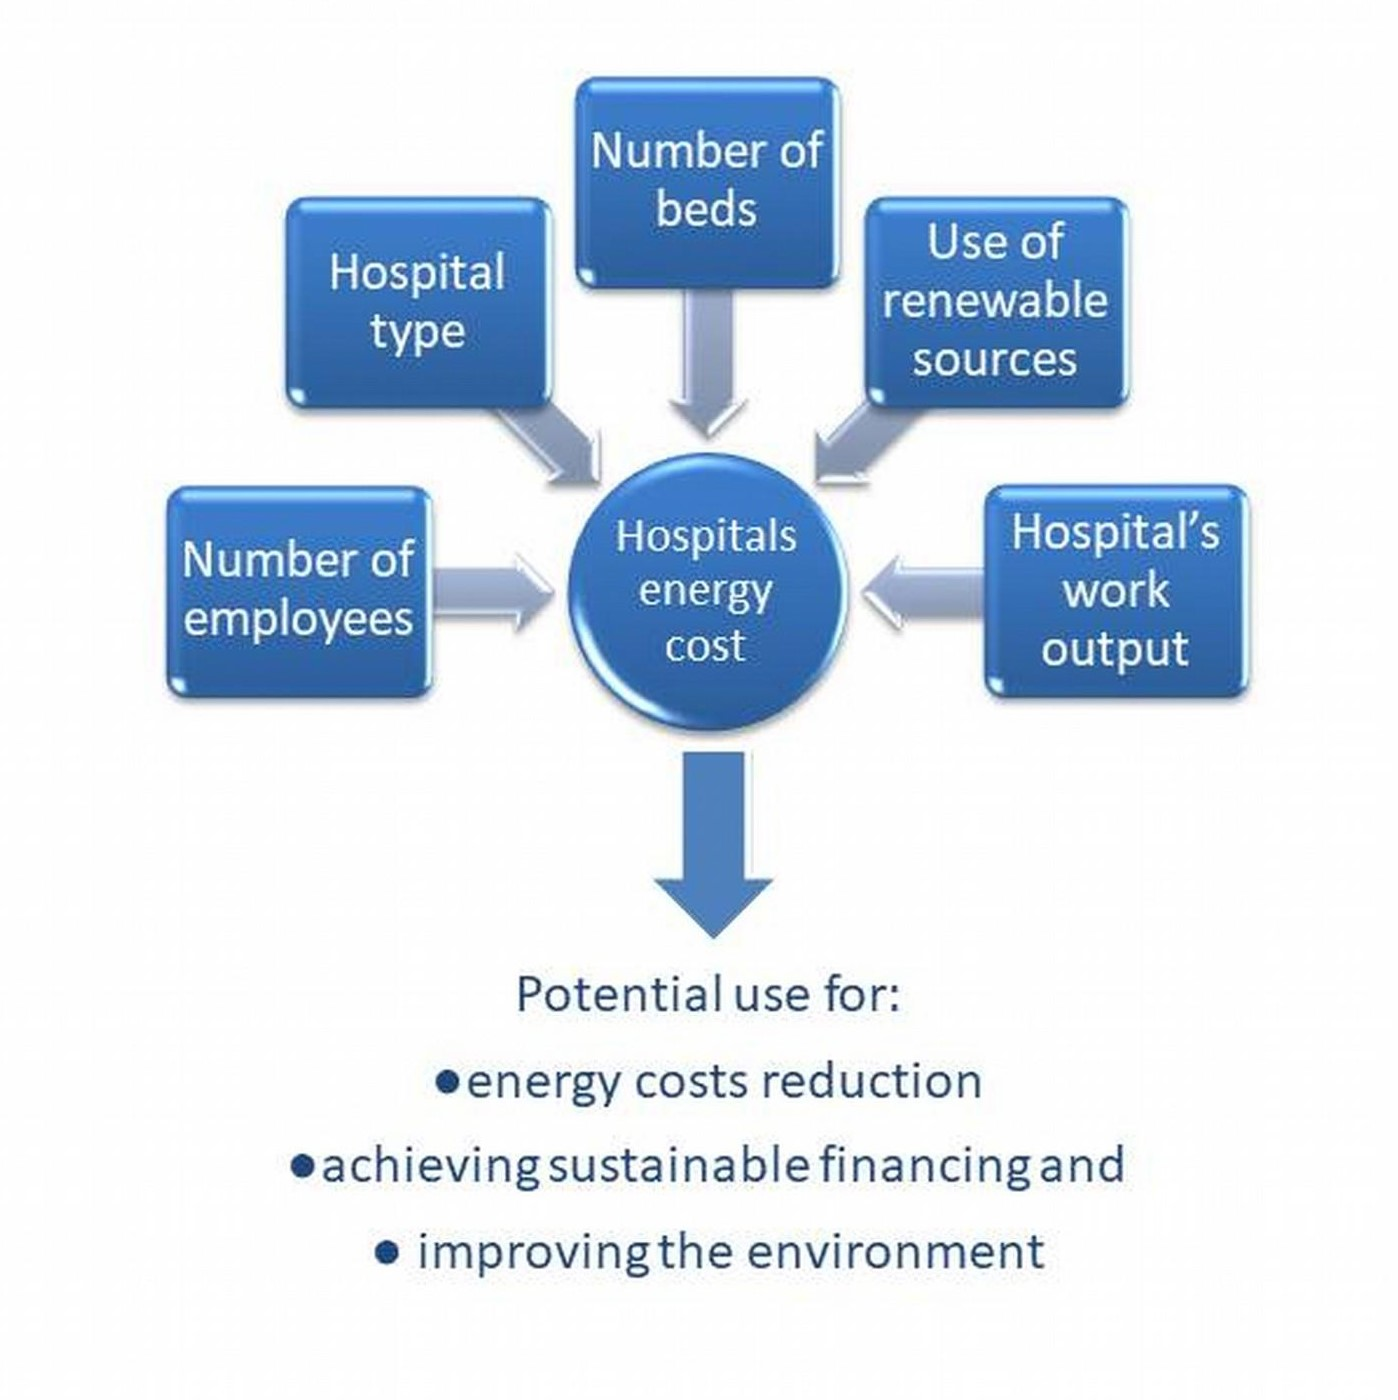
  • Have a complete picture of the cost of energy resources, both in total and per health unit.
  • Understand the factors that contribute to the energy cost so that they can plan targeted interventions.
  • Compare the indicators of each hospital against the ones with the best performance and practices, thus detecting which ones have less efficient energetic behaviors and promoting the use of renewable energy sources.
  • Be well-prepared regarding budgeting so that they can ensure the viability of their finances through sustainable development.
  • Have positive outcomes, such as decreasing costs and improving sustainability or even profitability due to better energy efficiency.
  • Measure, monitor, and improve the environmental footprint of the hospital, thus improving the environmental conditions of its area and potentially the health of the residents of the region in which it is located.

2. Materials and Methods

Our main data source was “BI-Health”, an online platform in which public hospitals in the country enter mandatory, operational and financial data every month (http://portal.bi.moh.gov.gr/) (accessed on 20 April 2021). The “Business Intelligence System” (BI-Health), is an information system that strengthens the actions of the stable administrative information of the Ministry of Health. BI-Health plays a central role in the organizational, operational, and financial modernization of the National Health System of Greece through the simplification of administrative information procedures, the effective management of resources, and the detailed control of operational and financial figures. It ensures the collection and processing of detailed and aggregated data of the public health units of the state at a central operational level and allows for the dissemination of information to management mechanisms with the ultimate goal of improving the quality of provided health services.
In many cases, it was necessary to cross-reference the data contained in the BI; for this, information from the official websites of the hospitals was used. Additionally, due to the adoption of the common codification of costs in Greek hospitals per category of material or service that was completed by the end of 2019, many entries of different costs were noticed in the same cells of BI-Health, which made it difficult to separately identify each category. For this reason, we searched the relevant uploads of each hospital on the Transparency Program (https://diavgeia.gov.gr/en) (accessed on 15 May 2021). Beginning 1 October 2010, all government institutions have been obliged to upload their acts and decisions onto the internet with special attention to issues of national security and sensitive personal data. Each document is digitally signed and assigned a unique internet uploading number (IUN) certifying that the decision has been uploaded at the “Transparency Portal”. Thus, we were able to identify the non/existence of natural gas supply but could not separate the costs of electricity from those of gas consumption or the costs of oil consumption for heating from those for gas because, in many cases, they were recorded in the same fields.
Individual hospital characteristics that have been shown by previous studies to affect energy consumption and many more that were available on the aforementioned platform were screened to be included in our multivariable model as independent variables in order to assess their association with energy cost (EC).
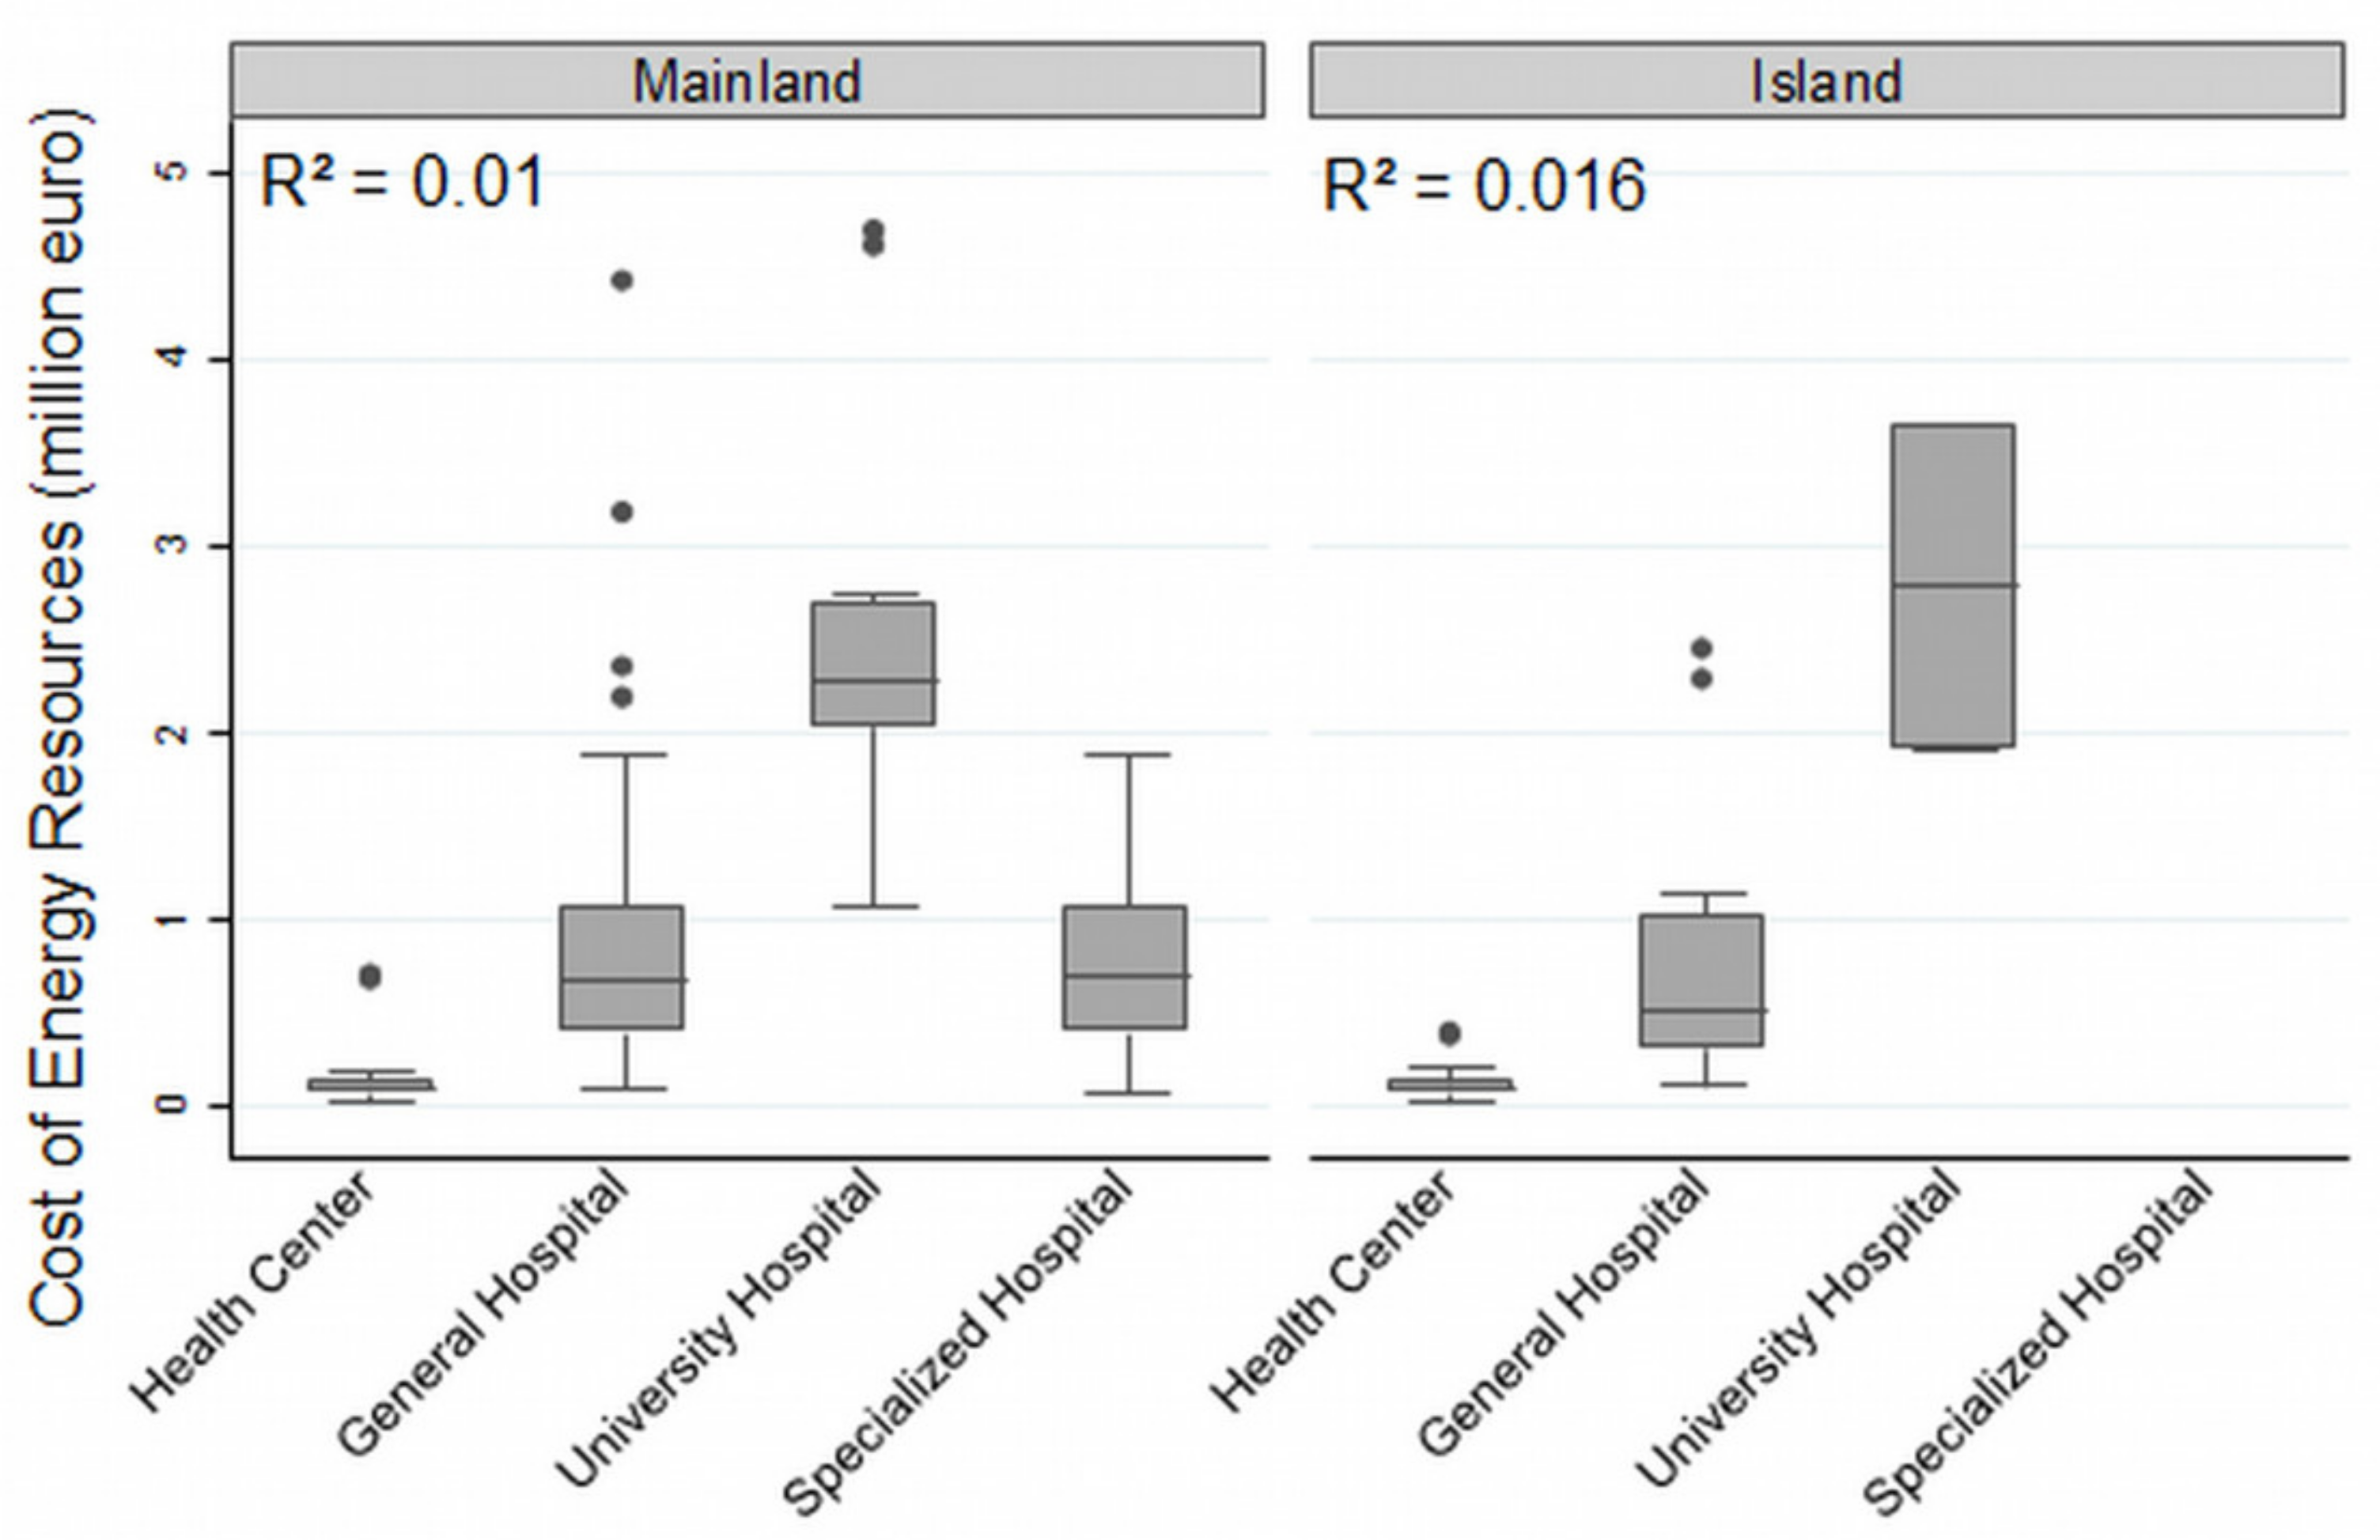
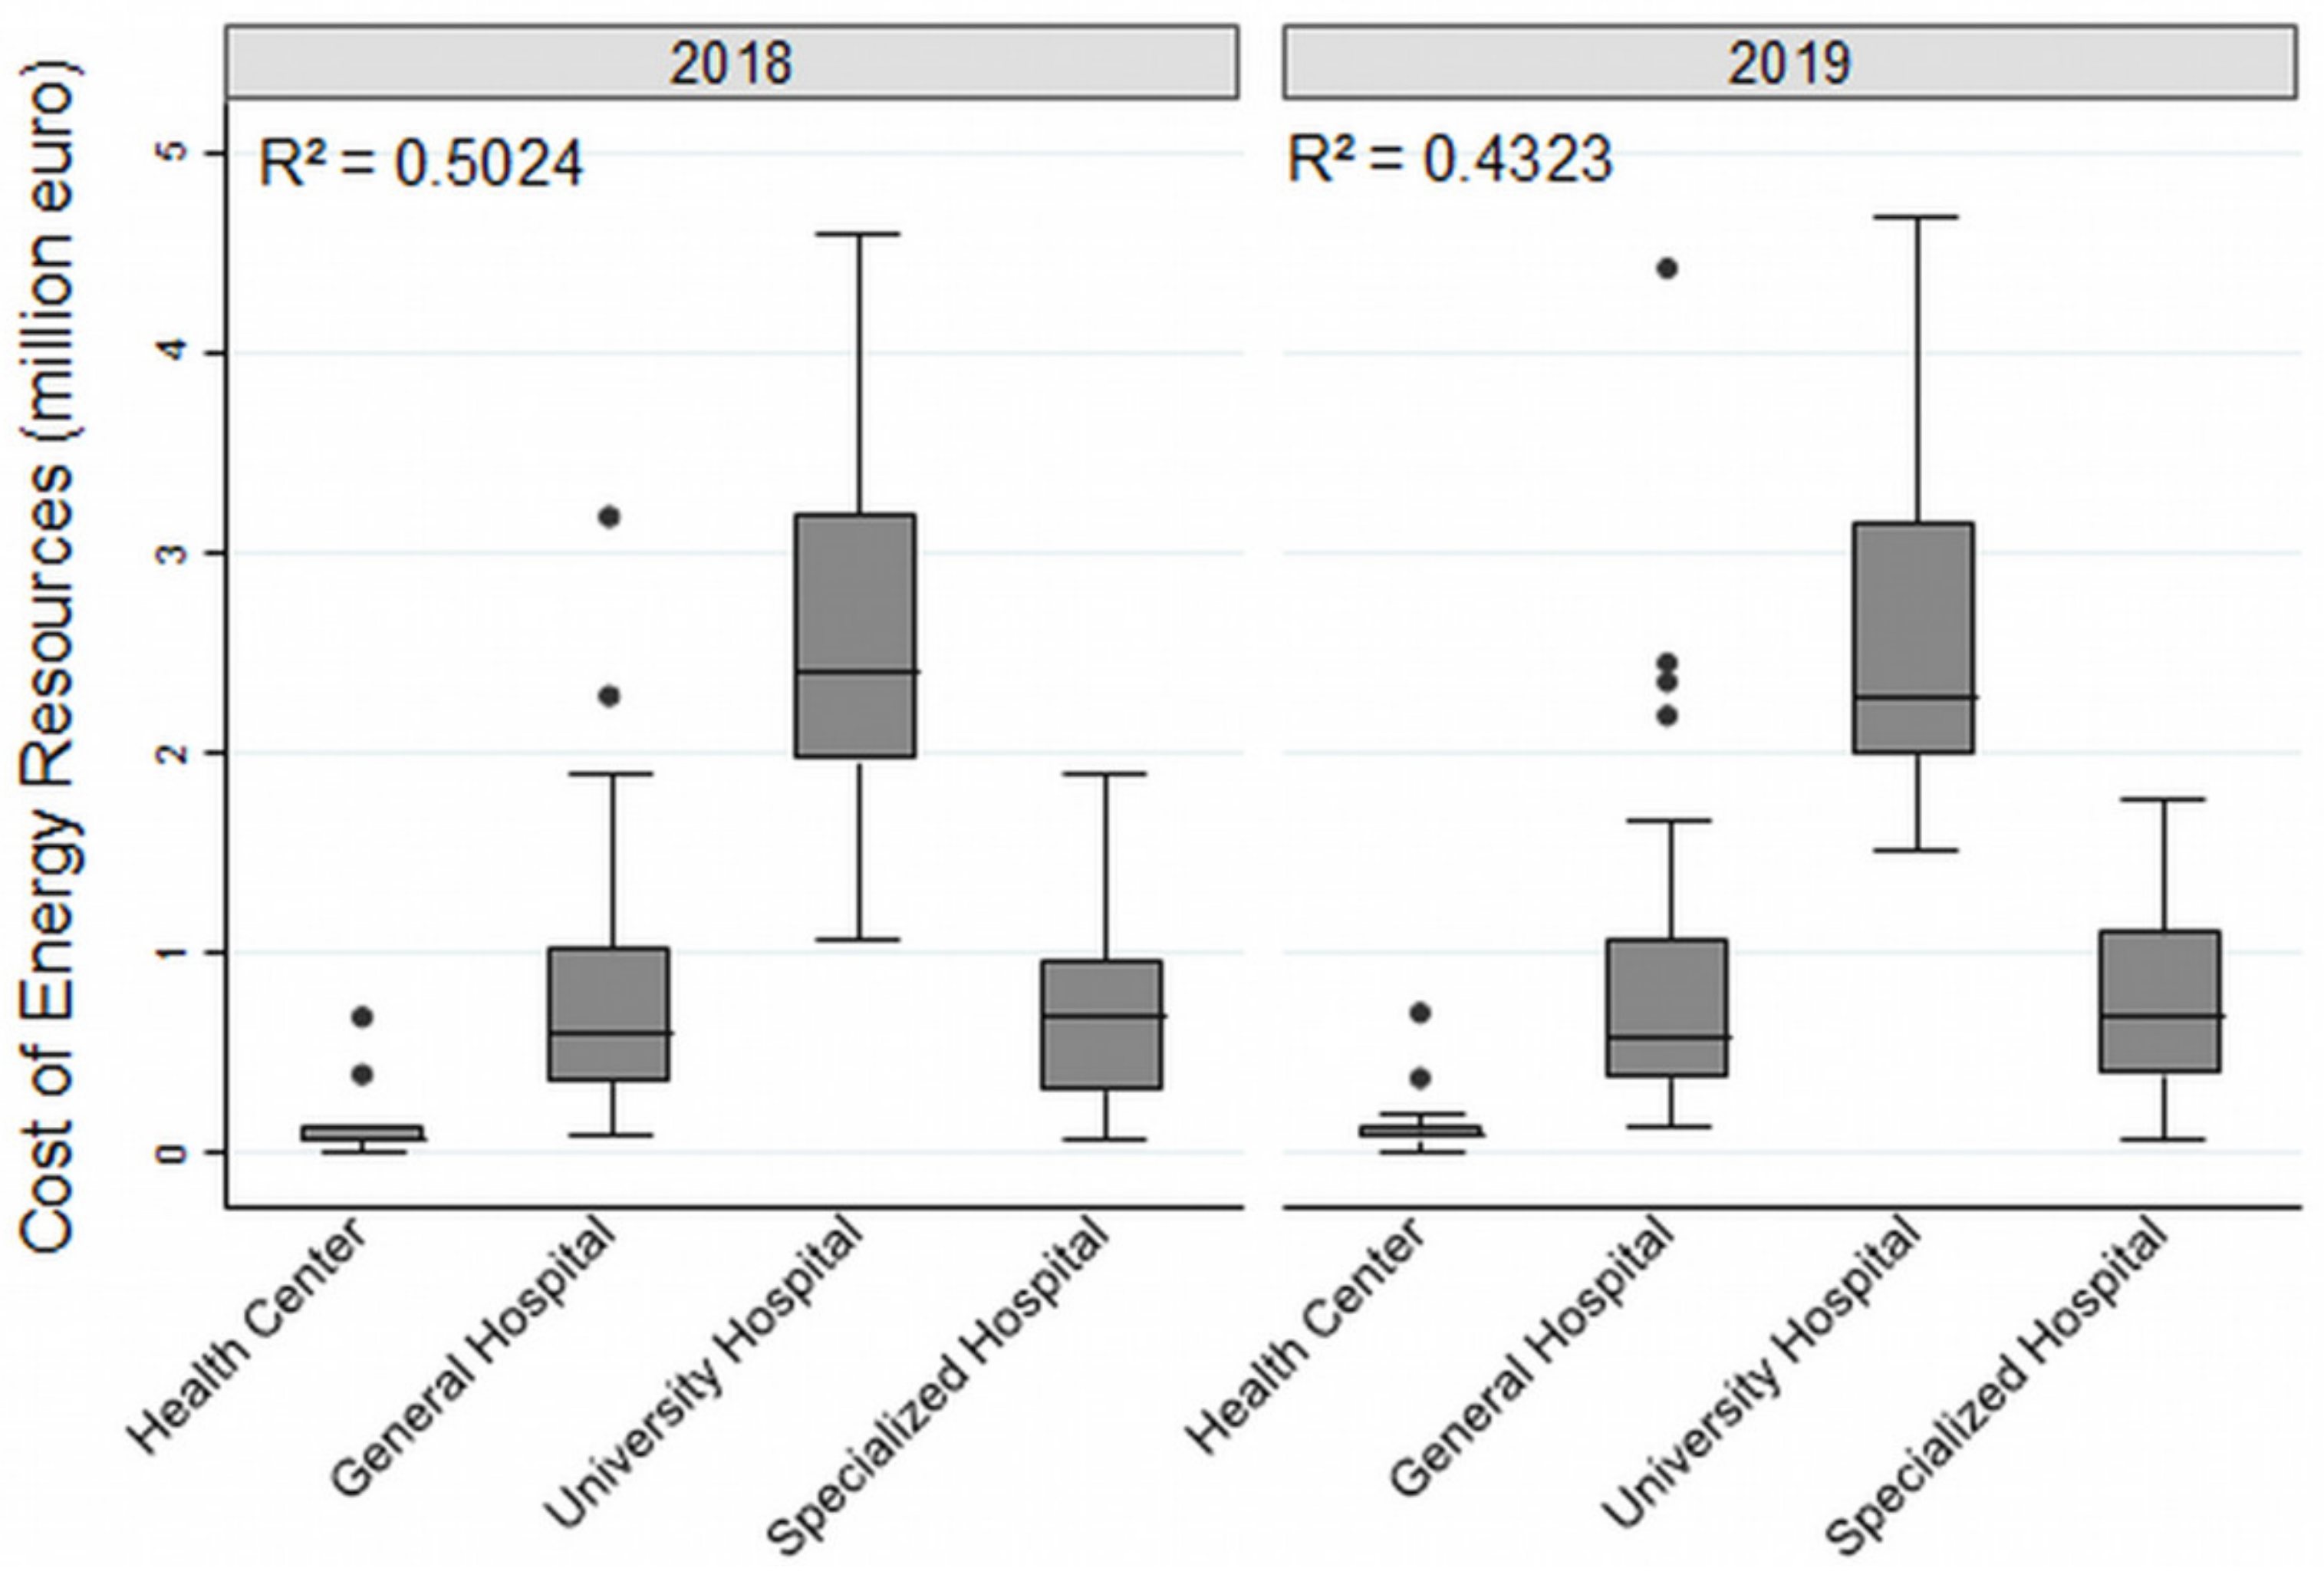
  • A hospital’s type is the first characteristic that reflects major information about its size and the number and complexity of the medical units that operate in it. There are four types of hospitals in Greece: small hospital/health centers, general hospitals, university hospitals, and special hospitals.
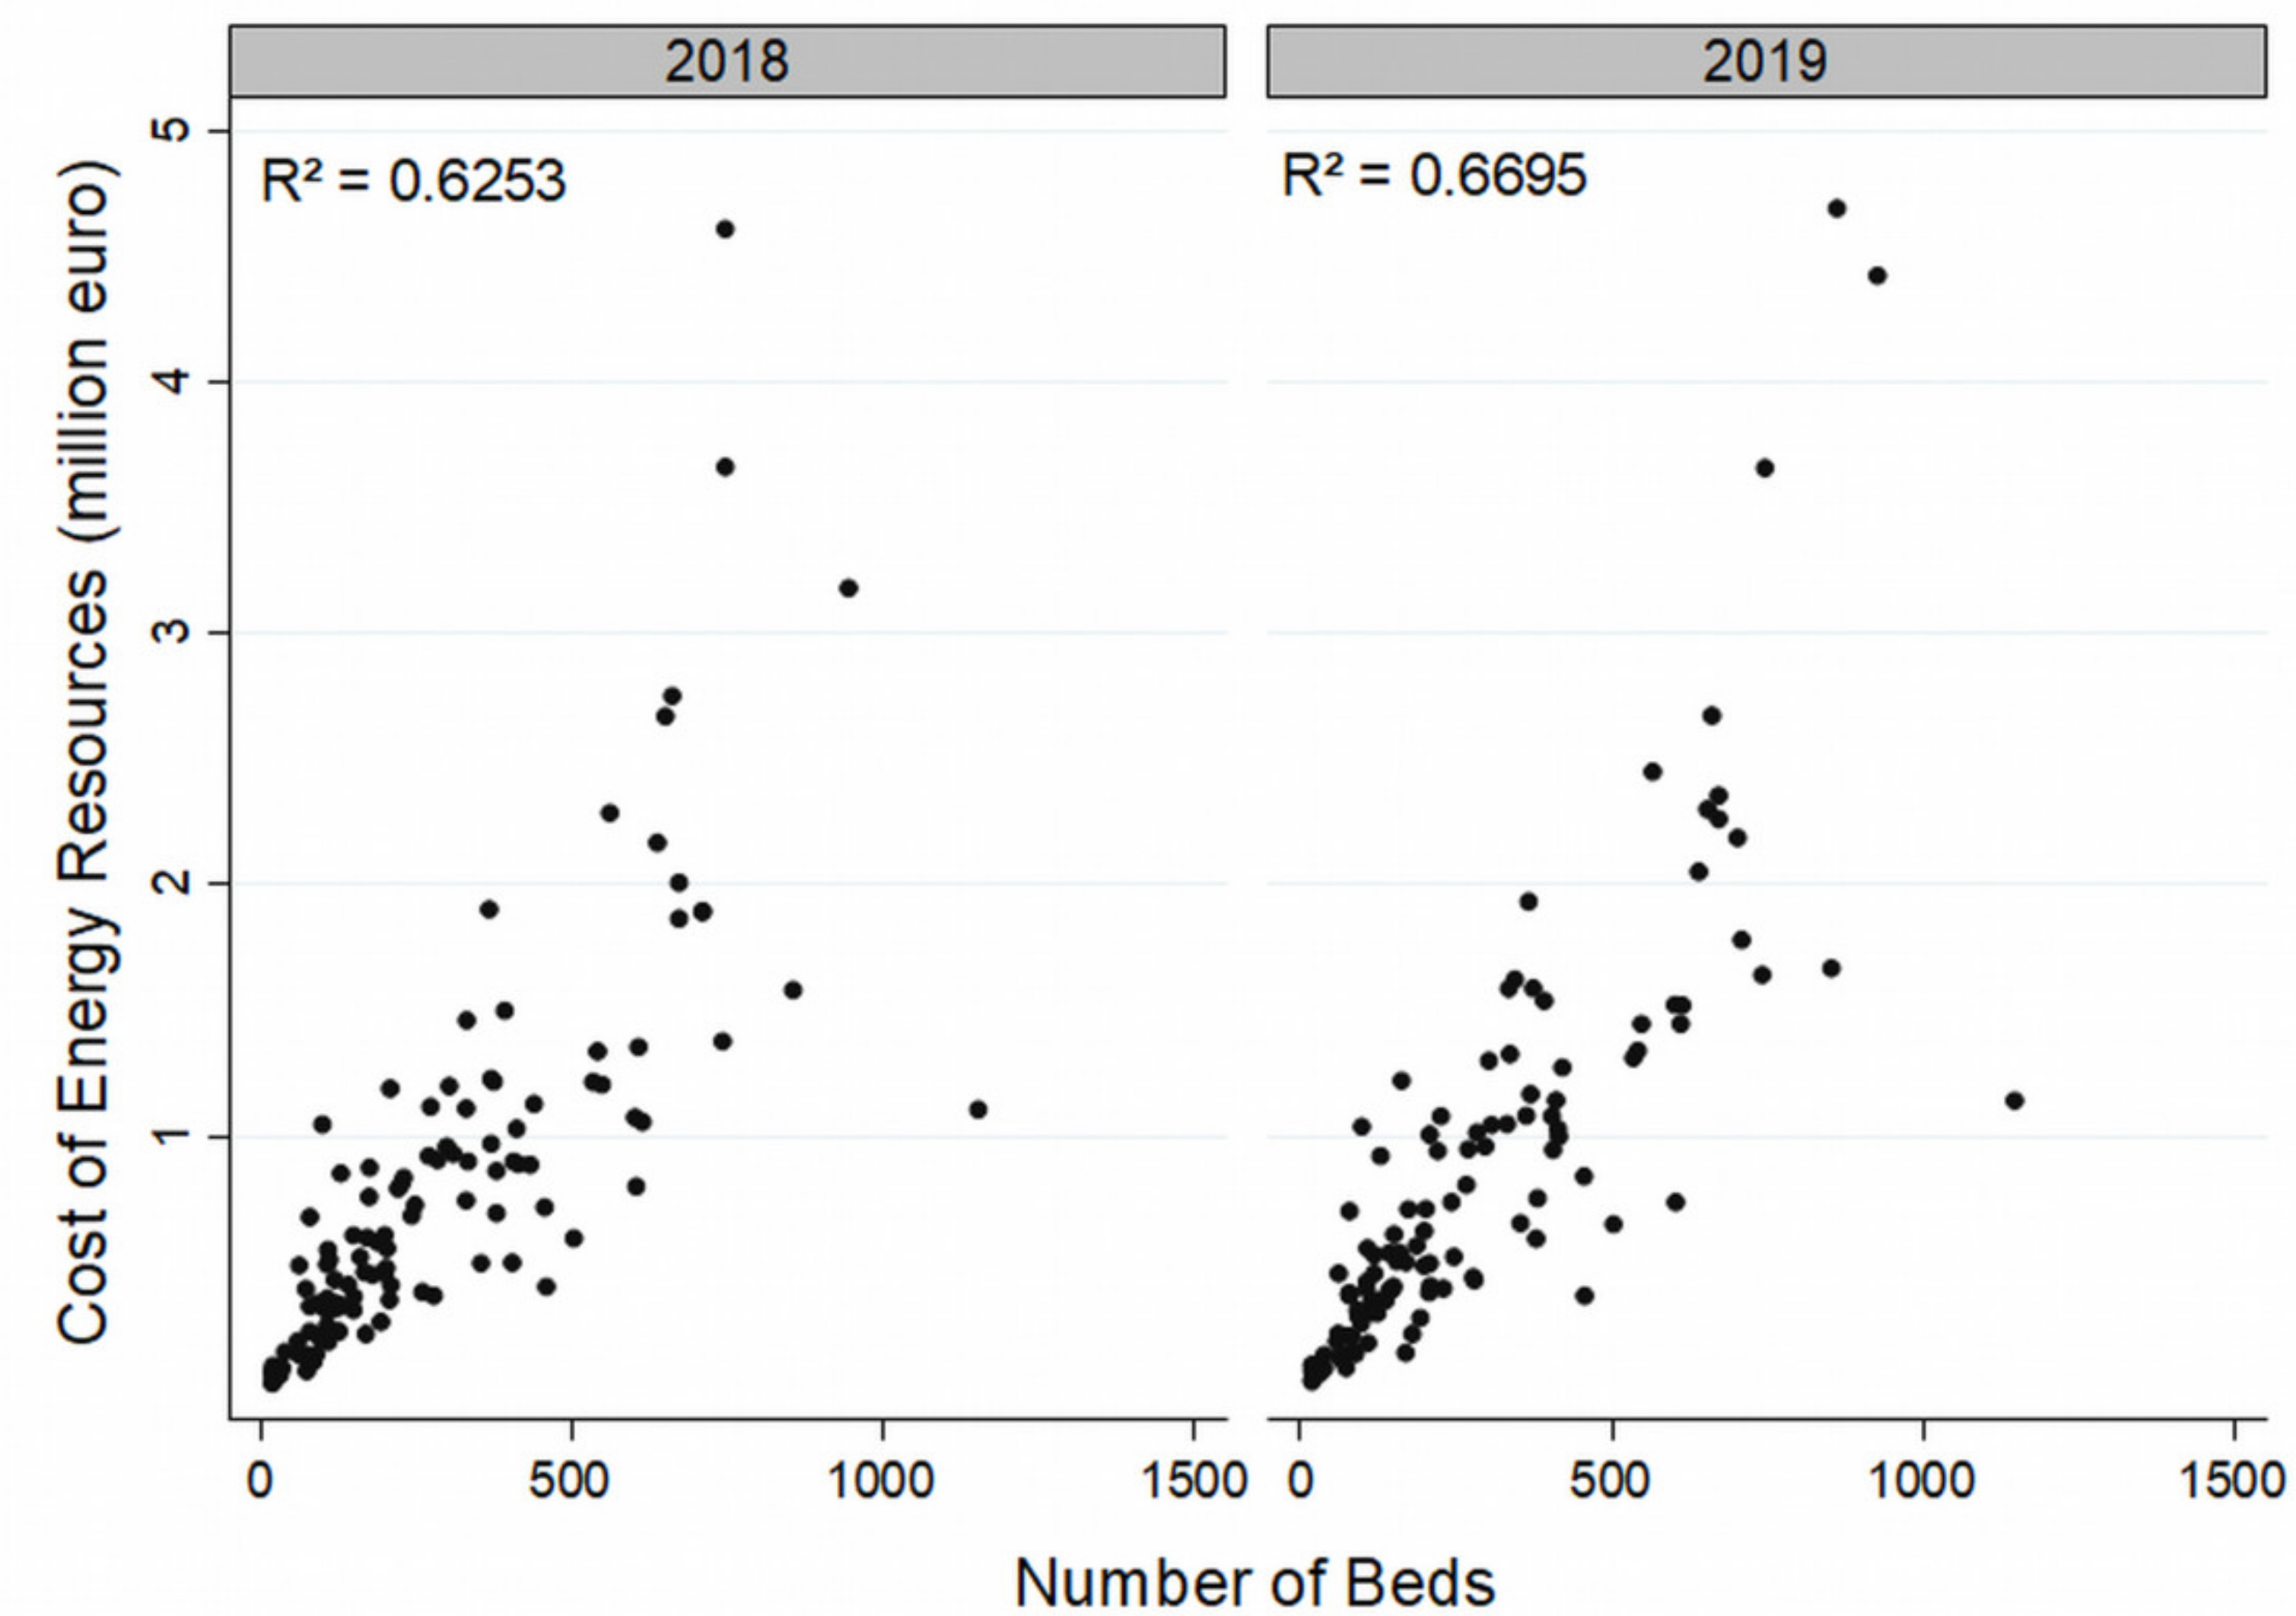
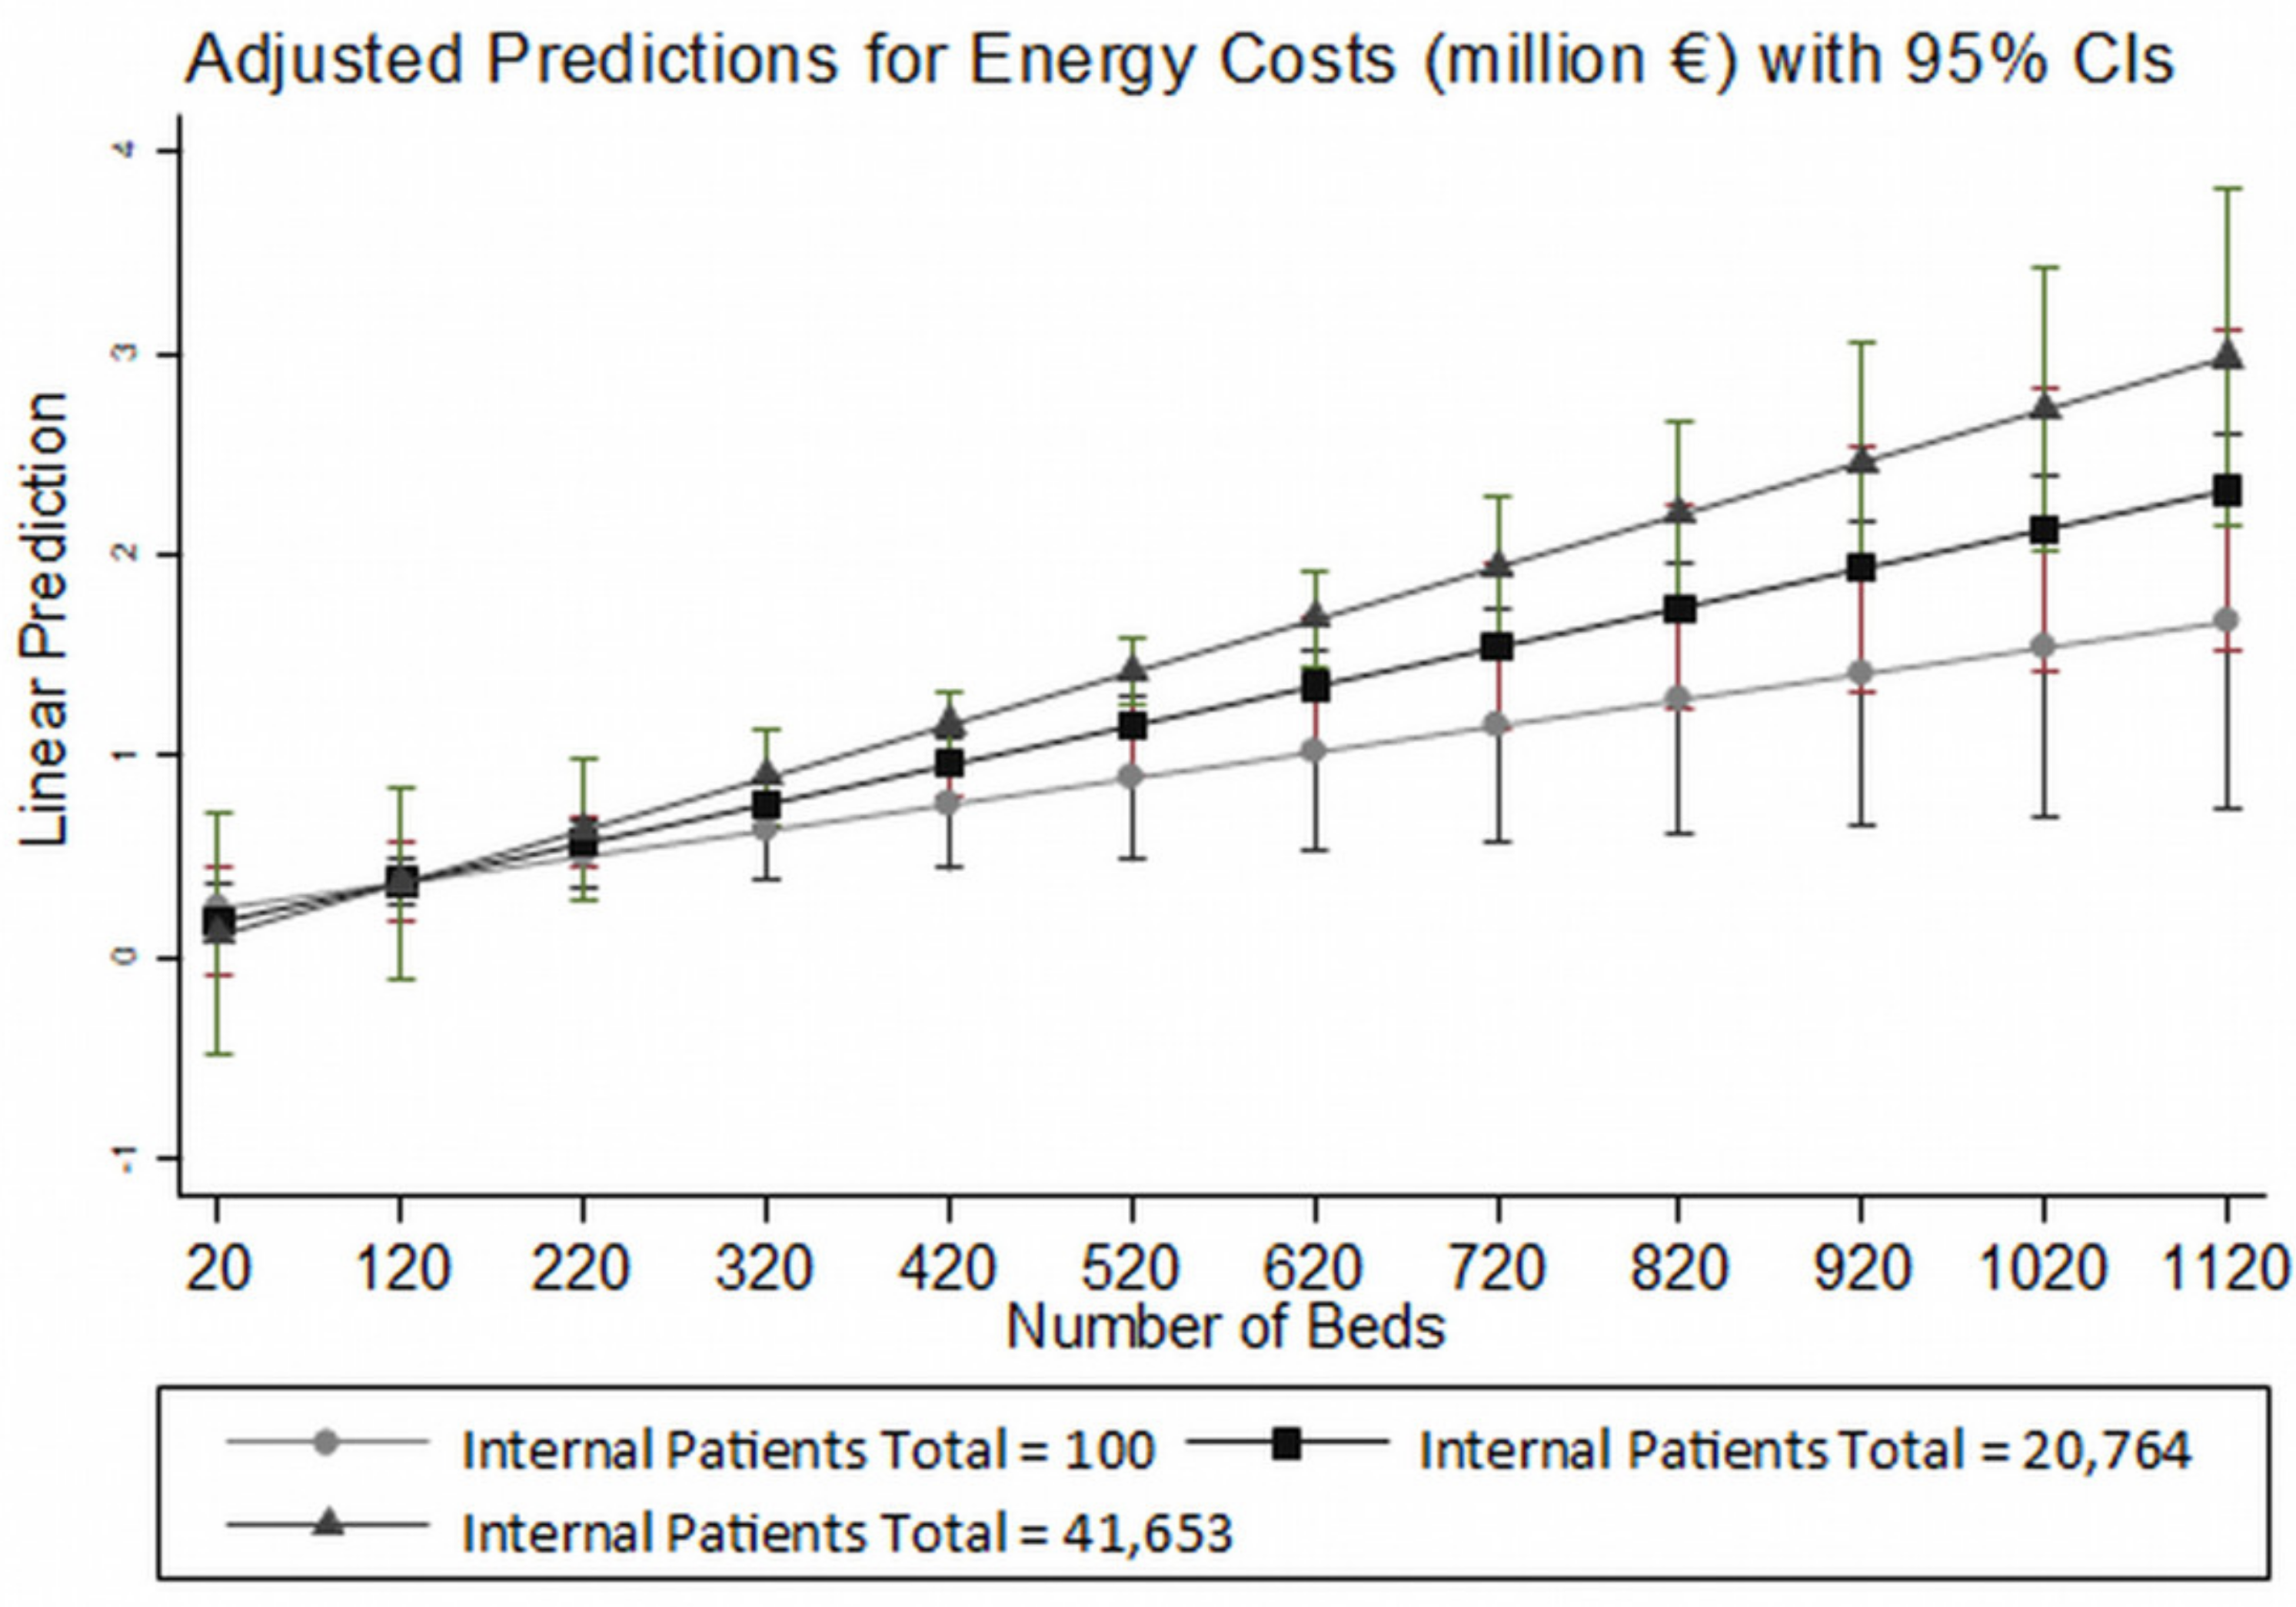
  • The number of beds was also included in our model because it indicates, to a large extent, the size of each hospital building and the type of services provided.
  • One additional element that significantly affects operating costs is the area in which each hospital is located. This variable concerns the location of each hospital, in mainland or island Greece, which indicates short or long distances from production units and high or low transport costs.
  • Τhe non/existence of special units such as intensive care, increased care, and artificial kidney units was included because of their possible special demands of energy sources.
  • The amount of total annual operating costs was also recorded as a comparison measurement between hospitals and the identification of best practices.
  • Τhe existence of a natural gas supply for the heating of the building facilities and water in each hospital is clearly more economical and more ecological than the use of petrol; for this reason, it was recorded separately.
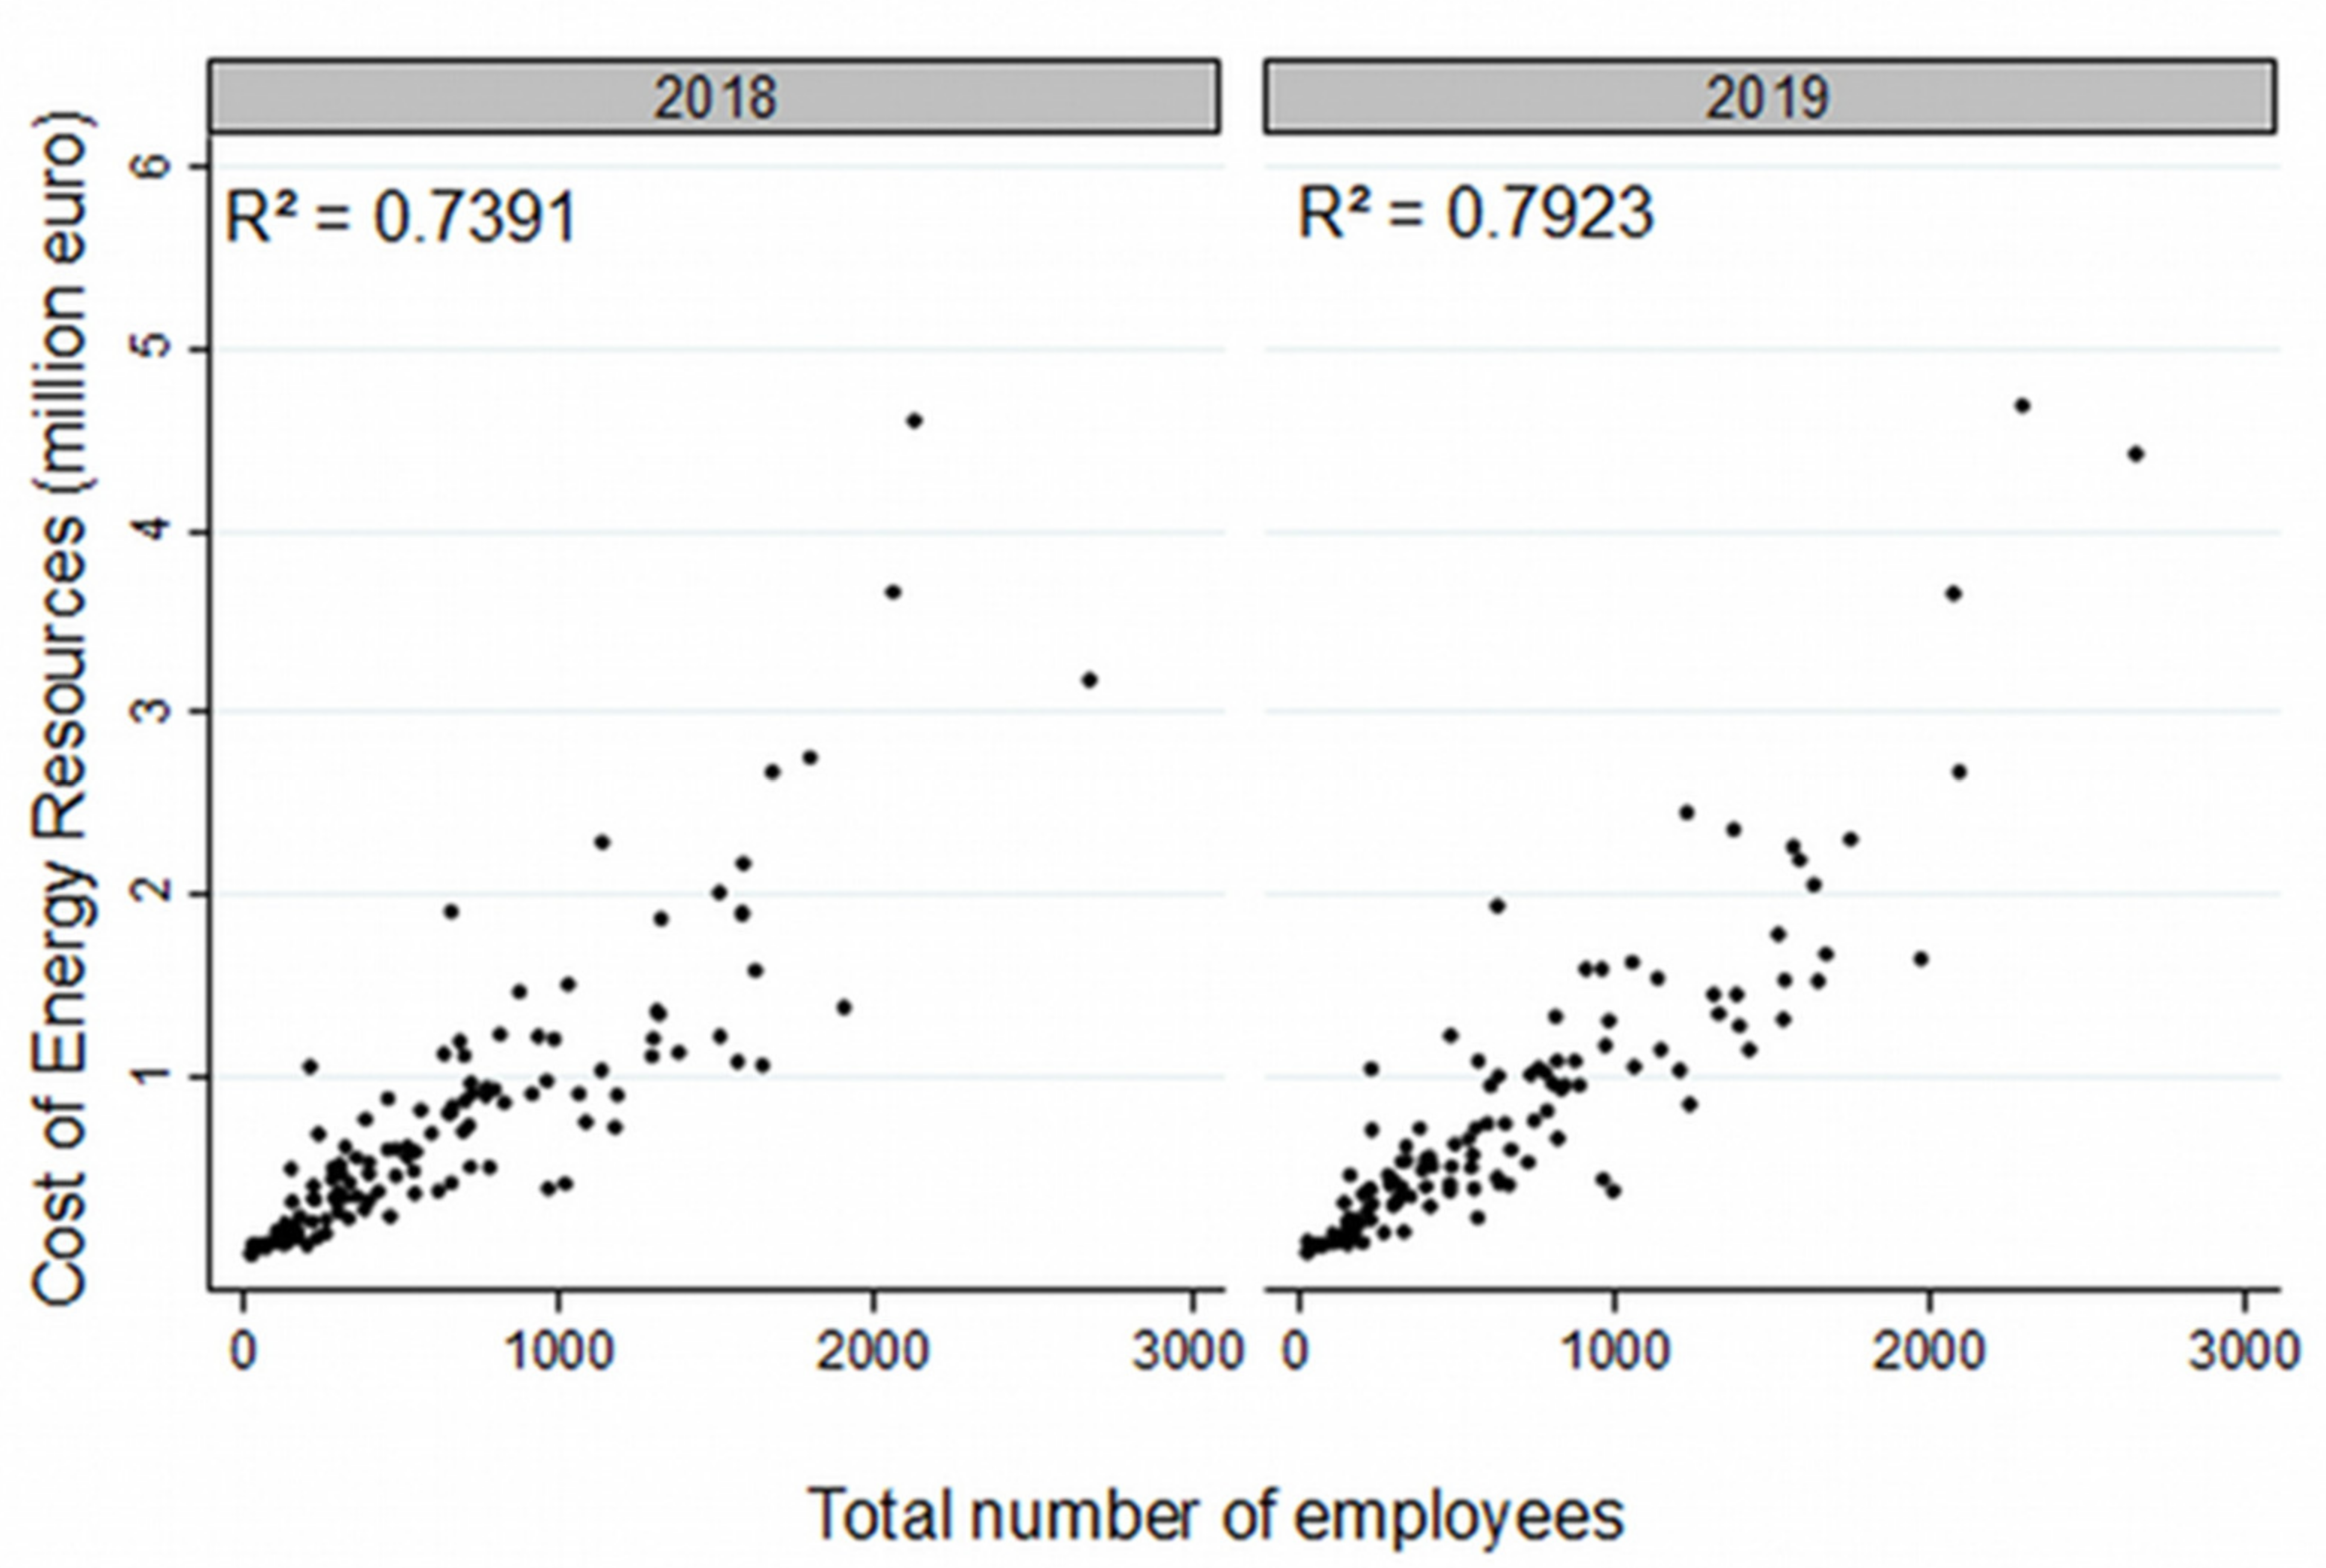
  • The number of employees, i.e., permanent and auxiliary staff members, was recorded.
Τhe total healthcare activities performed in each hospital definitely change operating costs, so the following were also recorded and evaluated for possible associations with energy costs:
  • The total number of patients, both internal and external.
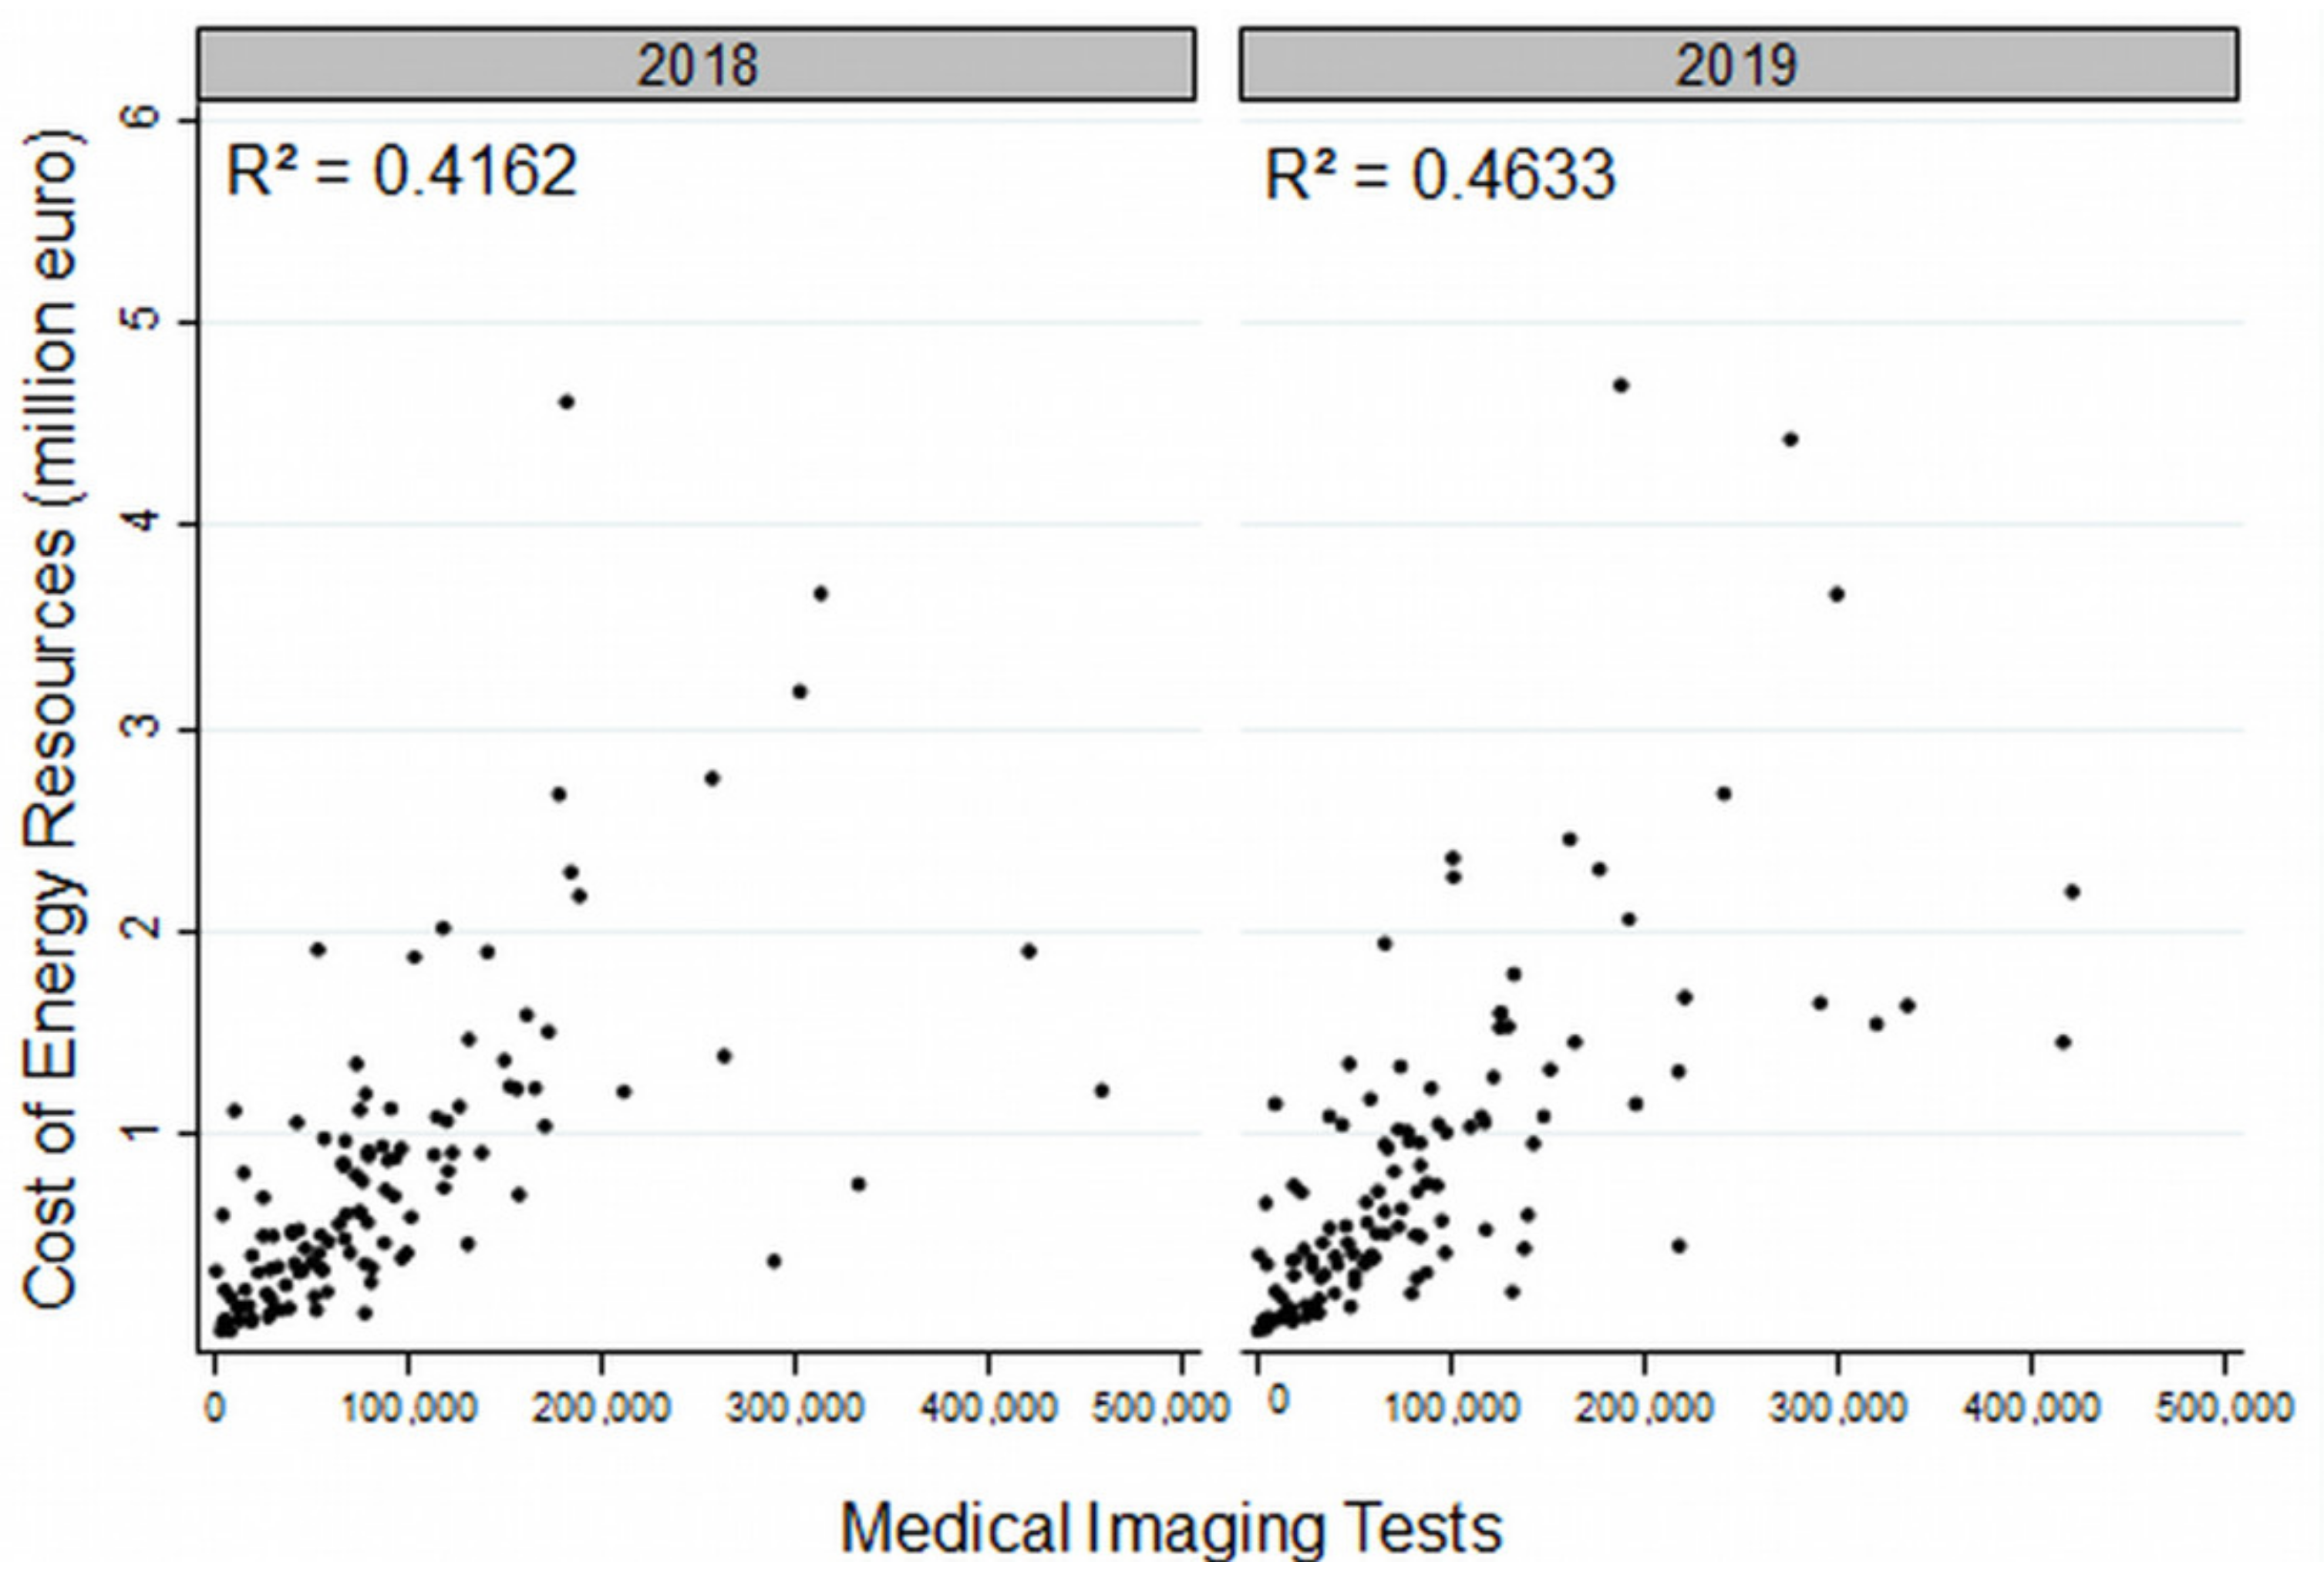
  • The total number of laboratory tests, e.g., bio-pathological tests, endoscopic examinations, invasive diagnostic tests, and medical imaging tests.
  • The total number of dialyses performed in the artificial kidney unit.
  • The total number of surgeries.
Using all the above-mentioned variables and the number of beds, we generated three derived variables for each hospital with the following indexes: ADS (Average Days of Stay), ABC (Average Bed Coverage), and PIR (Patient Income Rate).
It has been shown by many studies that environmental conditions change energy consumption, so we captured average minimum winter temperatures and average maximum summer temperatures in the areas where each hospital is located through the National Meteorological Service (which provides data to the Weather Atlas platform (https://www.weather-atlas.com/en/greece) (accessed on 20 April 2021) or other web sites that monitor monthly Greece’s climate (https://www.meteo.gr/climatic.cfm, https://www.helppost.gr/kairos) (accessed on 20 April 2021) in order to create a more accurate model. The data are available in Supplementary Table S1.
For the analysis, we used linear models with the cost of energy resource as the dependent variable. Since we had repeated measures from the same hospitals over multiple years, we first separately analyzed data for each year and then used methods suitable for longitudinal data analysis [17]. We applied and compared several models. First, we used ordinary least squares (OLS) with the Huber/White (Sandwich) estimator of variance in order to account for the fact that the observations were not dependent [18,19,20]. We finally applied random effects models for longitudinal data, with a random intercept for the hospitals [21,22,23]. All analyses were performed with Stata version 13, using the commands regress and xtreg. In all cases, significant results were considered those with a p-value < 0.05.

3. Results

In Greece, there are seven health districts with 125 hospitals (small hospitals/health centers, general hospitals, university hospitals and specialized hospitals). Of the 125 hospitals that exist in the country (mainland and the islands), 121 were included in our sample. Two very small hospitals were completely excluded due to the insufficient data they provided, whereas two others were recorded as one with their interconnected hospitals. The distribution of the hospitals according to their type, the area in which they are located, and their number of beds are shown in Table 1.
As stated above, we analyzed data related to energy resource costs (e.g., the cost of electricity, the cost of gas consumption where available, and the cost of heating oil). Due to the heterogeneity in the way the above costs were recorded in the information system from which the data were obtained, these costs were treated as a sum without separating them. Thus, the totals of these costs for the years 2018 and 2019 were €93,350,927 and €101,331,823, respectively—amounts approaching 4.5%, on average, of the total operating costs of hospitals per year. Of course, these figures were found to vary not only between health districts but also from hospital to hospital, even of the same category or size. These differences can be clearly observed in our data in Table 2, which suggest (in addition to the heterogeneity of structures) variations in the type and quantity of services provided and the adoption of different control and management practices. In some cases with low energy costs, the use of renewable energy sources was identified from recent investment actions of these hospitals.
All factors were examined with regression analysis for each year and then both years collectively to classify the data by hospital. The univariate associations in the total energy costs are presented in Table 3. The number of beds in each hospital seemed to have one of the largest effects on energy consumption in terms of cost (Figure 1) because it indicates the size and type of hospital, confirming the findings of other studies carried out in other countries (Germany, Spain, China, and England).
A recent study [16] that sampled 23 German public hospitals showed a high correlation between the built surface area and number of hospital beds (R² = 0.8616), which implies that hospitals are similar from a morphological point of view. Number of employees and hospital type appeared to have a significant effect on the total cost of energy resources when measured separately from the other factors (Figure 2, Figure 3 and Figure 4).
In the overall model, the hospital type that had the most statistically significant impact on energy cost was shown to be the university hospital. The region in which each hospital was located, although expected to affect costs, did not appear to yield statistically significant effect in these examined expenses amine (Figure 3), possibly because the categorization was not based on altitude but on whether the hospitals were located in mainland Greece or the islands.
Although the functional variables related to work output (inpatients and outpatients, days of hospitalization, MTN sessions, total surgeries, and number of imaging examinations) exhibited high correlations with each other, as shown in Table 4, most of them generated statistically significant effects in energy costs (Figure 5).
External climatic factors (such as average maximum summer temperature and average minimum winter temperature) did not seem to play a significant role in energy expenditure variations, which could be explained by the fact that Greece is a country with mild climatic conditions. This coincided with the results obtained in a similar study in German hospitals [16].
Given that all the aforementioned factors affect total consumption and therefore total costs, both individually and in combination, we proceeded to a regression analysis starting with all the independent variables and progressively excluding those that had no statistically significant additional effects. First, we conducted a regression analysis per year for 2018 and 2019, then we conducted regression analysis for both years (clustering the data per hospital), and we finally performed a random effect regression analysis with a GLS estimator (Table 5).
The variables that seemed to have statistically significant effects on energy costs in public hospitals were the number of beds, the hospital type, the number of employees, the non/existence of a natural gas supply, the number of inpatients, the number of surgeries, the number of medical imaging examinations, and some variables resulting from the interactions of the above.
It is clear that these variables correspond to two different categories—those that describe the size and type of hospital (we named them structural variables) and those that describe the health work produced by each health unit each year (we named them functional variables). The amount of predicting ability that each of these two categories of variables contributed to the overall model in describing energy resources costs and their variations was significantly different. By conducting regression analysis using only the structural variables, we derived models with an R² greater than 0.84 (Table 5), whereas adding the functional variables to the model led to an R2 of 0.87, suggesting that the additional contribution of hospitals’ healthcare output data was on the order of 3%.
We derived two regression models: Model 1, which includes both functional and structural variables, and Model 2, which includes only structural variables. Model 1 showed that the total energy cost (Y) for a given hospital could be derived from the following regression equation:
Y = −11034.03 + 1457.61 ∗ Number of Beds −14.39 ∗ Internal Patients—40.00 ∗ Total Surgeries + 1.00 ∗ Medical Imaging Tests + 979.91 ∗ Number of Employees + 316048.8 ∗ Gas + 0.032 ∗ (Beds ∗ Internal Patients)—1880.89 ∗ (Gas ∗ Beds).
The variables that most affected the total costs were the number of beds, the total number of employees, and the availability of a natural gas supply (structural variables); the number of inpatients, the number of surgeries, and the number of the medical imaging tests that are performed each year (operational variables). The interaction of the number of beds with the number of inpatients on total energy costs was statistically significant, indicating that as the number of inpatients increased, the impact of the number of beds on the cost of energy resources increased as well (Figure 6).
Likewise, the interaction of the number of beds with the existence of a natural gas supply significantly reduced the total energy costs. The larger the number of beds, the greater the reduction in a hospital’s energy costs when using natural gas (Figure 7).
If we observe the contribution of the operational variables (such as the number of surgeries) to the model, we can see their small but negative influence on the total energy cost in contrast to the large influence they had on the corresponding costs according to univariate analysis (Table 2). This happened because the variables describing the operational data were highly correlated with each other (Table 3), thus giving their place to the variable ‘hospital type’ in the overall energy cost regression model derived only from the descriptive variables in Model 2, which is expressed by the following equation:
Y = −96730.41 + 1215.221 ∗ Number of Beds 979.91 + 456407.7 ∗ Hospital Type (3) + 1038.766 ∗ Number of Employees + 49760.6 ∗ Gas −1142.712 ∗ (Gas ∗ Beds).
For both Models 1 and 2, Akaike’s information criterion (AIC) and Bayesian information criterion (BIC)—which are appropriate for maximum likelihood models—were estimated (Table 6). Both AIC and BIC indicated the preferred model to be the one with the largest number of variables, including both functional and structural information regarding the hospitals.
Nevertheless, given the small total increase in the R2 and the small difference in the value of the AIC and BIC, we chose to report the model with the fewest variables (structural variables), since these are much easier to identify and record and their values are relatively ‘stable’ because they do not change much, if at all, from year to year.

4. Discussion

In order to make necessary adjustments, there must first be a clear picture of the studied situation. This was attempted for hospitals in this study for the first time through research regarding Greek public hospitals. The energy behavior in terms of cost of all hospitals in the country was mapped, identifying both optimal and worst cases and indicating the field of action to the experts for the optimization of energy consumption and cost savings. One of the important findings of the present study is the existence of significant variation in the energy expenditure in Greek public hospitals that are not just related to the size, type of hospital, or even the number of patients. For example, the annual average energy costs per bed was found to range from 2200 to 3900€ in hospitals of the same category, representing a variable proportion of the total annual operating costs, i.e., from 2.1% to 10%. This indicates the adoption of different control and management practices by each institution (elements that should also be observed), highlighting the best practices that should be progressively implemented by all the structures.
The use of effective energy-conservation measures, such as the addition of the thermal insulation of exposed external walls, energy-efficient lamps, solar collectors for sanitary hot water production, the replacement of old inefficient boilers, and the regular maintenance of central heating boilers [12], are unquestionably actions that should be adopted in all health systems. Moreover, the use of renewable sources such as solar thermal energy, wind turbines, solar photovoltaic energy, solid biomass, and ground source heat pumps for heat, cooling, and electricity generation are some further options.
The need to adopt cheaper and sustainable solutions is undeniable, especially in times in which we are experiencing rapid increases in the price of energy resources. However, adaptation cannot be uniformly applied; it is necessary to identify the factors that influence consumption at any given time to make rational and fair decisions. The basic variables that influence energy consumption in Greek public hospitals, in terms of both the consumption measurement units that have been used in previous studies [11,13] and in financial terms, are the size of the facilities (indicated indirectly by the number of beds and the number of employees), the type of hospital (which indicates the complexity of the medical equipment), and the use of alternative forms of energy resources such as natural gas [24]. These variables can be easily retrieved and used in predicting budgets from year to year with relative accuracy.
However, when reliable information is available regarding the operational data of each hospital, namely the number of inpatients, the number of surgeries, and the total number of medical imaging examinations, we were able to create models with slightly higher predictive ability. By conducting regression analysis using only structural variables, we derived models with an R² greater than 0.84, whereas adding functional variables to the model led to an R2 of 0.87, suggesting that the additional contribution of hospitals’ healthcare output data was on the order of 3%. The main conclusion from these results is that the main factors affecting energy consumption in Greek hospitals are those related to the size and complexity of the buildings, which is to be expected because hospitals need heating, cooling, and uses energy resources for electricity in order to continuously operate its medical equipment whether it has 90% or 50% patient occupancy. Based on these factors, these mathematical models can indicate the margins of reduction for each hospital without compromising its safe operation. If the records become more detailed and reliable, the models can be updated to make more reliable estimates each time.
This information may form the basis of a national strategic plan for the energy policies of Greek public hospitals and health centers. In this way, the Ministry of Health can use these models to calculate energy costs to indicate times of the necessary interventions/adjustments of each structure by primarily considering the following:
(a)
The age of the buildings and electromechanical installations.
(b)
Access to renewable energy sources.
(c)
The educational needs of the hospitals stuff for sustainable behavior and sustainable management.
The records of operational and financial data should become progressively more detailed and homogenous, as well as be drawn directly from the hospitals’ information systems (including new data on targeted interventions completed by given hospitals), thus increasing their reliability [25].
Sustainable development is the idea that human societies must live and meet their needs without compromising the ability of future generations to meet their own needs. This requires the use of renewable energy sources through investments that are efficient and cost-effective. Given that in Greece (specifically in the country’s health structures that are significantly costly), we are still in early stages regarding the adoption of renewable energy sources, the information obtained from this study’s mapping and monitoring can form the backbone of this necessary change in a coordinated way.

5. Conclusions

The energy costs of public healthcare facilities undoubtedly comprise some of the largest and most inelastic costs of the state. Given rapid climate change and limited financial resources, efforts to adopt renewable energy sources are necessary in order to contain costs and reduce environmental footprints. For Greek public hospitals, the annual expenditure on energy consumption exceeds 4%; in some cases, it exceeds 7% of the total annual budgets for the operation of all healthcare units. The main factors that have statistically significant impacts on these costs are the structural characteristics of the hospitals indicated by the number of beds, the number of employees, the type of hospital, and the non/use of alternative and cheaper energy resources such as natural gas. A smaller but statistically significant impact on energy costs originates from hospital operating variables such as the number of inpatients, the number of surgeries, and the number of medical imaging examinations. These variables are easily retrieved and can be used in predicting the budget from year to year with relative accuracy. They can also be used to assess hospitals’ consumption and control management of energy resources, which in turn will lead to targeted interventions.

Supplementary Materials

The following are available online at https://www.mdpi.com/article/10.3390/en15010381/s1, Table S1: The Hospital Data.

Author Contributions

Conceptualization, P.N.Z. and P.G.B.; Data curation, P.N.Z.; Formal analysis, P.G.B.; Investigation, P.N.Z., A.S. and P.G.B.; Methodology, P.N.Z. and P.G.B.; Supervision, P.G.B.; Validation, P.N.Z. and A.S.; Visualization, P.N.Z.; Writing—original draft, P.N.Z.; Writing—review & editing, A.S. and P.G.B. All authors have read and agreed to the published version of the manuscript.

Funding

This research received no external funding.

Institutional Review Board Statement

Not applicable.

Informed Consent Statement

Not applicable.

Data Availability Statement

The data of this study is available in Supplementary Materials.

Acknowledgments

The authors wish to thank the Ministry of Health and, in particular, the Secretary General Ioannis Kotsiopoulos and the IT team that provided all the necessary data required to complete this work. The authors would like to thank the editor and anonymous reviewers for their constructive criticism that helped to improve the quality of the manuscript.

Conflicts of Interest

The authors declare no conflict of interest.

References

  1. OECD. Healthcare Costs Unsustainable in Advanced Economies without Reform. Available online: http://www.oecd.org/health/healthcarecostsunsustainableinadvancedeconomieswithoutreform.htm (accessed on 15 June 2021).
  2. U.N. Transforming Our World: The 2030 Agenda for Sustainable Development. In Seventieth United Nations General Assembly. Available online: http://www.un.org/ga/search/view_doc.asp?symbol=A/RES/70/1&Lang=E (accessed on 15 June 2021).
  3. World Health Organization. WHO Calls for Urgent Action to Protect Health from Climate Change. Available online: www.who.int/globalchange/ (accessed on 15 June 2021).
  4. Ziebik, A.; Hoinka, K. Energy Systems of Complex Buildings; Springer: London, UK, 2013. [Google Scholar]
  5. Bawaneh, K.; Ghazi Nezami, F.; Rasheduzzaman, M.; Deken, B. Energy consumption analysis and characterization of healthcare facilities in the United States. Energies 2019, 19, 3775. [Google Scholar] [CrossRef] [Green Version]
  6. Ma, H.; Du, N.; Yu, S.; Lu, W.; Zhang, Z.; Deng, N.; Li, C. Analysis of typical public building energy consumption in northern China. Energy Build. 2017, 136, 139–150. [Google Scholar] [CrossRef]
  7. Jiang, C.; Xing, J.; Ling, J.; Qin, X. Energy consumption and carbon emissions of hospitals in Tianjin. Front. Energy 2012, 6, 427–435. [Google Scholar] [CrossRef]
  8. Morgenstern, P.; Li, M.; Raslan, R.; Ruyssevelt, P.; Wright, A. Benchmarking acute hospitals: Composite electricity targets based on departmental consumption intensities. Energy Build. 2016, 118, 277–290. [Google Scholar] [CrossRef]
  9. Christiansen, N.; Kaltschmitt, M.; Dzukowski, F. Electrical energy consumption and utilization time analysis of hospital departments and large scale medical equipment. Energy Build. 2016, 131, 172–183. [Google Scholar] [CrossRef]
  10. Christiansen, N.; Kaltschmitt, M.; Dzukowski, F.; Isensee, F. Electricity consumption of medical plug loads in hospital laboratories: Identification, evaluation, prediction and verification. Energy Build. 2015, 107, 392–406. [Google Scholar] [CrossRef]
  11. Zorita, A.L.; Fernández-Temprano, M.A.; García-Escudero, L.A.; Duque-Perez, O. A statistical modeling approach to detect anomalies in energetic efficiency of buildings. Energy Build. 2016, 110, 377–386. [Google Scholar] [CrossRef]
  12. Gaglia, A.G.; Balaras, C.A.; Mirasgedis, S.; Georgopoulou, E.; Sarafidis, Y.; Lalas, D.P. Empirical assessment of the Hellenic non-residential building stock, energy consumption, emissions and potential energy savings. Energy Convers. Manag. 2007, 48, 1160–1175. [Google Scholar] [CrossRef]
  13. Vourdoubas, J. Energy consumption and carbon emissions in Venizelio hospital in Crete, Greece: Can it be carbon neutral? J. Eng. Archit. 2018, 6, 19–27. [Google Scholar]
  14. González, A.G.; García-Sanz-Calcedo, J.; Salgado, D.R. A quantitative analysis of final energy consumption in hospitals in Spain. Sustain. Cities Soc. 2018, 36, 169–175. [Google Scholar] [CrossRef]
  15. García-Sanz-Calcedo, J.; Gómez-Chaparro, M.; Sanchez-Barroso, G. Electrical and thermal energy in private hospitals: Consumption indicators focused on healthcare activity. Sustain. Cities Soc. 2019, 47, 101482. [Google Scholar] [CrossRef]
  16. González González, A.; García-Sanz-Calcedo, J.; Rodríguez Salgadom, D. Evaluation of energy consumption in German hospitals: Benchmarking in the public sector. Energies 2018, 11, 2279. [Google Scholar] [CrossRef] [Green Version]
  17. Diggle, P.J.; Heagerty, P.J.; Liang, K.Y.; Zeger, S.L. Analysis of Longitudinal Data; Oxford University Press: Oxford, UK, 2002. [Google Scholar]
  18. Huber, P.J. The behavior of maximum likelihood estimates under nonstandard conditions. In Proceedings of the Fifth Berkeley Symposium on Mathematical Statistics and Probability, Los Angeles, CA, USA, 18–21 July 1965; University of California Press: Berkeley, CA, USA, 1967; Volume 1, pp. 221–233. [Google Scholar]
  19. White, H.L., Jr. A heteroskedasticity-consistent covariance matrix estimator and a direct test for heteroskedasticity. Econometrica 1980, 48, 817–838. [Google Scholar] [CrossRef]
  20. White, H.L., Jr. Maximum likelihood estimation of misspecified models. Econometrica 1982, 50, 1–25. [Google Scholar] [CrossRef]
  21. Liang, K.-Y.; Zeger, S.L. Longitudinal data analysis using generalized linear models. Biometrika 1986, 73, 13–22. [Google Scholar] [CrossRef]
  22. Laird, N.M.; Ware, J.H. Random-effects models for longitudinal data. Biometrika 1982, 38, 963–974. [Google Scholar] [CrossRef]
  23. Skrondal, A.; Rabe-Hesketh, S. Generalized Latent Variable Modeling: Multilevel, Longitudinal, and Structural Equation Models; Chapman & Hall/CRC: Boca Raton, FL, USA, 2004. [Google Scholar]
  24. Sepetis, A. Sustainable Finance in Sustainable Health Care System. Open J. Bus. Manag. 2020, 8, 262–281. [Google Scholar] [CrossRef] [Green Version]
  25. Sepetis, A. Sustainable Health Care Management in the Greek Health Care Sector. Open J. Soc. Sci. 2019, 7, 386. [Google Scholar] [CrossRef] [Green Version]
Figure 1. The hospital cost of energy resources vs. the number of beds.
Energies 15 00381 g001
Figure 2. The hospital cost of energy resources vs. the number of employees.
Energies 15 00381 g002
Figure 3. Box plots for cost of energy resources by hospital location.
Energies 15 00381 g003
Figure 4. Box plots for cost of energy resources by hospital type.
Energies 15 00381 g004
Figure 5. The hospital cost of energy resources vs. the number of the medical imaging tests performed per year.
Energies 15 00381 g005
Figure 6. Energy cost projections for hospitals with different numbers of beds with/without a natural gas supply.
Energies 15 00381 g006
Figure 7. Energy cost projections for hospitals with different numbers of beds with/without a natural gas supply.
Energies 15 00381 g007
Table 1. Hospital distribution in Greece per hospital type and by location.
Hospital TypeArea
MainlandIsland
Number of HospitalsNumber of BedsNumber of HospitalsNumber of Beds
Small Hospitals/Health Centers938810477
General Hospitals6418,468132518
University Hospitals6397321115
Specialized Hospitals17646000
Table 2. Average cost of energy resources per bed in Greek public hospitals.
Hospital TypeAverage Annual Cost of Energy Resources per Bed from Both Years 2018 and 2019
ObsMeanStd. Dev.MinMax
Small Hospital/Heath Center382705.111778.74712.208728.43
General Hospital1553073.691440.71789.0710,435.82
University Hospital164049.811185.231779.096165.49
Specialized Hospital332467.771379.45956.877057.02
Table 3. Univariate associations of the 23 independent variables in the total cost of energy resources per year and in total.
Univariate Associations of the 23 Independent Variables in the Total Cost of Energy ResourcesLinear Regression
for Cost of Energy Resources Year 2018
Linear Regression for Cost of Energy Resources Year 2019Linear Regression for Cost of Energy Resources Clustered per HospitalRandom Effect
Regression (GLS) for Cost of Energy Resources
Number of Obs = 121Number of Obs = 121Number of Obs = 242 Number of Groups = 121Number of Obs = 242 Number of Groups = 121
Coef. (Std. Err.)Coef. (Std. Err.)Coef. (Std. Err.)Coef. (Std. Err.)
Number of Beds2583.323 (183.3146)2885.454 (185.8608)2735.491 (404.5028)2735.491 (130.6286)
Hospital Type
Small Hospital/Health Center
General Hospital618,148.7 (138,856.2)698,553.4 (160,696.5)658,642 (75,678.37)658,642 (105,513.8)
University Hospital2,473,521 (228,460.8)2,494,973 (264,730.9)2,484,247 (358,166.6)2,484,247 (173,713.4)
Specialized Hospital622,670.6 (180,968)635,208.7 (213,128.6)628,601.6 (119,088.8)628,601.6 (138,697.5)
Area—Island−186,407.6 (170,239.4)−257,482.8 (184,100.5)−221,945.2 (187,034.7)−221,945.2 (124,977.8)
Total Internal Patients 29.77748 (1.995884)29.24453 (2.318873)29.5028 (3.672652)29.5028 (1.53056)
Days of Stay9.627841 (0.6174054)9.806502 (0.706705)9.71513 (1.003908)9.71513 (0.4693699)
Total Number of Outpatients7.707917 (0.5921816)8.544256 (0.6152159)8.121719 (1.044999)8.121719 (0.427375)
Total Surgeries111.7947 (12.60767)130.2421 (13.89072)120.507 (21.77539)120.507 (9.361653)
Total Laboratory Tests0.4572315 (0.0269609)0.4933744 (0.0286535)0.4756304 (0.0481975)0.4756304 (0.0196695)
Medical Imaging Tests5.869697 (0.6399809)6.709507 (0.6620062)6.289428 (1.200686)6.289428 (0.4600281)
Average Days of Stay−11,523.83 (20,782.18)−5940.653 (23,832.93)−9048.96 (11,783.63)−9048.96 (15,697.78)
Average Bed Coverage719,374 (236,046.4)644,088.4 (243,526)677,010.9 (523,825.4)677,010.9 (169,197.2)
Patient Income Rate421,863.9 (178,211.9)314,378.6 (184,733.5)365,219.9 (296,320.8)365,219.9 (128,091.2)
Total Number of Employees1212.711 (66.04963)1,325.883 (62.22339)1271.508 (111.8295)1271.508 (45.33585)
Intensive Care Unit850,144.1 (115,520.8)879,509.4 (127,579.9)864,251.8 (109,305.8)864,251.8 (85,831.18)
Artificial Kidney Unit453,859.2 (141,255.3)537,861.2 (153,044.8)496,155.2 (116,690.6)496,155.2 (103,787.5)
Number of Dialysis57.45735 (12.96495)65.3004 (14.15578)61.34309 (11.70055)61.34309 (9.565,021)
Gas Yes/No335,470.1 (137,725.1)456,603.5 (147,253.1)396,036.8 (136,887.2)396,036.8 (100,556.3)
Average Low Temperature in Winter °C301.2561 (20,963.22)3182.975 (22,739.5) 1742.116 (30,626.47)1742.116 (15,412.65)
Average High Temperature in Summer °C94,859.44 (38,050.85)109,922.1 (41,126.1)102,390.8 (35,712.58)102,390.8 (27,926.4)
Table 4. Correlations between continuous variables of hospital output as calculated from both years’ data.
Pearson’s CorrelationsBedsInternal PatientsDays of StayTotal number of OutpatientsNumber of Sessions in AKUTotal SurgeriesLaboratory TestsMedical Imaging TestsTotal Number of EmployeesAverage Days of StayAverage Bed CoveragePatient Income Rate
Beds1.0000
Internal patients0.79961.0000
Days of stay0.90740.89861.0000
Total number of outpatients0.75560.85320.78021.0000
Number of sessions in AKU0.30700.38870.31180.49601.0000
Total number of surgeries0.70210.80450.74070.86120.41081.0000
Laboratory tests0.79320.87720.87620.83160.35750.77311.0000
Medical imaging tests0.62950.71190.68070.78930.38320.77600.72211.0000
Total number of employees0.92360.87930.92140.85240.35110.80120.91660.73981.0000
Average Days of Stay0.1921−0.1810.1579−0.2137−0.2041−0.2142−0.1472−0.1768−0.01051.0000
Average Bed Coverage0.23140.36160.46270.26370.13730.27790.29630.23950.32390.34801.0000
Patient Income Rate0.11180.44770.24260.35060.17510.42740.27350.24340.2290−0.40120.36991.0000
Table 5. Results for the hospital energy cost from the regression analyses for each year and in total.
VariablesLinear Regression for Cost of Energy Resources for Year 2018Linear Regression for Cost of Energy
Resources for Year 2019
Linear Regression for Cost of Energy
Resources Clustered per Hospital
Random Effect
Regression (GLS) for Cost of Energy Resources (Model 1)
Number of Obs = 121 R² = 0.8737 Number of Obs = 121
R² = 0.8823
Number of Obs = 242 Number of Groups = 121 R² = 0.8706Number of Obs = 242 Number of Groups = 121 Wald chi² = 771.39
Coef. (Std. Err.)Coef. (Std. Err.)Coef. (Std. Err.)Coef. (Std. Err.)
Number of Bedsb₁1737.639 (379.5269)1141.638 (407.442)1457.61 (427.0586) 1457.61 (280.5435)
Total Internal Patients b₂−7.148189 (4.642647)−20.38138 (4.466779)−14.39322 (4.973882)−14.39322 (3.244414)
Total Surgeriesb₃−41.46583 (11.992)−39.14559 (13.2354)−40.00607 (11.5357)−40.00607 (8.982373)
Medical Imaging Testsb₄0.6098211 (0.516857)1.371569 (0.549363)1.008296 (0.452521)1.008296 (0.3811336)
Total Number of Employeesb₅748.5674 (175.9849)1162.502 (187.1926)977.9197 (159.9215)977.9197 (129.222)
Gas Yes/Nob₆318,254.9 (107,887.6)318,874 (110,294.2)316,048.8 (100,715.5)316,048.8 (77,994.67)
Beds # Internal Patientsb₇0.0304837 (0.006491)0.0354459 (0.0065366)0.0325848 (0.0064755)0.0325848 (0.0046534)
Gass # Beds Gass = Yesb₈−2099.597 (289.5574)−1669.537 (289.5997)−1880.896 (409.1054)−1880.896 (206.8234)
Constantb₀−5651.184 (57,453.19)−8279.186 (59,706.13)−11,034.03 (40,728.71)−11,034.0 (41,903.62)
Table 6. Akaike’s information criterion and Bayesian information criterion for the two models.
ModelObsll (Null)ll (Model)dfAICBIC
Model 1242−3629.395−3381.432116784.8636823.242
Model 2242−3629.396−3402.7186821.4216849.332
Publisher’s Note: MDPI stays neutral with regard to jurisdictional claims in published maps and institutional affiliations.

