Article

Self-Heating of Biochar during Postproduction Storage by O2 Chemisorption at Low Temperatures

by
Aekjuthon Phounglamcheik
1,2,*,
Nils Johnson
1,
Norbert Kienzl
3,
Christoph Strasser
3 and
Kentaro Umeki
1,*
1
Division of Energy Science, Luleå University of Technology, 971 87 Lulea, Sweden
2
Material Science and Environmental Engineering, Tampere University, 33720 Tampere, Finland
3
BEST—Bioenergy and Sustainable Technologies GmbH, Inffeldgasse 21b, 8010 Graz, Austria
*
Authors to whom correspondence should be addressed.
Energies 2022, 15(1), 380; https://doi.org/10.3390/en15010380
Submission received: 27 November 2021 / Revised: 15 December 2021 / Accepted: 1 January 2022 / Published: 5 January 2022

Abstract

:
Biochar is attracting attention as an alternative carbon/fuel source to coal in the process industry and energy sector. However, it is prone to self-heating and often leads to spontaneous ignition and thermal runaway during storage, resulting in production loss and health risks. This study investigates biochar self-heating upon its contact with O2 at low temperatures, i.e., 50–300 °C. First, kinetic parameters of O2 adsorption and CO2 release were measured in a thermogravimetric analyzer using biochar produced from a pilot-scale pyrolysis process. Then, specific heat capacity and heat of reactions were measured in a differential scanning calorimeter. Finally, a one-dimensional transient model was developed to simulate self-heating in containers and gain insight into the influences of major parameters. The model showed a good agreement with experimental measurement in a closed metal container. It was observed that char temperature slowly increased from the initial temperature due to heat released during O2 adsorption. Thermal runaway, i.e., self-ignition, was observed in some cases even at the initial biochar temperature of ca. 200 °C. However, if O2 is not permeable through the container materials, the temperature starts decreasing after the consumption of O2 in the container. The simulation model was also applied to examine important factors related to self-heating. The results suggested that self-heating can be somewhat mitigated by decreasing the void fraction, reducing storage volume, and lowering the initial char temperature. This study demonstrated a robust way to estimate the cooling demands required in the biochar production process.

1. Introduction

Recently, biochar produced from the pyrolysis of biomass is attracting great interest as renewable material that can move society towards carbon neutral or carbon negative. One area of biochar application is soil amendment and carbon sink [1]. Other applications of biochar include alternative to fossil fuels, especially coal, in co-firing power plants [2,3], syngas production [4], and metallurgical processes [5,6]. An increase in biomass and char demands means an expansion in its production capacity, storage, and transportation. However, literature reported that biochar is prone to self-heating, which needs a closer look to avoid fire hazards. Spontaneous fire not only results in unnecessary production and maintenance costs but also leads to potential injuries and fatalities of operation personals. As reported by Krigstin et al. in 2018 [7], self-heating caused the highest number of incidents in biomass storage. They also reported that self-heating mishaps during biomass storage have significantly increased since 2014. Although no informative study of self-heating incidents was found, a similar trend should also appear for biochar. Thus, it is essential to prevent this incident in biochar production, particularly in large-scale storage. Some methods are generally recommended and practiced to prevent the self-heating of coal, such as forced cooling by water and oxygen purging with inert gases. However, biochar is high temperature upon production, and it requires being cooled before storage. Therefore, it is useful to have a predictive tool for self-heating in biochar storage in order to design a cooling process based on its production and storage conditions.
Biochar is reactive porous media that can undergo exothermic reactions at low temperatures [8,9]. Unlike raw biomasses, biochar is usually hydrophobic and has high carbon content [10]. Therefore, the self-heating of biochar is more likely to be initiated by exothermic oxidation between char and surrounding air rather than microbiological reactions, which are common causes for the self-heating of raw biomasses [11,12,13,14]. Char oxidation at low temperatures releases heat and increases its temperature slowly. If the heat release rate is higher than the dissipation rate by heat losses, thermal runaway will take place and lead to spontaneous ignition in the char storage [8,15]. Hence, more reactive chars would exhibit higher risks of thermal runaway. However, no study reported a clear reason behind the spontaneous oxidation of biochar at low temperatures. Among few publications on char oxidation at low temperature, Fan et al. [16] measured the oxidation rate of cornstalk char in the air by using thermogravimetric analysis (TGA) coupled with differential scanning calorimetry (DSC). They observed an exothermic reaction starting at around 120 °C, where the mass of the sample slightly increased. Major mass loss became apparent at the temperature above 220 °C due to oxidation. This result implies that the self-heating of biochar is initiated from exothermic heat generated by O2 chemisorption on the surface of biochar. Therefore, the kinetics of O2 chemisorption is an important information required to predict self-heating in biochar. Several works [17,18,19] measured and formulated combustion kinetics of char at high temperatures. Nevertheless, to the best of our knowledge, no previous work has investigated the kinetics of O2 chemisorption on biochar quantitatively, especially at low temperatures ranges, i.e., below 300 °C.
Despite the missing knowledge on the reaction kinetics, some studies investigated factors influencing self-heating related to char properties and storage conditions [8], such as pyrolysis temperature, ambient temperature, particle size, and storage size. Restuccia et al. [8] investigated the effects of pyrolysis temperature and raw biomass on the ignition temperature of char at different bed sizes. They observed self-heating at ambient temperatures between 100 and 245 °C. Among char produced between 350 °C and 800 °C, char produced at 450 °C showed the lowest ambient temperature for ignition, i.e., the highest risk. The authors explained that this observation occurred because char produced at temperatures higher than ca. 400 °C contained mostly lignin, which is less reactive. However, another reason could correlate to thermal annealing of biochar at high pyrolysis temperatures, resulting in a well-ordered aromatic structure with fewer defects as investigated in our previous work [20]. This observation is in agreement with statistical analysis provided by Riva et al. [21], which reported that self-heating of biochar pellets is low if the heat treatment is carried out at high temperatures. The result from Restuccia et al. [8] also showed that larger storages volume and larger char particles have lower ignition temperatures, meaning more prone to thermal runaway. Nevertheless, the results from these studies cannot be generalized and are not a quantitative prediction for different biochar samples, storage sizes, or container materials. There is a need to quantify the oxidation kinetics and resolve local temperature and concentration fields inside the storage volume for more quantitative prediction.
Due to the limitation to measure information locally inside large storages by experiments, numerical simulation is a suitable tool to reveal this information. It appears that some studies applied numerical simulation to investigate self-heating of raw biomass [22,23], but not for char. Indeed, no previous work considered O2 chemisorption at low temperatures (<300 °C) in the model. Thus, this work aims at developing a numerical model to describe and predict self-heating and thermal runaway of biochar in large-scale containers. The main objective of this work is to describe the role of O2 chemisorption on the self-heating of biochar with the help of reaction kinetics and a numerical model. Moreover, the simulation model has been used to reveal factors affecting this event in detail. Finally, recommended process conditions of biochar storage are presented to prevent thermal runaway and self-ignition during storage and transportation.

2. Materials and Methods

2.1. Sample Preparation

Biochar studied in this work was produced from a pilot-scale pyrolysis process. The raw material is dried poplar woodchips in sizes smaller than 30 mm. A rotary kiln reactor was used to pyrolyze woodchips at the temperature of 340 °C with a residence time of ca. 30 min. Biochar obtained from the reactor was cooled down to 40 °C, before being stored in closed containers. Table 1 summarizes the physical and chemical properties of the char sample. The bulk density was measured according to VDLUFA-Method A 13.2.1 [24]. Skeleton density, or true density, was measured by using a gas displacement pycnometer (Micromeritics AccuPyc II 1340 (Norcross, GA, USA)) with He as the gas medium. Proximate analysis was carried out by independent measurements of volatile matter and ash content according to ISO18123:2015 and ISO18122:2015, respectively. The fixed carbon content was calculated by difference. The major elemental composition was measured using EA3000, CHNS-O elemental analyzer from Eurovector Srl (Pavia, Italy). Higher heating value was measured by using a bomb calorimeter, IKA C200 (Staufen, Germany).

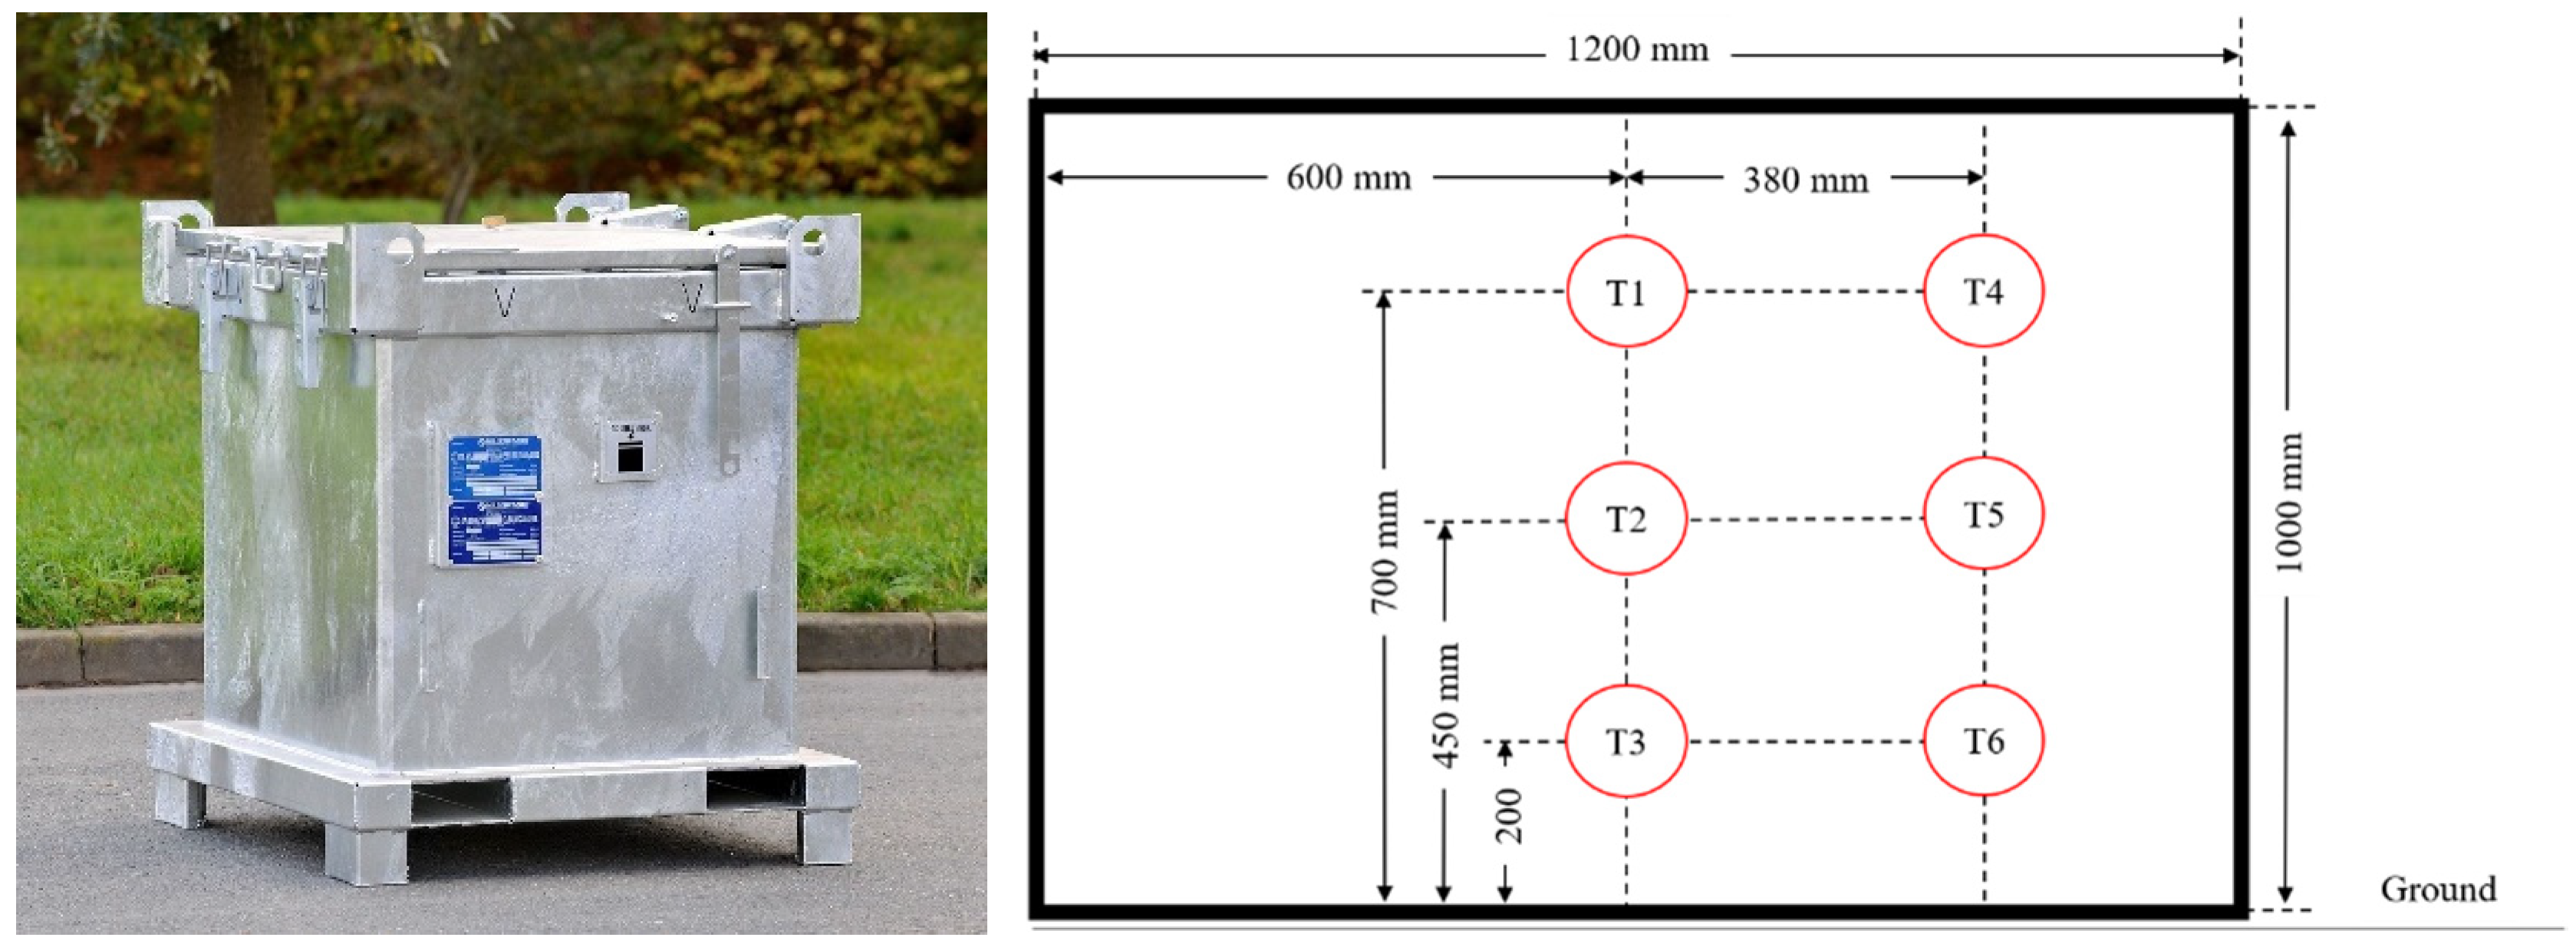
2.2. Self-Heating in a Large-Scale Container

The changes in the local temperatures inside biochar storage were monitored in a closed container made of galvanized steel, as depicted in Figure 1. This container is commonly used for the transportation of hazardous solid materials. The total volume of the container is 800 L, which has the dimension of 1200 mm in length, 1210 mm in width, and 1000 mm in height. Six type-K thermocouples were installed inside the container at the position illustrated in Figure 1. Around 150 kg of biochar was stored in the container, which was kept under ambient temperatures varied between 12 and 25 °C. The char temperatures were measured every 5 min for 16 h.

2.3. Measurement of Oxidation Kinetic Parameters

O2 chemisorption kinetics of the char sample was measured with TGA8000 from PerkinElmer Inc. (Waltham, MA, USA) A char sample with particle size below 75 µm was used to minimize the effects of intraparticle diffusion. Around 0.5–1.5 mg of the sample was loaded and spread at the bottom of an alumina crucible (diameter of 7 mm and height of 2 mm) as a thin layer to minimize the effects of interparticle diffusion. Reaction gas was fed vertically down to the crucible, and the total flow rate was kept constant at 100 mL min−1 at the standard state (25 °C and 105 Pa). This high total gas flow rate was applied to minimize the effects of gas film diffusion. Initially, the sample was heated to 340 °C at a heating rate of 50 °C min−1 and kept at 340 °C for 30 min under pure N2 (purity = 99.996%) to desorb any O2 gas molecules being adsorbed on the char sample. The sample was then cooled down to the target temperatures, that is, 50, 75, 100, 150, 200, 250, 275, and 300 °C, and held for 10 min before the measurement. The gas composition was switched from pure N2 to the oxidizing conditions, i.e., 5, 10, and 20% (vol.) of O2 in N2. The sample was held at the target conditions for 180 min. Figure S1 in the supplementary material depicts an example of TG curves obtained from the experiment with three repetitions.
The kinetic model in this work was simplified by assuming CO2 to be the only product of the reaction while CO generation is neglected [25,26]. Hence, the simplified reaction schemes used in this study can be expressed as:
C f + O 2 k 1 f ,   k 1 b C ( O 2 )   and
C + C ( O 2 ) k 2 C f + C O 2 .
Reaction 1 represents the chemisorption of O2 on active sites, including adsorption and desorption paths, while Reaction 2 describes the formation of CO2 from the surface. Cf denotes a free active carbon site, referring to a carbon site available for adsorption, while C(O2) represents the active carbon site occupied by O2 molecules. We assume that the specific surface area (S, m2 g−1) and the density of active sites ( ξ , mol m−2) remain constant under the initial stage of the char conversion considered in this study. Therefore, Reaction 2 includes the transformation of non-active carbon into a free active site. The rate of change with respect to the occupied site fractions was adapted from the method provided by Haugen et al. [25,26] as:
d θ C ( O 2 ) d t = k 1 f · p O 2 · θ f k 1 b · θ C ( O 2 ) k 2 · θ C ( O 2 ) .
The term ki represents the rate constant of reaction i. The site fractions θ f and θ C ( O 2 ) denote the fraction of free-carbon sites and the fraction of occupied sites, respectively. Therefore, the sum of these site fractions is unity, i.e., θ f + θ C ( O 2 ) = 1 .
The adsorption and desorption rate constants, k1f and k1b, were determined by using the experimental results obtained at the isothermal temperatures of 50–175 °C, where the loss of carbon from biochar is negligible ( k 2 0 ) . Hence, the apparent rate of Reaction 1 can be written as:
r R 1 = 1 m o · d m d t = M O 2 · S · ξ · ( k 1 f · p O 2 · θ f k 1 b · θ C ( O 2 ) ) ,
where m is the sample mass in g, m o is the initial sample mass in g, M O 2 is the molecular weight of O2 molecules in g mol−1, S is the specific surface area in m2 g−1, and ξ is the surface concentration of the active sites in mol m−2. The correlation between Equations (3) and (4) gives:
1 m 0 · d m d t = M O 2 · S · ξ · d θ C ( O 2 ) d t .
By integrating m from m0 to m, and θ C ( O 2 ) from 0 to θ C ( O 2 ) , the occupied site fraction can be determined by:
θ C ( O 2 ) = m m 0 m s a t m 0 ,
where m s a t represents the mass at the saturated point of the adsorption, which is expressed as m s a t = ( S · ξ · M O 2 + 1 ) · m 0 . This saturated mass was defined at the maximum mass observed from the experiment due to the adsorption, which was 1.0255 m 0 . Figure S2a in the supplementary material depicts an example of the fitting for k1f and k1b.
The rate constant for Reaction 2, k2, was determined using the experimental results obtained from the isothermal temperatures of 250–300 °C. Here, significant mass loss occurs due to the release of carbon atoms at the occupied active site to the gas phase due to Reaction 2. At this temperature, the change in mass due to chemisorption, Reaction 1, is relatively negligible. Carbon conversion is defined as:
X = 1 m C m 0 ,
where m C is the mass of remaining carbon at a given conversion. Meanwhile, the rate of Reaction 2 can be expressed as:
r R 2 = d X d t = M C ( O 2 ) · S · ξ · ( 1 X ) · ( k 2 · θ C ( O 2 ) ) .
By assuming d θ C ( O 2 ) d t = 0 in Equation (3), the occupied site fraction can be determined as:
θ C ( O 2 ) = k 1 f · p O 2 k 1 f · p O 2 + k 1 b + k 2 .
Hence, the rate constant for Reaction 2, k2, can be determined. It should be noted that the rate of the surface reaction was determined by using the data up to the conversion of 0.1 in order to obtain the best fitting. This is sufficient to be applied accurately in the self-heating and ignition simulation, where the conversion of the surface reaction is nearly zero. Figure S2b in the supplementary material depicts an example of the fitting for k2. The fitted rate constants are provided in Table S1.
Kinetic parameters, i.e., activation energies (E) and pre-exponential factors (A), of the reactions were determined using the Arrhenius equation. In order to get the best fitting to the experimental results, kinetic parameters were optimized by using the least-square method as described by Equation (S1) in the supplementary material.

2.4. Measurement of Specific Heat Capacity and Heat of Reaction

The heat of the reactions was measured by TGA-DSC using a thermal analyzer STA 449C Jupiter from Netzsch (Selb, Germany). Around 10 mg of the sample was heated from 25 to 340 °C at 20 °C min−1 in N2 and held for 30 min to desorb O2 contained in the sample. Then, the sample was cooled down to 40 °C and held for 10 min before the main measurement. The gas composition was switched from pure N2 to air, and the sample was heated to 300 °C at a heating rate of 10 °C min−1. The experiment was repeated two times.
Specific heat capacity (Cp) was assumed to be a linear function of temperature, which can be described as:
C p = a + b T ,
where a and b are heat capacity coefficients, and the temperature is in K. The sensible heat can be described as h = m ¯ T 1 T 2 ( a + b T ) d T .
The specific heat of Reaction 1, Δ H ¯ R 1 , and Reaction 2, Δ H ¯ R 2 , was assumed to be constant and independent from temperature. The total heat flow measured from the DSC experiment involves sensible heat and heat of reactions, which can be expressed as:
H = ( m · C p · d T d t ) + ( r R 1 · Δ H ¯ R 1 ) + ( r R 2 · Δ H ¯ R 2 ) .
The specific heat of the two reactions was optimized by a similar method as the rate constants.

2.5. Bed Model for Self-Heating of Biochar during Storage

Detailed simulation of self-heating in char storage has been performed in a one-dimensional transient model based on Cartesian coordinate. This model was extended from the particle model developed in the previous study [27]. It was derived under the assumption of local thermal equilibrium between gas and solid phase due to the absence of forced convective flows. The model geometry duplicates the dimension of the closed metal container described earlier, while boundary conditions allow us to modify the model for different types of containers, such as the one made of air-permeable materials.

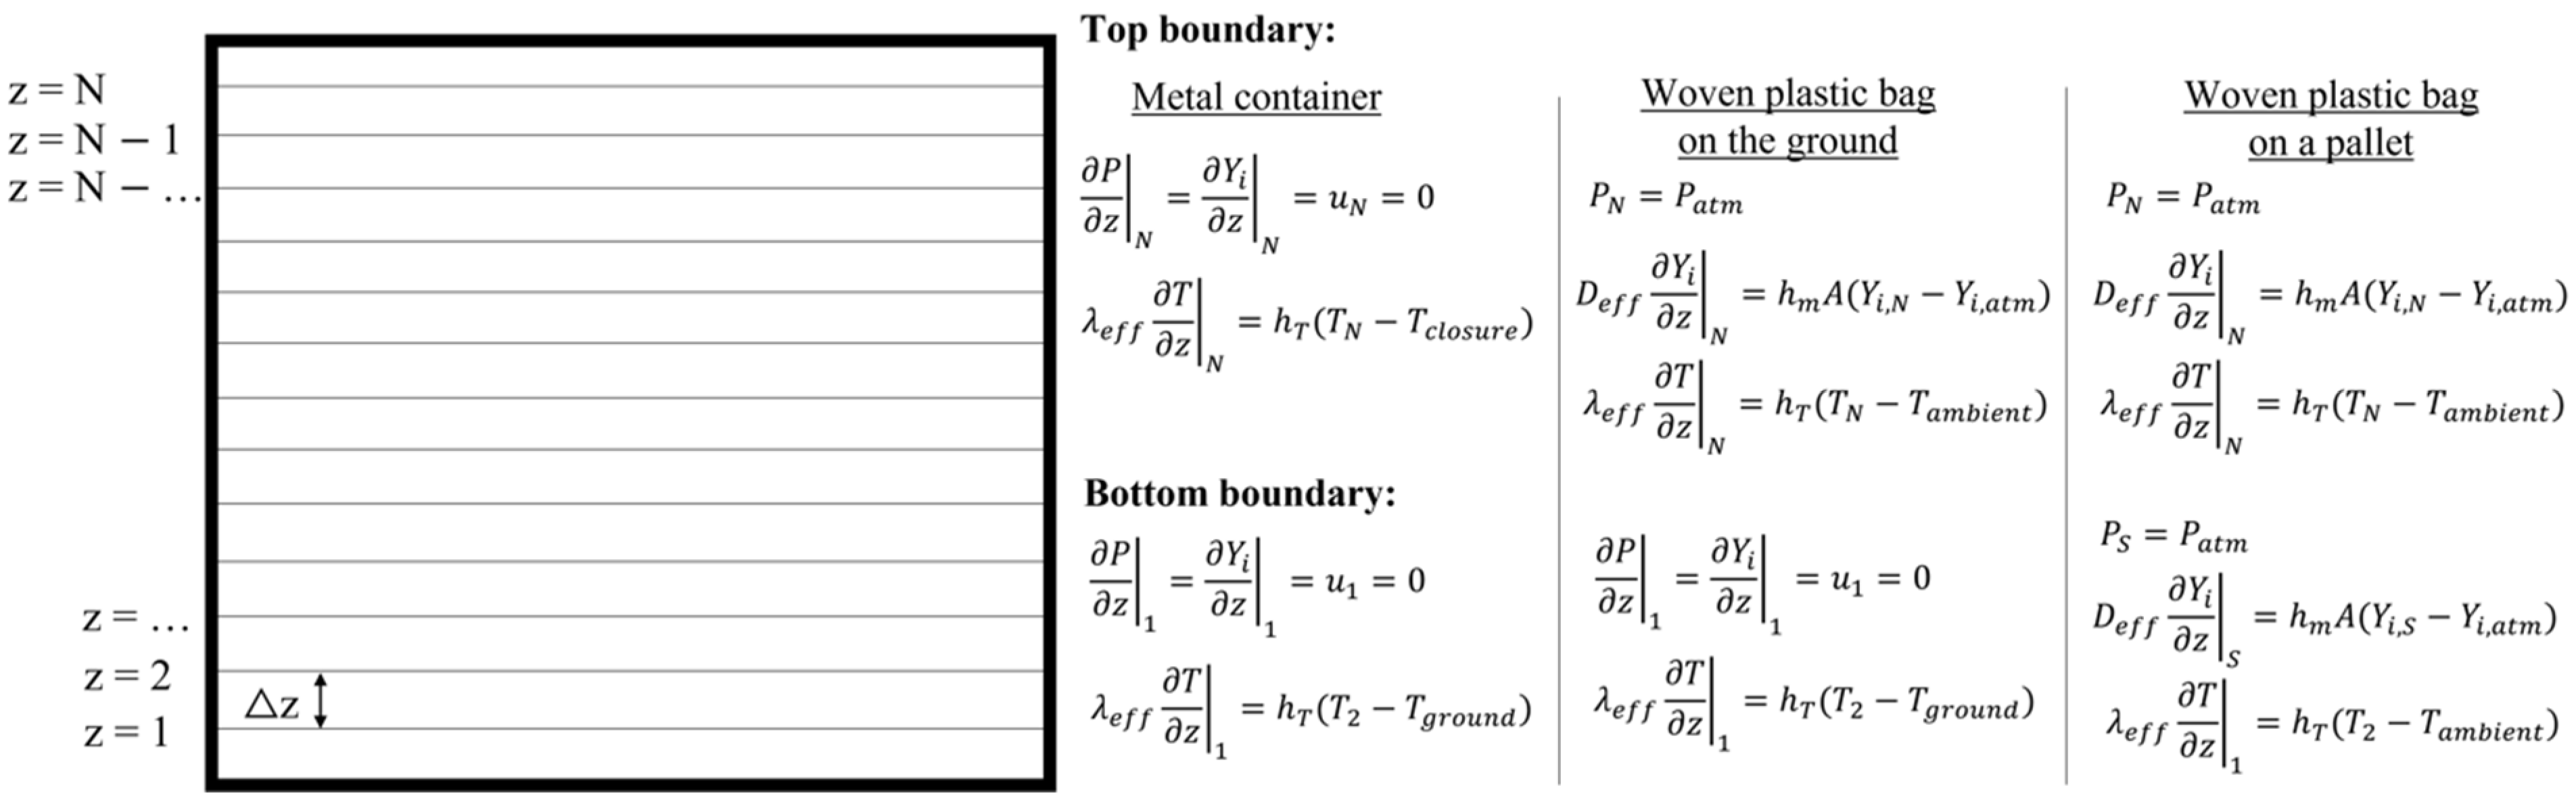
2.5.1. Governing Equations

In the solid phase, the mass conservation equation of biochar can be described as:
t ( ρ c θ C ( O 2 ) ) = p O 2 k a d s ρ c ( 1 θ C ( O 2 ) ) k d e s ρ c θ C ( O 2 ) k 2 ρ c θ C ( O 2 ) ,
where ρ c and t represent the bulk density of char and time, respectively. The rate constants were calculated from the kinetic model described earlier.
Transport equations of gaseous species including O2, CO2, and N2 were considered as multicomponent convective-diffusion equations with heterogeneous surface reactions, which can be expressed as:
ε t ( ρ g Y i ) + z ( ρ g u Y i ) = z ( ρ g D e f f Y i z ) + S , i ,
where ε , ρ g , Yi, and Deff represent the bed void fraction, gas density, mass fraction, and gas effective diffusivity, respectively. The source term of gas species i, S , i , is obtained from the reactions. The superficial gas velocity, u, is calculated from Darcy’s law, which can be written as u = φ μ P z , where, P, φ , and µ, are the pressure, permeability, and viscosity of the gas, respectively. The state of gas in the container is approximated by the ideal gas law. The energy balance equation was derived by assuming the local thermal equilibrium between solid and gas phases, which can be written as:
t [ ( ε ρ g C p , g + ρ c C p , c ) T ] + z ( ρ g u C p , g T ) = z ( λ e f f T z ) + Δ H ¯ j S , j ,
where C p and λ e f f are specific heat capacity and effective thermal conductivity, respectively. The specific heat of reactions, Δ H ¯ j , were obtained from the experimental measurement in the previous section. The sub-models for physical properties are provided in Table S2 in the supplementary material.

2.5.2. Numerical Methods

The set of partial differential equations were numerically solved in MATLAB® (Natick, MA, USA). The governing equations were discretized on a staggered grid by the finite volume method. The container was divided into 100 control volumes with a constant distance in the vertical direction, as shown in Figure 2. The fully implicit scheme was applied for the transient terms with the time-step of 60 s. Due to the low gas velocity in this study, the Courant number remained low even with this large time-step. Diffusion and convection terms were discretized by using the power-law scheme. The discretized equations were solved by using the tri-diagonal matrix algorithm method. Pressure-velocity coupled system was solved by the SIMPLE (Semi-coupled Implicit Method for Pressure Linked Equations) algorithm. Chemical reaction rates were integrated with smaller time-steps (time-step splitting method) to deal with its stiffness. Integrated value was implemented to the transport equations as source terms.
The boundary conditions were defined regarding the configuration of different containers, as provided in Figure 2. For the closed metal container, there are no mass or momentum exchanges between the container and the surrounding environment, while heat exchanges occur at the top and bottom of the container via convective heat transfer. For the case of a woven plastic bag on the ground, the mass and momentum exchanges are allowed at the top of the container, while the bottom boundary condition is the same as the previous case. In the case of a woven plastic bag placed on a pallet, momentum, mass, and energy are exchanged at both the top and the bottom of the container. The initial conditions are provided in Table 2.

3. Results and Discussion

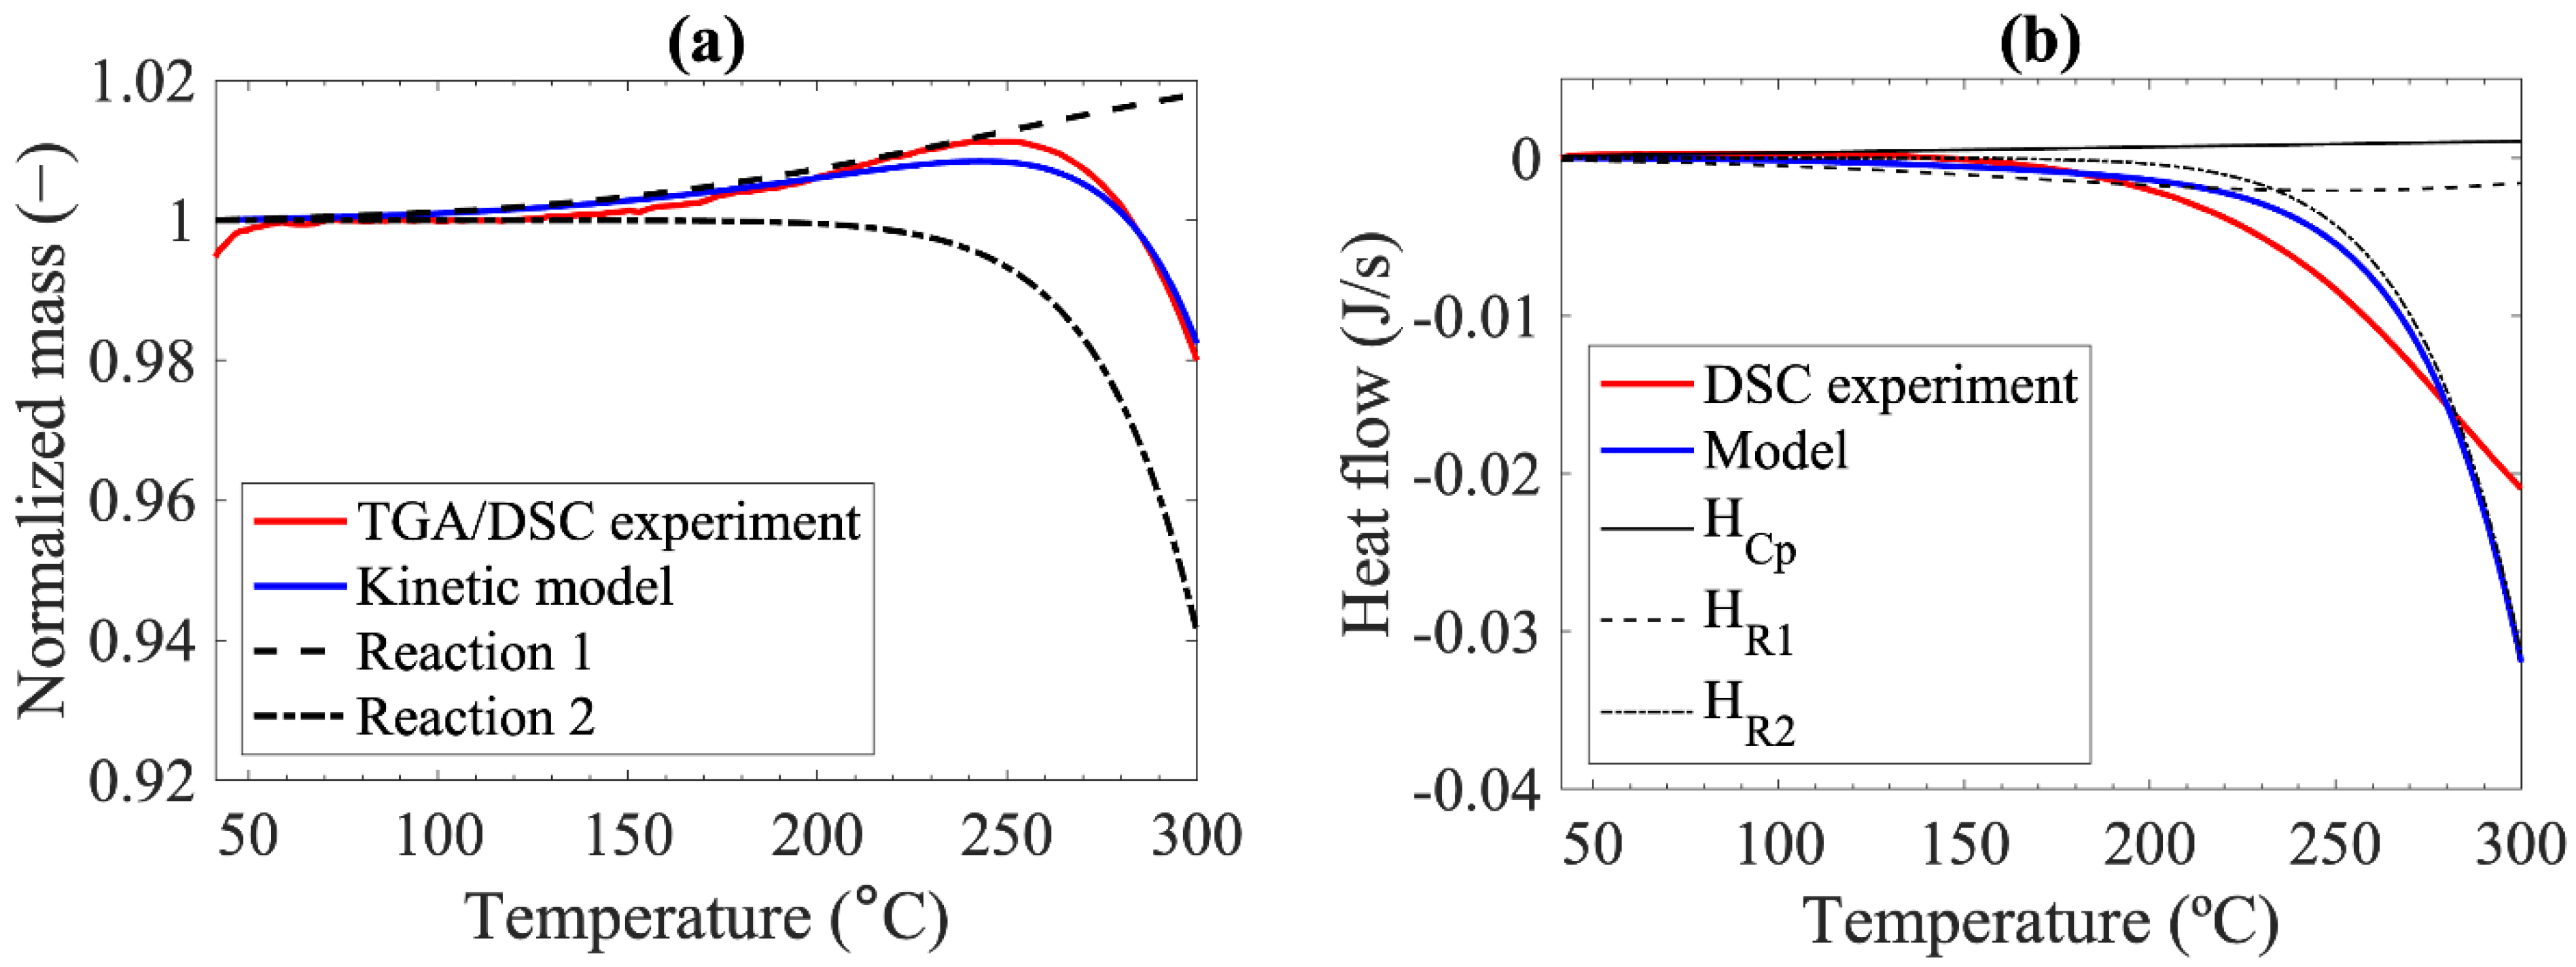
3.1. Kinetic Parameters of Biochar Oxidation at Low Temperature

Based on the methods described in Section 2.3, the reaction rate constants were estimated to be:
k 1 f = ( 1.16 1 s · b a r ) · exp ( 22.5 k J m o l R T ) ,
k 1 b = ( 3.34 1 s ) · exp ( 41.2 k J m o l R T ) ,
k 2 = ( 3.08 × 10 5 1 s ) · exp ( 103.3 k J m o l R T ) .
Comparison between the experiment and the model in the Arrhenius plots can be found in Figure S3 in the supplementary material. Figure 3a shows the mass changes calculated by the kinetic model, i.e., the summation of Equations (4) and (8), in comparison with the measurement in TGA-DSC experiment. The model shows good agreement with the experiment, with the benefit of predicting individual mass changes due to chemisorption and surface reaction.
Figure 3b depicts the heat flow measured from the char sample as a function of temperatures, which include influences of sensible heat, the heat of chemisorption, and the heat of surface reaction. Heat balance was slightly endothermic at temperatures below ca. 100 °C. Since the mass of the sample stayed nearly constant, the heat balance was dominated by sensible heat. Heat balance turned exothermic at the temperature above ca. 140 °C, mainly due to the heat of reactions.
The sensible heat of biochar under N2 was used to determine heat capacity coefficients (see Figure S4a). The coefficients a and b are −0.575 J g−1 K−1 and 0.00208 J g−1 K−2, respectively. The specific heat capacity of biochar obtained in this study, shown in Figure S4b, is lower than the values reported in the literature [28,29], which may be due to different material and pyrolysis conditions.
The specific heat of Reaction 1 is −10.04 MJ kg−1, while the specific heat of Reaction 2 is −8.57 MJ kg−1. As shown in Figure 3b, the heat balance of char is dominated by the sensible heat and the heat of Reaction 1 at temperatures below 200 °C. At higher temperatures, the exothermic heat progressively increased due to the high rate of Reaction 2. It is worth mentioning that the summation of specific heat of reactions is lower than the HHV, which may be due to CO formation. However, the degree of CO formation was set outside the scope of this study.

3.2. Self-Heating in a Closed Metal Container

This section discusses the results of the self-heating in a closed metal container obtained from the experiment and the simulation. It presents the self-heating behavior in the biochar storage with a limited supply of O2 from the surrounding environment.

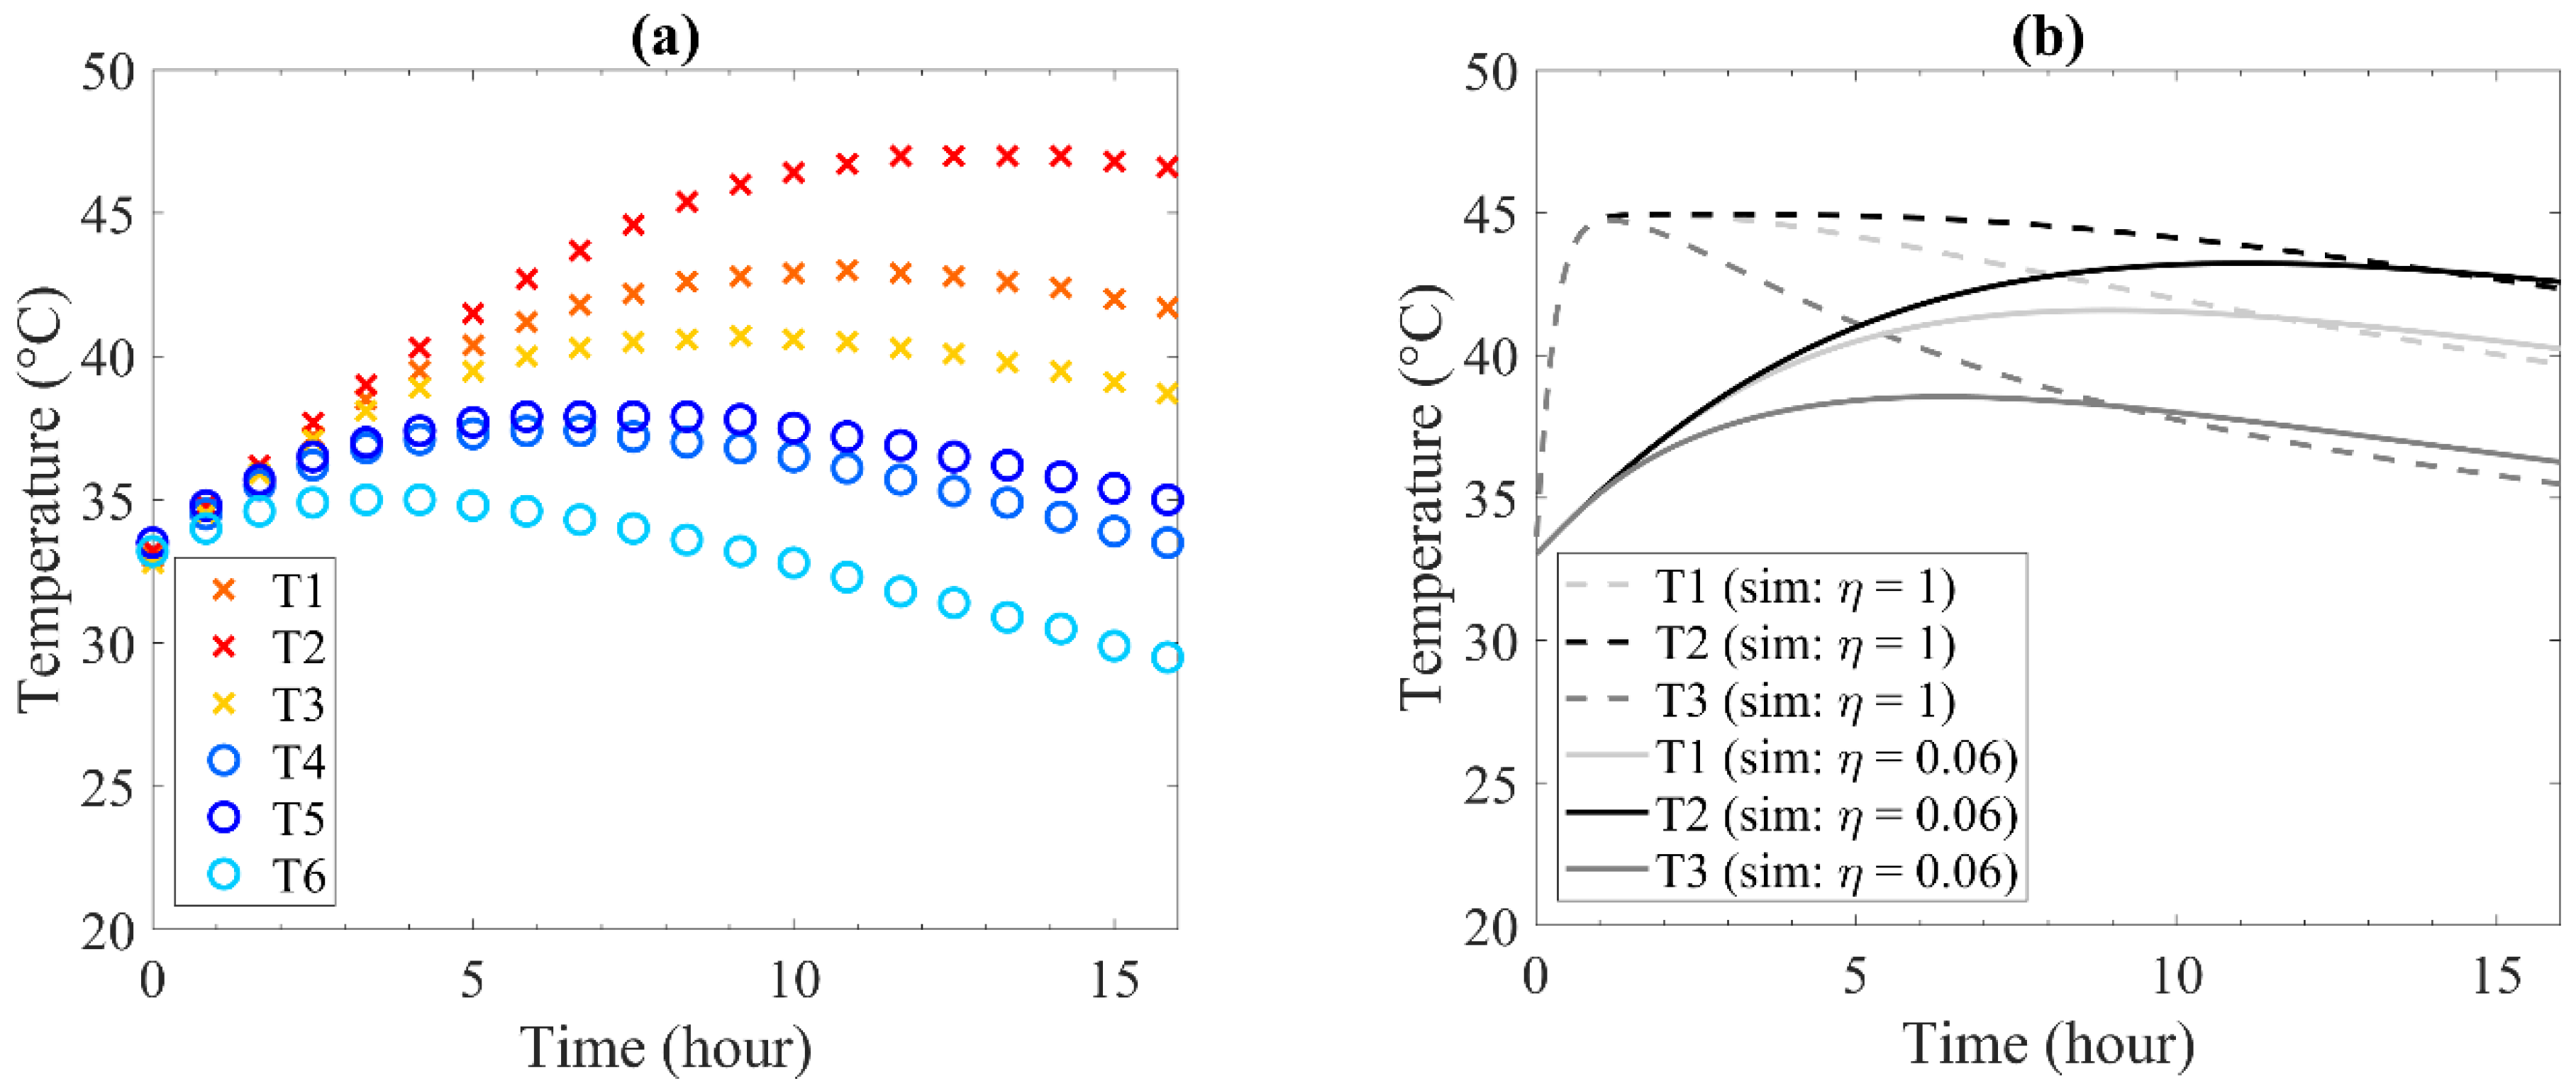
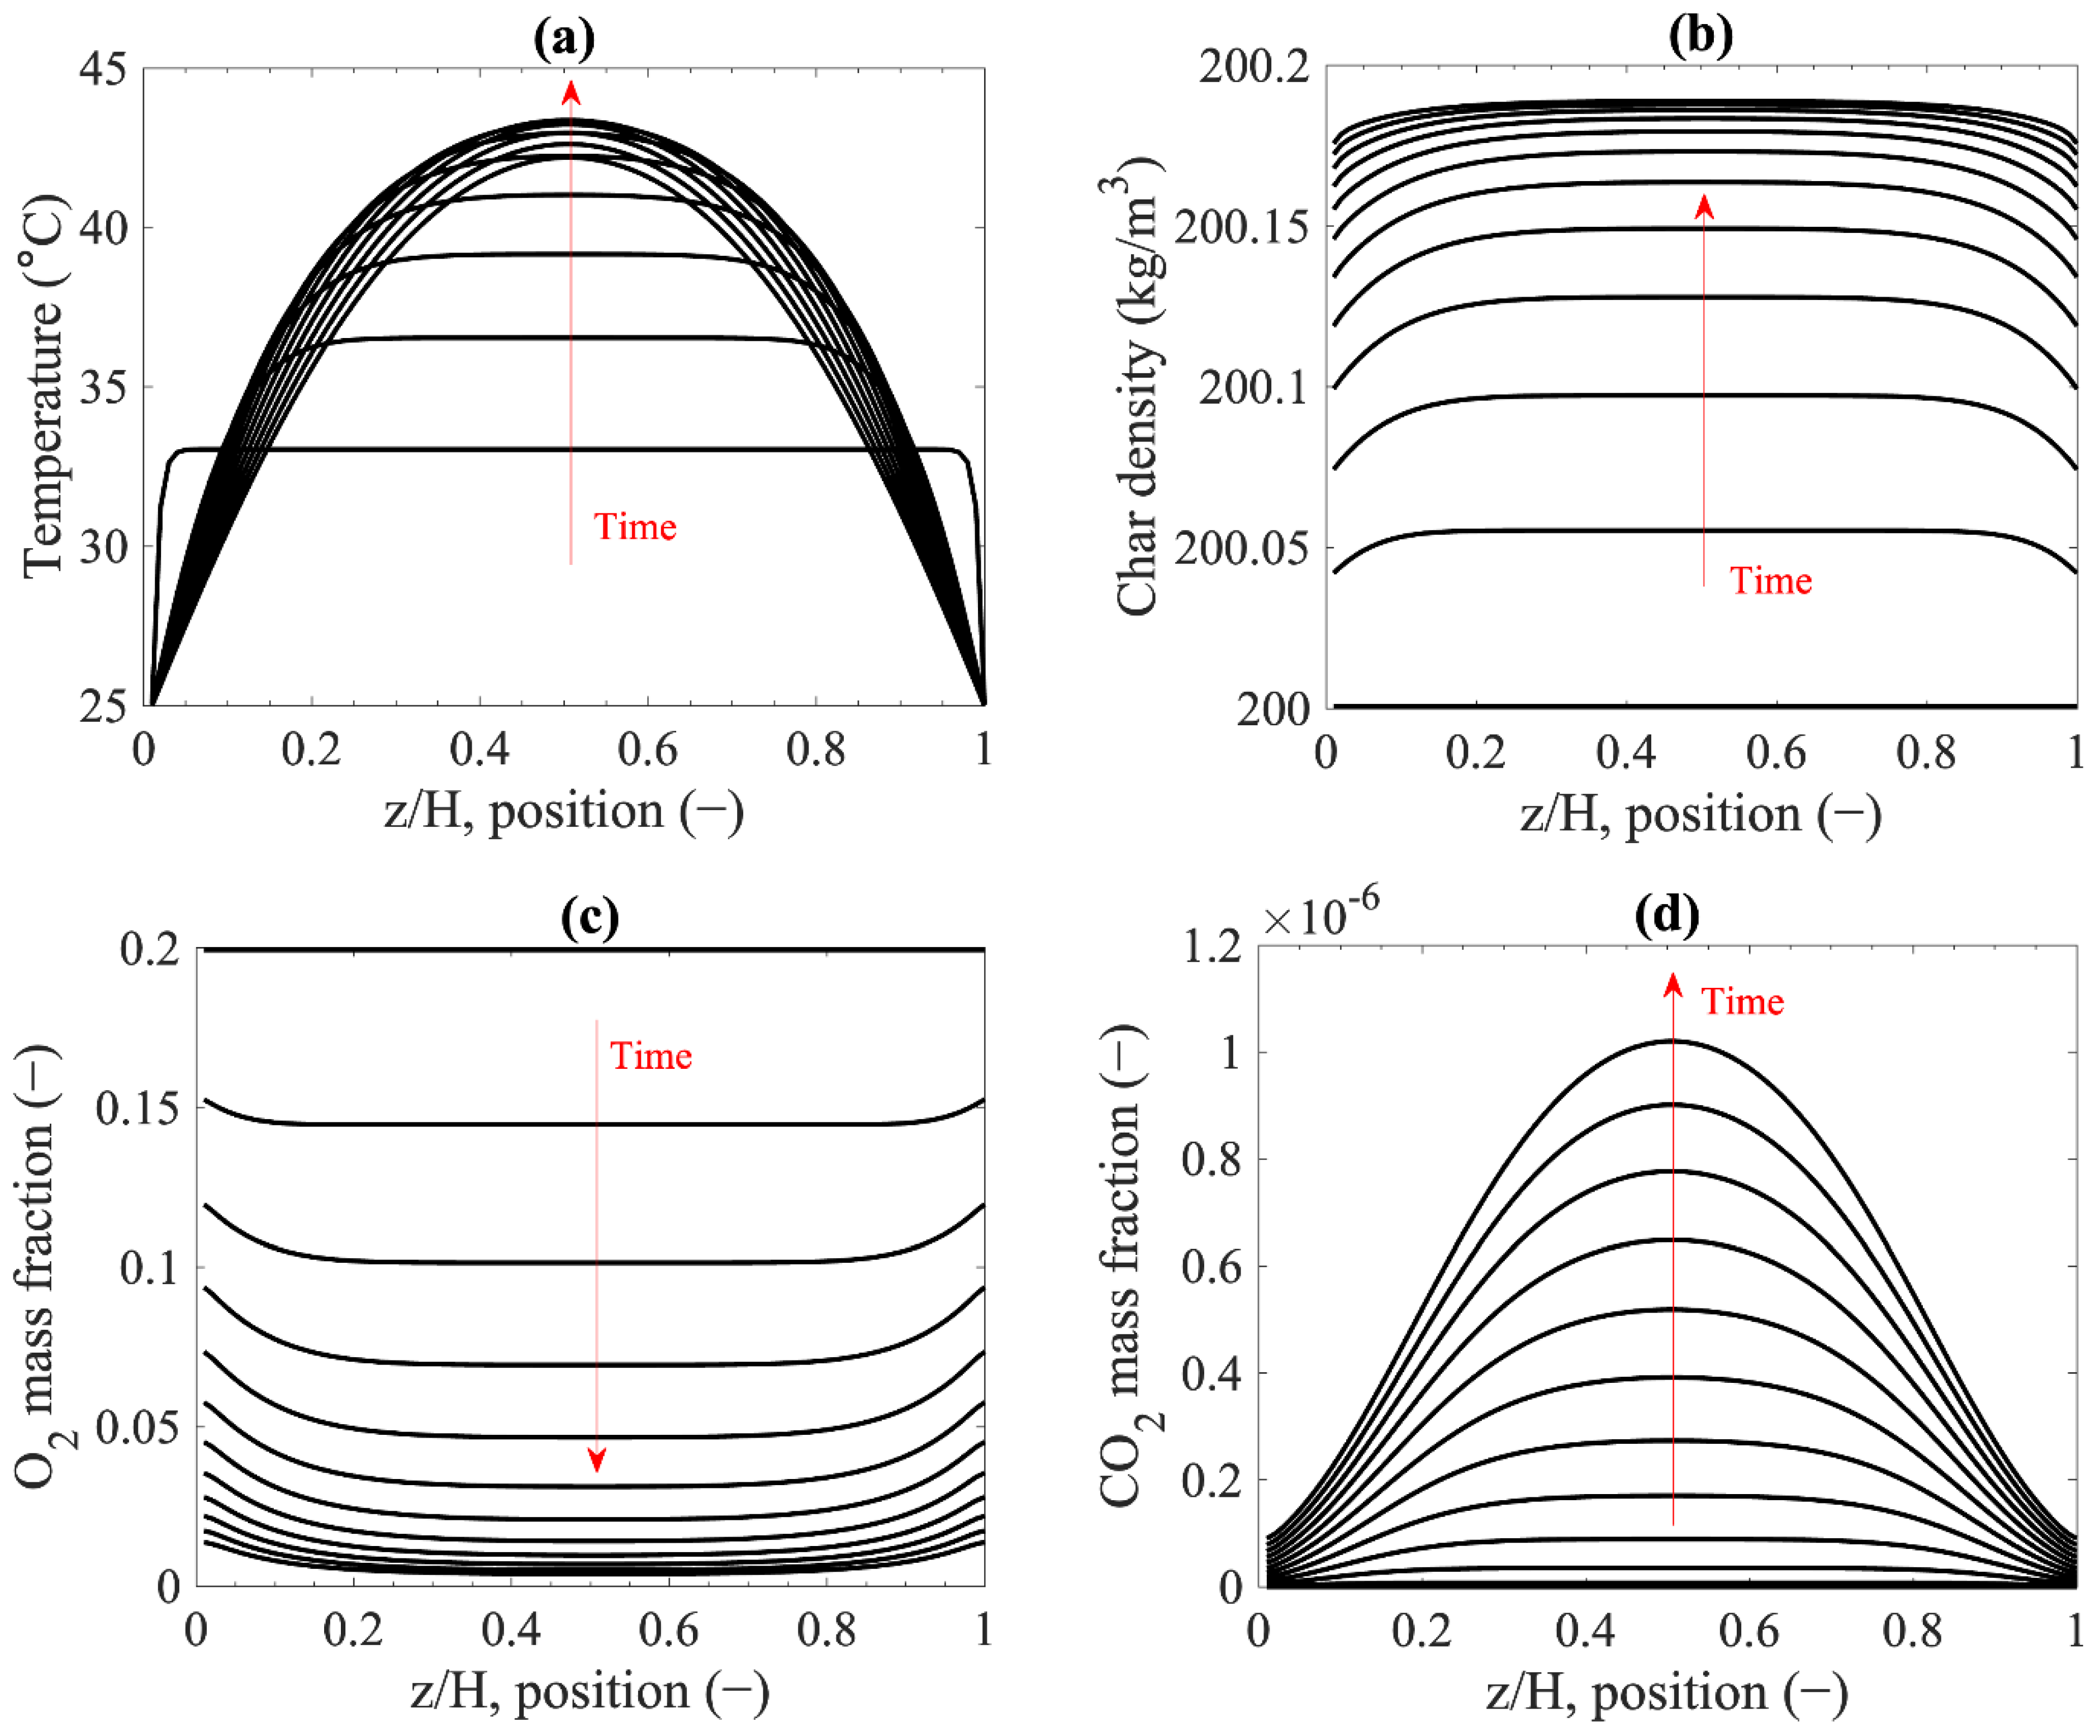
3.2.1. Comparison between Experimental and Simulation Results

Figure 4 depicts the temperatures at the different spots in the closed container (defined in Figure 1). The experimental results, Figure 4a, show that char temperature increased during the measurement, that is, self-heating of biochar in a closed container. The maximum temperature was observed at the middle of the container (T2), which was 47.1 °C after 12.4 h. In addition, the result shows temperature variation in both vertical and horizontal directions. In the horizontal direction, the temperatures at the center (T1–T3) were higher than those near the wall (T4–T6). This temperature variation in the horizontal direction indicates the cooling effects from the wall. Likewise, in the vertical direction, temperatures measured at the center of the container, i.e., T2 and T5, were higher than those closer to the bottom and the top. In addition, the bottom temperatures (T3 and T6) were lower than top temperatures (T1 and T4), which may be due to higher heat conductivity at the bottom where the container was placed on the ground.
Figure 4b depicts that temperature determined from the simulation reproduced a general trend observed in the experimental measurement. However, the simulation results that neglected intraparticle diffusion, i.e., effectiveness factor ( η ) = 1, showed a sharp temperature increase from 33 °C to 46.7 °C in ca. 1 h. This is much faster than the experimental result. It means that intraparticle diffusion played a vital role in reaction rates due to large particle size (ca. 30 mm). Heating time increases along with the decrease in effectiveness factors (see Figure S5 in the supplementary document). The best fit to the experimental result was obtained at η = 0.06, where the maximum temperature reached 43.5 °C in 11 h. The simulation exhibited lower maximum temperatures than the experiment, most probably because it neglected the heat dissipation in the horizontal direction. Nevertheless, it predicted the trend of temperature changes as a function of time. The simulation also showed the non-symmetric temperature in the vertical direction that agrees well with the experimental result. It should be noted that this simulation is one dimension in the vertical direction, and it cannot describe the change in the horizontal direction. Nonetheless, the simulation can still give detailed information inside the container and general trends against the parameters.
Figure 5 shows local temperature, char density, O2 mass fraction, and CO2 mass fraction, which changed over time. As can be observed from Figure 5b, char density increased over time due to the O2 chemisorption reaction, which coincided with the decrease of O2 in the container (Figure 5c). The result also shows that char density reached a stable value because the reactant, O2, inside the container was consumed almost completely. As the adsorption reaction progressed, exothermic heat of adsorption contributed to the increase in biochar temperature, as shown in Figure 5a. Despite the absence of mass exchange, temperatures around the bottom and the top of the container were lower than that of the center due to heat losses. Therefore, adsorption rates at the bottom and the top were lower than the center, as observed in Figure 5b,c. Figure 5d shows high CO2 mass fractions at the center of the container. It shows that the high temperatures at the center of the container also resulted in high surface reaction rates, albeit considerably lower than that of adsorption.
The results show evidence that exothermic heat generated by O2 chemisorption was large enough to initiate the self-heating in biochar storage at low temperatures. It increases the confidence of this hypothesis compared to the previous studies because the values of both kinetics and heat of reactions of O2 chemisorption were measured experimentally. Thus, the amount of O2 inside a container is an important factor determining the risk of thermal runaway. The following sections describe: (1) factors influencing O2 content inside char storages, and (2) how to minimize the risk of thermal runaway.

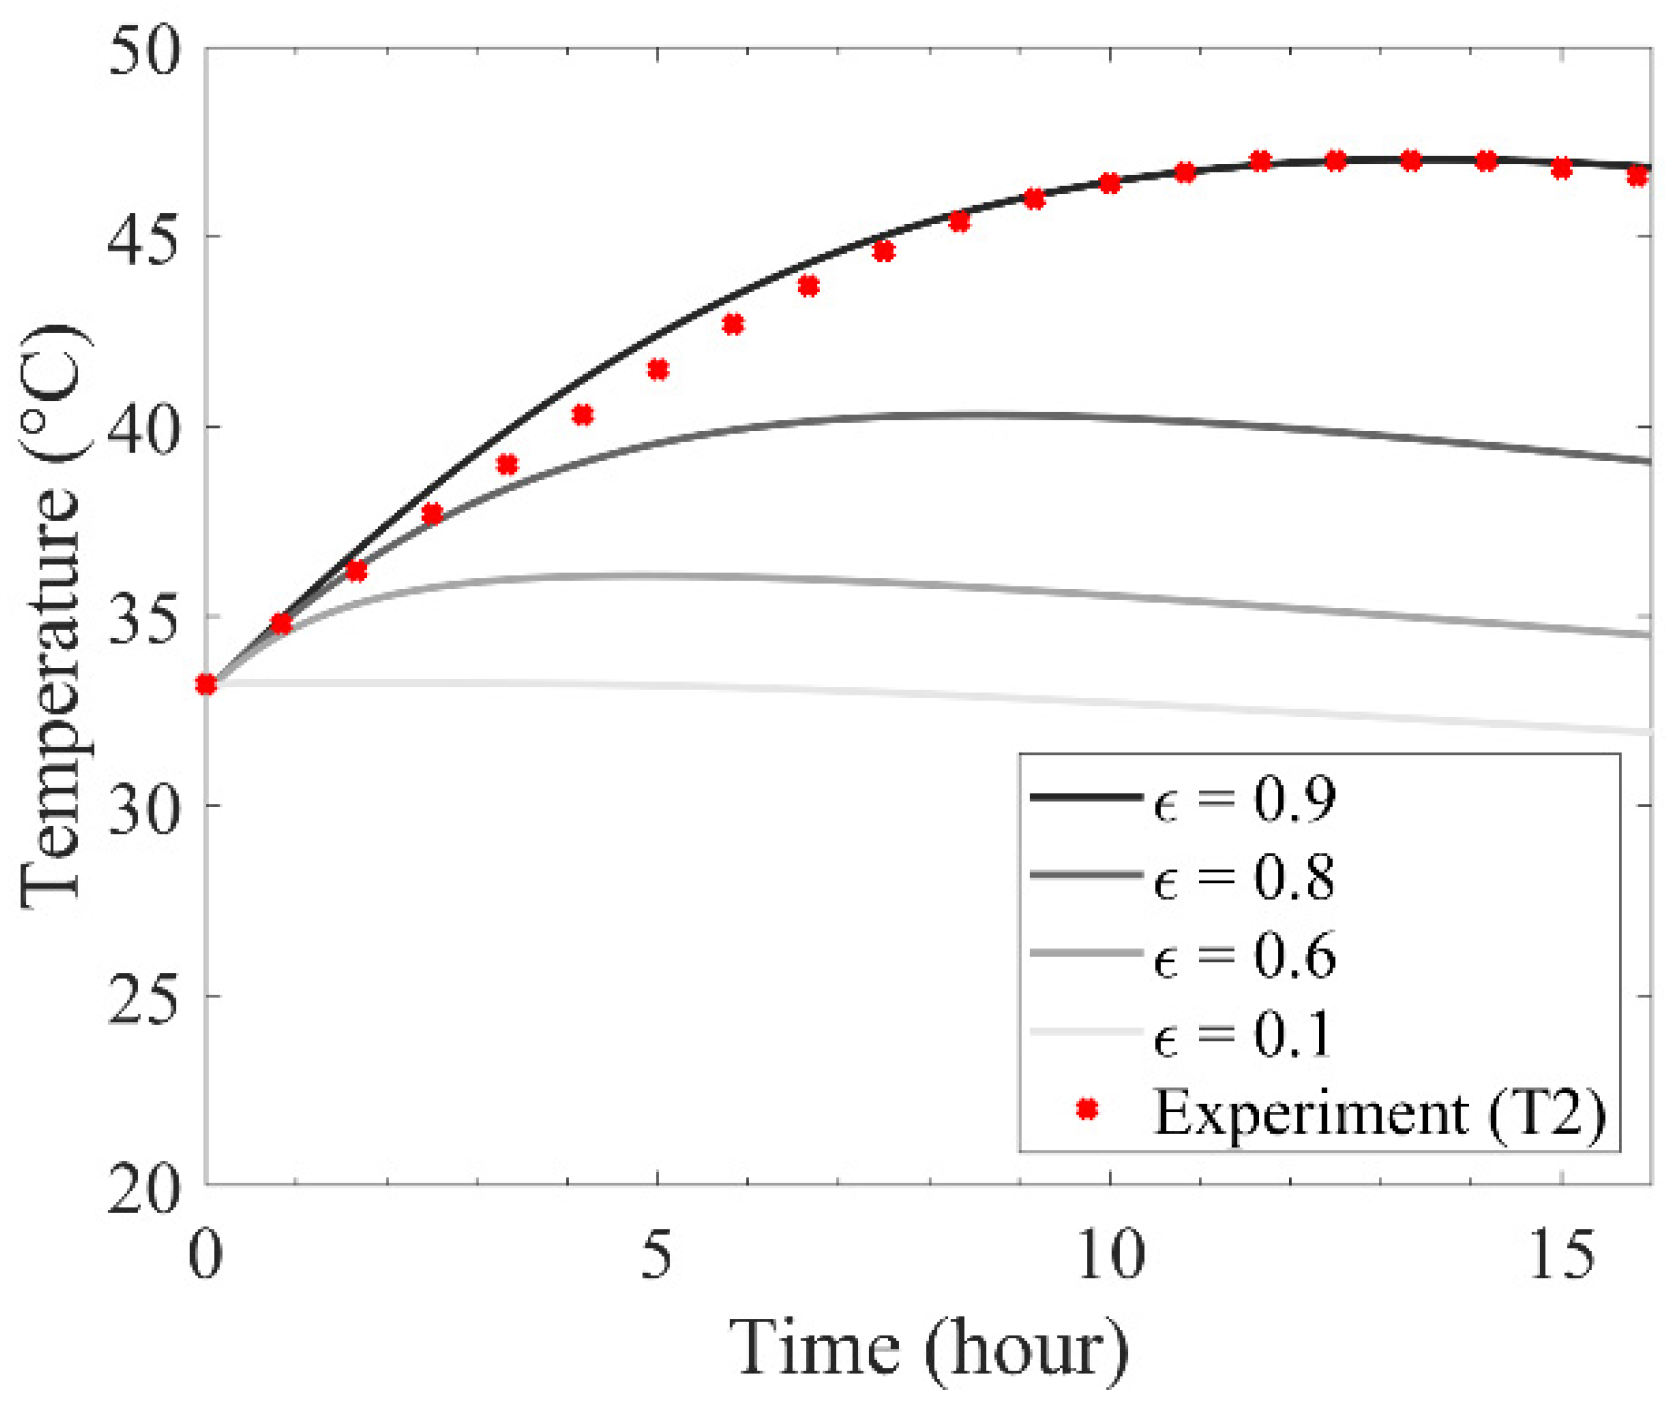
3.2.2. Effect of Bed Void Fraction on Self-Heating

The number of O2 molecules inside a biochar container is directly influenced by the void fraction of a biochar bed. Figure 6 illustrates the temperatures at the center of the container with various bed void fractions. As the void fraction decreased, the maximum temperature became lower and appeared earlier because less O2 was available and more char existed in a biochar container. Consequently, the temperature decreased due to heat losses once O2 was consumed completely by the adsorption reaction.
Based on this result, recommendations can be given to pyrolysis processes, where biochar is produced. Biochar with high bulk density means low particle and bed void fractions. Producing biochar using small particles could yield low void fractions and small bed channel sizes in storage vessels. However, this solution may not be valid because large particles are often beneficial to the increase of char yield. In addition, the presence of fine particles is not favorable for the risk of dust explosion. In addition, the production of small particles requires intensive energy for grinding, which decreases the overall system efficiency of the biochar production process. Therefore, producing biochar with high particle density, such as pellets, or with broad particle size distribution can be a solution to decrease void fraction and channel size as long as the process operation and the requirement in final products allow. In addition, if particles are non-spherical shapes, other properties such as aspect ratio may also affect bulk density.

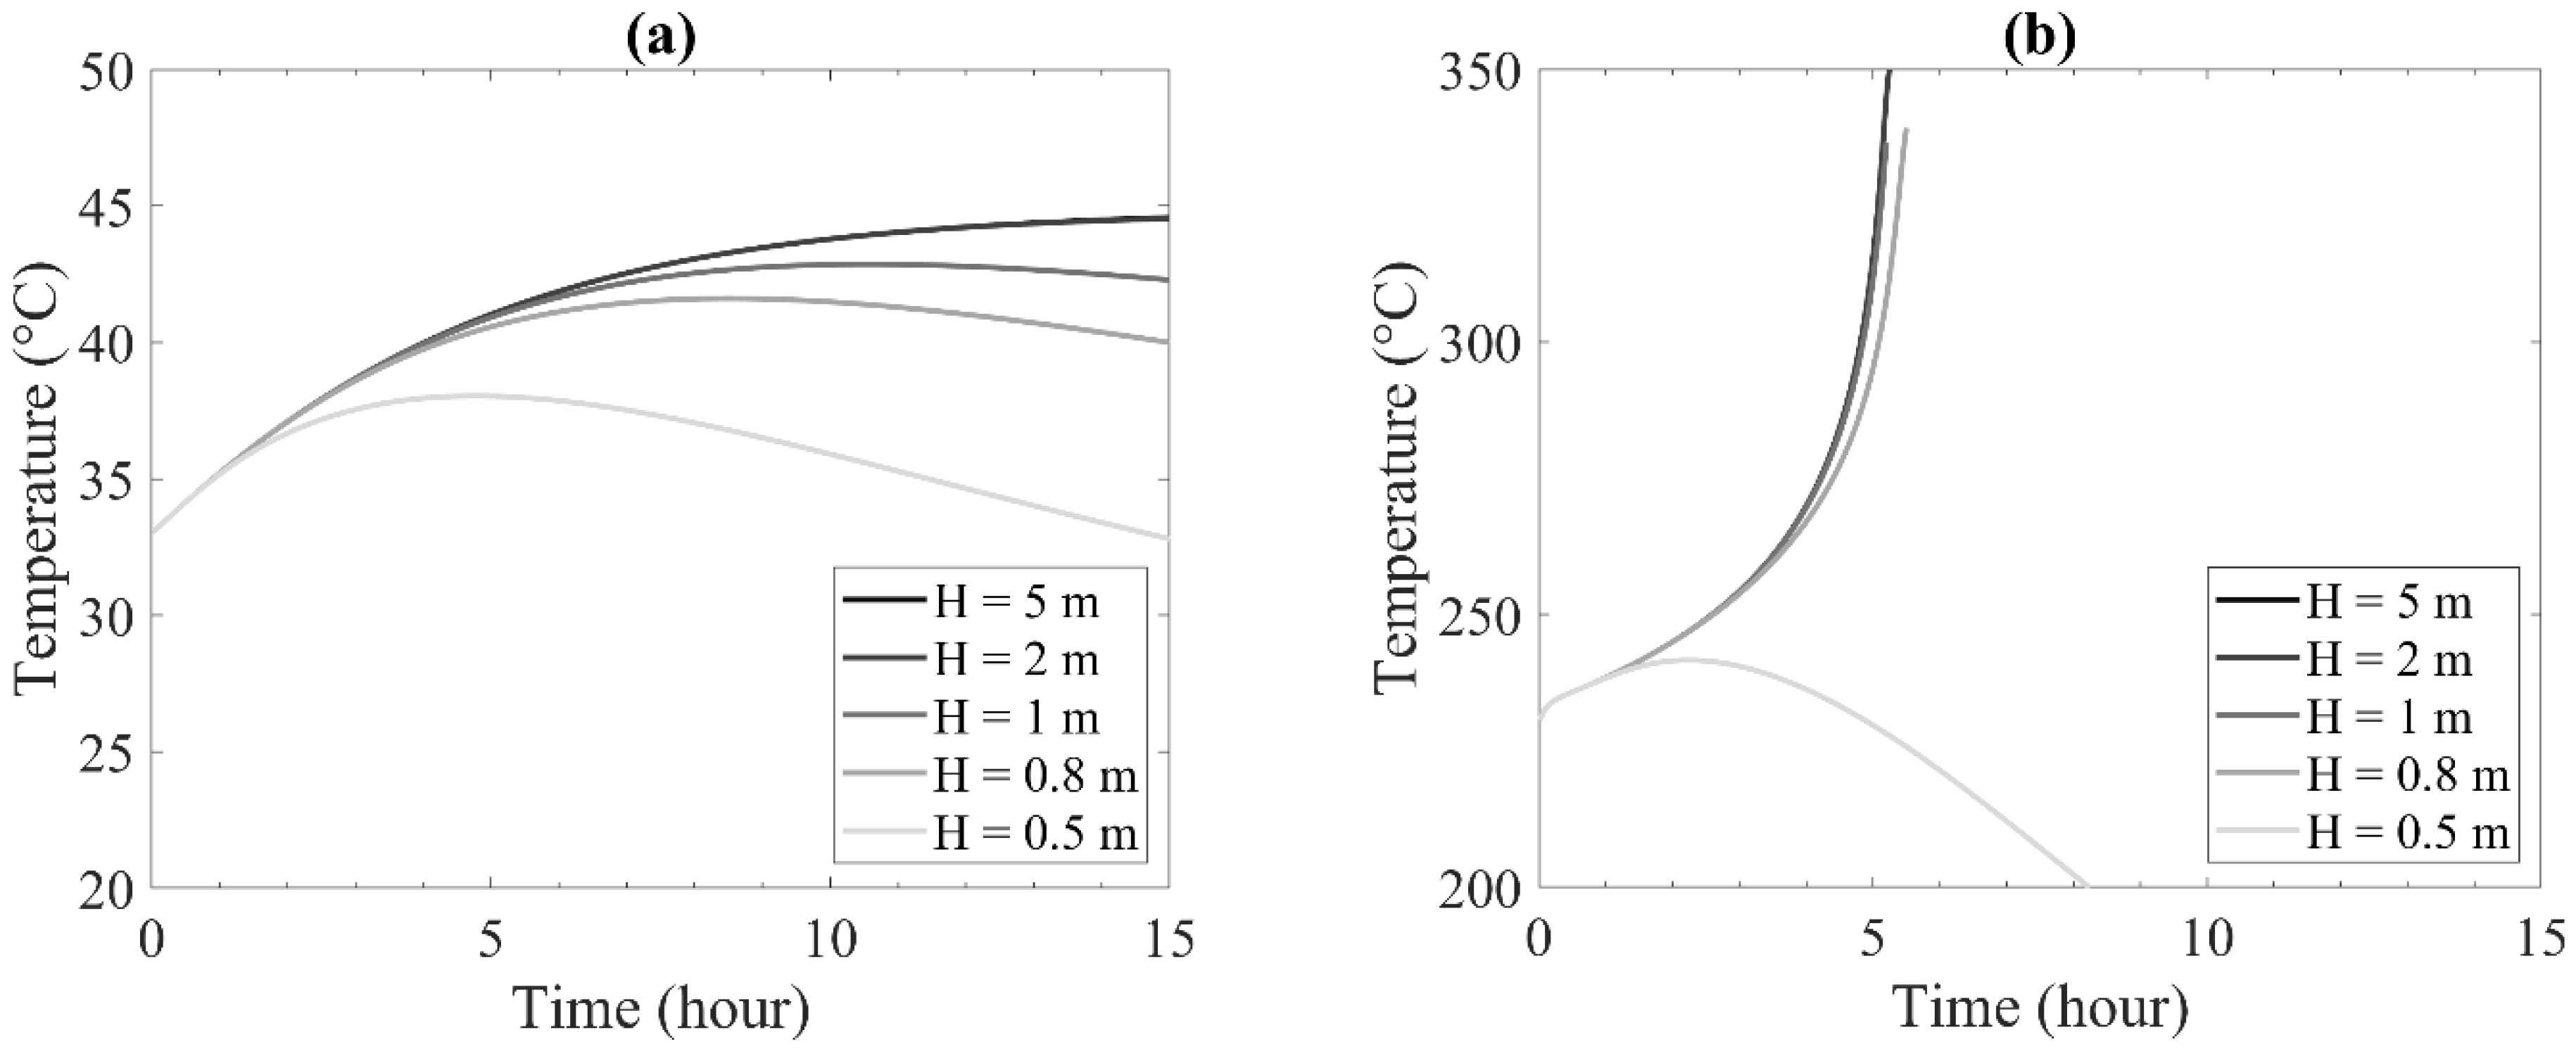
3.2.3. Effect of Storage Size

Storage size could affect both O2 content and heat loss rate, causing an impact on self-heating. Figure 7 shows the temperature at the center of the container as a function of time for different container sizes. Larger containers exhibited higher maximum temperatures, resulting in higher risks of thermal runaway. The risk of self-ignition is low for a container that stores char at low initial temperatures, i.e., 33 °C, as shown in Figure 7a. However, this is not the case if the container stores char at higher initial temperatures, for example, 230 °C in Figure 7b. Therefore, the safe storage size depends on the initial temperature of char stored in the container. Initial char temperature should be carefully controlled especially if the char produced from pyrolysis is stored in large piles or silos commonly applied in large industrial sites.

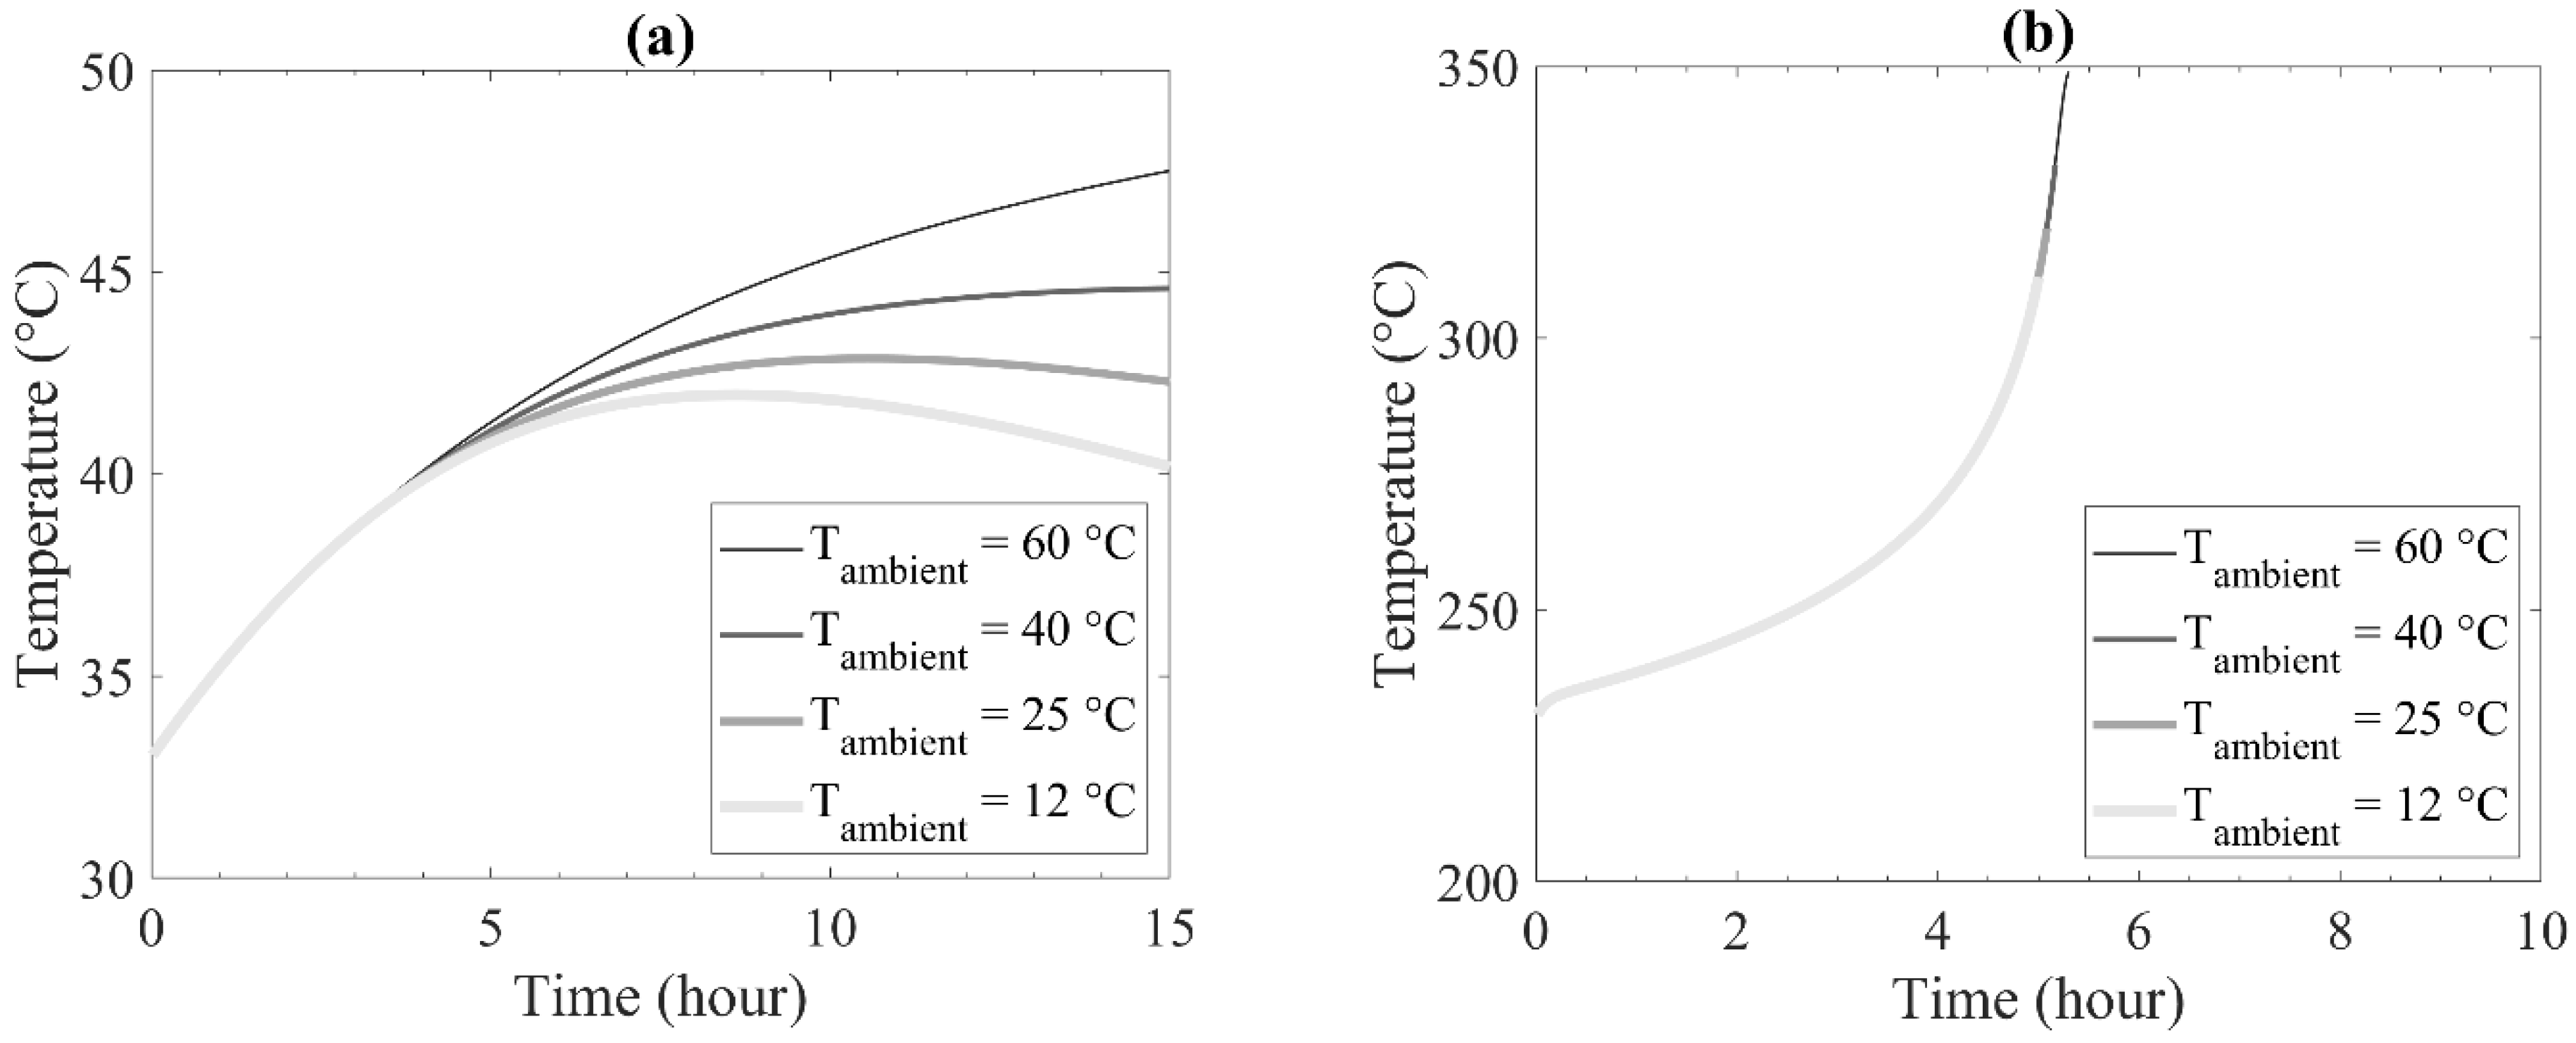
3.2.4. Effect of Ambient Temperature

Ambient temperature varies based on the time of the days and seasons. It directly affects the self-heating of biochar because it changes the heat dissipation rate. Figure 8 depicts simulation results obtained from different ambient temperatures. The effects were significant with low initial char temperature, as shown in Figure 8a. Low ambient temperature reduced the risk of thermal runaway. When the initial biochar temperature was 230 °C, as shown in Figure 8b, low ambient temperatures did not prevent biochar from thermal runaway even at the ambient temperature of 12 °C.

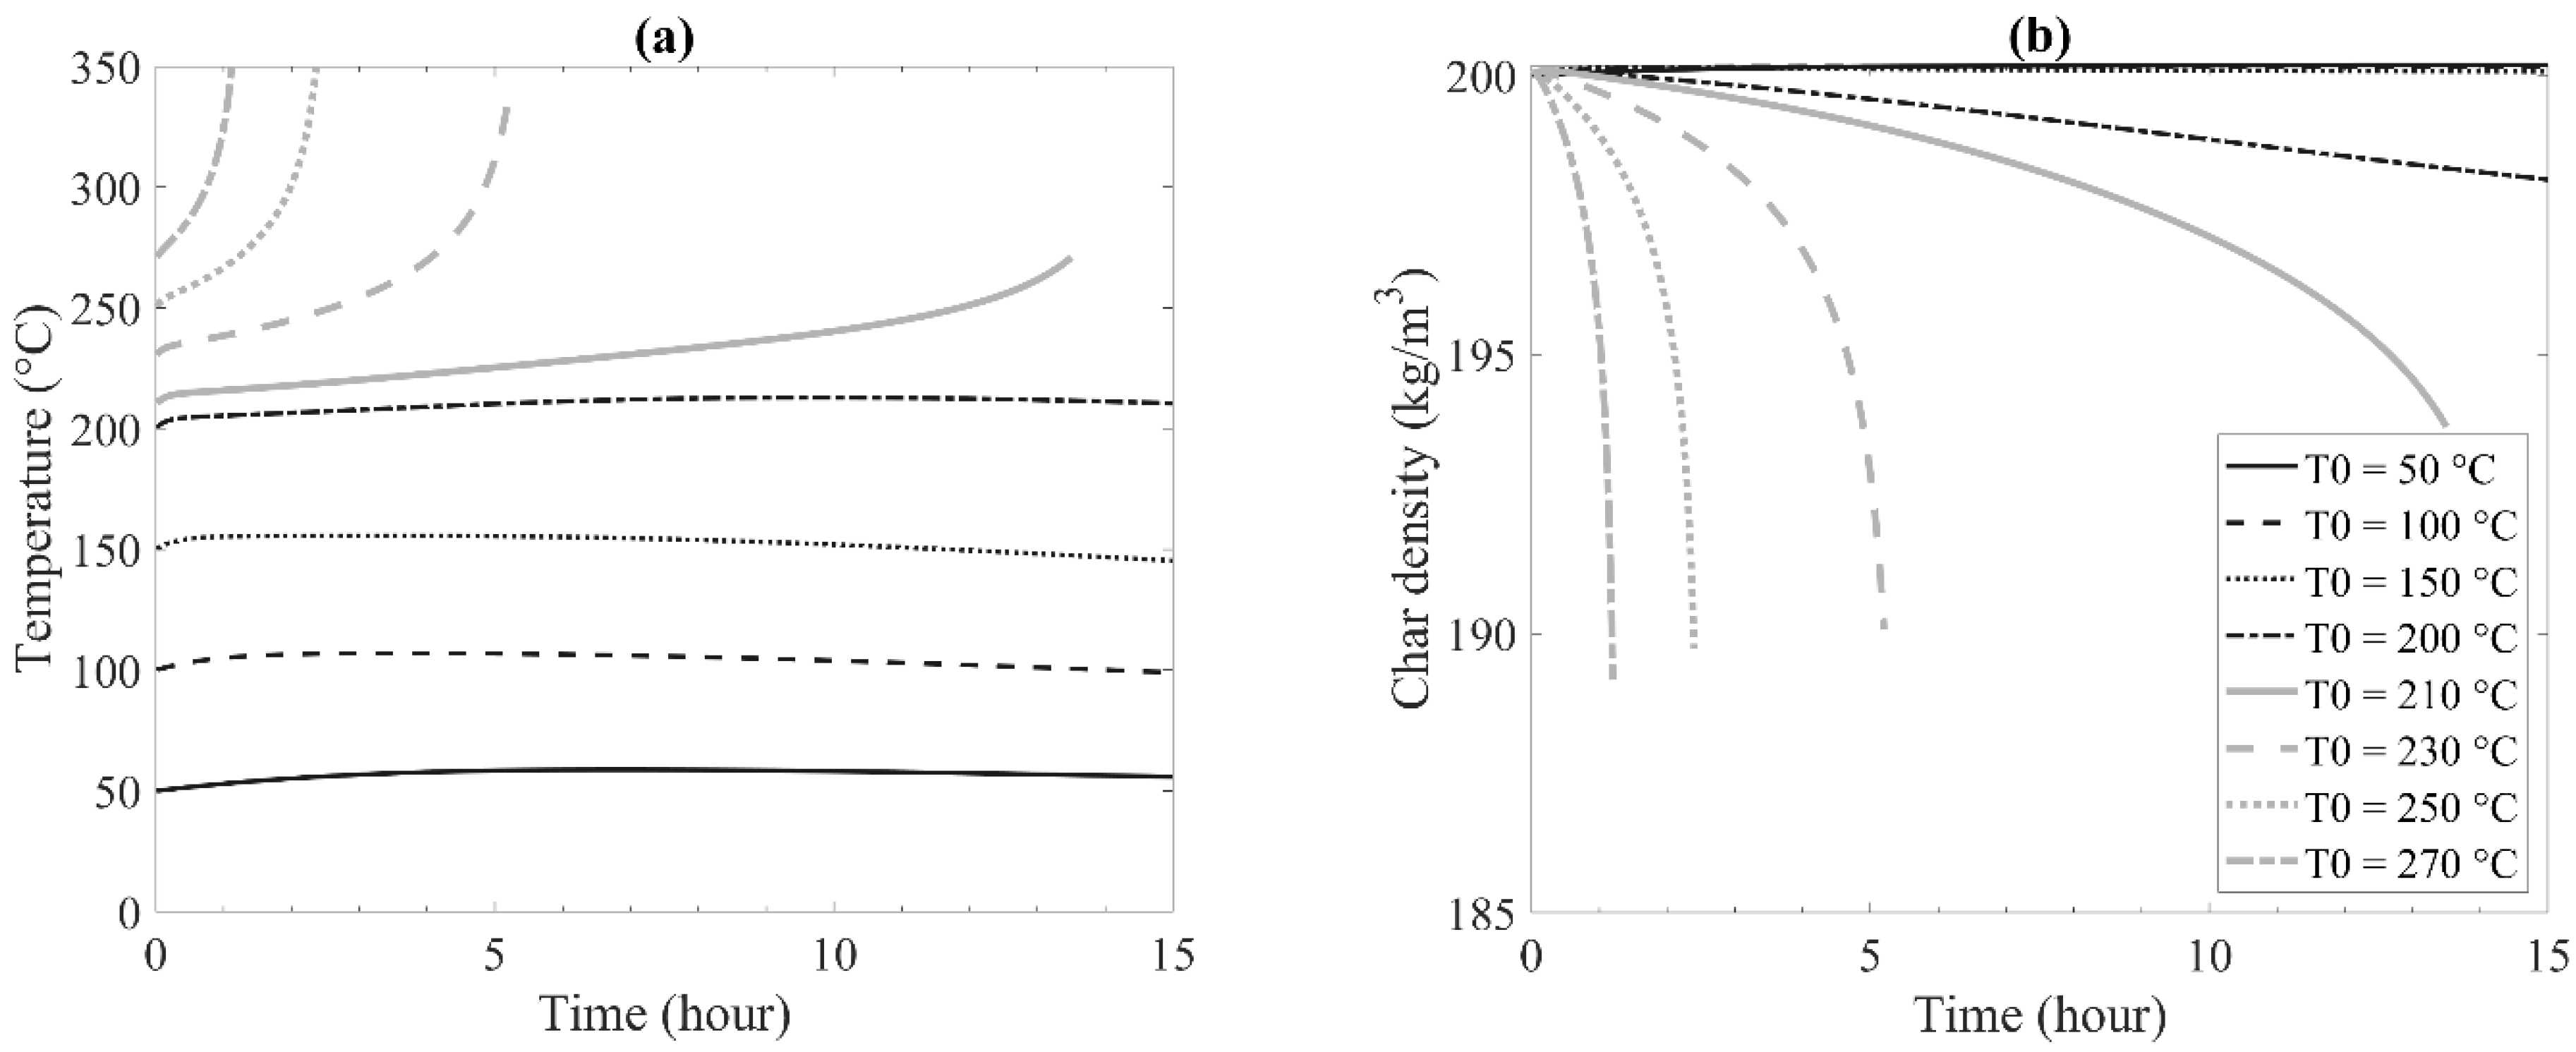
3.2.5. Effect of Initial Char Temperatures

As described in the previous sections, the consequence of storage size and ambient temperature is strongly dependent on the initial temperature of biochar. When biochar is stored at high initial temperatures, thermal runaway is difficult to prevent, even with small containers or low ambient temperatures. This is because, at a high initial temperature, the exothermic heat of the surface reaction becomes significant. Since the initial storage temperature of biochar determines the cooling duty of the pyrolysis operation, it is important to investigate the effects of initial char temperatures. Figure 9a shows temperature changes for different initial char temperatures. For containers that contain biochar with temperatures below ca. 200 °C, the temperature initially increased due to the self-heating initiated by O2 chemisorption, but then it slowly decreased because of heat losses to the surrounding environment. In this case, thermal runaway does not occur, and biochar is stored safely in a closed container. On the other hand, at higher char initial temperatures, the thermal runaway was observed.
At this simulation setup, i.e., Tatm = 25 °C, the char initial temperature at ca. 200 °C or lower did not cause thermal runaway. However, char density decreased substantially for the case with an initial char temperature of 200 °C, as shown in Figure 9b. It means that some biochar in the container has released CO2 through Reaction 2, but the associated heat release rate was smaller than the dissipation rate. The maximum initial temperature that did not show significant mass losses due to the surface reaction was ca. 150 °C. It should be noted that these safe temperatures can vary by other conditions, e.g., ambient temperature, biochar production conditions, and type of storage.

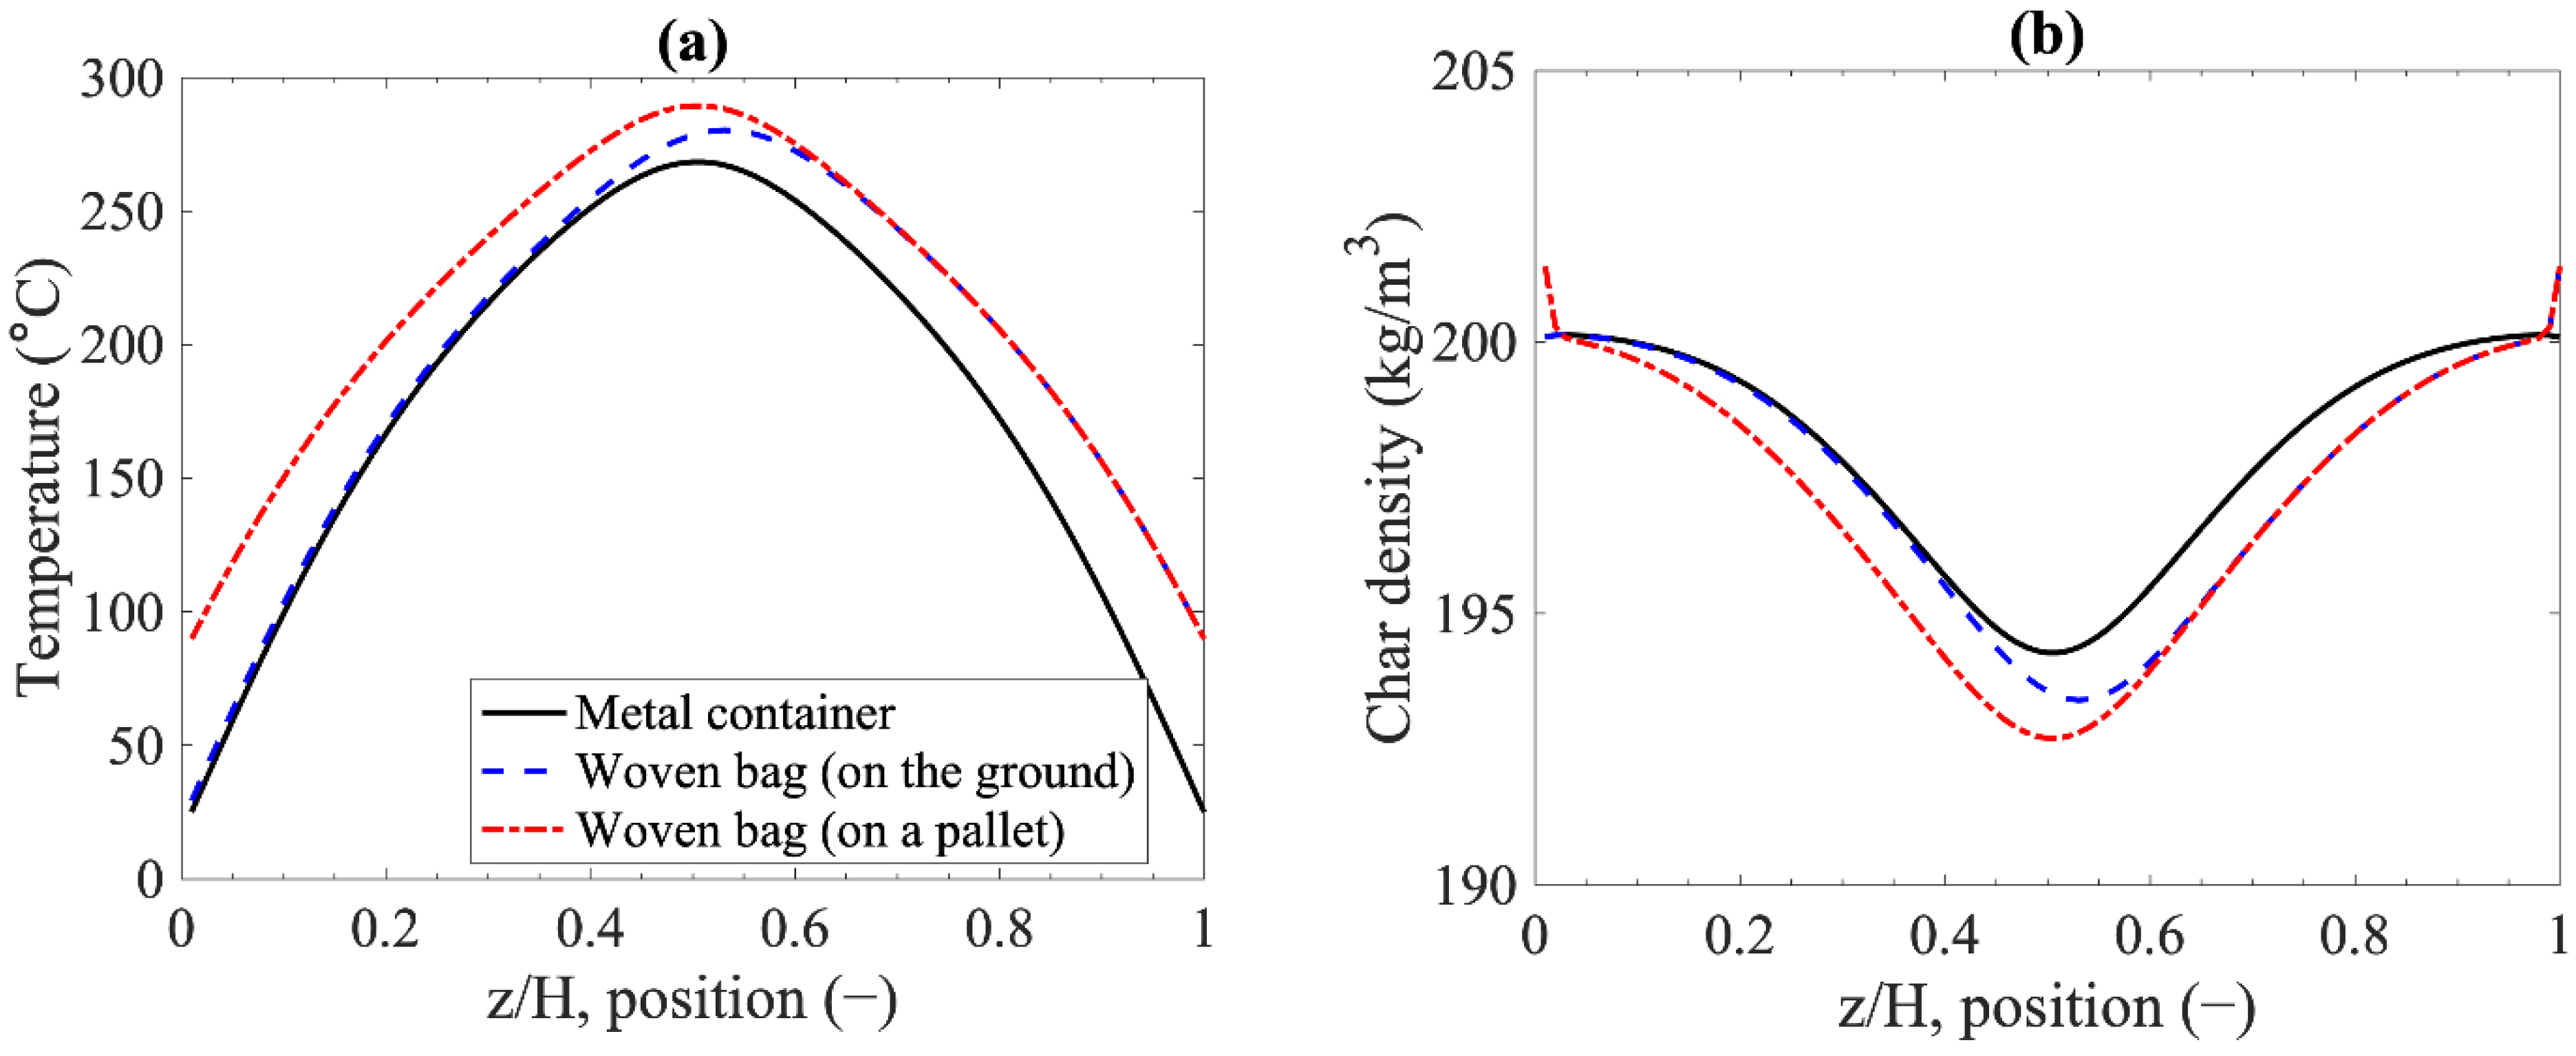
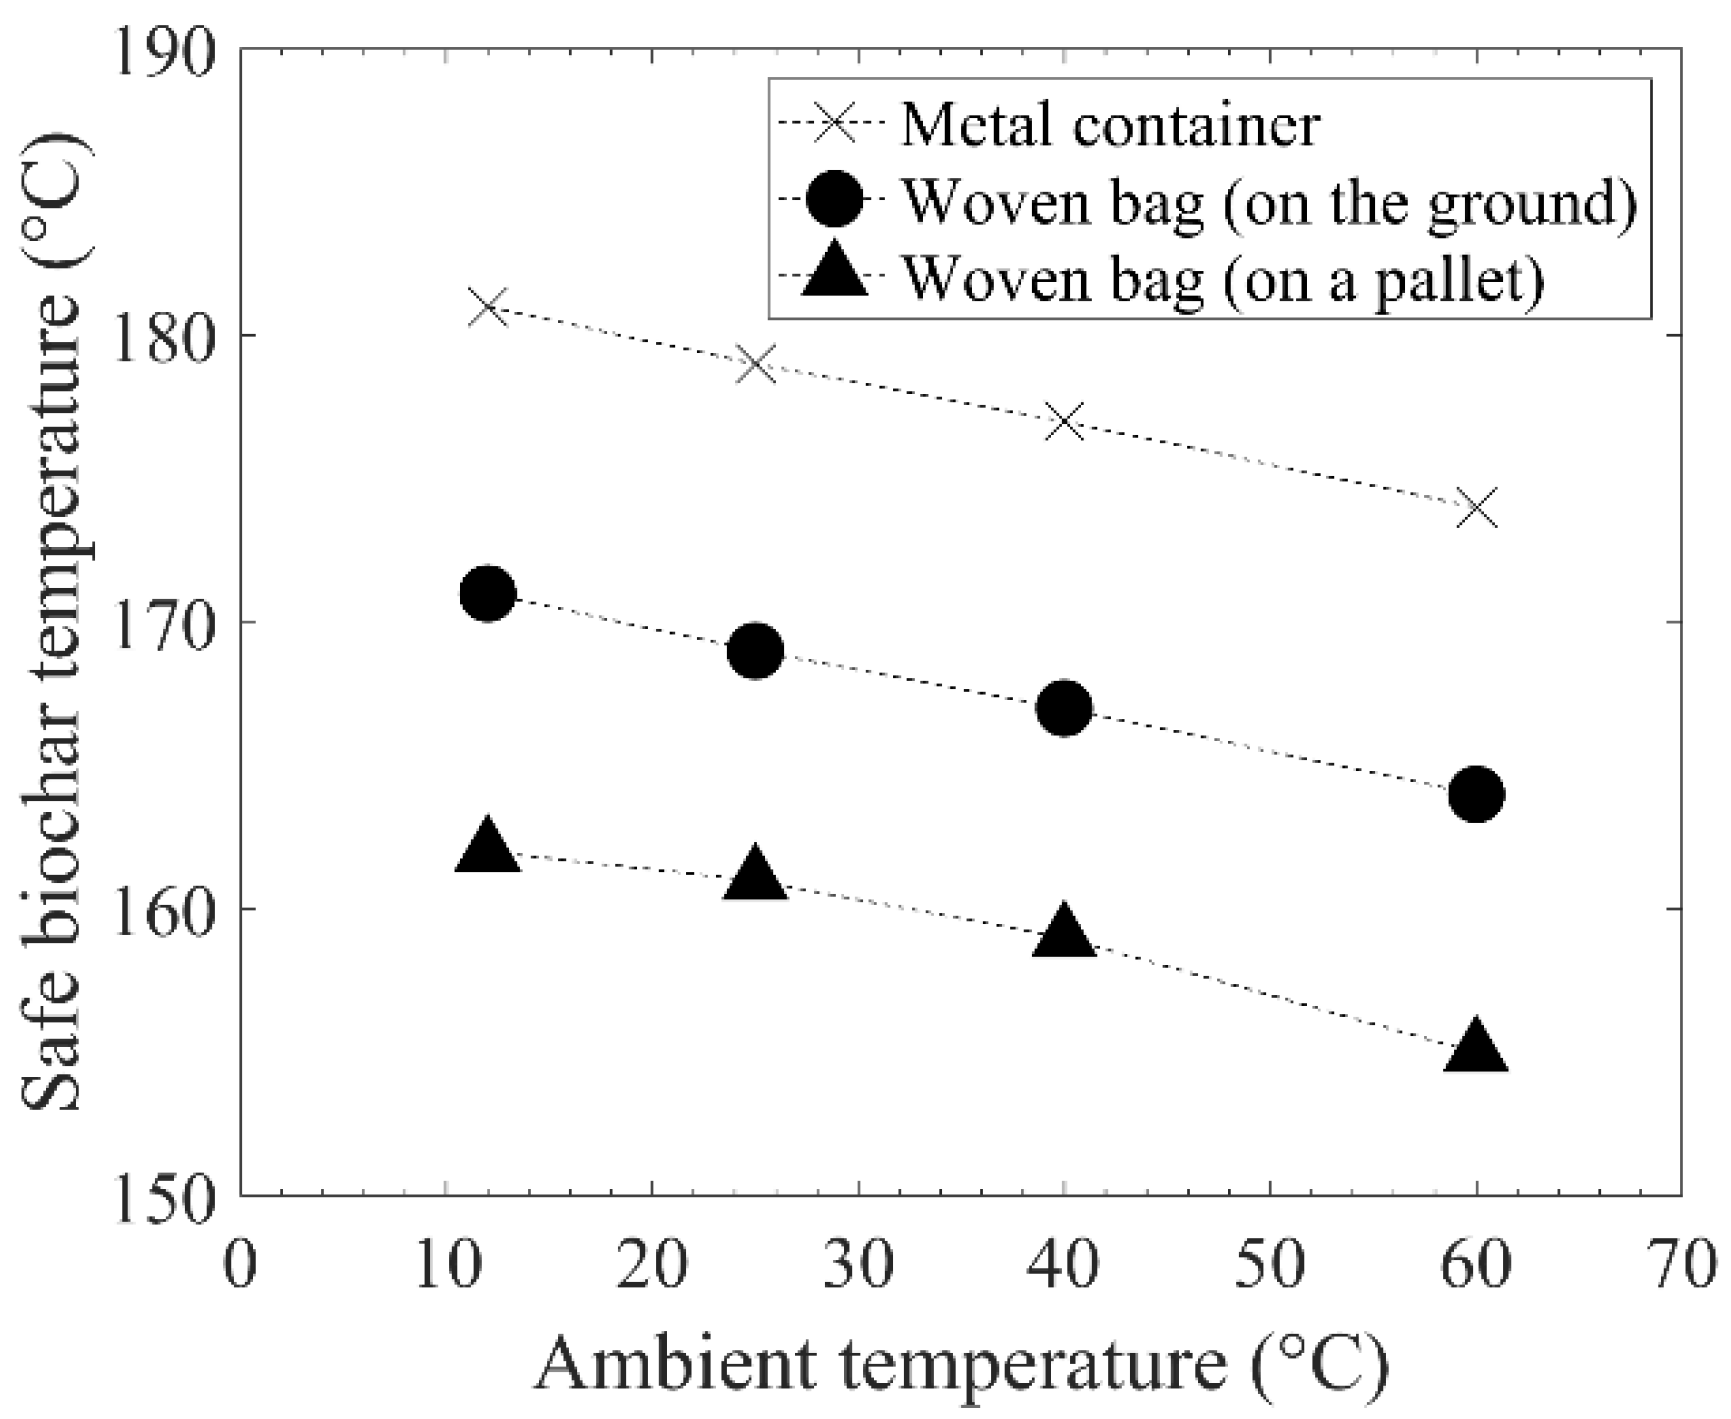
3.3. Comparison among Different Materials for Storage Containers

The previous sections investigated self-heating and thermal runaway in a closed metal container, where the O2 availability is limited to the initial conditions. Woven plastic bags are low-cost alternatives commonly used for the storage and transport of bulk materials. Self-heating behavior and the safe char initial temperature can differ in woven plastic bags because O2 is permeable through the material. Furthermore, if a bag is placed on a pallet, which is common for the ease of transportation, the bottom of the bag will also be exposed to O2, halving the diffusion length scale. Therefore, this section compares the risk of self-heating and thermal runaway among the simulations mimicking the boundary conditions of a closed metal container, a woven plastic bag on the ground, and a woven plastic bag on a pallet.
Figure 10 shows the local char density inside the closed metal container and the two woven plastic bag cases. The results were obtained by using the initial temperature of char at 210 °C, which was around the critical temperature for the risk of thermal runaway. These results with woven plastic bags show a higher risk of self-heating and thermal runaway than metal closed containers. Temperature profiles in Figure 10a show that char temperatures inside woven plastic bags were higher than in a closed metal container. Moreover, char stored in a bag on a pallet exhibited the highest temperature. The higher temperature profiles correspond to higher surface reaction rates, which can be observed by the lower char density in Figure 10b. The reason behind this is that O2 can be permeable and participate in chemisorption when using a woven plastic bag, and O2 can diffuse through both ends of the bag if the bag is placed on a pallet. Additional chemisorption means higher exothermic heat at the boundaries of the bag. Hence, temperatures in the middle of the bag will cool down slower than the case of a closed metal container. This could lead to a higher risk of thermal runaway.
The safe biochar temperature was defined as the highest initial char temperature when the temperature at the center of the container will start cooling down within 8 h after storage. If char temperature keeps increasing after 8 h, it was considered a high risk of thermal runaway. This definition reflects a typical working shift in commercial processes. Figure 11 compares the safe biochar temperatures for storage in different containers. The figure is represented as the function of ambient temperatures.
The result shows that the safe char temperatures of a closed metal container were higher than those of woven plastic bags. At the ambient temperature of 25 °C, the maximum safe temperature of the closed container can be higher than 175 °C. This is due to the limited amount of O2 in the closed container. Heat release from chemisorption will stop when O2 is completely consumed, and char temperature will eventually decrease due to heat losses. Between the woven plastic bags cases, higher maximum safe temperatures were observed for the case on the ground. This result indicates the highest risk of thermal runaway when a woven plastic bag is kept on a pallet. Biochar in the bags on the ground will have access to O2 only from the top of the bag. Biochar in the bags on a pallet will have access to O2 at the bottom as well. Having high O2 content means continuously releasing exothermic heat of chemisorption and surface reactions. Consequently, it is harder to cool down the char by heat dissipation to the surrounding environment.
As mentioned in the earlier section, ambient temperature directly affects the risk of thermal runaway. Higher ambient temperatures led to lower safe char temperatures. The result showed that the safe char temperature might vary by several degrees between the summer and the winter. This difference would affect minimum cooling demands in char production processes for different seasons.

4. Conclusions

During biochar storage in a closed storage vessel of biochar, char temperature slowly increased from 33 to 47 °C within ca. 12 h, then decreased due to heat losses. The highest temperature appeared in the middle of the container, and temperature distribution was observed in both horizontal and vertical directions. The simulation result showed good agreement with the experiment, and it also provided local information inside the container. The simulation showed that self-heating was initiated because of exothermic heat generated during O2 chemisorption at low temperatures. Therefore, char temperature kept increasing until O2 was completely consumed, and it decreased because of heat losses to the surrounding atmosphere.
Bed void fraction, storage size, ambient temperature, and initial char temperature were among the factors affecting self-heating. Low void fraction, or high bulk density, gave the lower risk of self-heating due to the low amount of O2 available in the bed. Small storage size and low ambient temperatures can also decrease the risk of thermal runaway, but the risk was highly dependent on the initial temperature of biochar. The surface reaction took place at a temperature above 150–200 °C and released CO2.
The maximum initial temperature of char for safe storage is useful data to increase the safety of pyrolysis processes because it can optimize the cooling demands of the process before storing biochar. The numerical model was adapted to compare self-heating among storage options, such as woven plastic bags, common low-cost containers to store bulk materials. The result showed that woven plastic bags are more prone to thermal runaway because the O2 has access to the bag at the top. It led to additional exothermic heat at the top boundary, lowering the heat dissipation rate from the center of the bag. Therefore, the maximum initial char temperatures for safe storage depend on the accessibility of O2 to the biochar at the boundary of the storage containers.

Supplementary Materials

The following are available online at https://www.mdpi.com/article/10.3390/en15010380/s1. Figure S1: TG curves (a) 50 °C and 20% O2 (b) 150 °C and 10% O2 (c) 300 °C and 5% O2, Figure S2: Fitting of Reaction 1 (a) and 2 (b), Table S1: Fitted rate constants, Figure S3: The Arrhenius plots for k1f (a), k1b (b), and k2 (c), Figure S4: Sensible heat (a) and specific heat capacity (b) of biochar, Table S2: Values and correlations for physical properties, Figure S5: Effect of intraparticle effectiveness factor on time of self-heating.

Author Contributions

Conceptualization, A.P., C.S. and K.U.; methodology, A.P., N.J. and K.U.; software, A.P. and N.J.; validation, A.P., N.K. and C.S.; formal analysis, A.P. and N.J.; investigation, A.P.; resources, N.K. and K.U.; data curation, A.P.; writing—original draft preparation, A.P.; writing—review and editing, N.J., N.K., C.S. and K.U.; visualization, A.P.; supervision, N.K., C.S. and K.U.; project administration, C.S. and K.U.; funding acquisition, N.K. and C.S. All authors have read and agreed to the published version of the manuscript.

Funding

This research was funded by the FFG (Austrian Research Promotion Agency) program COMET (Competence Center for Excellent Technolgies), grant nr. 869341.

Data Availability Statement

The data presented in this study are openly available at http://urn.kb.se/resolve?urn=urn:nbn:se:ltu:diva-88668.

Acknowledgments

The authors acknowledge Erik Nilsson for the DSC experiments.

Conflicts of Interest

The authors declare no conflict of interest. The funders had no role in the design of the study; in the collection, analyses, or interpretation of data; in the writing of the manuscript, or in the decision to publish the results.

References

  1. Lehmann, J. A handful of carbon. Nature 2007, 447, 143–144. [Google Scholar] [CrossRef]
  2. Dai, J.; Sokhansanj, S.; Grace, J.R.; Bi, X.; Lim, C.J.; Melin, S. Overview and some issues related to co-firing biomass and coal. Can. J. Chem. Eng. 2008, 86, 367–386. [Google Scholar] [CrossRef]
  3. Blackwood Technology. Co-Firing of Biomass; Blackwood Technol.: Hoofddrop, The Netherlands, 2017; Available online: http://www.blackwood-technology.com/applications/co-firing/ (accessed on 22 November 2021).
  4. Molino, A.; Larocca, V.; Chianese, S.; Musmarra, D. Biofuels production by biomass gasification: A review. Energies 2018, 11, 811. [Google Scholar] [CrossRef] [Green Version]
  5. Suopajärvi, H.; Umeki, K.; Mousa, E.; Hedayati, A.; Romar, H.; Kemppainen, A.; Wang, C.; Phounglamcheik, A.; Tuomikoski, S.; Norberg, N.; et al. Use of biomass in integrated steelmaking—Status quo, future needs and comparison to other low-CO2steel production technologies. Appl. Energy 2018, 213, 384–407. [Google Scholar] [CrossRef] [Green Version]
  6. Mousa, E.; Wang, C.; Riesbeck, J.; Larsson, M. Biomass applications in iron and steel industry: An overview of challenges and opportunities. Renew Sustain. Energy Rev. 2016, 65, 1247–1266. [Google Scholar] [CrossRef]
  7. Krigstin, S.; Wetzel, S.; Jayabala, N.; Helmeste, C.; Madrali, S.; Agnew, J.; Volpe, S. Recent health and safety incident trends related to the storage of woody biomass: A need for improved monitoring strategies. Forests 2018, 9, 538. [Google Scholar] [CrossRef] [Green Version]
  8. Restuccia, F.; Mašek, O.; Hadden, R.M.; Rein, G. Quantifying self-heating ignition of biochar as a function of feedstock and the pyrolysis reactor temperature. Fuel 2019, 236, 201–213. [Google Scholar] [CrossRef]
  9. Drysdale, D. An Introduction to Fire Dynamics, 3rd ed.; John Wiley & Sons, Ltd.: West Sussex, UK, 2011. [Google Scholar] [CrossRef] [Green Version]
  10. Phounglamcheik, A.; Wretborn, T.; Umeki, K. Increasing efficiency of charcoal production with bio-oil recycling. Energy Fuels 2018, 32, 9650–9658. [Google Scholar] [CrossRef]
  11. Tian, X.; Zhang, H.; Sheng, C. Self-Heating of Agricultural Residues during Storage and Its Impact on Fuel Properties. Energy Fuels 2018, 32, 4227–4236. [Google Scholar] [CrossRef]
  12. Hogland, W.; Marques, M. Physical, biological and chemical processes during storage and spontaneous combustion of waste fuel. Resour. Conserv. Recycl. 2003, 40, 53–69. [Google Scholar] [CrossRef]
  13. Krigstin, S.; Wetzel, S. A review of mechanisms responsible for changes to stored woody biomass fuels. Fuel 2016, 175, 75–86. [Google Scholar] [CrossRef]
  14. Juita; Dlugogorski, B.Z.; Kennedy, E.M.; Mackie, J.C. Low temperature oxidation of linseed oil: A review. Fire Sci. Rev. 2012, 1, 3. [Google Scholar] [CrossRef] [Green Version]
  15. Cruz Ceballos, D.C.; Hawboldt, K.; Hellleur, R. Effect of production conditions on self-heating propensity of torrefied sawmill residues. Fuel 2015, 160, 227–237. [Google Scholar] [CrossRef]
  16. Fan, P.; Fan, S.; Sheng, C. Low temperature oxidation and its kinetics of cornstalk chars. Fuel 2016, 184, 915–921. [Google Scholar] [CrossRef]
  17. Branca, C.; Di Blasi, C. Combustion kinetics of secondary chars in the kinetic regime. Energy Fuels 2010, 24, 5741–5750. [Google Scholar] [CrossRef]
  18. Yu, Y.; Fu, X.; Yu, L.; Liu, R.; Cai, J. Combustion kinetics of pine sawdust biochar. Therm. Anal. Calorim. 2016, 124, 1641–1649. [Google Scholar] [CrossRef]
  19. Fan, F.; Zheng, Y.; Huang, Y.; Lu, Y.; Wang, Z.; Chen, B.; Zheng, Z. Combustion kinetics of biochar prepared by pyrolysis of macadamia shells. Bioresources 2017, 12, 3918–3932. [Google Scholar] [CrossRef] [Green Version]
  20. Phounglamcheik, A.; Wang, L.; Romar, H.; Kienzl, N.; Broström, M.; Ramser, K.; Skreiberg, Ø.; Umeki, K. Effects of Pyrolysis Conditions and Feedstocks on the Properties and Gasification Reactivity of Charcoal from Woodchips. Energy Fuels 2020, 34, 8353–8365. [Google Scholar] [CrossRef]
  21. Riva, L.; Cardarelli, A.; Andersen, G.J.; Buø, T.V.; Barbanera, M.; Bartocci, P.; Fantozzi, F.; Nielsen, H.K. On the self-heating behavior of upgrading biochar pellets blended with pyrolysis oil: Effects of process parameters. Fuel 2020, 278, 118395. [Google Scholar] [CrossRef]
  22. Tg Azhar, T.N.A. Self-Heating Behaviour of Torrefied and Non-Torrefied Biomass Fuels. Ph.D. Thesis, The University of Sheffield, Sheffield, UK, 2018. [Google Scholar]
  23. Schwarzer, L.; Jensen, P.A.; Wedel, S.; Glarborg, P.; Karlström, O.; Holm, J.K.; Dam-Johansen, K. Self-heating and thermal runaway of biomass—Lab-scale experiments and modeling for conditions resembling power plant mills. Fuel 2021, 294, 120281. [Google Scholar] [CrossRef]
  24. Ithaka Institute. The European Biochar Certificate 2021. Available online: https://www.european-biochar.org/en (accessed on 30 July 2021).
  25. Haugen, N.E.L.; Mitchell, R.E.; Tilghman, M.B. A comprehensive model for char particle conversion in environments containing O2 and CO2. Combust. Flame 2015, 162, 1455–1463. [Google Scholar] [CrossRef] [Green Version]
  26. Tilghman, M.B.; Haugen, N.E.L.; Mitchell, R.E. Comprehensive Char Particle Gasification Model Adequate for Entrained-Flow and Fluidized-Bed Gasifiers. Energy Fuels 2017, 31, 2164–2174. [Google Scholar] [CrossRef]
  27. Biswas, A.K.; Umeki, K. Simplification of devolatilization models for thermally-thick particles: Differences between wood logs and pellets. Chem. Eng. J. 2015, 274, 181–191. [Google Scholar] [CrossRef]
  28. Koufopanos, C.A.; Lucchesi, A.; Maschio, G. Kinetic modelling of the pyrolysis of biomass and biomass components. Can. J. Chem. Eng. 1989, 67, 75–83. [Google Scholar] [CrossRef]
  29. Gupta, M.; Yang, J.; Roy, C. Specific heat and thermal conductivity of softwood bark and softwood char particles. Fuel 2003, 82, 919–927. [Google Scholar] [CrossRef]
Figure 1. The closed metal container and the thermocouple positions.
Energies 15 00380 g001
Figure 2. Discretization and the boundary conditions.
Energies 15 00380 g002
Figure 3. TGA-DSC result in comparison with the models for: (a) mass; and (b) heat.
Energies 15 00380 g003
Figure 4. Temperatures as a function of time at different locations in the container (Conditions: T0 = 33 °C, Tambient = 25 °C, ρ c , 0 = 200 kg m−3, Hcontainer = 1 m): (a) Experimental results; (b) Simulation results with and without an effectiveness factor.
Energies 15 00380 g004
Figure 5. Evolution of local properties over time with the interval of 100 min (Conditions: T0 = 33 °C, Tambient = 25 °C, ρ c , 0 = 200 kg m−3, and Hcontainer = 1 m): (a) Local temperature; (b) char density; (c) O2 mass fraction; (d) CO2 mass fraction.
Energies 15 00380 g005
Figure 6. Effects of bed void fraction on the temperature at the center of a closed container. (Condition: T0 = 33 °C, Tambient = 25 °C, Hcontainer = 1 m).
Energies 15 00380 g006
Figure 7. Effect of container size on the temperature at the center of the container with the conditions of Tambient = 25 °C, ρ c , 0 = 200 kg m−3: (a) initial char temperatures of 33 °C; (b) initial char temperatures of 230 °C.
Energies 15 00380 g007
Figure 8. Effects of ambient temperature on the temperature at the center of the container with the storage conditions of ρ c , 0 = 200 kg m−3 and Hcontainer = 1 m: (a) initial char temperatures of 33 °C; (b) initial char temperatures of 230 °C.
Energies 15 00380 g008
Figure 9. Effects of char initial temperature with the strorage condition of Tambient = 25 °C, ρ c , 0 = 200 kg m−3, and Hcontainer = 1 m: (a) on thermal runaway represented by the average char temperature; (b) on average char density.
Energies 15 00380 g009
Figure 10. Local profiles inside the storage container after 12 h (storage condition: T0 = 210 °C, Tambient = 25 °C, ρ c , 0 = 200 kg m−3, and Hcontainer = 1 m): (a) char temperature; (b) char density.
Energies 15 00380 g010
Figure 11. The safe biochar temperatures for safe storage in different types of containers. (storage condition: ρ c , 0 = 200 kg m−3, Hcontainer = 1 m, t = 8 h).
Energies 15 00380 g011
Table 1. Properties of the char sample.
PropertiesUnitValues
Bulk densitykg m−3200
Skelton densitykg m−31350
Higher heating valueMJ kg−125.9
Proximate analysis
Volatile matter%, dry basis38.5
Fixed carbon%, dry basis48.1
Ash (at 550 °C)%, dry basis13.4
Ultimate analysis
C%, dry basis66.9
H%, dry basis4.4
N%, dry basis1.1
O%, dry basis22.3
Table 2. Initial conditions.
t = 0
ρ c ( z , 0 ) = ρ c , 0
ρ g ( z , 0 ) = ρ g , 0
Y i ( z , 0 ) = Y i , 0
T ( z , 0 ) = T 0
P ( z , 0 ) = P a t m
u ( z , 0 ) = 0
Publisher’s Note: MDPI stays neutral with regard to jurisdictional claims in published maps and institutional affiliations.

