Article

Efficiency of Energy Consumption between Reinforced Concrete Structure and Cross-Laminated Timber Based Hybrid Structure in East Asian Cities

Department of Architecture, National Taiwan University of Science and Technology, Taipei 10608, Taiwan
*
Author to whom correspondence should be addressed.
Energies 2022, 15(1), 165; https://doi.org/10.3390/en15010165
Submission received: 28 October 2021 / Revised: 14 December 2021 / Accepted: 24 December 2021 / Published: 27 December 2021

Abstract

:
From the environmental perspective, wooden structures are favorable insulators that are suitable for carbon fixation and wooden-related products are considered the most sustainable material. Research has indicated that wooden structures have superior energy-saving performance compared to reinforced concrete (RC) structures. In this study, a CLT-based hybrid structure system that potentially improves the efficiency of energy consumption is proposed. The proposed hybrid structure system, which preserved original RC beams, columns and replaced CLT floors and walls, has less building weight compared to the original RC building. Additionally, less energy required for the manufacturing of building materials in the renovation of the aged building is achieved, compared to building a new CLT building. The energy consumptions for buildings with heights of 10 stories were compared. CLT and RC were selected as benchmark building materials to compare the energy-saving efficiencies with the proposed hybrid structure system. In addition, to examine the energy consumption differences at different latitudes, the energy consumptions in Taipei, Tokyo, Harbin, and Singapore were compared as well. The simulation results indicate the proposed hybrid structure system, which comprises RC beams and columns and CLT floors and walls, and has an energy-saving efficiency close to that of a CLT structure, by approximately 3–5% higher, however, had a superior energy consumption performance to the RC structure. In general, the proposed hybrid structure system can be effectively used for old building renewal in the selected Asian cities.

1. Introduction

Due to the environmental problems caused by global warming, energy consumption and carbon emissions must be reduced, and it is the only solution to stop the climate crisis [1]. The topic of environmental protection has drawn the attention of numerous countries. The building density in an area rapidly increases with increasing population. A report of the United Nations Environment Programme [2] indicates that the energy consumption of the construction sector accounts for 40% of the global energy consumption. In addition, the greenhouse gas emissions of the construction sector account for over 33% of the total global emissions, and the construction sector is considered the largest emission source. Consequently, to reduce their environmental impact, construction-related industries should aim to reduce their energy consumption and carbon dioxide emissions in the usage stage of the building life cycle.
The design and construction of wooden structures completely conform to the global trend of green building [3,4,5,6,7]. The material characteristics of cross-laminated timber (CLT), which has been rapidly developed recently, are different from those of traditional glue-laminated timber. CLT can provide high strength when used in vertical and horizontal combinations [8,9,10,11]. Theoretically, CLT can be used as the structural material for wooden structures over 10 stories. The fast construction of CLT structures has resulted in the rapid development of CLT structures in recent years [4,5,6]. From the environmental perspective, wooden structures are favorable insulators that are suitable for carbon fixation and wooden-related products are considered the most sustainable material [12]. From the Building Envelop point of view, the thermal conductivity of concrete is 1.4 w/m°k, which is 10 times the conductivity of wood. In addition, concrete has high thermal storage. In countries in cold zones, concrete walls are often placed in the direction of sunlight for thermal storage due to their high thermal storage characteristics. At night, the heat stored in concrete structures is released indoors; thus, the heating load in winter can be reduced [13]. However, in subtropical and tropical regions, the high thermal storage of concrete is one of the major reasons for increased air-conditioning consumption in the summer. Wood is a favorable insulator, and for the same thickness, the insulation value of wood is approximately 10 times that of concrete. Thus, wood can effectively block thermal conduction. Research has indicated that wooden structures have superior energy-saving performance to reinforced concrete (RC) structures [14,15,16,17,18]. Based on the analyses performed, it was indicated that wood-based buildings have a favorable energy balance in comparison to traditional buildings based on traditional materials [19]. Recent research concluded that CLT generally provides a significant improvement on energy efficiency, and studies on occupants’ comfort in buildings have been examined [20,21]. However, its energy performance efficiency and occupants’ comfort can be affected by weather, building size, internal loading, and HVAC control. Generally, CLT buildings provide sound insulation against cold weather as when the temperature outside is cold, the occupants can still find comfort in the house. The daily energy consumption of structures, such as their electricity generation and fuel consumption, influences the overall development direction of energy consumption for a country. Consequently, reducing energy consumption or adopting recyclable energy and thus reducing the overall energy consumption cost is a goal of many countries [22,23,24,25]. However, previous research has mostly focused on comparing the energy-saving efficiency between wooden and RC structures, as well as in high-latitude regions, energy-saving efficiency between hybrid structure systems and CLT or RC structures [14,15,16,17,18], as well as the performance of energy consumption in low-latitude regions, has not been focused.
For most East Asian cities, taking Taipei City as an example, RC is the primary building material for most structures. According to statistics, close to 400,000 residences were constructed between 1971 and 1990 in Taipei City [26]. These structures have a life expectancy of 30–50 years and currently require reconstruction or renovation. Thus, for urban renewal, a crucial aspect of this study is to understand how to use the advantages of wooden structures to develop efficient renewal models of energy consumption for the daily usage stage of the building life cycle. To propose a solution for the renovation of aged RC buildings, a new hybrid structure system that potentially improves the efficiency of energy consumption is proposed in this study. Hybrid structure systems by adopting CLT panels outside of original wall systems as a building’s additional envelope has been studied [27,28,29,30]. However, adding the additional CLT panel increased the total weight of the building, potentially increasing the seismic load of the aged buildings, which had reduced seismic resistance ability, due to the decay of the materials. In this study, a renovation method that preserves the RC beams and columns in old buildings and uses CLT floors and walls for renewal was proposed. Replacing the original RC wall and floor with a CLT panel reduces the total weight of the building, hence helping reduce the potential seismic load [31,32]. Furthermore, the energy required for the manufacturing of building materials could represent in the near future, almost 400% of operational energy [33], it could cause less energy consumption if only part of the elements, such as wall and floor were replaced in the aged building instead of rebuilding a new building. The other objective of this study was to compare the energy-saving trends of these structures of different heights from high-latitude regions to low-latitude regions. The energy consumptions for buildings with heights of 4 and 10 stories were compared. CLT and RC were selected as benchmark building materials to compare the energy-saving efficiencies with hybrid structure systems. Consequently, the Revit program was used with Green Building Studio (GBS) for simulating and analyzing the energy consumption of structures. The common residence structure type in Taipei City was selected, and its floor plan was used as the standard floor. The energy consumption efficiency of the hybrid structure system was compared with those of the other structure systems. Thus, a system with superior energy consumption efficiency could be identified for future urban renewal. In addition, to examine the energy consumption differences at different latitudes, the energy consumptions in Taipei City, Taiwan (taken as the standard); Tokyo, Japan (to the north of Taipei); Harbin city, China (to the north of Taipei), and Singapore (to the south of Taipei), which is close to the equator, were compared. Thus, the energy-saving efficiencies of wooden and RC structures in regions with different environmental conditions were compared.

2. Methodology

2.1. Assessment of Energy Consumption

Autodesk Green Building-rating System (GBS) was used for simulating the structure energy consumption in this study. GBS can be used as an independent cloud-service-based program or a plug-in component of the Revit program for energy analysis. GBS comprises the DOE-2.2 analysis core and can provide extremely detailed analysis. As a cloud-based tool, GBS can facilitate rapid computation on the Autodesk server. In general, the DOE-2.2 analysis core requires extremely detailed information on the building envelope and electromechanical system for computation. However, GBS presets numerous building envelope and electromechanical system parameters according to the ASHRAE standard. Thus, architects can focus more on the design factors that have decisive influences on the overall energy consumption of buildings and can ignore technical details. In addition to the building energy consumption, electricity consumption, and annual carbon emissions, GBS can calculate the Energy Star score of buildings. It can also evaluate the glass property and water usage efficiency scores according to the LEED evaluation system published by the U.S. Green Building Council. GBS can even determine the solar energy usage potential. In this study, a plug-in component of the Revit program 2019 version for energy analysis was used for simulation.

2.2. Assessment of Carbon Dioxide Emission

The Guidelines for National Greenhouse Gas Inventories published by the Intergovernmental Panel on Climate Change were used for the assessment of carbon dioxide emissions. In this study, the calculation method for the emissions of carbon dioxide, methane, and nitrous oxide was adopted to calculate the carbon emissions of different countries. GBS calculates the energy consumption of buildings according to two major parameters: electricity consumption and fuel consumption. The calculated carbon emission of electricity consumption differs according to the electricity carbon emission coefficients of different countries. The carbon emissions can be calculated using Equation (1). The emission coefficients of different countries are listed in Table 1. For calculating the carbon emission of fuel consumption, the fuel volume (m3) is first converted into energy units. An energy of 38 MJ or 10.6 kWh can be generated by burning 1 m3 of natural gas. The carbon emission of fuel consumption can then be calculated using Equation (2). The carbon emissions coefficient of fuel is listed in Table 2, and all the compared countries have the same carbon emissions coefficient of fuel. The carbon emissions of the total energy consumption of a building can be obtained by summing the carbon emissions of electricity and fuel.
(A)
Electricity consumption is converted into carbon emissions by using the following formula:
Electricity usage (kWh) × electricity emissions coefficient (kg CO2e/kWh)
= electricity carbon dioxide emissions (kg)
(B)
Fuel consumption is converted into carbon emissions by using the following equation:
Fuel usage (m³) × natural gas emissions coefficient (kg CO2e/ m³)
= fuel carbon dioxide emissions (kg),
(C)
The carbon emission of total energy consumption is calculated as follows:
Carbon emission of total energy consumption (kg)
= electricity carbon dioxide emissions (kg)+ fuel carbon dioxide emissions (kg)

3. Simulation Modeling

To determine the energy usage efficiencies under different conditions, the energy consumption and carbon emission were compared for different numbers of stories (4 and 10), different construction materials (RC and CLT), and cities with different latitudes (from north to south, Harbin, Tokyo, Taipei, and Singapore). The related structure usage situations and air admission timing of the air-conditioning system were set. In addition, the energy simulation was only conducted for the daily usage stage in the structure life cycle. When GBS was used for structure energy simulation, the basic settings, simulation parameters, weather data, electromechanical system, indoor load, and operation schedules had to be input in the simulation process. The basic parameters and settings of this study are as follows:
  • According to the descriptions on the official website of Autodesk, the data on weather stations were obtained from the World Meteorological Organization.
  • For concrete materials, the pre-existing data in the program were used. The parameters of CLT walls were obtained from relevant research [39,40].
  • For the electromechanical system and indoor load, detailed data were required from the DOE-2.2 analysis core to the electromechanical system for the operation. However, the building envelope and electromechanical system parameters were preset in GBS according to the ASHRAE standards. Different air-conditioning systems are used in different countries. The preset parameters were used for the mechanical system and indoor load in this study. The preset parameters of heating, ventilation, and air-conditioning (HVAC) systems were a central variable air volume system, hot-water heating, a performance coefficient of 5.96 for the freezer, and a boiler efficiency of 84.5.
Because this study was a preliminary study, a 24/7 operation schedule was set. Thus, simulations were conducted 7 days a week and 24 h a day annually. Then, GBS was used to analyze the simulated building energy consumption. In the comparison of the energy consumptions of different building materials (RC and CLT) in cities at different latitudes, only the energy consumption in the operation stage was considered. In addition, the following assumptions were made in the simulation process for the energy consumption:
  • The window positions remained the same when switching from an RC structure to a CLT structure; thus, the illumination demands remained the same.
  • Except for the balcony, the indoor temperatures of all the rooms were controlled between 18 and 26 °C.
  • No heating or cooling was conducted in the stair areas.
  • Electricity was used for the air-conditioning system and illumination, and fuel was used for heating.

3.1. Target Building

To determine the energy usage efficiencies for different numbers of stories and different weather conditions, the standard floor of social housing in Taipei City was used as the standard floor in this study. The layouts and basic information of a four-story building and a 10-story building are listed in Table 3 and displayed in Figure 1.

3.2. Building Materials

The targeted building that was selected was a typical social housing building surrounded by buildings in central Taipei city, and the orientation of the building is with the main entrance facing southward. This building type is adopted and simulated in other selected cities, and the surrounding condition of the building is assumed the same. The simulated building was an RC structure with fixed floor plans on different floors. In this study, the building height, building direction, total area, and opening, such as windows and doors were fixed for the building simulation. The material of major structures, such as beams and walls, was replaced with CLT. Thus, the influence of the floor height on energy-saving efficiency was examined. In addition, the energy consumption efficiencies of the RC and CLT structures were compared. Moreover, only the energy consumption in the daily life stage of the building was examined; the structural properties of the structure were not determined.
The physical properties of RC and CLT, including their heat transfer coefficient, specific heat, and density, were also determined for complete analysis. As presented in Table 4, RC has a higher heat transfer coefficient, specific heat, and density than CLT does. Thermal resistance and heat loss are inversely correlated. Thus, an increase in the thermal resistance of the wall material between the interior and exterior of a building can reduce the heat loss of the building (Equation (4)). As presented in Table 4, CLT walls have a higher thermal resistance than RC walls do. The thermal resistance of a 300-mm-thick external CLT wall is up to 3.3 m2·K/W (U-Value = 0.3 W/m2·K), while with a variable thickness of insulation applied, the U-Value ranges from 0.13 to 0.45 W/m2·K [41]. The thermal resistance of a 300-mm-thick RC external wall is only 0.25 m2·K/W, which is approximately 1/13th of the thermal resistance of a 300-mm-thick CLT external wall. Table 5 lists the physical properties of RC and CLT walls of different thicknesses. Figure 2 displays the models of numerical analysis. Four- and Ten-story CLT and RC buildings were constructed for comparing the energy consumptions in their daily life stages. In this paper, the buildings in different cities with different latitude were studied, to emphasize the influence of the building envelope on total energy consumption, the reflected U-Values of different cities for their roof and floor are assumed as follow, based on the different climate zone located. U-value of the roof was 0.28, 0.45, 0.50, 0.50 for Harbin, Tokyo, Taipei, and Singapore respectively. Moreover, the U-value of the floor was 0.38, 0.50, 0.80, 1.50 for Harbin, Tokyo, Taipei, and Singapore respectively. In order to simplify the simulation, the U-value of the window and door were set to be the same in order to clarify the major influence of the exterior wall.
Heat loss = (A/R) × (Tindoor − Toutdoor)
A: external surface area of the building.
R: thermal resistance (R value).
Tindoor: indoor air temperature.
Toutdoor: outdoor air temperature.

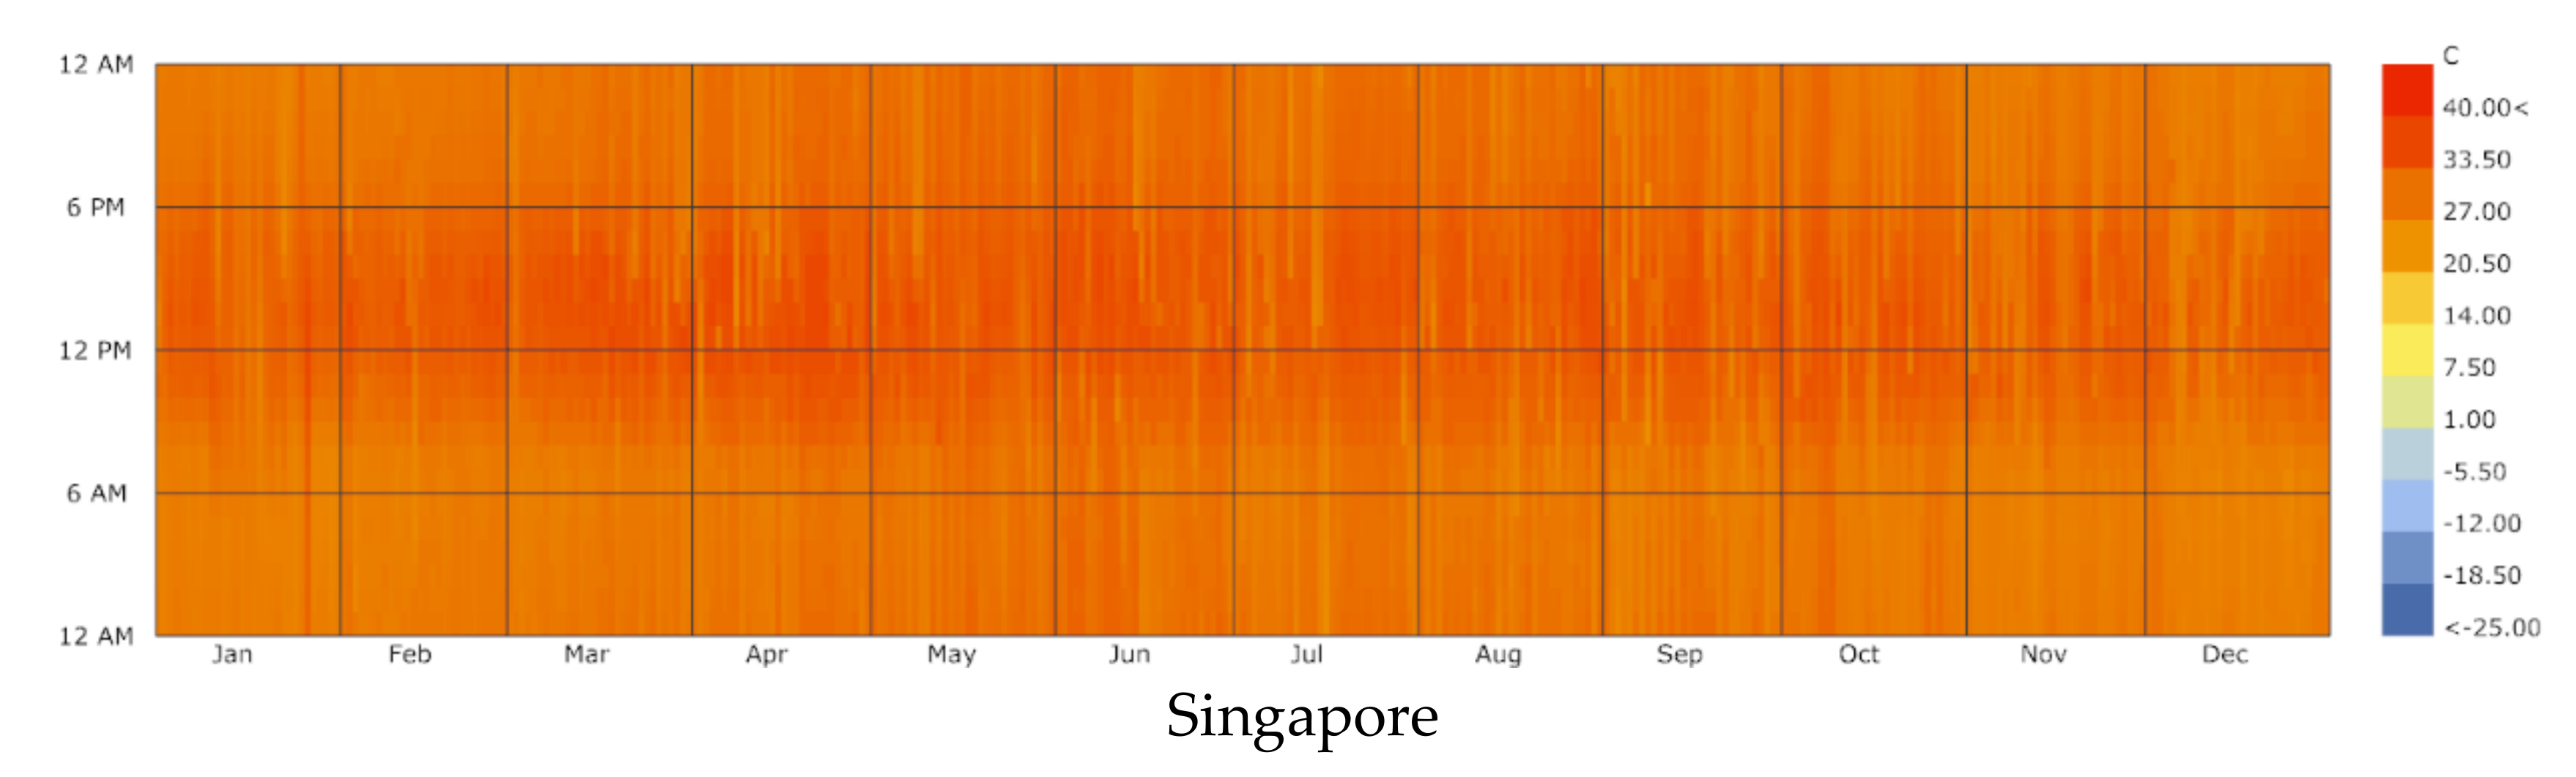
3.3. Cities in Different Latitude

Cities at different latitudes have different climates, which influences the energy consumption of buildings. The climate includes the highest and lowest outdoor temperatures and humidity. In this study, the energy consumption of buildings in cities at different latitudes was also simulated to determine how the overall energy usage efficiency varied with the latitude. As depicted in Figure 3, the latitude of Taipei was selected as the standard. The other cities selected for the comparison were Tokyo and Harbin, which are located to the north of Taipei, as well as Singapore, which is located close to the equator and to the south of Taipei. These cities were selected for comparing the energy-saving efficiencies of RC and CLT buildings of different heights in different environmental conditions.
The monthly average temperatures of the aforementioned cities in 2019 are presented in Table 6 and Figure 4. The lowest monthly average temperature in Harbin, which is located at a high latitude, was −17.2 °C in January, and the highest monthly average temperature in Harbin was 23.6 °C in July. Thus, the largest monthly average temperature difference was 40.8 °C in Harbin. The lowest monthly average temperatures in Singapore, which is located at a low latitude, were 26.8 °C and 27 °C in December, and the highest monthly average temperatures in Singapore were 30.6 °C and 28.9 °C in April and March, respectively. The highest monthly average temperature difference in Singapore was only 3.8 °C. The highest monthly average temperatures of Tokyo and Taipei, which are located in the temperate zone, were 28.6 °C in August and 30.6 °C in July, respectively. These temperatures were comparable to the high temperatures in Singapore, which is located in the tropics.

4. Results and Discussion

4.1. Energy Consumption

In the simulation, electricity was used by the HVAC system, illumination equipment, and other equipment. Fuel was used by the HVAC and domestic water heating systems. Table 7 presents the simulation results for the 4- and 10-story structures made of different building materials and located in cities at different latitudes.
For Harbin, which is located at the highest latitude among the considered cities, the annual electricity consumptions of the RC and CLT structures were 244 and 148 kWh/ m2, respectively. For Singapore, which is at the lowest latitude, the annual electricity consumptions of the RC and CLT structures were 232 and 227 kWh/ m2, respectively. For both 4- and 10-story structures, the simulation results indicated that the electricity consumption of RC structures was considerably higher than that of CLT structures at high and low latitudes. However, at low latitudes, the difference in the electricity consumption of RC and CLT structures was relatively small (Figure 5). The same trend was observed for fuel energy usage. Thus, the energy-saving efficiencies of CLT structures were higher than those of RC structures. The differences in the energy-saving efficiencies of CLT and RC structures were higher at higher latitudes (Figure 6).
A comparison of the total energy consumptions of RC and CLT structures is presented in Table 8 and Figure 7. For four-story structures, the total energy consumptions of the CLT structures were approximately 57%, 71%, and 88% of those of the RC structures in Harbin, Tokyo, and Taipei, respectively. No significant difference was observed in the total energy consumptions of the four-story CLT and RC structures in Singapore. For 10-story structures, the total energy consumptions of the CLT structures were approximately 61%, 73%, and 89% of those of the RC structures in Harbin, Tokyo, and Taipei, respectively. For Singapore, the difference between the total energy consumptions of the 10-story CLT and RC structures was marginally higher than that of the four-story CLT and RC structures.
The electricity and fuel energy consumption ratios of the CLT and RC structures were compared. Electricity consumption mainly originates from rooms with air-conditioning. Thus, a higher number of stories caused a lower ratio of the floor area being directly heated by sunlight. Consequently, the electricity-energy-saving efficiency of the 10-story structures was higher than that of the four-story structures (Figure 7). However, this energy-saving efficiency decreased with decreasing latitude. The consumption of fuel energy mainly originates from rooms with heating. Thus, the larger the surface area of a structure, the higher is the heat exchange. Table 8 and Figure 7 indicate that all the fuel energy consumption ratios of 10-story structures were higher than those of four-story structures in the different cities. In addition, CLT structures at high altitudes (Harbin) had a high fuel energy consumption efficiency. The energy consumption ratios of 4- and 10-story CLT structures were approximately 56% and 62% of those of 4- and 10-story RC structures, respectively. For Singapore, which is at a low latitude, indoor heating demands were low. Thus, the fuel energy consumption ratios did not exhibit a significant difference.

4.2. CO2 Emission

Table 9, Figure 8 and Figure 9 present the carbon dioxide emissions per unit area for 4- and 10-story RC and CLT structures in cities at different latitudes. The carbon emissions of electricity energy consumption mainly originate from air-conditioning systems, illumination systems, and basic facilities of the structure. The carbon emissions of fuel energy consumption mainly originate from the use of heating systems. Electricity carbon emissions were calculated according to the electricity emission coefficients of the countries in which the considered cities are located (Table 1 and Table 2). Thus, the carbon emissions from the same electricity energy consumption were different in different countries.
The electricity carbon emissions of four-story RC and CLT structures were 276 and 167 kg/ m2·yr, respectively, in Harbin; thus, the difference in the electricity carbon emissions of the two types of four-story structures was 109 kg/ m2·yr in Harbin. In Singapore, the electricity carbon emissions of four-story RC and CLT structures were 96 and 93 kg/ m2·yr, respectively, which represents an electricity carbon emission difference of 3 kg/ m2·yr. The difference in carbon emissions was small because the monthly average temperature in every month in Singapore was higher than 26 °C, which was the temperature set in this study for the air-conditioning system to be turned on. The air-conditioning system demands were high. Thus, the demands for carbon emissions from electricity energy consumption were high for both RC and CLT structures. For Harbin, in addition to the air-conditioning system demands, the heating system demands were high. Thus, significant differences were observed in the carbon emissions of electric energy consumption for RC and CLT structures in Harbin. In addition, the electricity emissions of Harbin were higher than those in other cities due to the higher electricity carbon emission coefficient in Harbin (1.13 kg CO2e/kWh). The carbon emissions of fuel energy consumption for four-story RC and CLT structures in Harbin were 199 and 111 kg/ m2·yr, respectively, which represents a fuel carbon emission difference of 88 kg/ m2·yr. In Singapore, the fuel carbon emissions of four-story RC and CLT structures were both 12 kg/ m2·yr. In cities at higher latitudes, the heating system needs were higher. Thus, the fuel carbon emissions and fuel carbon emission differences increased considerably with the latitude.
Figure 10 indicates that the 10-story structures had superior carbon emission reduction effects to those of the four-story structures for electricity and fuel energy consumption. For regions at high latitudes (Harbin), the differences in electricity carbon emissions of 10- and 4-story structures were not significant. However, the carbon emissions reduction efficiencies of structures with more stories could be shown in the differences in fuel carbon emissions.

4.3. Potential Hybrid Structure System for Renovation in Asian Cities

Previous results of this study indicate that CLT structures have higher energy-saving and carbon reduction efficiencies than RC structures do at different latitudes. These efficiencies increase with the number of floors. Moreover, the differences in the energy consumption efficiencies of CLT and RC structures increase with latitude. In this section, CLT and RC structures that were studied as benchmark building materials were furthermore compared with the energy-saving efficiencies of a hybrid structure system.
In Taipei, most buildings are RC structures that are approximately 30–50 years old. These structures are still usable; however, their overall energy consumption is high because of the RC building material. Consequently, a strategy is proposed for the renewal of these buildings in the future. The proposed strategy mainly involves preserving existing RC beams and columns and renewing the floors and walls with CLT. On the basis of this concept, a hybrid structure analysis model was established in this study. Figure 11 illustrates the model of preserving the RC beams and columns and replacing the floors and walls with CLT. The energy consumptions of CLT and RC structures of the same size were also compared. The analysis and simulation conditions were the same as stated previously as shown in Section 3.
The analysis results presented in Table 10 indicate that the 10-story hybrid structure system had a superior electricity energy consumption performance to the RC structure. The electricity energy consumption performance of the hybrid structure was only marginally worse (3–5% lower) than that of the CLT structure. Thus, the proposed hybrid structure system is close to a CLT structure in terms of electrical energy consumption. For fuel energy consumption, no significant difference was observed between the different structures in Singapore, which is located at a low latitude. In Taipei, Tokyo, and Harbin, which are located at relatively high latitudes, the fuel energy consumption of the hybrid structures was higher than that of the RC structures and not significantly different from that of the CLT structures. The CLT and hybrid structures exhibited no significant difference in their total energy consumption. The aforementioned structures exhibited lower total energy consumptions than the RC structures did. The energy-saving efficiency of the proposed hybrid structure system, which comprises RC beam structures and CLT floors and walls, is close to that of CLT structures. Taking energy consumption in RC structure as 100%, the relative consumption ratio is illustrated and as shown in Table 11, indicating that using CLT as building skin, such as hybrid structure proposes in this study, performs as well as the CLT structure. For all the East Asian cities selected in this study, the proposed hybrid structure system can be used effectively for old building renewal.

5. Conclusions

In this study, the energy consumption efficiency of the proposed hybrid system was compared with those of the RC and CLT structure systems. Detailed energy consumption and carbon emissions were compared for different numbers of floors (4 and 10), different building materials (RC and CLT), and cities at different latitudes (from north to south, Harbin, Tokyo, Taipei, and Singapore) to understand the energy usage efficiencies under different conditions. In order to clarify the major influence of exterior walls on energy consumption, part of the parameters for the simulation model are simplified, such as doors and windows, further detailed study needs to be conducted in order to obtain a deep understanding. For the preliminary study, the following conclusion is drawn, and worthy to provide to local authorities for the policymaking regarding urban renewal issues. For the proposed hybrid structure system, the electricity consumption performance of 10-story hybrid structures was superior to that of RC structures but marginally inferior to that of CLT structures (by approximately 3–5%). Thus, the electrical energy consumption of the hybrid structures was close to that of the CLT structures. No significant differences were observed in the fuel energy consumptions of the different structures in Singapore. In Taipei, Tokyo, and Harbin, which are located at higher latitudes than Singapore is, the fuel energy consumption of the hybrid structures was higher than that of the RC structures. No significant difference was observed in the fuel energy and total energy consumptions of the hybrid structure system and CLT structures. The fuel energy and total energy consumptions of the aforementioned structures were lower than those of the RC structures, indicating the advantage of the hybrid structure system used for old building renovation. In conclusion, the proposed hybrid structure system, which comprises RC beams, columns and CLT floors and walls, has less building weight compared to the original RC building, and less energy required for the manufacturing of building materials [31] in the renovation of the aged building, has an energy-saving efficiency close to that of a CLT structure. For all the East Asian cities selected in this study, the proposed hybrid structure system can be effectively used for old building renewal.

Author Contributions

Conceptualization, M.-T.T.; methodology, M.-T.T.; software, W.-T.L.; validation, W.-T.L. and M.-T.T.; formal analysis, W.-T.L. and M.-T.T.; investigation, W.-T.L. and M.-T.T.; resources, W.-T.L. and M.-T.T.; data curation, W.-T.L. and M.-T.T.; writing—original draft preparation, W.-T.L.; writing—review and editing, M.-T.T. All authors have read and agreed to the published version of the manuscript.

Funding

This research was financially supported by the Ministry of Science and Technology of Taiwan, R.O.C. under Grant No. MOST 109-2221-E-011-032—and the National Taiwan University of Science and Technology.

Institutional Review Board Statement

Not applicable.

Informed Consent Statement

Not applicable.

Data Availability Statement

Not applicable.

Conflicts of Interest

The authors declare no conflict of interest.

References

  1. Pierrehumbert, R. There Is No Plan B for Dealing with the Climate Crisis. Bull. At. Sci. 2019, 75, 1–7. [Google Scholar] [CrossRef] [Green Version]
  2. Guidelines on Green Houses of Worship, UN Environment Programme, July. 2020. Available online: https://www.unenvironment.org/resources/publication/guidelines-green-houses-worship (accessed on 5 October 2020).
  3. Green, M.; Taggart, J. Tall Wood Buildings: Design, Construction and Performance, 2nd ed.; Birkhäuser: Basel, Switzerland, 2020. [Google Scholar]
  4. Popovski, M.; Mohammad, M.; Ni, C.; Rezai, M.; Below, K.; Malczyk, R.; Sherstobitoff, J. Design and Construction of Tall Wood Buildings: Input Data, Testing and Advanced Analysis. In Proceedings of the 13th World Conference on Timber Engineering (13WCTE), Quebec City, QC, Canada, 10–14 August 2014. [Google Scholar]
  5. Connolly, T.; Loss, C.; Iqbal, A.; Tannert, T. Feasibility Study of Mass-Timber Cores for the UBC Tall Wood Building. Buildings 2018, 8, 98. [Google Scholar] [CrossRef] [Green Version]
  6. Connolly, T.; Moudgil, M.; Loss, C.; Iqbal, A. Feasibility of Cross-Laminated Timber Cores for the UBC Tall Wood Building. In Proceedings of the 15th World Conference on Timber Engineering (15WCTE), Seoul, Korea, 20–23 August 2018. [Google Scholar]
  7. Švajlenka, J.; Kozlovská, M. Evaluation of the Efficiency and Sustainability of Timber-Based Construction. J. Clean. Prod. 2020, 259, 120835. [Google Scholar] [CrossRef]
  8. C. P. CLT Handbook: Cross-Laminated Timber; Gagnon, S., Ed.; FPInnovations: Vancouver, BC, Canada, 2011. [Google Scholar]
  9. Alsayegh, G.; Mukhopadhyaya, P.; Wang, J.; Zalok, E.; van Reenen, D. Preliminary Characterization of Physical Properties of Cross-Laminated-Timber (CLT) Panels for Hygrothermal Modelling. Adv. Civ. Eng. Mater. 2013, 2, 472. [Google Scholar] [CrossRef]
  10. Laguarda Mallo, M.F.; Espinoza, O. Outlook for Cross-Laminated Timber in the United States. BioResources 2014, 9, 7427–7443. [Google Scholar] [CrossRef] [Green Version]
  11. Weissensteiner, J.; Barbu, M.C. Cross Laminated Timber—European Experiences. Pro Ligno 2013, 9, 69–72. [Google Scholar]
  12. Balasbaneh, A.T.; Sher, W. Comparative Sustainability Evaluation of Two Engineered Wood-Based Construction Materials: Life Cycle Analysis of CLT versus GLT. Build. Environ. 2021, 204, 108112. [Google Scholar] [CrossRef]
  13. Nässén, J.; Hedenus, F.; Karlsson, S.; Holmberg, J. Concrete vs. Wood in Buildings—An Energy System Approach. Build. Environ. 2012, 51, 361–369. [Google Scholar] [CrossRef]
  14. Haibo, G.; Ying, L.; Yiping, M.; Haoyu, H.; Cheng, S.; Yu, S. A Comparison of the Energy Saving and Carbon Reduction Performance between Reinforced Concrete and Cross-Laminated Timber Structures in Residential Buildings in the Severe Cold Region of China. Sustainability 2017, 9, 1. [Google Scholar]
  15. Haibo, G.; Ying, L.; Wen-Shao, C.; Yu, S.; Cheng, S. Energy Saving and Carbon Reduction in the Operation Stage of Cross Laminated Timber Residential Buildings in China. Sustainability 2017, 9, 292. [Google Scholar] [CrossRef] [Green Version]
  16. Khavari, A.M.; Pei, S.; Tabares-Velasco, P.C. Energy Consumption Analysis of Multistory Cross-Laminated Timber Residential Buildings: A comparative study. J. Archit. Eng. 2016, 22, 04016002. [Google Scholar] [CrossRef]
  17. Ying, L.; Haibo, G.; Cheng, S.; Wen-Shao, C. Assessing Cross Laminated Timber (CLT) as an Alternative Material for Mid-Rise Residential Buildings in Cold Regions in China—A Life-Cycle Assessment Approach. Sustainability 2016, 8, 1047. [Google Scholar] [CrossRef] [Green Version]
  18. Dong, Y.; Cui, X.; Yin, X.; Chen, Y.; Guo, H. Assessment of Energy Saving Potential by Replacing Conventional Materials by cross Laminated Timber (CLT)—A Case Study of Office Buildings in China. Appl. Sci. 2019, 9, 858. [Google Scholar] [CrossRef] [Green Version]
  19. Švajlenka, J.; Kozlovská, M.; Badida, M.; Moravec, M.; Dzuro, T.; Vranay, F. Analysis of the Characteristics of External Walls of Wooden Prefab Cross Laminated Timber. Energies 2020, 13, 5974. [Google Scholar] [CrossRef]
  20. Adekunle, T.O. Occupants’ Comfort and Stress Indices in a Structural Timber School Building in the Northeast US in Different Seasons. Build. Res. Inform. 2020, 48, 331–348. [Google Scholar] [CrossRef]
  21. Adekunle, T.O. A Field Survey on Thermal Comfort of Occupants and Cold Stress in CLT School Buildings. In Smart and Sustainable Cities and Buildings; Roggema, R., Roggema, A., Eds.; Springer: Cham, Switzerland, 2020. [Google Scholar]
  22. Amitha, J.; Satheeskumar, N.; Tuan, D.; Priyan, M.; Nick, H.; Lu, A. Life Cycle Performance of Cross Laminated Timber Mid-rise Residential Buildings in Australia. Energy Build. 2020, 223, 110091. [Google Scholar] [CrossRef]
  23. Laleman, R.; Albrecht, J. Estimations of the Reserve Margin during the Nuclear Phase-out. Int. J. Electr. Power Energy Syst. 2016, 81, 416–426. [Google Scholar] [CrossRef]
  24. Gülen, G.; Bellman, D.K. Scenarios of Resource Adequacy in ERCOT: Mandated Reserve Margin, Impact of Environmental Regulations and Integration of Renewables. Electr. J. 2015, 28, 89–100. [Google Scholar] [CrossRef]
  25. Lindner, B.; Brits, R.; van Vuuren, J.; Bekker, J. Tradeoffs between Levelling the Reserve Margin and Minimising Production Cost in Generator Maintenance Scheduling for Regulated Power Systems. Int. J. Electr. Power Energy Syst. 2018, 101, 458–471. [Google Scholar] [CrossRef]
  26. National Statistics (Taiwan). Housing Conditions of 2010 Statistical Tables. Population and Housing Census. 2010. Available online: https://census.dgbas.gov.tw/PHC2010/english/rehome.htm (accessed on 25 September 2020).
  27. Margani, G.; Evola, G.; Tardo, C.; Marino, E.M. Energy, Seismic, and Architectural Renovation of RC Framed Buildings with Prefabricated Timber Panels. Sustainability 2020, 12, 4845. [Google Scholar] [CrossRef]
  28. Barbagallo, F.; Margani, G.; Marino, E.M.; Moretti, A.; Tardo, C. Impact of Retrofit of RC Frames by CLT Panels and Friction Dampers. In Proceedings of the 8th International Conference on Computational Methods in Structural Dynamics and Earthquake Engineering, CompDyn 2021, Streamed from Athens, Athens, Greece, 28–30 June 2021. [Google Scholar]
  29. Pelaz, B.; Blanco, J.M.; Cuadrado, J.; Egiluz, Z.; Buruaga, A. Analysis of the Influence of Wood Cladding on the Thermal Behavior of Building Façades; Characterization through Simulation by Using Different Tools and Comparative Testing Validation. Energy Build. 2017, 141, 349–360. [Google Scholar] [CrossRef]
  30. Cambiaso, F.; Pietrasanta, M.V. Innovative Timber Construction: Sustainability and High Performance Building Skin. Int. J. Eng. Technol. 2014, 6, 47–54. [Google Scholar] [CrossRef] [Green Version]
  31. Haba, R.; Kitamori, A.; Mori, T.; Fukuhara, T.; Fukuhara, T.; Isoda, H. Development of CLT Panels Bond-in Method for Seismic Retrofitting of RC Frame Structure. J. Struct. Constr. Eng. (Trans. AIJ) 2016, 81, 1299–1308. [Google Scholar] [CrossRef]
  32. Khajehpour, M.; Pan, Y.; Tannert, T. Seismic Analysis of Hybrid Steel Moment Frame CLT Shear Walls Structures. J. Perform. Constr. Facil. 2021, 35, 04021059. [Google Scholar] [CrossRef]
  33. Pacheco-Torgal, F.; Faria, J.; Jalali, S. Embodied Energy versus Operational Energy. Showing the Shortcomings of the Energy Performance Building Directive (EPBD). Mater. Sci. Forum 2013, 730, 587–591. [Google Scholar] [CrossRef] [Green Version]
  34. Taipower Company Sustainabilty Report. 2008. Available online: https://www.taipower.com.tw/upload/85/2018010916401984784.pdf (accessed on 16 January 2021).
  35. CO2 Emissions, CO2 Emissions Intensity and Electricity Sales. 2020. Available online: https://www.tepco.co.jp/en/corpinfo/illustrated/environment/emissions-co2-e.html (accessed on 22 January 2021).
  36. Bureau of Energy, Ministry of Economic Affairs, Taiwan. 2019. Available online: https://www.moeaboe.gov.tw/ECW/populace/news/Board.aspx?kind=3&menu_id=57&news_id=17638 (accessed on 16 January 2021).
  37. EMA: Singapore Energy Statistics|Energy Transformation. 2020. Available online: https://www.ema.gov.sg/Singapore-Energy-Statistics-2019/Ch02/index2 (accessed on 18 January 2021).
  38. Ministry of Economic Affairs, Taiwan. 2017. Available online: https://reurl.cc/pd3oj8 (accessed on 16 January 2021).
  39. Peng, C. Calculation of a Building’s Life Cycle Carbon Emissions Based on Ecotect and Building Information Modeling. J. Clean. Prod. 2016, 112, 453–465. [Google Scholar] [CrossRef]
  40. The Technical Characteristics of KLH Cross-Laminated Timber Panels. Available online: http://www.klhuk.com/media/29233/technical%20characteristics.pdf (accessed on 5 May 2020).
  41. Stora Enso. CLT. Technical Brochure. Available online: https://www.storaenso.com/-/media/documents/download-center/documents/product-brochures/wood-products/clt-by-stora-enso-technical-brochure-en.pdf (accessed on 11 May 2020).
Figure 1. Standard floor plans of the target buildings.
Energies 15 00165 g001
Figure 2. Analysis models of numerical simulation.
Energies 15 00165 g002
Figure 3. Latitudes of the considered cities.
Energies 15 00165 g003
Figure 4. Annual temperatures of the considered cities.
Energies 15 00165 g004aEnergies 15 00165 g004b
Figure 5. Energy consumption of 4 story building in different cities.
Energies 15 00165 g005
Figure 6. Energy consumption of 10 story buildings in different cities.
Energies 15 00165 g006
Figure 7. Comparison of different types of energy consumption in different cities.
Energies 15 00165 g007
Figure 8. Carbon emissions of 4 story building in different cities.
Energies 15 00165 g008
Figure 9. Carbon emissions of 10 story building in different cities.
Energies 15 00165 g009
Figure 10. Comparison of different type of Carbon emissions in different cities.
Energies 15 00165 g010
Figure 11. Analysis models of hybrid structure system.
Energies 15 00165 g011
Table 1. Electricity carbon emission coefficients of different countries.
CountryElectricity Carbon Emission Coefficient
(kg CO2e/kWh)
China (Harbin)1.13 [34]
Japan (Tokyo)0.47 [35]
Taiwan (Taipei and Kaohsiung)0.53 [36]
Singapore0.41 [37]
Table 2. Fuel carbon emission coefficient of all the compared countries.
ItemCarbon Emission Coefficient
(CO2e/m³)
Natural gas1.88 [38]
Table 3. Basic information on the target buildings.
Building Type4F10F
Single-story floor area192.8 m2702.6 m2
Total floor area771.2 m27026.0 m2
floor-to-ceiling
height
others3.0 m3.2 m
Ground level3.2 m3.6 m
Total surface area1161.2 m23906.6 m2
Exterior window ratio16.4%19.9%
User number per unit area3 people/100 m23 people/100 m2
Total user number23 people211 people
Average illumination power6.6 W/ m26.6 W/ m2
Table 4. Physical properties of different walls.
Wall
Material
Wall
Purpose
Total Thickness
(mm)
Heat Transfer Coefficient
W/(m2·K)
Thermal
Resistance
(m2·K)/W
Thermal Mass
kJ/K
RCExterior wall1503.870.2560.98
Interior wall1203.460.2922.59
CLTExterior wall (10F)3000.303.34.66
Exterior wall (4F)2150.382.593.91
Interior wall1500.591.672.48
Table 5. Materials of different wall types.
Wall
Material
Wall
Purpose
Total Thickness
(mm)
Wall Schematic Interior MaterialThickness
(mm)
RC Exterior wall150 Energies 15 00165 i001Ceramic tile10
Cement mortar10
Concrete120
Cement mortar10
Interior wall120 Energies 15 00165 i002Cement mortar10
Concrete100
Cement mortar10
CLT Exterior wall (10F)300 Energies 15 00165 i003Plasterboard15
Rigid insulation wall50
CLT220
Plasterboard15
Exterior wall (4F)215 Energies 15 00165 i004Plasterboard15
Rigid insulation wall50
CLT135
Plasterboard15
Interior wall150 Energies 15 00165 i005Plywood10
Rigid insulation wall20
CLT110
Plywood10
Table 6. Weather information in the considered cities.
CityTemperature (°C)Relative Humidity
(%)
Wind Speed
(m/s)
Radiation
(Wh/m2)
HottestColdestHighestLowestHighestLowestHighestLowest
Harbin33−3081454.21.9209106
Tokyo34−177523.92.6198132
Taipei35784764.62.216644
Singapore342488823.91.29649
Table 7. Energy consumption comparison of structures with different heights in different cities.
HarbinTokyoTaipeiSingapore
RCCLTRCCLTRCCLTRCCLT
(A)
Electricity
(kWh/m²/yr)
4
storys
244148165148175179232227
10
storys
195105143119157151202190
(B)
Electricity
(MJ/m²/yr)
4
storys
877534594533644631833818
10
storys
702377517426566543726682
(C)
Fuel
(MJ/m²/yr)
4
storys
4021225115971020761603390389
10
storys
307519171304899701583382382
Sum (B) + (C)
(MJ/m²/yr)
4
storys
48982785219115531392124712231207
10
storys
37772294182113251267112611081064
Table 8. Energy consumption Ratio between RC Building and CLT Building.
HarbinTokyoTaipeiSingapore
Electricity
(Ratio of CLT/RC)
4 storys0.610.900.980.98
10 storys0.540.820.960.94
Fuel
(Ratio of CLT/RC)
4 storys0.560.640.791.00
10 storys0.620.690.831.00
Total Consumption
(Ratio of CLT/RC)
4 storys0.570.710.880.99
10 storys0.610.730.890.96
Table 9. Carbon emissions comparison of structures with different heights in different cities.
HarbinTokyoTaipeiSingapore
RCCLTRCCLTRCCLTRCCLT
(A)Electricity
(kg/m²/yr)
4 storys276167797195939693
10 storys220119695784818378
(C)Fuel
(Kg/m²/yr)
4 storys199111795038301212
10 storys15295696535291212
Sum (A)+(B)
(Kg/m²/yr)
4 storys474278158121133123108105
10 storys3722131331021181099590
Table 10. Energy consumption comparison of hybrid structures with RC and CLT structures in different cities.
HarbinTokyoTaipeiSingapore
RCCLTHybridRCCLTHybridRCCLTHybridRCCLTHybrid
(A) Electricity (MJ/m2/yr)702377389517426436566543549726682692
(B) Fuel (MJ/m2/yr)3075191718741304899882701583570382382382
Sum (A) + (B) (MJ/m2/yr)377722942263182113251318126711261119110810641074
Table 11. Comparison of energy consumption ratio of hybrid structures with RC and CLT structures in different cities.
CityRC Structure
Ratio (RC/RC)
Hybrid Structure
Ratio (Hybrid/RC)
CLT Structure
Ratio (CLT/RC)
Harbin Energies 15 00165 i006 Energies 15 00165 i007 Energies 15 00165 i008
Tokyo Energies 15 00165 i009 Energies 15 00165 i010 Energies 15 00165 i011
Taipei Energies 15 00165 i012 Energies 15 00165 i013 Energies 15 00165 i014
Singapore Energies 15 00165 i015 Energies 15 00165 i016 Energies 15 00165 i017
Publisher’s Note: MDPI stays neutral with regard to jurisdictional claims in published maps and institutional affiliations.

