Article

Analysis of the Impact of Climate Change on Surface Water Quality in North-Eastern Poland

by
Monika Puchlik
1,*,
Janina Piekutin
2 and
Katarzyna Dyczewska
1
1
Department of Forest Environment, Faculty of Construction and Environmental Sciences, Bialystok University of Technology, 45A Wiejska Str., 15–351 Bialystok, Poland
2
Department of Technology in Environmental Engineering, Faculty of Construction and Environmental Sciences, Bialystok University of Technology, 45A Wiejska Str., 15–351 Bialystok, Poland
*
Author to whom correspondence should be addressed.
Energies 2022, 15(1), 164; https://doi.org/10.3390/en15010164
Submission received: 27 November 2021 / Revised: 14 December 2021 / Accepted: 20 December 2021 / Published: 27 December 2021
(This article belongs to the Collection Feature Papers in Energy, Environment and Well-Being)

Abstract

:
This article presents the influence of climatic conditions on surface water quality. The research methodology, including physicochemical analysis from the Gołdapa and Bludzia rivers, is presented. The research lasted for two years. The results of the physicochemical studies of the Gołdapa and Bludzia rivers in early spring, spring, and autumn show that each of these seasons impacts the quality of surface waters. Moreover, it was proven that all the parameters are strongly correlated with the air temperature, the sum of daily precipitation, and water levels. For detailed analysis, the obtained results of own research were compared with meteorological and hydrological data from the last 15 years (2005–2021) for the region of north-eastern Poland. It was proven that temperature changes contribute to increased surface water pollution in the north-eastern part of Poland. Waters from areas that humans have not developed are of better quality than those that drain the urban area, which is reflected in the case of the superior quality of the Bludzia river compared to the Gołdapa river. The upward trend in temperature in the Gołdap region indicates that global warming will continue.

1. Introduction

Every year around the world, about 51 billion greenhouse gases are produced. According to many authors, an increase in mainly CO2 and other greenhouse gases will affect current farming systems [1,2,3] due to increasing air temperatures. Greenhouse gases occur in the atmosphere as a result of processes that occur naturally in nature. Such compounds include water vapor (H2O), methane (CH4), nitrous oxide (N2O), and the most frequently mentioned compound, carbon dioxide (CO2). Greenhouse gases also include compounds that have never been natural components of the atmosphere, such as freons generated by the chemical industry as cooling substances [4,5].
The climate of a given region is determined by the average long-term weather conditions, considering seasonal changes. The weather is its everyday manifestation, and at the same time, it is very changeable. However, changes in the climate of a given region can only be noticed after a more extended period (e.g., around ten years). This period of time is needed to distinguish long-term climate changes from natural weather variability [6].
Contemporary civilizational development features numerous negative consequences. These include the climate changes mentioned above, manifested mainly in the form of an increase in global average air temperatures and the extreme weather phenomena that go hand in hand with them. Climate models predict progressive global warming in the future, a modification in the structure of atmospheric rainfall, especially in winter and spring, and an associated increased risk of soil drought, resulting in, for example, problems in agricultural production [7]. Moreover, climate models and hydrological models indicate that most countries will experience a reduction in water resources, but this is particularly true in areas in which the low availability of potable water resources, the high impact of climate change, and increasing demand for food overlap [8]. A factor compounding the effects of anthropopressions on aquatic ecosystems is climate change. Recent climate reports have reported that if warming continues at the currently observed rate, global average air temperature will increase by 1.5 °C and then by 2 °C, and this will occur as early as between 2030 and 2052 [9], with some areas of the globe likely to experience temperature increases as high as 3 to 4.5 °C. Such a temperature increase will dramatically alter the way aquatic ecosystems and their biotic components function [10,11].
Cai and Cowan consider climate change to be responsible for a 20% reduction in rainfall during winter since the 1960s, and that even greater rates of rainfall reduction are likely in the future. [12]. The CO2 concentration in the atmosphere is expected to reach 440 ppm by 2040. RCP4.5 assumes the emission to peak around 2040 and the CO2 concentration to reach 540 ppm by 2100 [13].
Increasing the air temperature with changes in precipitation totals directly and comprehensively affects hydrology, water resources, and quality [14]. The indicators of surface water availability in Poland are relatively low. Even so, there are years when flood disasters plague the country. Therefore, there is concern that climate change may harm Poland’s water resources [15]. The increasing frequency of years with anomalous air temperatures and precipitation means that a precise identification of plants’ water needs is required. Kundzewicz and Matczak [16] pointed at in the climate change projections for adverse changes to the water budget deficit in Poland and projected it to increase further in the future.
Modern civilizational development features a number of negative consequences. It is necessary to make the public aware of climatic conditions and the possibility of mitigating its effects to protect the environment from pollution and degradation. The research started in 2019 constituted forested, rural, largely non-urbanized areas characterized by excellent recreational conditions, including clean environment, silence, tranquility, and natural values. The monitoring of surface water quality makes it possible to assess the transformation of ecosystems under the influence of contemporary climate changes and the role that forests can play in mitigating those changes. This study is part of one of the most important current research projects on the adaptation of forests and forestry to contemporary environmental changes. Research in this area features not only a cognitive purpose, but also fundamental practical, economic and social importance.

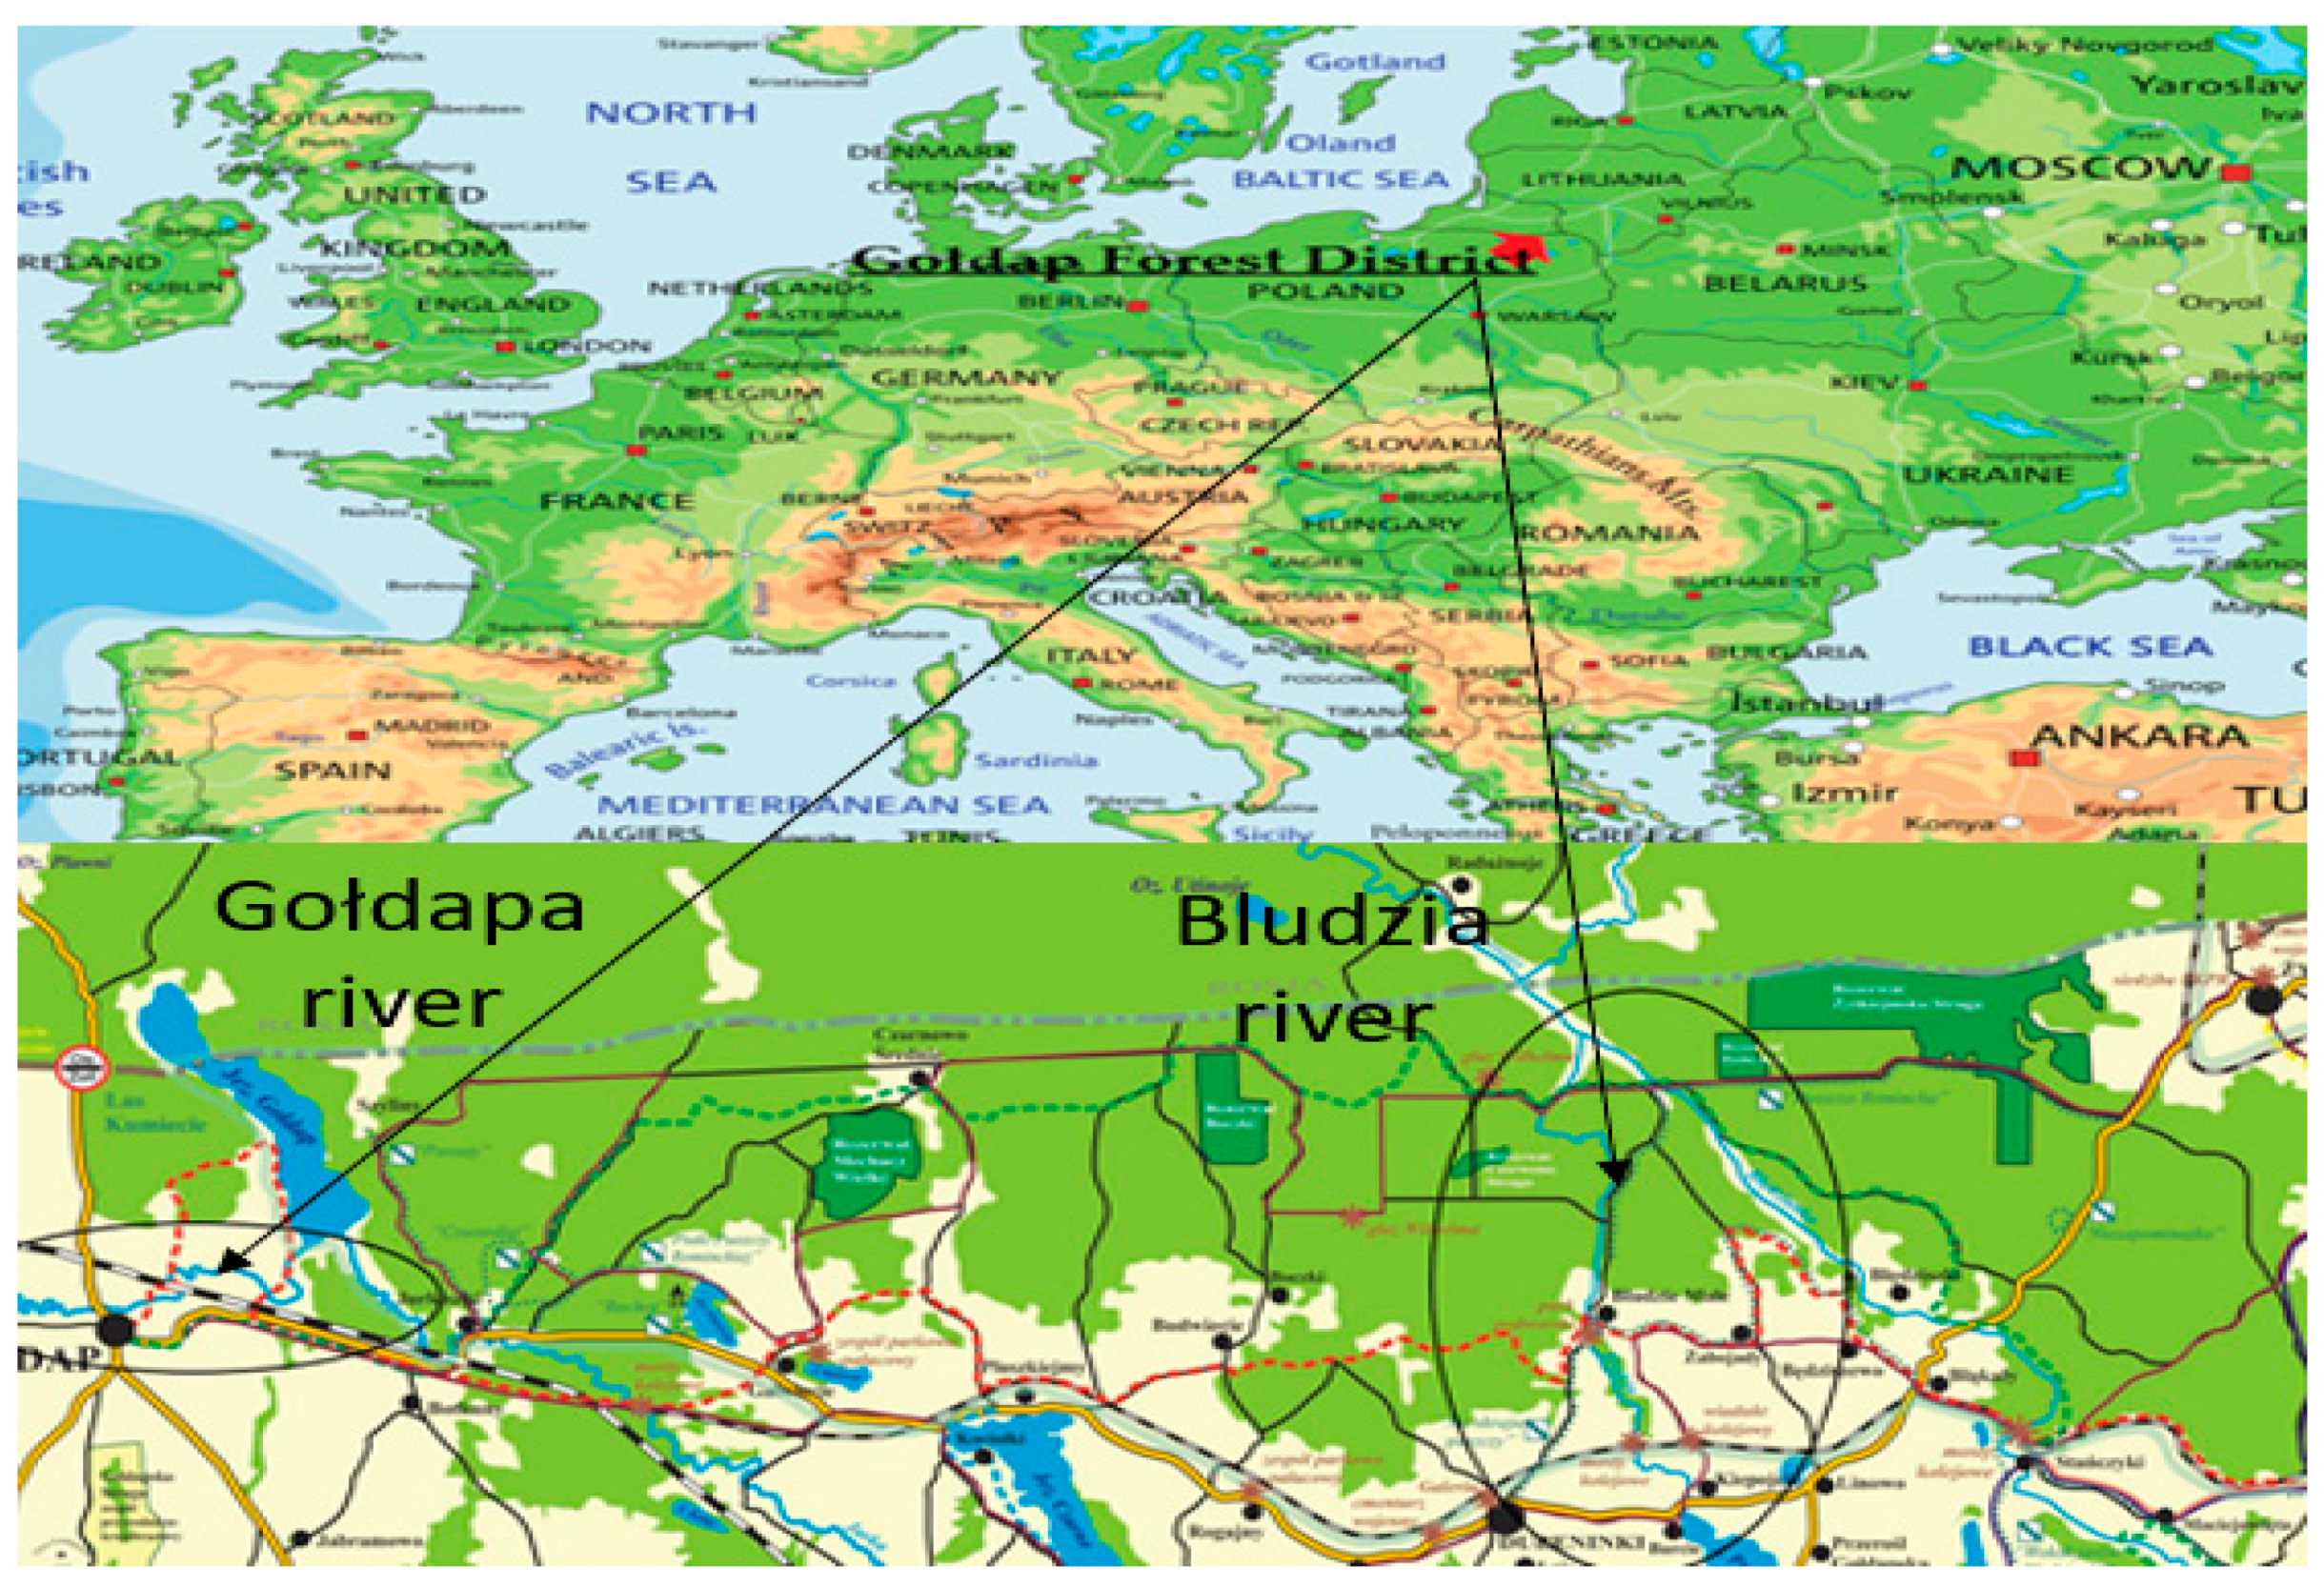
2. Characteristics of the Research Area

The Gołdap Forest Inspectorate is located in the north-eastern part of the Warmian-Masurian Voivodeship, in the Gołdap County, in the Gołdap and Dubeninki municipalities in Poland (Figure 1) [17]. To the west, this unit borders with the Czerwony Dwór Forest District, to the south with the Olecko Forest District, and to the east with the Suwałki Forest District. The Kaliningrad Oblast of the Russian Federation is its northern border. The forests managed by the Gołdap Forest District are part of the Romincka Forest. The forest complex in question is located in two countries, of which about 2/3 belong to Russia [18]. The area of the forest inspectorate covers 13 728.4 ha. According to Poland’s nature and forest regionalization in 2010, the forests in the forest district are located in the second Nature and Forest Region—Mazursko-Podlaska, in the mesoregions of Romincka Forest, Ełk Lakeland, and Suwalki Lakeland [19].

2.1. Climate of the Analyzed Region

The climate of the Dubeninki Commune features the characteristics of a transitional, continental sea. It is characterized by a high variability in weather conditions. The average yearly air temperature is 6–8 °C, while the average annual amplitude of air temperature is 19 to 22 °C. The warmest months are July and August, while the coldest are January and December [19,20]. Concerning physical locations, the studied area belongs to Eastern Europe, the sub-area of the East Baltic Lowlands, and the province of the East-Baltic Lowlands. It is situated within the macroregion of the Lithuanian Lake District, which (next to the Masurian Lake District) is a component of the Eastern Baltic Lake District sub-province [21]. The studied rivers are located in the Warmińsko-Mazurskie voivodeship, in the Gołdap poviat, near two communes: Gołdap and Dubeninki. The commune of Gołdap is located within several physical and geographic units. According to the physical and geographical division of Kondracki, it is located in the sub-province of the Eastern Baltic Lake District [21]. The western part of the commune belongs to the Masurian Lake District macroregion. The eastern part belongs to the Lithuanian Lakeland macroregion. The commune is also located within the following mesoregions: the Romincka Forest, the Land of Węgorapa, the Szeskie Hills, and the West Suwałki Lake District. The Mazurian Lake District is characterized by a relatively cool, humid climate, with continentalism increasing to the north-east. The average annual air temperature is 6.5 °C while half-year in the winter is −0.5 °C, and in the summer it is 13 °C. The average annual air humidity is 9.0 hPa. In the cold half-year, this average is 5.0 hPa, and in the summer it is11.5 hPa [22].

2.2. Water Relations

The area of the Gołdap Forest District is located in the Pregoła river catchment area. Its waters drain to the Vistula Lagoon. The southern boundary of this catchment runs near the southern boundary of the territorial range of the forest district, around the Black Lake. The main rivers of the Gołdap Forest District are Gołdapa and Błędzianka. Błędzianka and its main tributaries, Bludzia, Żytkiejmska Struga, and smaller tributaries, Czerwona Struga, Czernica, and Pstrążnia, are the forest rivers. Just before the border, the Bludzia river flows into Błędzianka as its tributary. The Czerwona Struga is a tributary of Bludzia. It is a small watercourse with great natural value. This is due to the presence on its shores of numerous stands of the rare and partially protected Matteucia struthiopteris fern. This area is under reserve protection. Żytkiejmska Struga is an extremely picturesque tributary of the Błędzka river. It flows through a vast, peat-covered valley, partially flooded by the activity of beavers. Its bog forest, mixed bog forest, and alder habitats are formed on peat soils. The Duży Budier and the Pstrążnia, as two left-bank tributaries of the Żytkiejmska Struga, are characterized by deep, shady valleys and large slopes, similar to mountain streams [17]. The total length of the Błędzianka river is approximately 70 km, of which 24.6 km is in Poland. The catchment area in Poland is 260.1 km2.
The Gołdapa river is one of the primary and largest rivers in the Gołdap Forest District area. This river begins near Kowale Oleckie. Initially, under the name “Jarka”, it flows into Lake Gołdap, from where it continues, as Gołdapa, to the south-west, to Węgorapa. The most interesting section is Jarka. It meanders through forest areas. In its valley, on fertile soils, mainly wet forest and ash alder habitats have developed. Gołdapa flows out of the lake, through agricultural lands [23]. The river source is 204 m, while the estuary is 97 m above sea level. The two large drops cause the river bed’s firm bottom and side erosion in its middle and upper course. Near the river, there are two lakes of ribbon origin (Gołdap and Czarne), which were formed due to subglacial activity.

3. Materials and Methods

3.1. Methodology

The preliminary research started in 2019, when research data and data from the IMWM were analyzed. A research area was selected, from which two rivers were chosen for the study: Gołdapa and Bludzia, characterized by significant forest cover and low population. The next step was the physicochemical analysis of the water.

3.2. The Research Process

The research covered the Gołdapa and Bludzia rivers. Samples were taken according to PN-ISO 5667-5: 2017-10 [24] over two years: autumn (October), early spring (March), and spring (May) 2020 and 2021, at six measurement and control points in total. The sampling points were established based on the nature of the catchment area: 1—areas within the range of cities, 2—areas located within the range of small settlements and forest areas, 3—typically agricultural and forest areas.
In the tested water samples, taken directly from the Gołdapa and Bludzia rivers, in accordance with the applicable methodology, the following were determined: nephelometric turbidity unit (NTU); pH; conductivity; ammonium ion; manganese; TOC; nitrate nitrogen; nitrite nitrogen; hardness; chlorides; sulfates.
The analyses and physicochemical measurements of the water were carried out in the Accredited Laboratories of Białystok Waterworks Sp. z o. o. The analyses were carried out following the Act of the Minister of the Environment on “The quality of water intended for human consumption” [25,26].

4. Results and Discussion

4.1. Hydromorphological Analysis

To determine the dependence of the influence of temperature and season on the increase in environmental pollution and the quality of surface waters, an analysis of the results of the waters of the Gołdapa and Bludzia rivers in the region of north-eastern Poland was carried out. Physicochemical tests were carried out in three research seasons over two years. The results of the physicochemical analyses of the waters of the Gołdapa and Bludzia rivers enabled a detailed analysis of changes in water quality throughout the research period. Moreover, to compare with the authors’ research, the meteorological and hydrological data for the Gołdap region from 2005–2021 were obtained, concerning the average daily precipitation and surface water levels [27] (Figure 2 and Figure 3).
The obtained data, both the sum of daily precipitation in the Gołdap region (Figure 2) and the water levels in the Gołdapa river (Figure 3), clearly indicate a downward trend, which means that the amount of precipitation will decrease, and the state of surface waters will decrease with them.
The surface water level in the Gołdap region will decrease every year (Figure 2). However, this is not the case with the oceans and seas. A global rise in temperature is causing Arctic ice to melt more and more rapidly—in the last decade, the level of the oceans has increased by 3 mm/year, compared to 1.7 to 1.8 mm/year in the last century [28]). Rosenzweig et al. [29] state that precipitation intensity increases in warmer climates, according to the laws of thermodynamics. More extended dry periods are therefore separated by intense rainfall, and thus the risk of flooding increases. In addition, the areas affected by severe drought have grown significantly in size globally. The Strategic Plan of Adaptation in Poland [30] contains information that changes in the structure and frequency of occurrence of precipitation have been recorded. In the wet seasons (early spring and spring), heavy rains began to dominate. The situation was similar regarding the Gołdap region (Figure 2), which showed jumps in precipitation. The current year, 2021, and May, in which the average daily sum of precipitation was as high as 107.8 mm, drew particular attention. With the predominance of high-rate rains, there was also an intensification in the number of days with precipitation during the year. Moreover, the rainless periods extended by about 5 days/10 years and most often affected eastern and central Poland [30]. This was reflected in the Gołdap region—Figure 2 shows that the amount of precipitation decreased every year.
Due to decreasing rainfall, water should be collected by increasing water retention, especially small retention in the form of, for example, ponds and wetlands. Forest play a unique role in water retention. According to Miler [31], forests form a kind of retention reservoir and stabilize the outflow from catchment areas. The author also emphasizes that small retention encompasses everything that contributes to the extension of the path and time of water circulation in the catchment, such as deciduous species, for which the incidence reaches 20%. Thus, there are many types of retention in forests, including vegetation retention, soil and ground retention, snow retention, depression retention, reservoirs, and watercourses. Moreover, Mioduszewski (2003) [32] indicates that the sum of precipitation in the forest is consistently about 10% higher than in the field. Evaporation is similar in forests and fields. The sum of runoff shows no relation to afforestation. Forests lengthen floods. Miler [31] states that small retention can accumulate water in small natural and artificial reservoirs and dam up water in the beds of small rivers and streams, in canals, and even ditches. Therefore, there is a wide range of possibilities to collect water, which is currently so valuable.

4.2. Temperature Variation Characteristics

The analysis of the results of changes in the average air temperatures for the Gołdap region from 2005–2021 showed an upward trend, which is illustrated by the linear regression in Figure 4.
The distribution of the results confirms the commonly observed climate change and global temperature increase. Kundziewicz [28] claims that the average temperature may be significantly above or significantly below the general trend in a single year or even in a single month. A similar relationship was observed in the studied region of Gołdap. The increase in the average temperature was not regular; it was different over the analyzed period (Figure 4). Climate changes occur mainly due to the intensification of the greenhouse effect and its consequences, i.e., climate warming. It is worth emphasizing that the greenhouse effect is a natural phenomenon—without it, life on Earth would not exist. However, the increased emission of greenhouse gases, resulting from the development of civilization, leads to its increase [32]. According to Furmańczyk [33], the Earth’s climate is highly variable. It has been observed over millions of years. It is evidenced by the results of geological studies of rocks from different epochs and periods of world history. Initially, climate change was caused by natural factors: fluctuations in solar radiation, volcanic dust, fluctuations in ocean temperatures, and an increase in glaciation. Kocur-Bera [32] claims that man and the development of civilization have become a new factor influencing the climate. The most noticeable climate changes have been recorded since the industrial revolution in the 18th century. It was a historic moment. It contributed to the growth of mechanization, the number of factories, and all means of transport. Their construction and operation led to the pollution of the environment with various substances and the emission of greenhouse gases into the atmosphere. Another problem affecting the increase in carbon dioxide emissions is the decrease in biologically active areas, such as meadows, pastures, forests, parks, gardens, wooded areas, etc. Global warming and the greenhouse effect have been observed for over two centuries [34]. Giddens [35] points out that greenhouse gases include carbon dioxide, water vapor, nitrogen oxides, methane, freons, and ozone. Through them, sunlight penetrates the Earth’s atmosphere, which heats the entire planet while remaining in the atmosphere. The fact is that if it were not for the greenhouse effect, the temperature on the Earth would be too low to sustain human life, and the entirety of the world’s ice would be chained up. Without an atmosphere containing greenhouse gases, the Earth’s average global temperature would be −18 °C, approximately 33 °C lower than it is today [28]. The greenhouse effect itself is a boon for the abundance of life on Earth. Meanwhile, human activity produces excessive greenhouse gases, which stops the increased amount of solar radiation. As a result, the temperature on Earth increases. Solomon et al. [36] found, based on the analysis of ice cores, that there had not been such high concentrations of carbon dioxide in the atmosphere as today for at least 650,000 years.
Research by Moździoch and Ploch [37] showed that over the last century, the mean global temperature increased by 0.74 °C, while in Europe it rose by 0.95 °C. Kundziewicz [28] reports that the global temperature has been increasing since 1960. According to the research by Michalska [38], in the last decade in Poland, an increase in air temperature from 0.3 to 0.6 °C has been recorded. This increase is most visible during winter, manifested by the reduced number of frosty days, a shortened period of snow cover, and the reduced icing of rivers and lakes. The winter with the lowest temperatures took place in 2010, as shown in Figure 4. This is confirmed by the research by Kundziewicz [28], in which he showed that in 2010 and 2011, there were several months in Poland with temperatures below the multi-year average. However, on a global scale, the entire year of 2010 was the warmest on record and concluded the warmest decade in the history of direct temperature observations.
High variability in weather, different lengths and courses of the seasons, and a wide range of air temperatures throughout the year in Poland, and thus in the Gołdap region, result from the country’s location in the transitional climate zone between the temperate continental climate in the east and the oceanic climate in the west (polar-sea air masses are mainly related to the transitional climate [39]).
Often, global climate changes are colloquially identified only with an increase in temperature. The research, however, suggests that in fact, all the elements of the interconnected climate systems and water resources change with this increase in temperature. As a result, the effects also affect many physical, biological, and human (socio-economic) systems. These include water systems, the cryosphere (glaciers, ice, snow cover, permafrost), coasts, natural disasters, ecosystems, agriculture, and health [29]. To demonstrate the relationship between air temperature and water resources, data from the Institute of Meteorology and Water Management were obtained from the period 2005–2021, concerning the total daily rainfall in the Gołdap region and the water levels of the Gołdapa river from the same time.
Climate change undoubtedly affects the quality of surface waters. Therefore, it is worth analyzing the results of physicochemical tests and selected heavy metals in water samples taken from the Gołdapa and Bludzia rivers in individual seasons.

4.3. Physicochemical Analysis

4.3.1. Turbidity

In the Gołdapa river, the highest mean turbidity values were recorded in the spring period, at point 1 (5.8 NTU), and the lowest in the early spring period, in intake II, at point 2 (1.0 NTU). The results were similar for the Bludzia river—the highest value also appeared in the spring period, at point 2 (6.0 NTU), and the lowest also in intake II, at point 3 (0.4 NTU) (Table 1). The highest values of this parameter occurred in spring, related to the period of heavy rainfall at that time and the positive air temperature. According to the data, the average total daily rainfall in the Gołdap region for this month, in 2021, was 107 mm; in March 2021, it was only 23.5 mm, and in October 2020, it was only 15.1 mm. According many authors [39,40,41], water turbidity can be caused by many substances, including soil and rock particles. The authors claim that, therefore, in periods of high water conditions, water becomes more turbid than in periods of low water conditions. According to this statement, the Gołdapa and Bludzia rivers were characterized by the highest turbidity during the periods of the highest rainfall and the associated high water levels. Similar results were observed by Olearczyk-Siwik [42], examining the Soła river during heavy rainfall. The author also showed that bottom sediments and floating suspensions transported at high water flow velocity also contribute to increases in turbidity. It is also worth paying attention to the water level of the Gołdapa river in the early spring period 2021—March (113.5 mm), with the average total daily rainfall for this month amounting to 23.5 mm. March 2021 was the month in which snow cover lay. At the same time, it melted, supplying watercourses with large amounts of rainwater, with the average turbidity being the lowest (2.06 NTU) compared to October (2.37 NTU) 2020 and May (4.61 NTU) 2021(Table 2). Moniewski [43] states that meltwater and rainwater are not strongly retained by the soil in winter, as it is cold, poorly diversified, and covered with rotting organic debris. In summer, flushing from the land surface is more effective due to heavy rainfall.

4.3.2. pH

The following parameter was the reaction. According to Szczykowska and Siemieniuk [41], most natural waters feature a pH value in the range of 6.5–8.0. Groundwater usually features a lower pH (slightly less than 7) than surface water due to its greater carbon dioxide saturation. Waters originating in peat bogs or fed by sewage are acidic and acidic, meaning their pH value is lower than 7. On the other hand, waters from mountain streams are very soft and feature a pH in the range of 5.0–5.5 (slightly acidic). Regarding the Gołdapa and Bludzia rivers, the reaction in any water abstractions was below 7 (Table 1 and Table 2). It should be emphasized that both rivers featured their highest pH values in the spring—in May 2021 (Gołdapa: pH from 8.27 to 8.57; Bludzia: pH from 8.23 to 8.45). Moniewski [43] explains the phenomenon of pH increase in summer as being due to the intensification of assimilation processes in surface waters due to rises in air temperature as well as water in watercourses. In such cases, the pH, may sometimes reach 10. This phenomenon results from the total intake of dissolved carbon dioxide from the water due to the photosynthesis processes taking place.

4.3.3. Nitrogen Compounds

The study of the water samples showed that the average values of nitrogen compounds in the Gołdapa river were formed in the entire research season, from less than 0.1 mg/L of ammoniacal nitrogen in the autumn period to 11.48 mg/L of nitrate nitrogen in the early spring period. Concerning the Bludzia river, this distribution ranged from 0.1 mg/L of ammoniacal nitrogen in the autumn period to 4.74 mg/L of nitrate nitrogen in the early spring period. The minimum and maximum values of the tested nitrogen compounds in both rivers appeared during the same seasons of the year. The Gołdapa river definitely exceeded the values observed related to the flow through the urban area (Table 2). The Bludzia river meanders through agricultural and forest areas among a much smaller number of buildings (Table 1). It should be emphasized that nitrogen, along with phosphorus, is a nutrient compound that influences plant development. However, its increased concentration in surface waters poses a danger as it leads to eutrophication, i.e., increased water fertility. Ammonium nitrogen occurs in natural waters in the form of ammonium ion (NH4+) due to the reaction of ammonia (NH3) with hydrogen ions. However, it can also take an undissociated form (NH3), exhibiting more potent toxic properties [44]. Aqueous solutions of ammonium salts must be acidic [41]. The sources of ammoniacal nitrogen in natural waters are mainly runoffs from agricultural areas fertilized with both natural and mineral fertilizers containing nitrogen. Other possible routes for the inflow of the discussed compound could be the processes of reduction of nitrate nitrogen and nitrite nitrogen and the processes of biochemical decomposition of organic nitrogen compounds—from plants, animals, or sewage [45]. Ammonium nitrogen concentrations in surface waters range from hundredths to several mg N-NH4+/L, unlike municipal wastewater, which is usually characterized by high concentrations ranging from several to several dozen mg N-NH4+/L [40]. The range given for surface waters is reflected in the case of both the studied rivers. The Gołdapa river featured the highest value of ammoniacal nitrogen in intake II, at point 3 (1.258 mg/L), and the Bludzia river also featured its highest value in intake II, but at point 2 (0.878 mg/L).
Nitrite nitrogen is easy to dissolve in water, and its aqueous solutions are alkaline. Both studied rivers showed their highest concentrations of this compound in water samples collected in spring—the Gołdapa river (max 0.28 mg/L, min 0.22 mg/L), the Bludzia river (max 0.23 mg/L, min 0.09 mg/L) (Table 1 and Table 2). It was observed that at the highest concentrations of nitrite nitrogen in uptake III, the concentration of hydrogen ions (pH) was the highest (Gołdapa: max 8.57, min 8.27; Bludzia: max 8.45, min 8.23) (Table 1 and Table 2). The presence of nitrite nitrogen in surface waters is mainly caused by the biochemical transformations of nitrogen-containing compounds. Nitrite nitrogen is an intermediate in the biological cycle. During biochemical decomposition, organic nitrogen compounds are first converted into ammonium nitrogen, and then, in an aerobic environment, and in the presence of nitrifying microorganisms, into nitrite nitrogen. This, in turn, is easily oxidized to nitrite nitrogen. Moreover, anaerobic conditions can also be a source of nitrite nitrogen by reducing nitrite nitrogen.
Unpolluted surface waters are generally rich in insignificant amounts of nitrite nitrogen concentrations, up to amounts not exceeding thousandths of mg/L. Slightly higher values may appear in polluted waters and waters flowing from swampy areas [46]. The Gołdapa river water collection points are located in areas of greater intensity of human activity. Points 1 and 2 are within reach of the city, settlements, forests, and point 3 is among agricultural fields and forests, which results in higher concentrations of nitrite nitrogen. In turn, the Bludzia river runs among rural areas at point 1, at point 2 through small settlements, and at point 3 it is surrounded by forest complexes and wetlands.
This diversity of water sampling locations showed that the waters flowing through urban areas and more intensively used for agriculture are more affluent in nitrogen compounds. Another factor influencing higher nitrogen concentrations in the spring was more intense rainfall in this period. Abundant surface runoff flushed many compounds from the surface, including nitrogen compounds, and thus supplied them with watercourses.
Among nitrogen compounds, nitrate nitrogen is the most persistent form of mineral nitrogen. Unpolluted surface waters usually contain nitrate nitrogen in low concentrations (up to 1 mg/L) [41]. Unfortunately, the Gołdapa river exceeds this value, reaching the maximum value of 11.48 mg/L in intake II, point 3. A similar situation was observed in the case of the Bludzia river, with the maximum average value of 4.74 mg/L in uptake II, point 2. These values indicate that the rivers were contaminated with nitrogen compounds, a downward trend in the concentration of this compound—from its maximum in March to its minimum in May. Thus, it was found that nitrate nitrogen is a nutrient essential for plant life. For this reason, during periods of increased plant vegetation (in the discussed case, this period was May), the concentration of nitrate nitrogen drops to lower values. However, it should be remembered that such a system may be disturbed by the inflow of pollutants [47].

4.3.4. Chloride

The data presented in the above graphs clearly indicate significant chloride contamination in the Gołdapa river. The highest values were observed in intake II (early spring—March 2020 and 2021), assuming the range from 11.09 to 26.99 mg/L (Table 2). On the other hand, the Bludzia river values during the entire research season oscillated between 6.22 to 7.50 mg/L (Table 1). In surface waters, there are chlorides of geological origin and those originating from sewage pollution. Regarding sewage, increased chloride concentrations in water are also accompanied by significant concentrations of nitrogen compounds. This relationship was observed in the Gołdapa river. In intake II, the highest concentrations of nitrogen compounds were also present with the highest chloride concentrations. It should also be noted that the growth of chlorides took place after the winter period, in which the road was cleared of snow and ice with the use of salt. Spring-like snow melts caused an influx of chlorides into the watercourses with them. The spring intake in May 2020 and 2021 showed a lower concentration of chloride values due to high rainfall, which raised the water level and caused its dilution.

4.3.5. Sulfates

When comparing the two studied rivers, it should be stated that Gołdapa displayed higher concentrations of sulfates in each uptake compared to Bludzia. The highest results in the Gołdapa river were recorded in intake II in the range from 42.94 mg/L in point 1 to 64.54 mg/L, and the lowest in intake I (max 24.50 mg/L, min 18.10 mg/L) (Table 2). Similar results were observed in the case of the Bludzia river. The highest sulfate concentrations were recorded in uptake II (max 37.32 mg/L, min 24.19 mg/L) and the lowest in uptake I (max 14.10 mg/L, min 11.70 mg/L) (Table 1). This distribution of results may be related to the heating season in the winter and early spring periods, during which sulfur oxides were emitted, which entered the watercourses together with rain or snowfall. The average values of sulfate concentration decreased at the end of May, probably due to heavy rainfall during this period. According to the available research, the content of sulfates (VI) in the waters of rivers and lakes ranges from 40–60 mg/L [41]. The studied rivers did not exceed this limit, except for Gołdapa: the sample from sampling II from point 2 exceeded these values, reaching 64.54 mg/L.

4.3.6. Phosphates

Regarding phosphates, the water samples from the Bludzia river showed much higher values than those from the Gołdapa river (Table 1 and Table 2). Its average concentration values were derived from the autumn and early spring periods. Intake II in 2020 and 2021 turned out to be richer in phosphates in both rivers. The results in the Gołdapa river in this abstraction ranged from 14.64 to 16.68 mg/L, and in the Bludzia river from 28.83 to 46.05 mg/L. It is worth noting that the highest value of phosphates (46.05 mg/L) in the Bludzia river may be related to the collection point location within rural areas. In rural areas, it was found that the sewage was most likely discharged, or its source was the surface runoff of melting snow from fields fertilized with phosphate fertilizers.

4.3.7. Calcium

Depending on the season of water sampling, the presence of the concentration of elements such as magnesium and calcium was also observed (Table 1 and Table 2). Both in the Gołdapa and Bludzia rivers, much higher concentrations of the tested elements were detected in water samples taken in the early spring 2020 and 2021. The shape of magnesium in the Gołdapa river ranged from 12 mg/L to 36.22, while calcium ranged from 72.32 to 159.79 mg/L in all the studied periods. As for the Bludzia river, the range of magnesium concentrations was from 12 to 38.52 mg/L, and for calcium it was from 58 to 137 mg/L.

4.3.8. Total Organic Carbon

An increase in the value of total organic carbon (TOC) concentrations in the water samples of the studied rivers in the spring (in May) in 2020 and 2021 was observed. In the case of the Gołdapa river, the mean TOC concentration values ranged from 21.79 to 83.09 mg C/L (Table 2). In the Bludzia river, it ranged from 32.90 to 69.65 mg C/L (Table 1). The correlation was found to be related to the increase in water temperature in the watercourse and the intensified decomposition processes of accumulated plant debris from the autumn period.
When analyzing the impact of climate changes on the quality of surface waters in the analyzed period, it is worth comparing the obtained results with the data from several years ago. Thanks to the courtesy of the Chief Inspectorate for Environmental Protection in Olsztyn, data on some physicochemical parameters from 2016 and 2019 were obtained, although only for the Gołdapa river.
The obtained data clearly show an increase in pollution in the Gołdapa river since the compared year, 2016. Particular attention was paid to the increased amounts of nutrients—nitrogen and phosphorus. The development of civilization generates increasing pollution in the environment. Growing agriculture also uses increasing amounts of pesticides and fertilizers. It should be noted that the results in both 2016 and 2019–2021 were similar, depending on the season. An example was the average value of total organic carbon in 2016, the amount of which gradually increased, starting in autumn. Nitrogen compounds also exhibited their highest values in the early spring period due to snow thaws and surface runoff to watercourses during this period. Anthropogenic factors primarily influence the quality of surface waters. The content of organic matter components in surface waters is mainly influenced by the form of land use and management [48]. The progressive development of industry and agriculture and improper water management in catchment areas create various pollution sources. Their type and number, together with natural factors, affect changes in the chemistry of surface waters. Wastewater, sediments, cities, the runoff of pollutants with atmospheric precipitation from unpaved urbanized areas, and agricultural and forest areas and roads [49] contribute to the increase in pollutant loads in rivers.
To determine the purity class of the studied rivers, the results obtained through our research on both rivers were compared with the Regulation of the Minister of Maritime Economy and Inland Waterway of 11 October 2019 [47]. Regarding the Gołdapa river, most of the water samples (43%) were classified as below class II of water purity, 42% in class I and 21% in class II, which means that Gołdapa features a condition below good. Based on the obtained results for the Bludzia river, it was found that 44% of the tested water samples were classified as water not corresponding to the first and second class of purity. It was also observed that 41% of the tested samples belonged to the first class of purity and only 15% to the second class of purity. It was found that the Bludzia river, like Gołdapa, belongs to the class of rivers with a below good condition.
The monitoring of surface water quality will be continued and extended to include two more rivers. Their results will make it possible to evaluate transformations in water ecosystems under the influence of contemporary climate changes.

5. Conclusions

  • Waters from areas that humans have not developed are of better quality than those that drain urban areas, which is reflected in the case of the superior quality of the Bludzia river relating to the Gołdapa river.
  • The study of physicochemical indicators in early spring, spring, and autumn showed an impact on the quality of surface waters. All the parameters were strongly correlated with the air temperature, the sum of daily precipitation, and water levels.
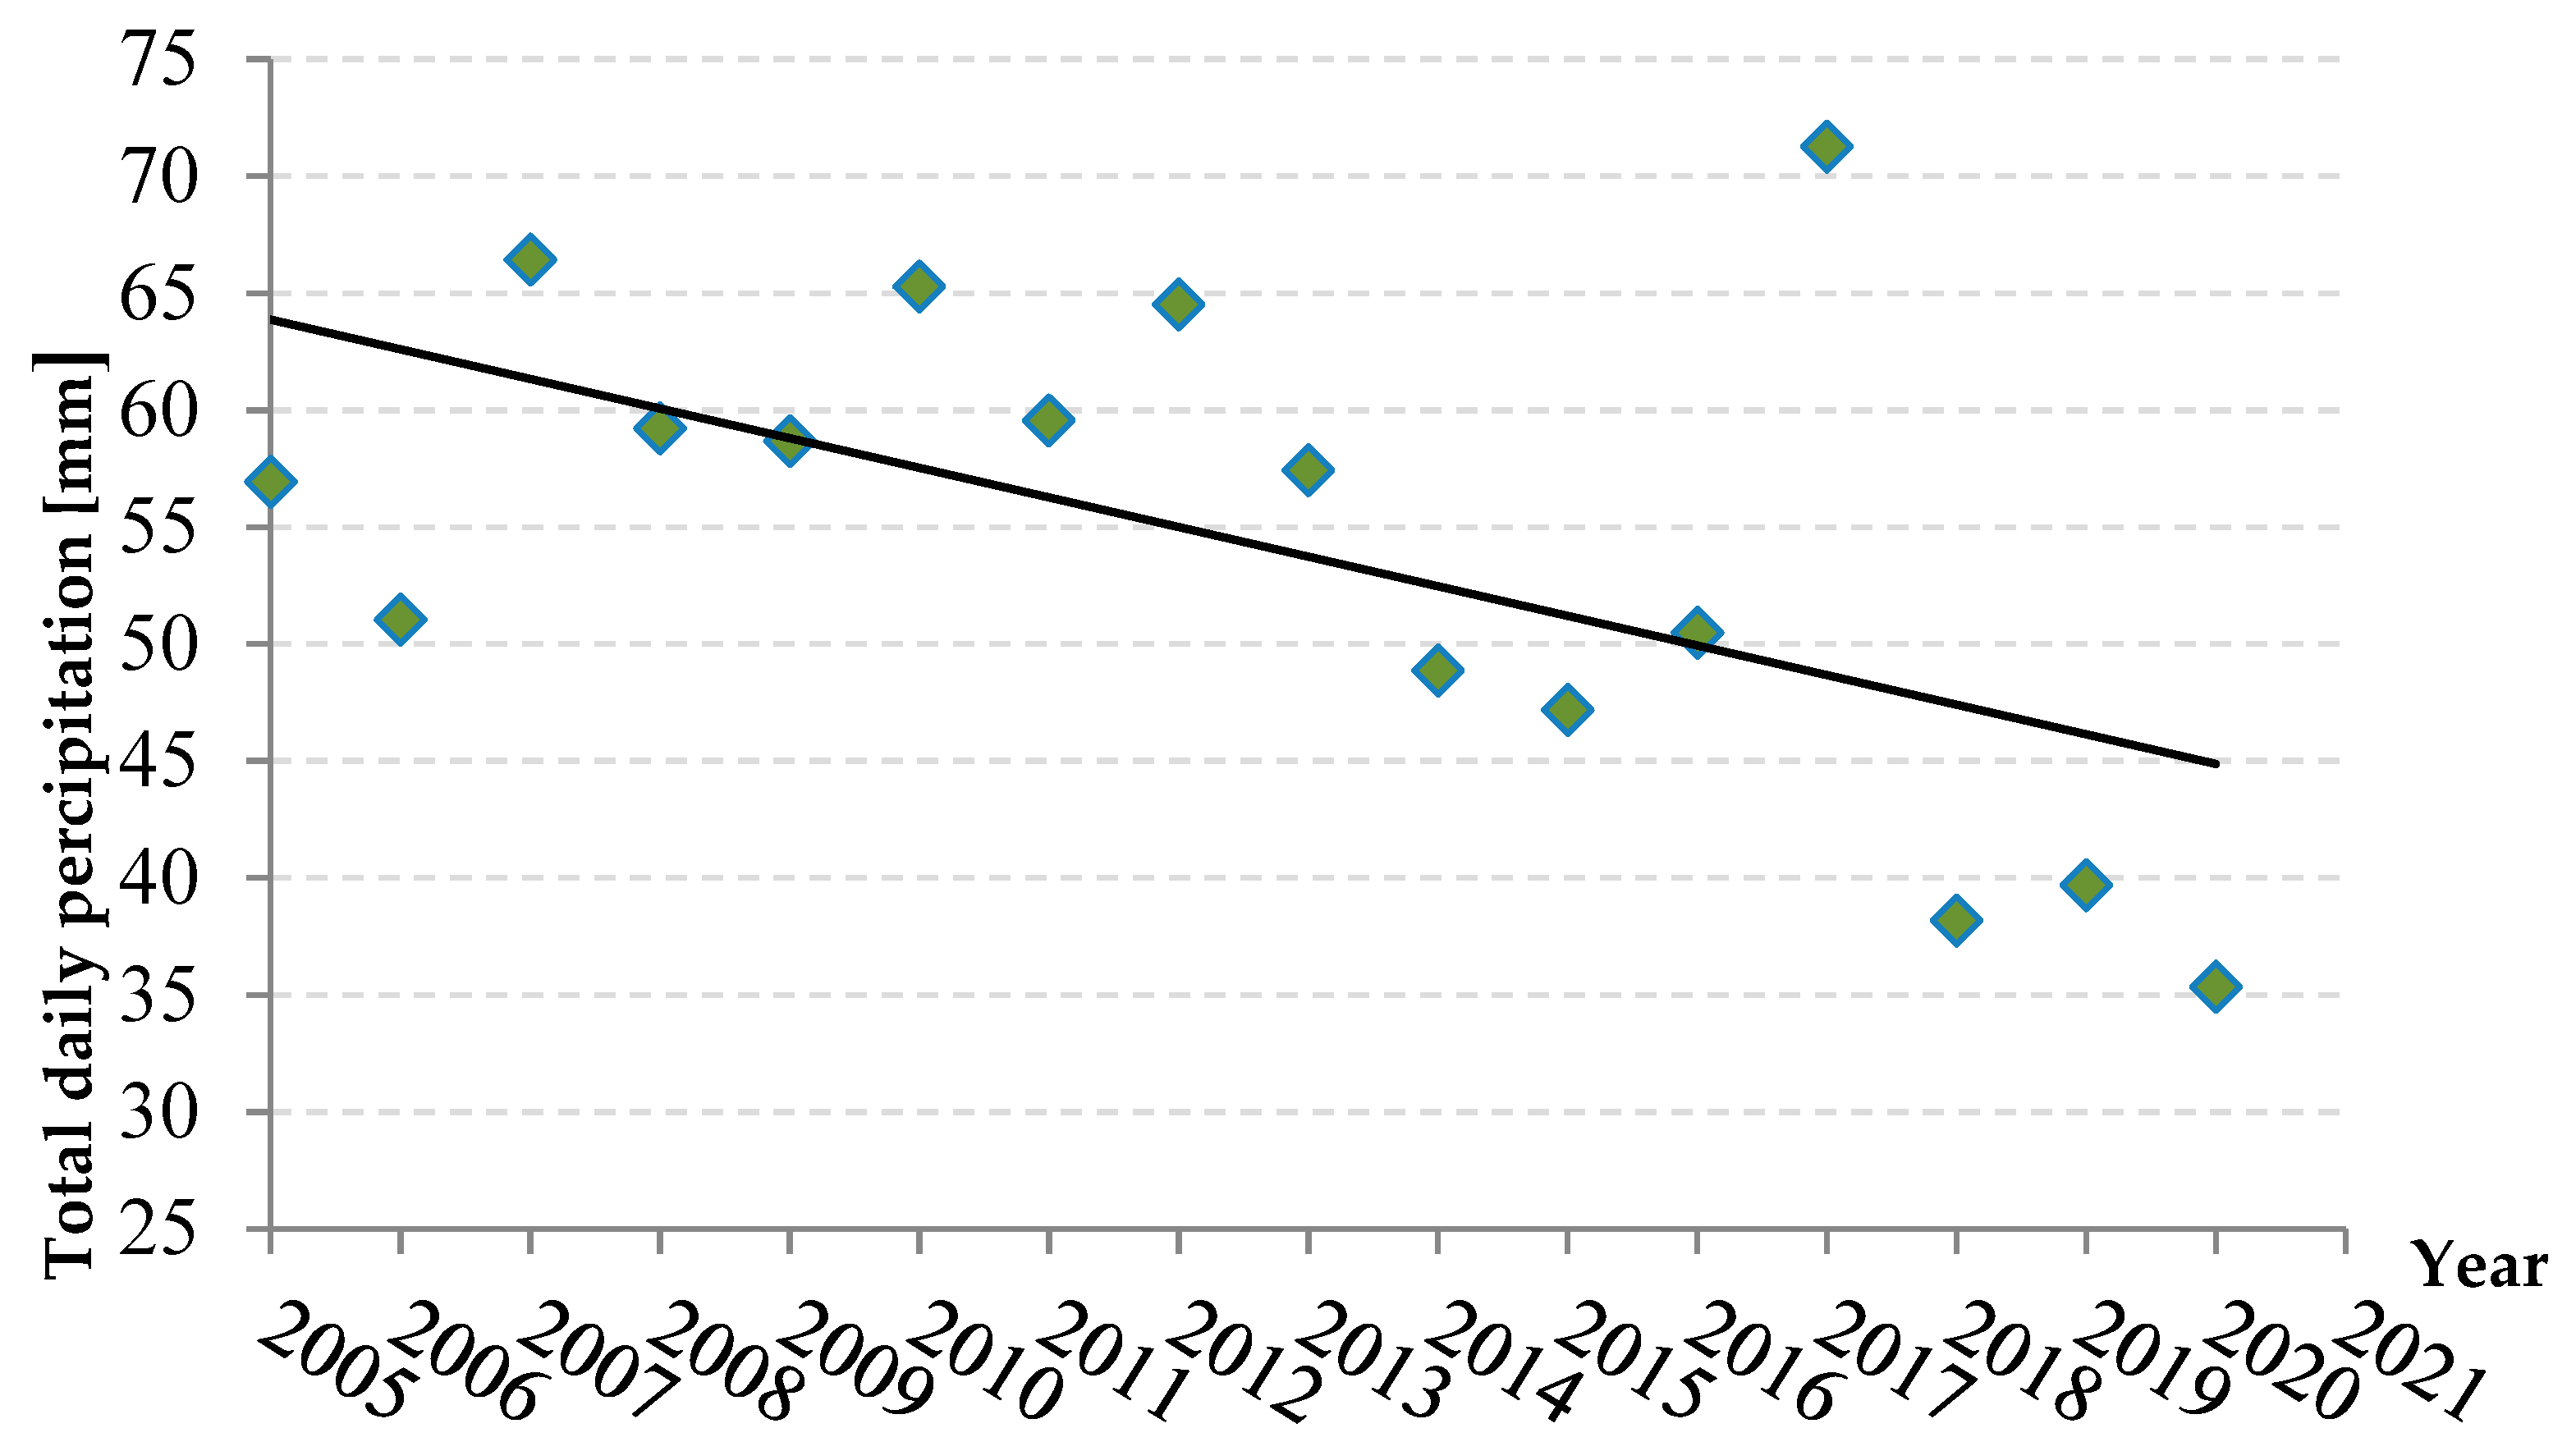
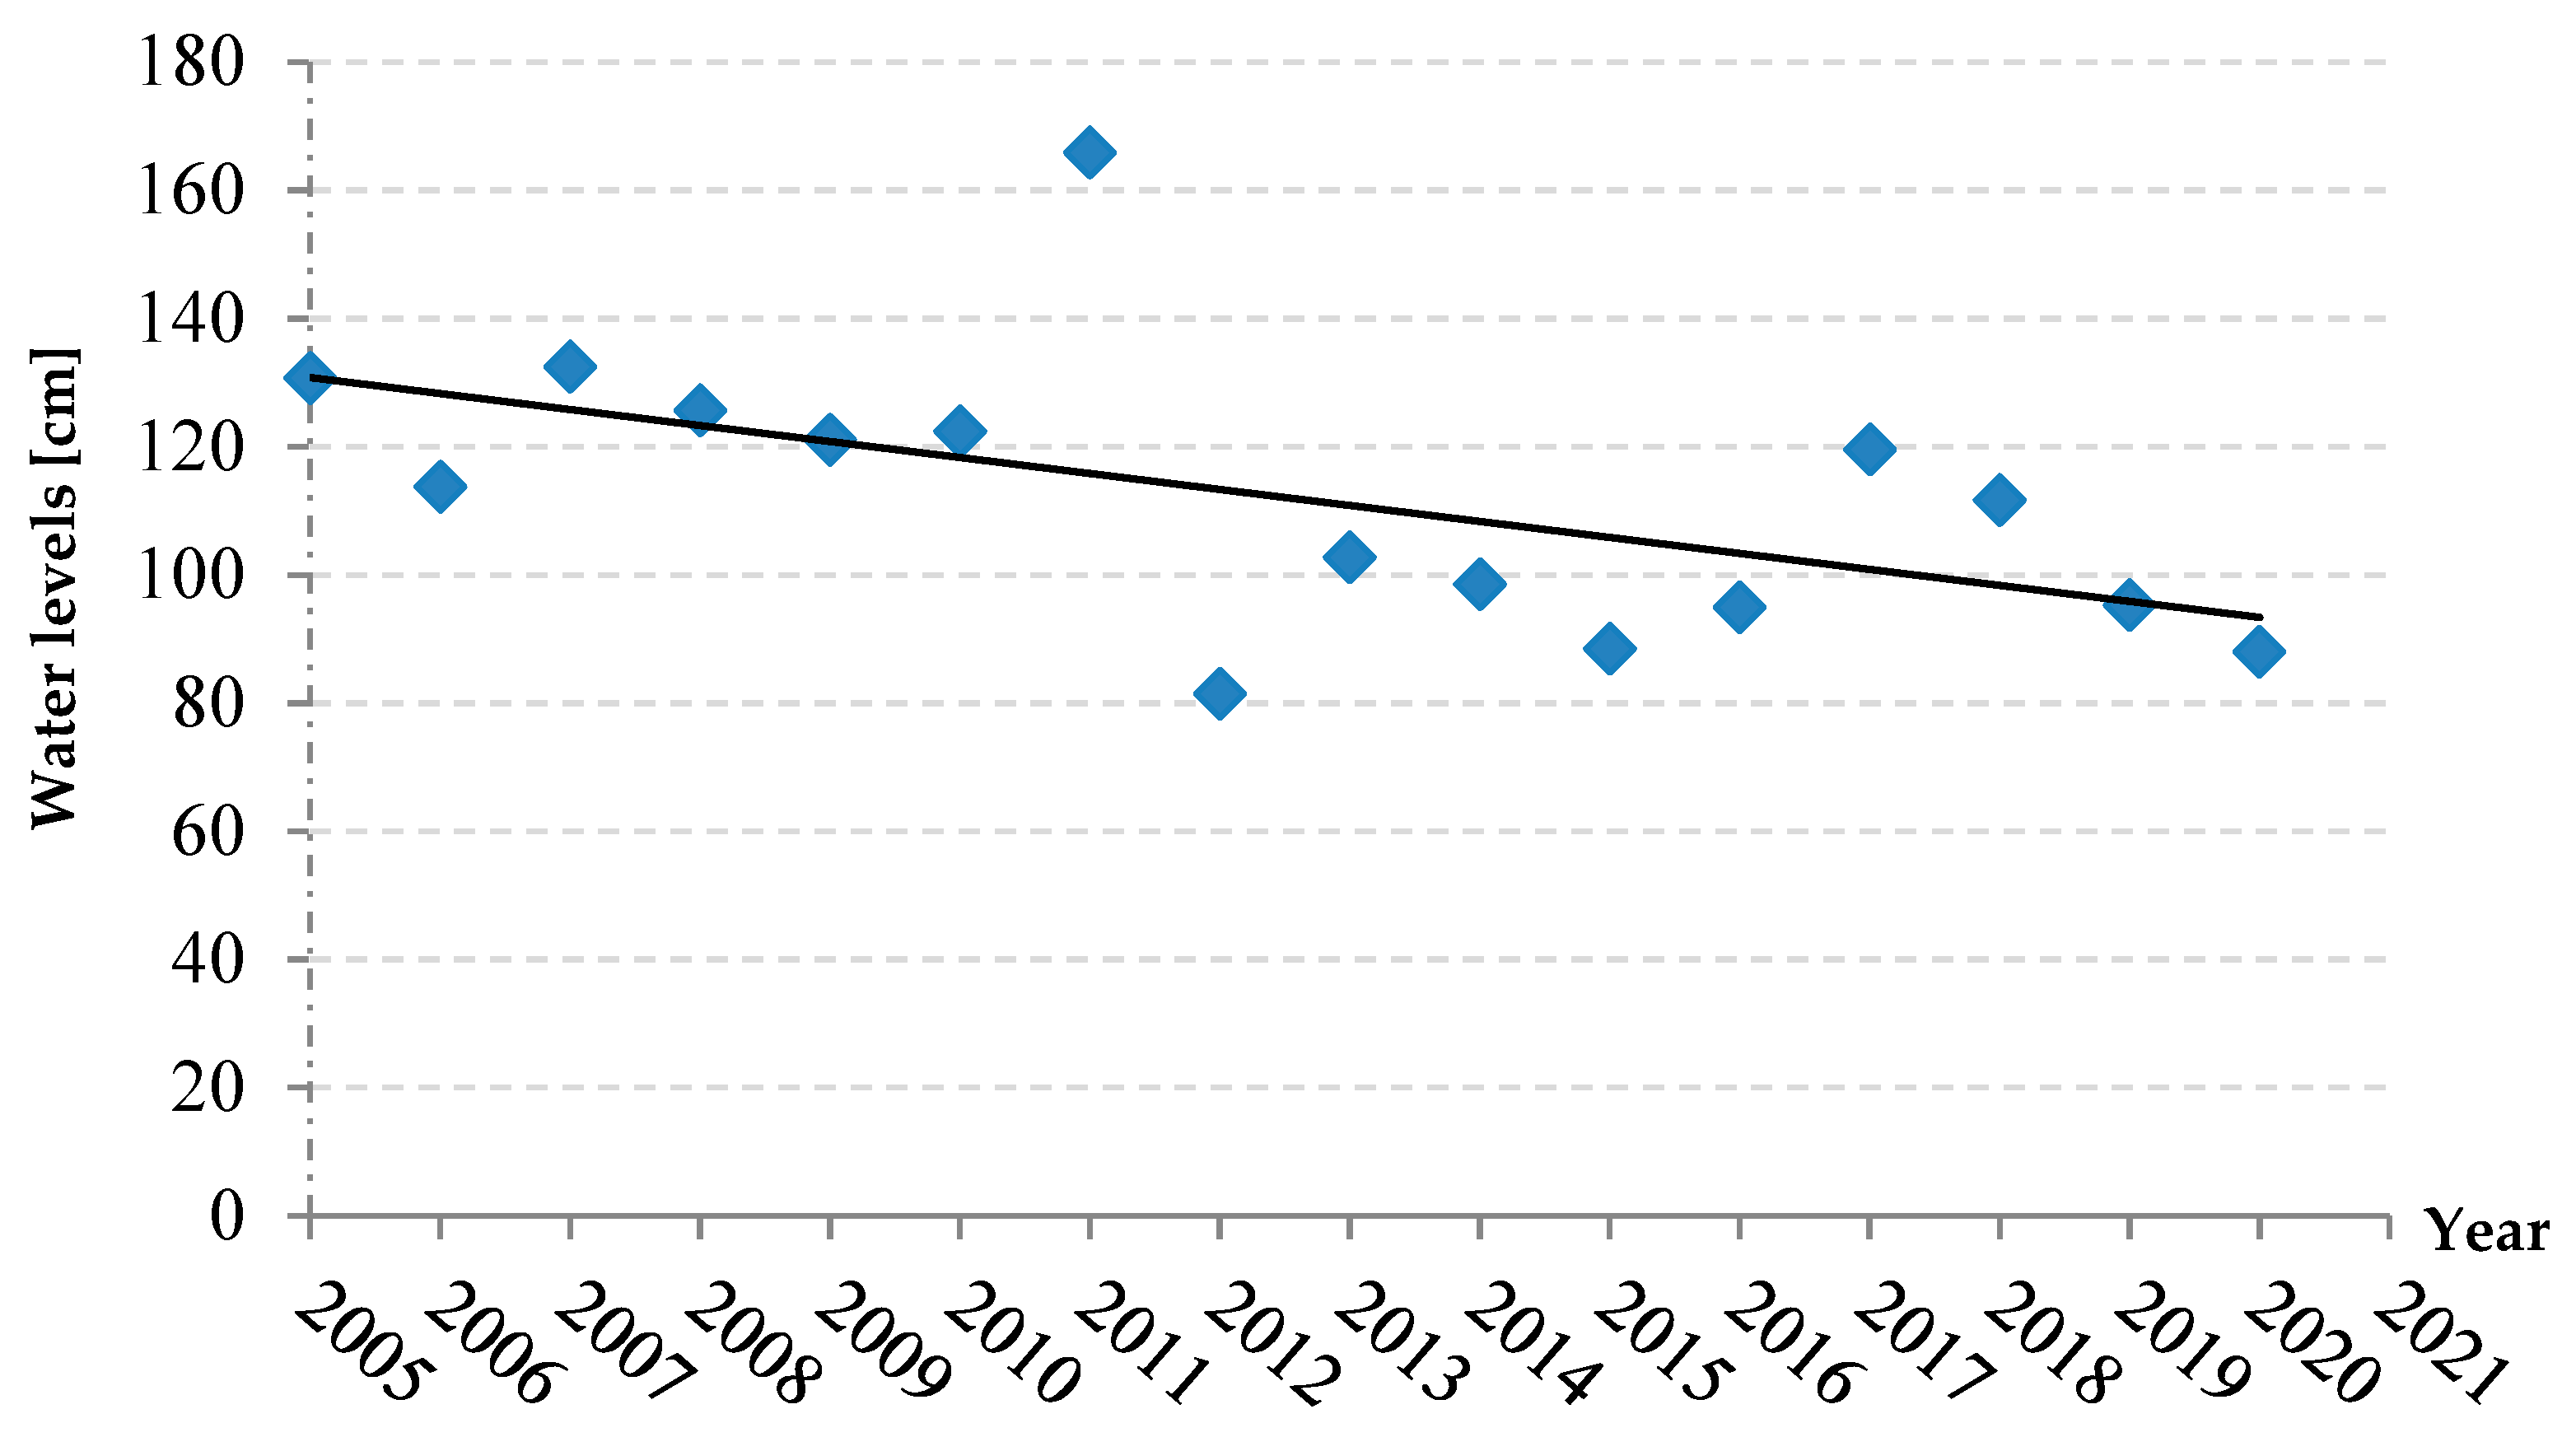
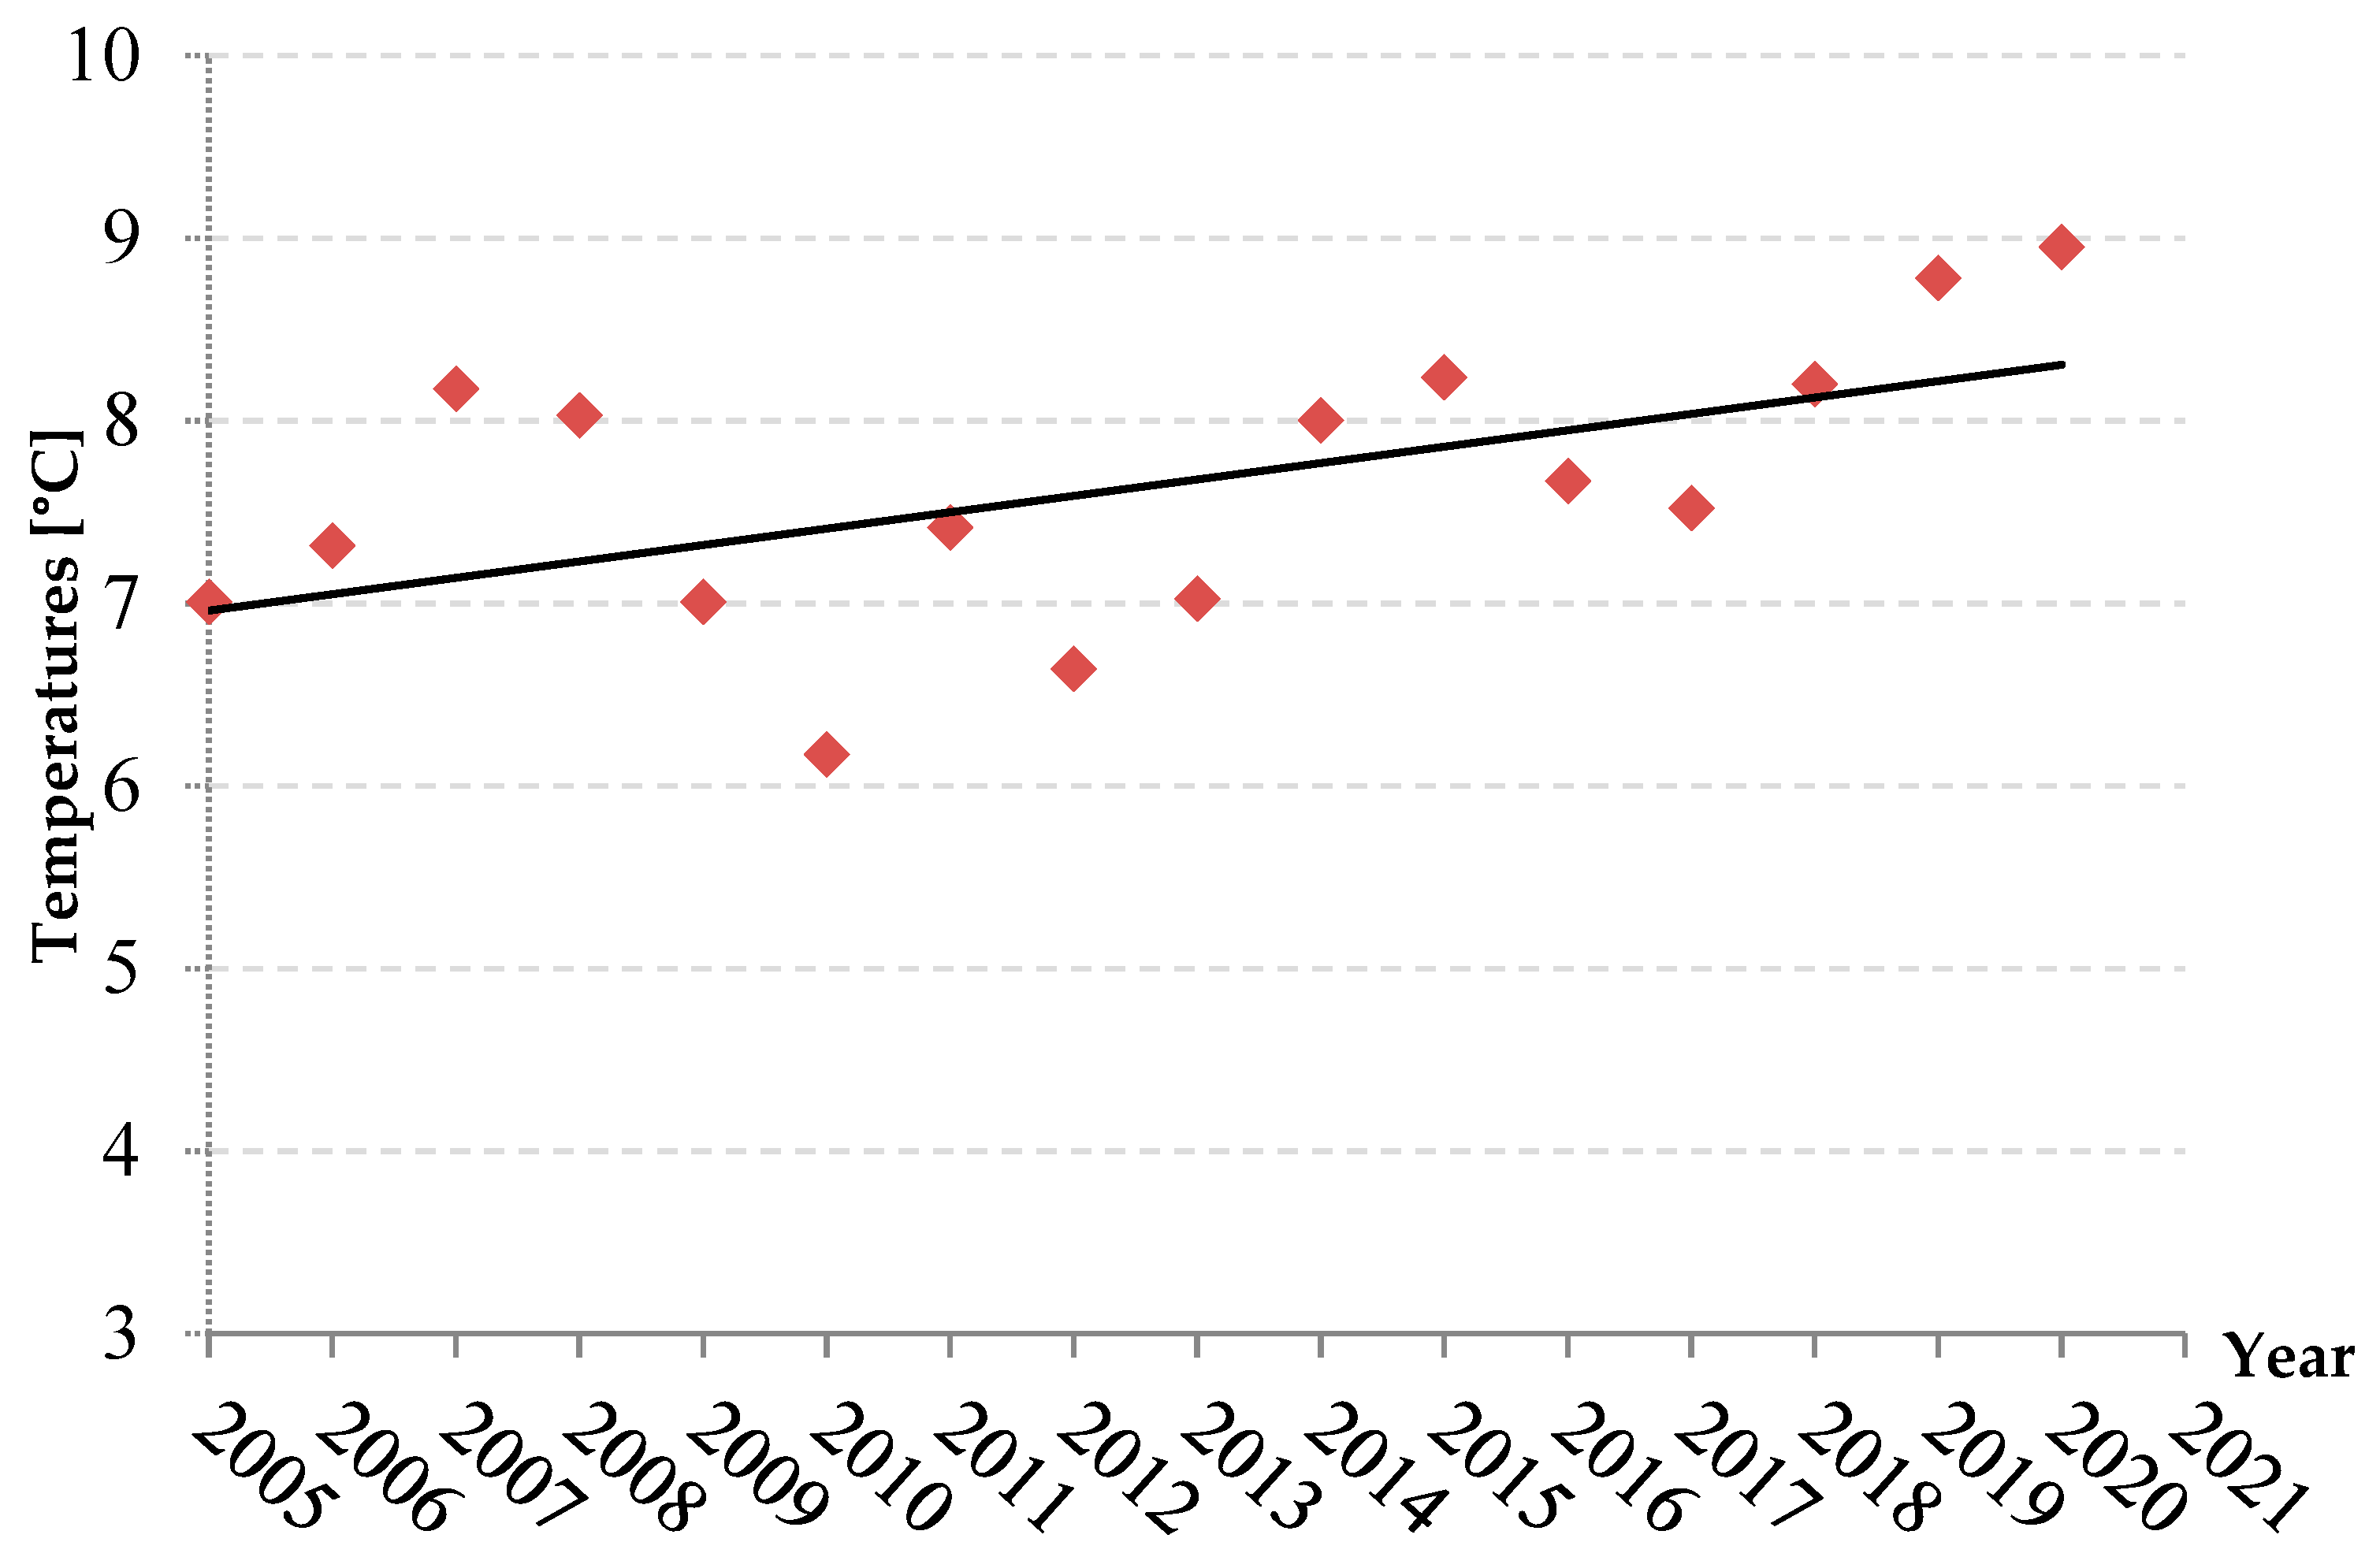
  • Meteorological and hydrological data obtained from IMWM for the last 15 years (2005–2021) for the Gołdap region showed an upward trend in the average air temperature and a downward trend relating to the average daily rainfall and water levels in the Gołdapa river.
  • The upward trend in temperature in the Gołdap region indicates that global warming will continue. Most likely, the rate of change will be driven by the countermeasures implemented to counteract climate change and the socio-economic development scenario, which affects the emission of greenhouse gases.

Author Contributions

M.P. performed the experiment. M.P. and J.P. and K.D. performed the experiment, conceived and analyzed the data, and then wrote the paper. All authors have read and agreed to the published version of the manuscript.

Funding

This research received no external funding.

Institutional Review Board Statement

Not applicable.

Informed Consent Statement

Not applicable.

Data Availability Statement

Not applicable.

Acknowledgments

The study was carried out within the framework: WZ/WB-INL/3/2021 and financed from the science funds for Ministry of Science and Higher Education in Poland.

Conflicts of Interest

The authors declare no conflict of interest.

References

  1. Malhi, G.S.; Kaur, M.; Kaushik, P. Impact of climate change on agriculture and its mitigation strategies: A review. Sustainability 2021, 13, 1318. [Google Scholar] [CrossRef]
  2. European Environment Agency. Climate Change Adaptation in the Agriculture Sector in Europe; EEA Report No 04; European Environment Agency: Copenhagen, Denmark, 2019; ISBN 9789294800725.
  3. Food and Agriculture Organization of the United Nations. The Future of Food and Agriculture. Alternative Pathways to 2050; FAO: Roma, Italy, 2018. [Google Scholar]
  4. Cowie, J. Climate changes. In Causes, Course, and Effects for Humans; University of Warsaw: Warsaw, Poland, 2009. [Google Scholar]
  5. Rolbiecki, S.; Biniak-Pieróg, M.; Żyromski, A.; Kasperska-Wołowicz, W.; Jagosz, B.; Stachowski, P.; Liberacki, D.; Kanecka-Geszke, E.; Sadan, H.A.; Rolbiecki, R.; et al. Effect of Forecast Climate Changes on Water Needs of Giant Miscanthus Cultivated in the Kuyavia Region in Poland. Energies 2021, 14, 6628. [Google Scholar] [CrossRef]
  6. Kundziewicz, Z.W.; Kozyra, J. The impact of climate change on agriculture in Poland. Acta Geophys. 2011, 11, 168–181. [Google Scholar]
  7. Pieniewski, M.; Okruszko, T.; Kundziewicz, Z.W. The impact of climate change on Poland’s water resources. Water Manag. 2017, 3, 19–25. [Google Scholar]
  8. Chang, H.; Jung, I.-W. Spatial and temporal changes in runoff caused by climate change in a complex large river basin in Oregon. J. Hydrol. 2010, 388, 186–207. [Google Scholar] [CrossRef]
  9. IPCC. Global Warming of 1.5 °C—(ipcc.ch); IPCC: Geneva, Switzerland, 2018. [Google Scholar]
  10. Zalewski, M.; Wagner-Lotkowska, I.; Tarczynska, M. Ecohydrological approaches to the elimination of toxic algal blooms in a lowland reservoir. Int. Ver. Theor. Angew. Proc. 2000, 27, 3176–3183. [Google Scholar] [CrossRef]
  11. Kiedrzynska, E.; Kiedrzyński, M.; Zalewski, M. Sustainable floodplain management for flood prevention and water quality improvement. Nat. Hazards 2015, 76, 955–977. [Google Scholar] [CrossRef] [Green Version]
  12. Cai, W.; Cowan, T. SAM and regional rainfall in IPCC AR4 models: Can anthropogenic forcing account for south-west Western Australian winter rainfall reduction? Geophys. Res. Lett. 2006, 33, L24708. [Google Scholar] [CrossRef]
  13. Nature Conservation Program. Available online: https://www.environment.act.gov.au/nature-conservation/nature-conservation-act-2014 (accessed on 20 August 2021).
  14. Lewandowski, A.; Litkowiec, M.; Grygier, A.; Dering, M. Verification of the origin of Norway spruce (Picea abies) in the Gołdap Forest District. Sylwan 2012, 156, 494–501. [Google Scholar]
  15. Zielony, R.; Kliczkowska, A. Poland’s Natural and Forest Regionalization 2010; ORWLP Biedon: Warsaw, Poland, 2012; pp. 48–54. [Google Scholar]
  16. Kundziewicz, Z.W. Consequences of climate change and adaptation to it. In Climate Change and Its Impact on Selected Sectors in Poland; Ridero IT Publishing: Poznan, Poland, 2017; pp. 31–45. [Google Scholar]
  17. Environmental Protection Program for the Dubeninki Commune for 2017–2020 with an Outlook for 2021–2024; Municipality Dubeninki: Dubeninki, Poland, 2017.
  18. Kondracki, J. Regional Geography of Poland; PWN: Warsaw, Poland, 2000. [Google Scholar]
  19. Environmental Protection Program of the Gołdap Commune for the Years 2004–2007, Taking into Account the Perspective for the Years 2008–2011; Municipality Goldap: Goldap, Poland, 2000.
  20. Kopciał, J. Mbrosiewicz Goldap and its surroundings, Suwadlki. Monographs 1995, 2, 2. [Google Scholar]
  21. Baranowski, D. Dynamic features of the Polish climate—Dominant types of atmospheric circulation. Slup. Geogr. Work. 2003, 1, 121–131. [Google Scholar]
  22. Kundzewicz, Z.W. Climate changes, their causes and effects: Observations and projections. Landf. Anal. 2011, 15, 39–49. [Google Scholar]
  23. Seredin, M. Report of Institute of Meteorology and Water Management; Climate of Poland; IMGW PIB: Warsaw, Poland, 2020. [Google Scholar]
  24. Water Quality Sampling. In Part 5: Guidelines for Sampling Drinking Water from Treatment Plants and Distribution Systems PN-ISO 5667-5: 2017-10; Polish Committee for Standardization: Warsaw, Poland, 2019.
  25. Regulation of the Minister of Health of December 7, 2017 on “The Quality of Water Intended for Human Consumption”; Minister of Health: Warsaw, Poland, 2017.
  26. Strategic Adaptation Plan for Sectors of Areas Sensitive to Climate Change until 2020; Ministry of the Environment, IOŚ-PIB: Warsaw, Poland, 2013.
  27. Rosenzweig, C.; Casassa, G.; Karoly, D.J.; Imeson, A.; Liu, C.; Menzel, A.; Rawlins, S.; Root, T.L.; Seguin, B.; Tryjanowski, P. Assessment of observed changes and responses in natural and managed systems. In Contribution of Working Group II to the Fourth Assessment Report of the Intergovernmental Panel on Climate Change; Cambridge University Press: Cambridge, UK, 2007. [Google Scholar]
  28. Miler, A.T. Small Water Retention in Polish Lowland Forests. Infrastructure and Ecology of Rural Areas; PAN Krakow; Commission for Technical Infrastructure of Rural Areas: Krakow, Poland, 2015; Volume 4, pp. 979–992. [Google Scholar]
  29. Mioduszewski, W. Small retention. In Protection of Water Resources and the Natural Environment. Guide; IMUZ: Falenty, Poland, 2003. [Google Scholar]
  30. Kocur-Bera, K. Convergence of spatial features of areas exposed to the effects of extreme events. Acta Sci. Pol. 2016, 15, 73–85. [Google Scholar]
  31. Furmańczyk, A. Climate changes in the natural environment. Socio-Econ. Thought. Stud. Res. Noteb. 2013, 37, 37–49. [Google Scholar]
  32. Winiecki, J. Global crisis. In The Beginning or the End? Regan Press: Gdansk, Poland, 2009. [Google Scholar]
  33. Giddens, A. Climate Catastrophe; Proszynski and Spólka: Warsaw, Poland, 2010. [Google Scholar]
  34. Solomon, S.; Qin, D.; Manning, M.; Chen, Z.; Marquis, M.; Averyt, K.B.; Tignor, M.; Miller, H.L. The Physical Science Basis. In Contribution of Working Group I to the Fourth Assessment Report of the Intergovernmental Panel on Climate Change; Cambridge University Press: Cambridge, UK, 2007. [Google Scholar]
  35. Moździoch, M.; Ploch, A. Climate changes and insurance of agricultural crops. Insur. News 2010, 3, 133–150. [Google Scholar]
  36. Michalska, B. Tendencies of air temperature changes in Poland. Work. Geogr. Stud. 2011, 47, 67–75. [Google Scholar]
  37. Woś, A. Weather types, climatic regions. In Atlas of the Republic of Poland, Ark. 31.8; PPWK: Warsaw, Poland, 1994. [Google Scholar]
  38. Szczykowska, J.; Siemieniuk, A. Water and Sewage Chemistry. Theoretical and Practical Foundations; Publishing House of Bialystok University of Technology: Bialystok, Poland, 2010. [Google Scholar]
  39. Olearczyk-Siwik, B. The problem of excessive turbidity of raw water on the example of the Czaniec reservoir. Sci. Pap. Min. Environ. 2010, 2, 63–74. [Google Scholar]
  40. Moniewski, P. Physico-chemical features of surface waters and their seasonal variability on the example of Dzierżązna. Acta Sci. Pol. Form. Circumiectus 2015, 13, 93–106. [Google Scholar] [CrossRef]
  41. Ekström, S.M.; Regnell, O.; Reader, H.E.; Nilsson, A.P.; Löfgren, S.; Kritzberg, E.S. Increasing concentrations of iron in surface waters as a consequence of reducing conditions in the catchment area. JGR Biogeosci. 2016, 121, 479–493. [Google Scholar] [CrossRef] [Green Version]
  42. Ciećko, P.; Panek, P. Water Pollution in Poland—Condition of Inland Surface and Ground Waters; Environmental Engineering Committee Monographs; Monograph of the Environmental Engineering Committee PAX: Gdansk, Poland, 2019; pp. 58–78. [Google Scholar]
  43. Hermanowicz, W.; Dojlido, J.; Dożańska, W.; Koziorowski, B.; Zerbe, J. Physicochemical Examination of Water and Sewage, Arkady; Arkady: Warsaw, Poland, 1999. [Google Scholar]
  44. Kornaś, M.; Grześkowiak, A. Influence of the use of the catchment on the shaping of water quality in the water reservoirs of the Drawa river catchment area. Water-Environ.-Rural Areas 2011, 11, 125–137. [Google Scholar]
  45. Bogdał, A.; Kowalik, T.; Kanownik, W.; Ostrowski, K.; Wiśnios, M. Assessment of the physicochemical condition of rainwater and runoff waters from the Wolninka stream catchment. Gas Water Sanit. Eng. 2012, 8, 362–365. [Google Scholar]
  46. Kowalik, T.; Kanownik, W.; Bogdał, A.; Policht-Latawiec, A. The impact of changes in the use of the upland catchment on the quality of surface water. Annu. Set Environ. Prot. 2014, 16, 223–238. [Google Scholar]
  47. The Classification of Ecological Status, Ecological Potential and Chemical Status and the Method of Classification of the Status of Surface Water Bodies, as Well as Environmental Quality Standards for Priority Substances; Regulation of the Minister of Maritime Affairs and Inland Navigation: Warsaw, Poland, 2019.
  48. Wiatkowski, M.; Rosik-Dulewska, C.; Gruss, L. Profile of changes in water quality indicators in the Stobrawa River. Infrastruct. Ecol. Rural Areas 2012, 3, 21–35. [Google Scholar]
  49. Kolada, A.; Pasztaleniec, A.; Bielczyńska, A.; Ochocka, A.; Kutyła, S.; Panek, P. Physicochemical Indicators in the Assessment of the Ecological Status of Surface Waters—Verification of Environmental Standards; Inspectorate of Environmental Protection: Warsaw, Poland, 2018. [Google Scholar]
Figure 1. The location of Gołdapa and Bludzia rivers in the Gołdap Forest District in the Regional Directorate of State Forests, Białystok, Poland [17].
Energies 15 00164 g001
Figure 2. Average daily precipitations in the Gołdap region in 2005–2021 in Poland [27].
Energies 15 00164 g002
Figure 3. Surface water levels in the Gołdap region in 2005–2021 in Poland, [27].
Energies 15 00164 g003
Figure 4. Changes in the average air temperature in the Gołdap region in 2005–2021 in Poland, (source: own study based on IMWM data from 2005–2021 in Poland [27]).
Energies 15 00164 g004
Table 1. Average values of selected physicochemical parameters of the Bludzia river from 2020–2021.
IntakeSampling PointTurbidity (NTU) *pHNH4+ (mg/L)NO3 (mg/L)NO2 (mg/L)Cl (mg/L)PO43− (mg)SO42− (mg/)OWO (mg/L) Mg2+ (mg/L)Ca+ (mg/L)Na+ (mg/L)Mn (µg/L)
I10.57.9<0.1<3.00.127.200.2014.1010.6112.0058.000.20
20.98.2<0.1<3.00.137.500.2012.709.8114.0069.000.20
34.08.2<0.1<3.00.137.000.2011.709.2714.0068.000.20
II11.38.00.703.410.176.9446.0524.1911.9537.46133.0312.3446.05
24.78.10.874.740.056.2238.5937.3216.2238.52137.0912.6338.59
30.48.00.353.750.086.4028.8325.8914.2029.60109.689.6528.83
III12.48.20.192.310.097.4016.6947.2215.6465.835.55
26.08.40.182.310.237.3817.4132.9012.0058.000.20
35.28.30.162.080.226.5516.4169.6514.0069.000.20
* nephelometric turbidity unit; —lack of measurement.
Table 2. Average values of selected physicochemical parameters of the Gołdapa river from 2020–2021.
IntakeSampling PointTurbidity (NTU) *pHNH4+ (mg/L)NO3 (mg/L)NO2 (mg/L)Cl (mg/L)PO43− (mg/L)SO42− (mg/L)OWO (mg C/L) Mg2+ (mg/L)Ca+ (mg/L)Na+ (mg/)Mn (µg/)
I16.07.9<0.10<3.00.207.600.2012.505.0815.0088.00204.0
23.08.1<0.10<3.00.205.600.2010.704.7515.0088.0055.00
32.88.2<0.10<3.00.185.600.2010.805.0415.0086.0056.00
II11.07.90.776.730.124.6616.4223.7115.1835.70162.868.760.08
24.48.10.784.680.085.0222.2227.2621.1636.67166.049.150.07
32.18.10.645.820.085.1023.4424.8515.7333.37150.148.710.05
III19.38.20.182.330.174.7513.3052.1914.8679.313.73
27.48.20.162.110.227.2317.1729.4317.3585.885.10
310.98.20.132.240.224.6213.2930.8115.3281.354.26
* nephelometric turbidity unit; —lack of measurement.
Publisher’s Note: MDPI stays neutral with regard to jurisdictional claims in published maps and institutional affiliations.

