Article

Energy Consumption in a Distributional Warehouse: A Practical Case Study for Different Warehouse Technologies

1
Faculty of Transport, Warsaw University of Technology, Koszykowa 75, 00-662 Warsaw, Poland
2
Faculty of Production Engineering, Warsaw University of Technology, Narbutta 85, 02-524 Warsaw, Poland
*
Author to whom correspondence should be addressed.
Energies 2021, 14(9), 2709; https://doi.org/10.3390/en14092709
Submission received: 18 March 2021 / Revised: 16 April 2021 / Accepted: 4 May 2021 / Published: 9 May 2021
(This article belongs to the Section G: Energy and Buildings)

Abstract

:
Energy consumption by distribution warehouses has become an essential component of green warehousing and research on reducing the carbon footprint of supply chains. Energy consumption in warehousing is a complex and multilayered problem, which is generally considered in the literature in relation to its detailed components, not as part of comparative studies. In this article, the authors consider six cross-sectional variants of warehouse technology, from manual to fully automatic, and analyze the energy consumption of a warehouse in various configurations. A methodology for estimating storage space and determining energy consumption is proposed. The energy balance of the warehouse variants includes energy for material handling equipment operation, energy consumption for building maintenance (heating, cooling, lighting, etc.), and energy generated by the photovoltaic system on the roof. Then, the operational costs of the variants are estimated and, on their basis, an automation index is determined. The index allows for a comparative analysis of energy consumption and the mechanization and automation of a warehouse. It is shown that a significant part of the energy is spent on maintaining a warehouse building, especially in the case of facilities with a low degree of automation.

1. Introduction

Energy consumption has become a significant design and operational factor for most material handling systems (MHSs) operating in industrial or distributional warehouses. Energy efficiency in intralogistics, in line with the general technological trends in all areas of industry and transport, has been incorporated into warehouse system design procedures and considered alongside performance, efficiency, and cost key performance indicators (cf. [1]). The energy consumption of warehouse installations has become not only a cost driver but also a marketing factor and a kind of message for customers and the world that the business is environmentally friendly. Therefore, it is not only a technological and ecological issue but also a market-driven issue to develop methods for the estimation of energy consumption based not only on the technical data of the equipment but also on supplementing warehouse design procedures with a broader view and adding a new research dimension to state-of-the-art reviews such as [2,3,4].
Since the major material handling manufacturers can offer comparable universal or tailored technologies for high-end warehousing, energy efficiency and, consequently, CO2 emissions have become a competitive element and are now an actual research and development objective, as confirmed by many authors [1,5,6,7,8,9,10]; see also Section 2. This is visible not only in the offers of equipment manufacturers and warehousing systems suppliers but also in the interest from researchers and users engaged in material flow technologies. It can be observed that energy consumption in warehousing is considered a token of sustainable development and social responsibility of logistics, being a part of industry and the economy (see Uyar, Karaman, and Kilic [11]). The minimization of energy consumption in intralogistics is often referred to as a green warehousing problem, which complements the environmental issues that contribute to sustainable development [5,12].
The reduction in energy consumption not only is based on the desire to save money or on marketing actions but is also a result of legal regulations. Aside from the regulations for designing industrial buildings, the Ecodesign Directive 2009/125/EC proposes a framework for the setting of ecodesign requirements of energy-related products (ErP), addressing all environmental aspects from a life cycle perspective [13]. The Directive regulates a wide range of components included in industrial systems, such as electric motors used extensively in MHSs. Implementing the measures of the Ecodesign Directive involves setting product requirements, especially minimum energy efficiency standards.
Warehouses are embedded elements of supply chains, serving as a kind of fuse in the material flow pipeline by dumping flow peaks and ensuring a continuous supply [14,15,16]. As elements of supply chains, business bodies, and technical systems, warehouses are subjected to improvements and optimization of efficiency and operating costs (see [14,15] or comprehensive state-of-the-art research such as [2,3,4,17,18]); therefore, the energy consumed by warehouses has become a two-valued factor: a cost driver and an element of the social responsibility of logistics (see [5]).
The optimization of energy consumption as an important design factor in intralogistics is a consequence of the desire to reduce logistical costs and increase efficiency, via marketing factors exploring pro-ecological trends and increasingly targeted provisions of international law. The aim of this study is to present a methodology of energy consumption estimation in a distribution warehouse based on an extended case study. The methodology includes the level of automation (automation index), floor space occupation, work intensity, and operating costs. Cross-cutting technological variants of a warehouse system performing the same logistics task will be analyzed. The main difference between the analyzed material handling technologies is the gradual increase in automation while reducing the physical space used. An additional deciding factor is the roof area of the warehouse building, which can be used to install photovoltaic panels to obtain additional energy, which affects the energy balance of the warehouse.
The remainder of this paper is organized as follows. Section 2 provides a literature review on the topic, especially green warehousing, methodological aspects of warehouse design, and estimating energy consumption by intralogistics systems. In Section 3, research and case study assumptions are presented. In Section 4, the methodology of calculating the space and dimensions of a warehouse facility is described. Section 5 provides a calculation of the energy consumption of MHSs, while Section 6 concerns building-related energy consumption and production. In Section 7, warehouse operational costs and the automation index are calculated. Finally, in Section 8 and Section 9, the conclusions are summarized.

2. Literature Review

The literature on warehouse facilities’ design and operation is abundant, and in recent years, in line with global trends, it has also focused on the environmental impact of warehouses. Therefore, this literature review is focused on the following problems explored in this article: green warehousing, elements of warehouse design, material handling systems and related energy consumption, and buildings as energy-consuming objects. Of course, the listed elements are intertwined and complementary and together reveal a complete picture of warehousing-related electric energy consumption.

2.1. Green Warehousing and Green Design Paradigms

Energy consumption, as a part of the green warehousing concept, has become a new design paradigm and key performance indicator. It is the reason for most energy consumption-related studies. However, it is a multifaceted problem concerning the operation of MHSs, control, building maintenance, creating appropriate working conditions, etc. Technical guidelines are developed to quantify and rationalize the energy consumption by intralogistics systems (e.g., FEM Intralogistic Systems Product Group [19]).
Research on energy consumption as part of the green warehousing concept has been particularly intensive in the last 10 years. Bartolini, Bottani, and Grosse [1], as well as Abeydeera, Mesthrige, and Samarasinghalage [6], presented systematic reviews of the literature on green warehousing, naming warehouses as major contributors to the rise in greenhouse gas emissions in supply chains and formulating terms for sustainable warehousing. This reverses the current trend of focusing on transport activities as the main source of air pollution (like in [12,20]). The authors showed that energy saving has been the most frequently studied objective. This makes the issue relevant, but the authors concluded that the literature lacks case studies and empirical data, the delivery of which is our intention.
Various studies have focused on supply chains acting against the green warehousing idea. Elhedhli and Merrick [7] considered a supply chain network design problem with CO2 emissions as the main criterion. Characteristically, the authors used the term “supply chain” but did not consider it in its entirety. Models optimizing carbon emissions are related to energy consumption but are focused on transport more than emissions from nodal elements of the supply chain (compare Jacyna et al. [12] and Ambroziak et al. [20]). This approach is changing and emissions resulting from the operations of logistics facilities are included (compare Bartolini, Bottani, and Grosse [1] and Boenzi et al. [21]). Boenzi et al. [21] also referred to green warehousing and named energy consumption as the key “greening element” but focused only on details of warehousing technology and omitted warehouse processes and building aspects.
Rai, Sodagar, Fieldson, and Hu [8] studied the operational and embodied energy in a typical industrial warehouse. They analyzed the construction materials with a potentially significant carbon impact and covered material substitutions for the 25 years of design life.
Carli et al. [22] are among the many authors naming the reduction in energy consumption as the main driver of the “green warehouse” strategy, but they only looked at details of picking systems, material handling equipment, and layouts.
Bank and Murphy [23] defined uniform metrics and guidelines on warehouse industry sustainability and used energy consumption as the basis for their proposed measures.

2.2. Elements of Warehouse Design

Ideas of green warehousing are the foundation of our research, but one of the fundamental problems is how to include the energy factor in the procedure of designing warehouses. Warehouses and warehousing process design are a much-studied topic, with systemic reviews of knowledge provided by, e.g., Yener and Yazgan [2], Gu, Goetschalckx, and McGinnis [3,17], Baker et al. [18], and De Koster, Le-Duc, and Roodbergen [4]. These comprehensive reviews named different parameters of warehouse assessment but rarely mentioned energy consumption alone. Usually, it is approached from the perspective of minimizing labor intensity. This assumption is the basis for detailed research such as that presented by Ene et al. [24], who used a genetic algorithm to support order batching and routing to minimize energy consumption while traveling. Their paper represents a typical approach in which only the optimization criteria were changed, from efficiency or productivity to energy consumption. Makris, Makri, and Provatidis [25] presented an energy-saving approach related only to the problem of routing order pickers by the traveling salesman problem (TSP). They analyzed the energy-to-time tradeoff and noticed that a relatively small loss of service time may lead to a significant decrease in consumed energy.
Hua, Cheng, and Wang [9], Bonney and Jaber [26], and Marchi, Zanoni, and Jaber [27] examined the importance of inventory planning as a potential environment changer and an extension of energy consumption. Inventory planning, as a nontechnical aspect of warehousing, influences the material flow volumes and configuration of MHSs and thus the energy consumption.
Different aspects of labor minimization, combining travel models with technological features of MHSs and the organization of warehouse processes, were discussed by Kłodawski et al. [28]. Warehouse processes can be effectively implemented in various technological and organizational variants and potentially assessed by energy consumption. This lays a foundation for this paper as it aims to compare different variants of warehouse processes and technologies, but which all serve the same material flow. The results obtained by Kłodawski et al. show that the shape of warehouse processes and material handling technologies is crucial for workload and labor consumption, and thus also energy consumption.
Warehouse design for minimal workload and rational use of resources is a subject of mathematical modeling and simulation. Jacyna, Wasiak, and Bobiński [29] proposed a comprehensive approach to modeling warehousing systems with tailored software. They called this process interdisciplinary and listed various technical, economic, social, and environmental issues influencing it. Just like Jachimowski et al. [30], they pointed to databases of warehouse technologies that should cover energy-related parameters.
Warehouses are also observed from an external perspective for better utilization of resources in the supply chain. Szczepański et al. [31] analyzed the problem of warehouse facility location, which, indirectly but significantly, affects energy consumption by the warehouse. The criteria for the facility’s location include the availability of workforce, land prices, and local development conditions. Jacyna-Gołda et al. [14] referred to the efficiency of the supply chain as a value dependent on the parameters of its elements—especially warehouses that can have different versions of technologies and processes.

2.3. Material Handling Systems and Related Energy Consumption

Electric energy drives most warehouses, and its usage is regulated by design-related factors and control systems. Energy consumption in warehouses is mostly related to the operation of handling systems. The number of highly detailed studies on MHS energy consumption is large, but still not very significant.
Calculation approaches for intralogistics energy consumption were offered by Tappia et al. [10], Lottersberger et al. [32], and Lerher et al. [33]. These approaches focus mostly on conveying and storage equipment and require known technical parameters and throughputs. This is also true of other studies such as Ekren’s [34], in which a shuttle-based storage and retrieval system was examined for electric energy consumption—in particular, acceleration and braking in the lifting and moving of devices, as well as energy regeneration. The author proved that reducing energy can be a way to improve the performance of automatic warehousing systems. Bortolini et al. [35] proposed a bi-objective time and energy model for rack automatic warehouses served by aisle captive automated storage/retrieval systems. Their model minimizes both the travel time and energy required by the cranes. The authors emphasized that the working time (labor intensity) is the basic factor influencing energy consumption and, at the same time, indicated that high efficiency and energy consumption are opposite goals. Zając [36] stated that it is hard to find a universal way of estimating energy consumption and presented a concept based on a driving characteristic of internal transport equipment. Zając calculated the energy consumption of a warehouse but mostly considered forklift trucks. Rücker, Rief, and Fottner [37] analyzed automated storage and retrieval systems (AS-RS), which are quite a popular subject in energy consumption research. They used a reference cycle based on a large-scale simulation experiment. Reference cycles will be also used in the model presented in this paper. Guerrazzi et al. [38] considered the configuration of AVS/RS with energy recovery systems and combined travel time modeling with energy usage. Stöhr, Schadler, and Hafner [39] analyzed the energy efficiency of diverse AS/RS, providing a detailed methodology and values for AS/RS energy consumption, which is partially used in this study.
Another interesting problem in warehousing is charging devices’ batteries and optimizing their use under different conditions. Studies usually focus on the capacity of chargers related to the frequency of charging cycles. Carli et al. [22] proposed an optimization model of a control strategy for the battery charging of a fleet of electric vehicles (e.g., forklifts). Zou et al. [40] investigated battery recovery and found that ignoring it leads to underestimating the number of robots and the system costs. Minav et al. [41] proved that the energy recovered from forklifts significantly reduces energy consumption. Renquist, Dickman, and Bradley [42] presented an economic comparison of fuel cell-powered forklifts to various types of battery-powered forklifts. Fast-charge forklifts were shown to be at an economic advantage with high workloads relative to conventional battery-swapping forklifts, while fuel cell forklifts are not economically competitive with battery-powered devices.

2.4. Buildings as Energy-Consuming Objects

Freis, Vohlidka, and Günthner [43] stated that there is no universal approach to estimating the total energy demand of warehouses as a complex system including intralogistics equipment operations and building maintenance. Within the building sector, methodologies for calculating the energy demand of buildings are well developed, but most are built around specific cases.
Rai, Sodagar, Fieldson, and Hu [8] presented a case study of a warehouse building life cycle in which the embedded and operational CO2 emissions of a representative building were calculated. They discussed the energy consumed for heating with different roof light ratios (RLR) and insulation of the envelope. The authors also raised the issue of energy embedded in construction materials and proved that it is comparable in scale to the energy used to maintain the building over 25 years of operation.
Energy consumption is a part of the smart building idea discussed by authors such as van Geest, Tekinerdogan, and Catal [44]. Freis, Vohlidka, and Günthner [43] noted the synergy effects in both building and intralogistics subsystems. They developed an integrated analytical model for energy calculation and reference building models. The authors used a method of precalculated energy consumption units for estimating MHS energy consumption. A similar approach is adopted in this study. Zając and Kwaśniowski [45] considered the idea of a zero-energy warehouse building. Howard et al. [46] studied energy consumption by end use. Besler et al. [47] presented the distribution of energy demand for air heating and cooling and equipment usage in a warehouse. Wang and Li [48] conducted a similar study. Porras-Amores, Mazarrón, and Cañas [49] investigated the distribution of air temperature in warehouses. In all these cases, researchers touched on warehousing but mostly focused on architecture and not on technological processes or equipment usage.
To organize the approaches to the energy consumption of warehouses discussed above, recurring topics from the literature review are compiled in Table 1.
This literature review reveals various aspects of energy consumption in logistics warehouses. However, these examples lack an approach that could be especially valuable to practitioners deciding on the warehouse technology to be used. Comprehensive warehouse assessment compares standardized performance and cost KPIs, but now also energy consumption. As shown in Table 1, there is still space for broader approaches to the organization of energy-efficient warehousing systems including the building, process and organization, and operational costs. Therefore, it is valuable to conduct research on how different variants of warehousing technology and configurations of warehousing processes influence the estimation of energy consumption and make it a decisive factor in conceptualizing variants of warehouse technologies. The proposed approach is an attempt to touch on all the elements listed in Table 1.

3. Research Assumptions and Case Study Grounds

A typical warehouse process is a sequence of standardized operations: receiving, putting away, storage, replenishment and order-picking, retrieval, and shipment (see [28,49,51]). The same process can be served in different ways under different warehousing technologies. Basically, the following general types of technologies can be applied:
  • “Low-storage” technologies, with a storage height of up to 5.0–6.0 m and wide rack aisles (approximately 4.0 m), using mostly counterbalanced forklift trucks for operations;
  • “High-storage” technologies, with a storage height of up to 10.0 m and wide rack aisles (approximately 2.7–3.7 m), using reach trucks;
  • Very narrow aisles (VNA), with a storage height of up to 12–15 m and narrow rack aisles (approximately 1.7–1.9 m), using VNA forklifts;
  • Automatic storage and retrieval systems (AS/RS) with an unlimited (apart from the structural strength of materials and economic profitability) storage height and 1.4–1.5 m aisles, using stacker cranes.
The listed technologies cover a wide range of warehouse applications and can be implemented in countless configurations. This is a summary of popular options for industrial warehouses, which are characterized by different effectiveness and energy consumption and require different spaces. On this basis, six variants of warehouse systems realizing common warehouse processes are proposed for the expanded case study. The variants differ in terms of automation level, efficiency, effectiveness, initial investment, operating costs, and the area and cubic capacity of buildings, as well as the electric energy consumption. It can be generalized that the subsequent variants are characterized by higher automation while reducing the layout area and increasing the system height (Figure 1):
  • V1—low-storage technology with counterbalanced forklift trucks, racking system up to 8.1 m, and wide rack aisles of about 3.7 m. This system is preferred when land prices are low and for general-purpose usage.
  • V2—high-storage technology with reach truck forklifts operating in the storage area (up to 9.75 m and with aisles of 2.7 m) and in buffer areas but supported by lifting forklifts in loading and unloading operations. This system is preferred for most universal pallet warehouses for logistics operators and for rented spaces.
  • V3—high-storage technology with VNA devices operating only in the storage area (up to 18 m (approximately 15 m of reaching) and with aisles of 1.9 m); other phases are supported by counterbalanced forklifts. This system is preferred for specialized or universal pallet warehouses with limited or expensive space.
  • V4—high-storage technology with VNA devices operating only in the storage area (up to 18 m (approximately 15 m of reaching) and with aisles of 1.9 m); the storage area is fed by a system of conveyors during loading and unloading operations by counterbalanced forklifts. This system is preferred for specialized or universal pallet warehouses with very limited or expensive space.
  • V5—pallet-silo with AS/RS devices operating only in the storage area (up to 37.8 m and with aisles of 1.5 m); other phases are supported by counterbalanced forklifts. This system is preferred for specialized pallet warehouses with very limited or expensive space.
  • V6—pallet-silo with AS/RS devices operating only in the storage area (up to 37.8 m and with aisles of 1.5 m); the storage area is fed by a system of conveyors, while loading and unloading operations are conducted by counterbalanced forklifts. This system is preferred for specialized pallet warehouses with very limited or expensive space.
The basic data characterizing variants of the warehouse facility are as follows:
  • The warehouse stores palletized material handling units (MHUs) with the following dimensions: S M H U = 800 mm, L M H U = 1200 mm, and H M H U = 1400 mm;
  • Daily reliable input material flow: λ D = 630 MHUs/day;
  • Daily reliable input material flow is equal to daily shipments;
  • Inventory standard (average MHU stay time): N O R = 15 days;
  • Number of working days per year: W d = 325 days;
  • Number of FTEs per day: N S = 2;
  • Maximum lifting height: H u p m a x (resulting from technology);
  • Working (in-rack) aisle width: S A i s l e   (resulting from technology).
The following assumptions for a warehouse building for all variants were set:
  • Functional areas in the building have rectangular shapes with the same height over the entire surface of the area.
  • The building has standard steel-framed construction and technical specifications for the roof and walls envelope (U-values: walls: 0.15 W/Km2, roof: 0.12 W/Km2, medium insulation—see [8]).
  • Luminous flux density is approximately 150 lx/m2; zone lighting control is used in the AS/RS area.
  • Roof–light ratio (RLR) is assumed to be 15%.
  • The facility is located in a humid continental climate zone with no dry season and warm summers (Dfb in the Köppen climate classification).
  • Heat from solar radiation and heat from bodies of employees are not considered.
  • Special climatic (refrigeration) conditions are not required.
  • The industrial estate belongs to investors and is not included in the cost calculation.
  • Average electricity consumption intensities for warehouse facilities for the required climate are as presented in Table 2.
  • Energy consumed for space heating (Table 2) is estimated for a building 12 m high. Taller or lower buildings will require different energies ([48]).
  • The internal temperature should allow people to operate without additional clothing (which refers mostly to heating, since air conditioning in a DfB climate is occasional).
  • AS/RS in variants V5 and V6 do not need lighting in the storage area since cranes are automatic and are equipped with their own sources of light (if necessary).
  • The roof is partially covered by photovoltaic panels (60%).
  • A sack-type layout is used (entry and exit docks located on the same wall).
To make the variants comparable, the following assumptions for process were made:
  • Variants are comparable under the assumed material flow parameters (defined below).
  • Technological variants have comparable handling and storage capacity.
  • All considered warehousing technologies are scalable. Systems are composed with modules grouped together to develop a system with the appropriate capacity features.
  • Examined storage technologies are representative for the market. This means that these are the most frequently used variants of MHSs and allow for a relatively accurate comparison of the energy consumption of individual solutions.
  • Fixed set of equipment is used in variants.
  • The same type of logistic unit is used (palletized unit) in all variants, and thus all warehouse technologies can handle this type of unit.
  • Elements of warehousing process are the same for all variants of technology.
  • The energy consumption depends on the workload of each type of equipment.
  • AS/RS take advantage of energy recovery and limited lighting.
  • Workload is calculated on the basis of reference cycles resulting from average distances to be traveled and average velocity of equipment used in the variant.
  • Technological variants are comparable with respect to total energy consumption.
  • Energy is consumed for building (heating, air conditioning, lighting, ventilation, building installations), driving equipment, and MHSs.
Accordingly, the process-related assumptions’ total annual energy consumption of the warehouse E n D can be calculated as follows:
n ϵ N         E n A = E E Q n A + E B H n A + E B L n A + E A C n A + E O S n A E P V n A ,
where:
  • n = the variant number, N = { 1 ,   2 , , n , , N } ;
  • E E Q n A = annual energy consumption of equipment and MHSs in variant n (kWh);
  • E B H n D = annual energy consumption of building heating in variant n (kWh);
  • E B L n D = annual energy consumption of building lighting in variant n (kWh);
  • E A C n D = annual energy consumption of air conditioning and ventilation in variant n (kWh);
  • E O S n D = annual energy consumption of other systems (required for human operation, IT, computers, etc.) in variant n (kWh);
  • E P V n D = annual energy generated by photovoltaic systems installed in variant n (kWh).
These factors will be discussed in detail in the following sections. The range of warehouse processes carried out in the facility was assumed to be constant. In every case, unloading and receipt of materials, putting away, storage, retrieval, loading, and shipping will be conducted.

4. Methodology of Calculation Space and Dimensions of a Warehouse Facility

Energy consumption depends on the spaces where MHSs are maintained and installed. To estimate the storage and handling space for an assumed number of material handling units (MHUs), it is necessary to set the maximum inventory level C A P W H , which is a product of the average daily material flow and MHU stay time (resulting from Little’s Law [53]):
C A P W H = λ D · N O R .
Stock will be stored in steel-frame pallet racks. A basic rack cell (RC) was selected. A single RC with the dimensions presented in Figure 2a can store three MHUs.
The RC width, height, and length, respectively, are as follows:
S R C = L M H U ,
H R C = H M H U + H G a p + H R B ,
L R C = C A P R C · S M H U + ( C A P R C + 1 ) · S G a p ,
while the RS’s storage capacity is C A P R C = 3 MHUs.
To quantify the space necessary to store the inventory, a basic storage module (BSM) composed of two rack cells (RCs) and an adjacent working aisle (WA) separating them was introduced. The BSM width, height, and length, respectively, are as follows (Figure 2b):
S B S M = 2 S R C + S A i s l e + S R o w G a p = 2 L M H U + S A i s l e + S R o w G a p ,
H B S M = H R C ,
L B S M = C A P R C · S M H U + ( C A P R C + 1 ) · S G a p + S R B ,
where S G a p is the distance between MHUs in the RC (approximately 100 mm), H R B is the height of the rack beam (approximately 100 mm), H G a p is the distance from the top of MHUs stored in the RC to the rack beam above it (approximately 150 mm), S R o w G a p is the distance between adherent rack rows (approximately 100 mm), and the BSM’s storage capacity is: C A P B S M = 2 C A P R C = 6 MHUs.
The height of the storage area (SA) is determined by the number of storage levels in the primary storage module (PSM), unless there are other construction restrictions on height. The PSM is a column of stacked BSMs, and the number of levels in the PSM results from the multiple heights of a rack cell, the maximum permitted construction height, and the possible maximum lifting (reaching) heights of internal transport equipment. The number of storage levels can therefore be determined as follows:
N l e v = H U p m a x H R C .
Thus, the storage capacity of the PSM is as follows:
C A P P S M = C A P B S M · N l e v ,
and the number of PSMs is determined by the formula:
N P S M = C A P W H C A P P S M .
The area of the SA can be estimated as follows:
A S A = N P S M · S P S M · L P S M ,
where PSM width = S P S M = S B S M ; PSM length = L P S M = L B S M .
To assess the energy consumption of a warehouse facility and its equipment, not only is the area of the storage area required, but also its dimensions, width ( S S A ) and length ( L S A ). Therefore, the area of the storage area is
A S A = S S A · L S A .
It was assumed that in the case of low-storage technologies using counterbalanced forklifts in the SA, the ratio of width to length should be approximately 2 (
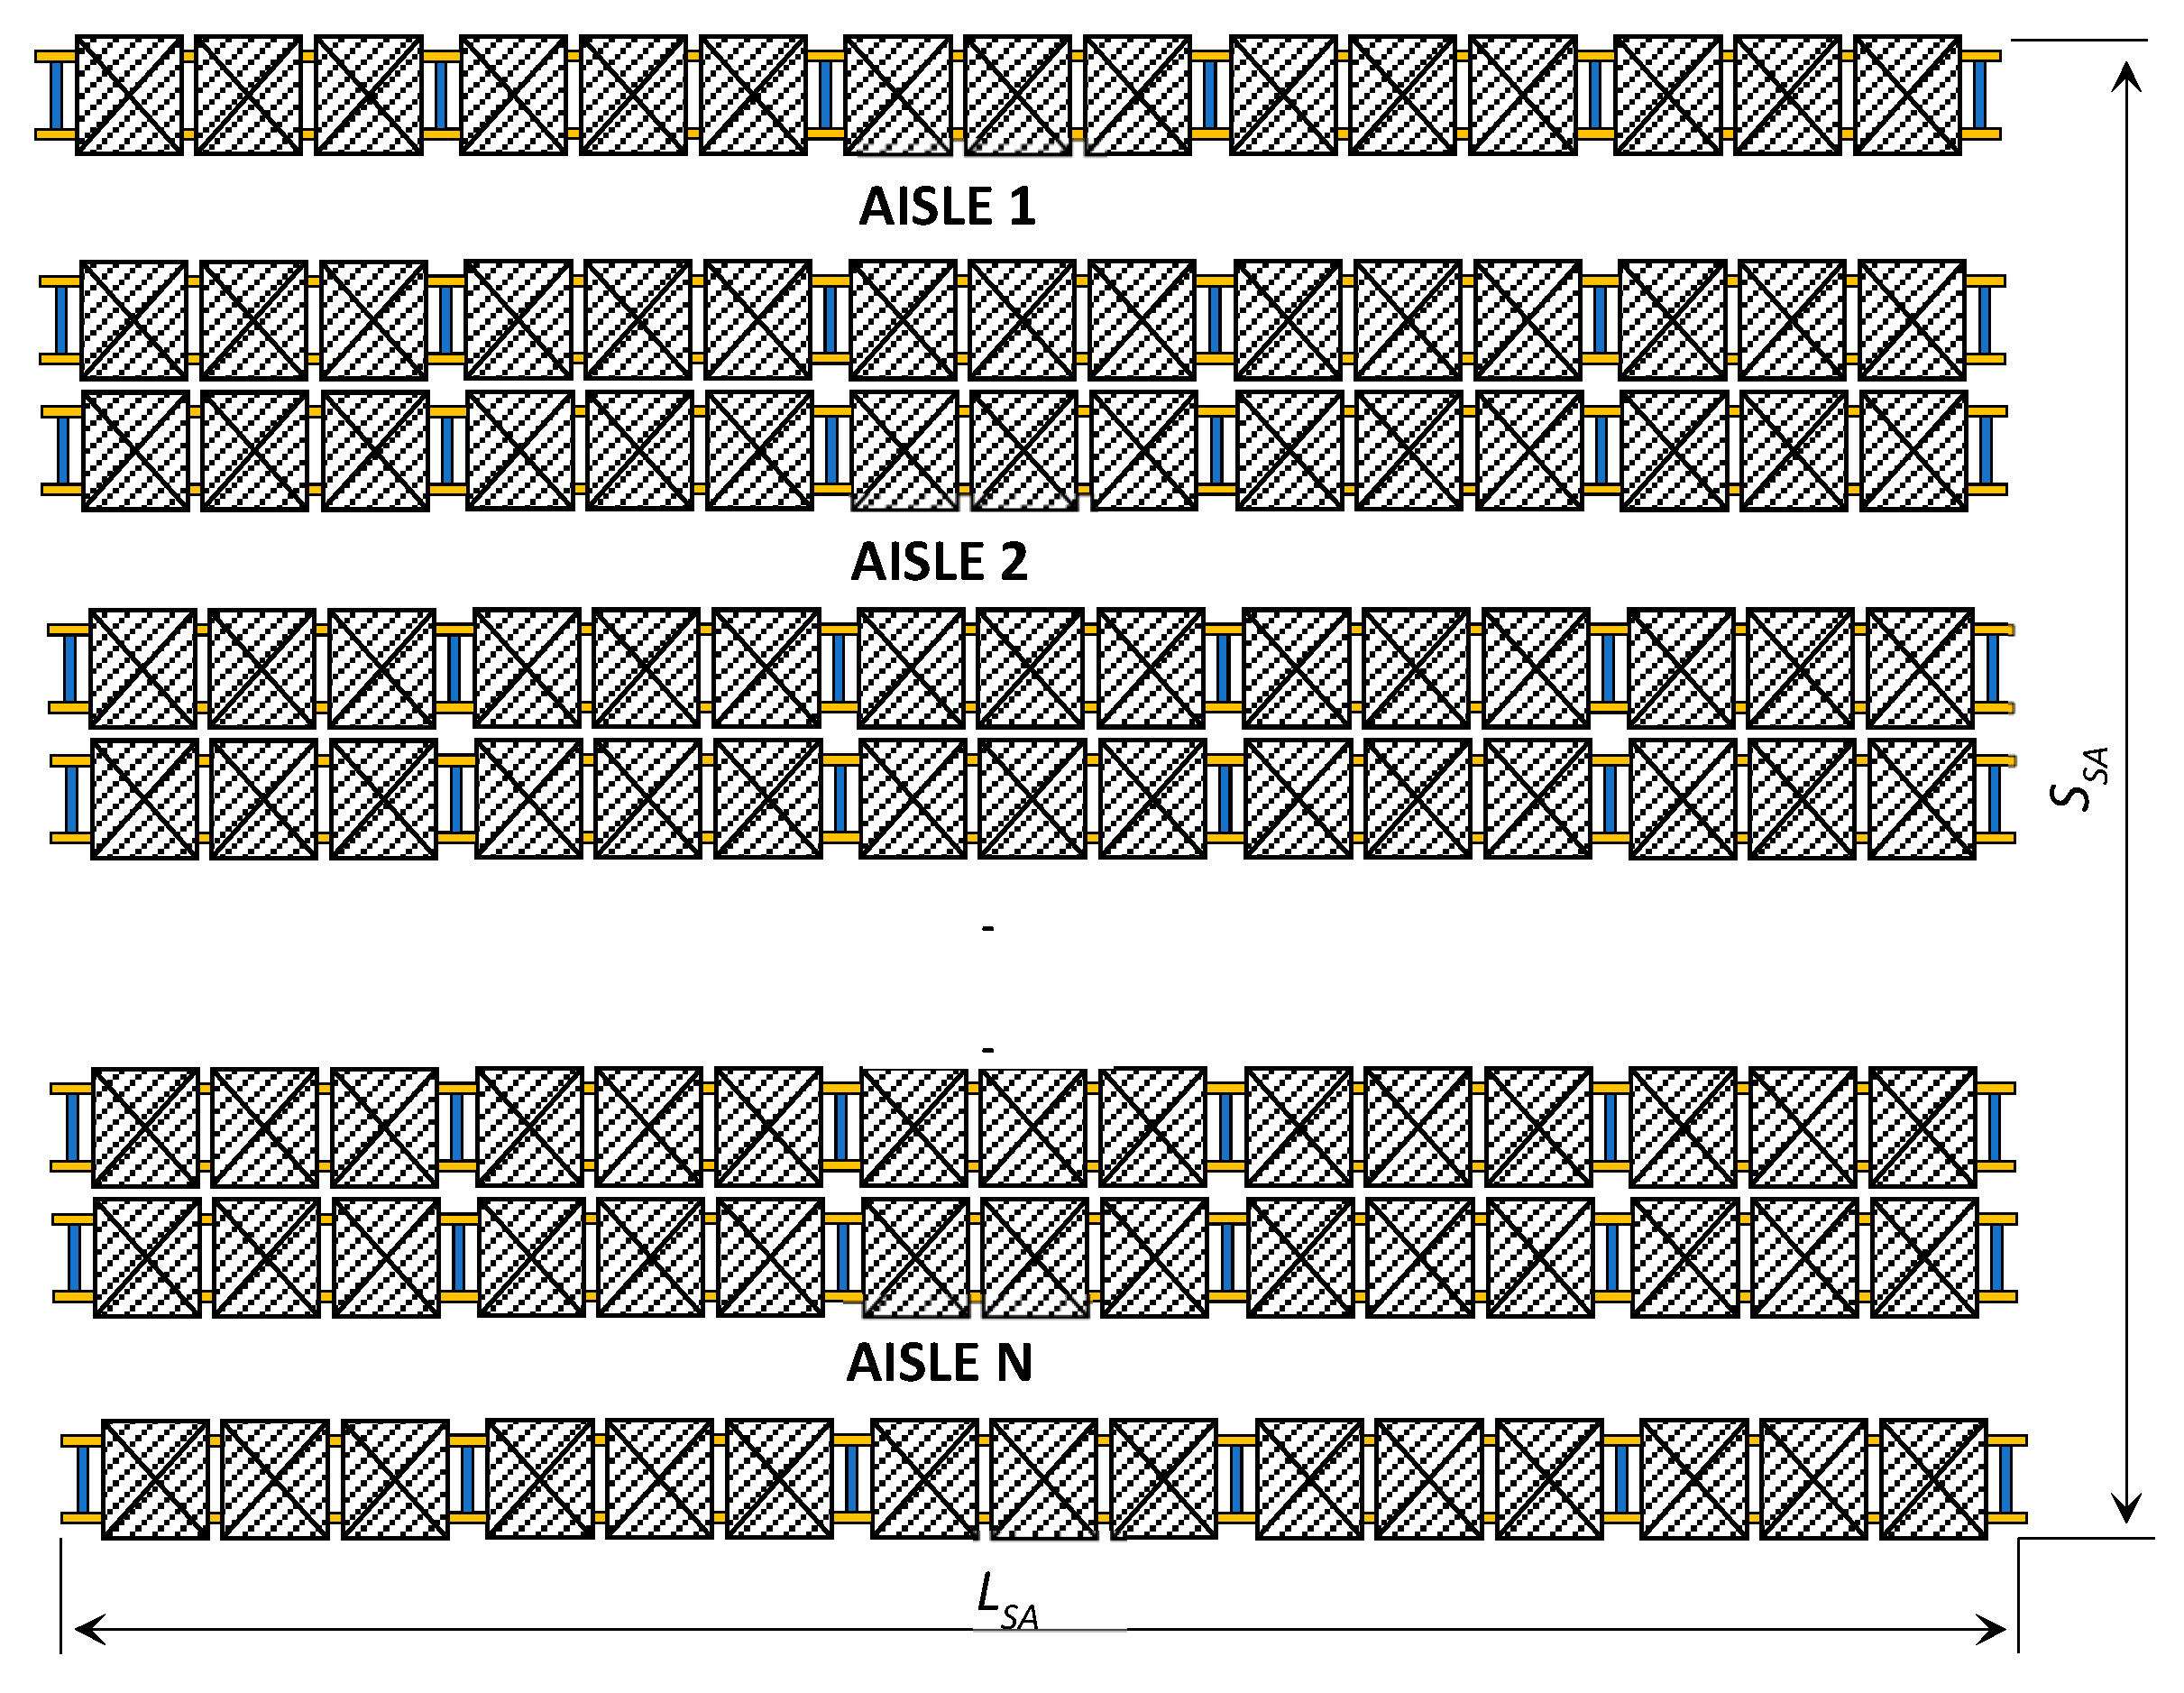
Figure 3):
S S A L S A = 2 .
This ratio of dimensions is a practical rule of thumb that leads to a global reduction in distances traveled and a reduction in time of material handling cycles of putting away and retrieval operations [51]. This assumption applies to single-block rack systems (Figure 3) operating with standard counterbalanced forklifts.
In the case of multiblock rack systems (rack rows separated by transverse corridors of S C A width—Figure 4), Equation (14) should consider the number of rack blocks ( N o B ) and takes the form of Equation (15). The length of a single rack block is designated as L S B A :
N o B · S S A L S B A = N o B · S S A L S A + 0.5 S C A = 2 .
In the case of technologies specialized to work in a single aisle (such as AS/RS), the opposite assumption was adopted. Specialized devices are usually rigidly assigned to certain aisles so that they can offer high work efficiency. Therefore, the lengths of aisles are also greater, thus reducing their number:
L S A S S A = 2 .
Equations (13)–(16) are used to determine the required length and width of the storage area:
  • In single-block rack systems operated by standard counterbalanced forklifts:
L S A = 0.5 A S A ,
S S A = 2 A S A .
  • In multiblock rack systems operated by standard counterbalanced forklifts:
L S A = S C A + ( S C A ) 2 + 8 S C A · A S A · N o B 4 ,
S S A = S C A + ( S C A ) 2 + 8 S C A · A S A · N o B 2 N o B .
  • In single-block systems operated by devices (cranes) specialized to work in a single aisle:
L S A = 2 A S A ,
S S A = 0.5 A S A .
The storage area is the main, but not the only, functional area in most warehouses [51]. The need for other areas results from the specific tasks and functions of the warehouse. The most used are input and output buffers (spatially connected or separated), internal transport roads, picking, repacking, consolidation, identification and control areas, etc. It was assumed that in this case, a warehouse is composed of a storage area, input and output buffer areas, and an internal transport area, which together house the complete warehouse process consisting of receiving (unloading, buffering and entry control), putting away, storage, retrieval, and shipment (buffering and exit control and loading operations).
The practical rule confirmed by most warehouse layouts states that the width of the buffer area corresponds to the width of the storage area, while its length (or depth) results from loading and unloading capacities and in this case is L B U F F = 21 m (Figure 5). Twenty-one meters is sufficient to keep at least two rows of 17 MHUs at each loading dock (average capacity of the trailer is 33 units). The area of the buffer is then equal to [51]
A B U F F = L B U F F · S B U F F ,
where
S B U F F = max { S S A , S B U F F m i n } .
The given material flows require a minimum of five loading docks, which will occupy about 35 m of the warehouse forehead (the width of buffers). Additional space is required for other elements of the warehouse process and equipment maintenance. For this reason, the minimum width of buffers for the discussed process was specified as S B U F F m i n = 50 m.
The storage area and buffers are connected by an internal transport area. It is of the same height as the buffer area, has a width of 0.5 L B U F F , and is the length of the storage area S S A . Therefore, the area of the internal transport path is
A I T R = 0.5 L B U F F · S S A ,
In this way, the total area of the warehouse in the case study is the sum of three elements:
A W H = A S A + A B U F F + A I T R
For warehouses with storage areas of up to 10 m, the height of the storage, buffering, and internal transport areas are usually the same:
H S A = H B U F F = H I T R = N l e v · H R C + 1.5   ( m ) ,
but for warehouses with a storage area higher than 10 m, the buffer and transport areas will have different heights:
H S A = N l e v · H R C + 1 , 5   ( m ) ,
H B U F F = H I T R = 4.8   ( m ) .
Then, the cubic capacity of the warehouse building is calculated as follows:
C U B W H = C U B S A + C U B B U F F + C U B I T R ,
where
C U B S A = H S A · A S A ,
C U B B U F F = H B U F F · A B U F F ,
C U B I T R = H B U F F · A I T R .
The dimensions of the building are necessary for calculating the maintenance costs and making room for warehouse storage and handling technologies (cf. [51,54]).

5. Energy Consumption of Material Handling Systems

All analyzed warehouse variants use steel pallet frame racks in the storage areas, operated by different internal transport technologies. Types of devices used to compose MHSs in the variants are as follows:
  • EQ1—lifting forklifts (electric, guided);
  • EQ2—counterbalanced forklift trucks (four wheels, driven, electric);
  • EQ3—reach truck forklifts (high-stacking forklifts, driven, electric);
  • EQ4—very narrow aisle forklifts (automatically guided, driven, electric);
  • EQ5—stacking cranes (double or single column, no operator, electric);
  • EQ6—roller conveyors (with electric motors).
The technical parameters of devices are gathered in Table 3. These are average values characteristic not of specific producers but of broader classes of devices for initial selection in most practical applications. The values result from the technical specifications of devices in their standard configuration, obtained by a broad overview of the equipment manufacturers’ offerings. The prices can differ according to the configuration of the equipment and the purchase contract conditions. The prices were subjectively determined on the basis of practice and equipment offers and can be considered reliable for Central Europe in the year 2020, but no official data are available.
To set the technological variants of a warehouse facility and warehousing process covering all four general categories of technology presented in Section 4, the internal transport technologies presented in Table 3 were assigned to different phases of the warehouse process as presented in Table 4. In this way, six different but typical variants were created.
All variants handle the same logistical task, which means that they all have the same inventory ( N O R ), use the same MHU, and have the same daily material flow volume ( λ D ). According to Equation (2), the storage capacity for all variants is: C A P W H = 630 · 15 = 9450 MHUs. The technical parameters of the warehouse facility in subsequent variants, calculated via the methodology presented in Section 4, are presented in Table 5 (variants V4–V6 use Equations (17)–(18), while the remaining variants use Equations (21)–(22)).
The calculated area and dimensions of functional areas enable estimating the average distances traveled by MHUs in reference cycles (gathered in Table A1). Distances are then used to calculate the time consumption of reference cycles for the phases of warehousing processes (Table A2). The duration of particular reference cycles depends on the times of picking up and putting down the units (approximately 20 s), the distance to be traveled, and the velocity of the device (acceleration and braking are omitted). Additionally, in cases of putting away and retrieval from the storage area, the average height of lifting/lowering the forks (assumed to be 0.5 ( N L e v   · H R C ) ) and the vertical movement speed were considered. Importantly, for technologies EQ4 and EQ5 (VNA and stacker cranes), simultaneous lifting of the forks and horizontal travel is possible. Then, the reference cycle duration is equal to the duration of the component (horizontal or vertical movement) that lasts longer.
Devices EQx assigned to phases of the warehouse process repeat default reference cycles to handle all MHUs flowing through the system. The daily workload of each phase of the process was estimated as a product of the reference cycle duration and daily number of MHUs to be moved (Table A3) and then broken down into individual types of devices (Table A4). The daily workload is the basis for the calculation of daily energy consumption (Table A5) and annual energy consumption (Table A6) of material handling.
Additionally, assuming two work shifts per day ( N S = 2 ), an even distribution of the workload over the time, and the technical coefficient reducing the effective worktime to approximately 85% (for more details, refer to [54]), the number of devices and employees in each design variant (Table A7) was estimated as the basis for cost estimation. The total energy consumption for an MHS in variants is summarized in Table 6.

6. Building-Related Energy Consumption

Variants of warehousing technology affect not only the technical efficiency and energy consumption of MHSs but also the layout and cubic capacity of the building. This is a crucial factor in the energy consumption of heating, lighting, and maintenance of building systems. It was also assumed that the roof surface can be used for the installation of renewable energy sources such as photovoltaic panels, which will reduce the demand for external energy. This profit may be different for different warehouse technologies. The consumption of electricity for heating or air conditioning depends on the technical specifications of the building envelope as well as the climate and local weather conditions (see Rai et al. [8], Freis, Vohlidka, and Günthner [43], and Howard et al. [46]). The illumination of the building depends mostly on operational requirements, but it is reasonable to assume that it is related to the number of employees working in storage areas (in high-storage technologies usually generated locally by material handling devices), while buffer areas are always well illuminated. Part of the lighting comes from the openings in the roof (roof–light ratio (RLR)). An additional factor is the need to ensure the living conditions for employees in social spaces, as well as the power needed for other building installations (IT infrastructure, security).
The heating and cooling coefficients related to the internal height of the building and recalculated unit energy consumption are presented in Table 7. The recalculation considers the data presented in Table 2 and the heights of warehouse areas presented in Table 5.
The roof surface is used (optionally) as a platform for photovoltaic panels (assumed to be approximately 60% of the area). The offer, installation, and configuration range of photovoltaic panels are very diverse. To standardize the terms of comparison, it was assumed that a panel with dimensions of 1.7 × 1.0 m2 generates approximately 0.3 kWp. Therefore, the power of the photovoltaic system for the warehouse can be estimated as follows:
P W H P V = 0.6 A W H 1 , 7 · 0.3   [ k W p ] .
We know that 1 kWp of a well-placed photovoltaic installation in the DfB climate can produce approximately 1000 kWh/year. A summary of the photovoltaic system capacity for variants of the discussed facility is presented in Table 8.
Considering the above assumptions and data, the estimated energy demand of the warehouse building is presented in Table 9.

7. Exploitation Costs and Automation Index

Energy consumption is a part of warehousing economics. The expenditures on the warehouse and its operation costs, including energy consumption, were estimated to determine the automation index A I n , which uses the share of human labor costs in the total operating costs of the warehouse to allow for a comparison of the automation in subsequent variants:
n ϵ N         A I n = ( 1 C H R n A C H R n A + C E M n A + C E E n A + C C S n A + C R S n A ) · 100 % ,
where:
  • n = the variant number, N = { 1 ,   2 , , n , , N } ;
  • C H R n A = annual cost of human labor in variant n (EUR);
  • C E M n D = annual cost of transport equipment maintenance in variant n (EUR);
  • C E E n A = annual cost of energy consumption of equipment and MHSs in variant n (EUR);
  • C C S n A = annual cost of warehouse control system maintenance in variant n (EUR);
  • C R S n A = annual cost of rack system maintenance in variant n (EUR).
Table 10 presents the expenditure on warehouse equipment and infrastructure. Expenditure for transport devices is a product of the number of devices in variants (Table A7) and the unit price (Table 3). The expenditure on buildings is a function of the assumed cost of erecting 1 m2 of an industrial hall of a given height and the areas of functional zones different in subsequent variants. Construction costs obtained from warehouse realizations in central Poland (suburban industrial areas) were averaged. The average cost of erecting 1 m2 of an industrial hall of up to 10 m in height is EUR 347.83; for between 10 to 20 m in height, it is EUR 543.48; and for above 20 m, it is EUR 739.13. No official data are available, however.
The expenditure on the rack system is proportional to the assumed inventory ( N O R = 9450 MHUs) and the cost of a single storage location, which is EUR 50 for less complex rack structures in variants V1 and V2, and EUR 90 for the other variants. The expenditure on the warehouse control system is correlated with the automation level of a variant. For the variants with higher automation (V5 and V6), expenditure of EUR 300,000 for a control system is assumed, and EUR 200,000 is assumed for the other variants (see [57]).
Table 11 presents the warehouse operational costs and automation index calculated for all variants. Operational costs of equipment and building include depreciation, service, repairs, and capital interest.
The average annual remuneration of employees depends on the required qualifications to operate a given type of device, averaged for the Central Europe area [58]: EUR 10,956.52 (EQ1), EUR 14,086.96 (EQ2), EUR 14,086.96 (EQ3), and EUR 15,652.17 (EQ4). The annual labor cost is multiplied by the number of employees performing warehouse tasks (Table A7).
The transport equipment maintenance cost is related to the use intensity, daily workload, inspections, and service (excluding the energy consumption). The practical method of setting maintenance costs (in the first year of operation) assumes calculating it as a percent of the initial value (see [16,54,59]). The following maintenance cost ratios were assumed: 0.12 (EQ1), 0.14 (EQ2), 0.16 (EQ3), 0.20 (EQ4), 0.14 (EQ5), and 0.16 (EQ6). A similar approach based on design best practices (detailed in [59]) was used to calculate the maintenance costs of the warehouse management system (cost index: 0.15) and nonmechanical equipment (racks, cost index: 0.025).

8. Discussion of Total Energy Consumption by Warehouse System and Other Results

The case study revealed the trend linking energy consumption of industrial warehouses with their automation level, land consumption, and costs. Table 12 and Figure 6 summarize warehouses’ energy consumption by individual end use categories under different warehouse technologies.
The obtained results should be analyzed in relation to the following four factors:
  • Carbon footprint (environmental impact);
  • Operational costs and facility productivity;
  • Future automation trends and social factors;
  • Automation index.
In 2012, Elhedhli and Merrick [7] analyzed a supply chain configuration and related CO2 emissions by changing the number of warehouses (nodes) in the network and considering only warehouse setup costs. In 2021, this approach would raise immediate questions about the warehouse energy consumption and related carbon footprint, which can vary significantly depending on the technology used—as presented in Table 12. The set of three warehouses in the network analyzed by Elhedhli and Merrick in the “worst”-case scenario (as in variant V1) will indirectly produce about 2411 tons of CO2 annually (3.93 kg/MHU) through electric energy usage (1 kWh ≈ 0.417 kg of CO2 [60]), while in the “best” case (V5), it will be about 592 tons (0.96 kg/MHU). These results are only for operational emissions and do not consider emissions related to embodied materials, which can be much larger for variants with a larger footprint. This is a significant issue to be considered as an argument for green warehousing and constitutes grounds for including a wider approach to automation in future research on the environmental impact of logistics, as presented by Rai et al. [8].
Operational costs and return of investment (ROI) are usually the final determinants of technology selection, as seen in [2,15,16,17,18] and [59]. It is meaningful that these publications usually do not treat the energy costs as a separate KPI. However, the cost characteristics gathered in Table 12 show that the energy makes up a large part of total operational costs, especially in low-automated variants (V1, V2), and should be considered the main decisive factor in these cases. The situation here is contingent upon the climate conditions, which can force intensive heating proportional to the facility space in a DfB climate—in line with the findings of Rai et al. [8] or Howard et al. [46]. The optimization of energy consumption for space conditioning should be prioritized before the equipment usage in low-storage technologies to achieve better global results. Of course, the space volume is correlated with the productivity and number of devices used [54,59]. The space (both terrain occupied and cubic space) is much larger for low-storage technologies (V1, V2), requiring wide floors and flat buildings. This also influences the heating patterns. The low equipment maintenance costs in variants V1 and V2 are balanced by the high human labor costs.
Low-automated and low-storage variants (V1 and V2) require larger spaces for stock keeping and material handling solutions but are preferred when the land price is low because of the ROI [54]. It must be noted that newly constructed warehouse buildings, regardless of the location, are generally higher than 10–12 m, not only due to better space utilization but also due to the energy savings related to the maintenance (heating, cooling, and lighting) of the space, as confirmed by [43] and this study. This means that variant V1, with an 8.1 m storage area height, is an extreme case favoring poor energy efficiency. The heating is not the only factor to be discussed. Narrower aisles in variants V3–V6 not only reduce the amount of space to be maintained but also shorten the distances to be traveled and increase the share of the vertical component in reference cycles, which can be pursued jointly with horizontal travel. This leads to a smaller energy demand for reference cycles in V5 and V6, as discussed in [39]. Additionally, by eliminating the human factor in highly automated technologies (V5 and V6), we can further reduce the electricity consumption by keeping the temperature lower and reducing the lighting (zone lighting control), as well as applying higher speeds for material handling to reduce the number of devices and recuperation mechanisms.
The roof of the warehouse (but also the plot) can be used for additional renewable energy sources. Due to the multitude of configuration variants, the optimistic outputs for the photovoltaic system presented in the case study are not included in the energetic balance of the warehouse and are only indicative. This example reveals a significant potential in the installation of photovoltaic panels and shows the scale of possible profit from the installation. Figure 7 shows the total energy consumption compared to the energy that can potentially be generated from 60% of the roof surface.
The automation of warehouse processes leads to a reduction in space and maintenance costs (especially employment costs), increasing the safety and quality of services and decoupling the demand for workforce from the operational efficiency of the system. This is especially important in the current precarious market conditions. Additionally, new trends related to the autonomation of vehicles and intralogistics devices have made new warehouse technologies such as intelligent forklifts, robots, AGVs, and solutions based on the Internet of Things more popular. Automatic solutions are able to recover kinetic energy and require less heating and lighting. Of course, these technologies are more expensive (cf. Table 10) and should be considered in the long term to assess the return on investment. Nevertheless, even with a longer period of ROI, warehouse automation is chosen more often than it was 10 years ago due to its independence from the labor force. This factor is very significant in the light of economic crises, social changes, military conflicts, and emerging crisis situations such as the COVID-19 pandemic.
The level of automation can be difficult to define and measure since the variety of technologies makes them difficult to classify. The automation index (Equation (35)) is simple to apply and provides easily interpreted results to be used for the preliminary evaluation of warehouse design concepts. The index is correlated with energy consumption (as presented in Figure 7) and supplements the panel of KPIs for the assessment of warehouse sustainability (cf. [54,59] and the discussion on sustainable measures in [23]).
The results obtained depend, to a large extent, on the daily material flow volume and average MHU stay time. Changes in these two values (see Equation (2)) will change the energy demand for material handling and provide a different structure of energy consumption than that presented in Figure 6. For this reason, the presented conclusions should primarily be related to the above case study but can also show a general trend.

9. Conclusions

Designing a warehouse facility tailored to the specific conditions of a supply chain involves the consideration of many technical and economic factors, most of which relate to investments and periodical operating costs, and especially return on investment. One of the key factors in this aspect is (electric) energy driving modern storage installations. Warehouses use devices powered by gas, and, less often, diesel, but most of the technology uses line electricity or batteries. A warehouse is therefore as responsible for the carbon footprint as other elements of the supply chain.
The energy consumption by warehouse processes may be determined not only by implementing energy-saving technologies and buildings but also, above all, by the selection of core warehouse technologies. Core technologies impose the shape of the building, the racking systems, and the human work patterns and costs. Of course, the presented considerations do not fully take into account the specifics of different industries and supply chains, the types of materials to be handled and transported, or the functional efficiency, productivity, reliability, and expandability of the analyzed solutions. They also do not touch on external factors, especially the social environment, availability of workforce, and economic conditions, which will be decisive factors for the selection of core warehouse technology, and thus energy consumption. The example also omits order picking processes, as well as value-adding services, which are often the core activity of a warehouse.
Nevertheless, the considerations, simplified in this way, allowed us to compare the energy consumption of warehouse processes in typical technological options in relation to the proposed automation index describing the degree of mechanization and automation of the process. The research presented in this paper also revealed the structure of energy consumption in storage facilities and thus indicated places of potential optimization. This can be a guide or inspiration for practitioners who are about to decide on warehouse technology. A comparative table of the core technologies presented in the article was not previously available in the literature.
The factors discussed will be gradually considered in the research by the authors; however, the scope of the warehouse energy consumption problem is very wide and varied, which makes it impossible to effectively include all the factors mentioned in one universal method (as revealed by the literature review). Nevertheless, updating our knowledge on the energy consumption of warehouses requires a comparative analysis at a general level to frame detailed issues dominating in the literature.

Author Contributions

Conceptualization, K.L. and M.K.; methodology, K.L.; validation, K.L., M.K., and P.G.; formal analysis, K.L. and M.K.; investigation, M.K.; resources, K.L., M.K., and P.G.; data curation, K.L. and M.K.; writing—original draft preparation, K.L.; writing—review and editing, P.G.; visualization, M.K.; supervision, M.K.; project administration, K.L. All authors have read and agreed to the published version of the manuscript.

Funding

This research received no external funding.

Institutional Review Board Statement

Not applicable.

Informed Consent Statement

Not applicable.

Acknowledgments

The authors thank the business partners and associates who have allowed for the use of data from particular projects.

Conflicts of Interest

The authors declare no conflict of interest.

Appendix A. Detailed Tabular Data on Variants of the Warehouse Process

Table A1. Distances of reference cycles in warehousing process phases (one direction) (m).
Phase of ProcessV1V2V3V4V5V6
unloading19.5019.5019.5019.5019.5019.50
transport to storage area80.5269.7341.4451.8738.6146.22
putting away (to rack cell)59.5248.7363.5063.5040.8740.87
retrieval (from rack cell)59.5248.7363.5063.5040.8740.87
transport to the buffer area80.5269.7341.4451.8738.6146.22
loading19.5019.5019.5019.5019.5019.50
Table A2. Duration of a reference cycle in the warehousing process phase (min).
Phase of ProcessV1V2V3V4V5V6
unloading0.861.060.860.860.860.86
transport to storage area1.471.361.082.311.052.05
putting away (to rack cell)1.371.280.900.901.141.14
retrieval (from rack cell)1.371.280.900.901.141.14
transport to the buffer area1.471.361.082.311.052.05
loading0.861.060.860.860.860.86
Table A3. Daily workload of warehouse process phases (working h/day).
Phase of ProcessV1V2V3V4V5V6
unloading10.8613.3110.8610.8610.8610.86
transport to storage area18.5417.1913.6229.0513.2625.88
putting away (to rack cell)17.2816.1211.3711.3714.3714.37
retrieval (from rack cell)17.2816.1211.3711.3714.3714.37
transport to the buffer area18.5417.1913.6229.0513.2625.88
loading10.8613.3110.8610.8610.8610.86
Total93.3793.2371.70102.5576.98102.21
Table A4. Daily workload of individual types of equipment (working h/day).
Type of EquipmentV1V2V3V4V5V6
EQ10.0026.630.000.000.000.00
EQ293.370.0048.9621.7148.2421.71
EQ30.0066.600.000.000.000.00
EQ40.000.0022.7422.740.000.00
EQ50.000.000.000.0028.7328.73
EQ60.000.000.0058.100.0051.76
Table A5. Daily energy consumption of warehouse variants (kWh/day).
Phase of ProcessV1V2V3V4V5V6
unloading54.299.8554.2954.2954.2954.29
transport to storage area92.7256.7268.11150.7066.32119.62
putting away (to rack cell)86.4253.1879.5979.5933.7633.76
retrieval (from rack cell)86.4253.1879.5979.5933.7633.76
transport to the buffer area92.7256.7268.11150.7066.32119.62
loading54.299.8554.2954.2954.2954.29
Total466.87239.50403.96569.14308.74415.33
Table A6. Annual energy consumption of warehouse variants (kWh/year).
Phase of ProcessV1V2V3V4V5V6
unloading17,643320217,64317,64317,64317,643
transport to storage area30,13518,43322,13448,97621,55538,876
putting away (to rack cell)28,08817,28425,86725,86710,97210,972
retrieval (from rack cell)28,08817,28425,86725,86710,97210,972
transport to the buffer area30,13518,43322,13448,97621,55538,876
loading17,643320217,64317,64317,64317,643
Table A7. Number of devices of and employees for all design variants (pcs/persons).
Type of EquipmentV1V2V3V4V5V6
EQ10/02/4 10/00/00/00/0
EQ27/140/04/82/44/82/4
EQ30/05/100/00/00/00/0
EQ40/00/02/42/40/00/0
EQ50/00/00/00/03/03/0
EQ60/02/40/0165.5 2/00/0147.9/0
1 The time utilization coefficients for people and equipment work are different; types of manual work are not considered. 2 The length of conveyors (EQ6) in meters.

References

  1. Bartolini, M.; Bottani, E.; Grosse, E.H. Green warehousing: Systematic literature review and bibliometric analysis. J. Clean. Prod. 2019, 226, 242–258. [Google Scholar] [CrossRef]
  2. Yener, F.; Yazgan, H.R. Optimal warehouse design: Literature review and case study application. Comput. Ind. Eng. 2019, 129, 1–13. [Google Scholar] [CrossRef]
  3. Gu, J.; Goetschalckx, M.; McGinnis, L.F. Research on warehouse operation: A comprehensive review. Eur. J. Oper. Res. 2007, 177, 1–21. [Google Scholar] [CrossRef]
  4. De Koster, R.; Le-Duc, T.; Roodbergen, K.J. Design and control of warehouse order picking: A literature review. Eur. J. Oper. Res. 2007, 182, 481–501. [Google Scholar] [CrossRef]
  5. Johnsson, F.; Karlsson, I.; Rootzén, J.; Ahlbäck, A.; Gustavsson, M. The framing of a sustainable development goals assessment in decarbonizing the construction industry—Avoiding “Greenwashing”. Renew. Sustain. Energy Rev. 2020, 131, 110029. [Google Scholar] [CrossRef]
  6. Abeydeera, L.H.U.W.; Mesthrige, J.W.; Samarasinghalage, T.I. Global Research on Carbon Emissions: A Scientometric Review. Sustainability 2019, 11, 3972. [Google Scholar] [CrossRef] [Green Version]
  7. Elhedhli, S.; Merrick, R. Green supply chain network design to reduce carbon emissions. Transp. Res. Part D 2012, 17, 370–379. [Google Scholar] [CrossRef]
  8. Rai, D.; Sodagar, B.; Fieldson, R.; Hu, X. Assessment of CO2 emissions reduction in a distribution warehouse. Energy 2011, 36, 2271–2277. [Google Scholar] [CrossRef] [Green Version]
  9. Hua, G.; Cheng, T.C.E.; Wang, S. Managing carbon foot prints in inventory management. Int. J. Prod. Econ. 2011, 132, 178–185. [Google Scholar] [CrossRef]
  10. Tappia, E.; Marchet, G.; Melacini, M.; Perotti, S. Incorporating the environmental dimension in the assessment of automated warehouses. Prod. Plan. Control 2015, 26, 824–838. [Google Scholar] [CrossRef]
  11. Uyar, A.; Karaman, A.S.; Kilic, M. Is corporate social responsibility reporting a tool of signaling or greenwashing? Evidence from the worldwide logistics sector. J. Clean. Prod. 2020, 253, 119997. [Google Scholar] [CrossRef]
  12. Jacyna, M.; Wasiak, M.; Lewczuk, K.; Kłodawski, M. Simulation model of transport system of Poland as a tool for developing sustainable transport. Arch. Transp. 2014, 31, 23–35. [Google Scholar] [CrossRef]
  13. Official Journal of the European Union. L 285/10. Directive 2009/125/EC of the European Parliament and of the Council of 21 October 2009. Establishing a framework for the setting of ecodesign requirements for energy-related products. Available online: https://eur-lex.europa.eu/legal-content/EN/TXT/HTML/?uri=CELEX:32009L0125&from=EN (accessed on 10 March 2021).
  14. Jacyna-Gołda, I.; Izdebski, M.; Szczepański, E.; Gołda, P. The assessment of supply chain effectiveness. Arch. Transp. 2018, 45, 43–52. [Google Scholar] [CrossRef] [Green Version]
  15. Lewczuk, K. Dependability issues in designing warehouse facilities and their functional areas. J. KONBiN 2016, 2, 201–228. [Google Scholar] [CrossRef] [Green Version]
  16. Frazelle, E.H. World-Class Warehousing and Material Handling, 2nd ed.; McGraw-Hill Education: New York, NY, USA, 2016. [Google Scholar]
  17. Gu, J.; Goetschalckx, M.; McGinnis, L.F. Research on warehouse design and performance evaluation: A comprehensive review. Eur. J. Oper. Res. 2010, 203, 539–549. [Google Scholar] [CrossRef]
  18. Baker, P.; Canessa, M. Warehouse design: A structured approach. Eur. J. Oper. Res. 2009, 193, 425–436. [Google Scholar] [CrossRef] [Green Version]
  19. FEM Intralogistic Systems Product Group. FEM 9.865 Energy Consumption—Determination Methods (ECoDeMISE)—English; FEM European Materials Handling Federation: Brussels, Belgium, 2017. [Google Scholar]
  20. Ambroziak, T.; Jachimowski, R.; Pyza, D.; Szczepański, E. Analysis of the traffic stream distribution in terms of identification of areas with the highest exhaust pollution. Arch. Transp. 2014, 32, 7–16. [Google Scholar] [CrossRef]
  21. Boenzi, F.; Digiesi, S.; Facchini, F.; Mossa, G.; Mummolo, G. Greening activities in warehouses: A model for identifying sustainable strategies in material handling. Ann. DAAAM Proc. Int. DAAAM Symp. 2015, 26, 980–988. [Google Scholar]
  22. Carli, R.; Digiesi, S.; Dotoli, M.; Facchini, F. A Control Strategy for Smart Energy Charging of Warehouse Material Handling Equipment. Procedia Manuf. 2020, 42, 503–510. [Google Scholar] [CrossRef]
  23. Bank, R.; Murphy, R. Warehousing sustainability standards development. IFIP Adv. Inf. Commun. Technol. 2013, 414, 294–301. [Google Scholar]
  24. Ene, S.; Küçükoglu, I.; Aksoy, A.; Oztürk, N. A genetic algorithm for minimizing energy consumption in warehouses. Energy 2015, 114, 973–980. [Google Scholar] [CrossRef]
  25. Makris, P.A.; Makri, A.P.; Provatidis, C.G. Energy-saving methodology for material handling applications. Appl. Energy 2006, 83, 1116–1124. [Google Scholar] [CrossRef]
  26. Bonney, M.; Jaber, M.Y. Environmentally responsible inventory models: Non-classical models for a non-classical era. Int. J. Prod. Econ. 2011, 133, 43–53. [Google Scholar] [CrossRef]
  27. Marchi, B.; Zanoni, S.; Jaber, M.Y. Energy Implications of Lot Sizing Decisions in Refrigerated Warehouses. Energies 2020, 13, 1739. [Google Scholar] [CrossRef] [Green Version]
  28. Kłodawski, M.; Lewczuk, K.; Jacyna-Gołda, I.; Żak, J. Decision making strategies for warehouse operations. Arch. Transp. 2017, 41, 43–53. [Google Scholar] [CrossRef] [Green Version]
  29. Jacyna, M.; Wasiak, M.; Bobiński, A. SIMMAG3D as a tool for designing of storage facilities in 3D. Arch. Transp. 2017, 42, 25–38. [Google Scholar] [CrossRef]
  30. Jachimowski, R.; Gołębiowski, P.; Izdebski, M.; Pyza, D.; Szczepański, E. Designing and efficiency of database for simulation of processes in systems. Case study for the simulation of warehouse processes. Arch. Transp. 2017, 41, 31–42. [Google Scholar] [CrossRef]
  31. Szczepański, E.; Jachimowski, R.; Izdebski, M.; Jacyna-Gołda, I. Warehouse location problem in supply chain designing: A simulation analysis. Arch. Transp. 2019, 50, 101–110. [Google Scholar] [CrossRef]
  32. Lottersberger, F.; Hafner, N.; Jodin, D. Efficiency indicators for benchmark and improvement of energy efficiency on automated material flow systems. Proc. Manuf. Syst. 2013, 8, 199–204. [Google Scholar]
  33. Lerher, T.; Edl, M.; Rosi, B. Energy efficiency model for the mini-load automated storage and retrieval systems. Int. J. Adv. Manuf. Technol. 2014, 70, 97–115. [Google Scholar] [CrossRef]
  34. Ekren, B.Y. A simulation-based experimental design for SBS/RS warehouse design by considering energy related performance metrics. Simul. Modell. Pract. Theory 2020, 98, 101991. [Google Scholar] [CrossRef]
  35. Bortolini, M.; Faccio, M.; Ferrari, E.; Gamberi, M.; Pilati, F. Time and energy optimal unit-load assignment for automatic S/R warehouses. Int. J. Prod. Econ. 2017, 190, 133–145. [Google Scholar] [CrossRef]
  36. Zając, P. The idea of the model of evaluation of logistics warehouse systems with taking their energy consumption under consideration. Arch. Civ. Mech. Eng. 2011, 11, 479–492. [Google Scholar] [CrossRef]
  37. Rücker, A.; Rief, J.; Fottner, J. An investigation of Mean Energy Demand, Performance and Reference Cycles for Stacker Cranes. FME Trans. 2020, 48, 307–312. [Google Scholar] [CrossRef]
  38. Guerrazzi, E.; Mininno, V.; Aloini, D.; Dulmin, R.; Scarpelli, C.; Sabatini, M. Energy Evaluation of Deep-Lane Autonomous Vehicle Storage and Retrieval System. Sustainability 2019, 11, 3817. [Google Scholar] [CrossRef] [Green Version]
  39. Stöhr, T.; Schadler, M.; Hafner, N. Benchmarking the energy efficiency of diverse Automated Storage and Retrieval Systems. FME Trans. 2018, 46, 330–335. [Google Scholar] [CrossRef]
  40. Zou, B.; Xu, X.; Gong, Y.Y.; De Koster, R. Evaluating battery charging and swapping strategies in a robotic mobile fulfillment system. Eur. J. Oper. Res. 2018, 267, 733–753. [Google Scholar] [CrossRef]
  41. Minav, T.A.; Murashko, K.; Laurila, L.; Pyrhönen, J. Forklift with a lithium-titanate battery during a lifting/lowering cycle: Analysis of the recuperation capability. Autom. Constr. 2013, 35, 275–284. [Google Scholar] [CrossRef]
  42. Renquist, J.V.; Dickman, B.; Bradley, T.H. Economic comparison of fuel cell powered forklifts to battery powered forklifts. Int. J. Hydrog. Energy 2012, 37, 12054–12059. [Google Scholar] [CrossRef]
  43. Freis, J.; Vohlidka, P.; Günthner, W.A. Low-Carbon Warehousing: Examining Impacts of Building and Intra-Logistics Design Options on Energy Demand and the CO2 Emissions of Logistics Centers. Sustainability 2016, 8, 448. [Google Scholar] [CrossRef] [Green Version]
  44. Van Geest, M.; Tekinerdogan, B.; Catal, C. Design of a reference architecture for developing smart warehouses in industry 4.0. Comput. Ind. 2021, 124, 103343. [Google Scholar] [CrossRef]
  45. Zając, P.; Kwasniowski, S. Zero energy buildings in the logistics warehouse systems. E3S Web Conf. ASEE17 2017, 22, 00198. [Google Scholar] [CrossRef] [Green Version]
  46. Howard, B.; Parshall, L.; Thompson, J.; Hammer, S.; Dickinson, J.; Modi, V. Spatial distribution of urban building energy consumption by end use. Energy Build. 2012, 45, 141–151. [Google Scholar] [CrossRef]
  47. Besler, M.; Cepiński, W.; Kęskiewicz, P.; Skrzycki, M. Analysis of annual energy consumption by a warehouse building. E3S Web Conf. ASEE19 2019, 116, 00009. [Google Scholar] [CrossRef]
  48. Wang, L.L.; Li, W. A study of thermal destratification for large warehouse energy savings. Energy Build. 2017, 153, 126–135. [Google Scholar] [CrossRef]
  49. Porras-Amores, C.; Mazarrón, F.R.; Cañas, I. Study of the Vertical Distribution of Air Temperature in Warehouses. Energies 2014, 7, 1193–1206. [Google Scholar] [CrossRef] [Green Version]
  50. Lewczuk, K.; Kłodawski, M.; Jacyna-Gołda, I. Selected Aspects of Warehouse Process Control and the Quality of Warehouse Services. In Management Perspective for Transport Telematics TST 2018; Mikulski, J., Ed.; Springer: Cham, Switzerland, 2018; Volume 897, pp. 445–459. [Google Scholar]
  51. Jacyna, M.; Lewczuk, K.; Kłodawski, M. Technical and organizational conditions of designing warehouses with different functional structures. J. KONES Powertrain Transp. 2015, 22, 49–58. [Google Scholar]
  52. U.S. Energy Information Administration. Commercial Buildings Energy Consumption Survey (CBECS), Table E6. Electricity Consumption Intensities (kWh) by End Use. 2012. Available online: https://www.eia.gov/consumption/commercial/data/2012/c&e/cfm/e6.php (accessed on 10 March 2021).
  53. Bartholdi, J.J., III; Hackman, S.T. Warehouse & Distribution Science. Release 0.98.1. 2019. Available online: https://www.warehouse-science.com/book/editions/wh-sci-0.98.1.pdf (accessed on 10 March 2021).
  54. Jacyna-Gołda, I.; Lewczuk, K. The method of estimating dependability of supply chain elements on the base of technical and organizational redundancy of process. Eksploat. Niezawodn. Maint. Reliab. 2017, 19, 382–392. [Google Scholar] [CrossRef]
  55. Jungheinrich Commercial Offer. Available online: https://www.jungheinrich.co.uk/products/new-forklifts (accessed on 14 April 2021).
  56. Mecalux Commercial Offer. Available online: https://mecaluxpl.cdnwm.com/katalogi/ukladnice-paletowe.1.4.pdf (accessed on 14 April 2021).
  57. Warehouse Management Software Buyer Trends—2018 Report. Available online: https://softwareconnect.com/warehouse-management/buyer-trends-2018-report/ (accessed on 14 April 2021).
  58. Eurostat Statistics Explained. Wages and Labour Costs. Available online: https://ec.europa.eu/eurostat/statistics-explained/index.php/Wages_and_labour_costs (accessed on 14 April 2021).
  59. Jacyna, M.; Lewczuk, K. Projektowanie Systemów Logistycznych; Wydawnictwo Naukowe PWN: Warsaw, Poland, 2016. [Google Scholar]
  60. U.S. Energy Information Administration. Available online: https://www.eia.gov/tools/faqs/faq.php?id=74&t=11 (accessed on 14 April 2021).
Figure 1. Schematic presentation of warehouse technological variants.
Energies 14 02709 g001
Figure 2. (a) Rack cell (RC) scheme; (b) basic storage module (BSM).
Energies 14 02709 g002
Figure 3. Single-block arrangement of storage area.
Energies 14 02709 g003
Figure 4. Two-block layout of the storage area; N o B = 2.
Energies 14 02709 g004
Figure 5. Schematic warehouse layout.
Energies 14 02709 g005
Figure 6. Annual energy consumption in the examined warehouse system (kWh/year).
Energies 14 02709 g006
Figure 7. Total energy consumption and production in the examined warehouse system compared with the automation index.
Energies 14 02709 g007
Table 1. Topics that arise in the literature review on energy consumption by warehouses.
TopicsCarbon FootprintLabor and Operational CostsMaterial and Construction TechnologiesDirect Measurement of Energy Usage
General-purpose research on energy consumption in logistics[11,12,20][14]
Green warehousing and green design paradigms[1,6,7][19,21,23][5,8][22]
Elements of warehouse design procedure[9][2,3,4,15,17,18,24,25,26,27,28,29,31,50,51][30]
Material handling systems and related energy consumption [10,32,34,35,36,38,39,42] [33,37,40,41]
Building-related energy consumption [43][8,43–49]
Table 2. Assumed average electricity consumption intensities by end use (kWh/m2/year).
Space HeatingCoolingVentilationLightingIT Network and Equip. Other
see [8]see [52]see [52]see [52]see [52]see [52]
104.5510.7644.30622.6052.15319.376
Table 3. Parameters of transport equipment.
ParameterEQ1EQ2EQ3EQ4EQ5EQ6
Maximum lifting height H U p m a x (m)-5.07.115.6535-
Width of working aisle in storage area S A i s l e (m)2.33.72.71.91.5-
Unit energy consumption E C o n h (kWh/h)0.74 153.372.350.1 1
Horizontal   velocity   V x m a x (km/h)6171211.113.51
Vertical   velocity   V y m a x (km/h)-1.81.982.12.3-
Unit price P (EUR)15,00039,60042,000101,200350,000900 2
1 Energy usage estimated for representative devices [55] (EQ1—ERE 120, EQ2—EFG 316, EQ3—ETV C16, EQ4—EKX 410-516, EQ5 and EQ6 by [56]). 2 1-m module.
Table 4. Assignment of transport equipment to the phases of the warehousing process.
Phase of ProcessV1V2V3V4V5V6
unloadingEQ2EQ1EQ2EQ2EQ2EQ2
transport to storage areaEQ2EQ3EQ2EQ6EQ2EQ6
putting away (to rack cell)EQ2EQ3EQ4EQ4EQ5EQ5
retrieval (from rack cell)EQ2EQ3EQ4EQ4EQ5EQ5
transport to the buffer areaEQ2EQ3EQ2EQ6EQ2EQ6
loadingEQ2EQ1EQ2EQ2EQ2EQ2
Table 5. Technical parameters of the variants of the warehouse system.
ParameterV1V2V3V4V5V6
L R C (m)2.82.82.82.82.82.8
S R C (m)1.21.21.21.21.21.2
H R C (m)1.651.651.651.651.651.65
L B S M (m)2.92.92.92.92.92.9
S B S M (m)6.25.24.44.444
H B S M (m)1.651.651.651.651.651.65
S A i s l e (m)3.72.71.91.91.51.5
N L e v   (pcs)4510102222
C A P P S M (pcs)24306060132132
N P S M   (pcs)3943151581587272
L S A (m)59.5248.7363.5063.5040.8740.87
S S A (m)119.0397.4731.7531.7520.4420.44
H S A (m) 18.109.7518.0018.0037.8037.80
A S A (m2)7084.674749.712016.132016.13835.38835.38
C U B S A (m3)57,385.7946,309.7036,290.2536,290.2531,577.4731,577.47
L B U F F (m)212121212121
S B U F F (m)119.0397.4750.0050.0050.0050.00
H B U F F (m)8.109.754.804.804.804.80
A B U F F (m2)2499.632046.871050.001050.001050.001050.00
C U B B U F F (m3)20,247.0019,956.985040.005040.005040.005040.00
A I T R (m2)1249.821023.44333.38333.38214.62214.62
C U B I T R (m3)10,123.509978.491600.201600.201030.181030.18
A W H (m2)10,834.117820.023399.503399.502100.002100.00
C U B W H (m3)87,756.3076,245.1842,930.4542,930.4537,647.6537,647.65
1 The inner height of the building (not the reaching height) is equal to H S A
Table 6. Summarized annual energy consumption of warehouse variants (kWh/year).
Variant:V1V2V3V4V5V6
Total151,73277,837131,287184,971100,339134,982
Table 7. Heating and cooling coefficients related to building height.
Height of Building (m): 4.88.19.751837.8
Heating and cooling coefficient related to building height0.7111.22
Recalculated unit electricity consumption for space heating and cooling (kWh/m2/year)80.72115.31115.31138.38230.63
Table 8. Data for calculation of electricity generated by photovoltaic system.
ParametersV1V2V3V4V5V6
A W H (m2)10,834.117820.023399.503399.502100.002100.00
P W H P V (kWp)1147.14828.18360360222.48222.48
E W H P V energy generated (kWh/year)1,147,140828,180360,000360,000222,480222,480
Expenditure (million EUR)1.260.910.390.390.240.24
Table 9. Elements of average electricity consumption intensities by end use.
CategoryV1V2V3V4V5V6
Energy consumption for heating and cooling (kWh/year)1,249,281901,726390,657390,657294,744294,744
Energy consumption for ventilation (kWh/year)46,65233,67314,63814,638904346,652
Surface to be illuminated (m2)10,83478203400340010501050
Energy consumption for lighting (kWh/year)244,905176,77276,84676,84623,73523,735
Energy consumption for IT networks and equipment (kWh/year)23,32616,8367319731945214521
Other energy consumption (kWh/year)209,922151,52165,86965,86940,69040,690
Total energy consumption for building maintenance (kWh/year)1,774,0861,280,528555,329555,329372,733372,733
Table 10. Expenditure for warehouse system elements (EUR).
ParametersV1V2V3V4V5V6
Transport equipment 277,200240,000360,800430,5491,208,4001,257,783
Building3,768,4292,720,0371,576,9031,576,9031,057,3291,057,329
Rack system472,500472,500850,500850,500850,500850,500
Warehouse control system200,000200,000200,000200,000300,000300,000
Total4,718,1293,632,5372,988,2033,057,9523,416,2293,465,613
Table 11. Operational costs of warehouse system (EUR/year).
ParametersV1V2V3V4V5V6
Human labor 197,217184,696175,304118,957112,69656,348
Equipment maintenance 138,80837,20062,65675,400169,176178,661
Energy for transport equipment20,51310,52317,74925,00613,56518,248
WMS maintenance30,00030,00030,00030,00045,00045,000
Rack system maintenance23,62523,62542,52542,52542,52542,525
Building maintenance 194,21168,00139,42339,42326,43326,433
Energy for building239,837173,11475,07575,07550,39050,390
Total644,211527,159442,732406,386459,785417,605
Share of energy in total cost40.4%34.8%21.0%24.6%13.9%16.4%
Automation index36%35%47%59%71%83%
1 Without the cost of energy.
Table 12. Annual energy consumption and production in warehouse system (kWh/year).
ParametersV1V2V3V4V5V6
Transport equipment151,73277,837131,287184,971100,339134,982
Heating and cooling1,249,281901,726390,657390,657294,744294,744
Ventilation46,65233,67314,63814,6389 0439 043
Lighting244,905176,77276,84676,84623,73523,735
IT network and equipment23,32616,8367319731945214521
Other209,922151,52165,86965,86940,69040,690
Total energy consumption1,925,8181,358,365686,616740,300473,072507,715
Automation index36%35%47%59%71%83%
Energy generated by photovoltaic system1,147,140828,180360,000360,000222,480222,480
Publisher’s Note: MDPI stays neutral with regard to jurisdictional claims in published maps and institutional affiliations.

