1. Introduction
High efficiency Cu(In,Ga)Se
2 (CIGS) solar cells are always achieved by incorporating small amount of sodium (Na) into the CIGS film to improve open-circuit voltage and fill factor [
1]. molybdenum (Mo) coated soda-lime glass (SLG) is a common substrate used for CIGS solar cells. SLG acts as a source of Na and the Mo thin film serves as transport gate for Na diffusion from the SLG into the CIGS. On the other hand, Chirila et al. [
2] found that a Potassium (K) post-deposition treatment on CIGS was beneficial for its performance but, interestingly, found a depletion of Na as a result of increased K concentration. The authors argued that the exchange occurred due to an ion exchange reaction. It is, therefore, particularly important to study and understand the diffusivity of Na and K in Mo thin films and the diffusion mechanism that occurs. To this date and to the best of our knowledge, very few studies have been reported on directly characterizing the diffusion and/or providing diffusivity constants in Mo thin films [
3]. And on top of that, none of them have considered directly the grain size effect on the SIMS intensity data, which, as it will be shown later, it likely biases the measured diffusion coefficient.
Another key element to take into account for the study of alkali diffusion in Mo is oxygen. Oxygen has effectively been found to facilitate sodium diffusion through Mo and CIGS films [
3,
4,
5,
6,
7,
8] and has been used to ensure higher adhesion on flexible substrates [
9]. Using X-ray photoelectron spectroscopy (XPS) and secondary ion mass spectrometry (SIMS), researchers found oxygen content up to 30 at.% O in the films and up to 53 at.% O on the surface. Some authors noted an increased in oxygen presence with an increase of film “porosity” and hypothesized that some of the oxygen came from the Na
2O present in the glass [
8,
10]. Other researchers have purposely added oxygen to the films for a more systematic study of its effect on sodium diffusion. Zellner et al. annealed samples of SLG/Mo/CIGS in an environment of 1.33 mPa (
Torr) of oxygen to force its presence in the film [
11]. Similarly, Yoon et al. [
6] oxidized SLG/Mo/CIGS sample by annealing at 200 °C under ambient O
2 gas. On the other hand, Forest et al. [
3] added oxygen to Mo film surface by heating the piece in ambient air at 200 °C. They had a range of oxygen content on the Mo film surface from 16 at.% to 65 at.%. In all those cases, the films were already fabricated.
In this study, a constant amount of oxygen was introduced into the chamber during sputtering to ensure a more uniform oxygen content throughout the film. In contrast to the previous work on sodium diffusion in molybdenum thin films, in this work, the sodium diffusion occurs while Mo films are deposited on soda lime glass. We propose a theoretical mechanistic model and use it to provide an in-depth theoretical analysis of the sodium diffusion in molybdenum thin films that lead to the registered SIMS data. Furthermore, the effect of grain and grain boundary sizes on the SIMS data, typically used to study concentration profiles of species after a diffusion process, was investigated.
The paper is organized as follows. In
Section 2, the experimental details for fabrication of the molybdenum thin films are presented. Characterization techniques and the respective results are also discussed.
Section 3 lays out a theoretical mechanistic modeling background needed to better understand and model the process of sodium diffusion through thin films. Subsequently, in
Section 4, the diffusion numerical modeling that lead to the diffusion coefficients and details of the mathematical, numerical, and geometrical schemes for modeling such diffusion processes are described. In
Section 5, extracted diffusion coefficients and data analysis are presented. The analysis of the data examines the rate at which the molybdenum is deposited and its relation to the extent of the oxidation. This culminates in analyzing how the diffusion front for the sodium moves with respect to the film growth. To obtain a full picture, the substrate temperature and extent of oxidation are examined. Finally, conclusions are summarized in
Section 6.
2. Experimental Details and Film Characterization
Using DC magnetron sputtering with a PVD 75 system (made by Kurt J. Lesker, Pittsburg, CA, USA), Molybdenum thin films were prepared on soda lime glass (SLG) substrates by depositing for 90 min. The substrate to target distance was 15.24 cm (6 inches), and no substrate biasing was used. The depositions utilized a high purity 5.08 cm (2 inches) molybdenum sputtering target with an argon pressure of 1.33 Pa (10 mTorr) at 100 Watts. During this process, a partial pressure of oxygen compared to argon of 1/100 was introduced to facilitate sodium diffusion. Five different substrate temperatures (), and a control sample, were used to determine the effect of substrate temperature on film and diffused species behavior. The control sample was fabricated at room temperature; the other substrate temperatures used were 50 °C, 100 °C, 150 °C, 200 °C, and 250 °C.
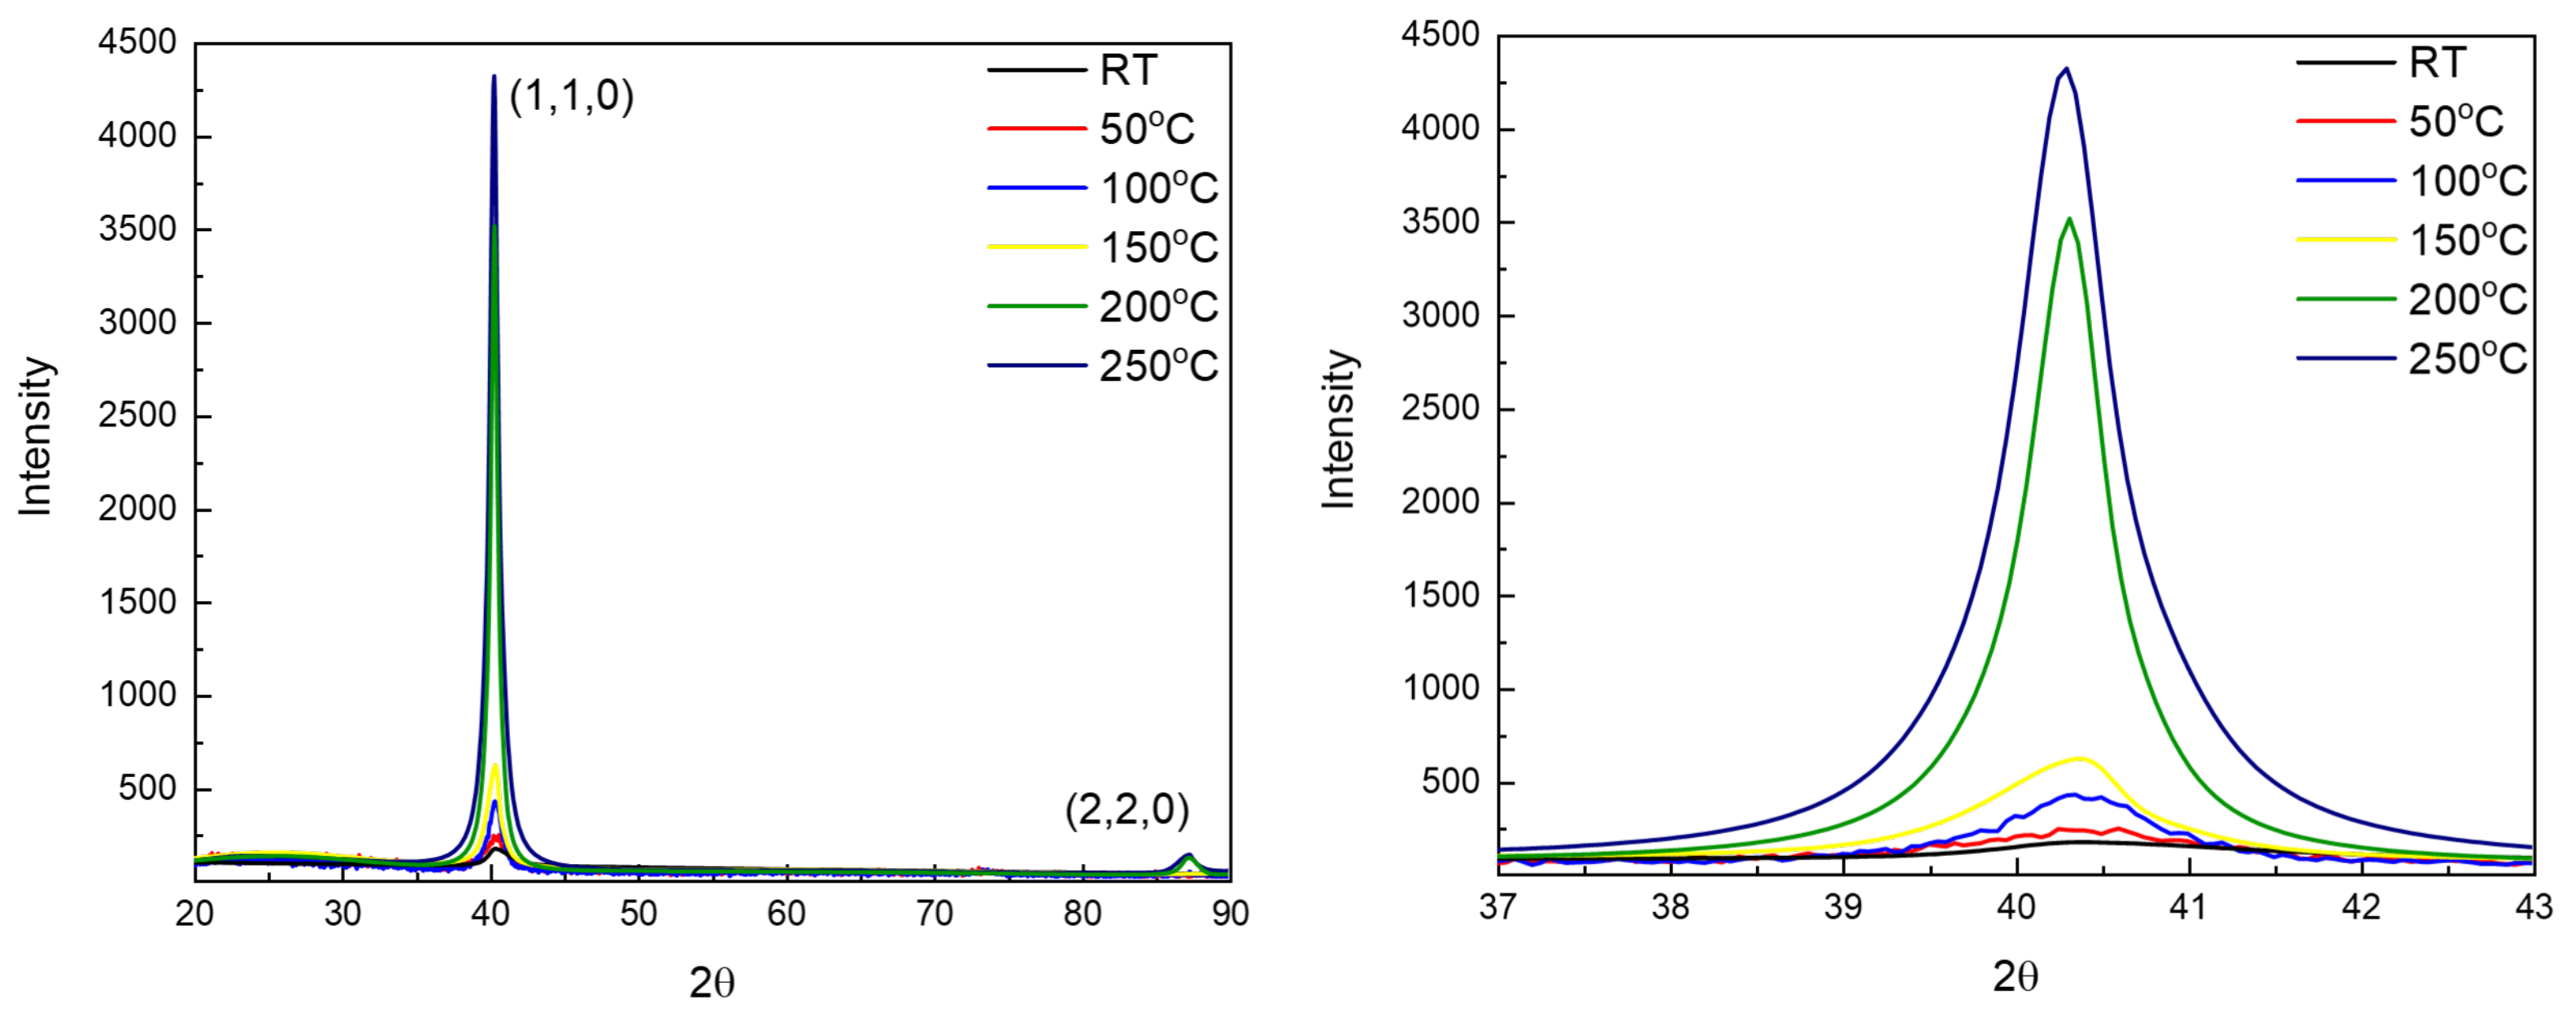
X-ray Diffraction (XRD) was performed to determine the crystal structure of the deposited films. XRD measurements were performed using a MiniFlex II Benchtop X-ray Diffractometer (made by Rigaku, Tokyo, Japan). The main goal of XRD processes was to approximate the grain size within the films; this extracted grain size is key to determine the effective sodium diffusion path in the film. To approximate the grain size, the Scherrer’s equation was used. Scherrer’s equation relates the width of the peak at its half maximum intensity to an average grain size within the film by:
where
is the grain size,
is the Bragg angle,
is the source X-ray wavelength,
is the full width at half maximum of the relevant peak, and
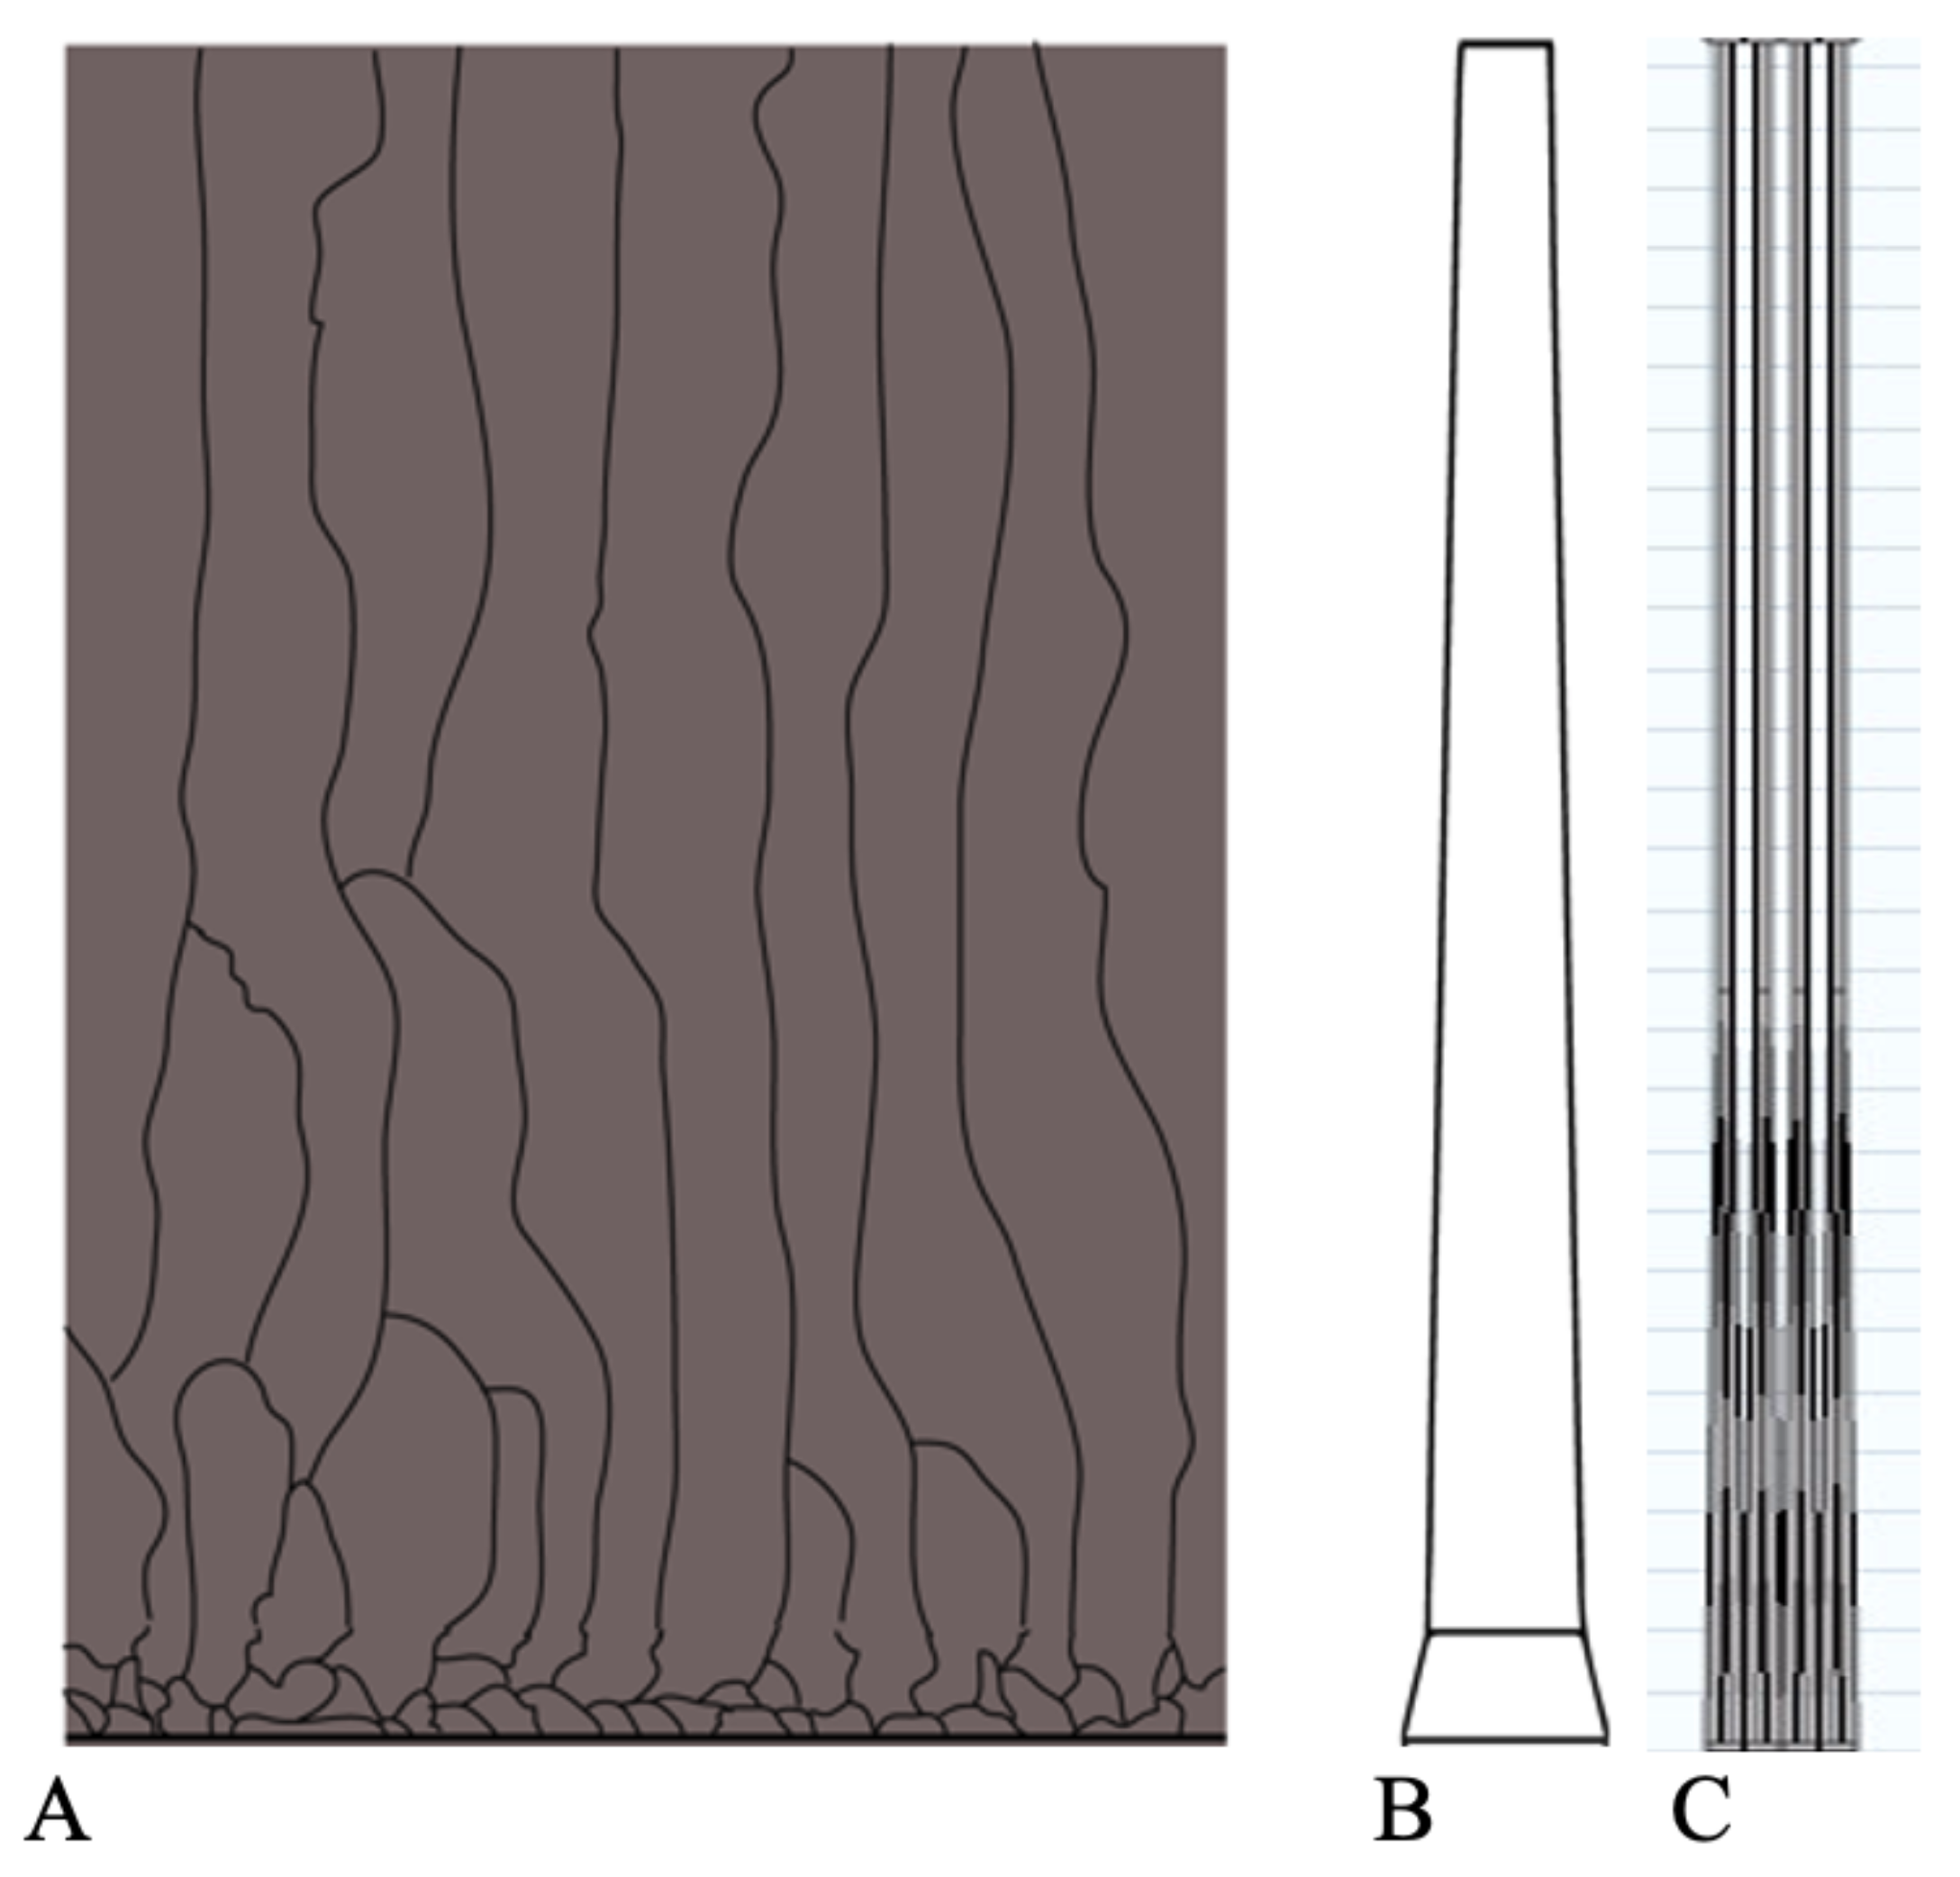
K is the shape factor. While Scherrer’s equation for determining grain size can, at times, be a poor predictor due to the relative small grain size within the molybdenum thin films and the distinct growth structure of molybdenum, it proves to be an excellent tool for determining the grain size orthogonal to the substrate. Sputtered molybdenum films grow in a columnar grain structure with a preferred (110) orientation. In
Appendix A, XRD spectra patterns for the molybdenum films deposited on SLG at different substrate temperatures for this work are shown. Scherrer’s equation explicitly provides the grain size perpendicular to the miller index, meaning that if we assume that molybdenum thin films have a columnar film structure, this grain size can be thought as the average thickness of one of the columnar grains [
12]. For this study, the average grain size
was estimated using Scherrer’s equation and using full width at half maximum extracted from
Figure A1 for each sample. The fit to the peak was done using a Split Pseudo Voigt line shape.
The film thicknesses (
h) were obtained using scanning electron microscopy (SEM). SEM measurements were performed using a JSM-6060LV system (made by JEOL, Peabody, MA, USA). The average film thickness was determined to be 500 nm, with small variations due to sputtering power and gas flow fluctuations. As far as the average grain boundary size (
) is concerned, using transmission electron microscopy, Lin et al. (1987) [
13] found it to be around 3 nm. This value was later used by Forest et al. [
3] and will be used in this manuscript.
Table 1 provides the grain sizes and film thickness for all the Mo thin film samples. It also shows the grain boundary size to grain size ratios, which are in the same range as the porosity values obtained by Bommersbach et al. [
8].
Dynamic secondary ion mass spectrometry (SIMS) was used to generate the ion profiles of sodium (Na), oxygen (O), and potassium (K) through the Mo thin films. SIMS measurements were performed using a ION TOF TOF-SIMS equipment.
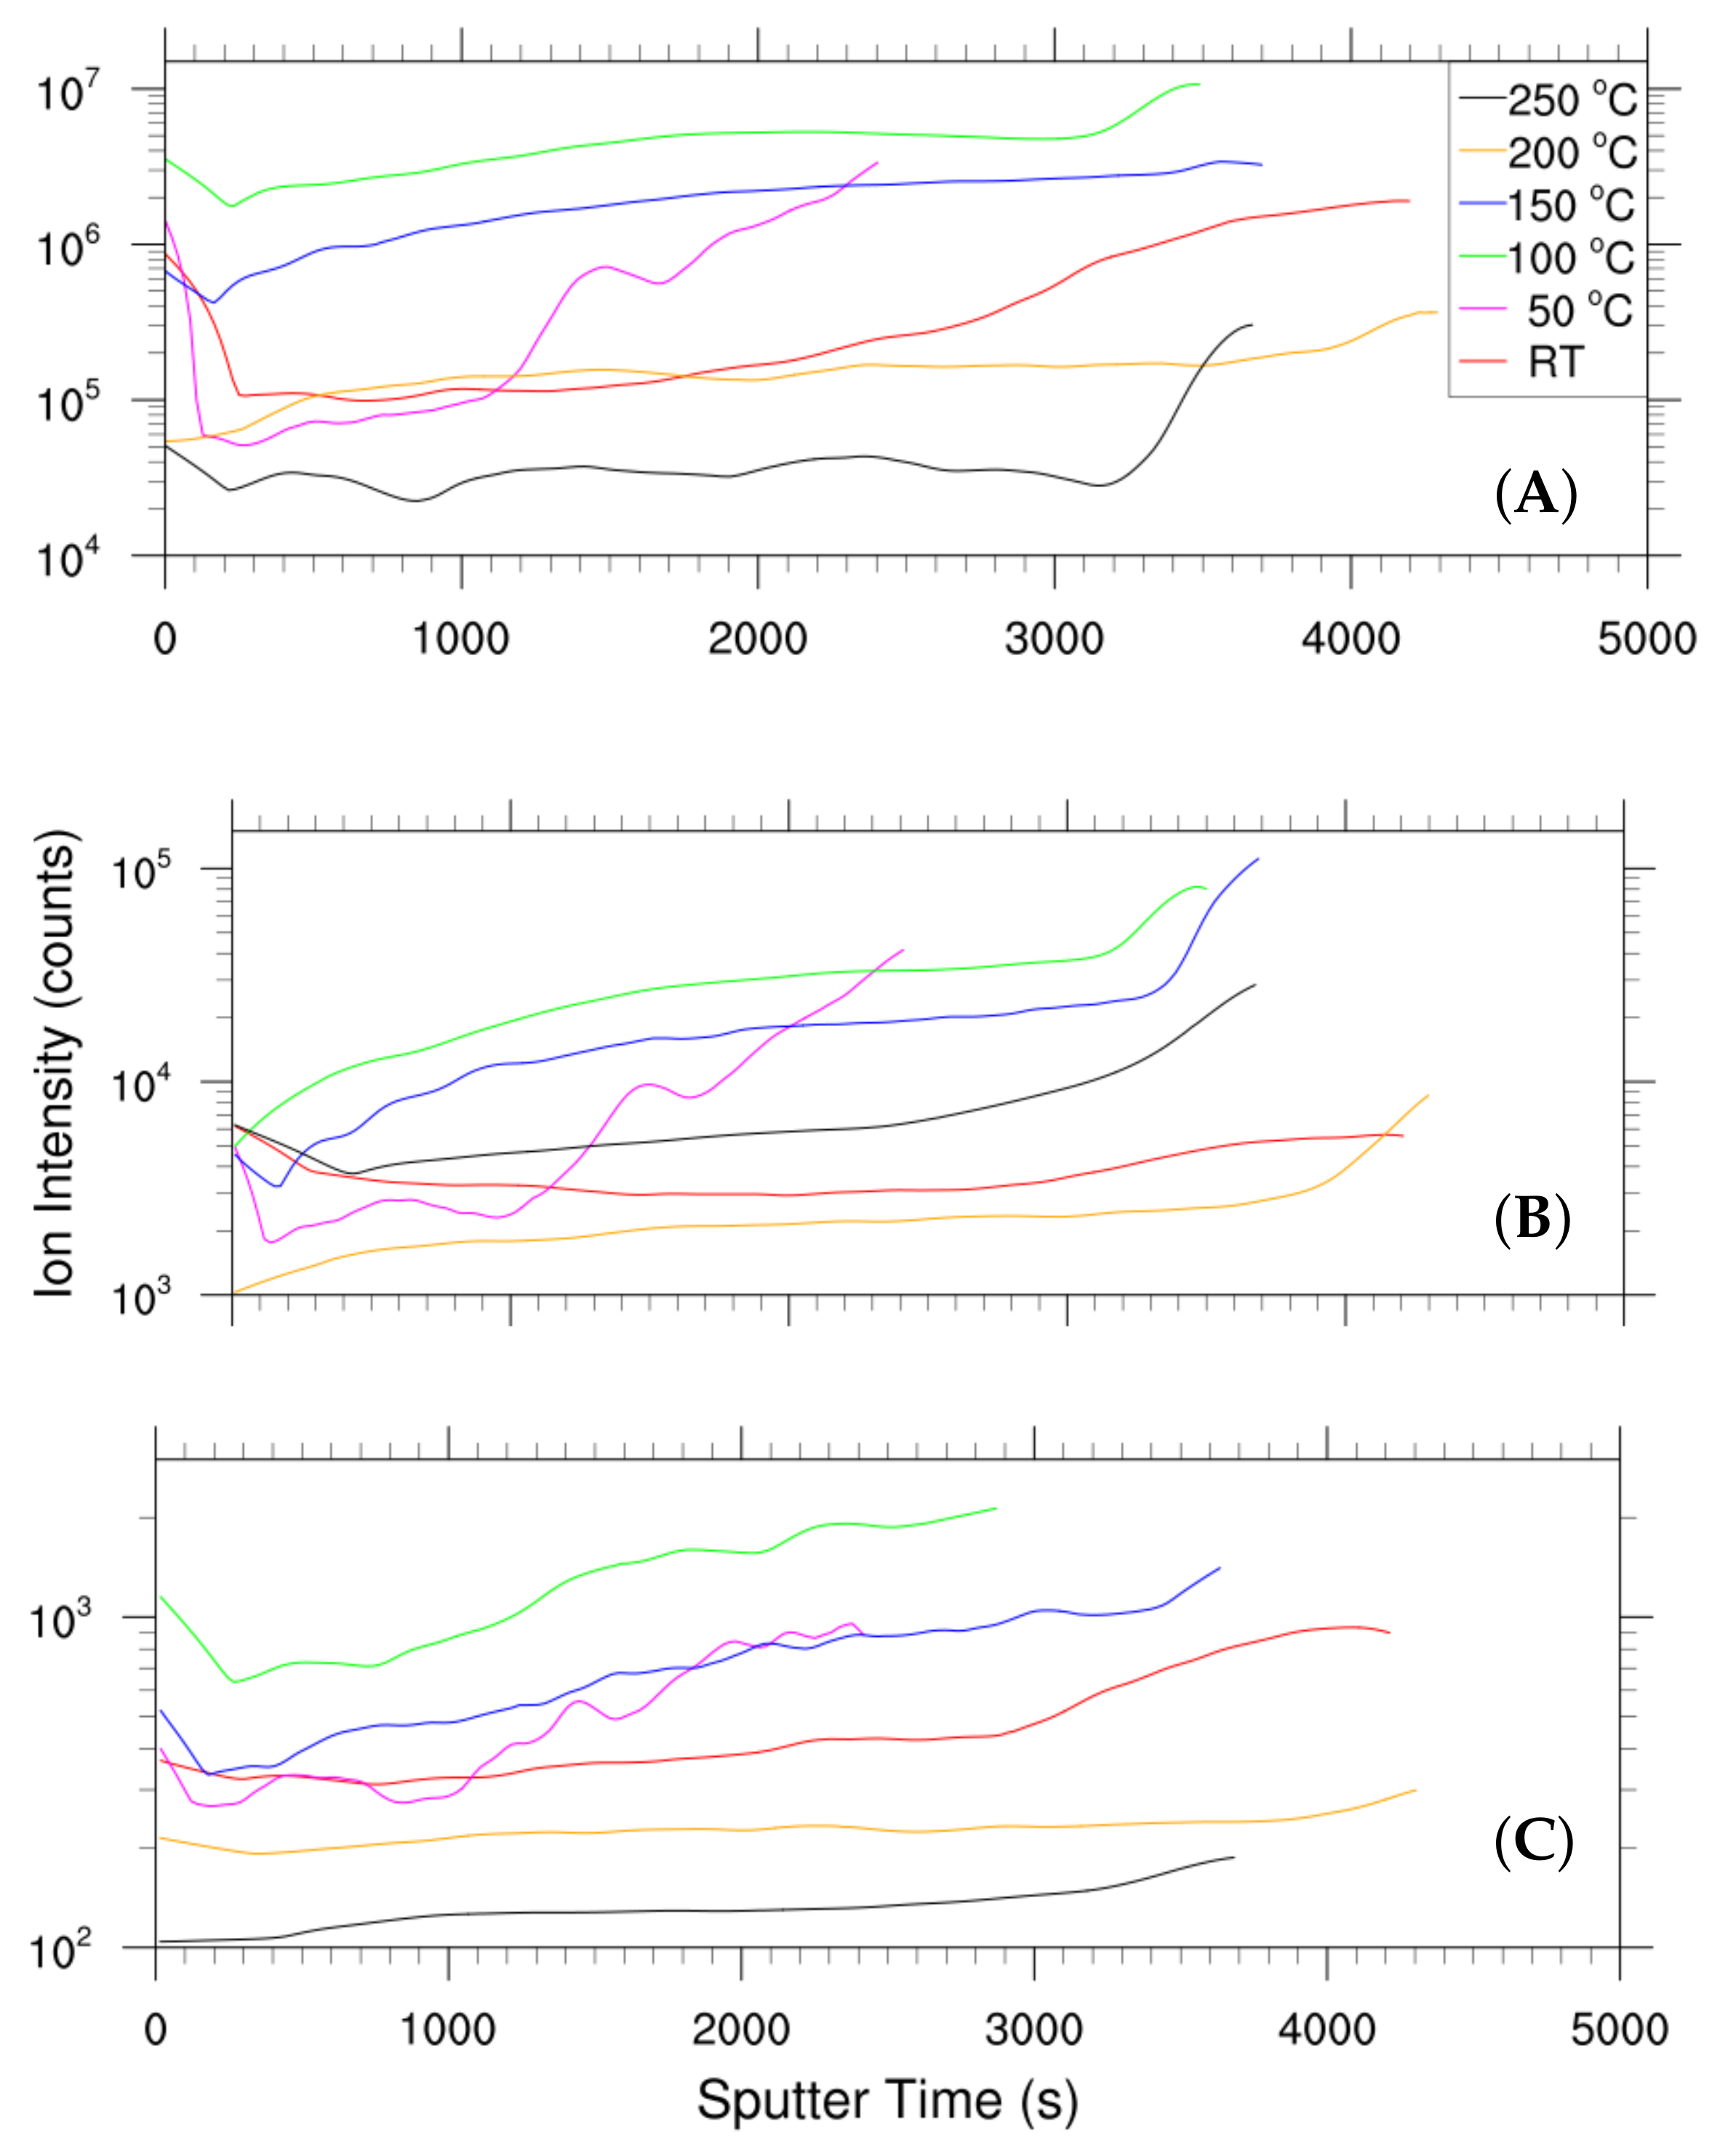
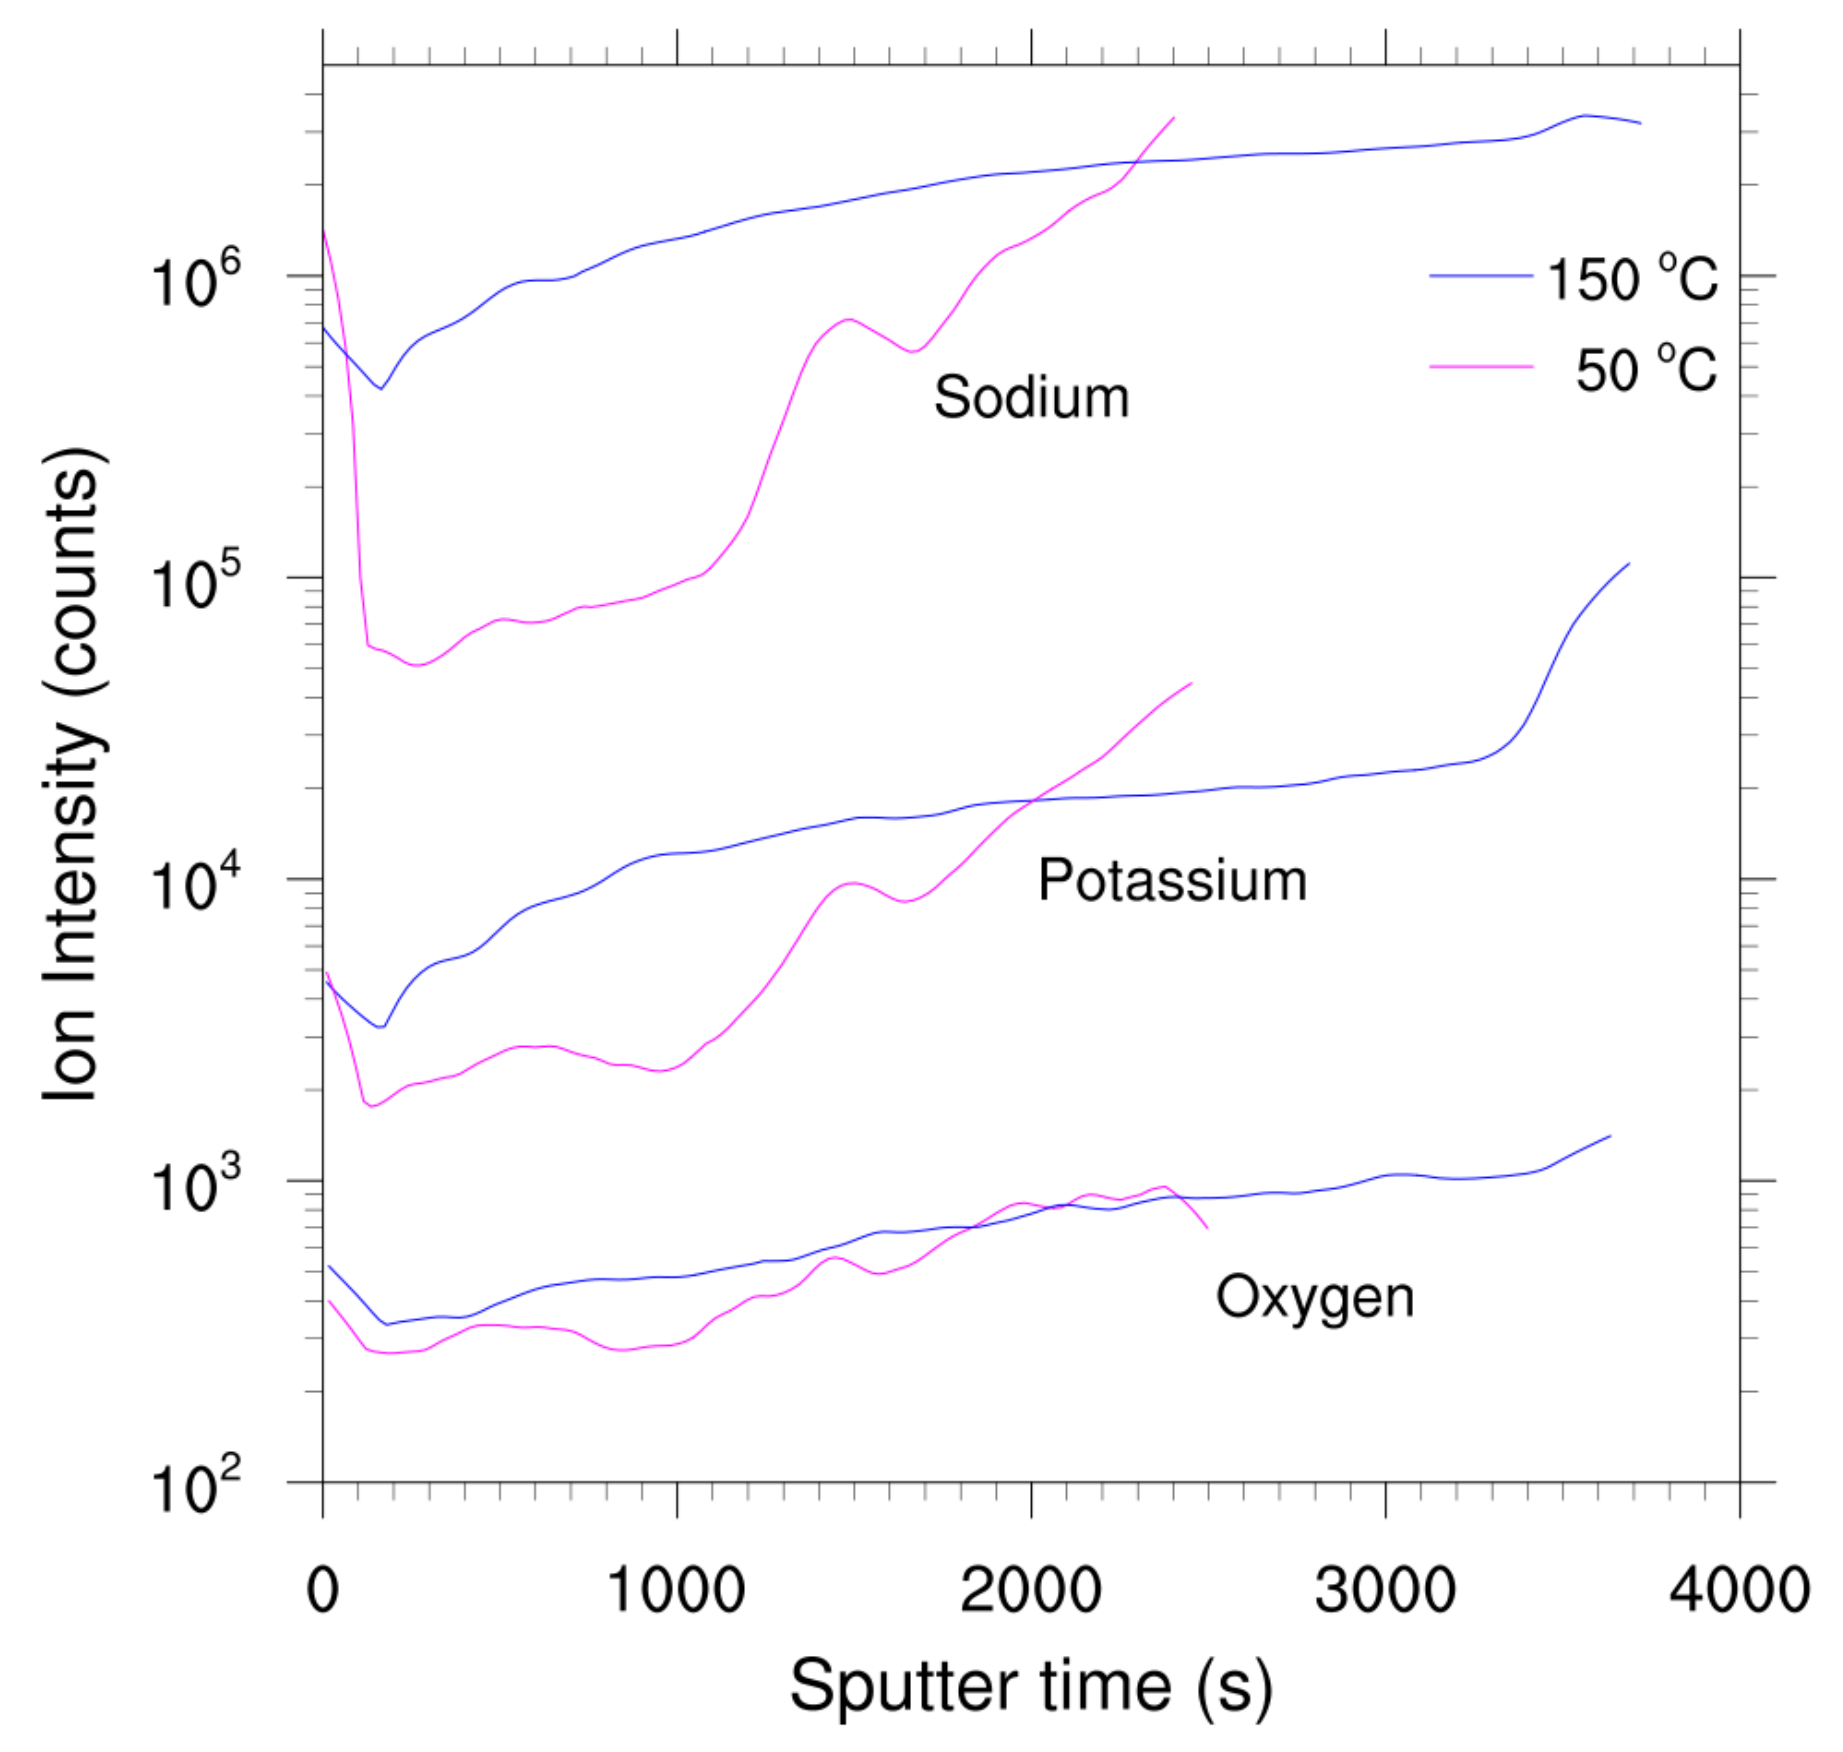
Figure 1 presents the SIMS depth profile of Na, O, and K for the films deposited at each substrate temperature. For each atomic species, the highest intensity is found to be at the Mo/SLG interface (right side of each figure). There are several reasons for that: (1) Both sodium and potassium originate from the SLG; (2) when the films are beginning to coalesce into the columnar structure, it is possible for more oxidation to occur because of the higher effective surface area of the molybdenum during the preliminary film coalescence; (3) because the matrix of material is transitioning from an oxidized molybdenum to soda lime glass, it is fairly common to see the intensity of atomic species of small concentration to build-up at such interfaces due to atomic mixing. The sputter time at the peak is related to the film thickness and it can be seen how well it correlates to the film thickness obtained from SEM (
Table 1). This paper will focus on analyzing the diffusion process of sodium diffusion only. This is mostly due to the lack of potassium within the substrate. The typical SLG contains 14 wt% Na
2O and only 0.03% K
2O. While we will not be examining the K profiles in detail, similar trends between the Na and K profiles are observed. This implies that both Na and K follow the same diffusion mechanism through the grain boundaries. A local sharp increase of the intensity is found at the Mo film surface (as sputter time approaches zero). This is the effect of the “accumulation layer” as described by Forest et al. [
3].
In addition, the resulting oxygen content in the bulk of the molybdenum thin films (after the deposition process) was monitored through the atomic percentages of oxygen detected through X-ray photoelectron spectroscopy (XPS). XPS high resolution measurements were performed using a SPECS system (made by SPECS, Berlin, Germany) with a PHOIBOS 150 Analyzer (made by SPECS, Berlin, Germany).
5. Results and Discussion
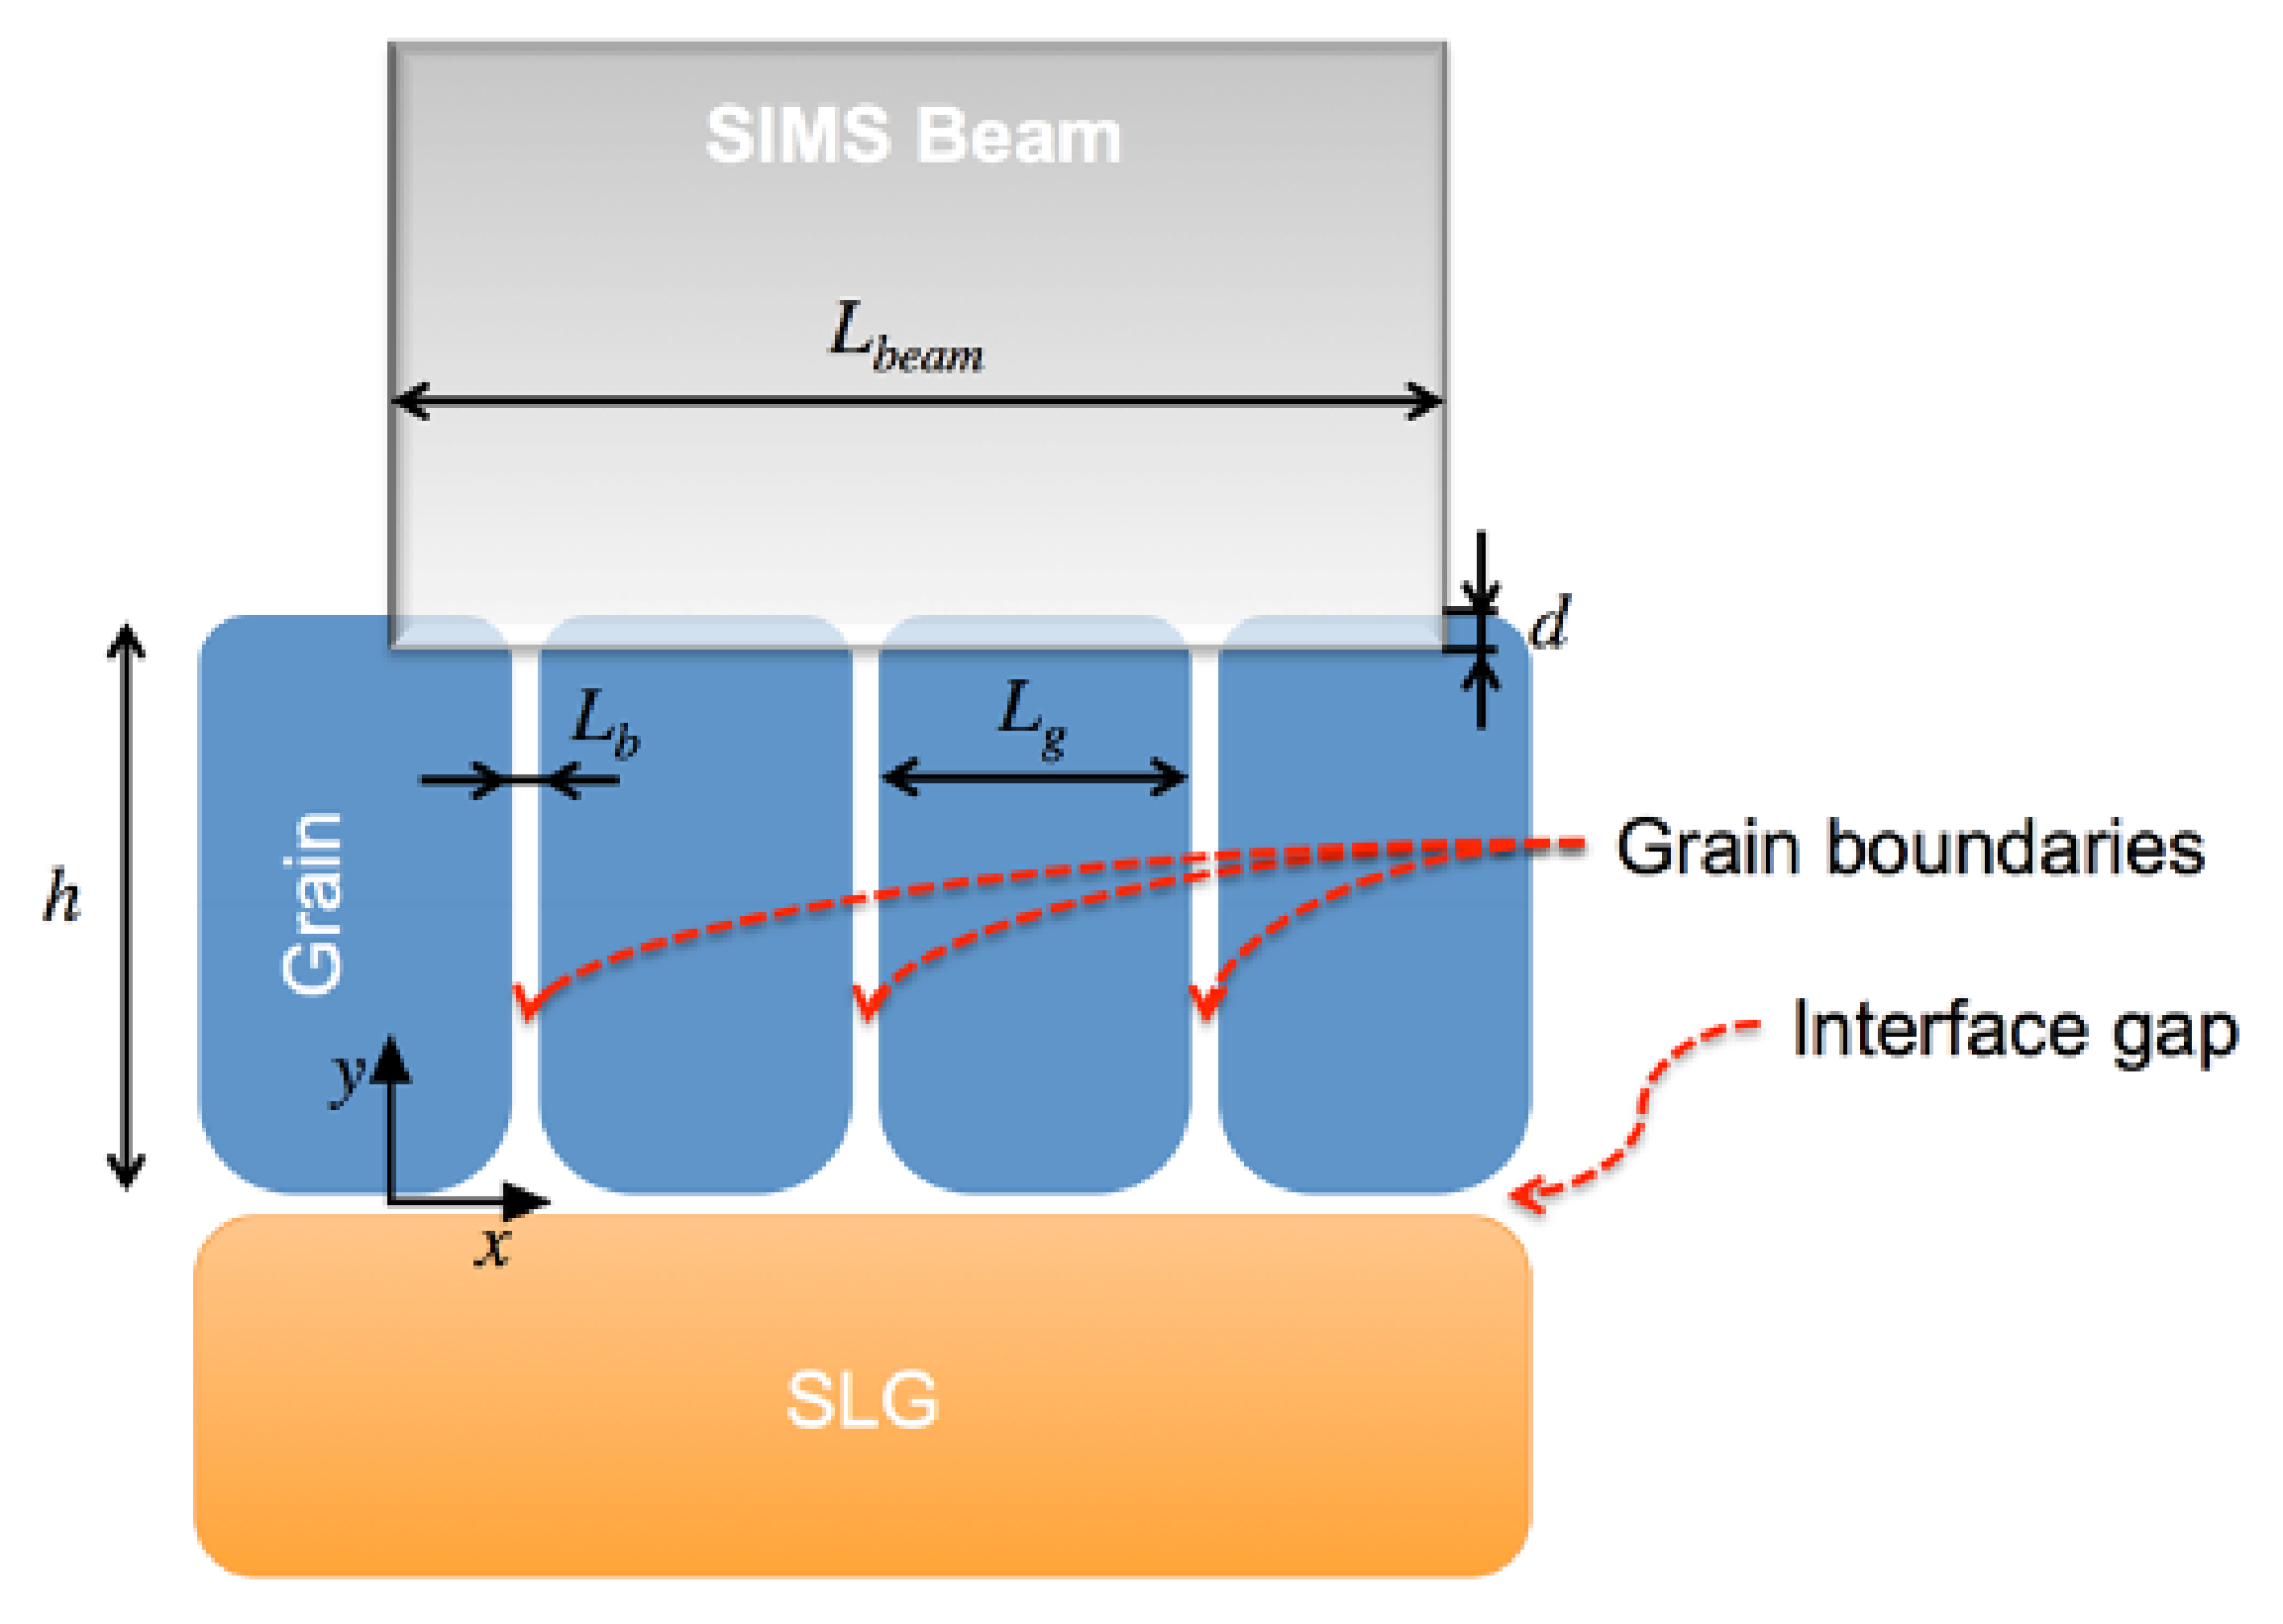
Computational diffusion modeling was performed for all the molybdenum thin films following the trial-and-error scheme to obtain the corresponding diffusion coefficients. All geometrical models were tried for all substrate temperatures. For the splitting grain boundary cases (
Figure 5C), three-way, two-way, and no split modes were tested.
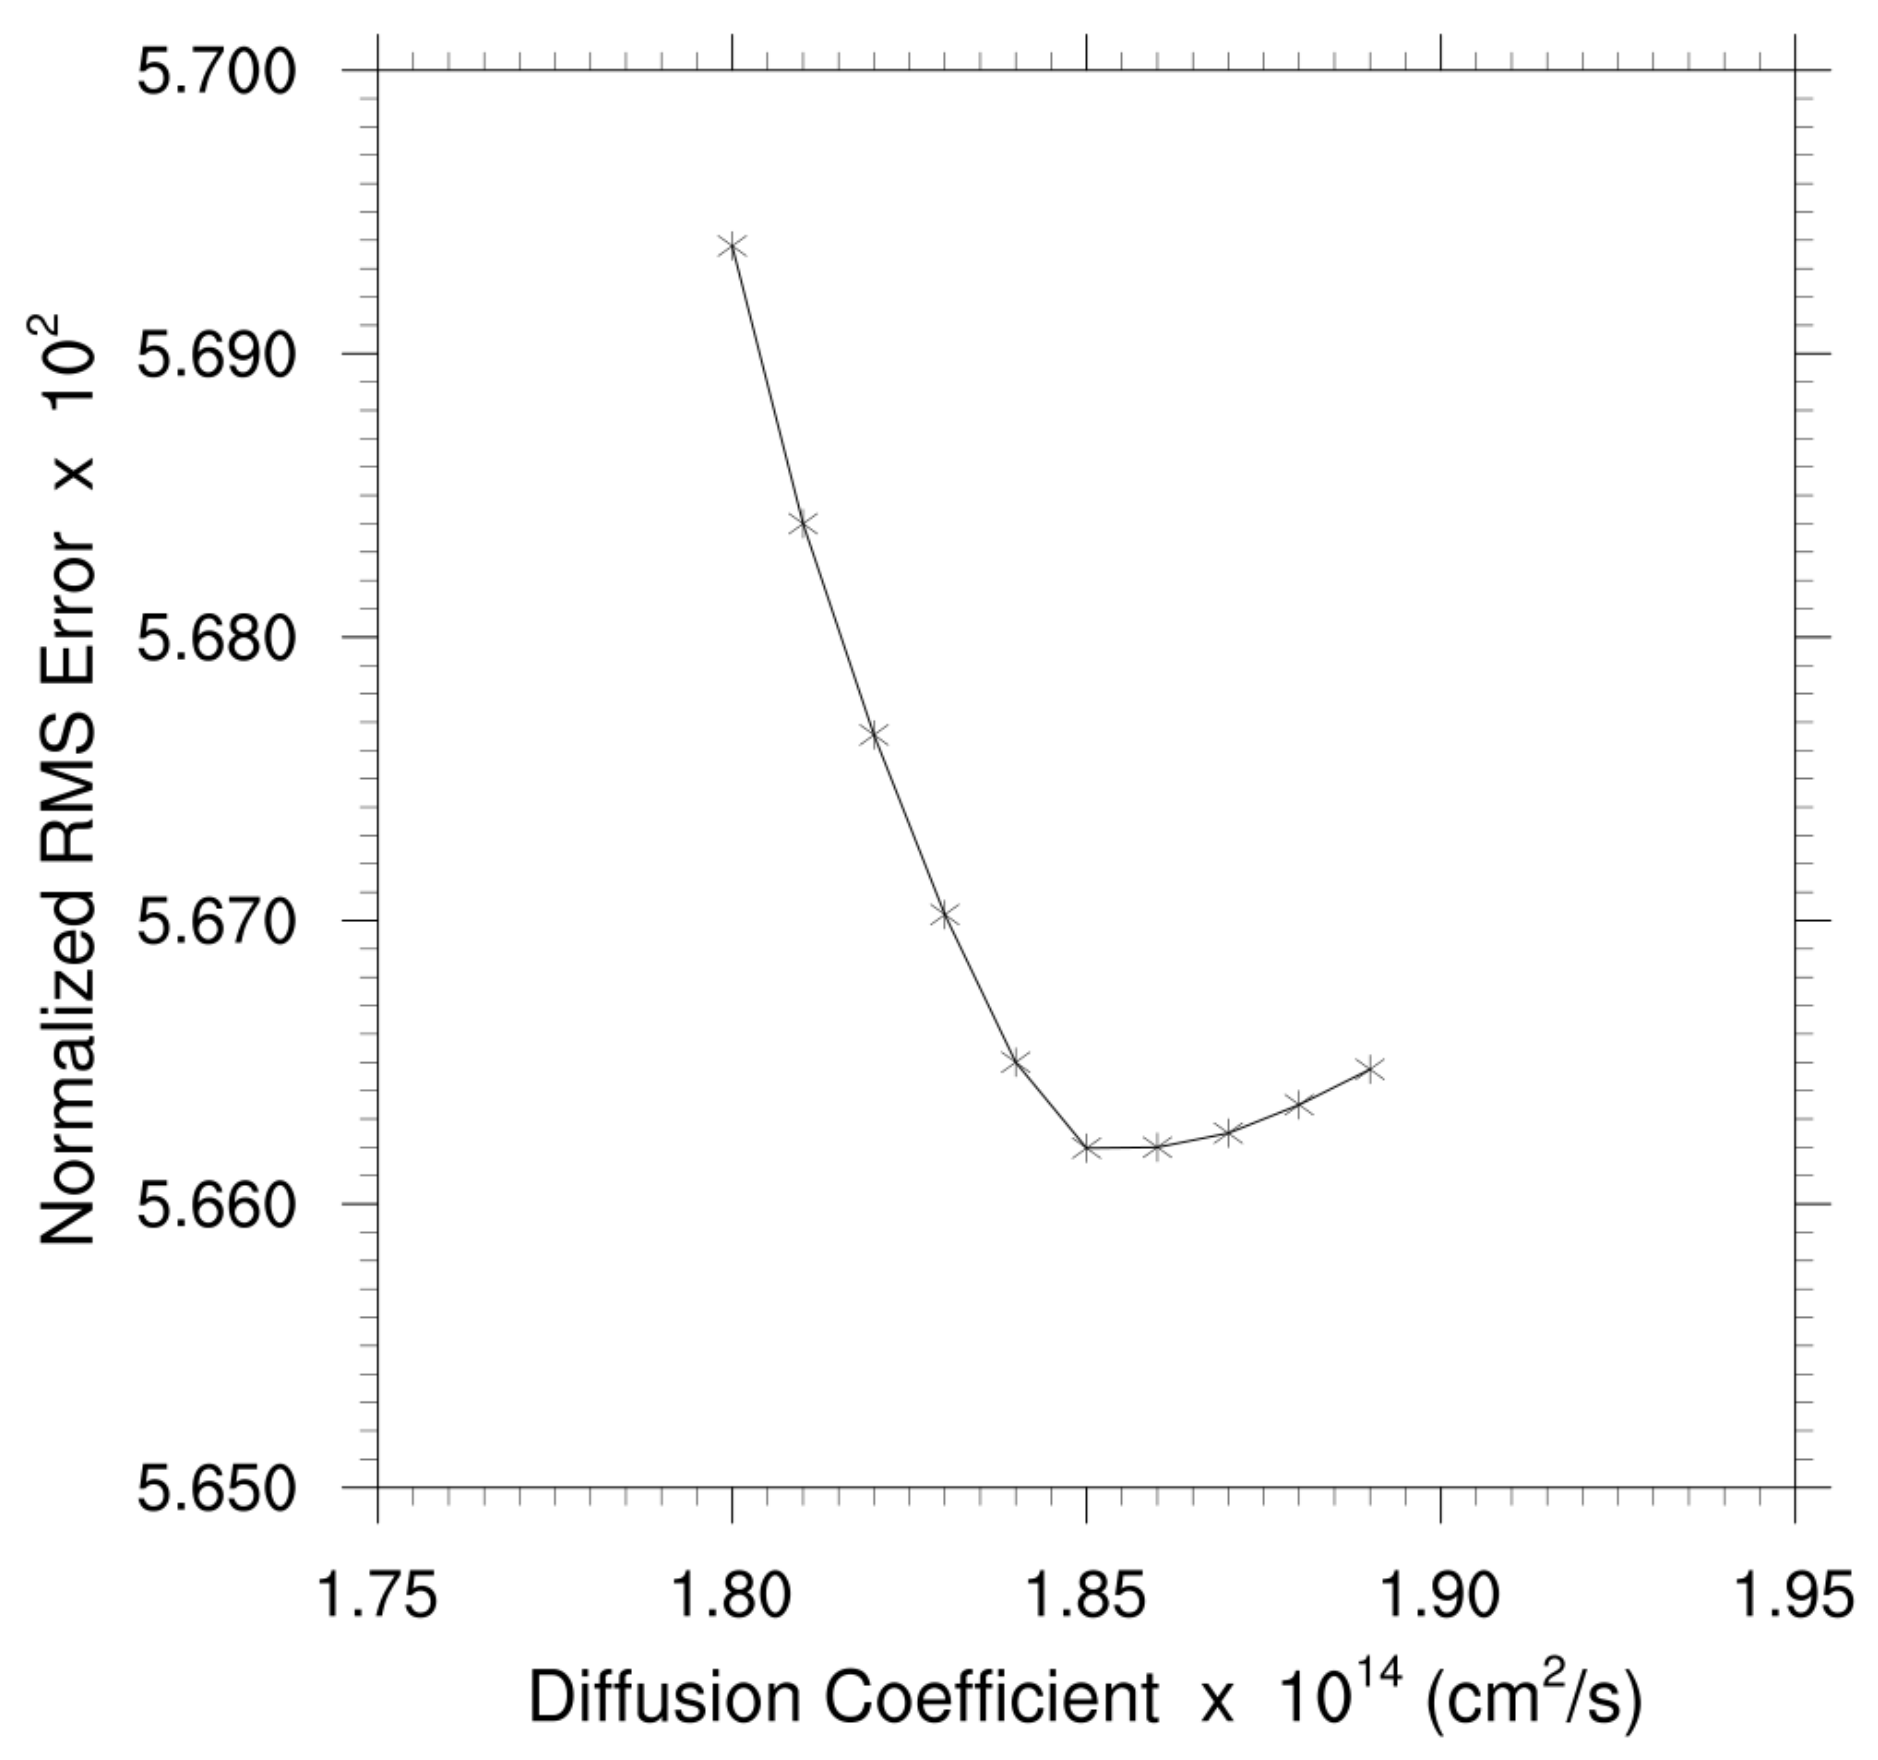
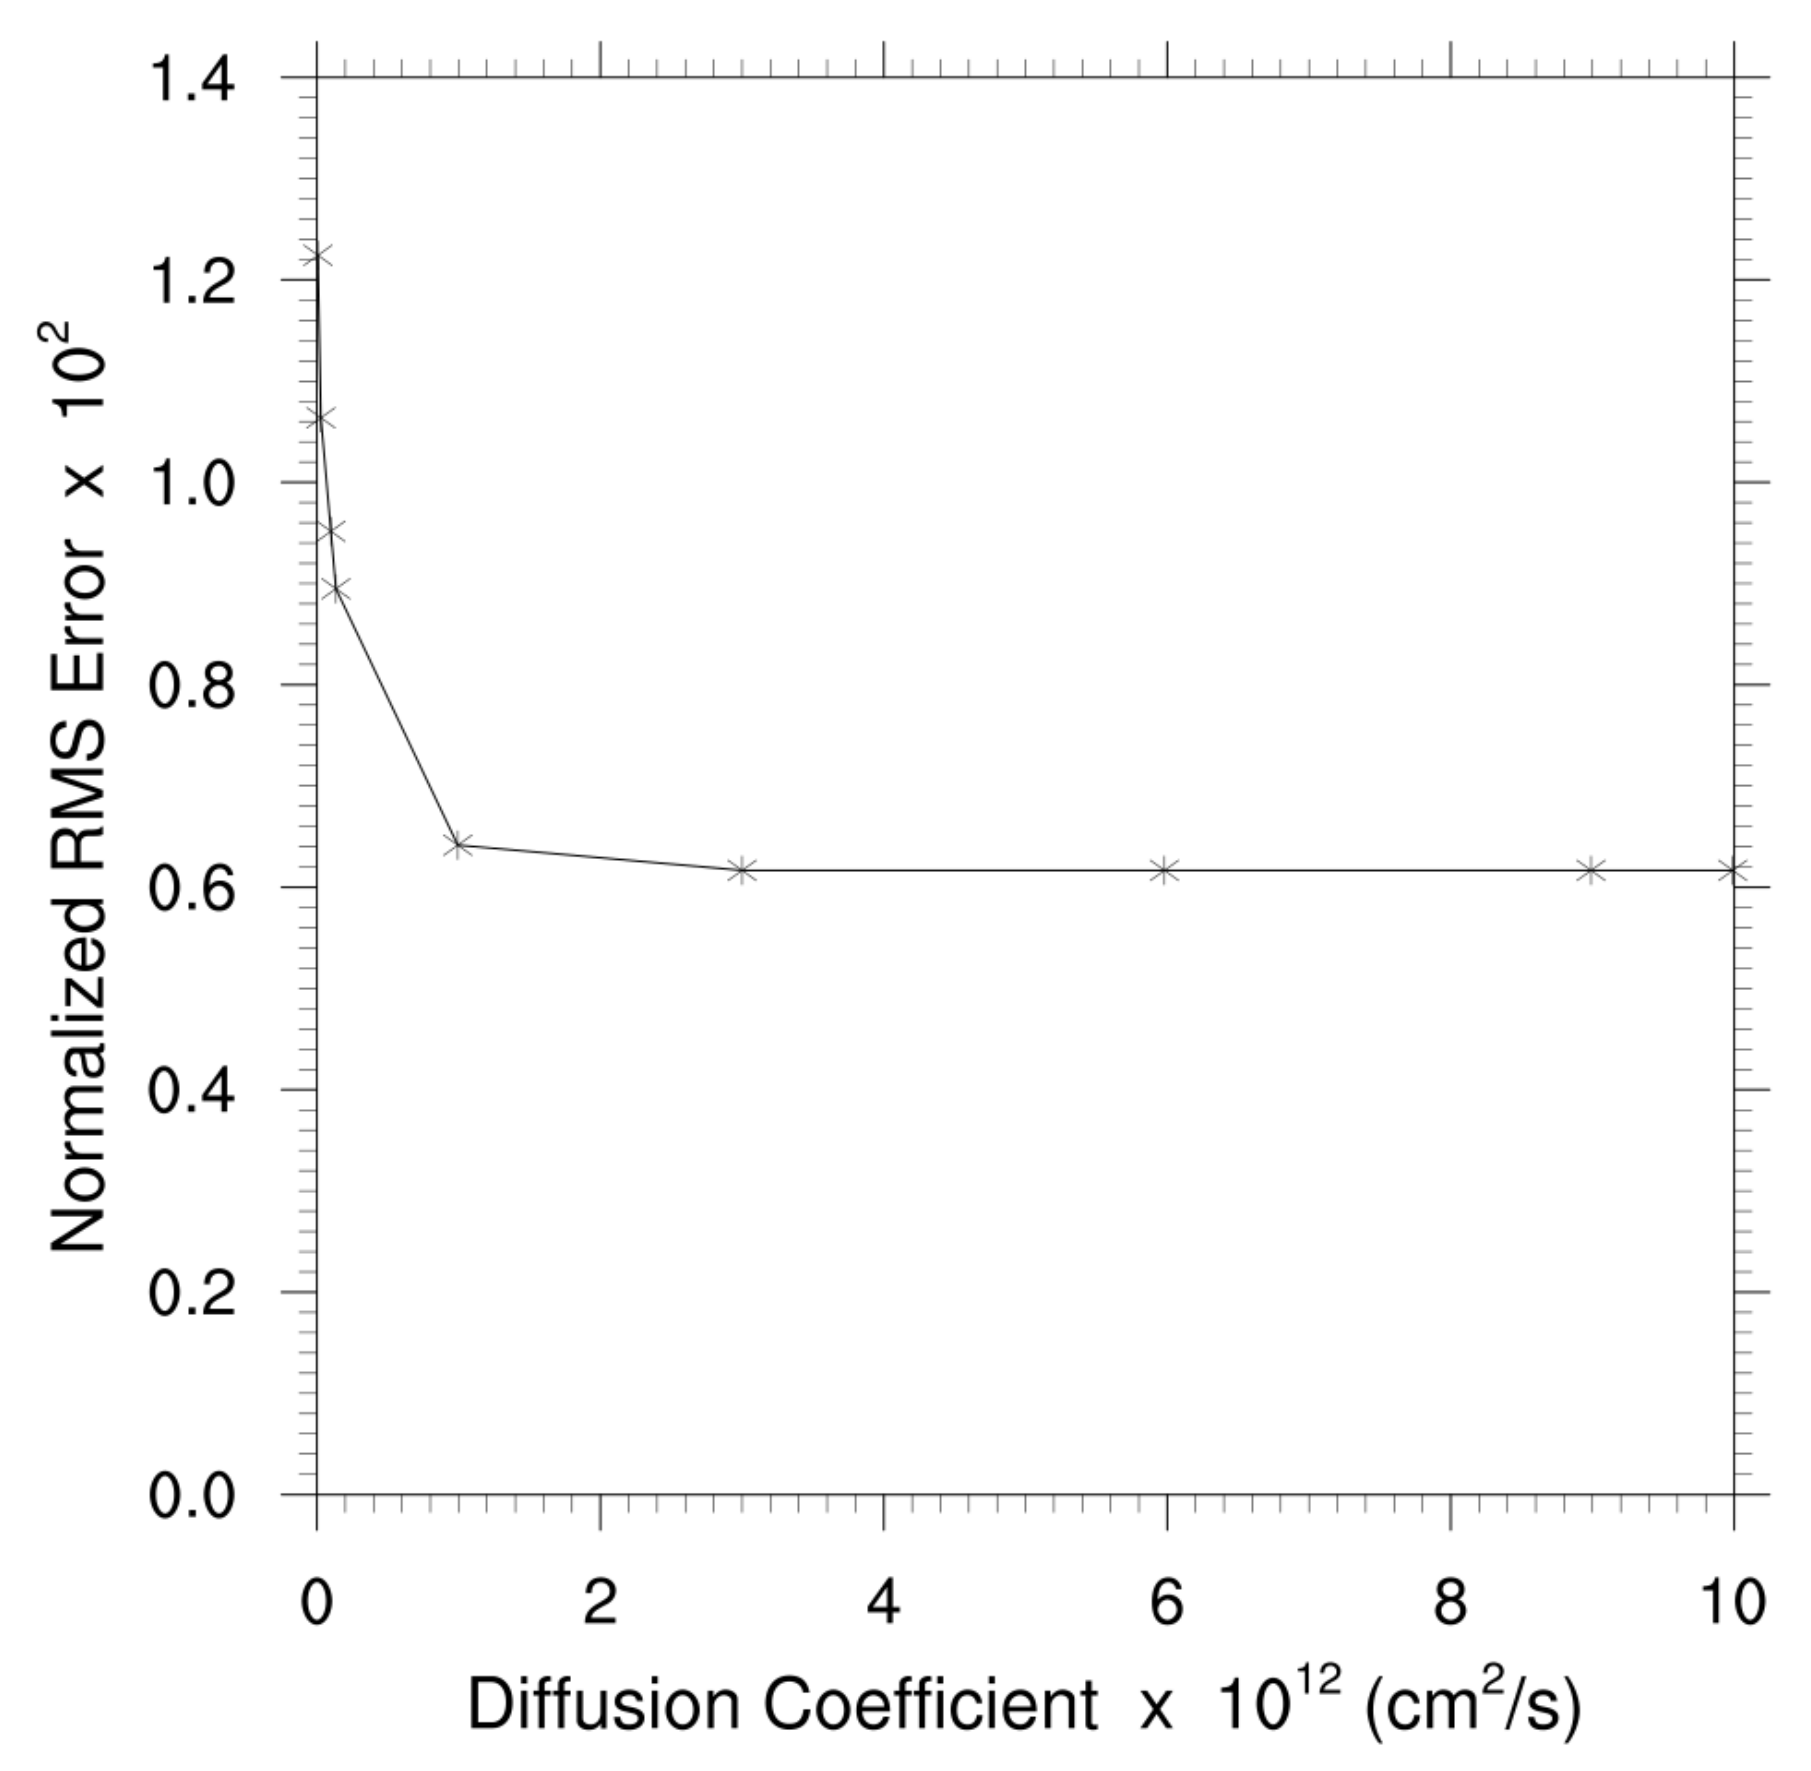
Figure 7 shows the RMS error obtained in the trial-and-error scheme for the thin film deposited at room temperature with grain boundary split in two. The minimum error was observed at a diffusion coefficient of 1.85 × 10
−14 cm
2/s.
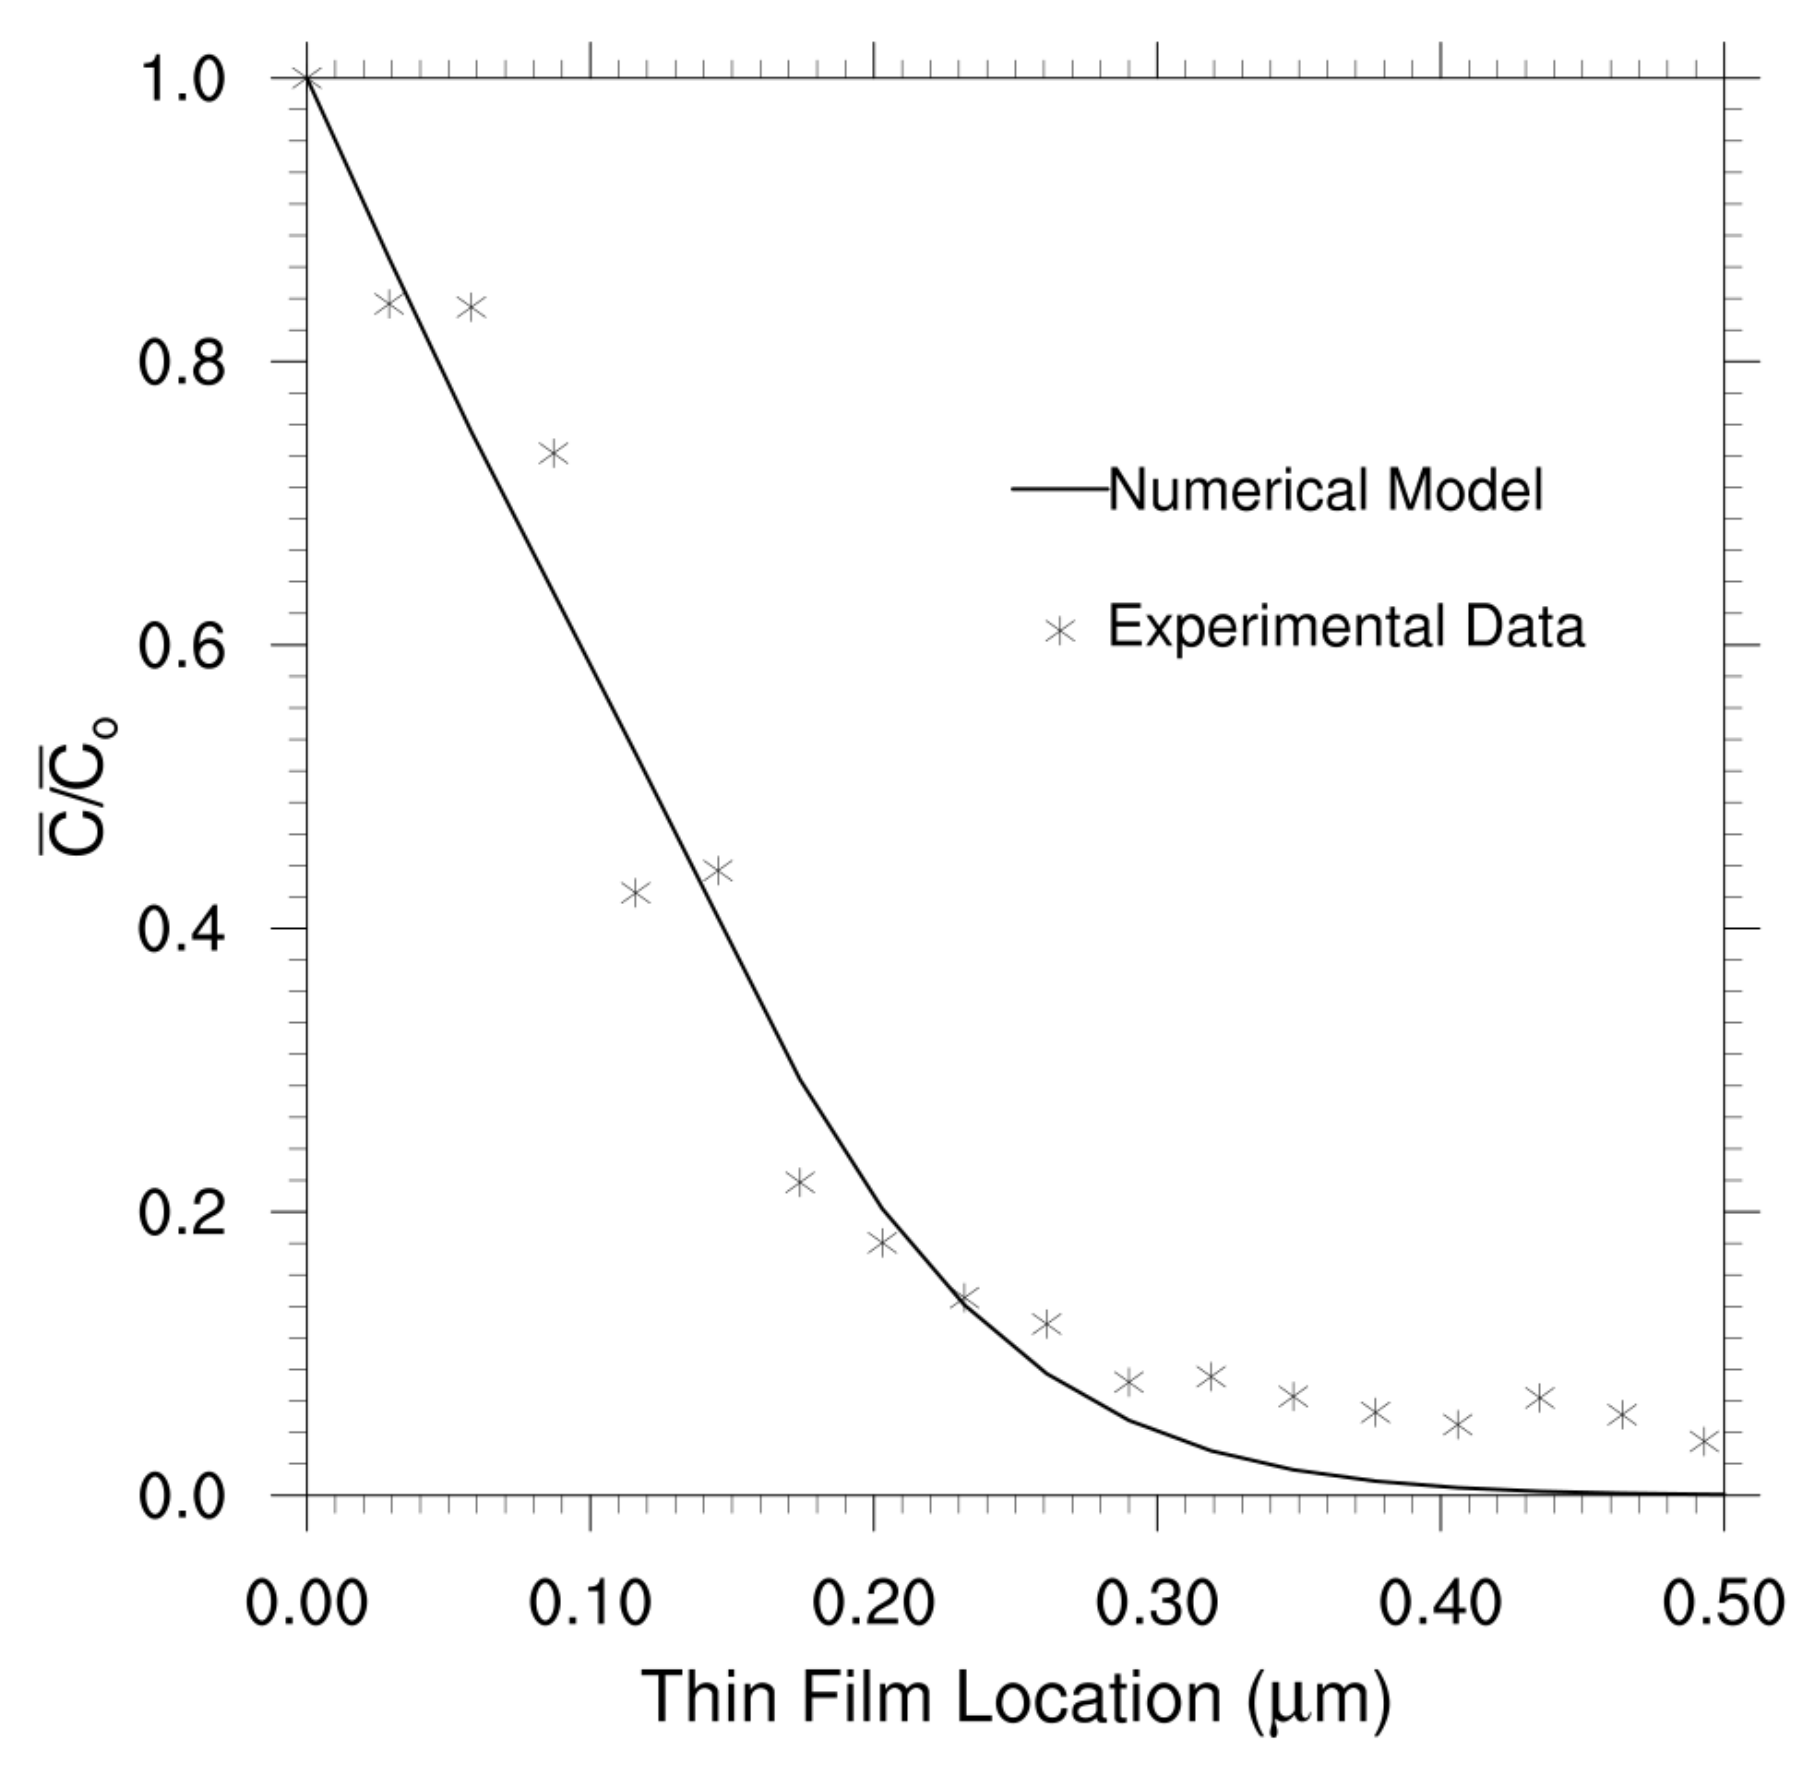
Figure 8 shows how close the simulated concentration and the normalized SIMS profiles are.
For the substrate temperature cases of 100 °C, 150 °C, 200 °C, and 250 °C, it was not possible to get a minimum root-mean-square (RMS) error (see
Figure 9). This can only happen if the film is fully saturated with sodium at the end of the deposition. Because either partial or full saturation occurs during the deposition process, it is not possible to discern the diffusivity of sodium through molybdenum grain boundaries with the experimental data. More on this will be discussed later.
Table 2 presents all diffusion coefficients for RT and 50 °C cases for different geometrical models. The case of multiple simple grain boundaries with three ways split near interface was not realized for RT because it was not geometrically feasible (the 3 nm grain boundaries would overlap). Analyzing all the values, it can be noted that there is no major effect of the actual geometrical model near the interface on the diffusion coefficients. All diffusion coefficients are reasonable when compare to the ones found in the literature [
3]. They reported larger values in the order of 10
−12 and 10
−13 cm
2/s, but they are for higher temperatures of 300 to 400 °C. The temperature dependence of a diffusion coefficient typically follows an Arrhenius type relation:
where
is the apparent activation energy for grain boundary diffusion, and
is the pre-exponential factor. Diffusion coefficients increase with temperature. One important observation from
Table 2 is the diffusion coefficient for 50 °C is counter-intuitively lower than the one for RT. We must consider that there are unavoidable experimental uncertainties during the film growth, which could lead to a diffusion path different to the one our model predicts; and during SIMS, which could lead to a biased experimental intensity (concentration) profile.
Having only two diffusion coefficients at two different temperatures is not enough to get a statistically acceptable activation energy. Some authors have reported values of 117 kJ/mol [
3] and 40 kJ/mol [
11]. Assuming that the diffusion mechanism in previous work is the same as in this work and that the activation energy does not depend on the oxygen content, we could use those activation energy values. The oxygen content should not affect the activation energy, but it could affect the pre-exponential factor in Arrhenius expression.
With those reported activation energies and our diffusion coefficients at RT and 50 °C, we obtained the pre-exponential factors: 8.27 × 10
5 cm
2/s using
from Reference [
3], and 1.87 × 10
−8 cm
2/s using
from Reference [
11].
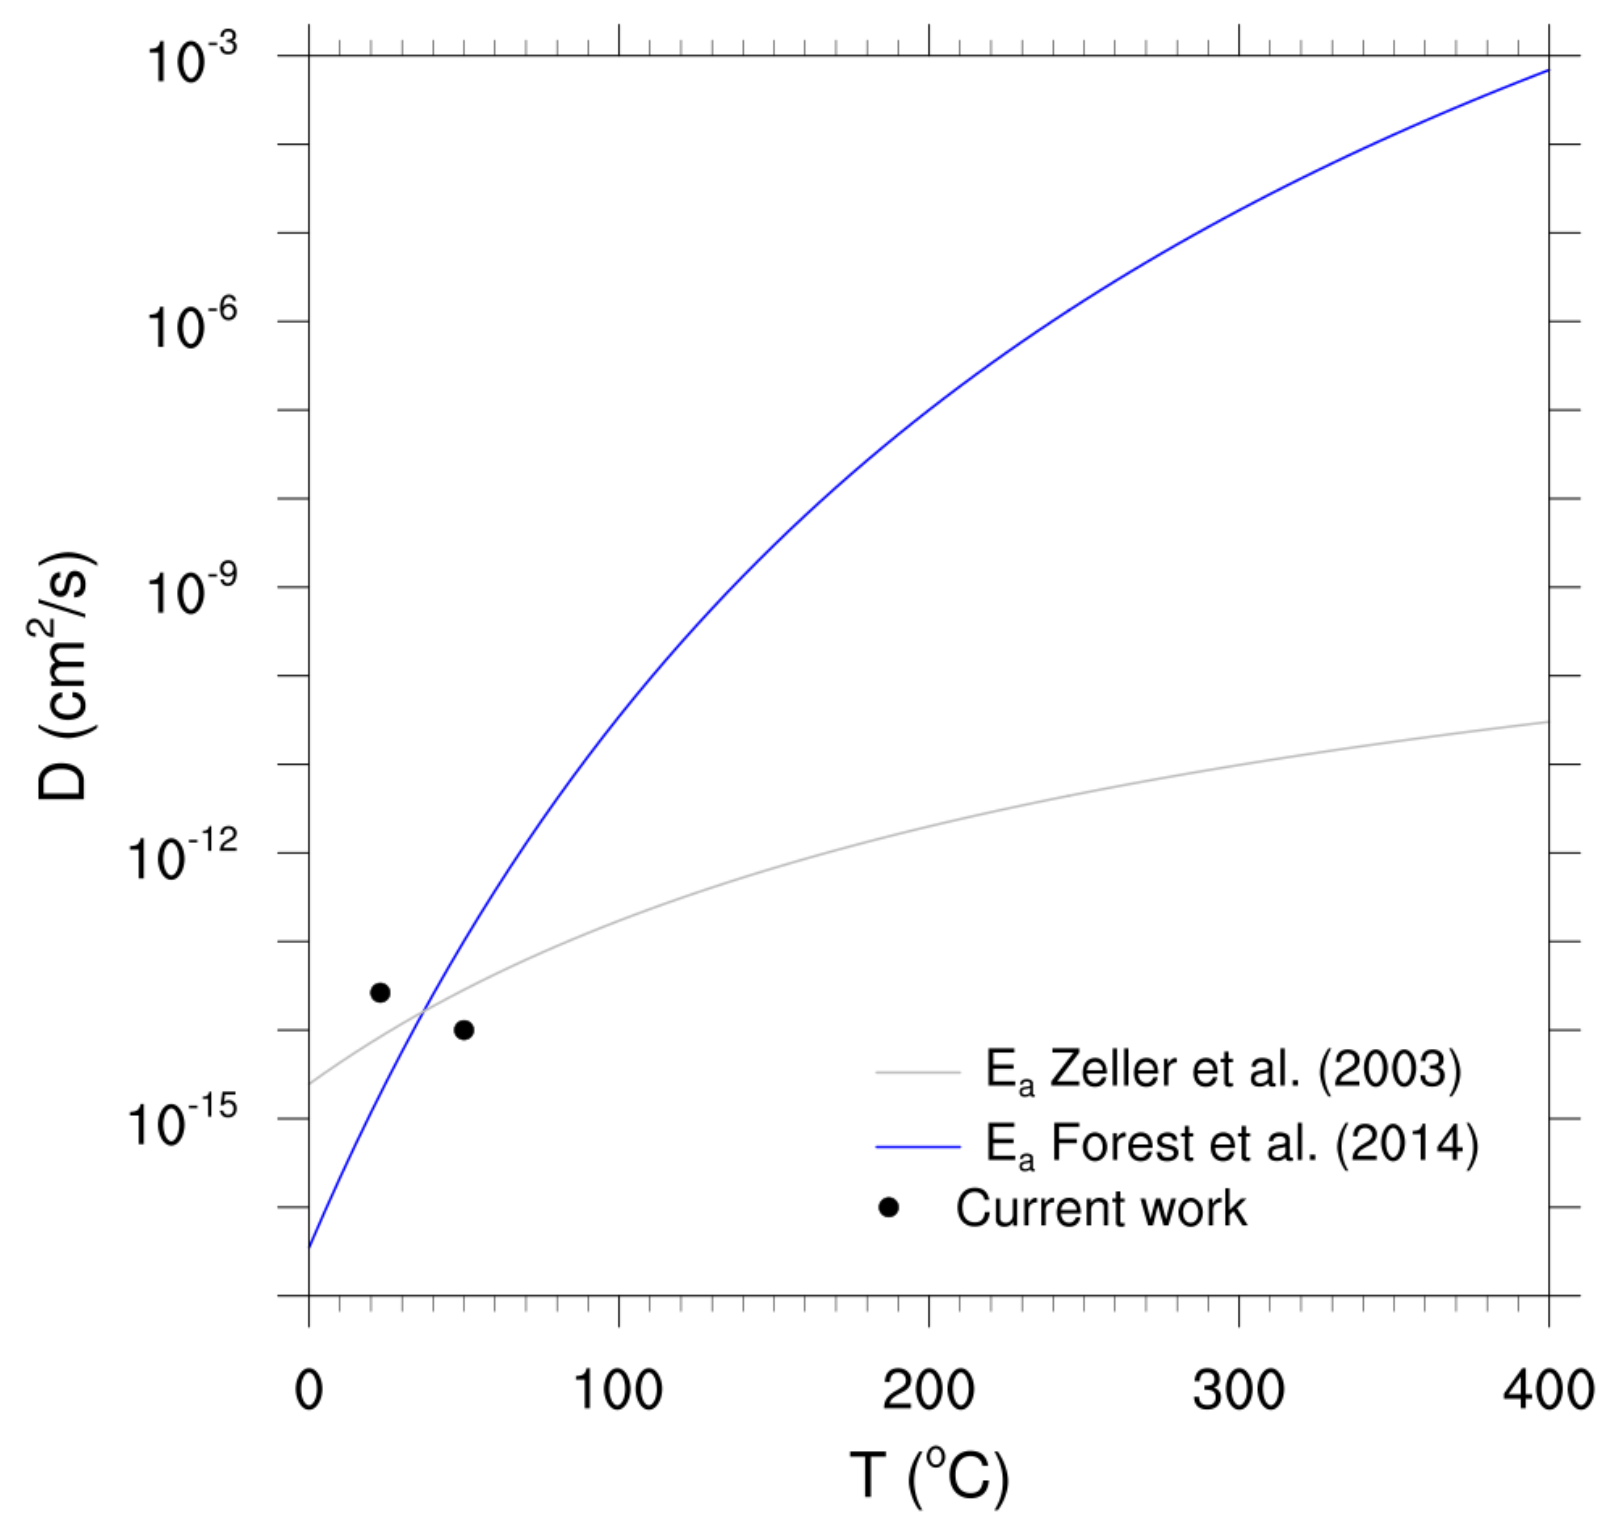
Figure 10 shows the Arrhenius theoretical curves using both sets of activation energy and pre-exponential factor. The lower activation energy from Reference [
11] seems to better predict the diffusion coefficient for a couple of reasons. First, the pre-exponential factor represents the diffusion coefficient at extremely large temperatures. The one using
from Reference [
3] seems to be extremely large while the other is more reasonable. Second, the diffusion coefficient theoretical prediction is closer to the experimental values when
from Reference [
11] is used, and third, the predicted diffusion coefficients at the range temperature of 300 °C and 400 °C are in the order of 10
−11 cm
2/s, which is closer to the values reported in Reference [
3]. Our prediction is still larger but the oxygen content is larger in our case. We will, therefore, adopt the activation energy found by Reference [
11] for this work.
While diffusion coefficients could not be easily extracted from the higher temperature films due to their pseudo-saturated behavior, the methodology used to form the proposed diffusion profiles still showed consistent results. The dimensional reduction techniques used further facilitate the validity of these techniques for dimensionality reduction of columnar thin films.
5.1. Oxygen Content
As mentioned in the experimental section, oxygen was intentionally and continuously provided in the chamber during deposition; thus, the grain boundaries should be saturated with oxygen. The question is whether the oxygen could also be within the Mo grain. The oxidation of molybdenum has been as subject of various studies. For example, Gulbransen et al. proposed an Arrhenius type of equation for Mo oxidation rate under chemical control (no transport process control) [
19]. They proposed the following equation:
where
is the rate of reaction in [atoms/cm
2/s]. With the use of molybdenum density and molecular weight, and Avogadro number, we can convert this rate of reaction to speed of oxidation (see
Table 3). For the range of substrate temperatures in this work, since the speed at which the molybdenum atoms are stacked to form the grain is 1 to 8 orders of magnitude faster than the speed of any molybdenum oxide to form, it is highly unlikely that molybdenum oxide gets formed within the grain. However, molybdenum atoms are still exposed to oxygen at the grain boundaries, where oxidation continues. We, therefore, conclude that the oxygen is not within the molybdenum grain but only at the grain boundaries. Thus, the oxygen SIMS profiles should also follow Equation (
3).
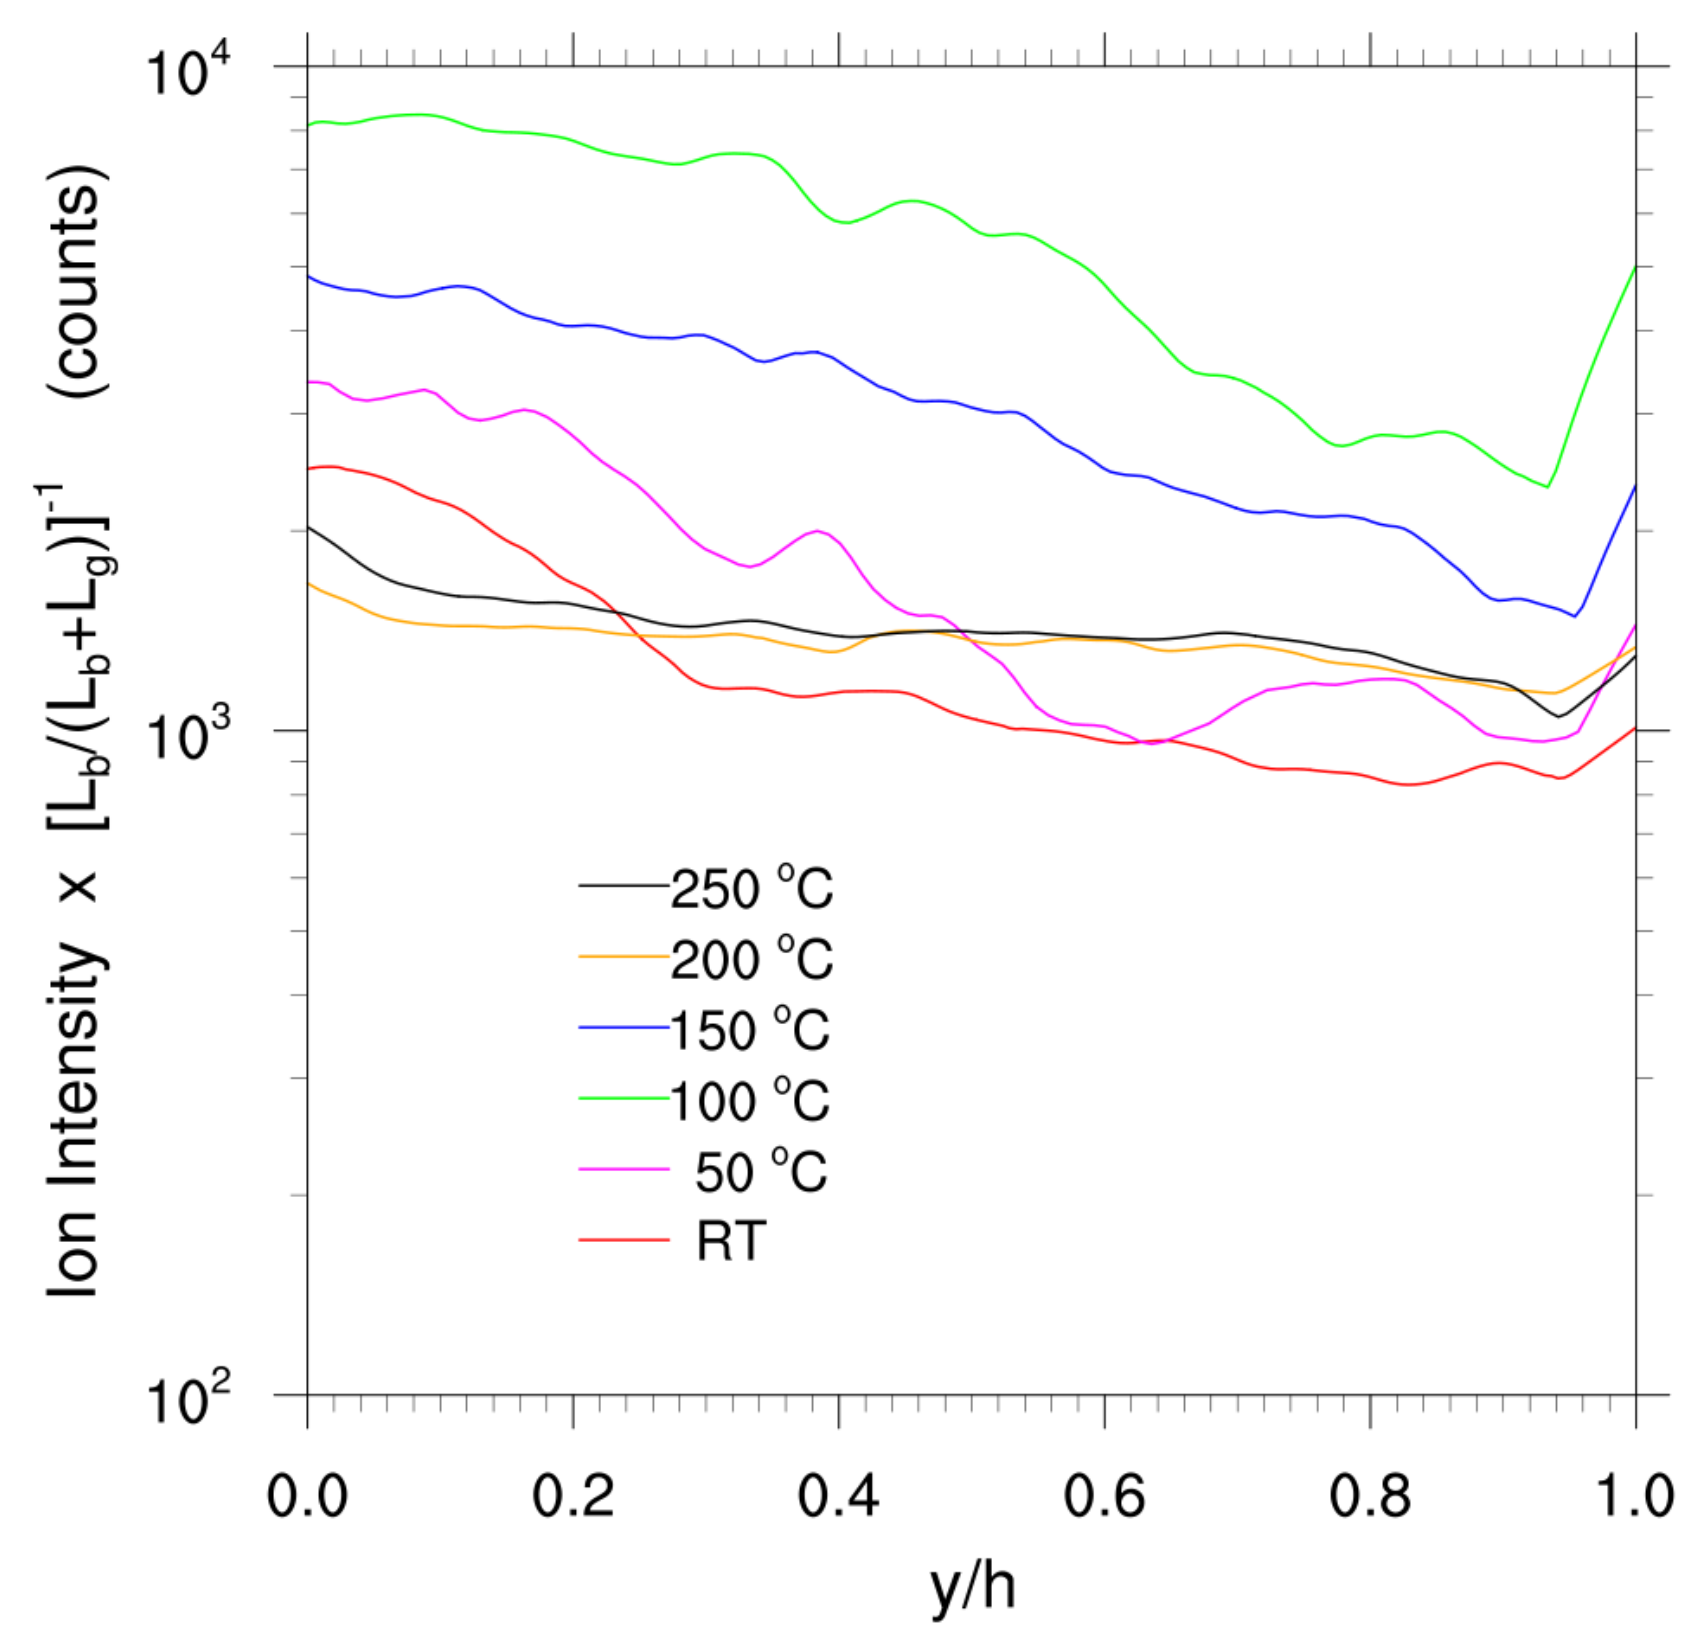
From Equation (
3) and recalling the relation between SIMS intensity and species concentration in Equation (
2), to determine the corrected SIMS intensity that shows the oxygen content in the grain boundary only, we divide the intensity values by the respective grain boundary to grain size ratio (
) values from
Table 1. The results are shown in
Figure 11. In theory, since the oxygen was always present in the chamber, the corrected SIMS intensity should be a relative constant value across the whole film. This did not occur precisely because we do not have the exact
profile within the film; however, we note that, except for the cases of substrate temperatures of 100 °C and 150 °C, the curves overlap relatively closely. This overlapping of the curves after dividing the intensity by the respective grain boundary to grain size ratio (
) is another evidence of the effect of this ratio on the SIMS profiles.
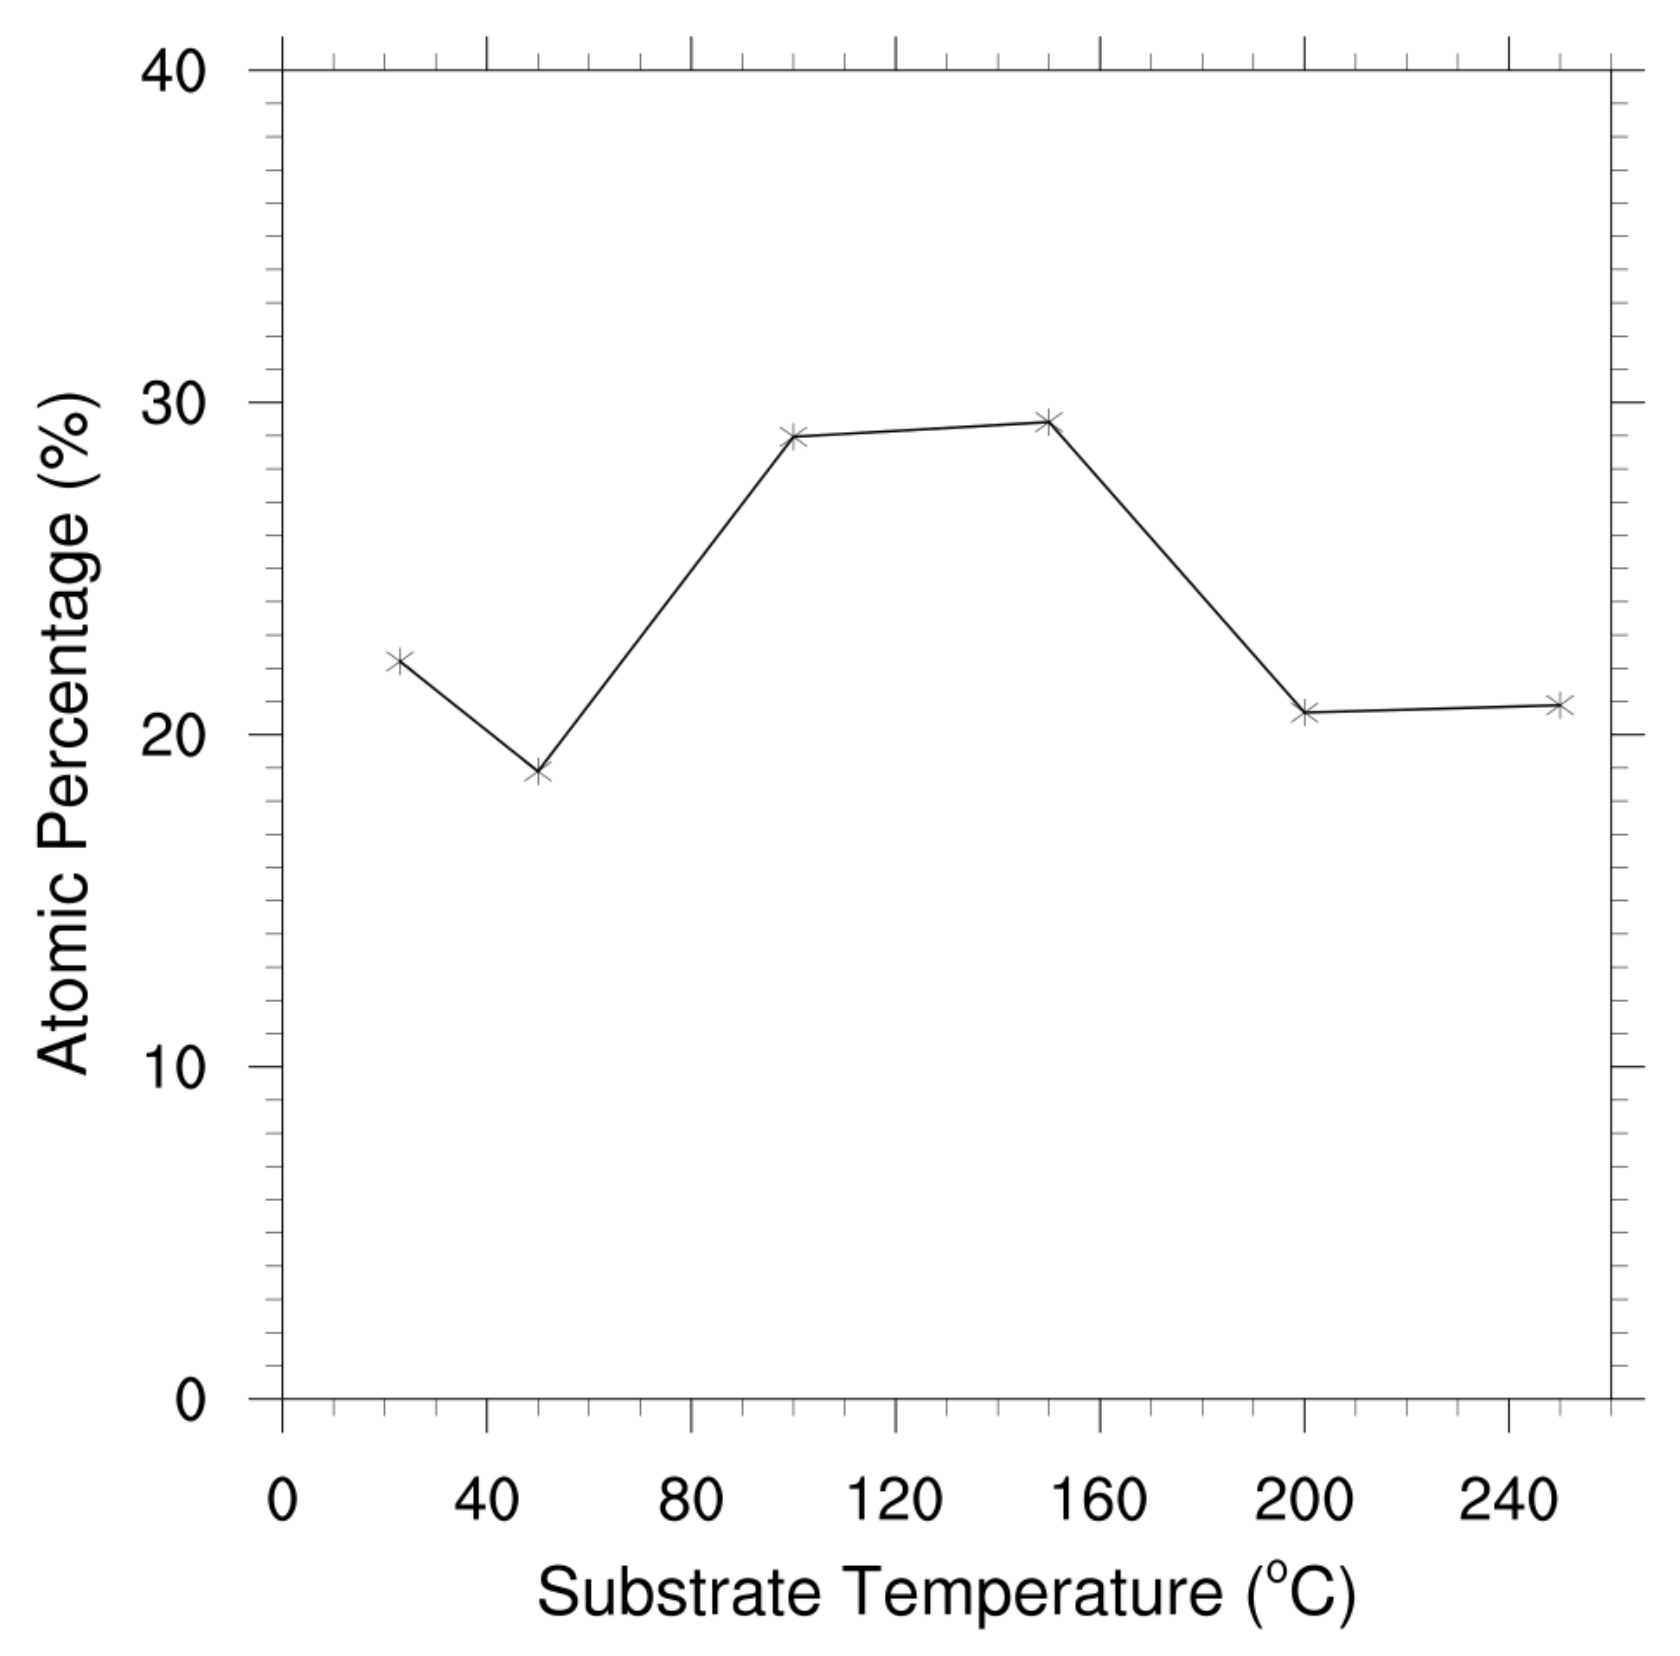
It is not clear yet why there is an excess of oxygen in the molybdenum films for 100 °C, and 150 °C, but such excess is confirmed with the atomic percentages of oxygen detected through XPS (see
Figure 12). As mentioned before, oxygen has effectively been found to facilitate sodium diffusion through Mo and CIGS films. Thus, the oxygen excess in those particular cases could be one of the reasons why the Na SIMS profiles exhibits saturation for the cases of substrate temperatures of 100 °C, and 150 °C. One could expect that the two saturated Na SIMS profiles and the O SIMS profiles in
Figure 1A,C would be the same because both species are saturated in the grain boundary; however, they are not. This is an indication that the sodium and oxygen are both in the grain boundary but at different locations within the boundary. The oxygen should be predominantly on the grain surface exposed to the grain boundary, whereas the sodium seems to be located throughout the whole grain boundary.
5.2. Film Growth Speed vs. Diffusion Front Speed
In contrast to the previous work on sodium diffusion in molybdenum thin films, in this work, the sodium diffusion occurs while Mo films are deposited on soda lime glass. Thus, the speed of the film growth is important to compare against the diffusion front speed. The film growth speed is simply calculated by
where
h is the film thickness (from
Table 1), and
t is the total deposition time, which was the same for all the samples: 1.5 h (5400 s). The diffusion front speed is estimated by
where
is the specie front location after the total deposition time. This can be estimated by
[
20]; thus, the diffusion front speed becomes
D can be estimated by using the Arrhenius expression, for which we use the activation energy by Zeller et al.
Table 4 shows all those values and the speed ratio, which is the ratio
.
From
Table 4, one can observe that, for the cases of 150 °C, 200 °C, and 250 °C, the diffusion front moves faster than the film growth; thus, the film will be saturated with sodium at the end of deposition. This explains the saturated SIMS profiles for those cases. On the other hand, for the cases of RT, 50 °C, and 100 °C, the film growth is faster.
5.3. Substrate Temperature Effect
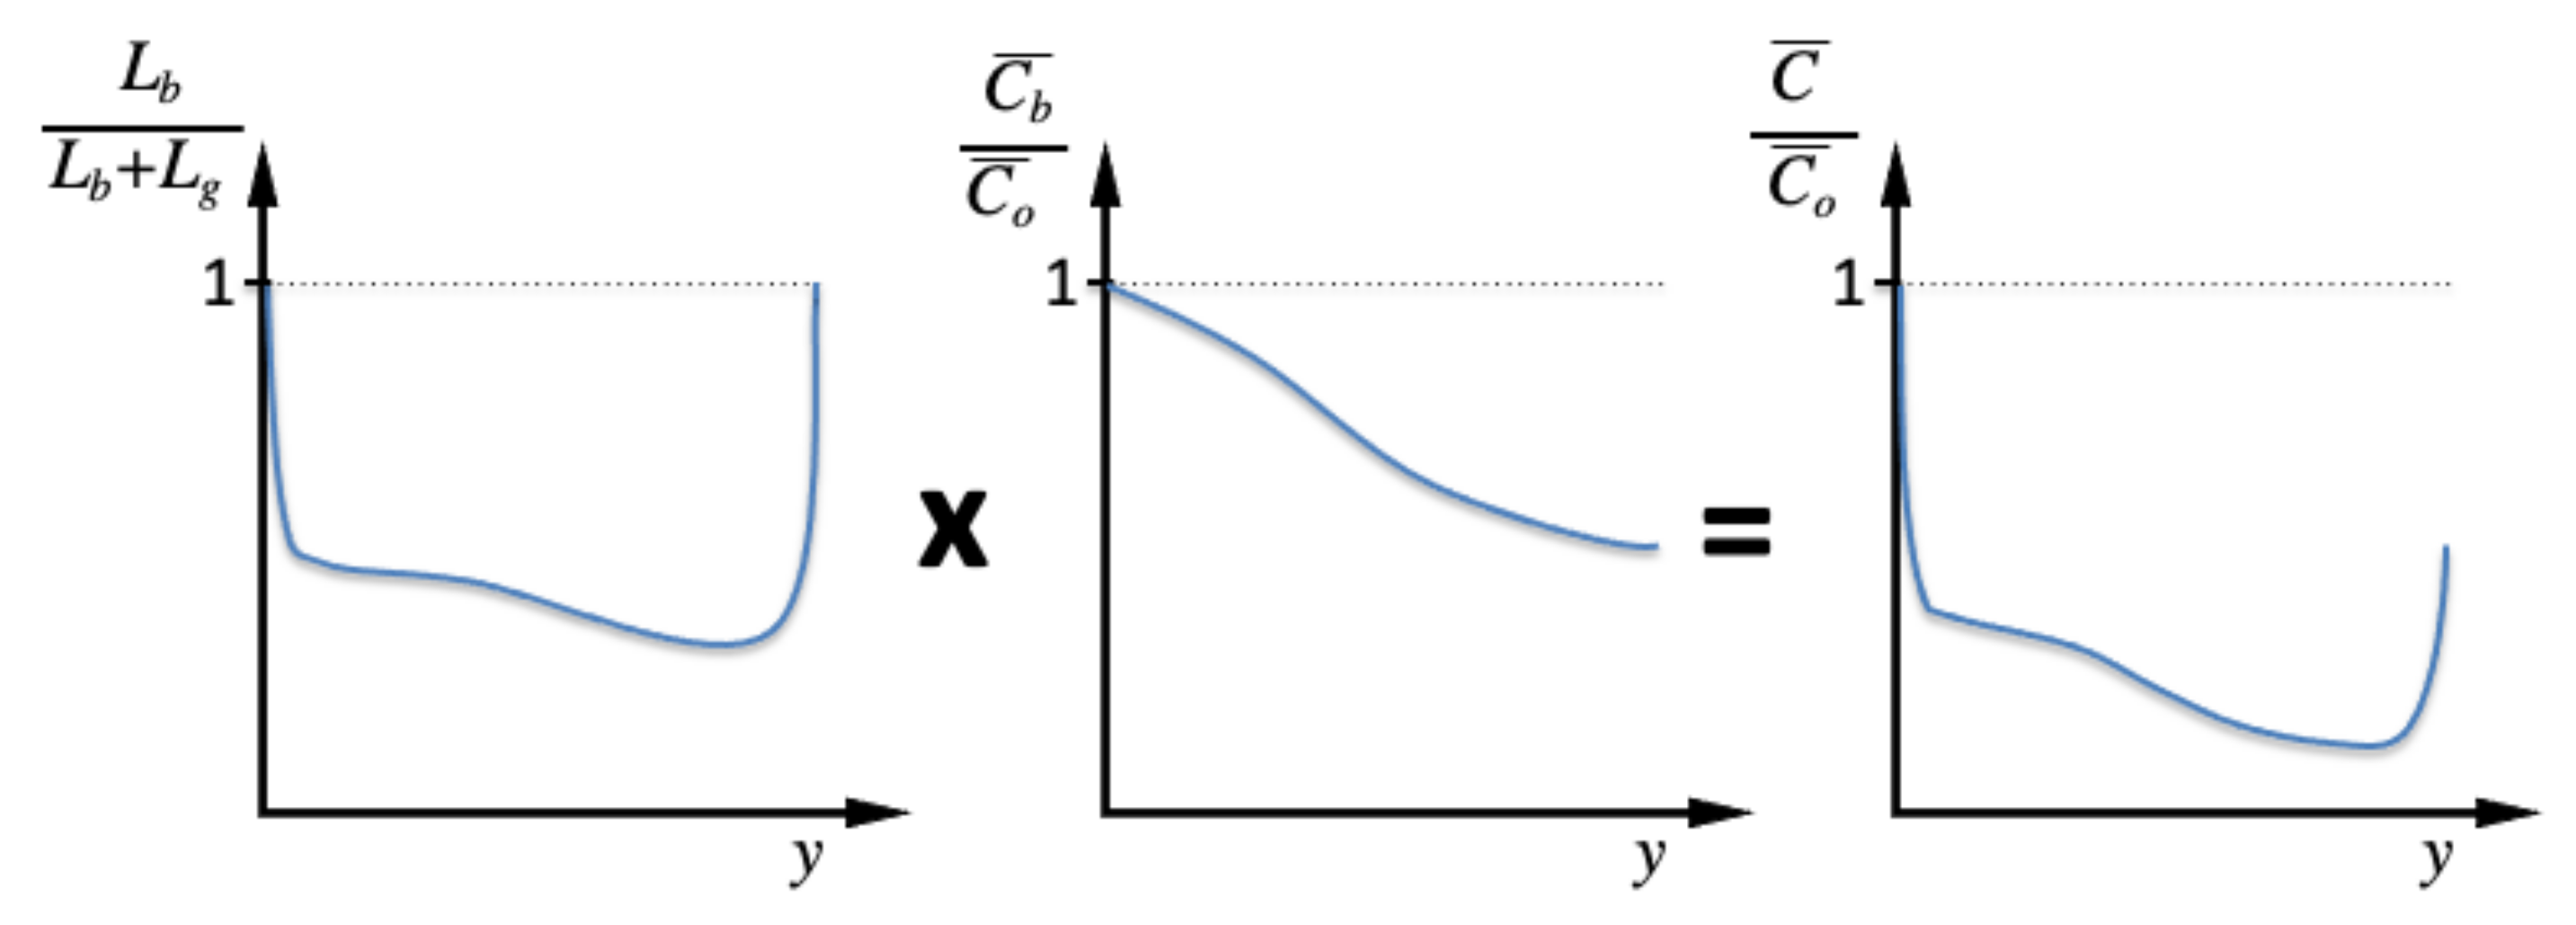
Examining Equation (
3), it can be deduced that the overall concentration of sodium in the thin film depends on two factors: (1) the grain boundary size to grain size ratio
, and (2) the actual concentration of sodium in the grain boundary (
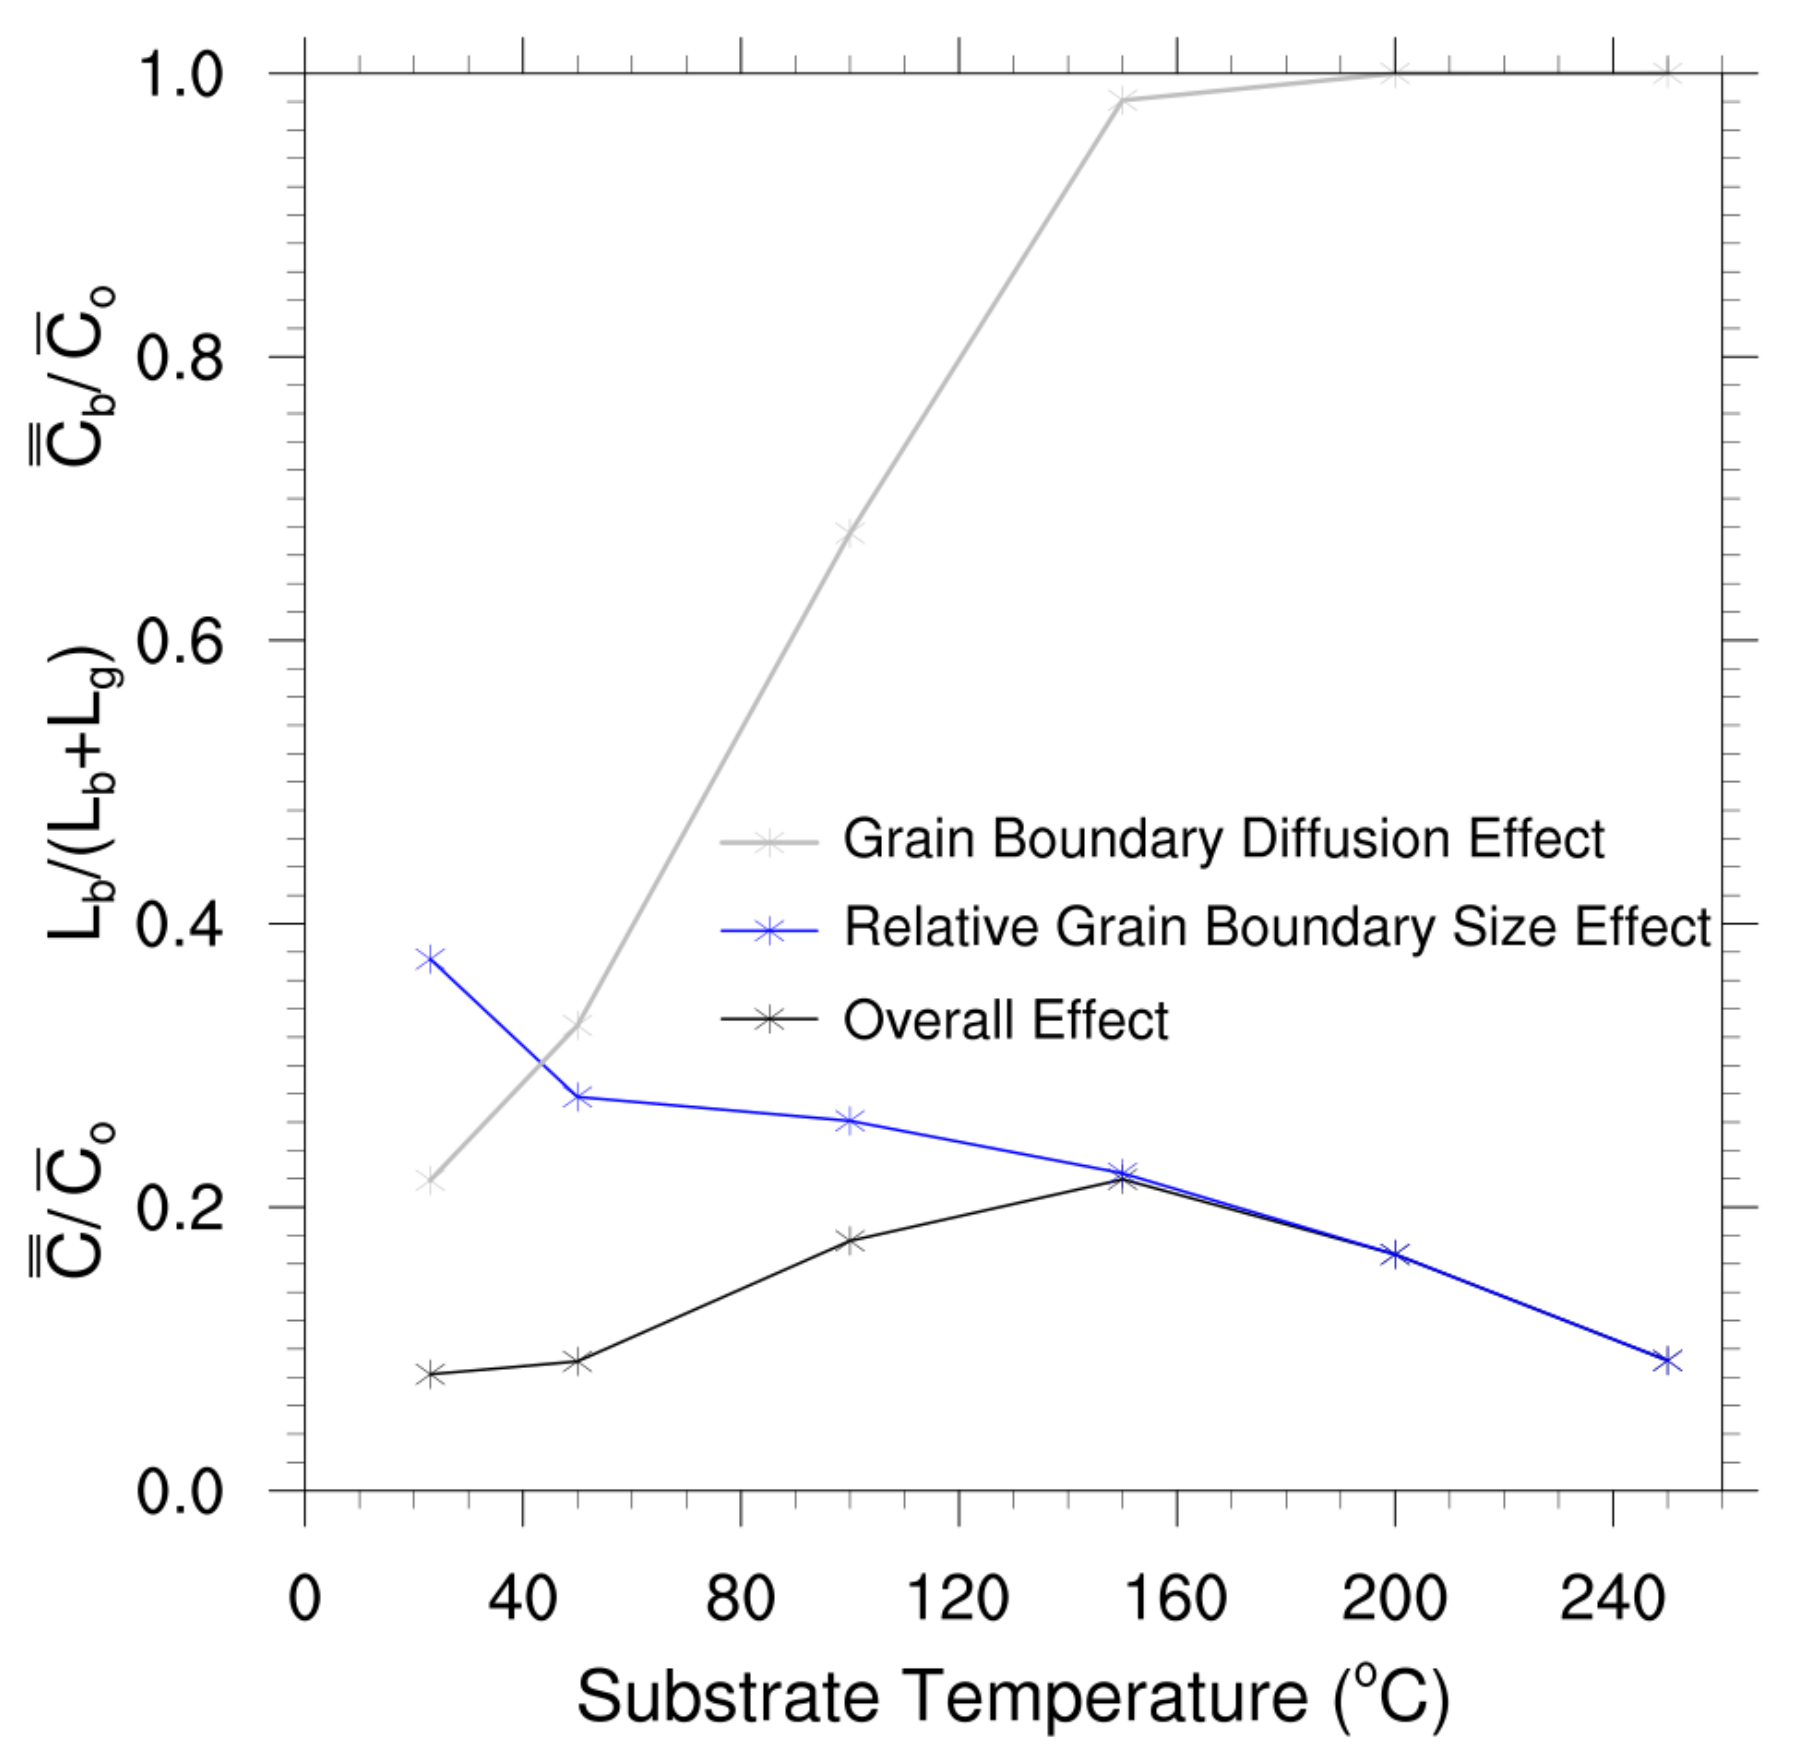
). The grain boundary size to grain size ratio decreases with increasing substrate temperature (larger grains, less boundaries in a fixed space). The specie concentration depends on the diffusion coefficient, which increases with substrate temperature (Arrhenius equation behavior). Since each factor depends differently on temperature, when one increases, the other one decreases. At large temperatures, the grains are larger reducing the number of paths through which the sodium could diffuse, while at low temperatures, the diffusion coefficient is not large enough to allow the sodium to diffuse. This implies that there should be a temperature at which the concentration of sodium is the highest.
To study this in more details, one can look at
Table 1 for the overall grain boundary size to grain size ratio. As for the overall concentration of sodium in the grain boundary, we do not have enough information from the experiments to evaluate it because the SIMS profiles show evidence of sodium saturation in most of the samples. Thus, the simple one-dimensional mathematical models, shown in
Section 3.3, can be used. Those expressions provide a concentration at any given film location. To get an overall concentration of sodium in the grain boundary, one can take the average across the film:
which leads to
for the case of Equation (
4), and
for the case of Equation (
5).
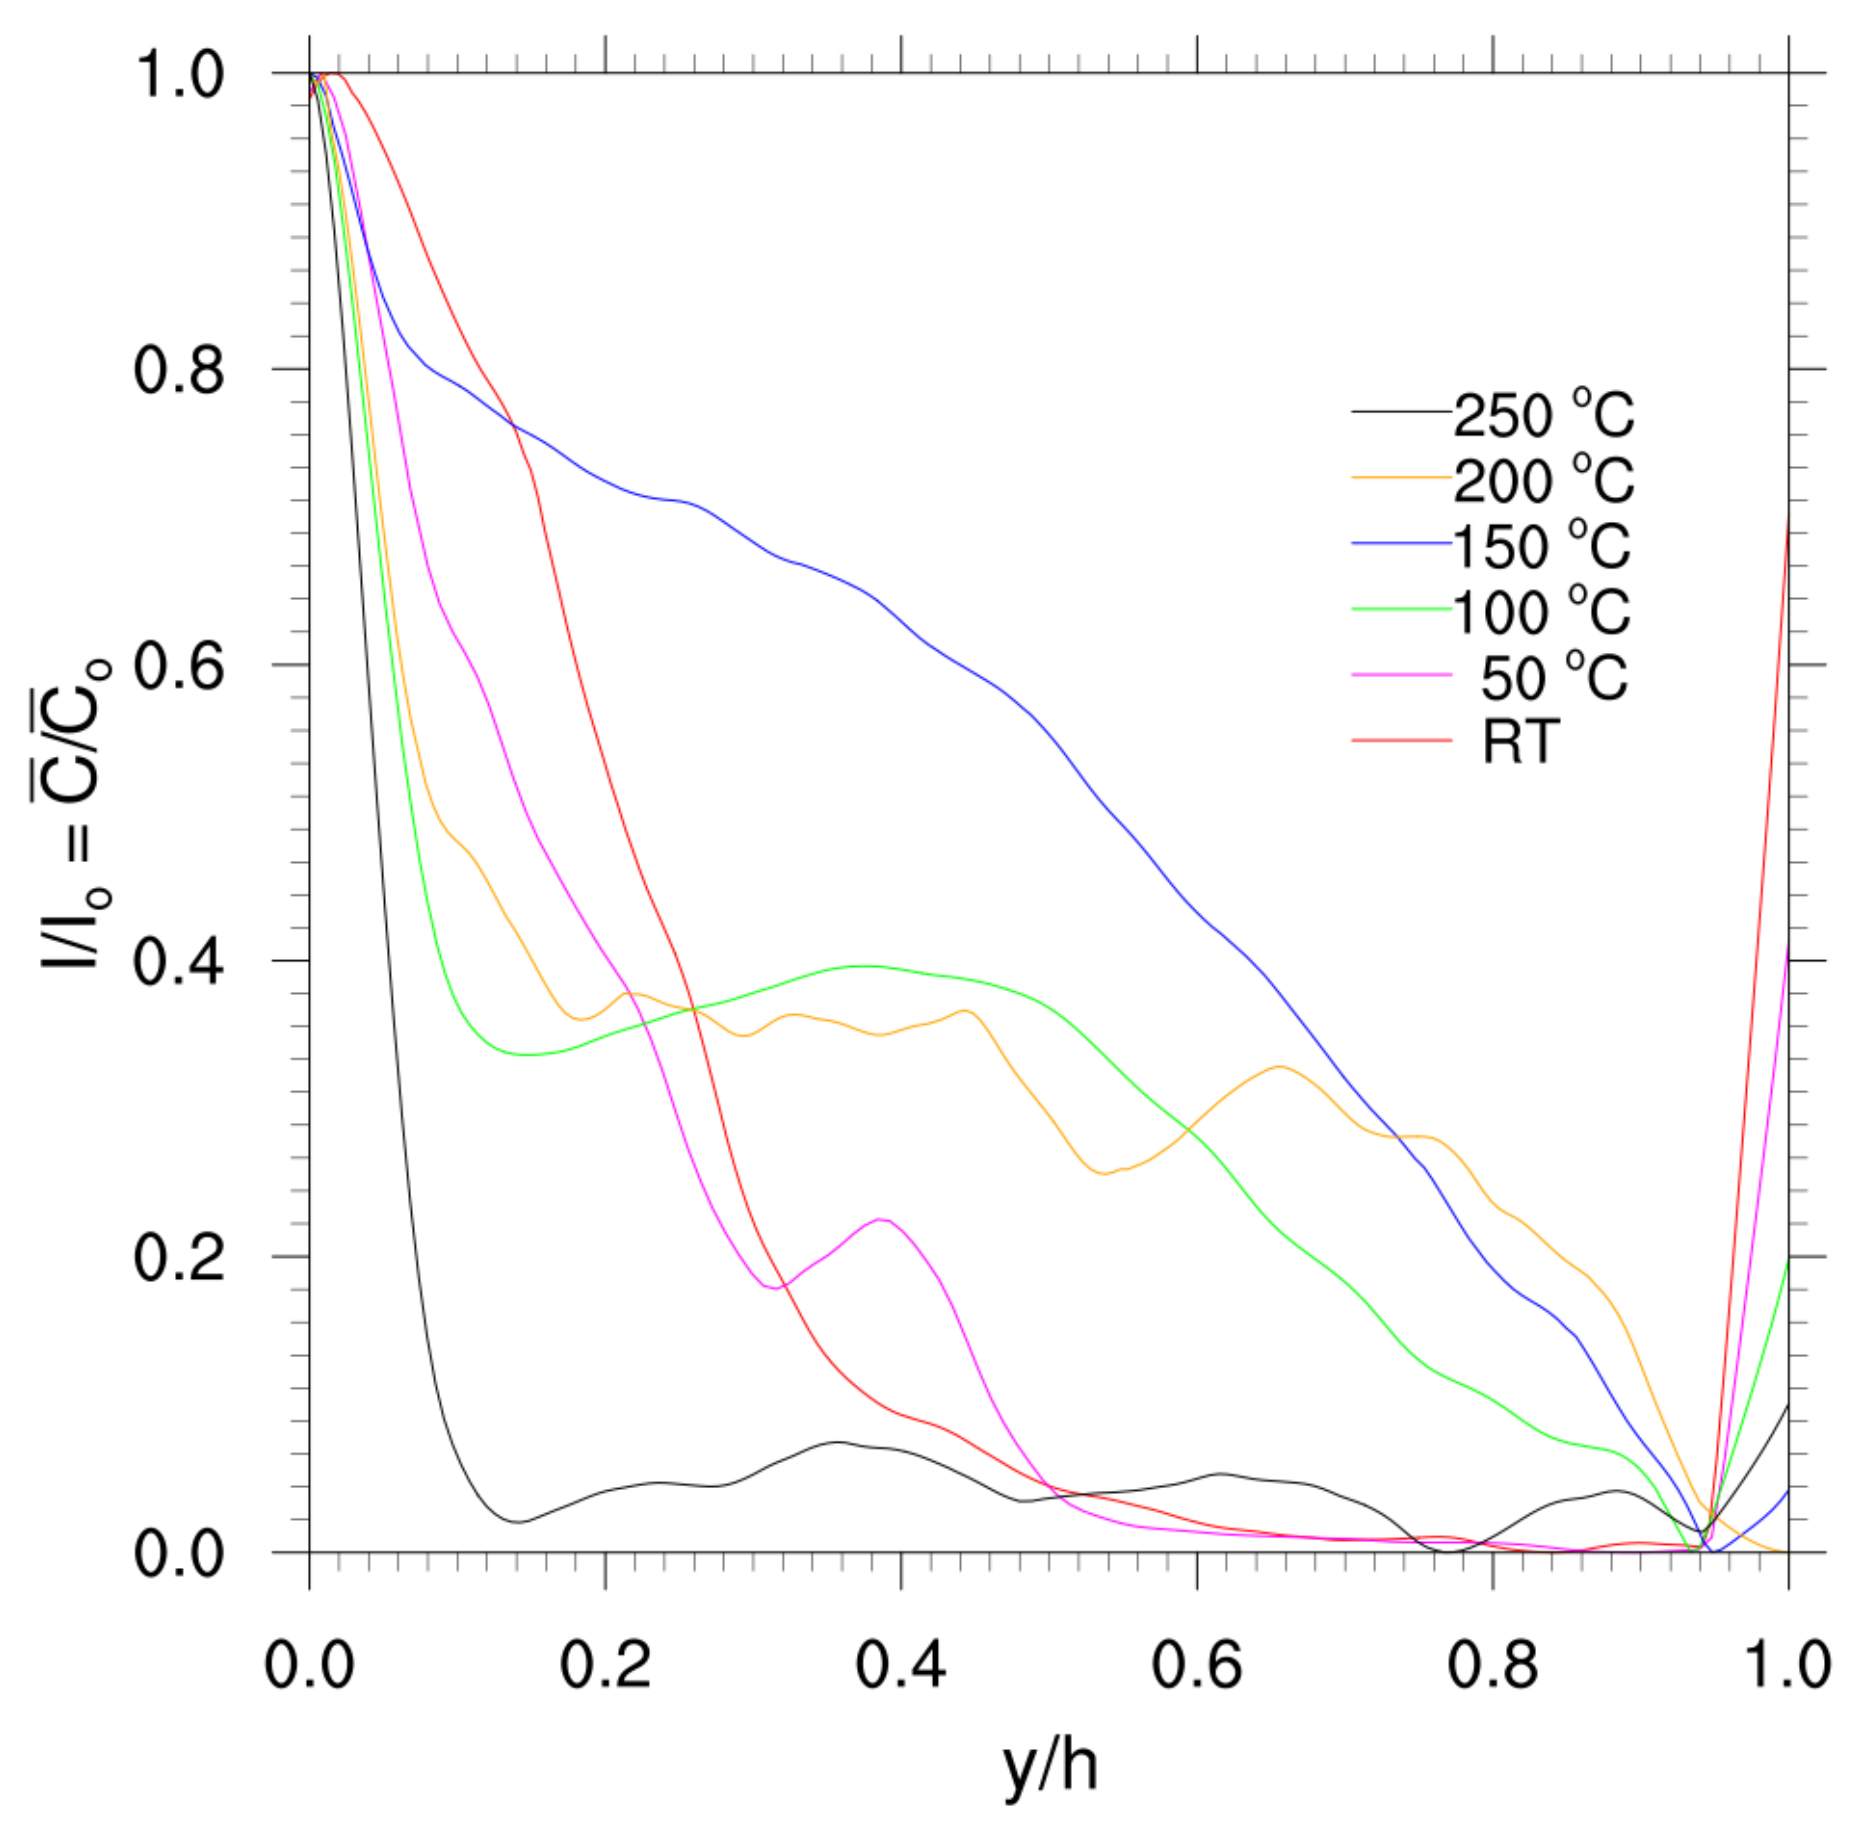
Figure 13 shows
using Equation (
13) for the different substrate temperatures (light gray curve—grain boundary diffusion effect). Note that the model predicts overall saturation of sodium (
) for substrate temperatures larger than 150 °C. The values of the relative grain boundary size
from
Table 1 are also shown (blue curve—relative grain boundary size effect). Following Equation (
3), both of these factors were multiplied to obtain the overall concentration of sodium in the bulk of the thin film (black curve—overall effect). As discussed above, our model predict that a maximum concentration of sodium should be detected by SIMS in the temperature range of 100 °C to 200 °C. Similar findings were observed using Equation (
14) for the grain boundary diffusion effect (results not shown). This finding is yet another evidence of why the SIMS profiles for such temperatures show saturation. The simple mathematical models also show that the grain boundaries could be saturated for high substrate temperatures, as it was observed in the corresponding SIMS profiles.
6. Conclusions
In this paper, we analyzed the sodium diffusion behavior in oxidized molybdenum thin films deposited on soda-lime glass at different substrate temperatures. Several observations were made after the analysis. First, we demonstrated that it is extremely important to consider the grain boundary size to grain size ratio when studying species diffusion in solid thin films. Second, substrate temperature has been thought as a key parameter in the diffusion of alkali ions through the molybdenum thin films due to its well-known effect in the diffusion coefficient. However, it also affects the grain boundary size to grain size ratio by decreasing it. This behavior implies that there is a range of temperatures where a maximum overall specie concentration can be found in a solid thin film. Third, as others have observed, the presence of oxygen notably affects the effective diffusion of sodium in molybdenum thin films. The oxygen is likely located at the grain boundaries. Fourth, the speed at which the molybdenum is deposited on the soda-lime glass also plays an important role in the diffusion of sodium. If the film growth is slow, the sodium could reach saturation in the grain boundaries quickly. And, finally, a diffusion modeling via COMSOL, with an appropriate grain boundary to grain geometry, can allow the determination of species diffusion coefficients that match dynamic SIMS profiles.


 ,
, 


