
Aerodynamic Characteristics of Shark Scale-Based Vortex Generators upon Symmetrical Airfoil

 , , and
Abstract
:1. Introduction
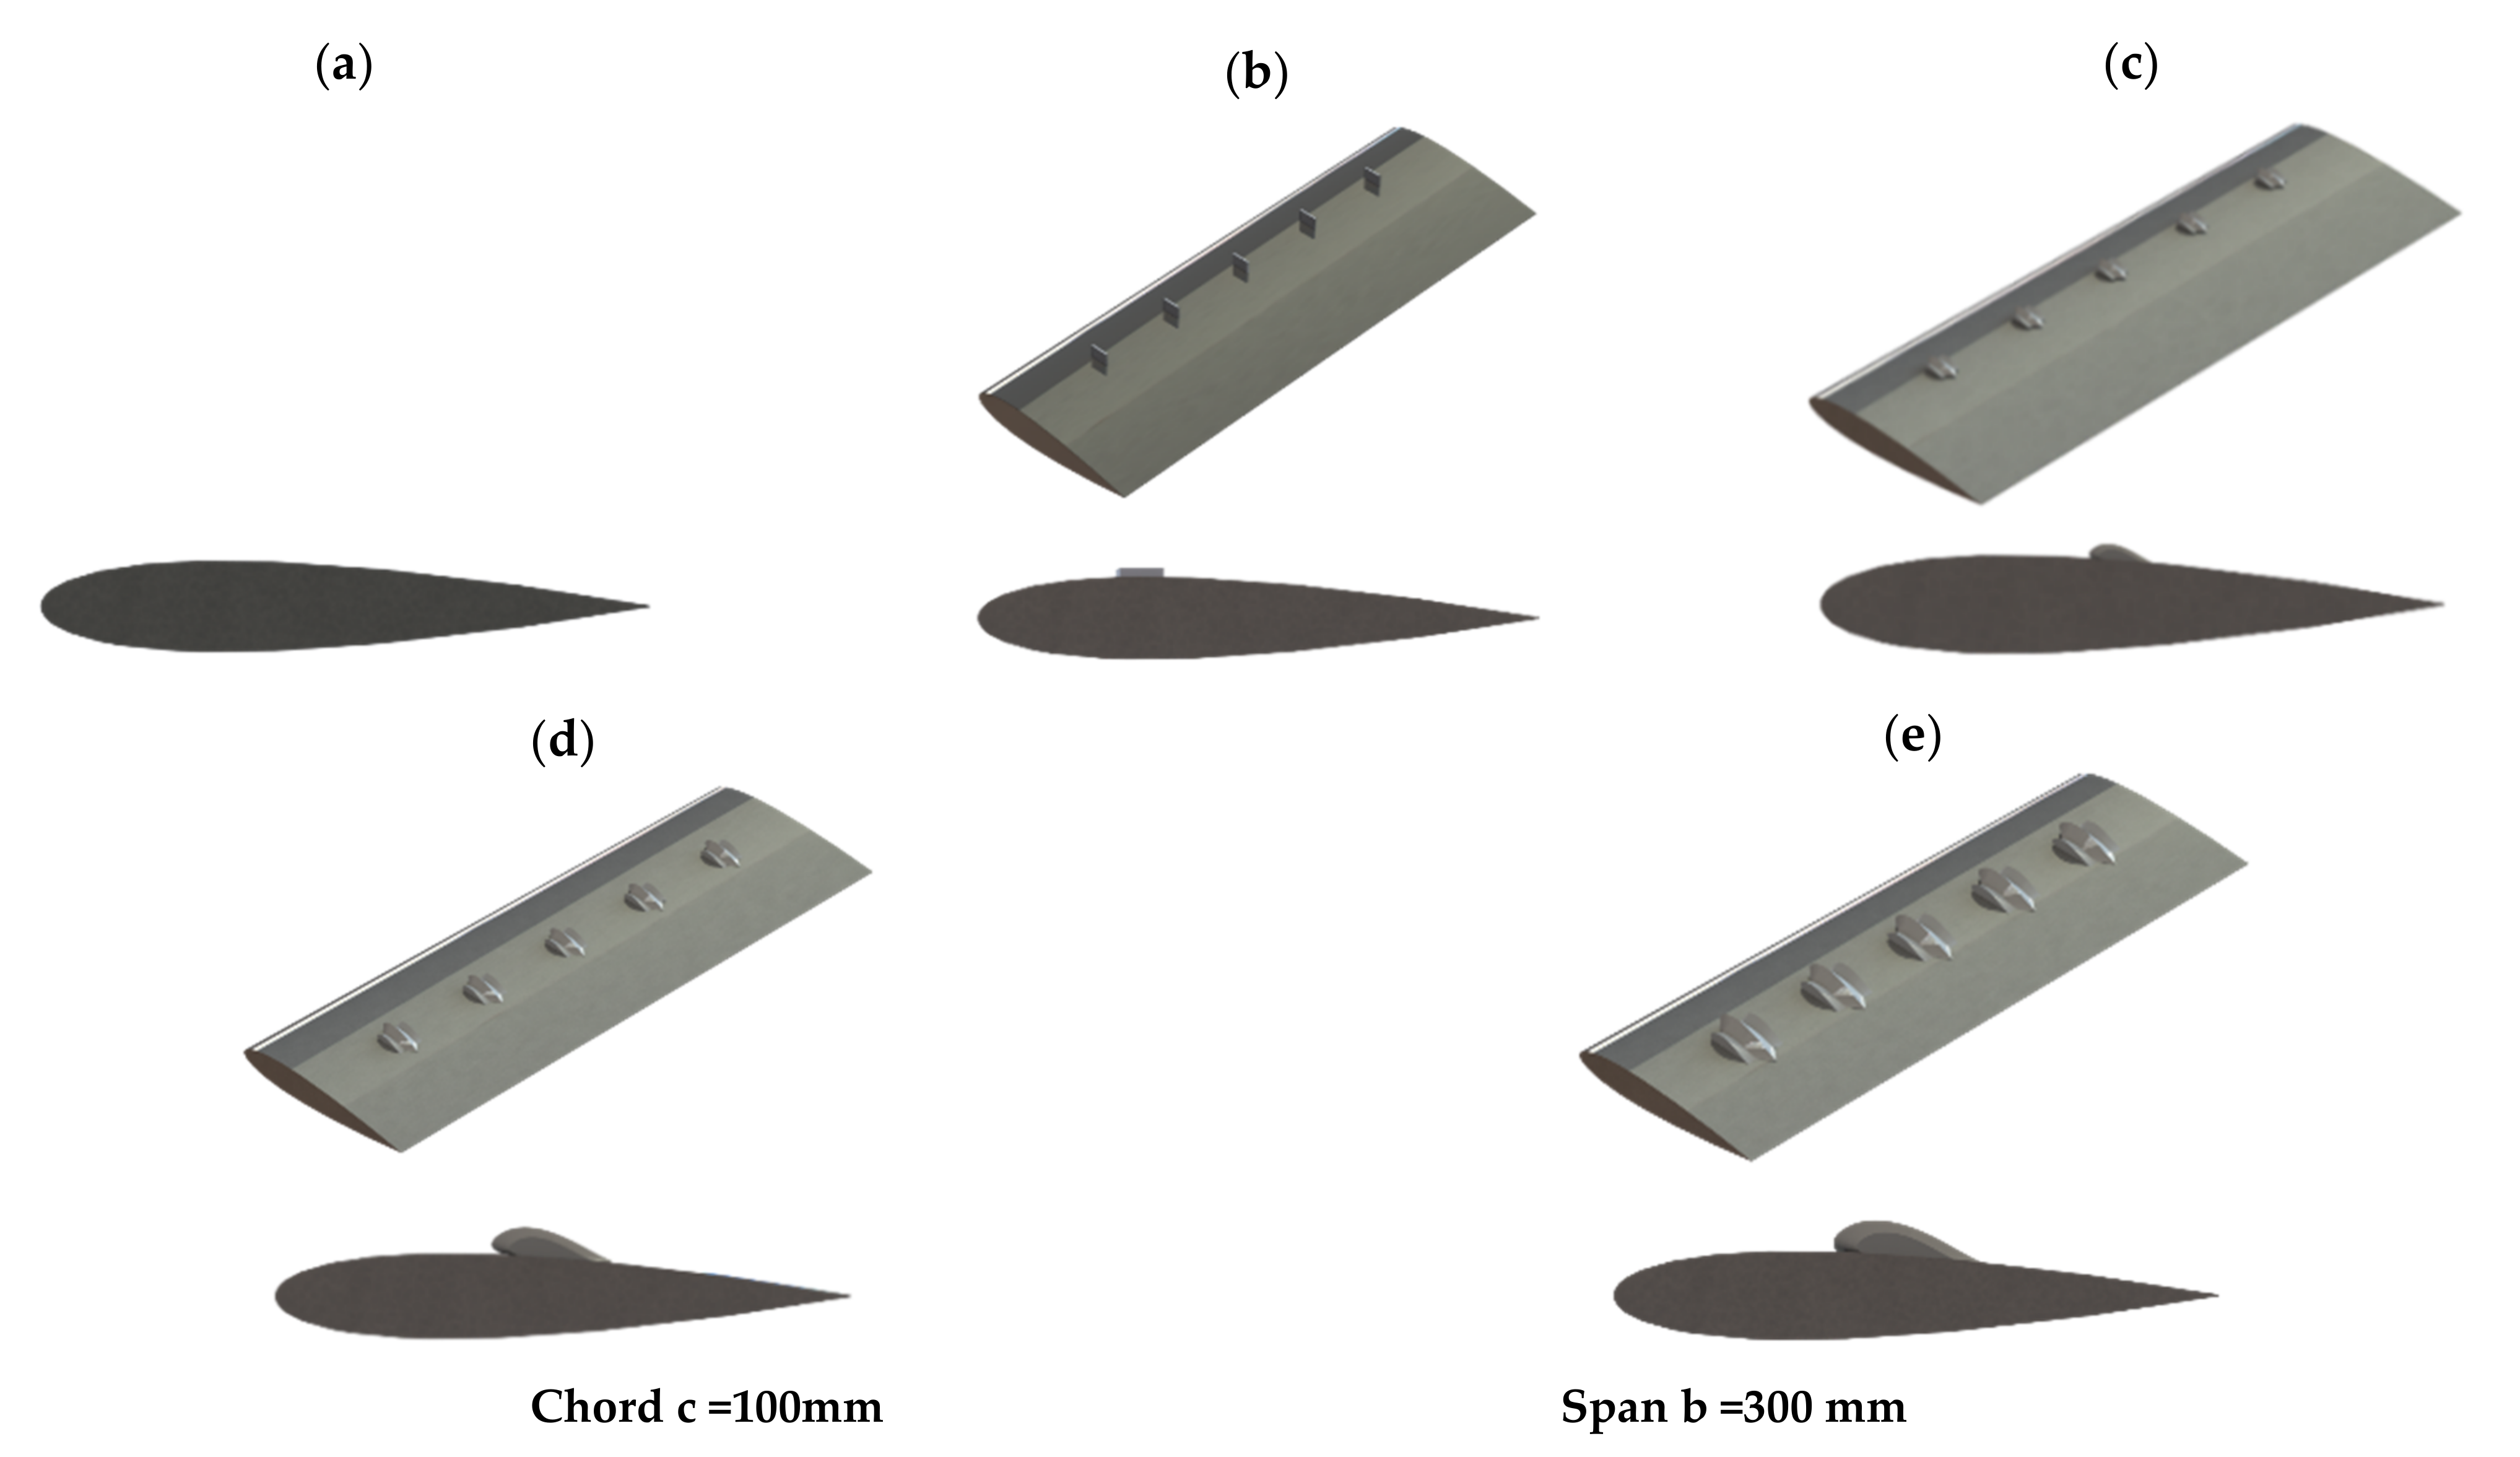
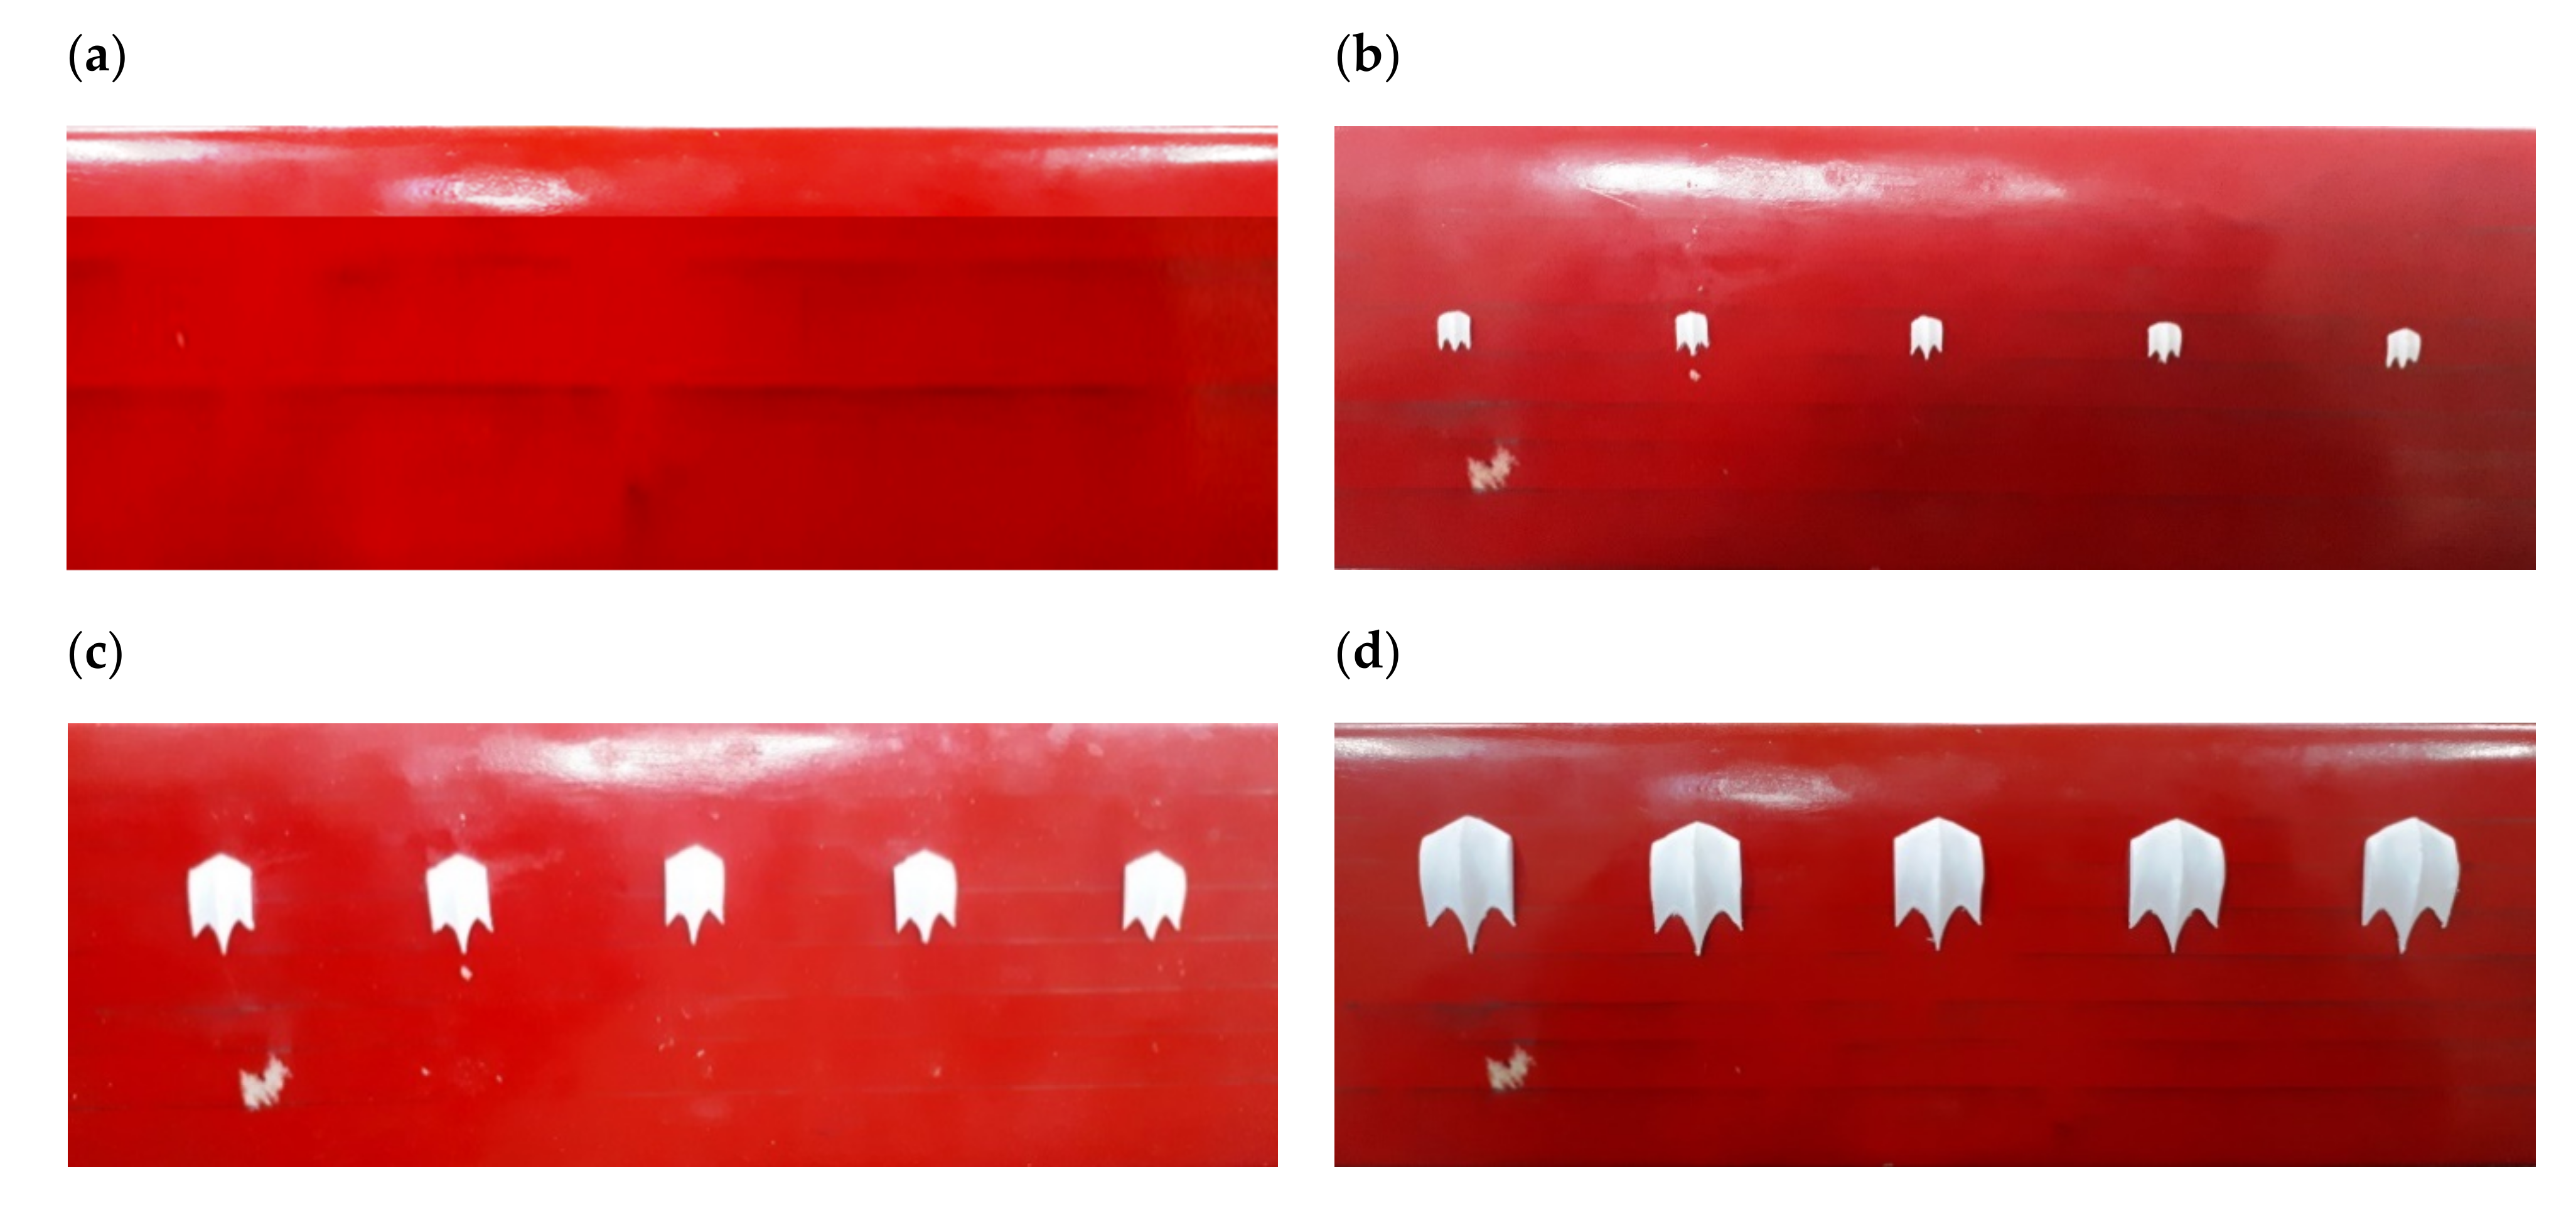
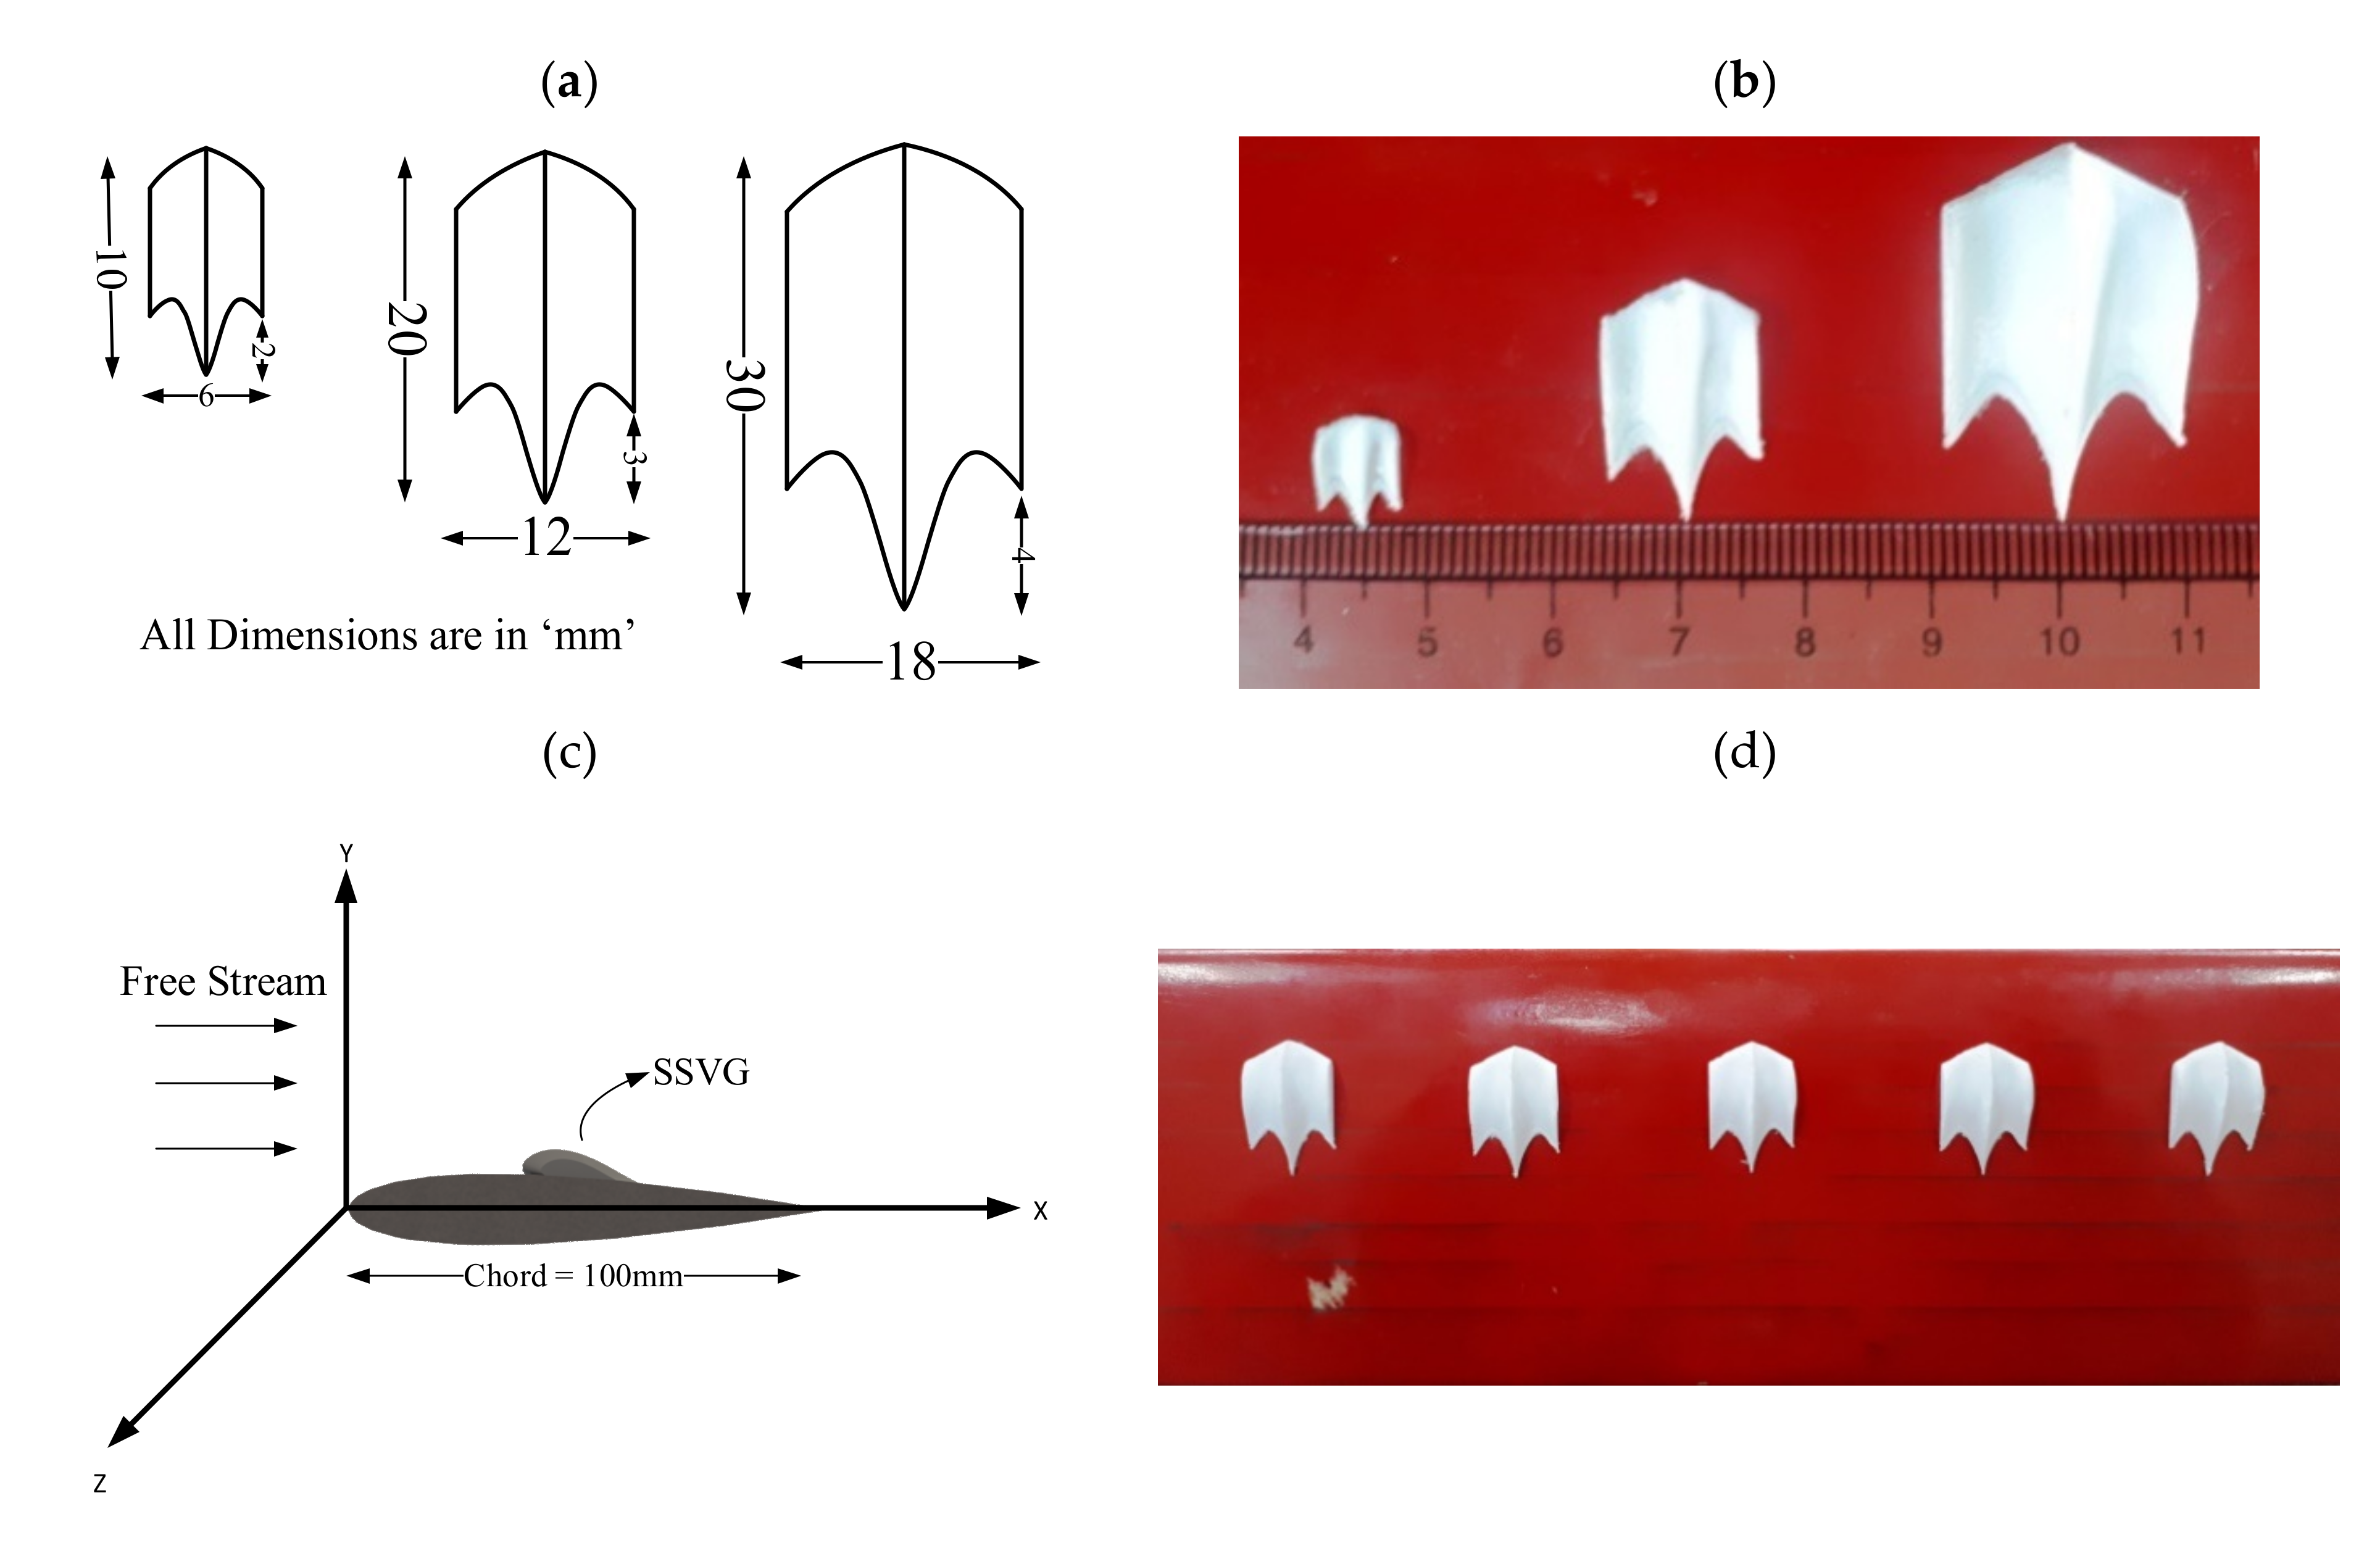
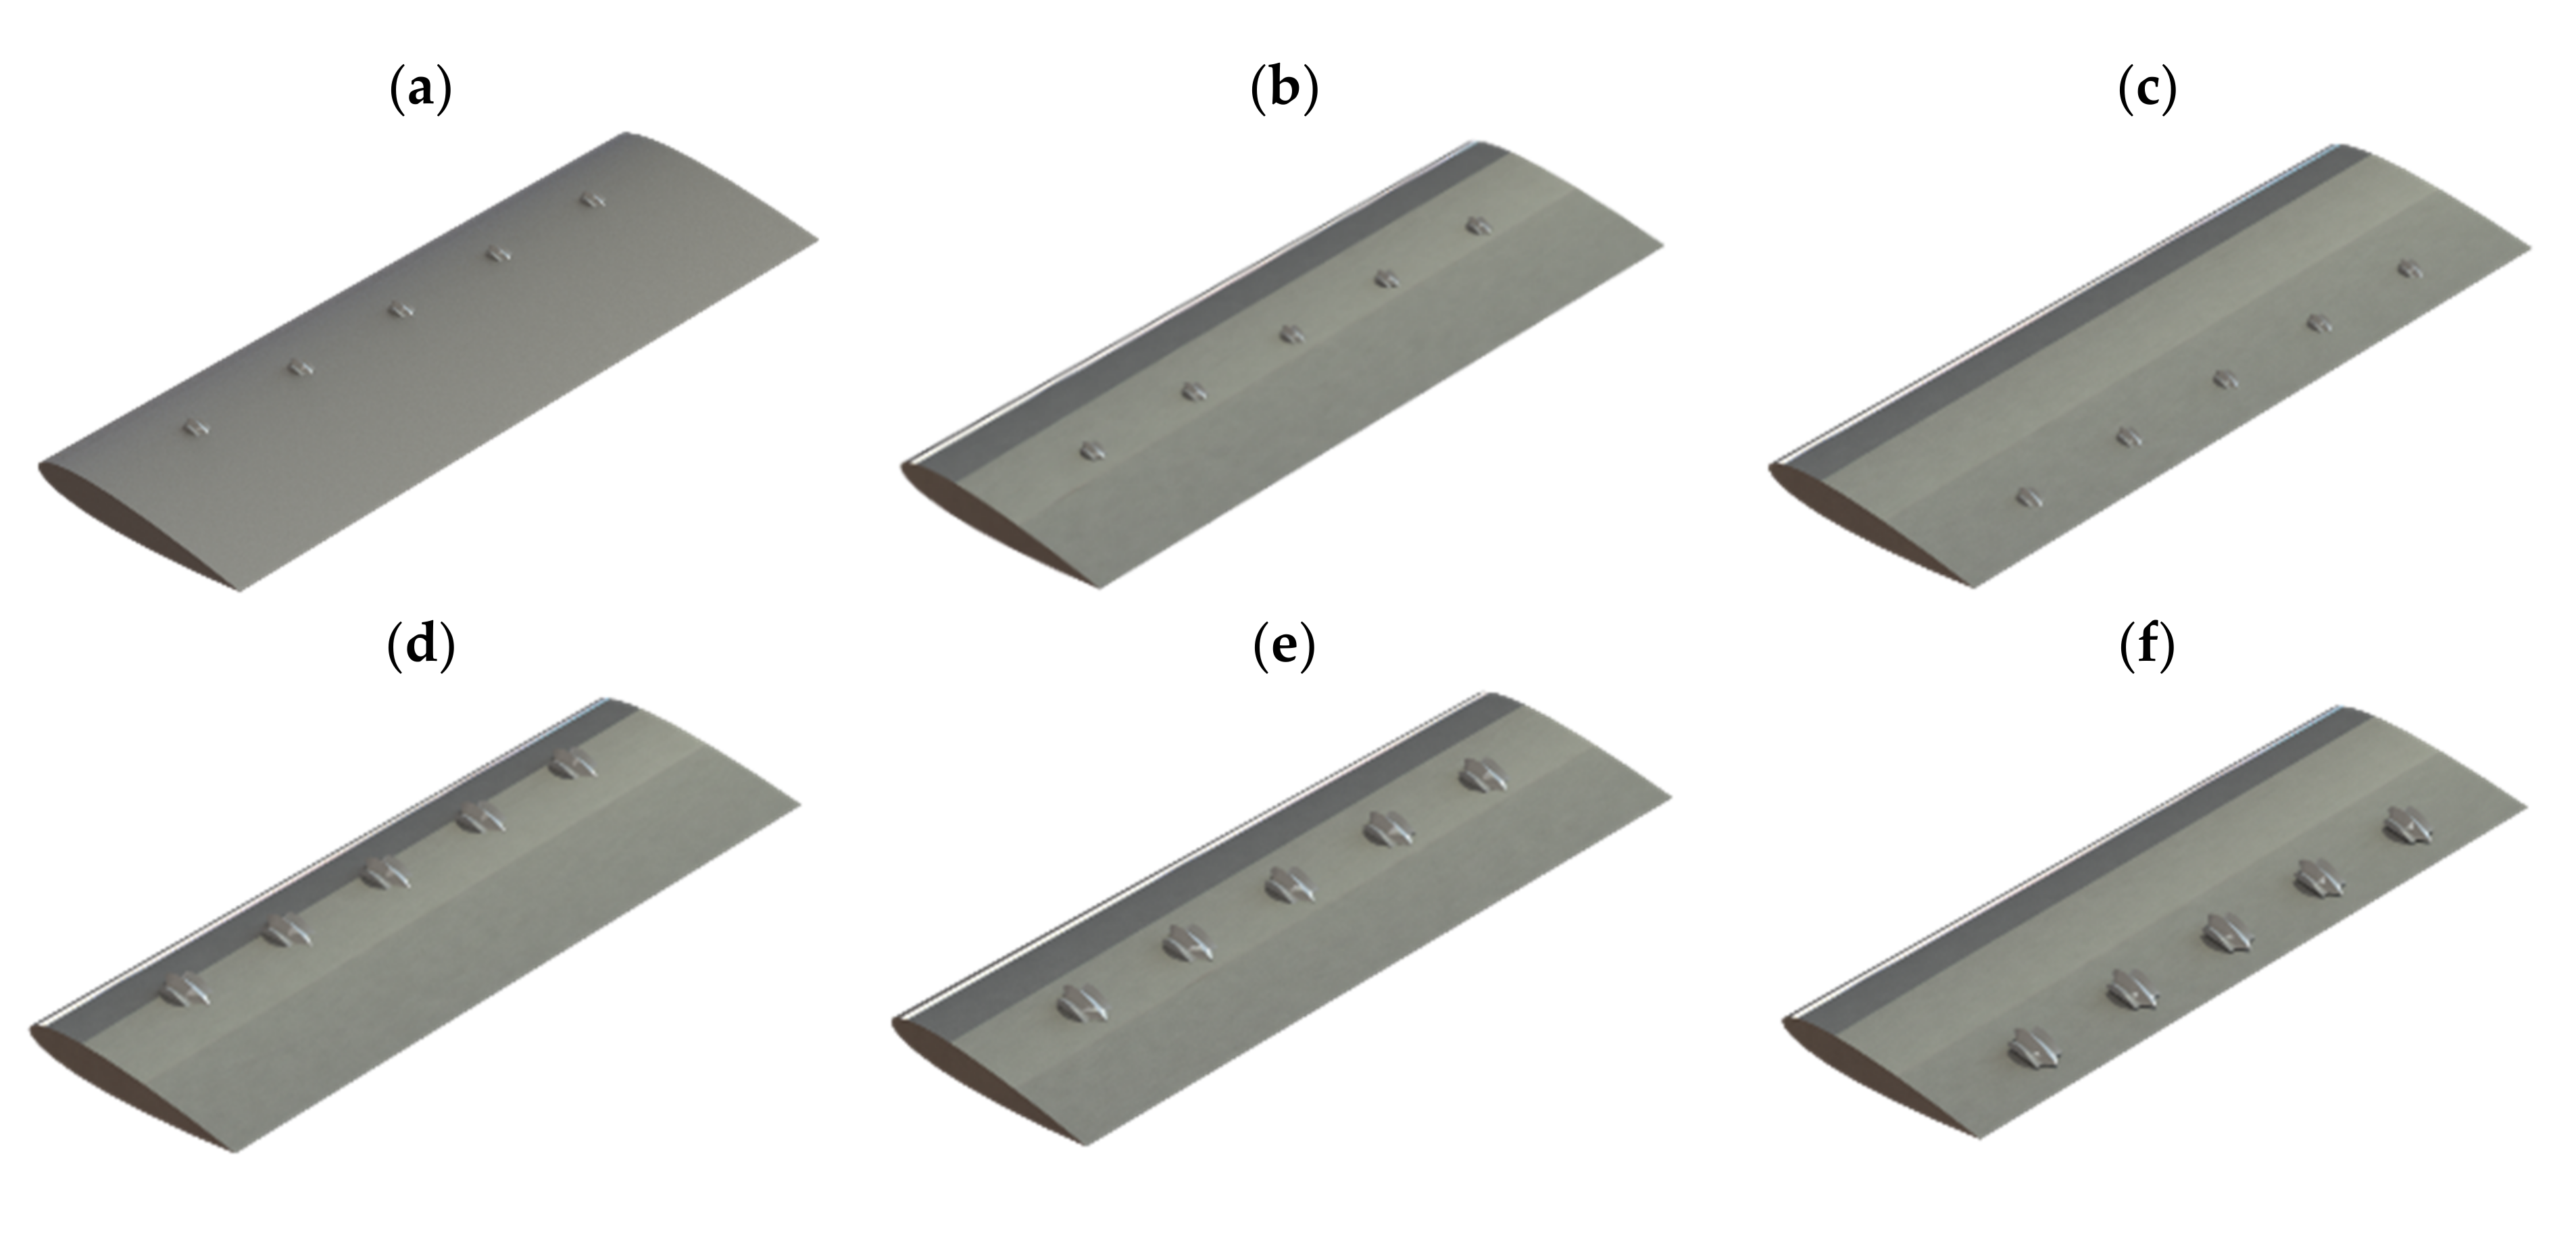
2. Experimental Methodology
3. Results
3.1. Influence of SSVG on the Aerodynamic Characteristics of the Baseline Model
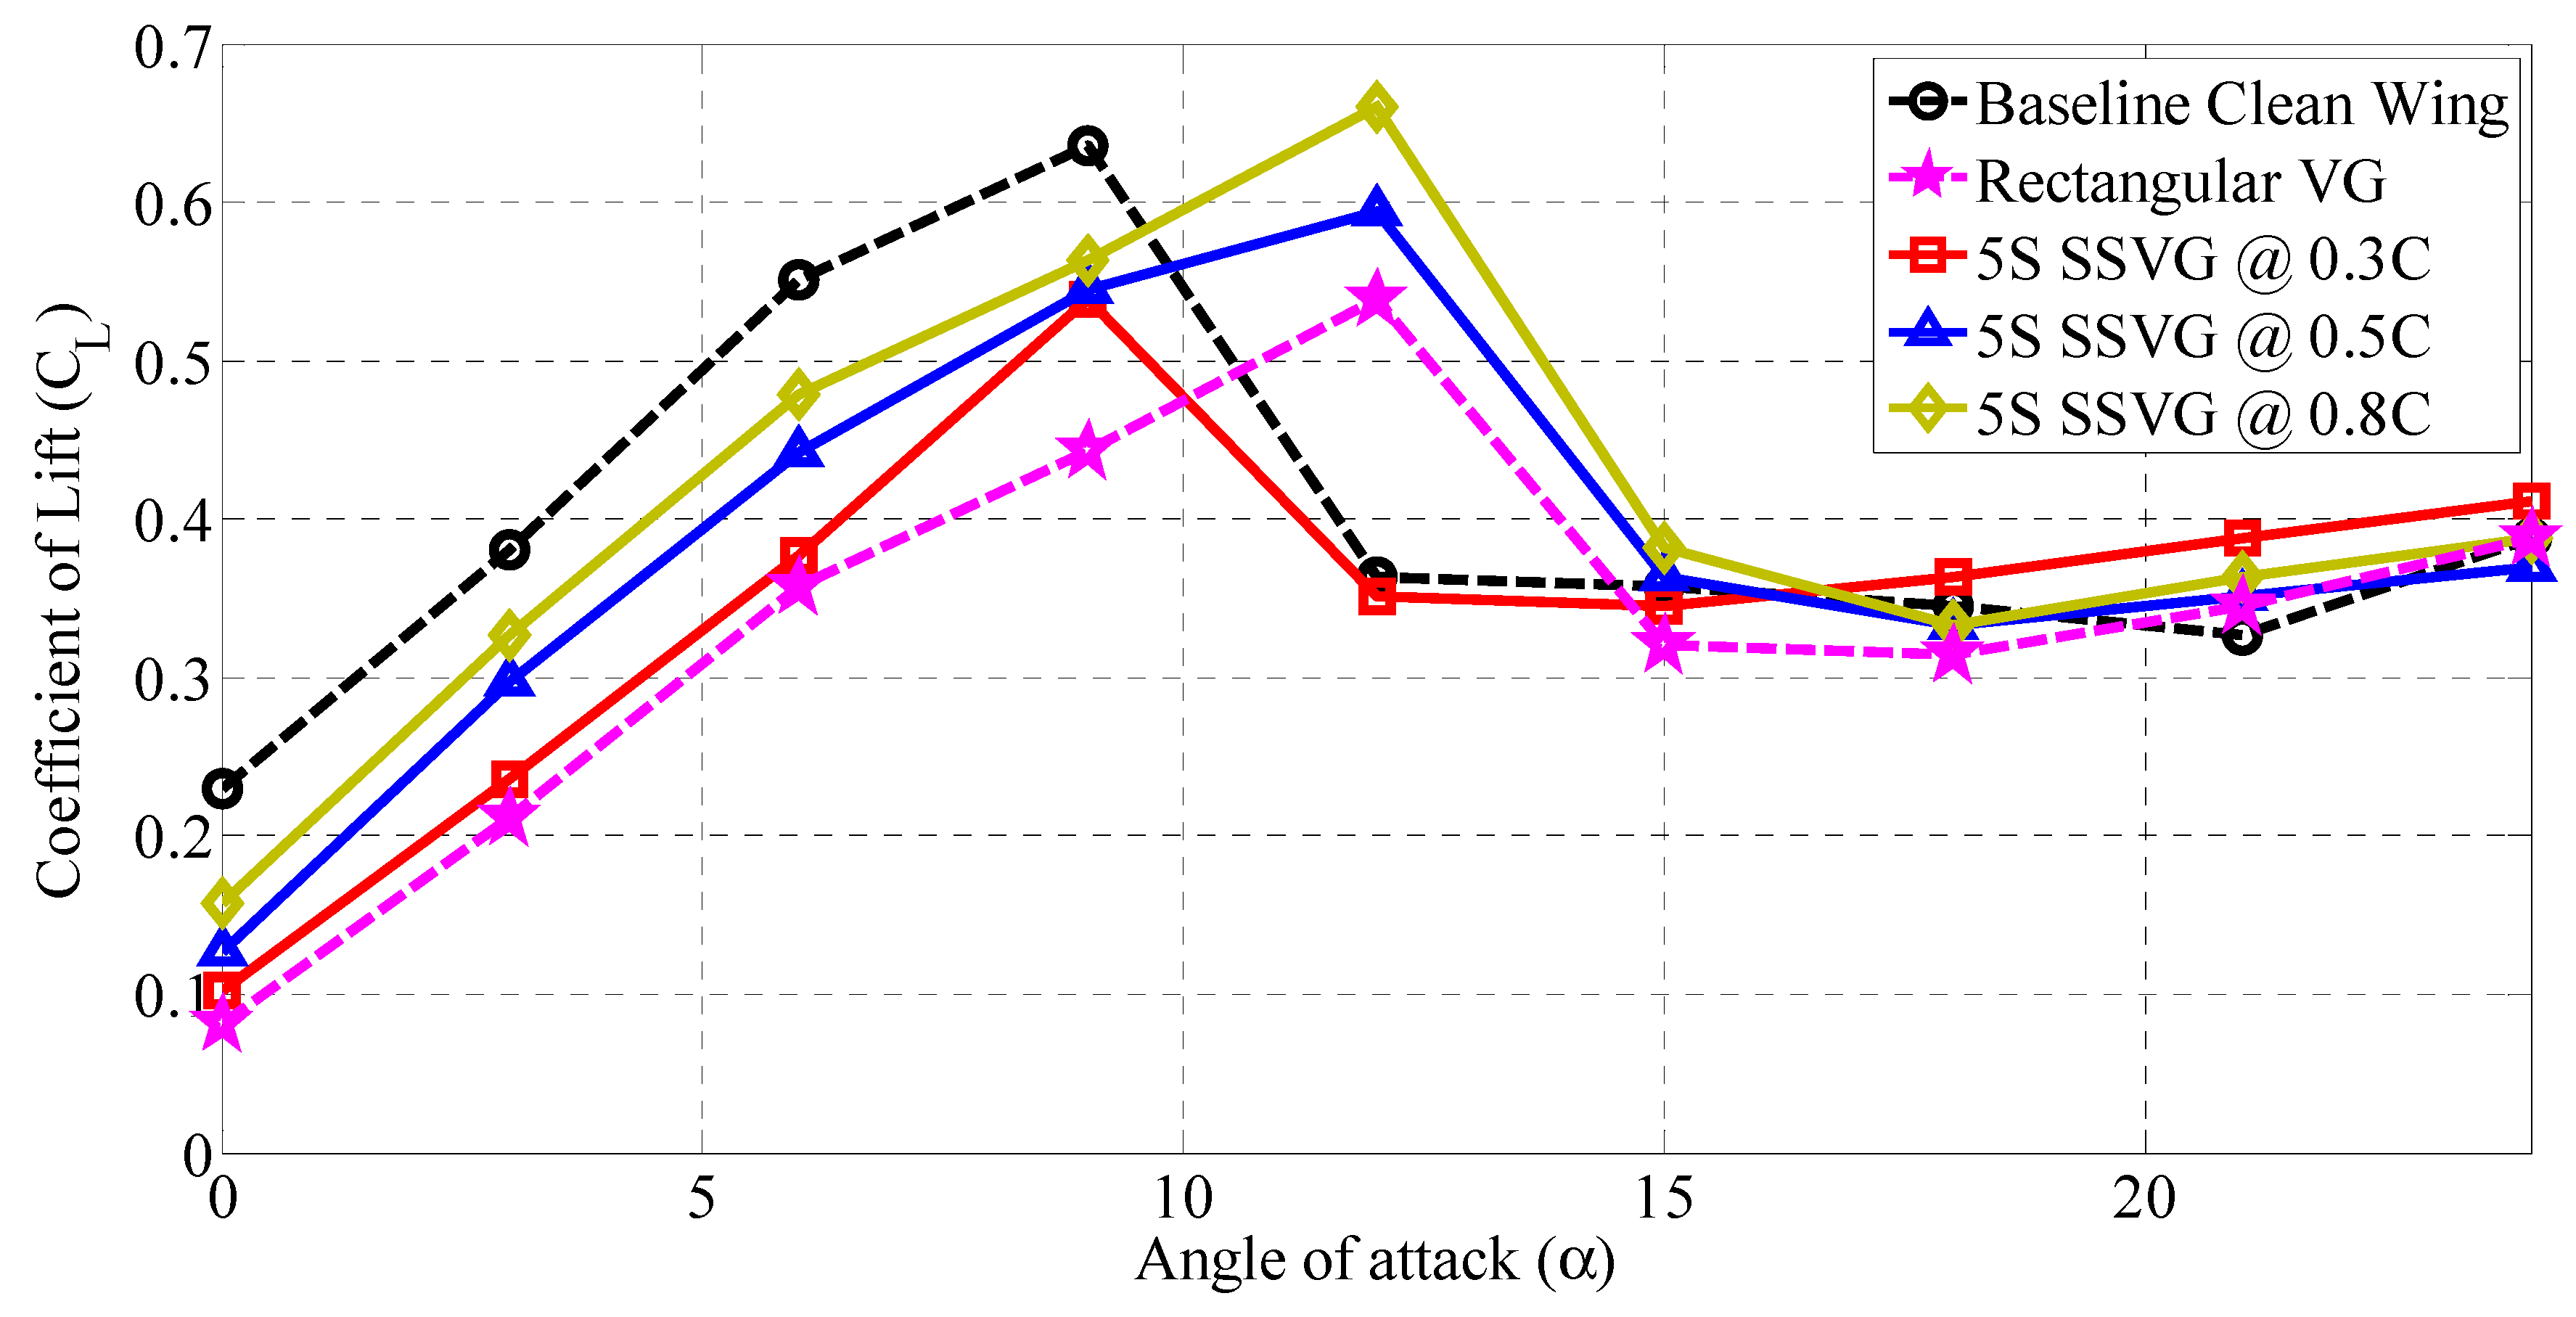
3.2. Influence of 5S Type SSVG at Various Chordwise Locations (x/C)
3.3. Influence of 5M Type SSVG at Various Chordwise Locations (x/C)
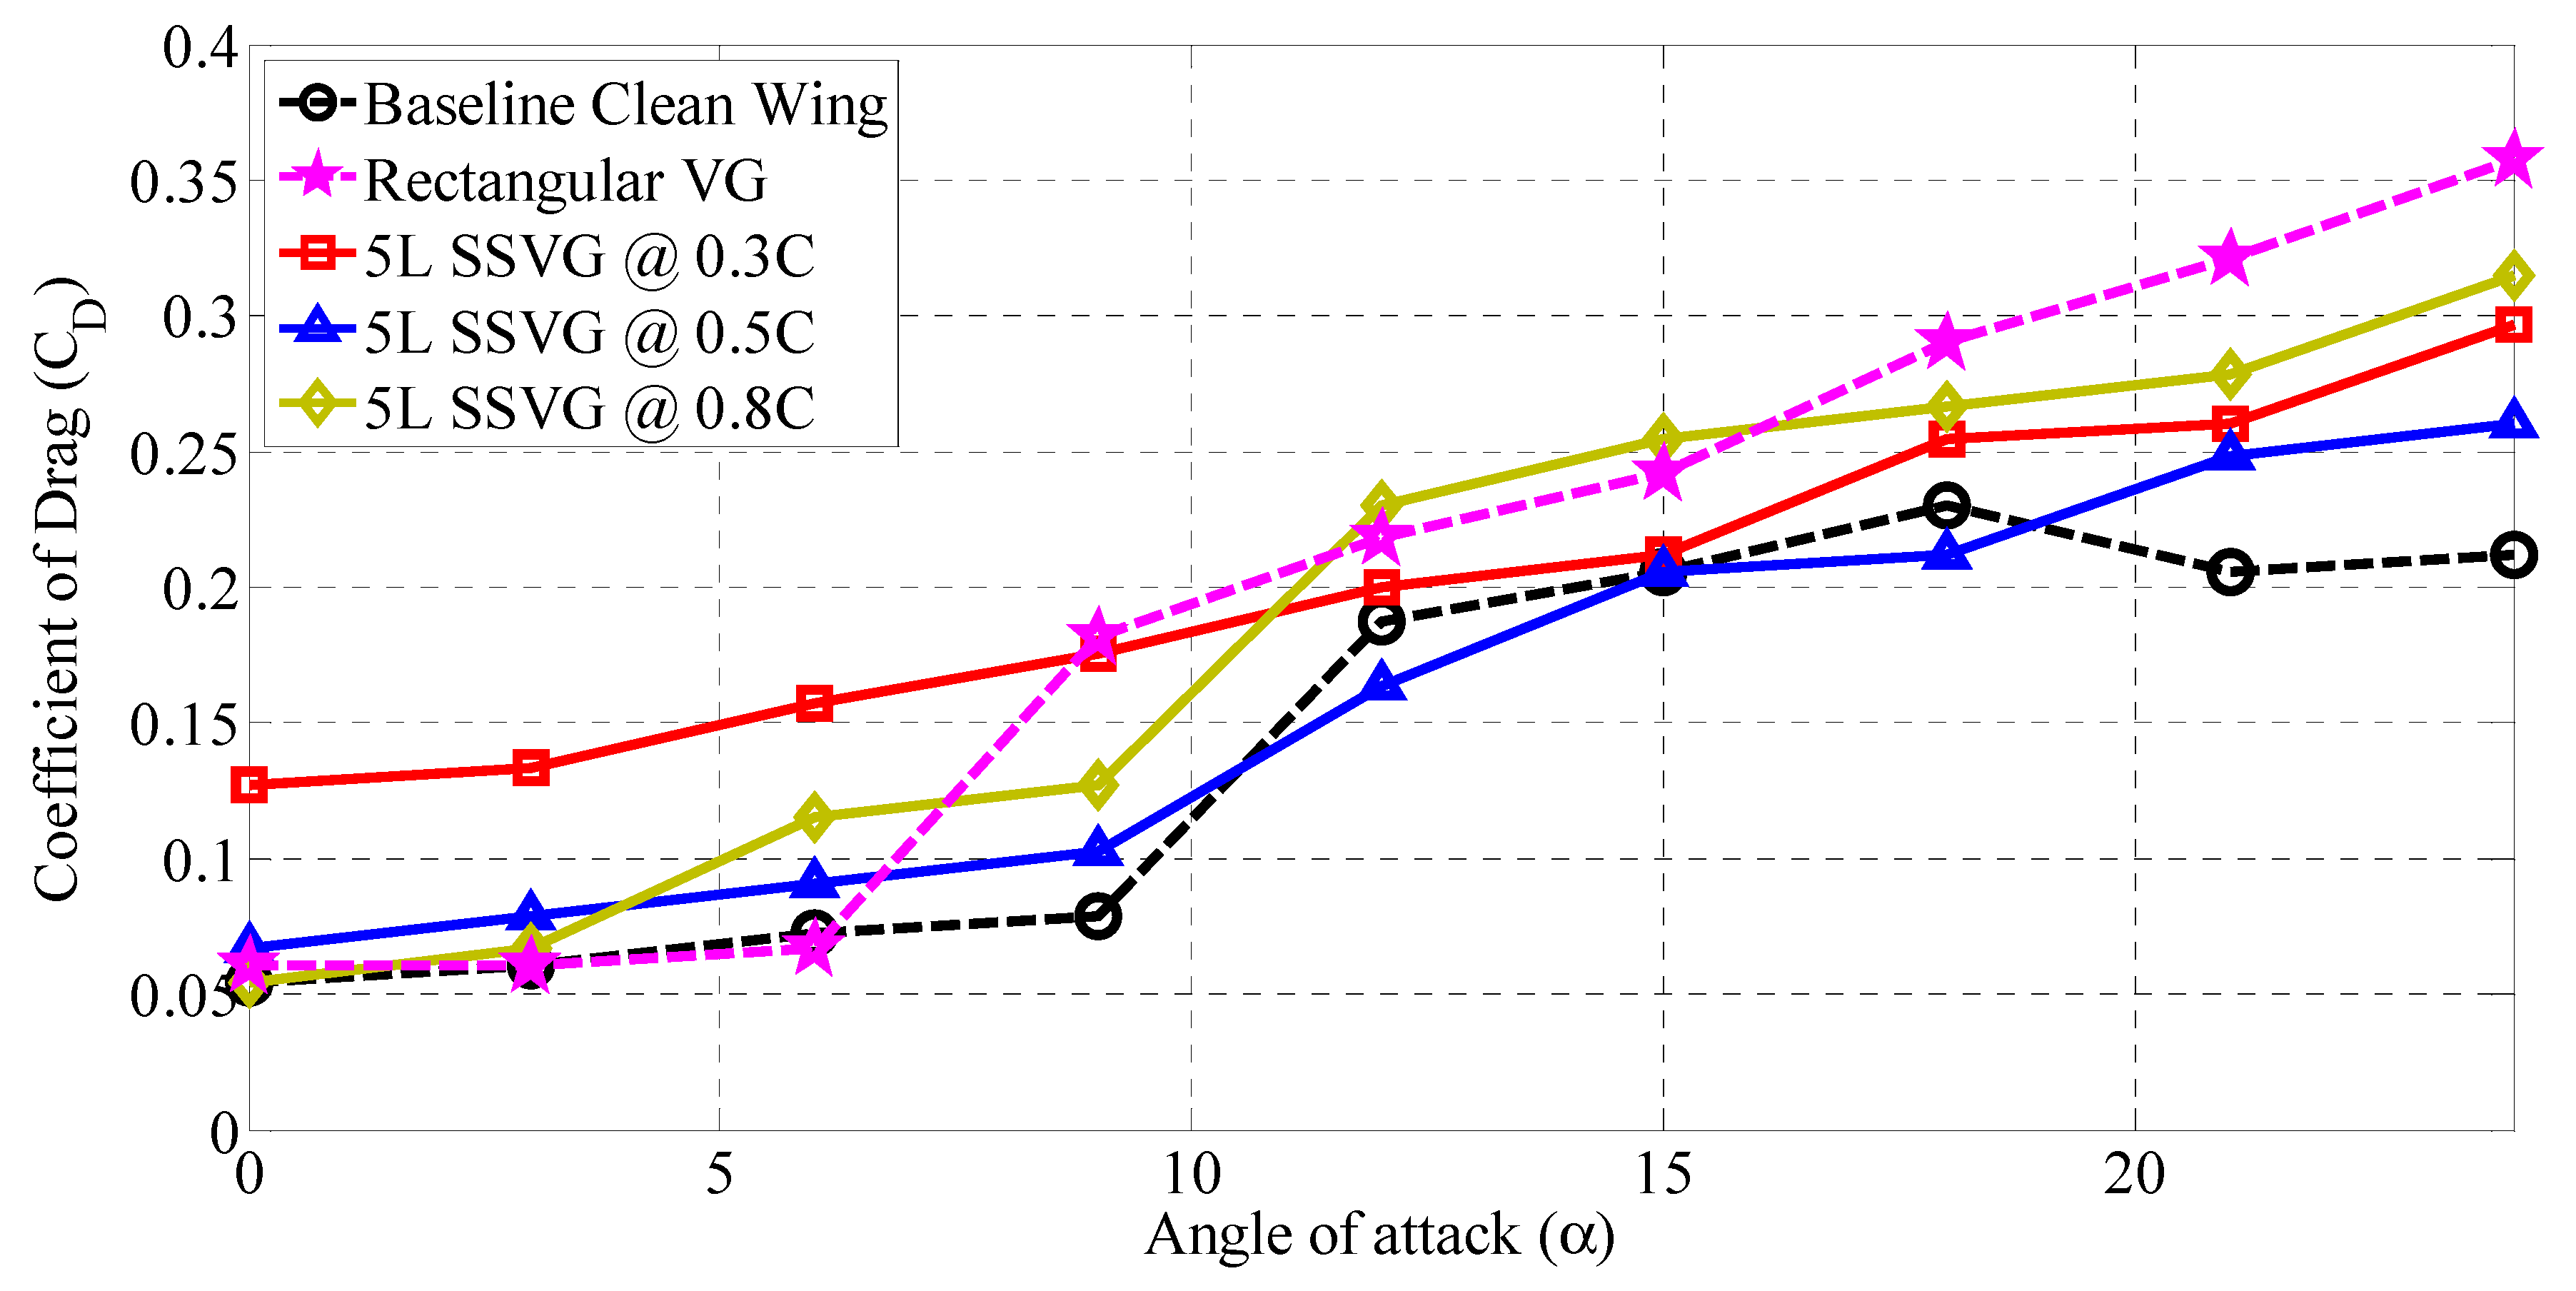
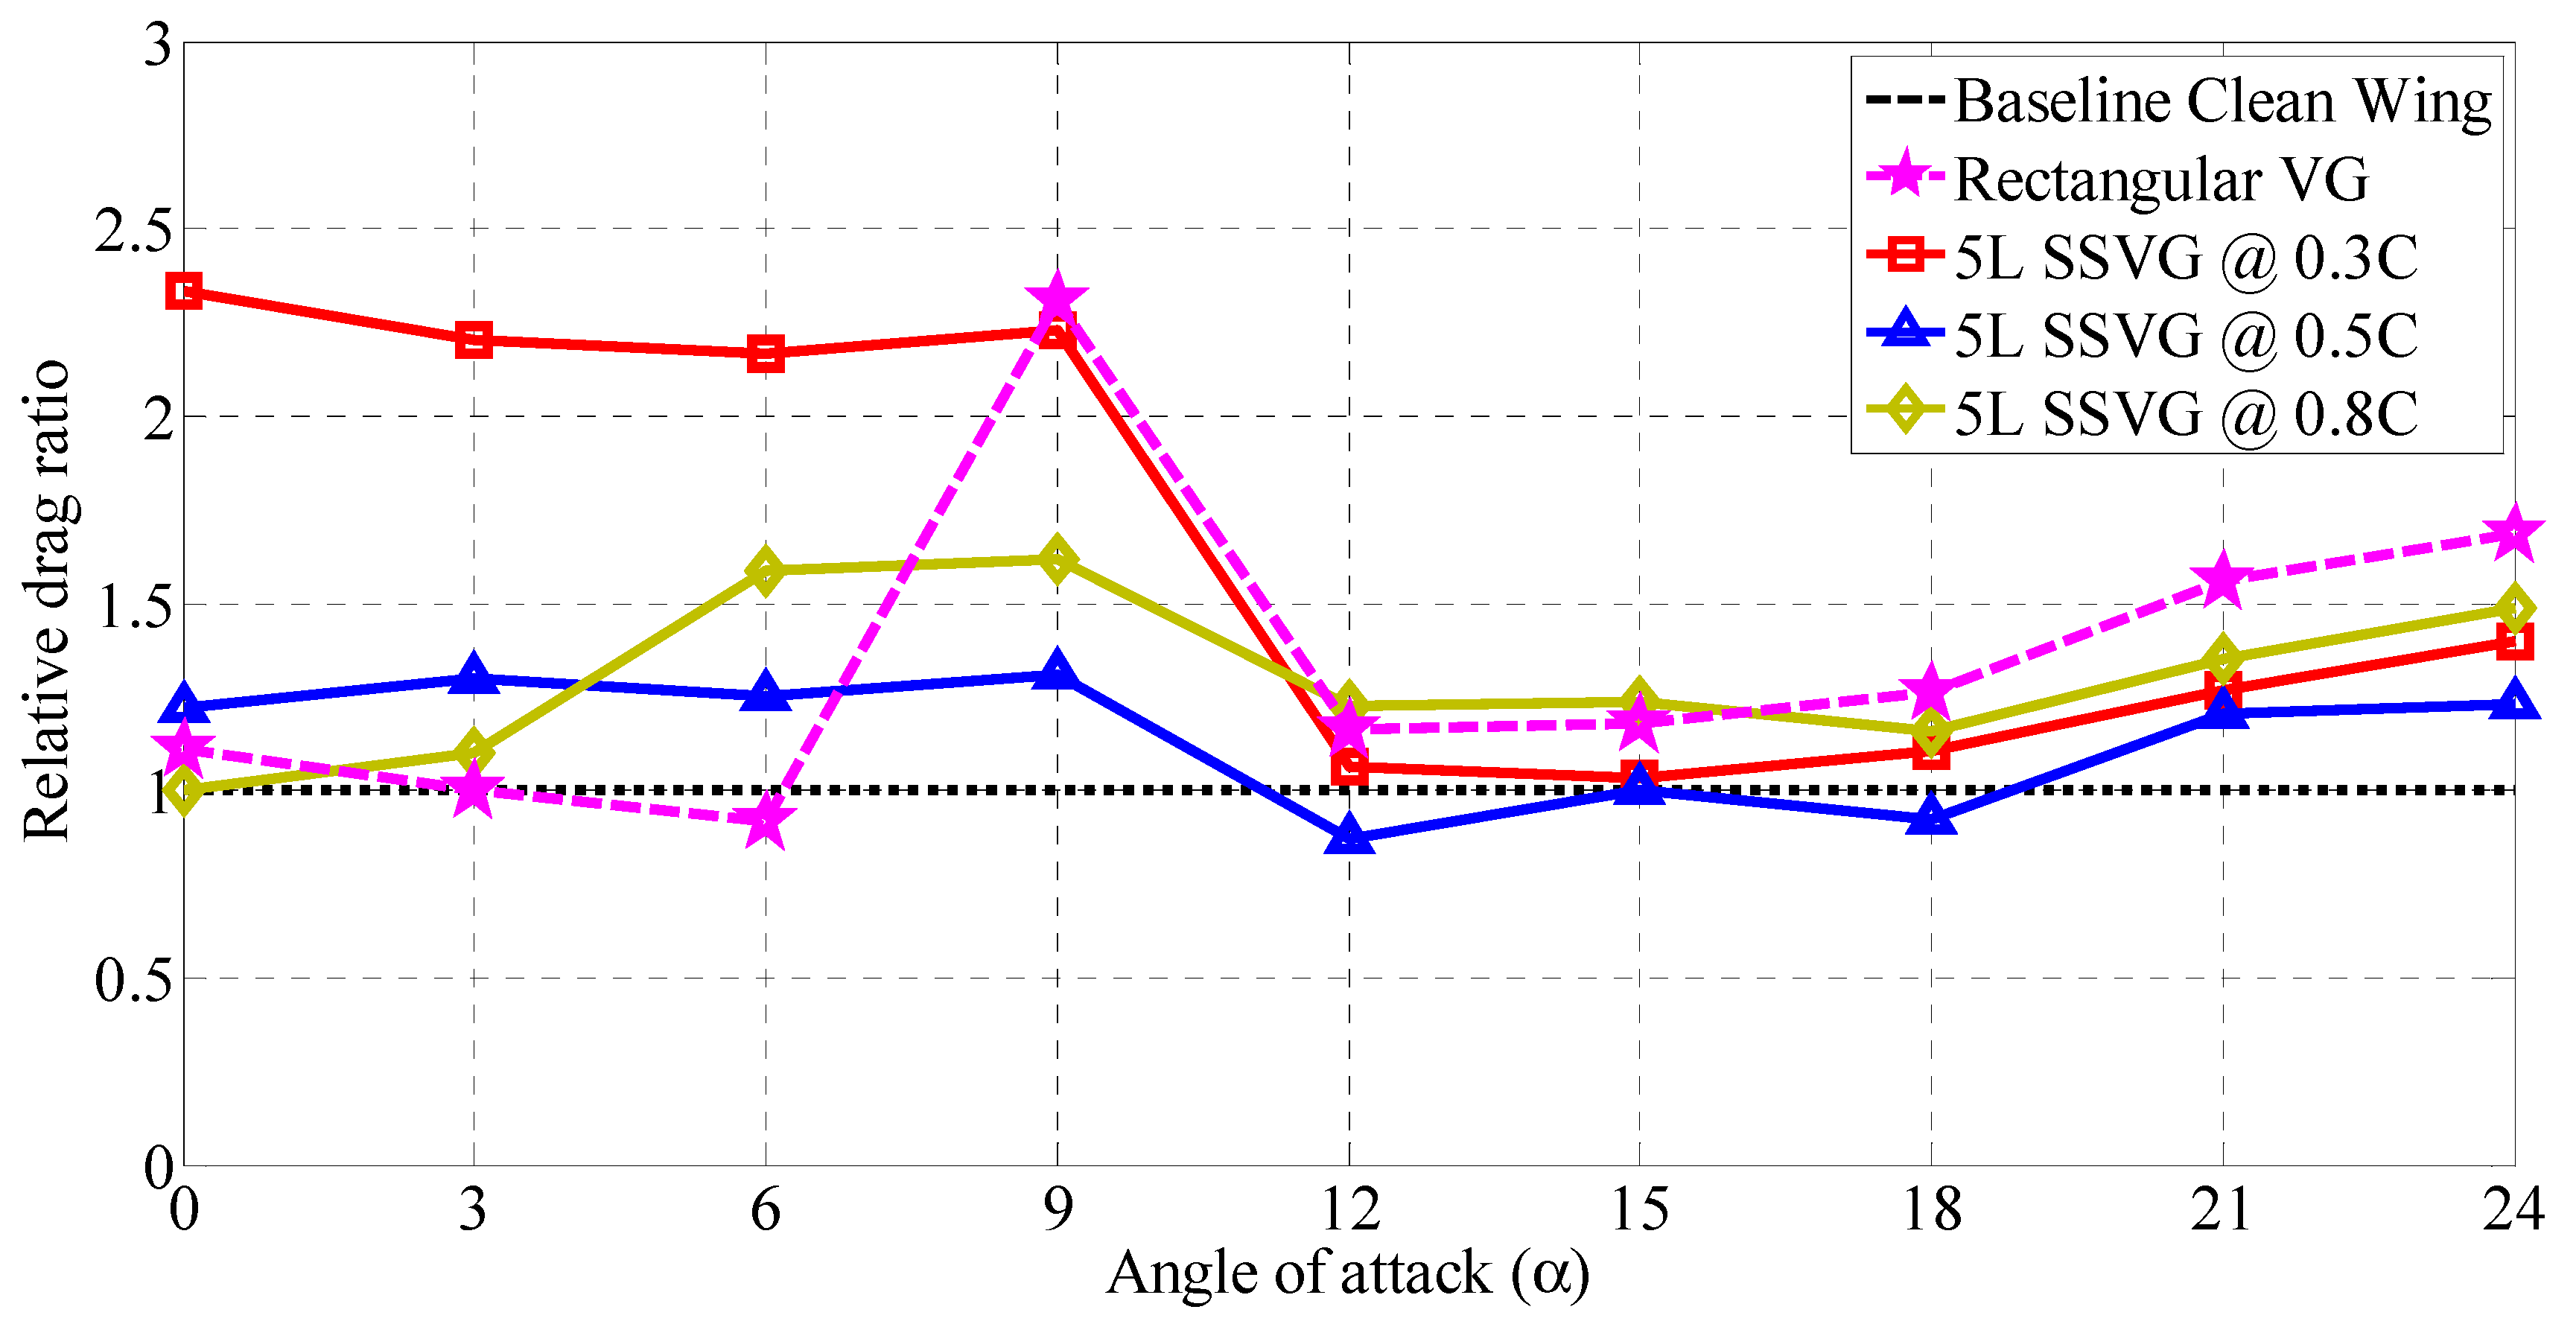
3.4. Influence of 5L Type SSVG at Various Chordwise Locations (x/C)
3.5. Understanding the Optimum Configuration of Modified Models with SSVG
4. Conclusions
- Incorporation of the 5S type SSVG at 0.8C chordwise distance of the airfoil enhance the lift coefficient () by about 3.80% when compared against the baseline NACA 0015 airfoil model.
- 5S type SSVG, when placed at 0.8C, showed that it is effective in delaying the stall by effectively mitigating the flow separation.
- Shark scale-inspired vortex generators of 5S type, when installed at 0.3C, exhibits the lowest drag coefficient () when compared against the baseline model.
- Shark scale-inspired vortex generators of the 5S type, when installed at 0.5C and 0.8C, offered better aerodynamic characteristics relative to the conventional rectangular VG.
Author Contributions
Funding
Conflicts of Interest
Nomenclature
| SSVG | Shark Scale Vortex Generator |
| VG | Vortex Generator |
| Re | Reynolds number |
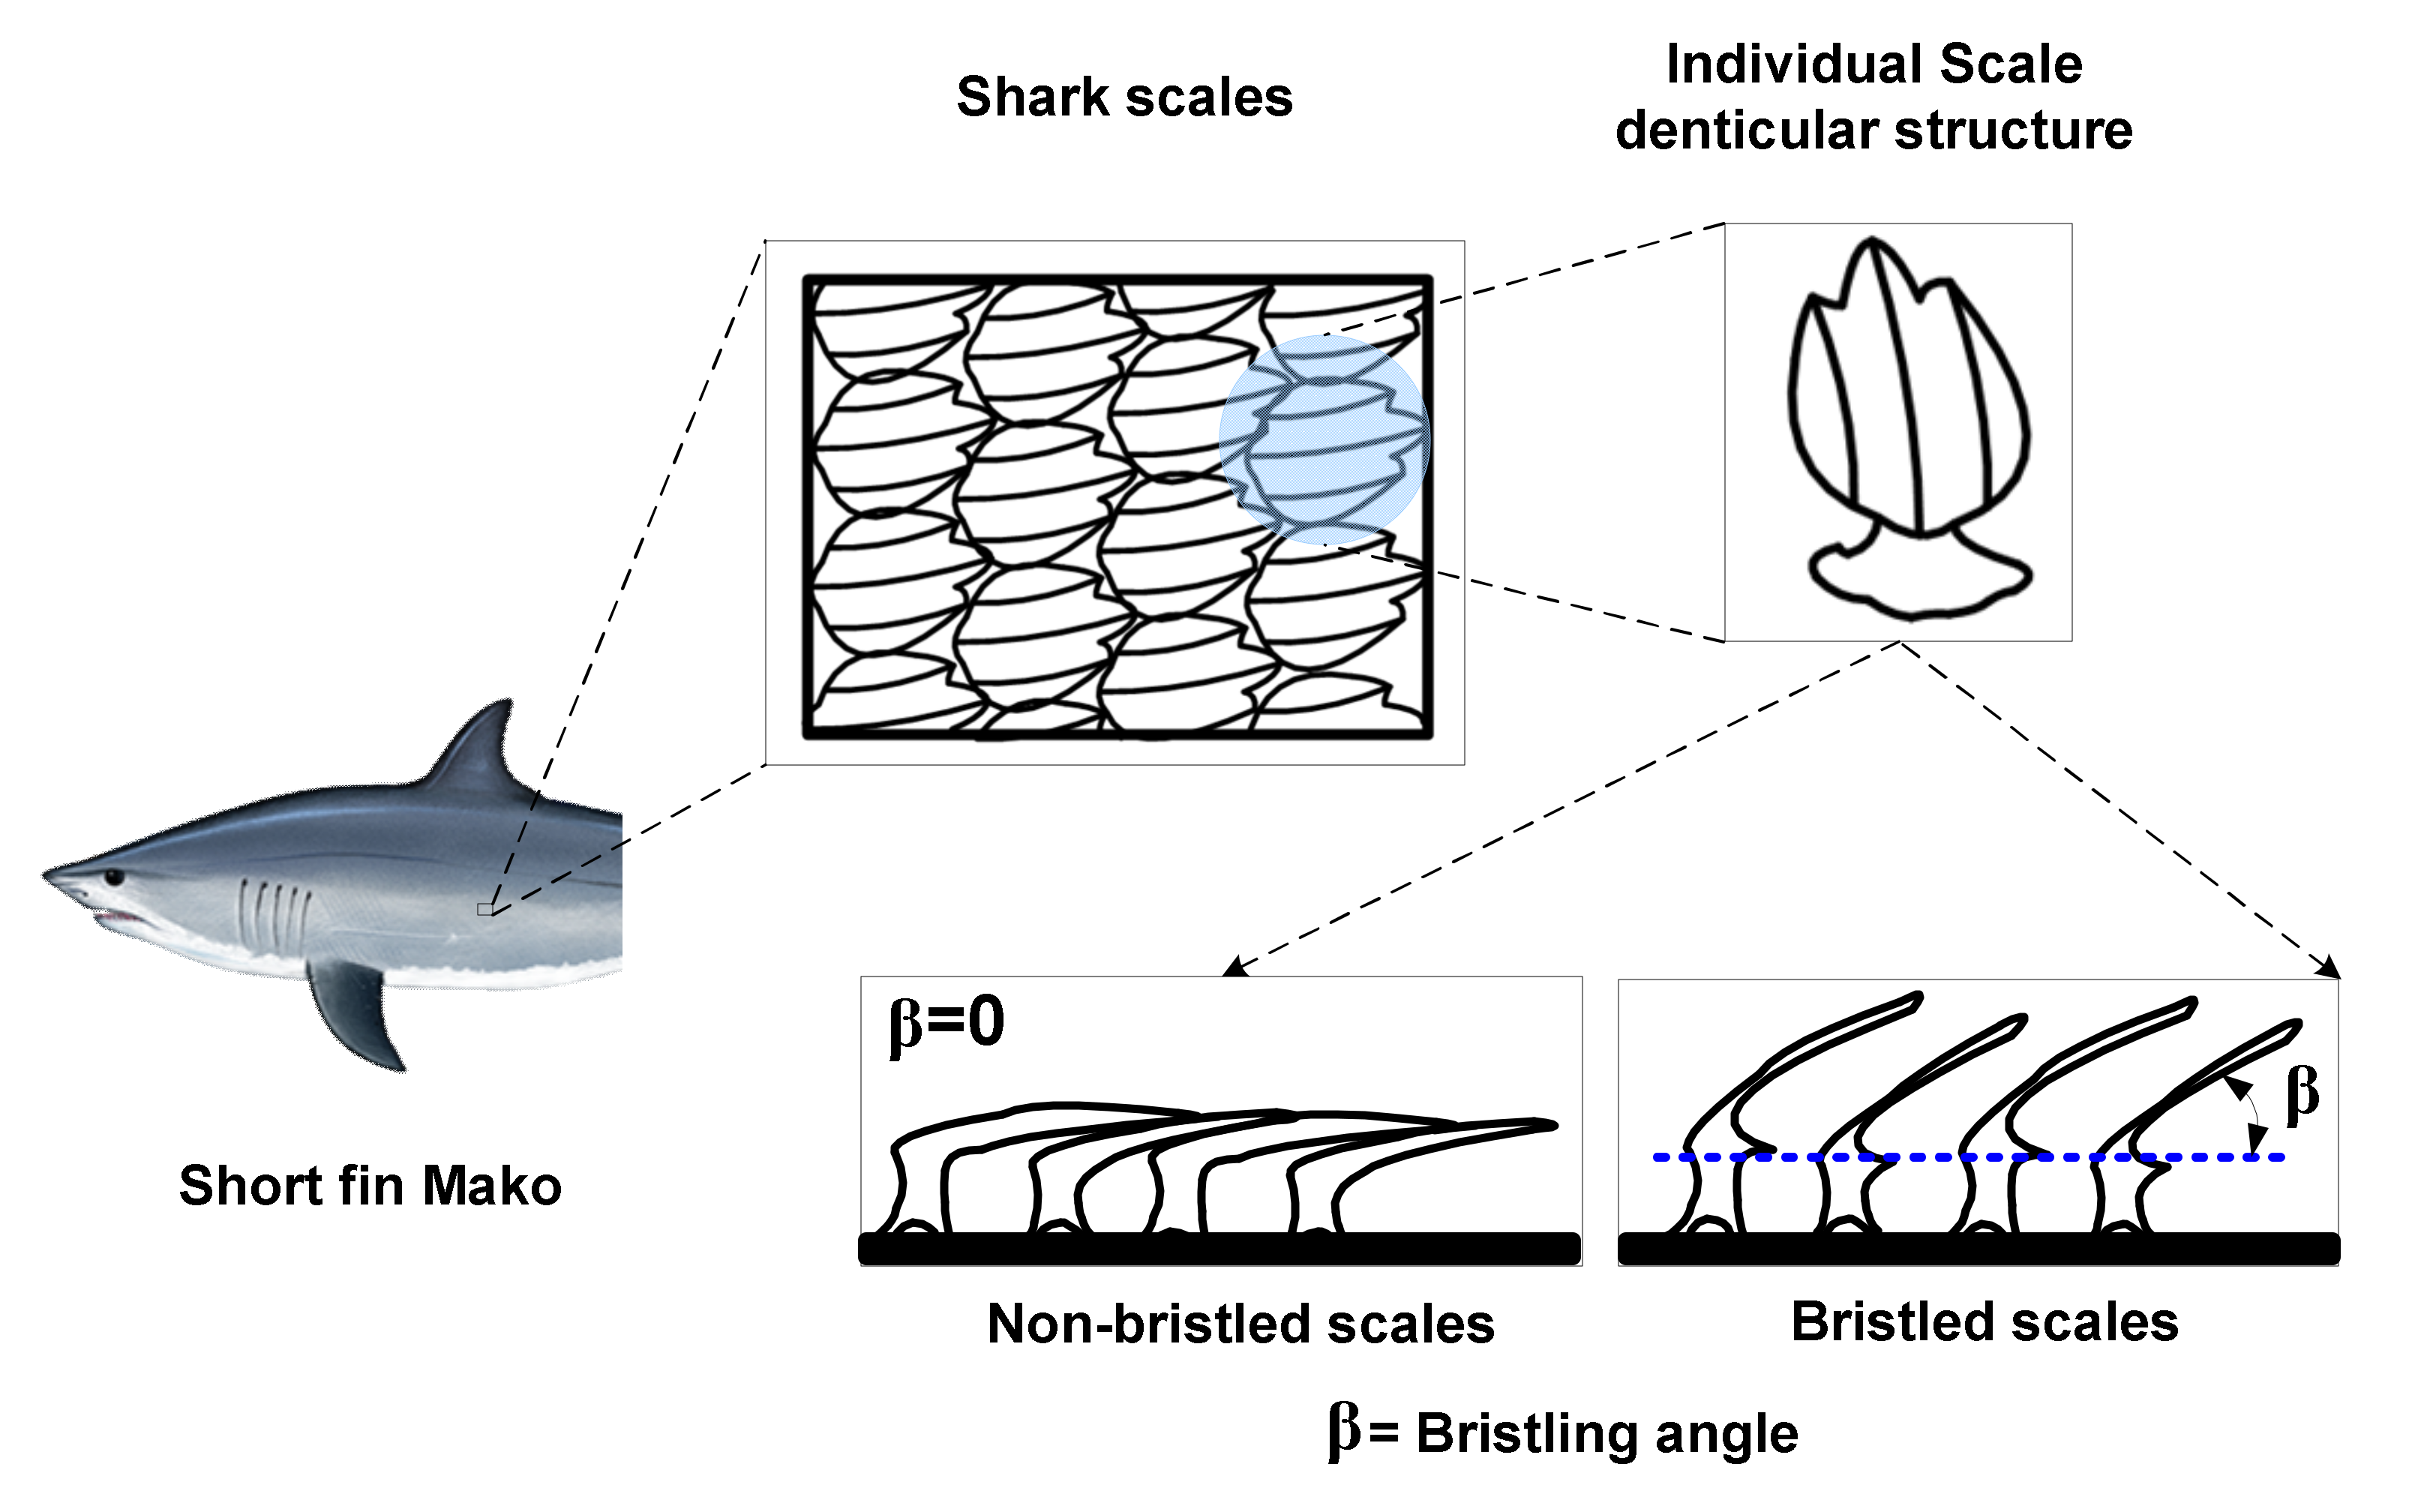
| β | Bristling angle |
| UAV | Unmanned Aerial Vehicle |
| MAV | Micro Aerial Vehicle |
| NACA | National Advisory Committee for Aeronautics |
| A | Amplitude (in mm) |
| λ | Wavelength (in mm) |
| c | Chordlength (in mm) |
| b | Span (in mm) |
| PLA | Poly lactic acid (or) Polylactide |
| MPS | Miniature Pressure Scanner |
| FL | Lift force |
| FD | Drag force |
| CL | Coefficient of lift |
| CLmax | Maximum coefficient of lift |
| CD | Coefficient of drag |
| CDmin | Minimum coefficient of drag |
| L/D | Aerodynamic efficiency |
| ρ | Density of fluid |
| v | Free-stream velocity |
| s | Wing area |
| dCL/dα | Lift curve slope |
| α | Angle of attack |
| αstall | Stalling angle of attack |
| x/C | Chordwise location |
References
- Choi, H.; Park, H.; Sagong, W.; Lee, S. Biomimetic flow control based on morphological features of living creatures. Phys. Fluids 2012, 24. [Google Scholar] [CrossRef]
- Feld, K.; Kolborg, A.N.; Nyborg, C.M.; Salewski, M.; Steffensen, J.F.; Berg-Sørensen, K. Dermal denticles of three slowly swimming shark species: Microscopy and flow visualization. Biomimetics 2019, 4, 38. [Google Scholar] [CrossRef] [Green Version]
- Raheem, M.A.; Edi, P.; Pasha, A.A.; Rahman, M.M.; Juhany, K. Numerical Study of Variable Camber Continuous Trailing Edge Flap at Off-Design Conditions. Energies 2019, 12, 3185. [Google Scholar] [CrossRef] [Green Version]
- Popp, M.; White, C.F.; Bernal, D.; Wainwright, D.K.; Lauder, G.V. The denticle surface of thresher shark tails: Three-dimensional structure and comparison to other pelagic species. J. Morphol. 2020, 281, 938–955. [Google Scholar] [CrossRef]
- Domel, A.G.; Saadat, M.; Weaver, J.C.; Haj-Hariri, H.; Bertoldi, K.; Lauder, G.V. Shark skin-inspired designs that improve aerodynamic performance. J. R. Soc. Interface 2018, 15. [Google Scholar] [CrossRef] [Green Version]
- Sudin, M.N.; Abdullah, M.A.; Shamsuddin, S.A.; Ramli, F.R.; Tahir, M.M. Review of research on vehicles aerodynamic drag reduction methods. Int. J. Mech. Mechatron. Eng. 2014, 14, 35–47. [Google Scholar]
- Bar-Cohen, Y. Introduction to Biomimetics: The Wealth of Inventions in Nature as an Inspiration for Human Innovation. In Biomimetics: Biologically Inspired Technologies; CRC Press: Boca Raton, FL, USA, 2006. [Google Scholar]
- Camhi, M.D.; Pikitch, E.K.; Babcock, E.A. Sharks of the Open Ocean: Biology, Fisheries and Conservation; Wiley: Hoboken, NJ, USA, 2009; p. 502. [Google Scholar] [CrossRef]
- Videler, J.J. Body surface adaptations to boundary-layer dynamics. Symp. Soc. Exp. Biol. 1995, 49, 1–20. [Google Scholar] [PubMed]
- Patricia, F.W.; Guzman, D.; Iñigo, B.; Urtzi, I.; Maria, B.J.; Manu, S. Morphological Characterization and Hydrodynamic Behavior of Shortfin Mako Shark (Isurus oxyrinchus) Dorsal Fin Denticles. J. Bionic Eng. 2019, 16, 730–741. [Google Scholar] [CrossRef]
- Lang, A.W.; Hidalgo, P. Cavity Flow Characterization of the Bristled Shark Skin Microgeometry. In Proceedings of the 47th AIAA Aerospace Sciences Meeting including the New Horizons Forum and Aerospace Exposition, Orlando, FL, USA, 5–8 January 2009. [Google Scholar]
- Motta, P.; Habegger, M.L.; Lang, A.; Hueter, R.; Davis, J. Scale morphology and flexibility in the shortfin mako Isurus oxyrinchus and the blacktip shark Carcharhinus limbatus. J. Morphol. 2012, 273, 1096–1110. [Google Scholar] [CrossRef]
- Lang, A.; Motta, P.; Habegger, M.L.; Hueter, R.; Afroz, F. Shark skin separation control mechanisms. Mar. Technol. Soc. J. 2011, 45, 208–215. [Google Scholar] [CrossRef]
- Bechert, D.W.; Bruse, M.; Hage, W.; Meyer, R. Fluid mechanics of biological surfaces and their technological application. Naturwissenschaften 2000, 87, 157–171. [Google Scholar] [CrossRef]
- Lang, A.W.; Bradshaw, M.T.; Smith, J.A.; Wheelus, J.N.; Motta, P.J.; Habegger, M.L.; Hueter, R.E. Movable shark scales act as a passive dynamic micro-roughness to control flow separation. Bioinspiration Biomim. 2014, 9. [Google Scholar] [CrossRef] [PubMed]
- Zhen, T.K.; Zubair, M.; Ahmad, K.A. Experimental and numerical investigation of the effects of passive vortex generators on Aludra UAV performance. Chin. J. Aeronaut. 2011, 24, 577–583. [Google Scholar] [CrossRef] [Green Version]
- Ashill, P.R.; Fulker, J.L.; Hackett, K.C. A review of recent developments in flow control. Aeronaut. J. 2005, 109, 205–232. [Google Scholar] [CrossRef]
- Lin, J.C. Review of research on low-profile vortex generators to control boundary-layer separation. Prog. Aerosp. Sci. 2002, 38, 389–420. [Google Scholar] [CrossRef]
- Fouatih, O.M.; Medale, M.; Imine, O.; Imine, B. Design optimization of the aerodynamic passive flow control on NACA 4415 airfoil using vortex generators. Eur. J. Mech.-B/Fluids 2016, 56, 82–96. [Google Scholar] [CrossRef]
- Wang, H.; Zhang, B.; Qiu, Q.; Xu, X. Flow control on the NREL S809 wind turbine airfoil using vortex generators. Energy 2017, 118, 1210–1221. [Google Scholar] [CrossRef]
- Zhi-yong, Z.; Wang-long, Z.; Zhi-hua, C.; Xiao-hui, S.; Chen-chao, X. Suction control of flow separation of a low-aspect-ratio wing at a low Reynolds number. Fluid Dyn. Res. 2018, 50, 065504. [Google Scholar] [CrossRef]
- Yousefi, K.; Saleh, R. Three-dimensional suction flow control and suction jet length optimization of NACA 0012 wing. Meccanica 2015, 50, 1481–1494. [Google Scholar] [CrossRef]
- You, D.; Moin, P. Active Control of Flow Separation Over an Airfoil Using Synthetic Jets, In Solid Mechanics and Its Applications; Springer Verlag: Heidelberg, Germany, 2009; Volume 14, pp. 551–561. [Google Scholar]
- Minelli, G.; Hartono, E.A.; Chernoray, V.; Hjelm, L.; Krajnović, S. Aerodynamic flow control for a generic truck cabin using synthetic jets. J. Wind Eng. Ind. Aerodyn. 2017, 168, 81–90. [Google Scholar] [CrossRef]
- Greenblatt, D.; Wygnanski, I.J. The Control of flow separation by periodic excitation. Prog. Aerosp. Sci. 2000, 36, 487–545. [Google Scholar] [CrossRef]
- Brunn, A.; Nitsche, W. Separation Control in an Axisymmetric Diffuser Flow by Periodic Excitation. In Engineering Turbulence Modelling and Experiments 5; Rodi, W., Fueyo, N., Eds.; Elsevier Science Ltd.: Oxford, UK, 2002; pp. 587–596. ISBN 978-0-08-044114-6. [Google Scholar]
- Yousefi, K.; Saleh, R. The effects of trailing edge blowing on aerodynamic characteristics of the naca 0012 airfoil and optimization of the blowing slot geometry. J. Theor. Appl. Mech. 2014, 52, 165–179. [Google Scholar] [CrossRef]
- Ganesh, N.; Arunvinthan, S.; Pillai, S. Effect of surface blowing on aerodynamic characteristics of tubercled straight wing. Chin. J. Aeronaut. 2019, 32, 1111–1120. [Google Scholar] [CrossRef]
- Raayai-Ardakani, S.; McKinley, G.H. Drag reduction using wrinkled surfaces in high Reynolds number laminar boundary layer flows. Phys. Fluids 2017, 29. [Google Scholar] [CrossRef]
- Raayai-Ardakani, S.; McKinley, G.H. Geometric optimization of riblet-textured surfaces for drag reduction in laminar boundary layer flows. Phys. Fluids 2019, 31. [Google Scholar] [CrossRef] [Green Version]
- Zhang, Y.; Yan, C.; Chen, H.; Yin, Y. Study of riblet drag reduction for an infinite span wing with different sweep angles. Chin. J. Aeronaut. 2020, 33, 3125–3137. [Google Scholar] [CrossRef]
- Ismail, M.F.; Vijayaraghavan, K. The effects of aerofoil profile modification on a vertical axis wind turbine performance. Energy 2015, 80, 20–31. [Google Scholar] [CrossRef]
- Jones, G.; Santer, M.; Debiasi, M.; Papadakis, G. Control of flow separation around an airfoil at low Reynolds numbers using periodic surface morphing. J. Fluids Struct. 2018, 76, 536–557. [Google Scholar] [CrossRef] [Green Version]
- Luo, H.; Qiao, W.; Xu, K. Passive control of laminar separation bubble with spanwise groove on a low-speed highly loaded low-pressure turbine blade. J. Therm. Sci. 2009, 18, 193–201. [Google Scholar] [CrossRef]
- Seo, S.-H.; Hong, C.-H. Performance improvement of airfoils for wind blade with the groove. Int. J. Green Energy 2015, 13, 34–39. [Google Scholar] [CrossRef]
- Law, Y.Z.; Jaiman, R.K. Passive control of vortex-induced vibration by spanwise grooves. J. Fluids Struct. 2018, 83, 1–26. [Google Scholar] [CrossRef]
- Mu, T.; Zhang, R.; Xu, H.; Zheng, Y.; Fei, Z.; Li, J. Study on improvement of hydraulic performance and internal flow pattern of the axial flow pump by groove flow control technology. Renew. Energy 2020, 160, 756–769. [Google Scholar] [CrossRef]
- McAuliffe, B.R.; Yaras, M.I. Passive manipulation of separation-bubble transition using surface modifications. J. Fluids Eng. 2009, 131. [Google Scholar] [CrossRef]
- D’Alessandro, V.; Clementi, G.; Giammichele, L.; Ricci, R. Assessment of the dimples as passive boundary layer control technique for laminar airfoils operating at wind turbine blades root region typical Reynolds numbers. Energy 2019, 170, 102–111. [Google Scholar] [CrossRef]
- Robarge, T.W.; Stark, A.M.; Min, S.; Khalatov, A.A.; Byerley, A. Design Considerations for Using Indented Surface Treatments to Control Boundary Layer Separation. In Proceedings of the 42nd AIAA Aerospace Sciences Meeting and Exhibit, Reno, NV, USA, 5–8 January 2004; pp. 1–10. [Google Scholar]
- Huang, L.; Huang, P.G.; LeBeau, R.P.; Hauser, T. Numerical study of blowing and suction control mechanism on NACA0012 airfoil. J. Aircr. 2004, 41, 1005–1013. [Google Scholar] [CrossRef]
- Junxuan, C.; Xun, G.Z. Numerical study on drag reduction by micro-blowing/suction compounding flow control on supercritical airfoil. Procedia Eng. 2015, 99, 613–617. [Google Scholar] [CrossRef] [Green Version]
- Akansu, Y.E.; Karakaya, F.; Şanlisoy, A. Active control of flow around NACA 0015 airfoil by using DBD plasma actuator. EPJ Web Conf. 2013, 45. [Google Scholar] [CrossRef] [Green Version]
- Guoqiang, L.; Weiguo, Z.; Yubiao, J.; Pengyu, Y. Experimental investigation of dynamic stall flow control for wind turbine airfoils using a plasma actuator. Energy 2019, 185, 90–101. [Google Scholar] [CrossRef]
- Arunvinthan, S.; Pillai, S.; Cao, S. Aerodynamic characteristics of variously modified leading-edge protuberanced (LEP) wind turbine blades under various turbulent intensities. J. Wind Eng. Ind. Aerodyn. 2020, 202, 104188. [Google Scholar] [CrossRef]
- Zhang, Y.; Zhang, X.; Li, Y.; Chang, M.; Xu, J. Aerodynamic performance of a low-Reynolds UAV with leading-edge protuberances inspired by humpback whale flippers. Chin. J. Aeronaut. 2021, 34. [Google Scholar] [CrossRef]
- Custodio, D.; Henoch, C.W.; Johari, H. Aerodynamic characteristics of finite span wings with leading-edge protuberances. AIAA J. 2015, 53, 1878–1893. [Google Scholar] [CrossRef]
- Sicot, C.; Devinant, P.; Loyer, S.; Hureau, J. Rotational and turbulence effects on a wind turbine blade.Investigation of the stall mechanisms. J. Wind Eng. Ind. Aerodyn. 2008, 96, 1320–1331. [Google Scholar] [CrossRef]
- Li, Q.; Maeda, T.; Kamada, Y.; Murata, J.; Furukawa, K.; Yamamoto, M. Effect of number of blades on aerodynamic forces on a straight-bladed Vertical Axis Wind Turbine. Energy 2015, 90, 784–795. [Google Scholar] [CrossRef]
- Abohela, I.; Hamza, N.; Dudek, S. Effect of roof shape, wind direction, building height and urban configuration on the energy yield and positioning of roof mounted wind turbines. Renew. Energy 2013, 50, 1106–1118. [Google Scholar] [CrossRef]
- Roach, P.E. The generation of nearly isotropic turbulence downstream of streamwise tube bundles. Int. J. Heat Fluid Flow 1986, 7, 117–125. [Google Scholar] [CrossRef]
- Arunvinthan, S.; Pillai, S. Aerodynamic characteristics of unsymmetrical aerofoil at various turbulence intensities. Chin. J. Aeronaut. 2019, 32, 2395–2407. [Google Scholar] [CrossRef]


| Methodology | Categorization | Reference |
|---|---|---|
| Vortex generators | Passive | Fouatih et al. [19], Wang et al. [20] |
| Suction | Active | Zhi-yong et al. [21], Yousefi et al. [22] |
| Synthetic jets | Active | You et al. [23], Minelli et al. [24] |
| Periodic excitation | Active | Greenblatt et al. [25], Brunn et al. [26] |
| Blowing | Active | Yousefi et al. [27], Ganesh et al. [28], |
| Surface wrinkling | Passive | Raayai-Ardakani et al. [29] |
| Riblets | Passive | Raayai-Ardakani et al. [30], Zhang et al. [31] |
| Morphing/geometrical profile modification | Passive | Ismail et al. [32], Jones et al. [33] |
| Spanwise groove | Passive | Luo et al. [34], Law et al. [35] |
| Grooves | Passive | Seo et al. [36], Mu et al. [37] |
| Surface modification | Passive | McAuliffe et al. [38], D’Allesandro [39] |
| Indents/ surface treatments | Passive | Robarge et al. [40] |
| Blowing and suction | Hybrid | Huang et al. [41], Junxuan et al. [42] |
| Plasma | Active | Akansu et al. [43], Guoqiang et al. [44] |
| Leading-edge protuberances | Passive | Arunvinthan et al. [45], Zhanget al. [46] |
| Label | Chord (mm) | Span (mm) | Amplitude (A) (in mm) | Wavelength (λ) (in mm) |
|---|---|---|---|---|
| 5S | 10 | 6 | 2 | 3 |
| 5M | 20 | 12 | 3 | 6 |
| 5L | 30 | 18 | 4 | 9 |
| Label | Parameter | Baseline | Modified | Benefits |
|---|---|---|---|---|
| 5S@0.8C | CLmax | 0.63 | 0.66 | 3.80% increment |
| 5S@0.8C | α at CLmax | 9° | 12° | Extended operating range |
| 5S@0.3C | CDmin | 0.05 | 0.04 | Maximum drag reduction by 20% |
| 5S@0.8C | αstall, degree | 9° | 12° | Stall delay by 3° |
Publisher’s Note: MDPI stays neutral with regard to jurisdictional claims in published maps and institutional affiliations. |
© 2021 by the authors. Licensee MDPI, Basel, Switzerland. This article is an open access article distributed under the terms and conditions of the Creative Commons Attribution (CC BY) license (http://creativecommons.org/licenses/by/4.0/).
Share and Cite
Arunvinthan, S.; Raatan, V.S.; Nadaraja Pillai, S.; Pasha, A.A.; Rahman, M.M.; A. Juhany, K. Aerodynamic Characteristics of Shark Scale-Based Vortex Generators upon Symmetrical Airfoil. Energies 2021, 14, 1808. https://doi.org/10.3390/en14071808
Arunvinthan S, Raatan VS, Nadaraja Pillai S, Pasha AA, Rahman MM, A. Juhany K. Aerodynamic Characteristics of Shark Scale-Based Vortex Generators upon Symmetrical Airfoil. Energies. 2021; 14(7):1808. https://doi.org/10.3390/en14071808
Chicago/Turabian StyleArunvinthan, S., V.S. Raatan, S. Nadaraja Pillai, Amjad A. Pasha, M. M. Rahman, and Khalid A. Juhany. 2021. "Aerodynamic Characteristics of Shark Scale-Based Vortex Generators upon Symmetrical Airfoil" Energies 14, no. 7: 1808. https://doi.org/10.3390/en14071808