Article

In Situ Tests of the Monitoring and Diagnostic System for Individual Photovoltaic Panels

by
Mariusz Woszczyński
1,*,
Joanna Rogala-Rojek
1,
Sławomir Bartoszek
1,
Marian Gaiceanu
2,
Krzysztof Filipowicz
3 and
Krzysztof Kotwica
4
1
KOMAG Institute of Mining Technology, Pszczyńska 37, 44-101 Gliwice, Poland
2
Department of Automatic Control and Electrical Engineering, Faculty of Automatic Control, Computers Science, Electrical and Electronics Engineering, Dunarea de Jos University of Galati, Domneasca Street 47, 800008 Galati, Romania
3
Faculty of Mining, Safety Engineering and Industrial Automation, Silesian University of Technology, ul. Akademicka 2, 44-100 Gliwice, Poland
4
Faculty of Mechanical Engineering and Robotics, AGH University of Science and Technology in Kraków, al. Mickiewicza 30, 30-059 Kraków, Poland
*
Author to whom correspondence should be addressed.
Energies 2021, 14(6), 1770; https://doi.org/10.3390/en14061770
Submission received: 25 February 2021 / Revised: 17 March 2021 / Accepted: 18 March 2021 / Published: 22 March 2021
(This article belongs to the Special Issue The IMTech 2021 Innovative Mining Technologies)

Abstract

:
The dynamic development of photovoltaic systems in the world and in Poland is mainly related to the drop in prices of installation components. Currently, electricity from photovoltaics is one of the cheapest renewable energy sources. The basis for effective energy generation is, first of all, failure-free operation of the photovoltaic system over a long period of operation, up to 30 years. The paper presents the results of a study of a low-cost distributed system for monitoring and diagnosis of photovoltaic installations (SmartPV), capable of assessing the operating parameters of individual photovoltaic panels. The devices were tested by connecting them to an existing photovoltaic installation, allowing the measurement of operational parameters of individual photovoltaic panels as well as operating conditions such as illuminance and panel surface temperature. The data were recorded on a server using wireless Wi-Fi transmission. Interesting data were collected during the tests, confirming the usefulness of the suggested device for monitoring the photovoltaic installations. Differences in performance of the photovoltaic panel depending on solar radiation and surface temperature were recorded. The temperature coefficient of power was determined, allowing for increased accuracy in the prediction of generated power. The correct recording in different situation, i.e., shading, sensor damage or weather anomalies, was verified. Based on the collected data, rules will be defined for an expert application which, in combination with SmartPV devices, will ensure a quick response to any malfunctions of the photovoltaic system, both related to failures and those resulting from natural degradation during operation.

Graphical Abstract

1. Introduction

1.1. Photovoltaics in the World and in Poland

Solar radiation reaching the Earth’s surface is the largest potential source of available energy. The annual flux of solar radiation exceeds the global energy demand by 30,000 times (Figure 1). The photovoltaic (PV) leader in Europe is not Spain or Italy, as it may seem, but Germany. Against common belief, the hot weather in southern Europe is not good for photovoltaic panels or the power grid. High temperatures cause warming up of the cells, which significantly reduces their efficiency. Therefore, the photovoltaic panels produce less energy. Poland and the United Kingdom are also at the forefront of countries using the energy from the sun, which has up to 25% less sunshine than Germany, but they are still good enough for photovoltaics to bring real benefits.
The performance of photovoltaic panels in Poland is so good that the share of photovoltaics in the Polish energy mix should keep growing. Due to its geographical location, Poland is a very good place to invest in the photovoltaic sector.
By the end 2020, photovoltaic installations in the Polish power system reached a capacity close to 4 GW. This means an annual increase of over 250% [2]. The photovoltaic industry in Poland is developing dynamically. It can be considered ironic that the coal industry—a producer of the main fuel for the Polish energy sector—is becoming increasingly interested in investing in renewable energy. Waste dumps are an integral part of the landscape of the regions with post-mining areas. To a large extent, they are areas that disfigure the environment and should be revitalised. In connection with the huge increase in interest in photovoltaics in Poland, the mining industry is gaining profitable ways of managing unexploited mining areas. For example, in 2020, one of the Polish mining companies launched a new 3 MWp (peak) photovoltaic power plant. They have announced that it is also preparing other PV projects, including much larger ones, with capacities of 66 and 30 MW, respectively [3]. The power of photovoltaic panels installed in Poland is being increased mainly by company investors, but the state support system, including subsidies from the “My current” program, also plays a very important role [4]. This has resulted in new photovoltaic installations of around 730 MW, and this program could potentially fund up to 1.2 GW of photovoltaic capacity. Taking into account the subsidies, the period of return on private investment is currently 6 to 7 years, assuming that the installation will operate without any failures.

1.2. Monitoring of PV Installations

The basis for the efficient generation of electricity in photovoltaic systems is their failure-free operation over the long lifetime of the system (up to 30 years) and a fast return on investment. The long-term operation of photovoltaic installations is mainly influenced by conditions changes (including weather) and the quality of the components used. In order to guarantee high reliability of the installed PV modules, a fast, simple and reliable method of checking their efficiency is required, both at the production stage and during normal operation. Attempts have already been made to develop monitoring systems for photovoltaic panels, based on data from climate services [5] or on thermographic analysis [6]. The possibility of monitoring the electrical parameters of both whole strings (arrays) [7] and single photovoltaic panels [8] was analysed.
If one of the PV panels is damaged during operation, the efficiency of the installation will be reduced in relation to the project assumptions [9], and the owner will face a significantly extended payback period. It is not always possible to quickly detect cell damage in PV panels caused by a “hot-spot”, i.e., thermal damage to the cell, which can be caused, e.g., by its partial shading. Such a situation results from the fact that the shaded cell does not process solar energy and does not produce electricity, but the current flowing through it from the remaining, efficient PV modules causes overheating and damage to the cell [10,11]. Experience shows that the weather conditions in which the photovoltaic panels work have an impact on their aging and damage occurrence [12]. If this type of damage is to be detected earlier, it would be possible to automatically use bypass systems, which would shut down or limit the flow of current through the non-functioning cell.
The quality assessment of the photovoltaic system in Poland should be based on documented data collected in accordance with the recommendations of the standard: PN-EN 61724:2002—Monitoring of photovoltaic system performance—Guidelines for measurements, data exchange and analysis. This requires mandatory monitoring of solar radiation intensity, ambient temperature, temperature of PV modules and electrical parameters of PV system operation. Standard PN-EN 61724:2002 contains general guidelines for monitoring the properties of photovoltaic systems. It also regulates energy monitoring procedures based on the characteristics of a photovoltaic (PV) system [13].

1.3. Pollution of PV Installations

During the operation of a photovoltaic power plant, breakdowns may occur due to damage to the inverter, cables, photovoltaic panels or their manufacturing defects. However, these are random situations which are beyond the user’s control, but it is certain that the panels will get dirty [14,15]. For many years, manufacturers of photovoltaic modules have ensured that if the modules are operated under normal atmospheric conditions, and they do not need to be washed due to the self-cleaning of the surface. It has been argued that cleaning the modules will cause mechanical failures. However, practice proves otherwise. In rural areas, a big problem is caused by the air polluted in the result of agricultural work, which becomes rich in organic substances, and these easily stick to the surface of the modules. This type of dirt will not be removed by rain, but on the contrary, it will accumulate over time and require considerable maintenance. In the relatively short term, this will lead to a 10% or more loss of module performance. Design errors in the installation of PV systems also increase the level of residual soiling of the modules, e.g., modules that are horizontal are quickly polluted, and their performance drops significantly. The ability to partially self-clean the modules only appears when the inclination exceeds 15 degrees.
According to one of the Polish manufacturers of photovoltaic panels, the average annual decrease in power, under normal operating conditions, with typical rainfall and lack of spot pollution is about 4.4%, but with the lack of rainfall, in industrialised areas, with the aerosols and spot pollution as much as 20%. The frequency of cleaning is a matter of dispute. It is recommended to remove dirt on average 2–4 times a year (preferably after a period of grass and tree pollination), but this operation should be approached rationally. Experimental studies on the influence of cleaning on the efficiency of the installation were carried out in Iraq [16], but the economic aspects were not presented. In Poland, the cost of panel cleaning is from 1–2.5 EUR per m2 (for installations with areas larger than 100 m2). For example, in the case of 50 kWp installations, with an area of about 375 m2, the annual revenue from electricity generation is 6250 EUR. In case of a 15% drop in panel pollution, the revenue is reduced by about 900 EUR. The cost of cleaning photovoltaic panels is about 730 EUR. As it can be seen from the example above, the efficiency is low. It would be unprofitable to clean the panels twice a year, so it is important to monitor the installation and obtain reliable information on the degree of pollution of panel surfaces.

1.4. SmartPV—PV Monitoring System at a Fair Price

An analysis of the photovoltaic market, in the context of changing legal aspects, has confirmed the increased demand for continuous monitoring systems for PV systems. There are IOT (Internet of Things)-based monitoring systems for photovoltaic installations, but they focus on a higher level of installation—inverter data collection and management (data from a whole array of PV panels, without the possibility to identify them) [17]. There are also solutions to collect data from each PV panel (such as microinverters), but these are not popular, mainly due to the price of such a system. In addition, microinverters monitor electrical data without reference to the panel temperature and illumination.
The electrical performance of a loaded PV module depends on the resistance of the load, the insolation and its temperature. The surface temperature of the module increases due to a number of factors, which include:
  • Absorption of solar radiation (absorption of photons, which does not generate charge pairs);
  • Ambient temperature;
  • Heat generated as a result of current flow through the p-n junction.
The most common method currently used to monitor the surface temperature of photovoltaic panels is the use of thermal imaging cameras. This is a very effective method of detecting anomalies in photovoltaic installations, but it is difficult to imagine continuous thermographic monitoring, especially on large installations. The suggested SmartPV system is a cost-effective solution that can be used in both new and existing photovoltaic installations. The use of widely available and popular solutions makes it possible to build the device at a reasonable price. In series production, the manufacturing cost is estimated at around 40 EUR. Figure 2 presents a 3D model of the target version of the device, which will be launched on the market. The casing is equipped with a dedicated bracket, which simplifies mounting the device to the supporting structure of photovoltaic panels.
The main advantages of the SmartPV system, are the following:
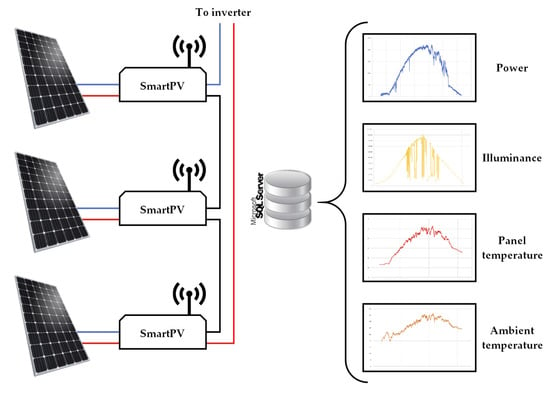
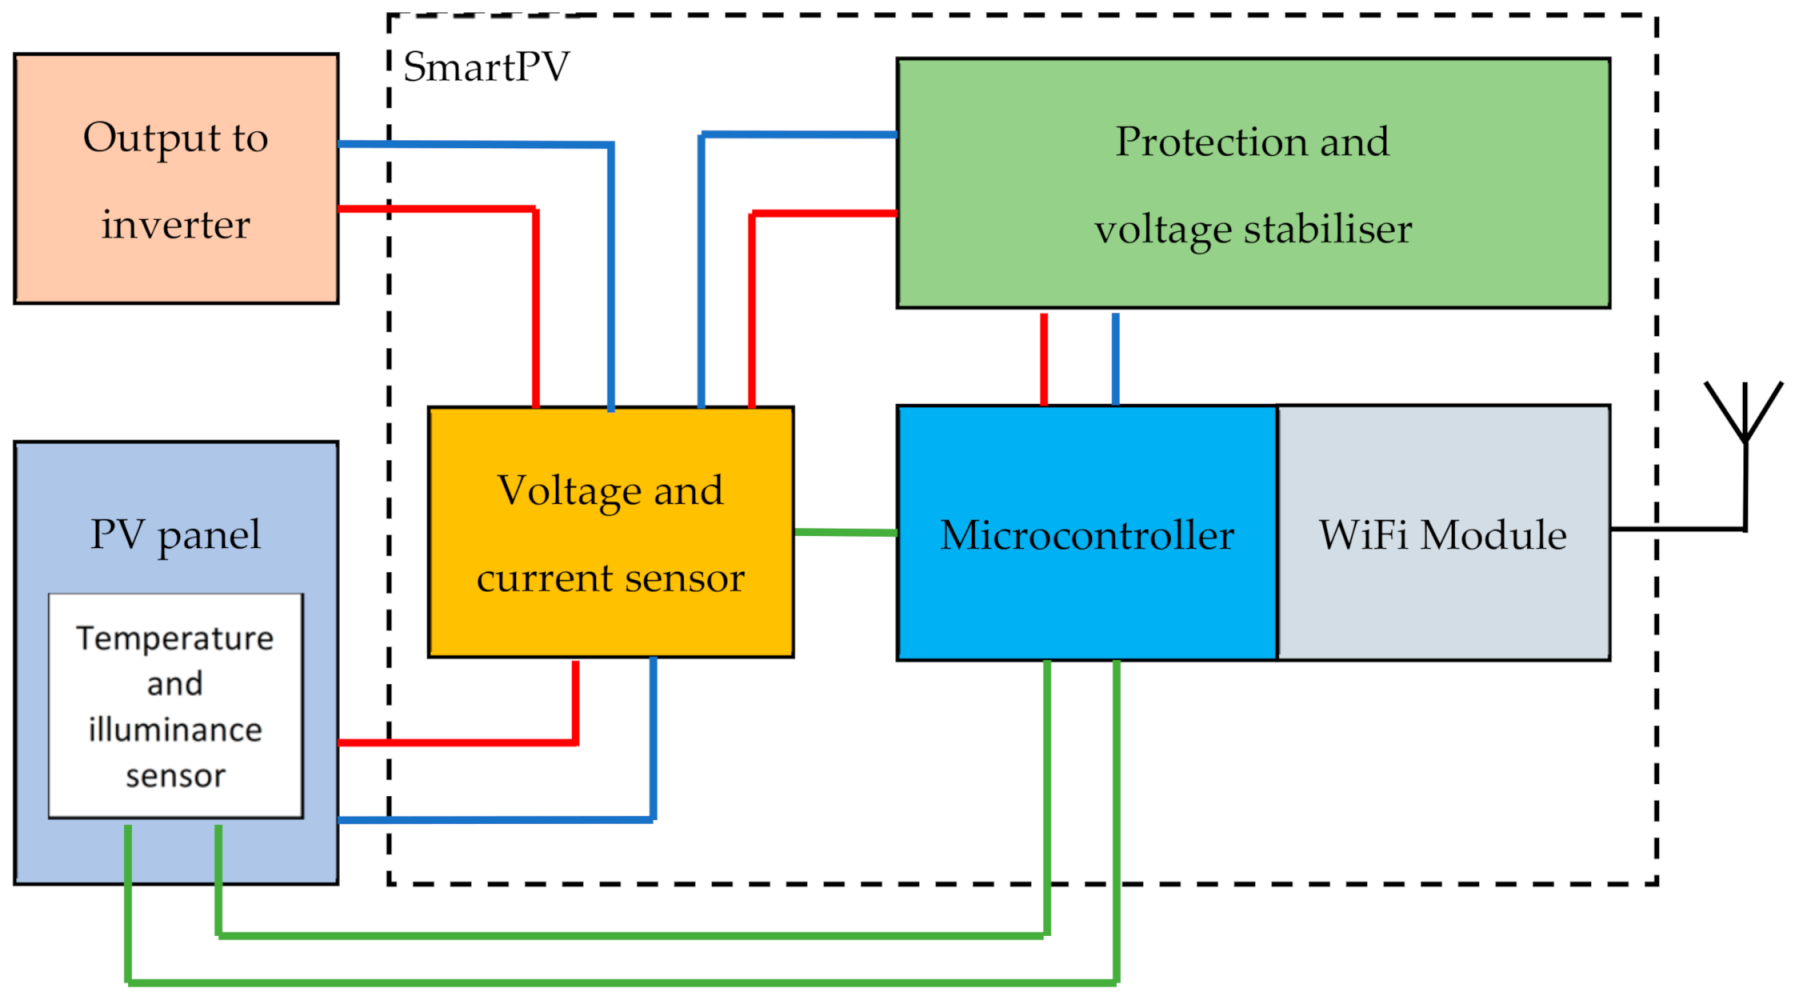
  • Continuous measurement of photovoltaic system operation parameters (voltage and current, panel temperature and solar radiation intensity, ambient temperature and humidity);
  • Transparency of the system and effective maintenance,
  • Accurate information on panel performance;
  • Automatic data analysis;
  • Reduction of operating costs (service planning, cleaning, etc.) and minimisation of the return period;
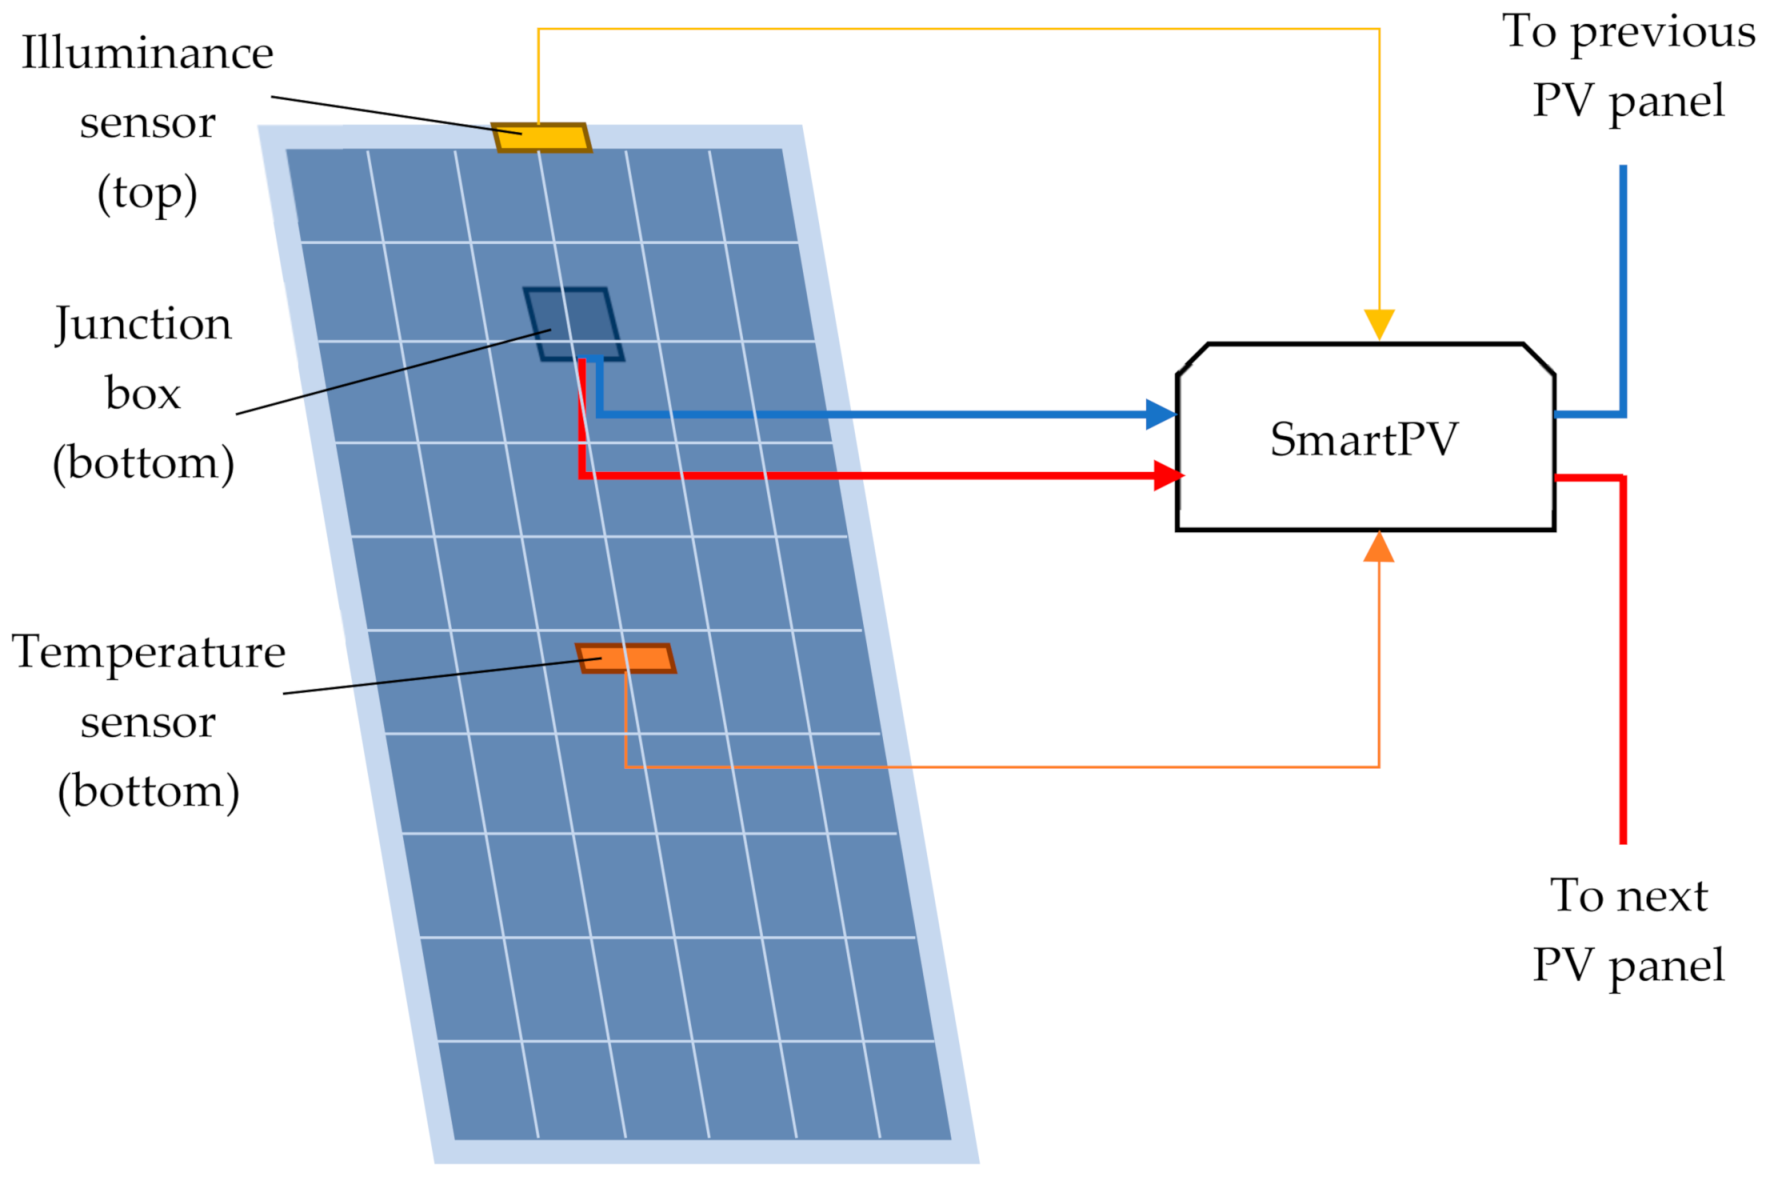
  • Quick installation, using MC4 (Multi Contact 4 mm), connectors, which are standard in photovoltaics;
Verification of the developed device operation for its suitability for monitoring the performance of a photovoltaic installation was the tests’ main objective. The following chapters present a description of the operation of the developed SmarPV device and discuss the testing methods. The results recorded during the tests are presented, with a classification into different aspects of measurement. The conclusions and possibilities offered by SmartPV are presented.

2. Materials and Methods

2.1. Description of SmartPV Functionality

The idea of the developed solution is to monitor parameters of photovoltaic modules, such as voltage and current, module surface temperature, illumination and ambient temperature (optional humidity). The proposed SmartPV system is based on an individual interface designed to diagnose each PV module, connected to a database system via a wireless data transmission medium, in line with the Internet of Things (IOT) concept [18]. The solution is based on known measurement methods, but applied in an original way, combining the measurement of electrical and environmental parameters [19,20]. The device consists of several key modules, shown in Figure 3.
The current flowing through the photovoltaic panel is continuously monitored by a current sensor (Hall sensor). The voltage is recorded by a converter adjusting it to the microcontroller input (0 ÷ 5 V). Due to the fact that the SmartPV device is intended to operate in outdoor conditions, there is a possibility of electrostatic overvoltages and overvoltages caused by lightning. The SmartPV power supply system is equipped with a three-stage protection system—a polymer fuse of a spark gap of 90 V tripping voltage, a transistor and a diode with a coil, protecting the module against reverse polarity of the power supply and a diode limiting transient overvoltages of the voltage stabiliser. A miniature Wi-Fi wireless radio communication module was installed in the SmartPV circuit, which enables the recorded data to be sent to a server (Figure 4). Thermoelectric sensors were used to monitor temperature changes. The temperature sensor suggested in SmartPV is a popular digital thermometer, equipped with 1-wire communication interface, which is a type of electronic interface as well as communication protocol between two (or more) devices. A sensor, converting light intensity within a wavelength the range 320 ÷ 1050 nm into a measurable, proportional to insolation frequency, was applied for illumination measurement. The sensor’s measuring range is between 1 and 65,535 lx. In photovoltaics, solar radiation is mainly given in W/m2, but our observations show that illumination measured in lux represents the real solar radiation as well. As with temperature measurements, it is important in SmartPV to measure and compare the solar radiation on the panels at different locations in the installation, to make reference of the power generated.
For the purpose of testing, a special application was developed to collect data from SmartPV devices to a server. Data collected during the tests and the rules that can be defined based on them will be used to develop an expert application based on machine learning process. As shown in publications [21,22], neural networks and machine learning can be successfully used in monitoring and diagnostics of the systems in photovoltaic installations. Machine learning algorithms create an analytical model based on training data to predict operational parameters or to make direct decisions without a human intervention. Machine learning is a consequence of the development of artificial intelligence methods and their implementation, especially in innovative technologies and industry [23]. It ensures that the process of data acquisition and analysis is automated to improve and develop the system and to increase efficiency, performance and reliability.

2.2. Test Methods

The SmartPV device is connected individually to the photovoltaic panel, using the original MC4 connectors, and the SmartPV outputs are connected in series as planned by the photovoltaic installation designer. The device is powered directly from the PV panels. The suggested SmartPV solution measures temperature of the selected point on the surface of each photovoltaic panel by gluing the sensor on the inside (Figure 5). The suggested mounting location is in the centre of the PV panel surface, but it is most important that the sensors are applied to all panels in the same place. Temperature of the entire panel surface cannot be monitored in this way, but the undesired states can be detected. As the panel temperature also depends on the sunlight intensity, the SmartPV device is equipped with a solar illuminance sensor glued to the frame from the top of the photovoltaic panel. In addition, the sensor will give information about the local illumination of the photovoltaic panel, which is particularly important for installations oriented at different angles to the ground and with different azimuth. It is then possible to directly determine the expected performance of the PV panels in relation to the local access to the solar radiation. In the case of large installations, solar conditions can be different in different parts of the plant (e.g., influence of local cloud cover, growth of vegetation causing shading, etc.). SmartPV, by using separate temperature and illumination sensors, is a high-resolution monitoring system that gives complete information about each panel in a PV power plant.
The devices were connected to a real photovoltaic installation, on the roof of the KOMAG building in Gliwice (Poland). Data were recorded over 19 months to identify reliability of the modules, which were continuously improved. The analyses presented in the publication are based on data from the last 6 months of this period. Due to the fact that all photovoltaic panels in the installation were working properly during the tests, shading (or damage) of one of them was simulated.
During the test, data from the shaded panel and the neighbouring panel were continuously recorded. First, one vertical column of PV cells was shaded (Figure 6a), which should trigger the first bypass diode. The next step was to obscure the three vertical columns of cells, further limiting the output of the PV panel, by activating 2 diodes. In the next step, the PV panel was uncovered, and its output returned to its nominal level. The response of SmartPV to the obscuring of one horizontal row of cells was also checked (Figure 6b), during which all 3 bypass diodes should be activated.

3. Results and Discussion

Figure 7 shows a graph of the energy generated by the photovoltaic panel. The temperature is also plotted as a monthly average of the maximum daily temperature recorded each day of the month.

3.1. Detection of the Installation Pollution

The analysis of the graphs presented in Figure 8 and Figure 9 shows that despite nearly 2% more energy given by the sun in August 2020, the photovoltaic panel generated 8% less electric energy. This was related to the dirtiness of the panel surface. The scale of pollution was not large, but this could already be observed in the recorded results. The average coefficient expressed by the ratio of power to solar radiation intensity was 0.0028 in August 2019 and 0.0025 in August 2020, respectively.
The panels were not cleaned during the tests. Further tests are planned, during which power will be recorded from panels that are dirtier than at present. The plant will then be cleaned, and the effect of cleaning will be tested.

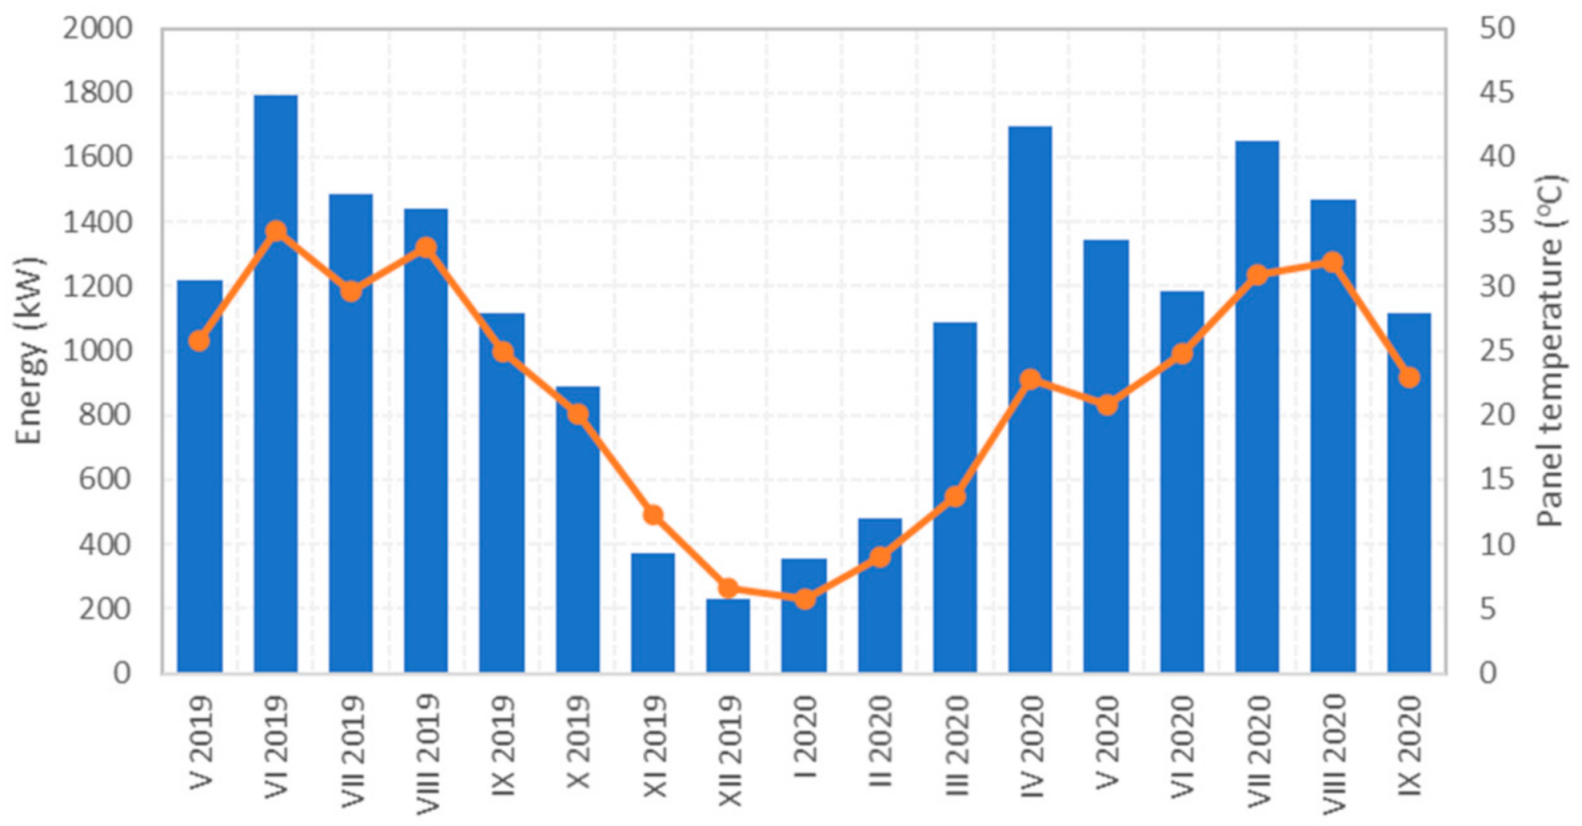
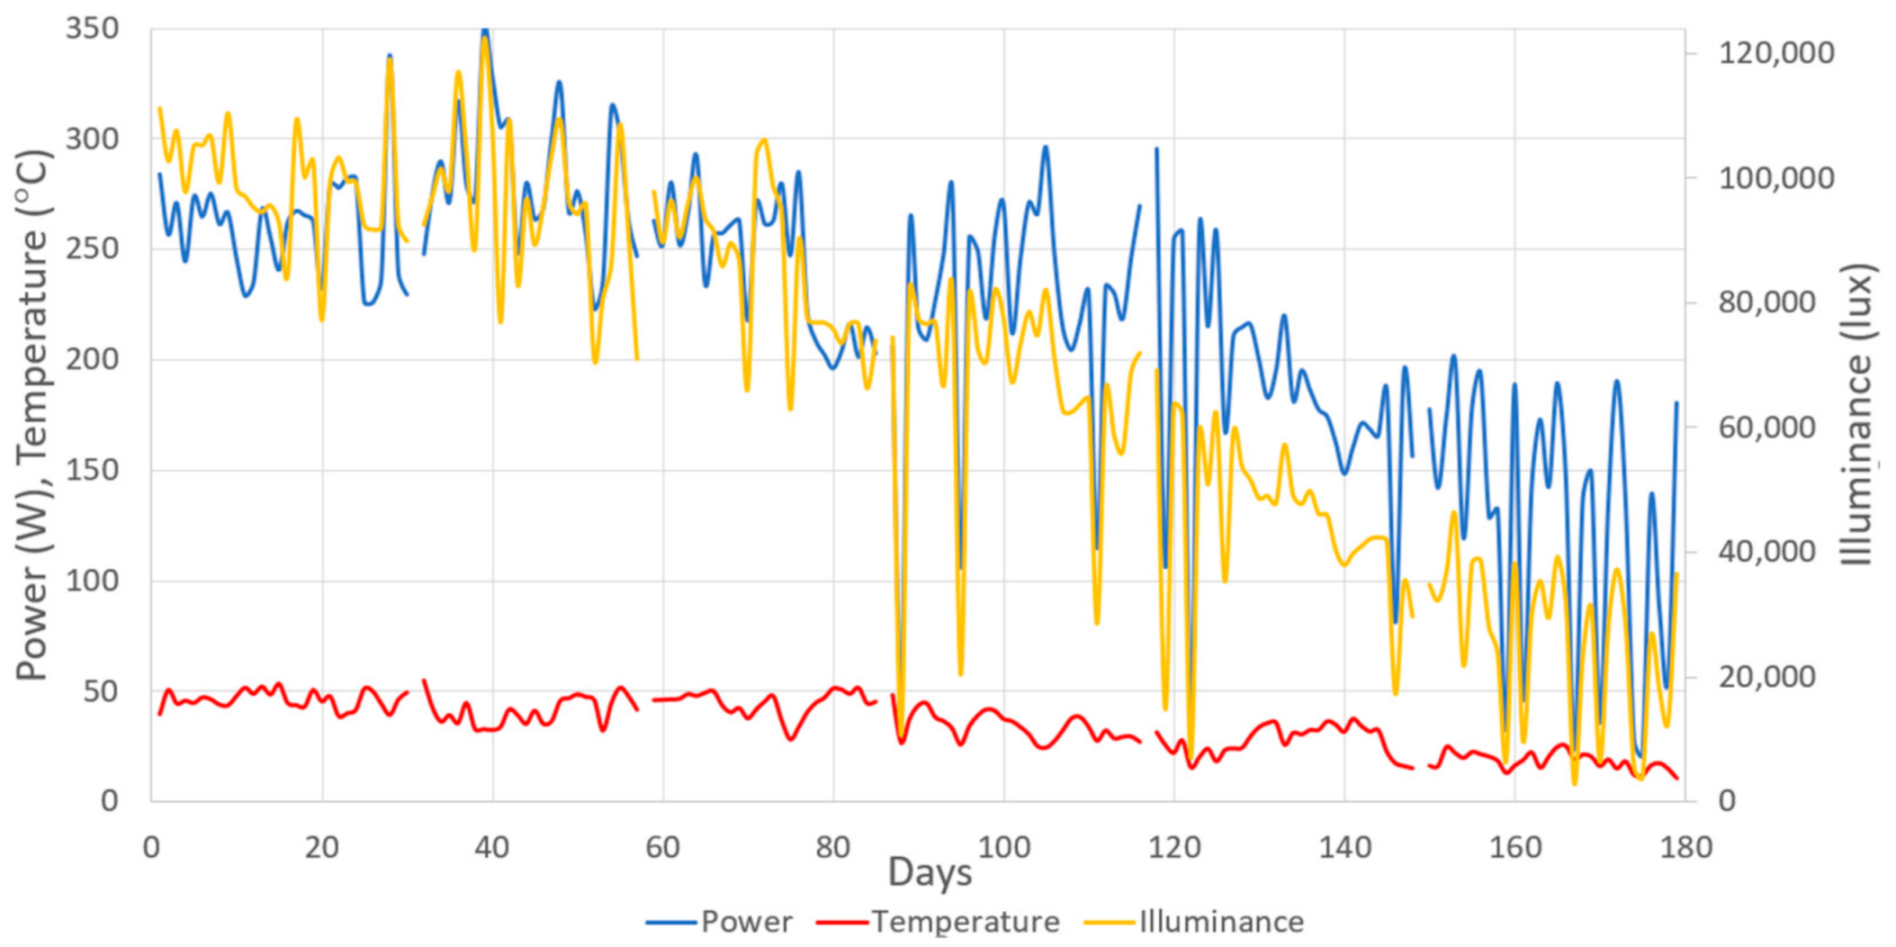
3.2. Impact of Temperature and Illuminance on Panel Performance

Obviously, in the summer months, the high intensity of solar radiation translates into beneficial results of the photovoltaic installation despite less favourable temperature conditions (Figure 10).
Various attempts are made worldwide to increase the efficiency of photovoltaic installations by cooling their surfaces. In [24], the efficiency of panel cooling by air-water mixture stream was assessed. The test results showed that despite an increase in the efficiency of the installation by up to 20%, cooling was not justified economically. Tests on the efficiency of hybrid photovoltaic PVT (Photovoltaic Thermal) panels were also conducted. In [25], the efficiency of a regular PV panel with a PTV hybrid panel was compared. An increase in the efficiency of a photovoltaic system by more than 2% was observed, but obtaining the energy in a form of useful heat was an additional advantage.
In the autumn months, when the intensity of solar radiation decreases from four to five times, the photovoltaic system also works with lower efficiency, but the decrease in efficiency is not proportional to the decrease in the intensity of solar radiation—the generated power decreases by half in this case due to improving temperature conditions. A strong reduction in power generation, associated with the drop in solar radiation, resulted in drop in ambient temperature and thus the drop in surface temperature of photovoltaic panels.

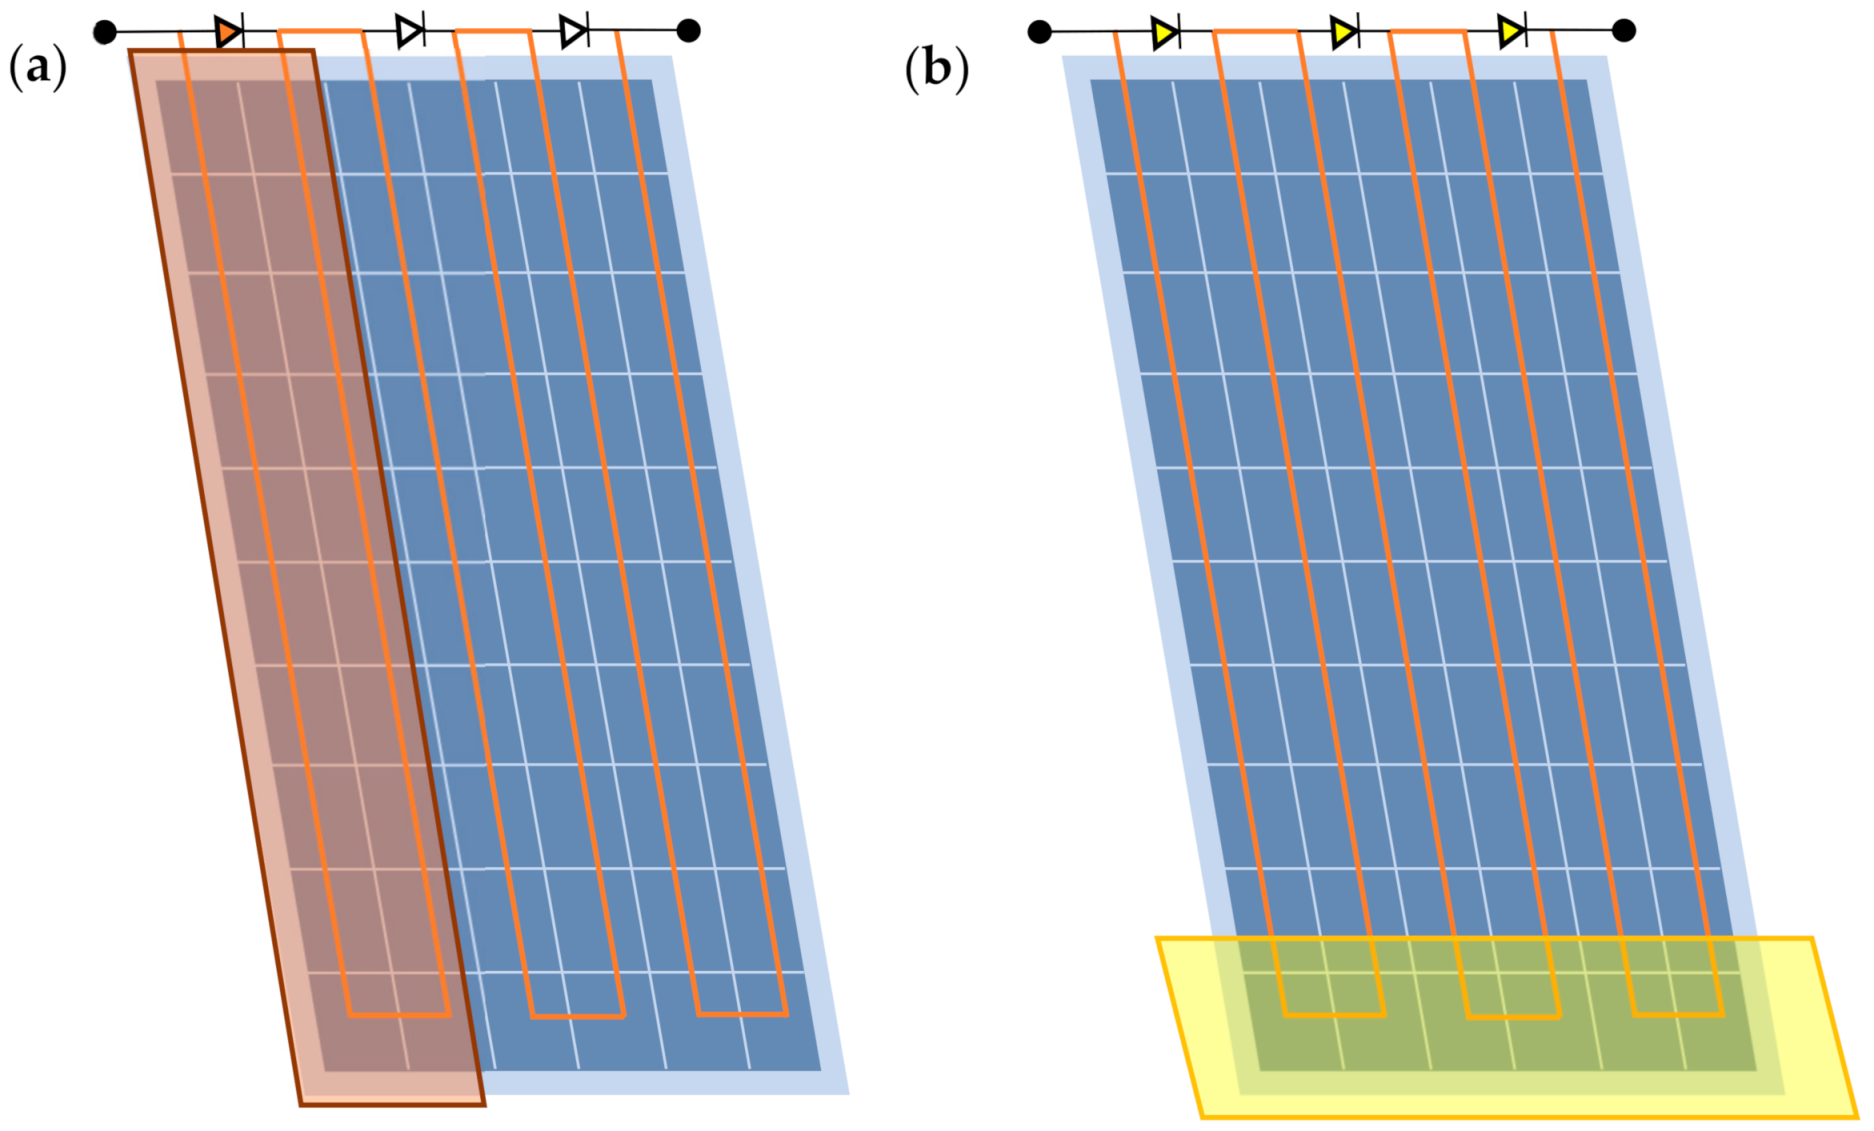
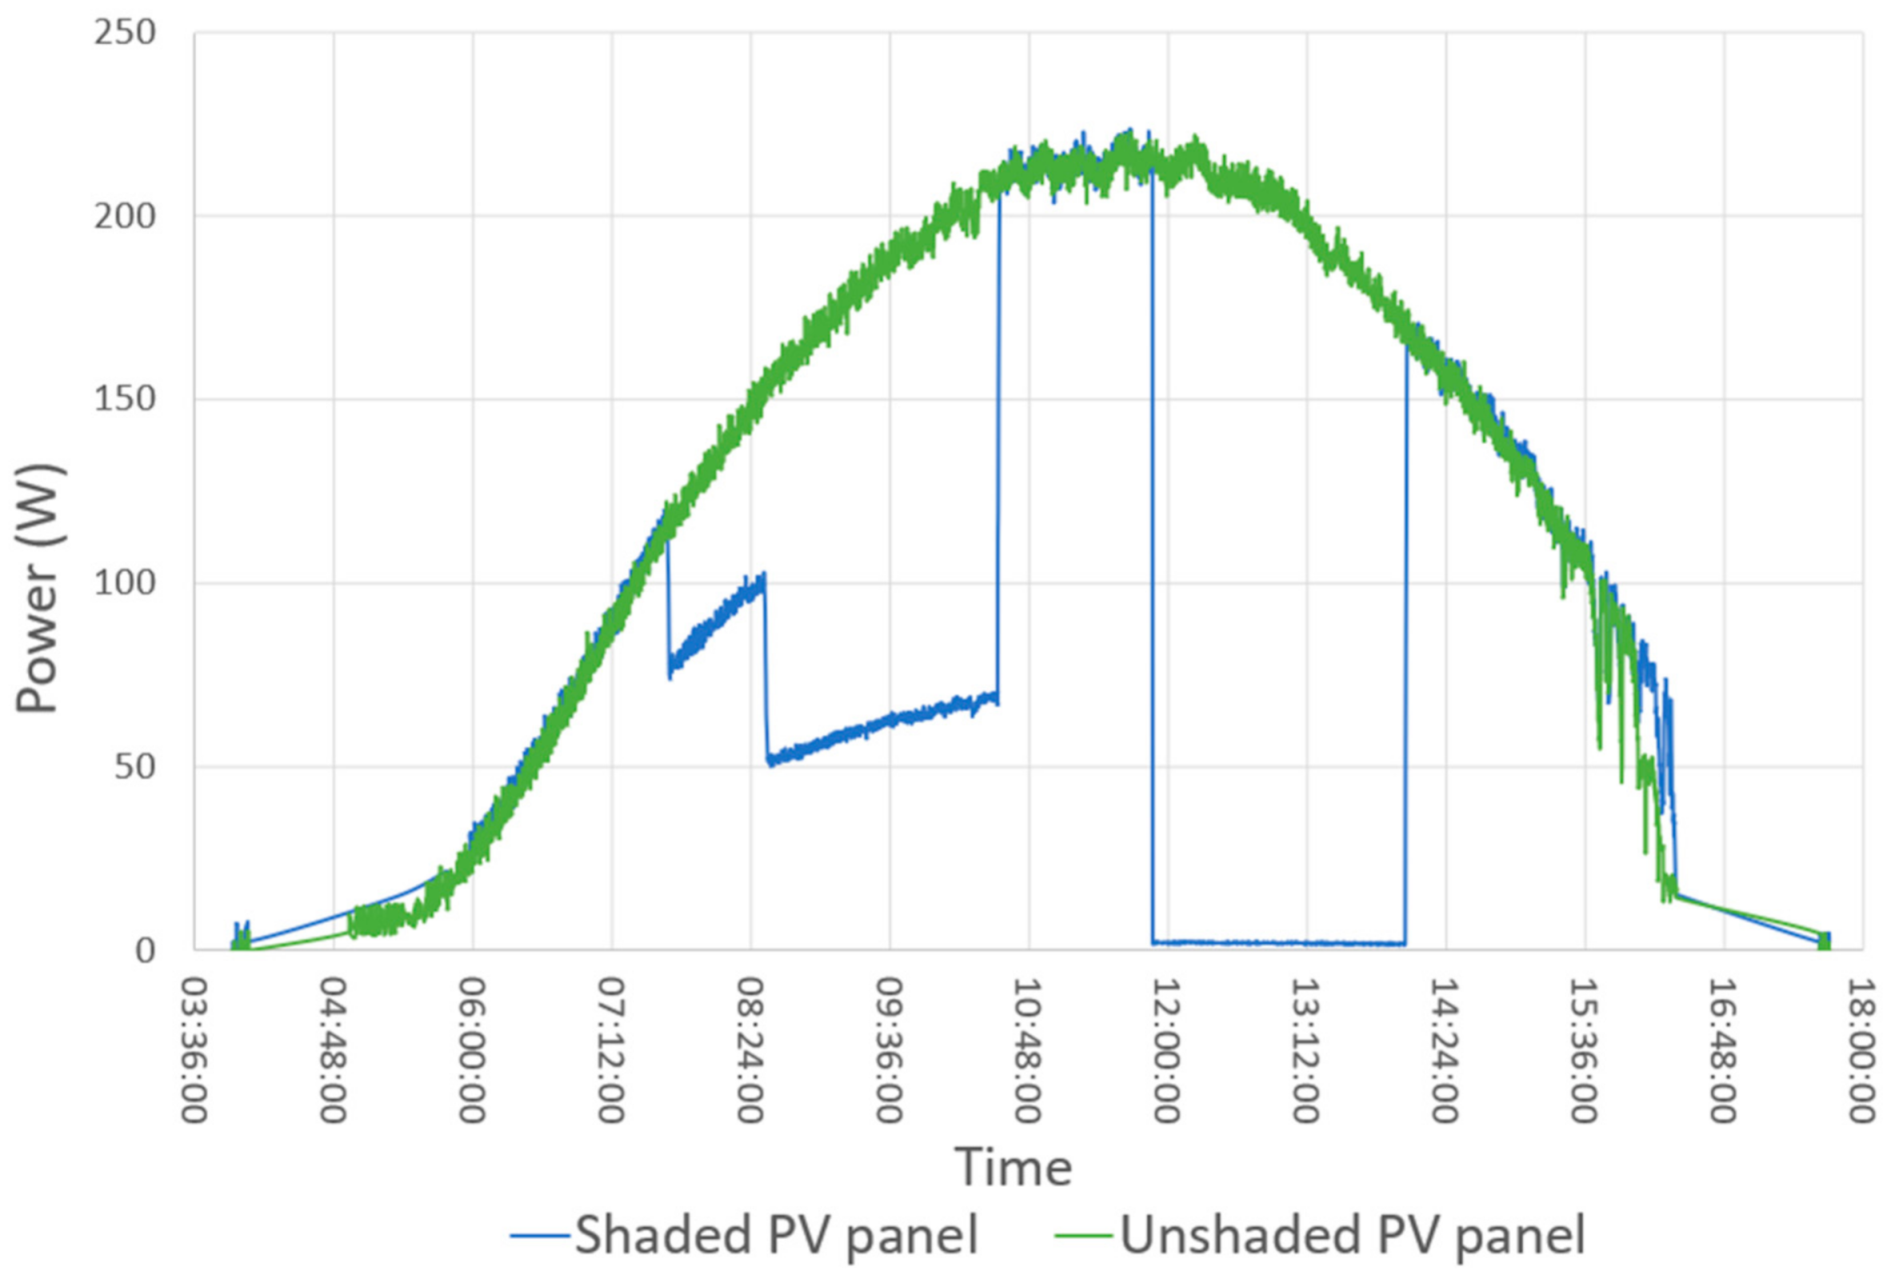
3.3. PV Panel Shading (or Damage)

The diagram (Figure 11) shows the power from two photovoltaic panels—the shaded one and the one next to it, which was not shaded. Based on the data from the illuminance sensor, and from adjacent PV modules, the software will be able to identify similar events and notify the operator about failure of the specific panel.
Panel shading started at approximately 7:30 a.m. The 33% decrease in efficiency recorded (blue colour) was caused by covering one row of PV cells. Another drop in the photovoltaic panel efficiency (by 66%), which appeared after about half an hour, was caused by the activation of another bypass diode (covering another row of cells). The complete uncovering of the panel represents the return to maximum panel efficiency under given weather conditions. Around 12 o’clock, the photovoltaic panel was switched off. This is due to covering only one horizontal row of cells in the vertically aligned PV panel. The tests confirmed the known principle of operation of shunt diodes in PV panels, but their main purpose was to prove that SmartPV devices correctly identify shading, or damage to the panel. For comparison, the power generated by an unshaded photovoltaic panel is marked green in the graph.
Shading is one of the primary issues to be taken into account when designing a photovoltaic installation. Shaded areas should then be skipped, or power optimizers should be used. However, during the long-term operation of a PV plant, periodic shading such as snow will occur. Modules arranged vertically and covered with snow even in a small area will not produce energy until the snow has completely melted. In the case of horizontal placement, as the snow melts and moves downwards, the work will be undertaken by not covered cell rows.

3.4. Temperature Power Factor

On the basis of the collected data, power reference coefficients, regarding each month of the measuring period, were determined (Table 1), and the dependence of this coefficient on temperature is presented (Figure 12).
Assuming temperature loss coefficient of 0.41%/°C above 25 °C, the expected values of the power output can be adjusted in relation to the current intensity of solar radiation. Figure 13 shows the percentage distribution of power and intensity of solar radiation from the selected month (September 2019). The maximum recorded value is assumed as 100%.
Power calculated from the relationship (1), expected at 25 °C, is marked in green.
P o b l W =   P m W + ( P m W × 0.0041 ( 1 ° C ) × t m ( ° C ) 25   ( ° C ) )
where:
  • Pobl—calculated power (W);
  • Pm—measured power (W);
  • Tm—measured temperature (°C).
In this way, half of the percentage deviation between power and illuminance were corrected. On the basis of further analyses, it is possible to reduce the error range and thus to increase the diagnostics accuracy of the photovoltaic system operation.

3.5. Sensor Failure

Figure 14 shows an illuminance graph from one of the SmartPV devices, recorded by the application. The graph shows discontinuities in the illuminance curve. It was found that in the following days, the SmarPV module did not send illuminance values to the database. The remaining devices recorded correct values of the sunlight intensity, so the sensor was suspected to be damaged. It was found that moisture entered the sensor, and it was not operated properly. The system, by analysing data from SmartPV devices, can evaluate the operation of the whole installation as well as conduct self-diagnosis, by comparing values between the measured modules. In this way, it is possible to detect damage to photovoltaic panels and also to the SmartPV devices themselves or the sensors connected to them.

3.6. Wheather Anomalies

An interesting phenomenon, recorded on 21.07.2019, is presented in Figure 15. By analysing the data from SmartPV, at first it seems that there was a few-hour break in communication with the network.
To verify the data, the power graph from the inverter was checked, and it was found that the inverter recorded the same pattern, which suggests that the whole installation stopped generating electricity for some time. The weather conditions on 21 July 2019 gave explanation to the recorded graphs. On that day, a heavy hailstorm was reported in Gliwice. Heavy clouds and hail covering the surface of the panels were the reason for a periodic interruption in the operation of photovoltaic installation. It is very important that the software is able to record and identify such events.

3.7. Results in Relation to International Literature

The tests of photovoltaic installations and the analysis of the methods of improving their efficiency were the subject of many scientific publications, e.g., [5,6,7,10,14,15,20,23,24,25]. Due to the fact that the solar energy resources in different countries of the world are mainly related to their geographical location and the local meteorological conditions, the results obtained from the tests of photovoltaic installations in different climatic zones may be very different. Moreover, the climate of Poland is characterized by a large variability of weather conditions and significant differences regarding the seasons in the following years. This is due to significant changes in the angle of incidence of solar radiation in the annual cycle and to the clashing of two atmospheric fronts—Atlantic and continental. The frequent cloudiness, as well as high precipitation in autumn and spring and low air temperatures in winter, affects the uneven distribution of solar radiation in the annual cycle [26,27]. In view of the above, it is extremely difficult to compare the results of tests conducted under different atmospheric conditions. However, the measured data of the authors confirm the thesis of temperature impact on efficiency of photovoltaic cells assumed in other publications. The higher temperature of PV cells causes a decrease in the voltage generated by the cell, which in turn causes a decrease in generated power and thus photovoltaic conversion [9,10,11,24,25,26]. As a result of tests, it was also confirmed that maintaining the cleanliness of the panels is an important factor affecting the efficiency of a photovoltaic installation [14,15,16]. It is also reasonable to build intelligent systems for detecting malfunctions and cell damage, which may destroy the panel causing a significant loss in power in the circuit to which the damaged panel is connected [7,8].

4. Conclusions

Photovoltaic farms require constant supervision and rapid response to any irregularities and failures to operate efficiently. Monitoring systems of photovoltaic power plants, available on the market, are largely based on data from inverters, which allow for the installations diagnostics at the level of strings. With this approach, a local pollution or failure of each photovoltaic panel cannot be noticed. Available monitoring systems for photovoltaic panels focus mainly on electrical parameters, which only allow for a diagnosis of the panels from a technical point of view, not allowing to forecast energy production, depending on the weather conditions.
The first period of trials and tests of the suggested SmartPV solution in real-life conditions confirmed wide possibilities of using the system for data acquisition and analysis of technical conditions of photovoltaic installations. The modifications introduced after the initial testing stage allowed to configure the devices to increase their communication reliability
Interesting data were collected during the tests, confirming the usefulness of the suggested device for monitoring the photovoltaic installations. Differences in performance of the photovoltaic panel depending on solar radiation and surface temperature were recorded. The temperature coefficient of power, allowing for increased accuracy in the prediction of generated power, was determined. Correctness of data recording in different cases, i.e., shading, sensor damage or weather anomalies, was verified. The collected data is the base for the construction of an expert application, based on machine learning, enabling ongoing analysis of the recorded data and rapid response to irregularities in the operation of the photovoltaic system. Data were recorded on a server at 10 s intervals. It turned out that a large amount of data was accumulated from several months of testing, which made the analyses time-consuming and required computer hardware with high computing power.
The sampling rate can be reduced, definitely reducing the volume of recorded data without losing its quality. The reliability of the recorded data was checked at the stage of laboratory tests, during which no distortions of the recorded values were found. In the SmartPV device software, additional filters were implemented, which prevented sending to the server random, erroneous values, which were due to communication problems with the sensors, mainly during module start-up (in the morning) and shutdown after sunset.
The tests also showed some discrepancies in the readings of the measuring sensors between the different SmartPV devices. The differences in readings are due to both the tolerances of the sensors themselves and the tolerances of the electronic components used in the measuring system. Therefore, SmartPV modules should be calibrated under identical operating conditions before their final use.
The correct working of the photovoltaic installation during the whole testing period required simulating the shading or cell damage by shadowing successive rows of cells. The tests confirmed the operation of the bypass diodes and the correct response of SmartPV to a sudden drop in PV panel efficiency.
In the photovoltaic installation on which the SmartPV devices were tested, the panels were connected in 20 pc strings. Due to the limitation of the number of SmartPV devices tested to 10 pc, it was not possible to compare directly the data recorded by us with those collected by the photovoltaic inverter.
SmartPV estimates the expected current output of the photovoltaic installation, in relation to the solar irradiance at the level of each panel, and deduces the causes of possible power drops, allowing corrective action to be targeted effectively. The following conclusions can be drawn from the tests:
  • SmartPV modules closely monitor the panel operation (whose parameters depend on the intensity of solar radiation), recording the voltage and current generated individually by each panel.
  • A strong dependence of the generated electrical power on the intensity of solar radiation was confirmed, including a significant adverse effect of temperature. Excessive heating of the panels causes a decrease in efficiency of 0.5% for each 1 °C.
  • Coefficients were determined to allow estimation of the expected electric power, depending on the period and weather conditions. The coefficients make it possible to increase the accuracy of the prediction of the expected power at a given period and weather conditions.
  • The SmartPV system can detect the degree of pollution on the surface of the photovoltaic panels (pollution of the panels can cause up to 20% decrease in the efficiency of the installation) by comparing the currently generated power of the whole installation (or string) with the calculated theoretical value (based on current sensor data and archive data). In economically justified cases (when the loss due to pollution reaches the value of the installation cleaning costs), the system can inform the user about the need to clean the installation.
  • By analysing data from each panel, it is possible to detect their damage (e.g., mechanical, e.g., caused by hail, delamination, hot spots, etc.) Damage to a single panel affects the operation of the entire installation, causing a significant loss of power in the string to which it is connected.
  • Based on the analysis of sensor data, historical data and a comparison of the current panel output with the nominal output, it is possible to track the panel’s ageing trend and inform the user about the need for replacement.
  • A horizontal arrangement of the photovoltaic panels is definitely more beneficial, mainly due to the effect of snowfall on the efficiency of the installation. Snow accumulated on the operating system melts slowly (under the influence of the higher surface temperature of the panels), slowly sliding off the panels, exposing successive rows of cells. In a horizontal arrangement, a PV panel starts operating at 33% efficiency when the top 2 rows of cells are uncovered and will gradually increase in efficiency. Vertically stacked panels will start operating after the snow has completely melted or slid off.
  • The system can locally detect panel shading that was not considered or did not exist at the installation designing stage (e.g., trees, new buildings).
  • In several cases, breaks in communication were detected, manifesting as missing data in the database. The target solution will use external Wi-Fi aerials, thus increasing the reliability of wireless communication.
  • A self-diagnostics algorithm, built into the system software, enables real-time self-monitoring to detect erroneous values from the sensors or damage.

Author Contributions

Conceptualization, M.W.; methodology, M.W. and K.F.; software, S.B. and J.R.-R.; validation, S.B. and M.W.; formal analysis, K.K.; investigation, M.W. and M.G.; writing—original draft preparation, M.W. All authors have read and agreed to the published version of the manuscript.

Funding

This research received no external funding.

Institutional Review Board Statement

Not applicable.

Data Availability Statement

The data presented in this study are available on request from the corresponding author.

Conflicts of Interest

The authors declare no conflict of interest.

References

  1. Michalski, M. Wykład: Energetyka Słoneczna—Fotowoltaika., Systemy Energetyki Odnawialnej B.22; VIESSMAN Academy: Telford, UK, 2016; Available online: https://www.viessmann.ovh/wp-content/uploads/T3_SEO-B22_Fotowoltaika_M_Michalski_29_11_2016.pdf (accessed on 6 December 2020).
  2. Institute for Renewable Energy. In Photovoltaic Market in Poland 2020; IEO: Warsaw, Poland, 2020; Available online: https://ieo.pl/en/pv-report (accessed on 20 January 2021).
  3. KGHM Is Preparing Further PV Projects. Available online: https://www.gramwzielone.pl/energia-sloneczna/104137/kghm-szykuje-kolejne-projekty-pv (accessed on 30 January 2021).
  4. Olczak, P.; Matuszewska, D.; Kryzia, D. “Mój Prąd” as an example of the photovoltaic one off grant program in Poland. Polityka Energetyczna 2020, 23, 123–137. [Google Scholar] [CrossRef]
  5. Choi, J.; Choi, M.; Shin, Y.; Lee, I.W. Design of Web-based Monitoring System for Solar Photovoltaic Power Plants. In Proceedings of the International Conference on Information Networking, Barcelona, Spain, 7–10 January 2020; pp. 784–786. [Google Scholar]
  6. Guerriero, P.; Catalano, A.P.; Matacena, I.; Codecasa, L.; D’Alessandro, V.; Daliento, S. Experimental Assessment of Malfunction Events in Photovoltaic Modules from IR Thermal Maps. In Proceedings of the THERMINIC 2019—2019 25th International Workshop Thermal Investigations of ICs and Systems, Lecco, Italy, 25–27 September 2019. [Google Scholar]
  7. Chao, K.H.; Tsai, J.H.; Chen, Y.H. Development of a low-cost fault detector for photovoltaic module array. Electronics 2019, 8, 255. [Google Scholar] [CrossRef] [Green Version]
  8. Samara, S.; Natsheh, E. Intelligent Real-Time Photovoltaic Panel Monitoring System Using Artificial Neural Networks. IEEE Access 2019, 7, 50287–50299. [Google Scholar] [CrossRef]
  9. Skomedal, Å.F.; Aarseth, B.L.; Haug, H.; Selj, J.; Marstein, E.S. How much power is lost in a hot-spot? A case study quantifying the effect of thermal anomalies in two utility scale PV power plants. Sol. Energy 2020, 211, 1255–1262. [Google Scholar] [CrossRef]
  10. Bayrak, F.; Oztop, H.F. Effects of static and dynamic shading on thermodynamic and electrical performance for photovoltaic panels. Appl. Therm. Eng. 2020, 169, 114900. [Google Scholar] [CrossRef]
  11. Kunz, O.; Evans, R.J.; Juhl, M.K.; Trupke, T. Understanding partial shading effects in shingled PV modules. Sol. Energy 2020, 202, 420–428. [Google Scholar] [CrossRef]
  12. Dhimish, M.; Alrashidi, A. Photovoltaic degradation rate affected by different weather conditions: A case study based on PV systems in the UK and Australia. Electronics 2020, 9, 650. [Google Scholar] [CrossRef] [Green Version]
  13. PN-EN 61724: 2002—Monitorowanie Własności Systemu Fotowoltaicznego—Wytyczne Pomiarów, Wymiany Danych i Analizy (Photovoltaic System Performance Monitoring—Guidelines for Measurement, Data Exchange and Analysis); Polski Komitet Normalizacyjny: Warszawa, Poland, 2002.
  14. Jaszczur, M.; Koshti, A.; Nawrot, W.; Sędor, P. An investigation of the dust accumulation on photovoltaic panels. Environ. Sci. Pollut. Res. 2020, 27, 2001–2014. [Google Scholar] [CrossRef] [PubMed]
  15. Styszko, K.; Jaszczur, M.; Teneta, J.; Hassan, Q.; Burzyńska, P.; Marcinek, E.; Łopian, N.; Samek, L. An analysis of the dust deposition on solar photovoltaic modules. Environ. Sci. Pollut. Res. 2019, 26, 8393–8401. [Google Scholar] [CrossRef] [PubMed] [Green Version]
  16. Kasim, N.K.; Obaid, N.M.; Abood, H.G.; Mahdi, R.A.; Humada, A.M. Experimental study for the effect of dust cleaning on the performance of grid-tied photovoltaic solar systems. Int. J. Electr. Comput. Eng. 2021, 11, 74–83. [Google Scholar]
  17. De Arquer Fernández, P.; Fernández Fernández, M.Á.; Carús Candás, J.L.; Arboleya Arboleya, P. An IoT open source platform for photovoltaic plants supervision. Int. J. Electr. Comput. Eng. 2021, 125, 106540. [Google Scholar] [CrossRef]
  18. Ding, W.; Liu, Y.; Aamir, M.L.; Beluch, T.; Filipski, A. The role of internet of things monitoring in photovoltaic solar energy. J. Mine Vent. Soc. S. Afr. 2020, 73, 33–37. [Google Scholar]
  19. Woszczyński, M.; Grabowski, J. Koncepcja Inteligentnego Systemu Monitoringu i Diagnostyki Paneli Fotowoltaicznych. KOMTECH 2016, Innowacyjne Techniki i Technologie dla Górnictwa. Bezpieczeństwo—Efektywność—Niezawodność; Instytut Techniki Górniczej KOMAG: Gliwice, Poland, 2016; pp. 110–125. ISBN 978-83-60708-97-2. [Google Scholar]
  20. Woszczyński, M. Model inteligentnego systemu monitoringu i diagnostyki paneli fotowoltaicznych. Napędy Sterow. 2018, 5, 70–73. [Google Scholar]
  21. Lu, S.; Wang, F.; Ren, L.; Zhu, W. A health diagnosis method for photovoltaic module based on neural network. In Proceedings of the 8th Renewable Power Generation Conference (RPG 2019), Shanghai, China, 24–25 October 2019. [Google Scholar]
  22. Ortega, E.; Aranguren, G.; Saenz, M.J.; Gutierrez, R.; Jimeno, J.C. Wireless sensor network for photovoltaic modules monitoring. In Proceedings of the IEEE 44th Photovoltaic Specialist Conference, PVSC, Portland, OR, USA, 5–10 June 2016; pp. 1–5. [Google Scholar]
  23. Mazurek, K.; Szygula, M.; Perutka, K.; Turczynski, K.; Stankiewicz, K. Acquiring electric energy from the transport conveyor roller movement for distributed sensors network. J. Electr. Eng. Elektrotechnicky Cas. 2020, 71, 87–95. [Google Scholar] [CrossRef]
  24. Hadipour, A.; Rajabi Zargarabadi, M.; Rashidi, S. An efficient pulsed- spray water cooling system for photovoltaic panels: Experimental study and cost. Renew. Energy 2021, 164, 867–875. [Google Scholar] [CrossRef]
  25. Kulkarni, R.S.; Talange, D.B.; Dharme, A.A.; Mate, N.V. Development and performance analysis of solar photovoltaic–thermal (PVT) systems. Sadhana Acad. Proc. Eng. Sci. 2020, 45, 208. [Google Scholar] [CrossRef]
  26. Baran, K.; Leśko, M.; Wachta, H. Badania pozycjonowania paneli fotowoltaicznych na terytorium Polski. PAK 2013, 59, 1097–1100. [Google Scholar]
  27. Rodziewicz, T.; Wacławek, M. Ogniwa słoneczne—Wpływ środowiska naturalnego na ich pracę; WNT: Warsaw, Poland, 2011; ISBN 978-83-7926-264-9. [Google Scholar]
Figure 1. Global annual energy consumption in relation to resources [1].
Energies 14 01770 g001
Figure 2. 3D model of SmartPV device.
Energies 14 01770 g002
Figure 3. SmartPV block diagram.
Energies 14 01770 g003
Figure 4. Method of data acquisition from PV panels.
Energies 14 01770 g004
Figure 5. How to connect SmartPV to a PV panel.
Energies 14 01770 g005
Figure 6. How to simulate panel shading: (a) vertical shading, (b) horizontal shading.
Energies 14 01770 g006
Figure 7. Power output and panel temperature.
Energies 14 01770 g007
Figure 8. Power graph and illuminance in August 2019.
Energies 14 01770 g008
Figure 9. Power graph and illuminance in August 2020.
Energies 14 01770 g009
Figure 10. A graph of the power and intensity of solar radiation recorded between June and November 2019.
Energies 14 01770 g010
Figure 11. Graph of power generated by two neighbouring PV panels.
Energies 14 01770 g011
Figure 12. Correlation between power coefficient and temperature.
Energies 14 01770 g012
Figure 13. Percentage monthly distribution of light intensity and power.
Energies 14 01770 g013
Figure 14. Illuminance graph (panel 3) of 3 June 2019.
Energies 14 01770 g014
Figure 15. Power graph of 21 July 2019 (SmartPV—left side, inverter—right side).
Energies 14 01770 g015
Table 1. Comparison of average power and temperature coefficients in each month.
MonthAverage Power Coefficient (W/lux)Average Temperature (°C)
June0.002743.6
July0.003040.1
August0.002644.7
September0.003534.0
October0.004327.5
November0.005118.2
Publisher’s Note: MDPI stays neutral with regard to jurisdictional claims in published maps and institutional affiliations.

