1. Introduction
A bifacial photovoltsic (PV) module utilizes irradiance from both sides for the generation of electricity [
1,
2,
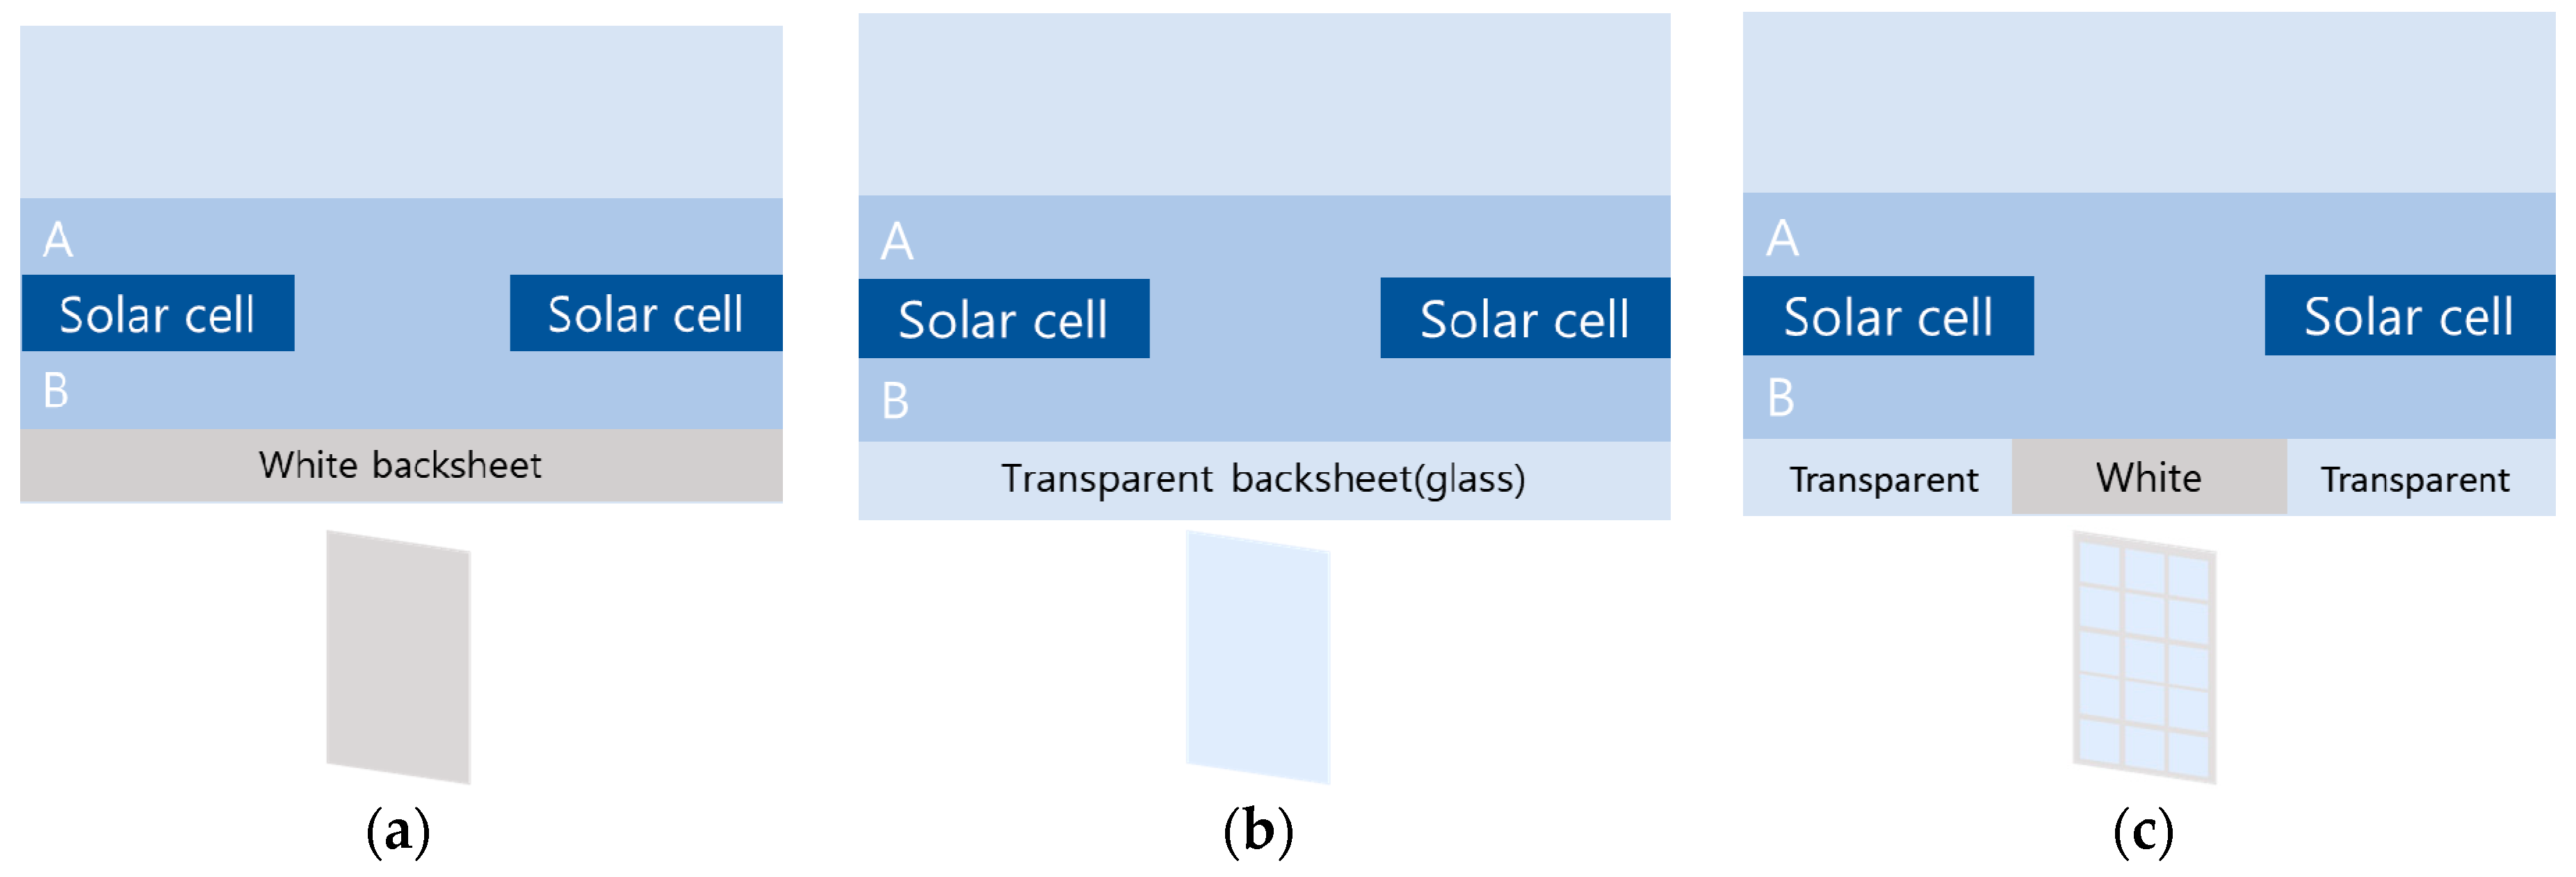
3]. The performance of the rear side of the module, described by its bifaciality, is influenced to a large degree by the cells’ bifaciality and by the transparency of the module rear side. A white backsheet as a module rear side produces additional cell-to-module (CTM) gains. Additional reflected light is coupled in the cell from inactive module areas such as cell spacing and the module margins [
4,
5,
6]. On the other hand, a transparent backsheet or glass in a bifacial module enables the utilization of the additional irradiance that can enter through the module rear side [
4,
5]. Previous studies have focused on the analysis of differences due to the rear side material (glass or backsheet) or comparison of backsheet types (transparent vs. white backsheet) [
7,
8].
To use the benefits of both concepts, some companies have created a mesh backsheet or mesh glass concept, which is a selectively transparent module rear side, combining reflective areas between cells with transparent areas underneath the cells (
Figure 1). The mesh is usually a coating applied to the inside or outside of the base material.
Previous studies have analyzed the performance of bifacial modules with internal reflection, including one position of the internal reflector and tilt angles. These studies did not consider rear side irradiance and the layout of the module rear side, such as the width, thickness and position of the coated area [
9,
10,
11,
12].
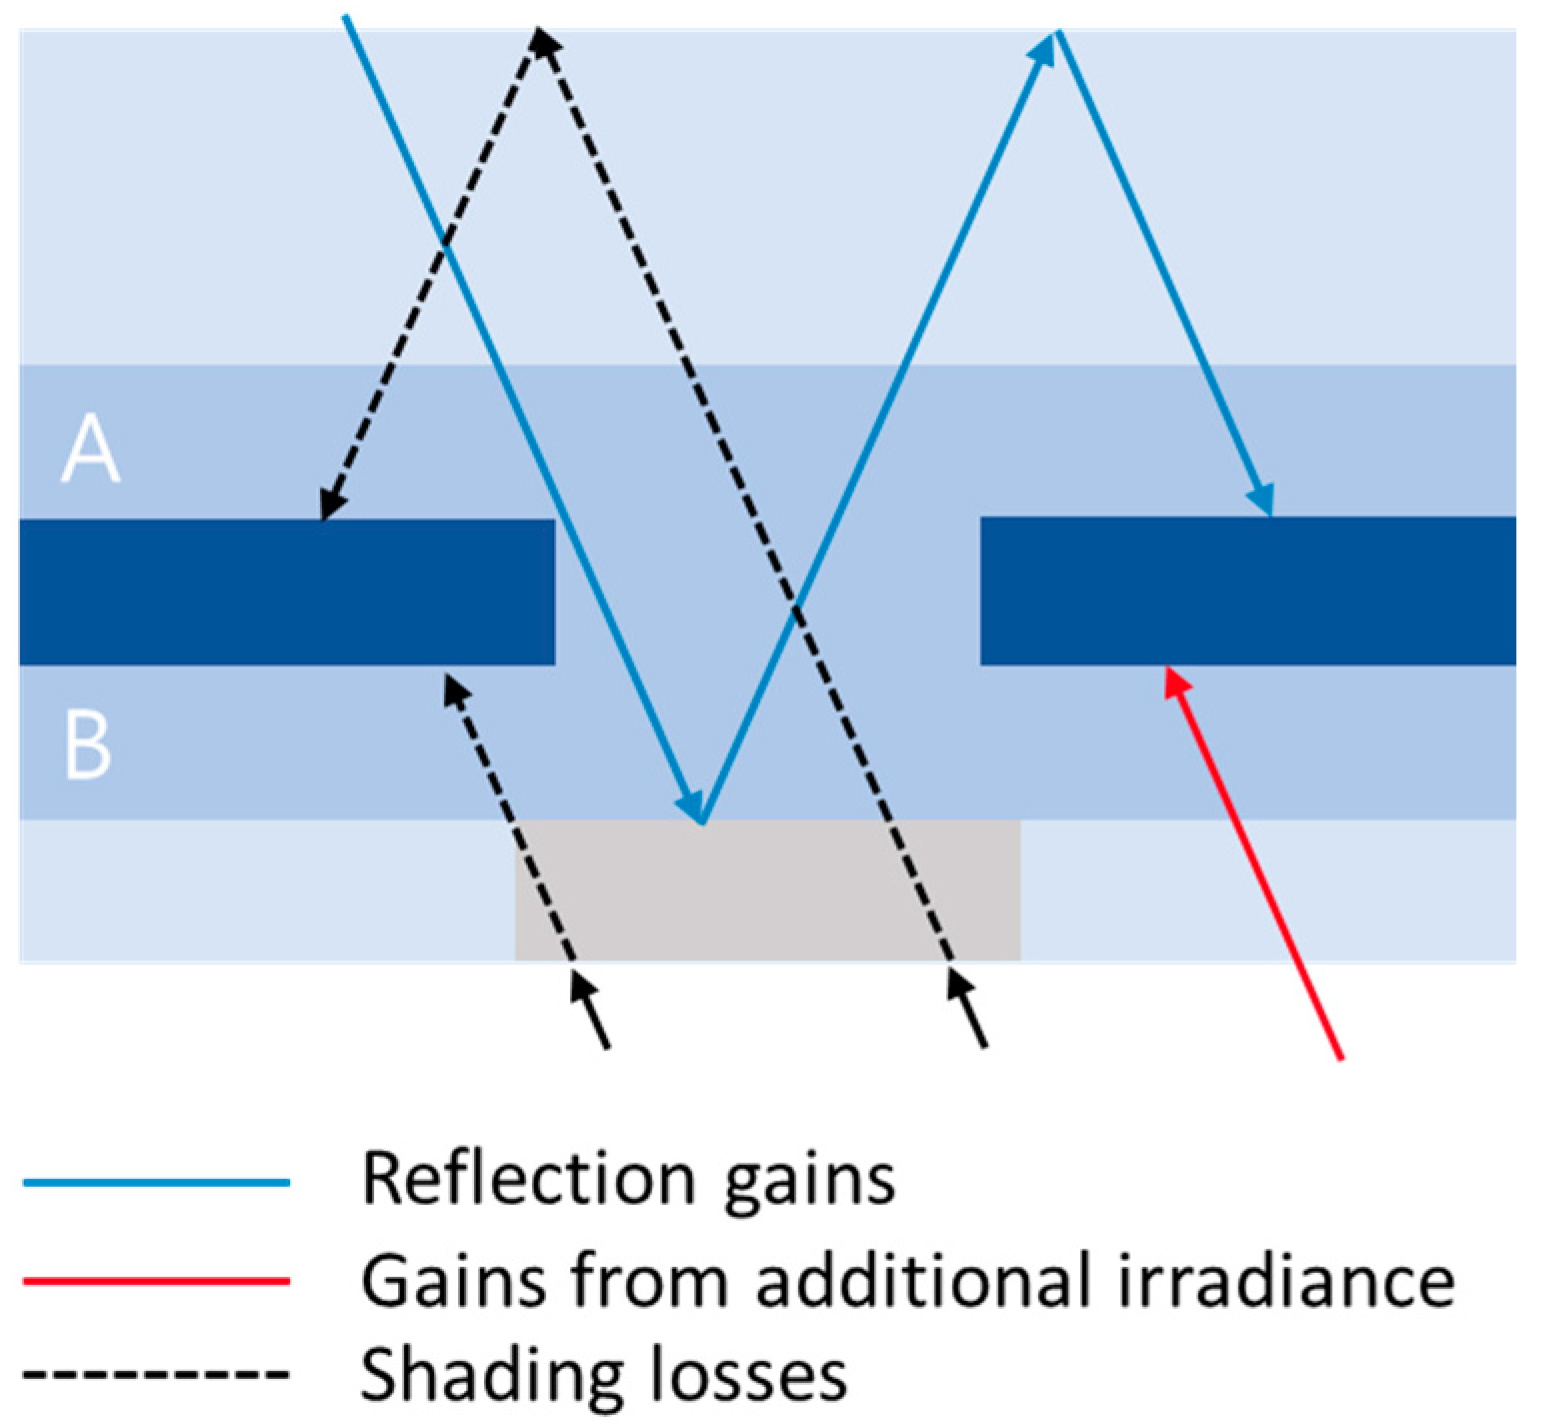
Therefore, we extend a previously developed model based on simplified ray tracing [
6] to consider the impact of selectively coated backsides on internal light management in photovoltaic modules. We consider both reflection gains due to front and rear side irradiance as well as potential shading losses on the module rear side (
Figure 2). We investigate the performance of the mesh backsheet or glass concept. We analyze the cell-to-module losses of the mesh backsheet module depending on parameters such as reflectance of the coated area on the backsheet, bifaciality of the solar cell and width of the coated areas in the cell spacing.
2. Simulation Methods
2.1. Cell-to-Module Analysis
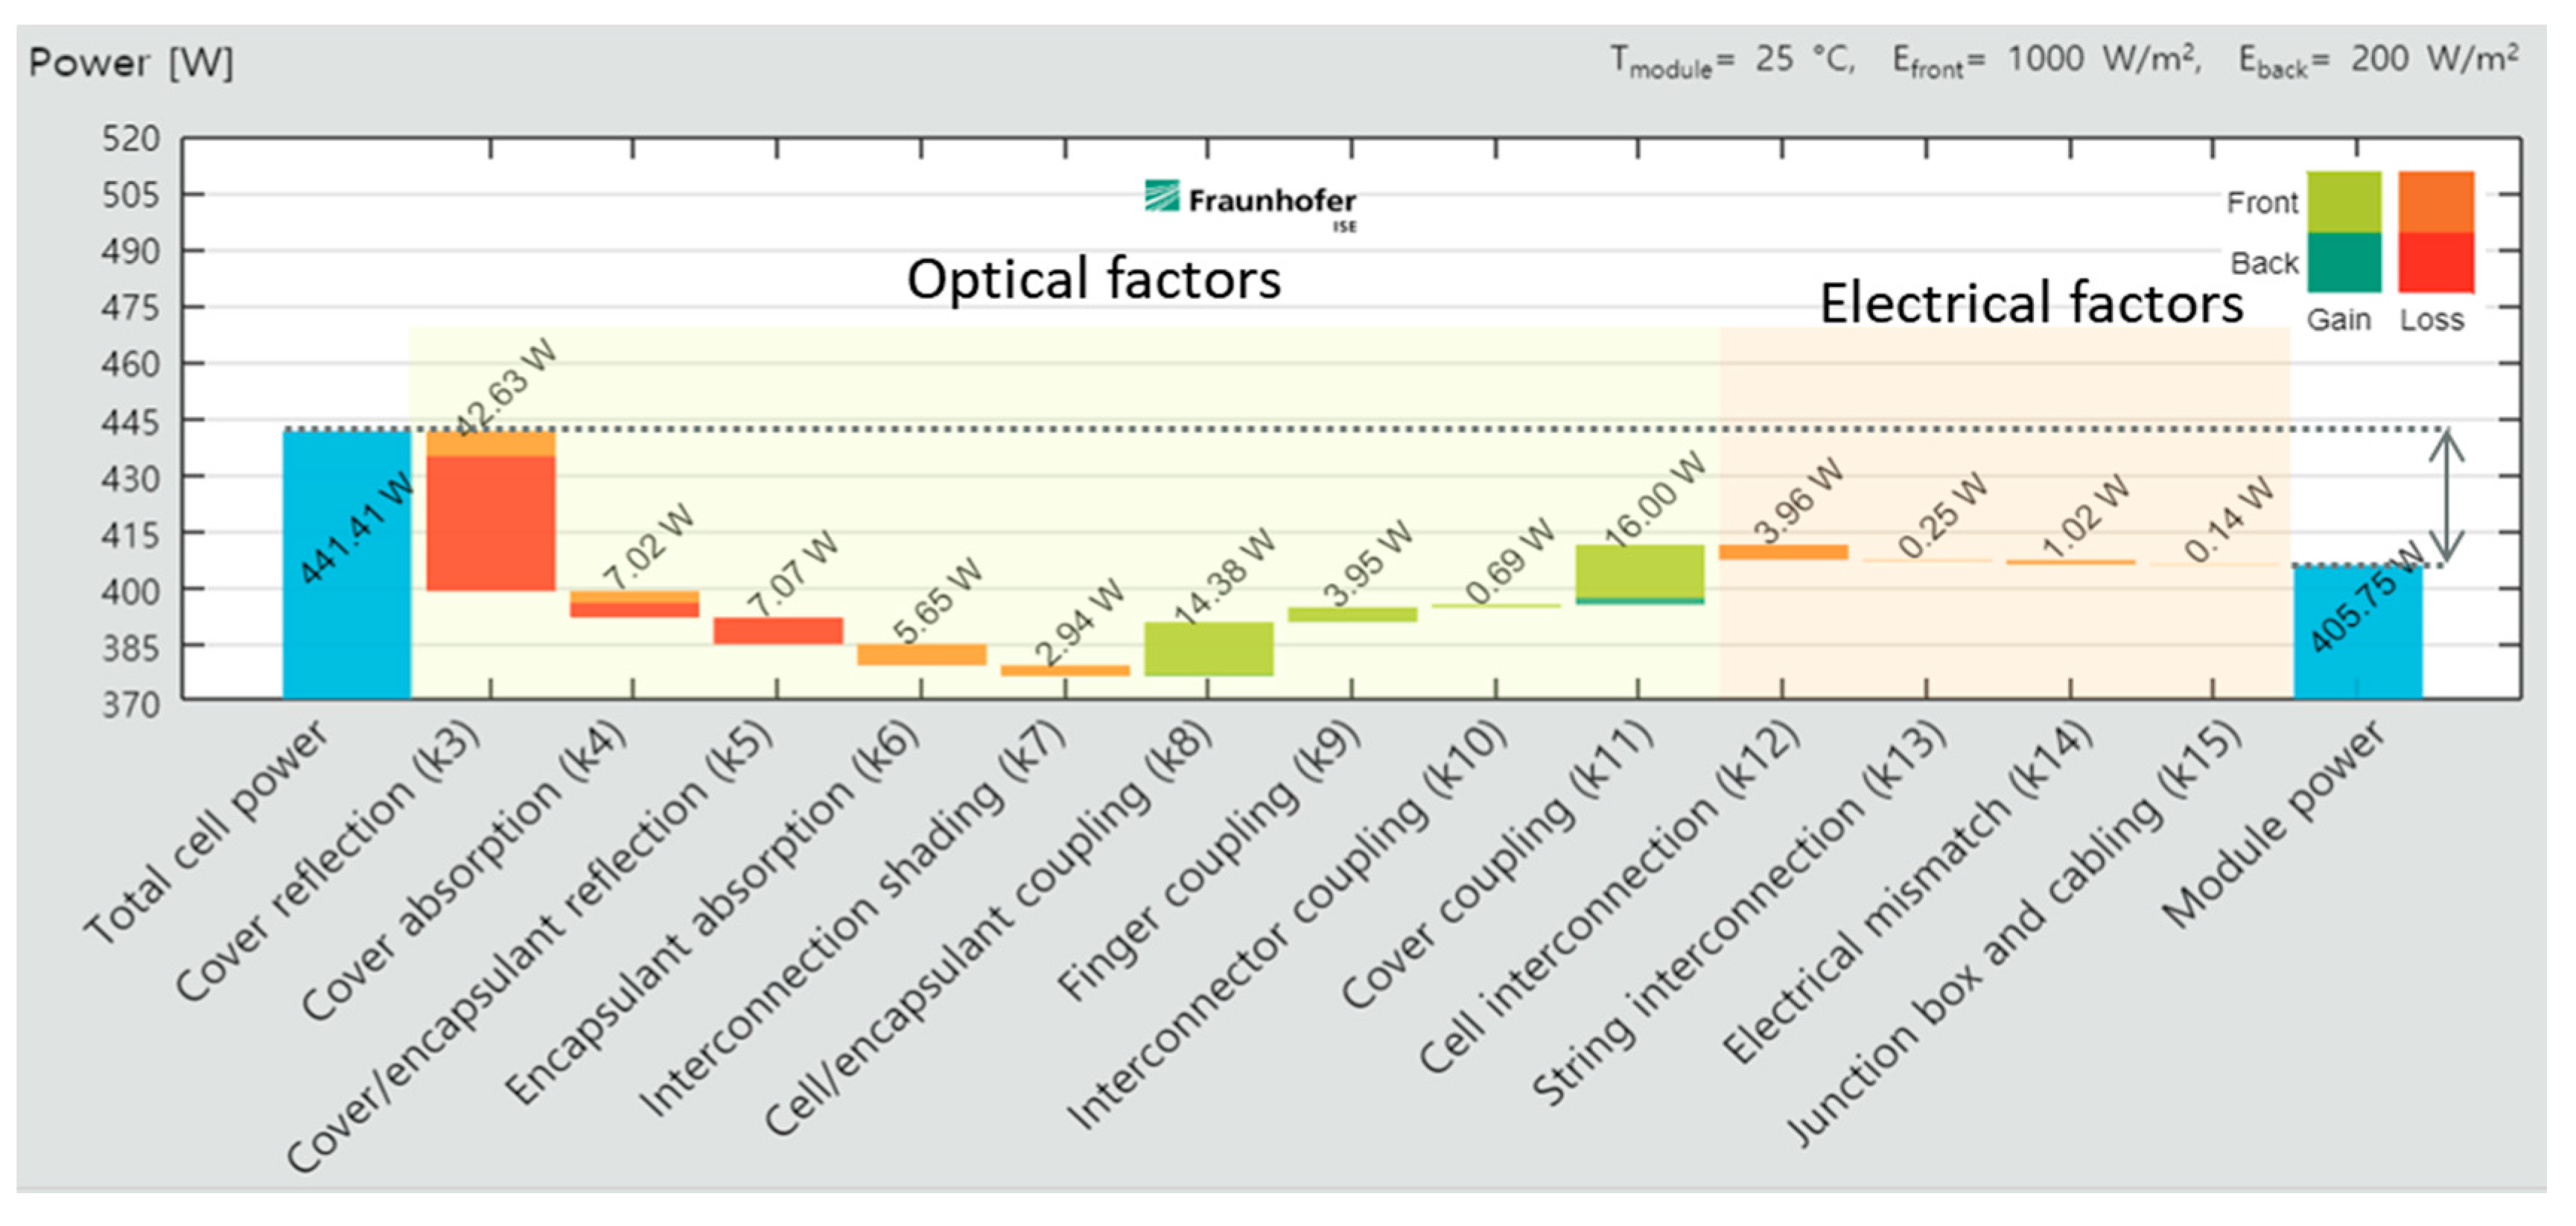
Figure 3 shows a waterfall diagram depicting the typical sources of losses and gains considered in cell-to-module analysis (CTM analysis) using the software SmartCalc.CTM. As presented in the figure, the CTM ratio describes the ratio between the sum of the initial solar cell power (or solar cell efficiency) and the power (or efficiency) of the final module. Therefore, two definitions of the CTM ratio exist, one based on power and one based on efficiency. In the present study, we use the power CTM ratio. The aspect of this analysis investigated here is gains that can be achieved by optical coupling, for example, at otherwise inactive module areas [
13].
In a module configuration featuring a mesh backsheet or mesh glass rear side, the so-called backsheet coupling gain (k11) is affected by the coated areas on the module rear side. Compared to a simple homogeneous backsheet, some more aspects of the geometry must be accounted for. In the following, we will describe how to consider the front side gains and potential rear side losses associated with the use of a meshed module rear side.
2.2. Ray Group Model Definition
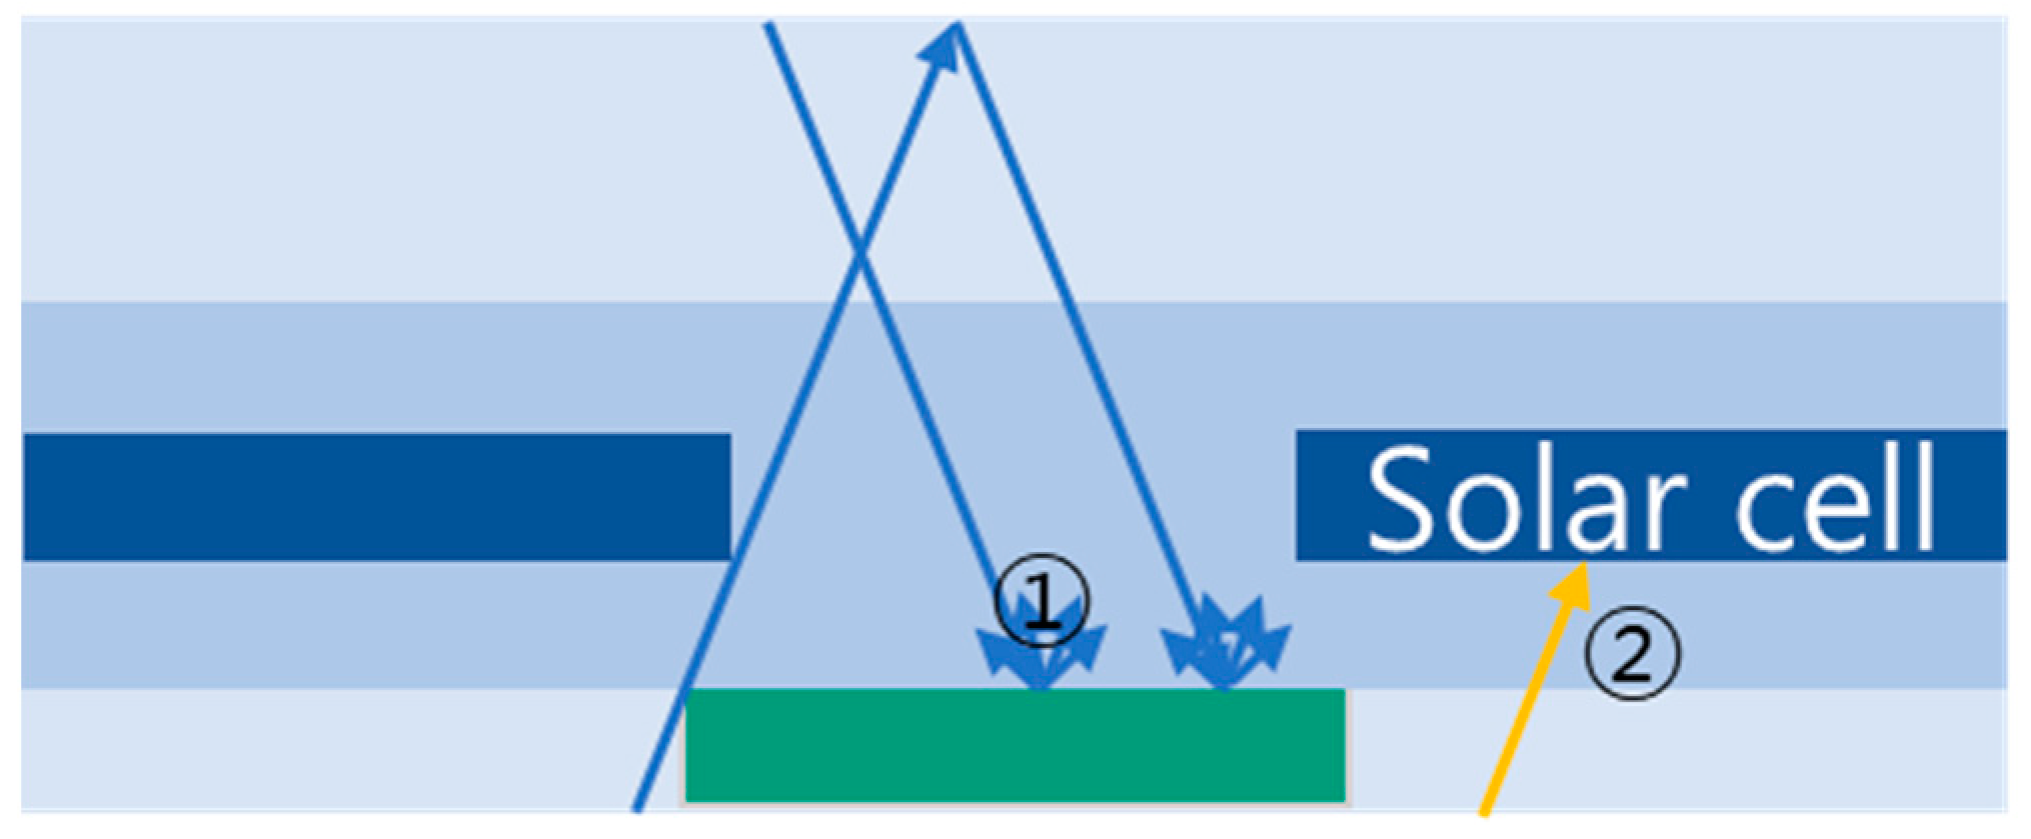
Figure 4 schematically shows the two contributions to module power that we investigated. As shown in the following figure, the additional irradiances can be produced by internal reflection and irradiance from the rear side. We define the ray groups based on the thickness of each layer and the following contributions. Additionally, we consider the illuminated area when analyzing with various incident angles.
2.2.1. Reflection Gains from Front Side Illumination
The light incident on inactive module areas from the front side is reflected by the coated area of the meshed backsheet. We define the excess width of the mesh bars underneath the cell as
xref. We denote the width of the solar cell as w
cell and the height of each layer of the module stack as
hg, heA, hc, heB and
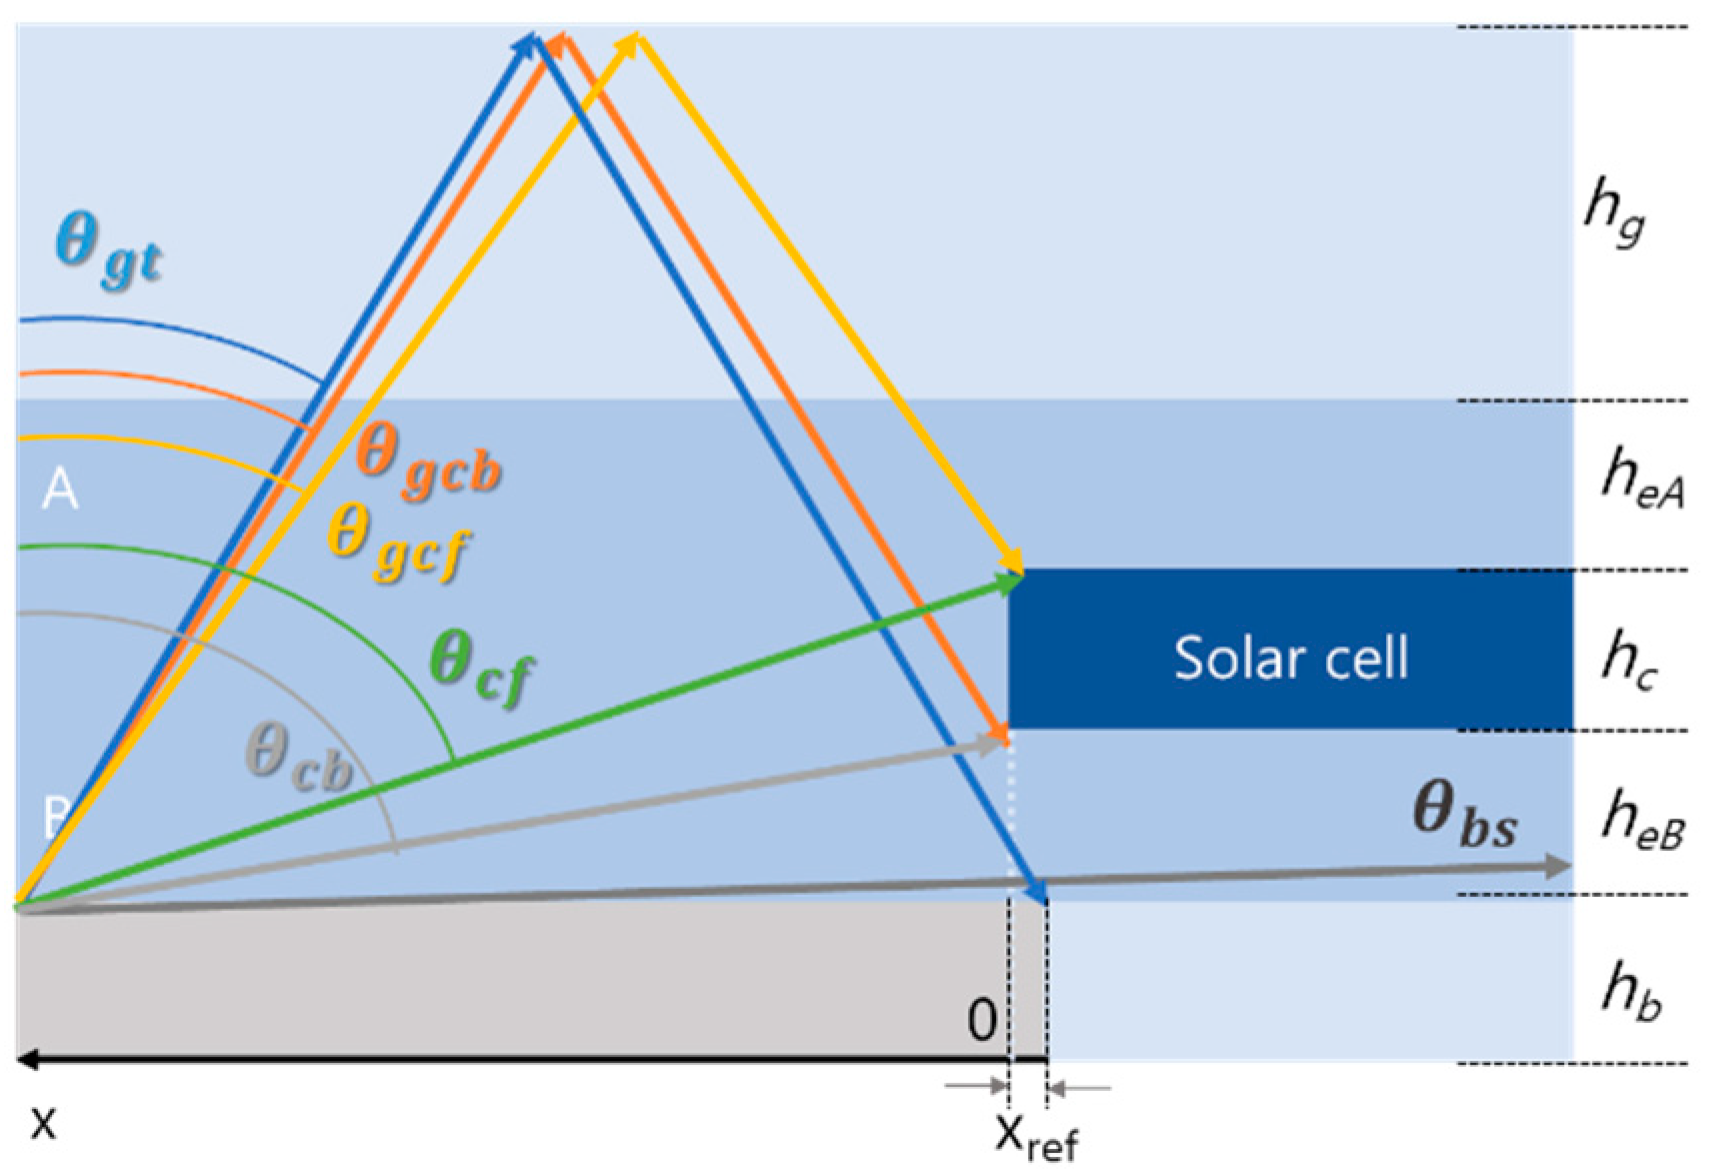
hb (for front glass, front encapsulant, solar cell, rear encapsulant and backsheet/glass, respectively). The backsheet is assumed to diffusely reflect light, following the distribution of a perfect Lambertian reflection. Each light ray hitting the coated area is thus reflected with its power reduced by the given reflectance. We consider each point x along a line perpendicular to the cell edge in the space between cells, where
x = 0 is defined as the cell edge of the right cell (comp.
Figure 5). To accurately describe the light redistribution from this point, we define so-called ray groups, which are fully defined by their reflected angles. Additionally, we consider the azimuth angle of the incident light
. As the reflection is assumed to be perfectly uniform, the distribution of the reflected light is not affected by the incidence angle. However, shading due to the solar cell edges is affected, as we will see below. Each ray group represents the light being redirected into a specific part of the module: the cell front side, the cell back side (the cell edge, which is considered to belong to the front side), the coated backsheet area, the transparent area or exiting the module via the front side. Each ray group is denoted by letters that represent the path the light takes after being reflected (e.g., g.bs = glass.backsheet). This nomenclature is given along with their respective angular ranges in
Table 1.
Figure 5 schematically depicts the threshold angles which define these different ray groups. The threshold angles are defined by the module geometry and given in Equations (1)–(6).
To define the total irradiance hitting its target in each ray group, we first define a loss matrix M for the respective light path. The loss matrix is calculated based on previously calculated angle-dependent optical loss factors (see k
3 to k
6 in
Figure 3) that define transmission and reflection losses through the encapsulation materials and at the glass/air interface. The bi-directional reflection distribution function of the backsheet (BRDF) is measured or modeled depending on the reflective properties of the coating and, in the present study, a perfectly Lambertian reflection distribution is assumed. More details on the impact of backsheet reflection on internal coupling gains can be found in Pfreundt et al. [
6].The total irradiance of each ray group is calculated by Equation (7) using the light fraction defined in Equation (8).
The threshold angles
and
define the range of each ray group, as defined in
Table 1.
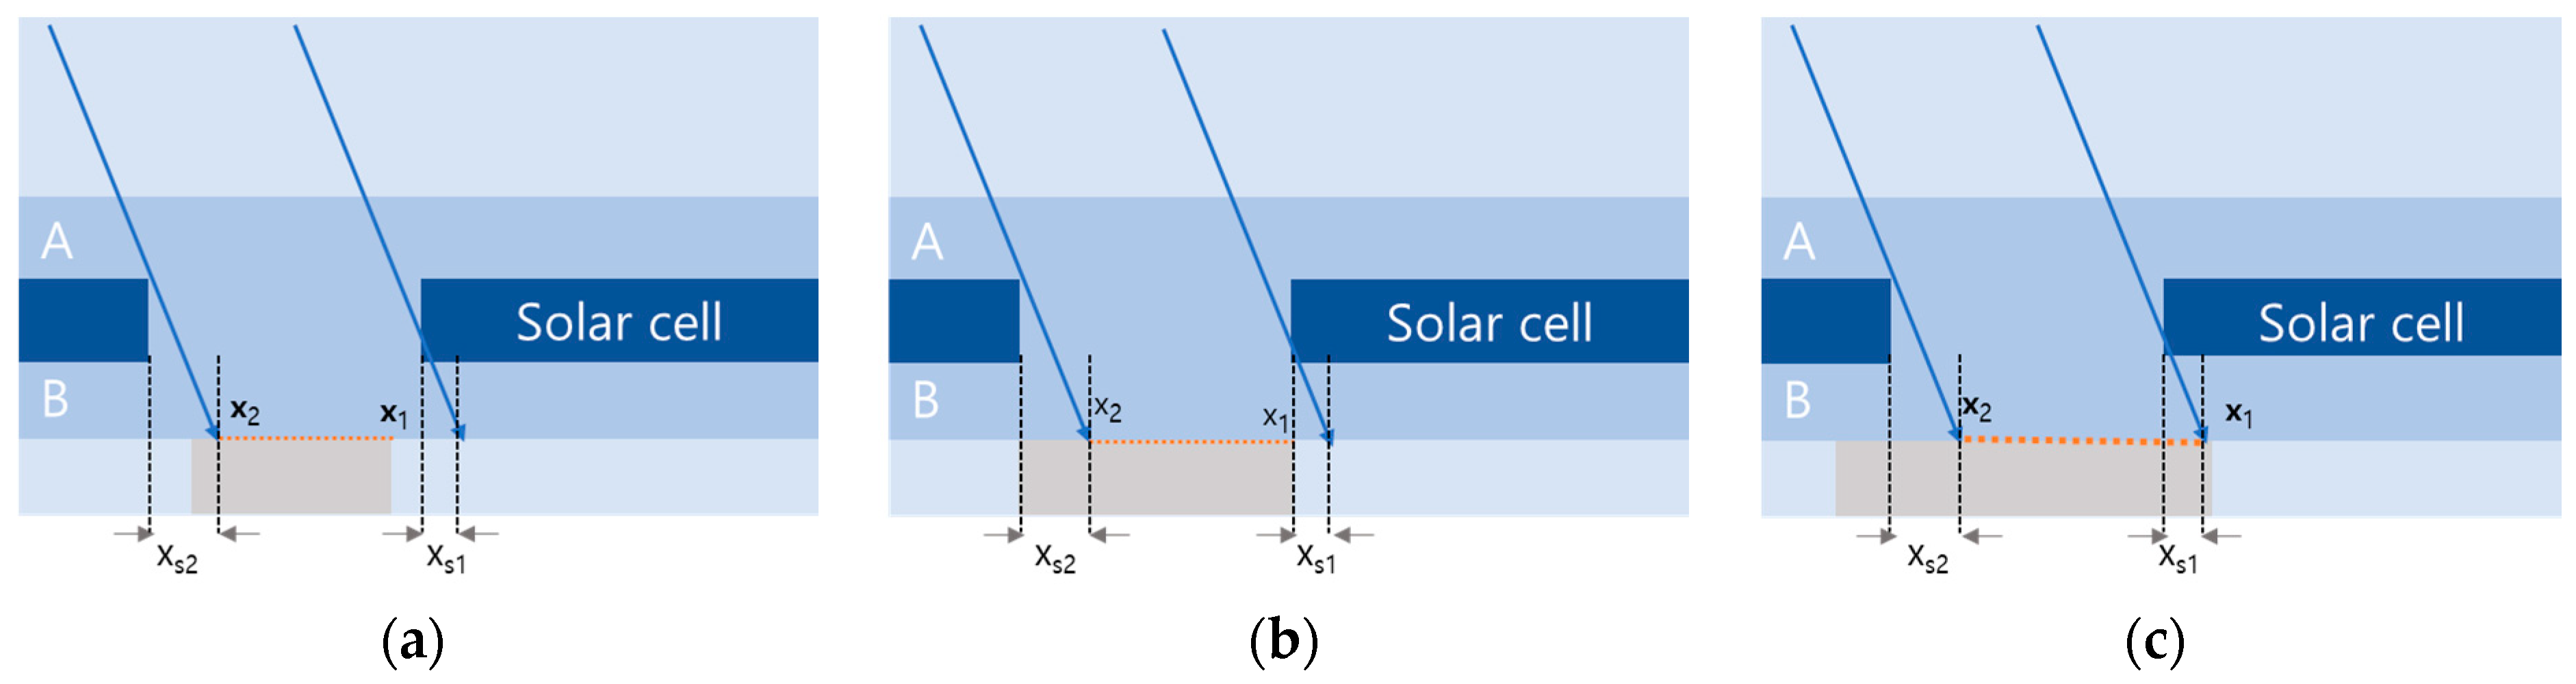
At incidence angles other than normal incidence, shading from the solar cell changes the position of the illuminated area on the module rear side. Especially in the case of the inhomogeneous back side of the mesh backsheet, this shift in the illuminated area needs to be considered.
While the depiction in
Figure 6 shows a two-dimensional view of the module cross-section by x, we consider the shading effects for all four sides of the cell respectively. This considers the impact of the azimuth angle of the incident light. Equations (9)–(12) define the shaded and illuminated areas on each side of the cell, where
hc is the height of the cell and
heB is the height of the lower encapsulation materials above the mesh. Due to symmetry, the width of the illuminated areas on opposite sides of the cell are identical. To correctly account for the reflection gains with respect to a single cell, we need to consider the light redistribution in opposite directions. On one side, we consider the left solar cell as the target and, on the opposite side, the right solar cell. The calculated gains along a line are then integrated around the cell circumference, accounting for the cell format by weighing the respective contributions. Thus, we calculate the reflection gain per cell depending on its surrounding inactive area.
2.2.2. Reflection and Direct Gains from Rear Side Illumination
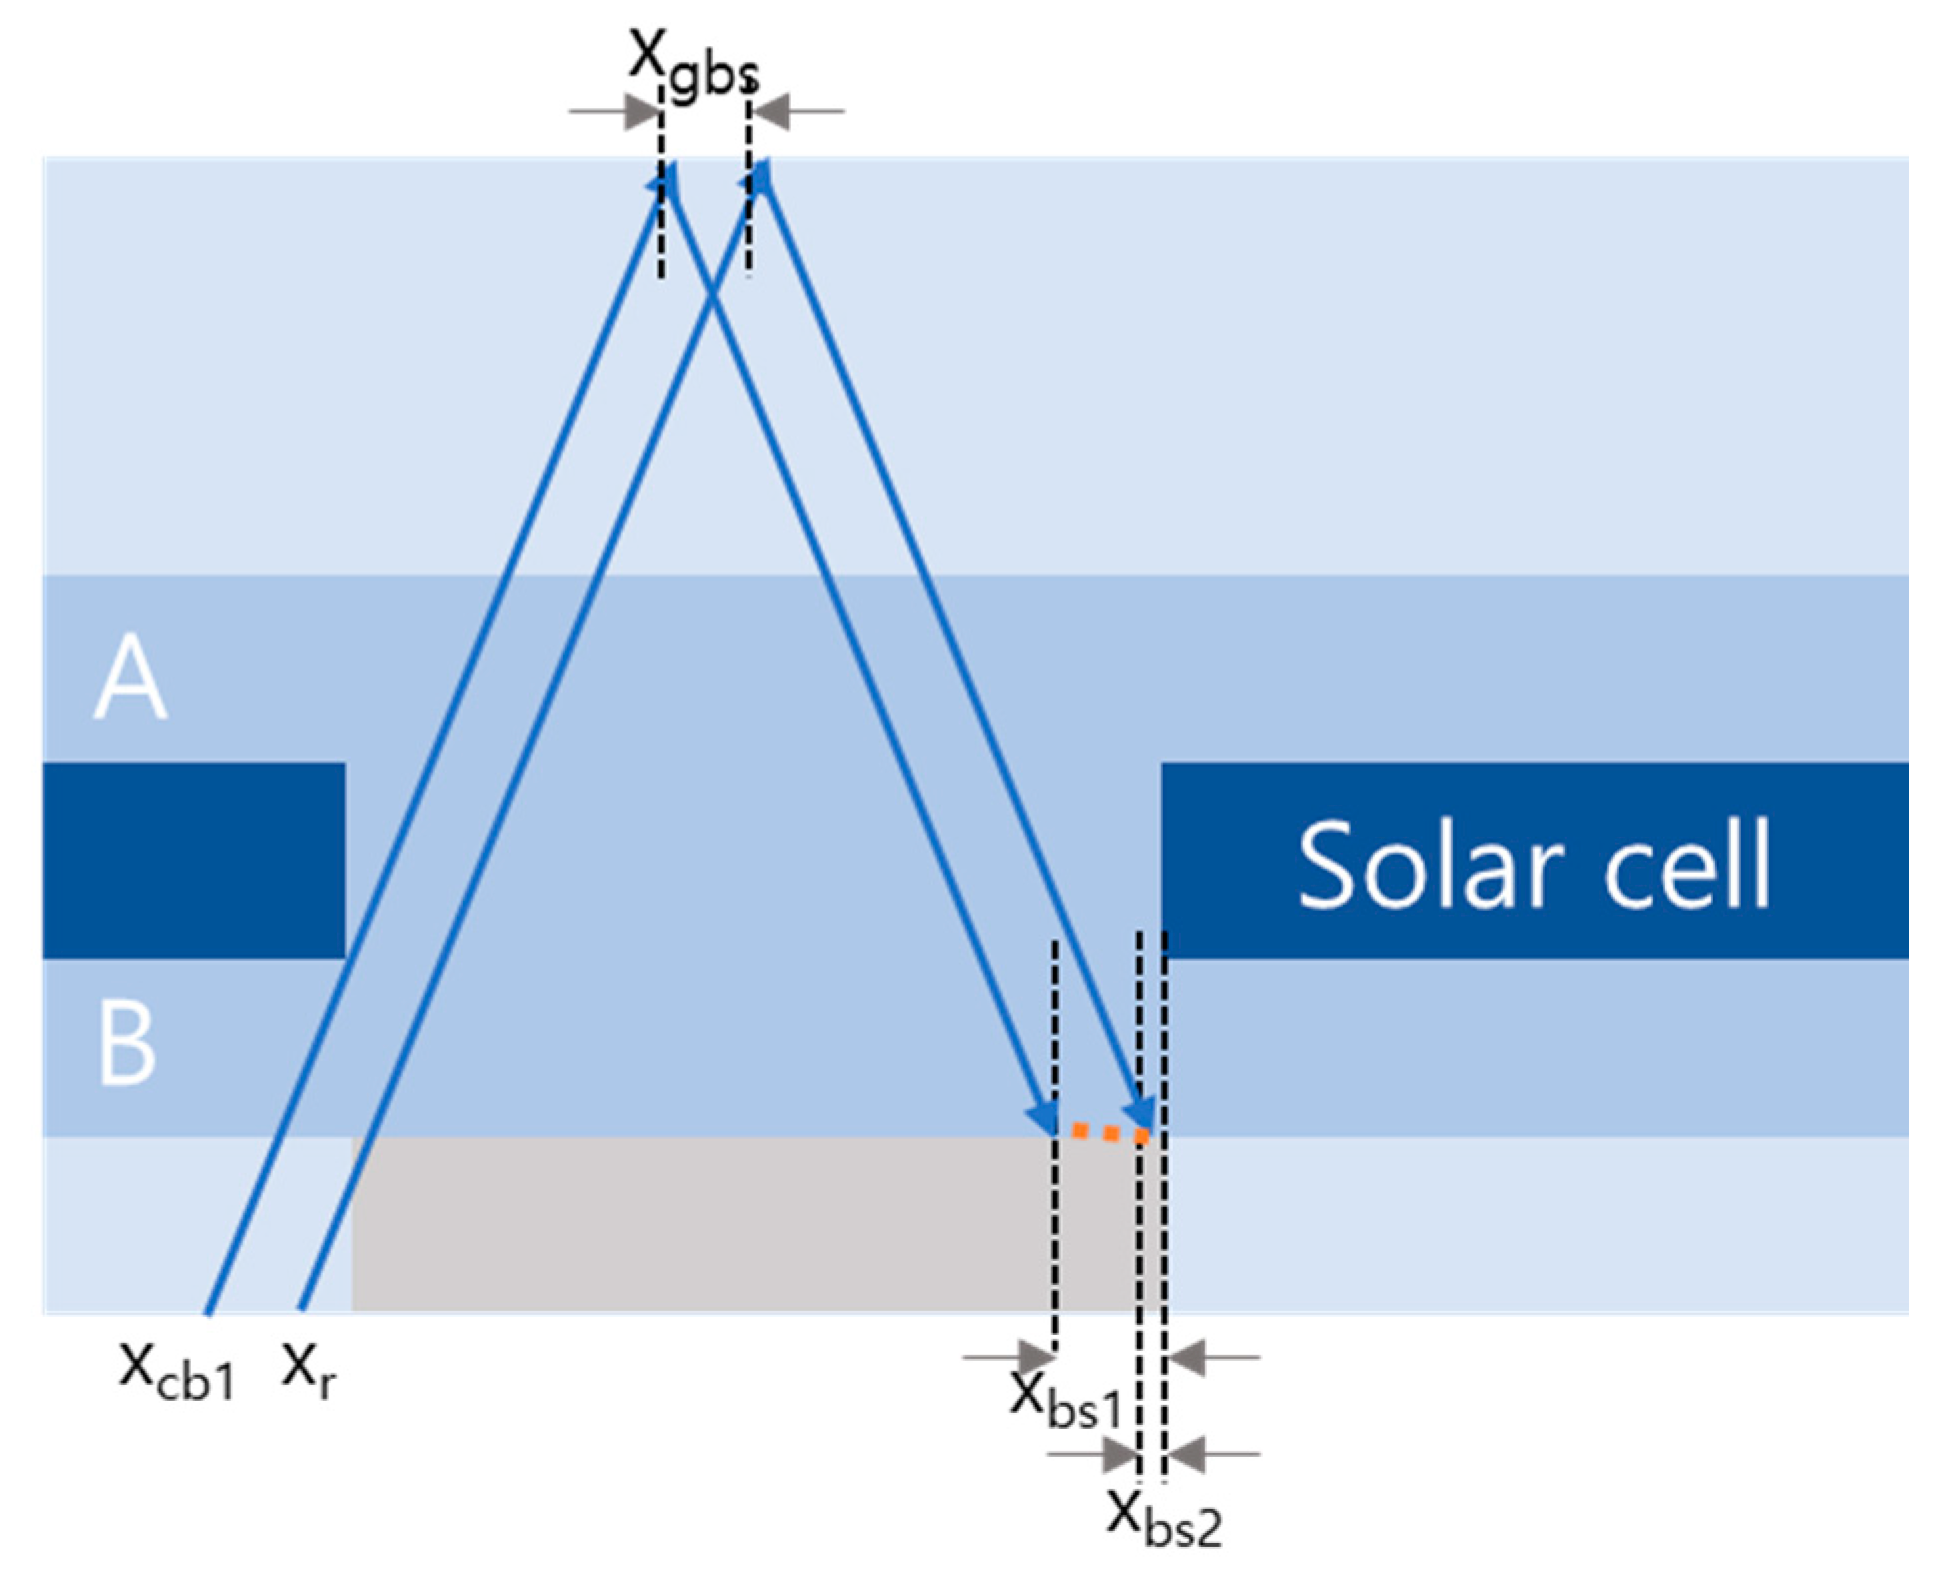
We divide the light into two main parts, one hitting the (projected) cell gap and one part hitting the cell directly. A major part of the rear side irradiance illuminates the back side of the solar cell directly. A small part is redirected to the front side or edge of the cell and another small part is absorbed or reflected by the coated area on the backsheet. These parts are again determined by the angle of incidence of the rear illumination and resulting shading distances. These are depicted in
Figure 7 and
Figure 8 calculated using Equations (13)–(16) and Equations (17)–(20), respectively. The light received by the cell back side is directly calculated using the appropriate loss matrix (including reflection at the rear interface and absorption in the encapsulation materials). For the part of the light hitting the module in the cell gap area, we again distinguish different fractions of light, depending on the angle of incidence. These contributions are small compared to those from the front side coupling gain since light is initially reflected at the internal glass interface and at an angle smaller than that required for total internal reflection.
The illuminated area on the cell back side is determined by the following boundaries, using the thickness of the rear glass or backsheet up to the coated area
and the thickness of the rear encapsulation layer
to determine the shading lengths. It should be noted that
can be 0 in the case where the mesh is applied to the outside of the module rear side. In this case, the internal material height is added to
, neglecting refraction at the internal interface.
Just as for the front side illuminated area, the four sides of a cell are illuminated differently. Each side is illuminated at a different angle of incidence. This is considered by in integration boundaries
xbs1 and
xbs2 (
ybs1 and
ybs2, respectively).
2.2.3. Total Irradiance on Solar Cell
The total irradiation on each side of the cell is calculated by integrating all contributions in each ray group at each illuminated point
x on the inner reflective boundary of the backsheet and module rear side respectively.
x1 and
x2 denote the boundaries of the respective illuminated areas as described above.
2.2.4. CTM Factor k11
The gains associated with the additional irradiance on the cell due to internal reflection and losses associated with rear side shading are summarized as the (incident light) power gain
. The factor describing the resulting power change of the PV module due to this gain is described by a CTM factor (
k11), by which the short circuit current of the cell is affected. The subsequent impact on module power includes consideration of the IV curve of the solar cell and electrical losses. The details of this calculation can be found elsewhere [
14]. The reference power
Pref value is the sum of the direct irradiance on the cell front and cell back after all other optical losses and gains due to the encapsulation of the cell have been accounted for.
3. Results
We analyze the performance of PV modules with mesh backsheets by
CTM ratio and power gain. The
CTM ratio is the ratio between the sum of initial cell powers and final module power.
The power gain is the ratio between additional gain (reflected gains, direct gains) and initial irradiance. Additionally, we consider the power loss depending on operating temperature. The power gain is determined for a variation of the effective backsheet reflectance, the cell bifaciality factor, the width of the mesh and the distance between cell and coated area (mesh) on the module rear side
. This distance can be influenced by encapsulation thickness, thickness of the rear cover and positioning of the mesh-coated side (inner or outer surface). The power loss can be increased when the input irradiance is increased.
In this study, we simulate the performance of a PV module with a mesh backsheet in five scenarios. We analyze this depending on parameters such as reflectance, bifaciality factor and width of backsheet. In addition, we define the power loss by the mesh backsheet. Through the four scenarios, we define the optimal conditions of each variant. In scenario five, we compare the power gain and CTM ratio depending on type of backsheet in optimal conditions.
S1. Power gain depending on the reflectance of mesh coating.
S2. Power gain depending on bifaciality factor of the solar cell.
S3. Power gain depending on the width of the mesh bars.
S4. Comparison of module temperature loss and CTM ratio.
S5. Comparison of the mesh concept with uniform backsheets (BS).
Table 2 shows the parameters of each scenario. We further investigate the angle dependence of the two gain factors for different module setups. Incidence angles up to 60 degrees are used in the simulation.
All simulated modules have an identical setup of 132 bifacial half cells (79.38 mm × 158.75 mm) with a bifaciality factor of 65% if nothing else is stated. For encapsulation, conventional ethyl vinyl acetate (EVA) with UV blocker and a 3.2 mm front glass with anti-reflective coating is used. The cell and string distance are fixed at 5 mm, resulting in a module size of 2.08 × 1.02 m². The module rear side is composed of a transparent backsheet or glass with a white coating in the area between cells. The width of these areas is varied symmetrically, keeping the center of the coating in the center between cells. The reflectivity of the coating is varied between 64% and 88% (values obtained from measurements of industry materials) and an idealized, theoretical value of 100%.
3.1. S1: Power Gain Depending on the Reflectance the Mesh Coating
The total hemispheric reflectance of the backsheet is an important factor for internal optical gains within the PV module [
15,
16,
17,
18].
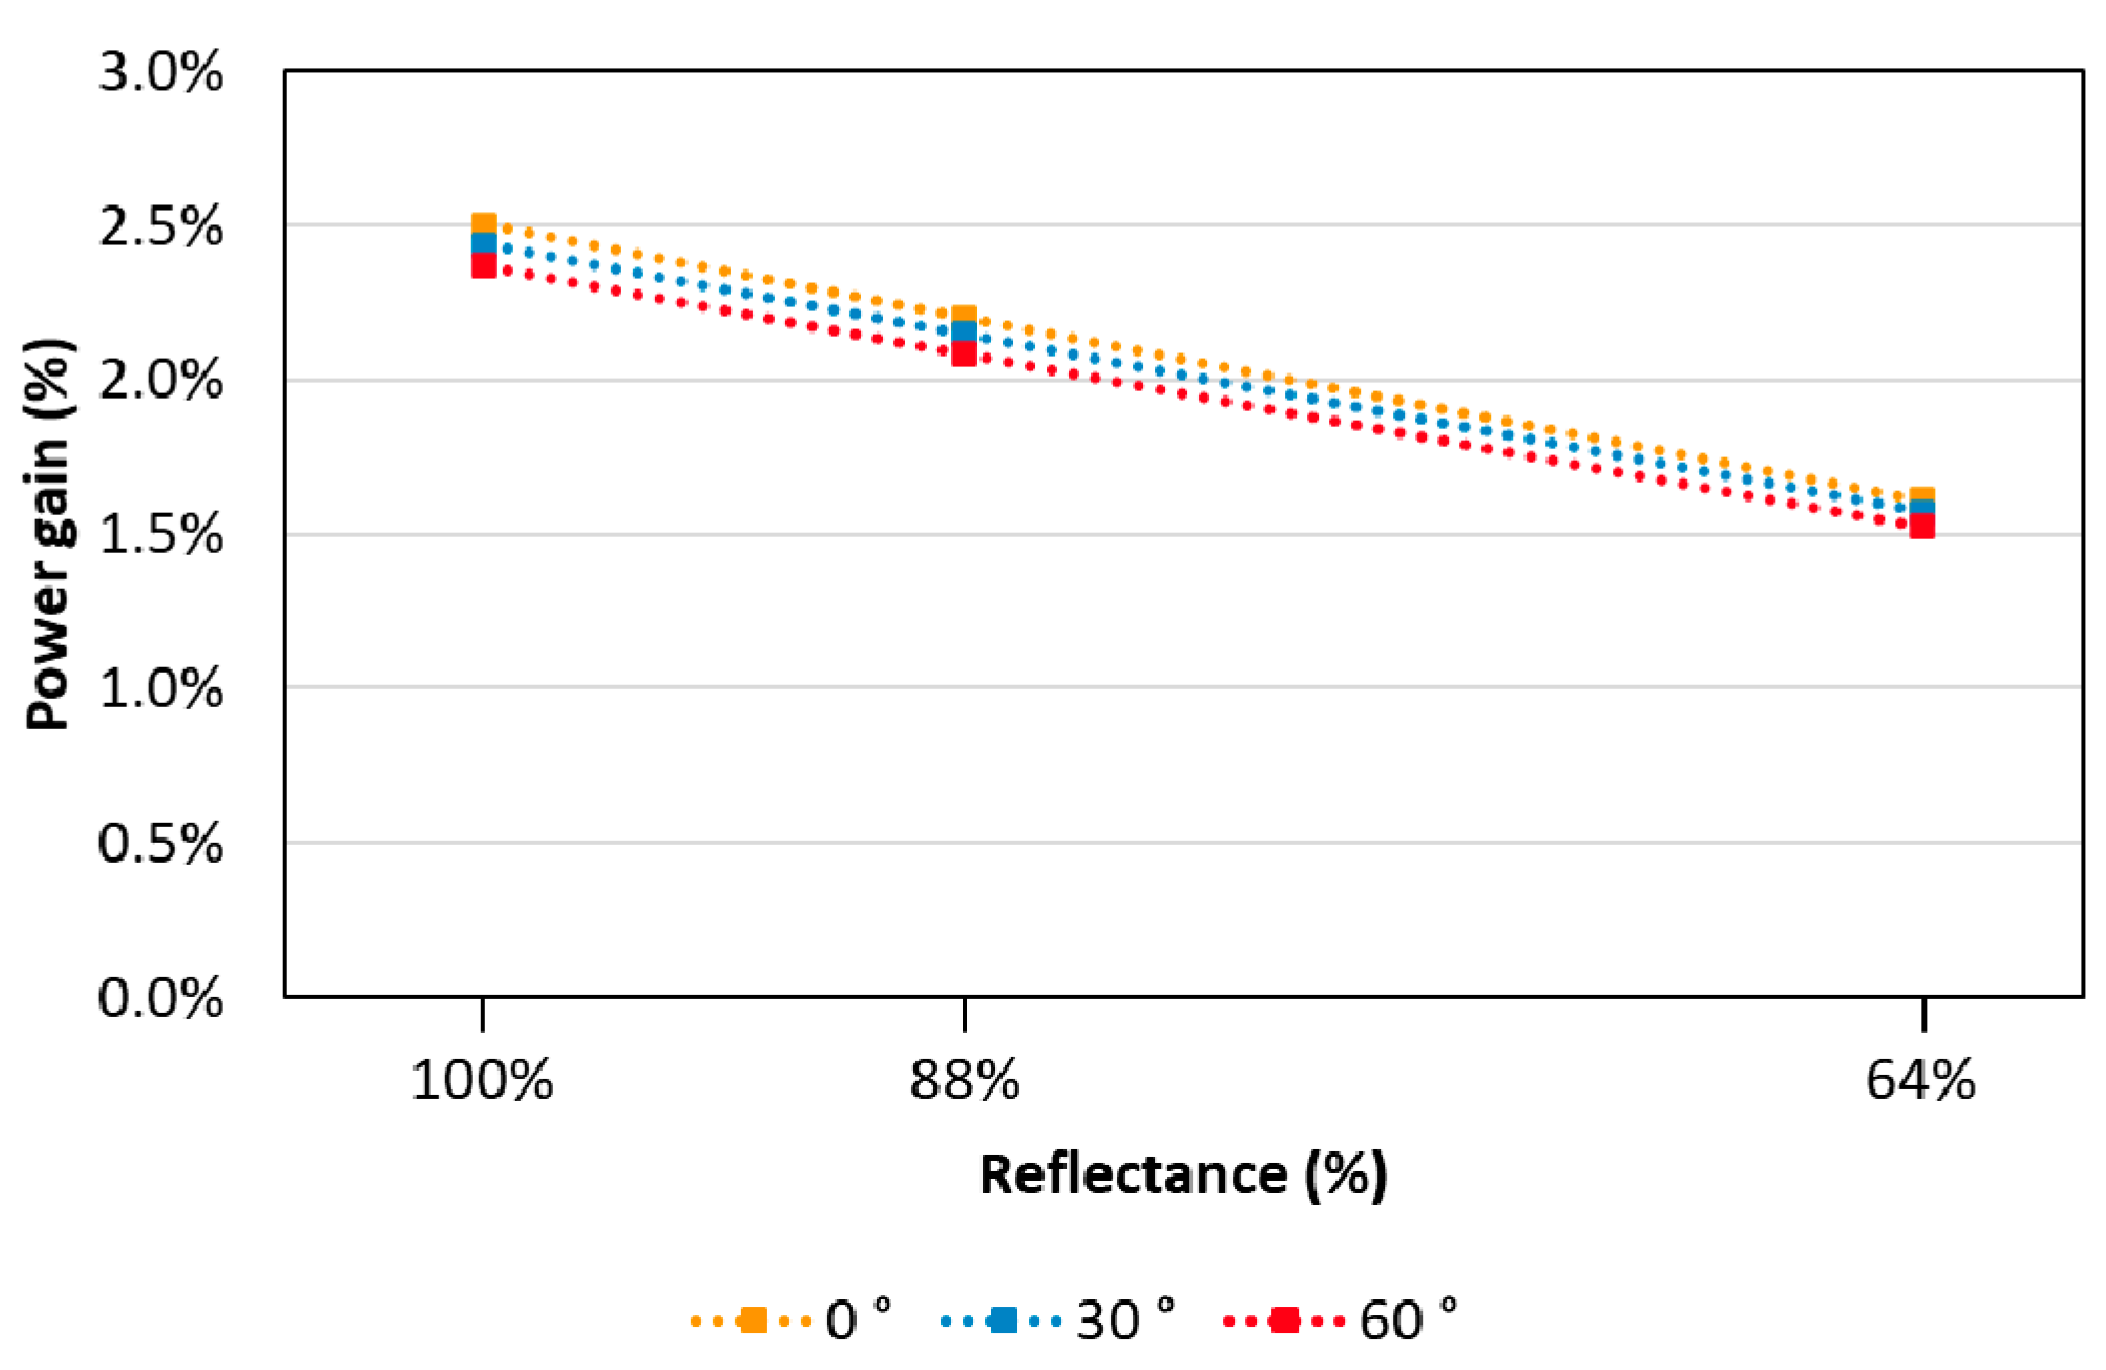
Figure 9a shows the calculated power gain for a mesh exactly as wide as the cell gap for different incidence angles. Three different reflectivities of the coated backsheet area are shown, while all other parameters are kept constant.
reflectivity of coated backsheet: 100%;
reflectivity of coated backsheet: 88%;
reflectivity of coated backsheet: 64%.
In the ideal case 1, our calculations show a power gain of about 2.45% due to internal reflective gains from front and rear side irradiance. At a reflectivity of 88%, this gain is decreased by 12% to 2.2%. At a reflectivity of 64%, this gain is decreased by 36% to 1.6%.
3.2. S2: Power Gain Depending on the Bifaciality Factor of the Solar Cell
The bifaciality factor is the ratio between the nominal efficiency of the solar cell back side and the nominal efficiency at the solar cell front side [
19,
20]. We compare the power gain for three different cases that correspond to bifaciality factors found for different solar cell technologies. The reflectivity of the coated backsheet area is 64% in this comparison:
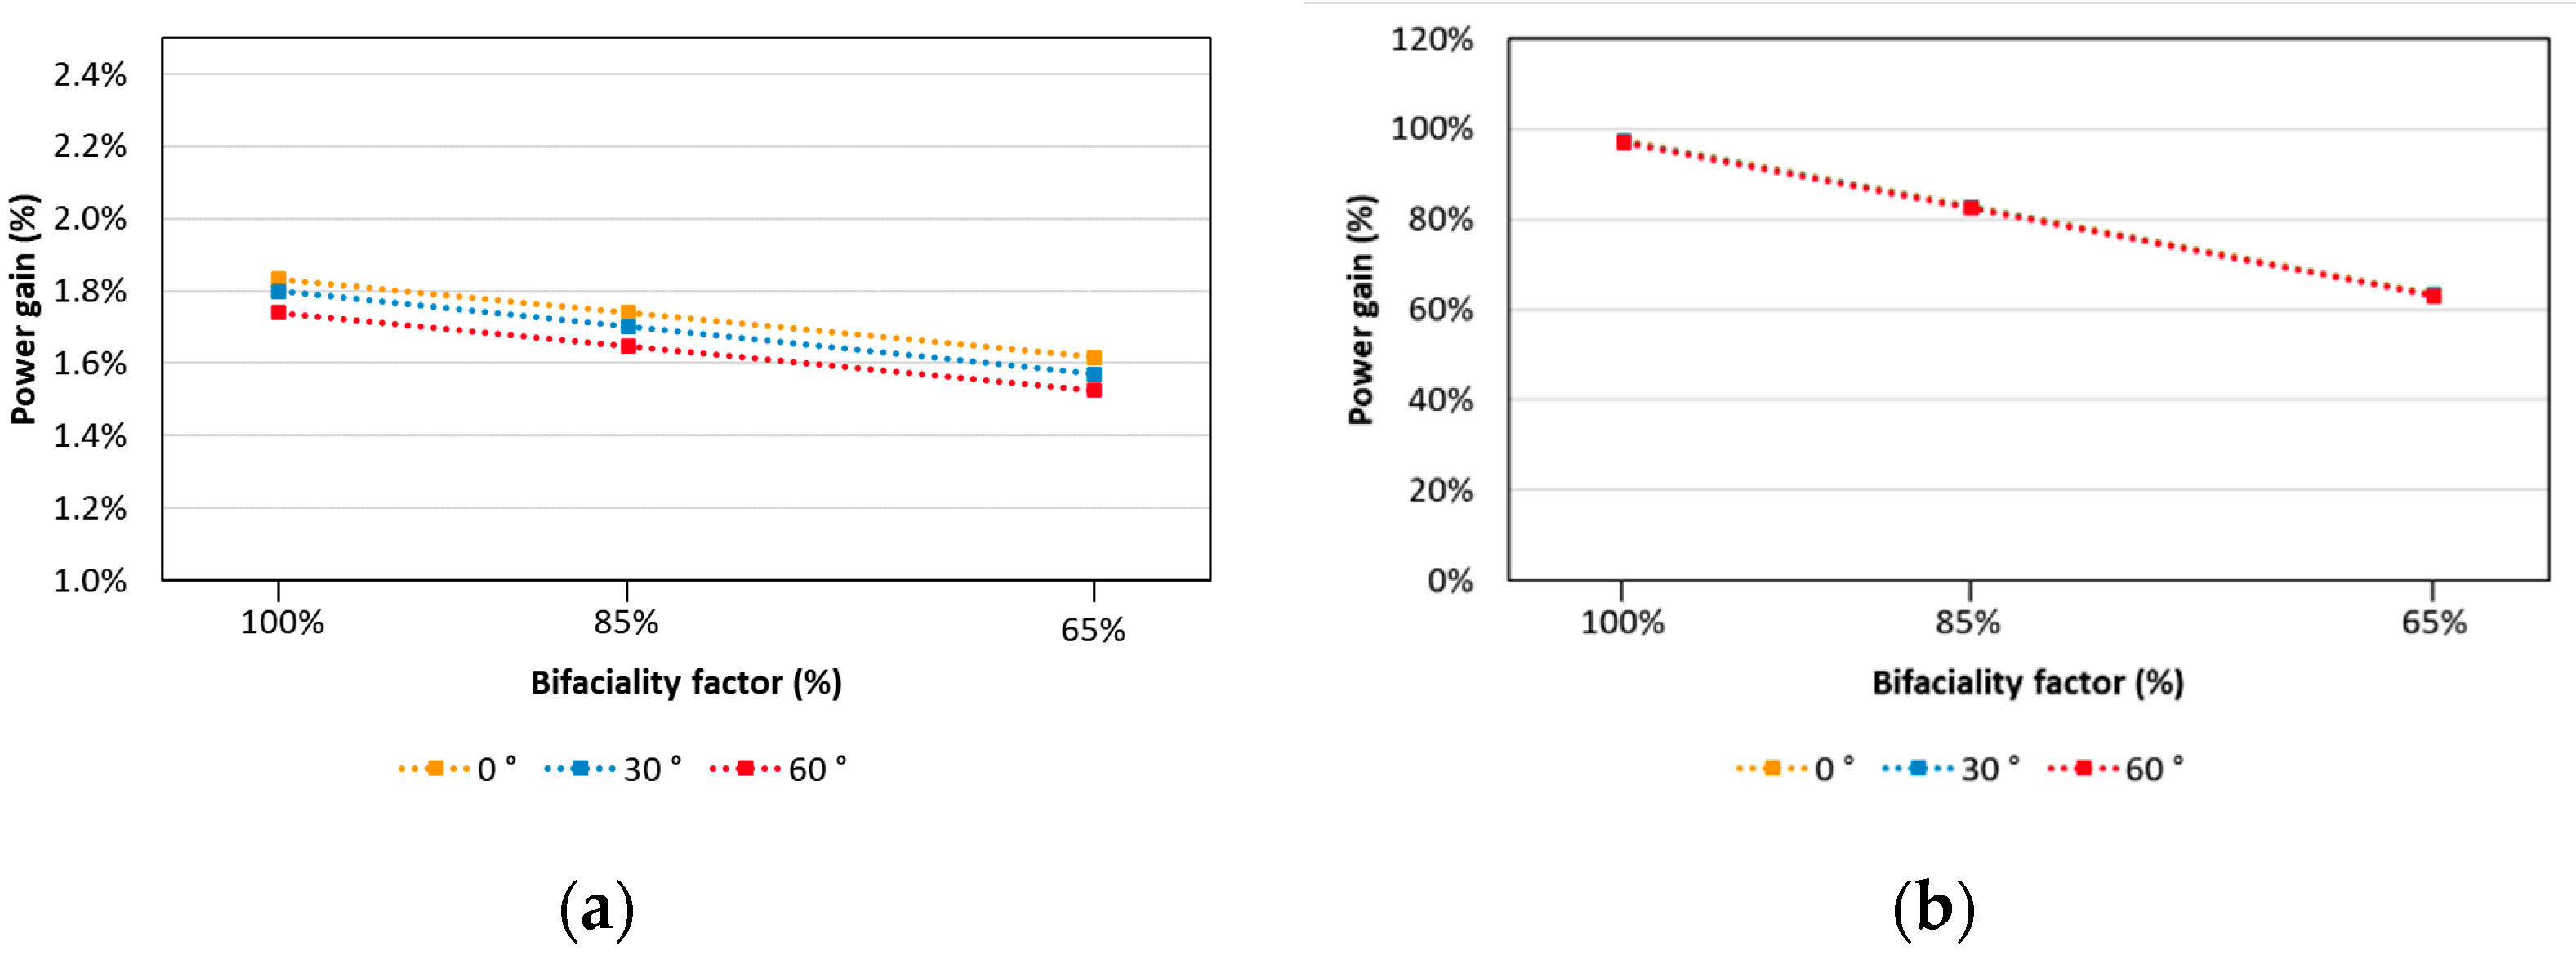
Figure 10 shows the power gain depending on the cell bifaciality factor. As presented in
Figure 10a, the power gain shows the highest values for case 1. When the incident angle is 0°, The power gain due to internal reflection of cases 2 and 3 is about 5.3% and 11.4% lower than that of case 1, respectively. All cell surfaces (cell front, cell side, cell back) receive irradiance from internal reflection. Therefore, the power gain is not linearly impacted by the bifaciality factor. However, the result shows that a large fraction, approximately 28%, of reflected light is redirected to the cell rear side and therefore affected by the bifaciality factor. The redistribution depends significantly on the cell distance, as previous studies have shown. For small cell distances, a larger portion of the reflected light is redirected to the cell back side, while for the larger cell distances, redirection to the cell front side is dominant [
6,
7,
8,
9,
10,
11,
12].
The power gain due to irradiance from the module rear side increases proportionally when the bifaciality factor is increased, and the power gain due to rear irradiance of case 2 is 15% lower, and that of case 3 is 35% lower, than case 1.
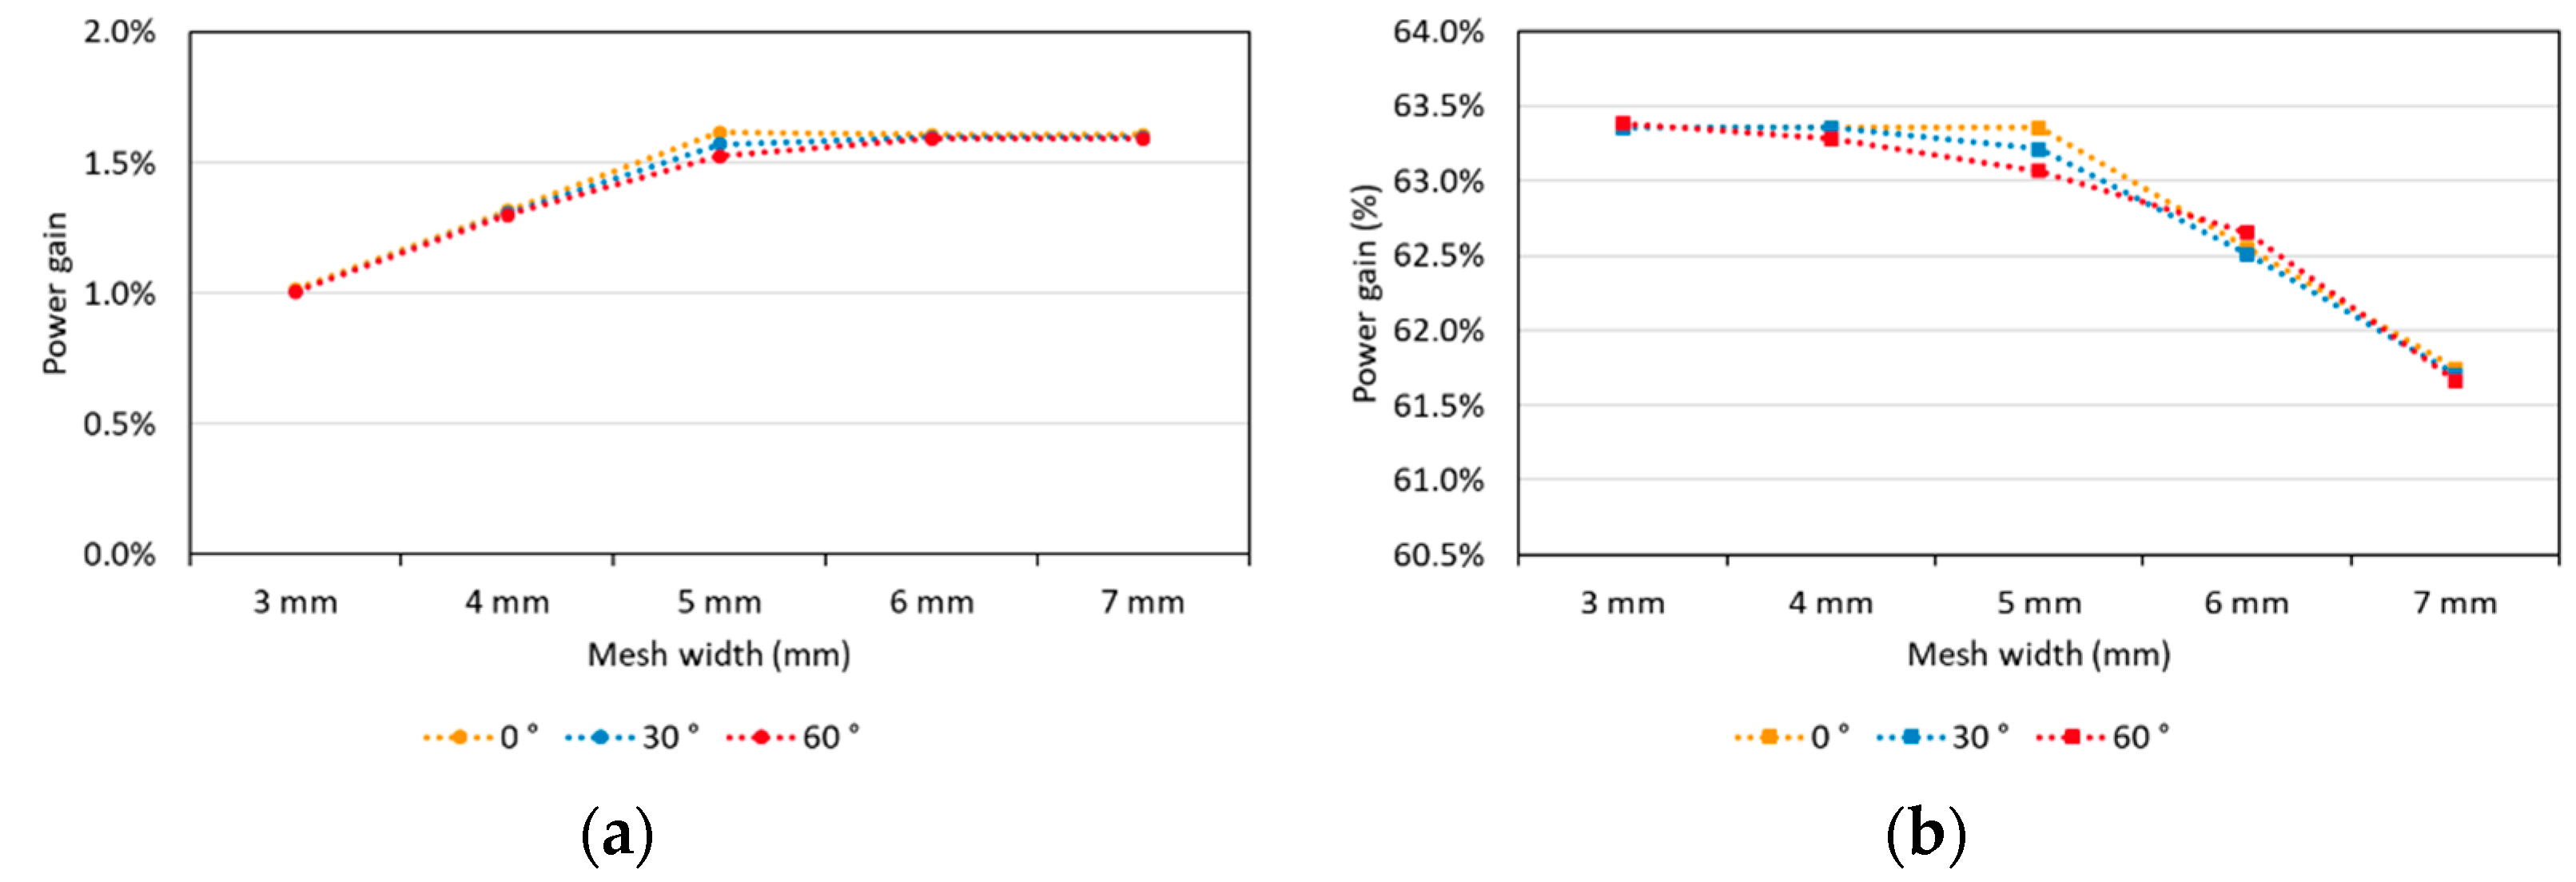
3.3. S3: Power Gain Depending on the Width of the Mesh Bars
The width of the coated area and the resulting overlap x
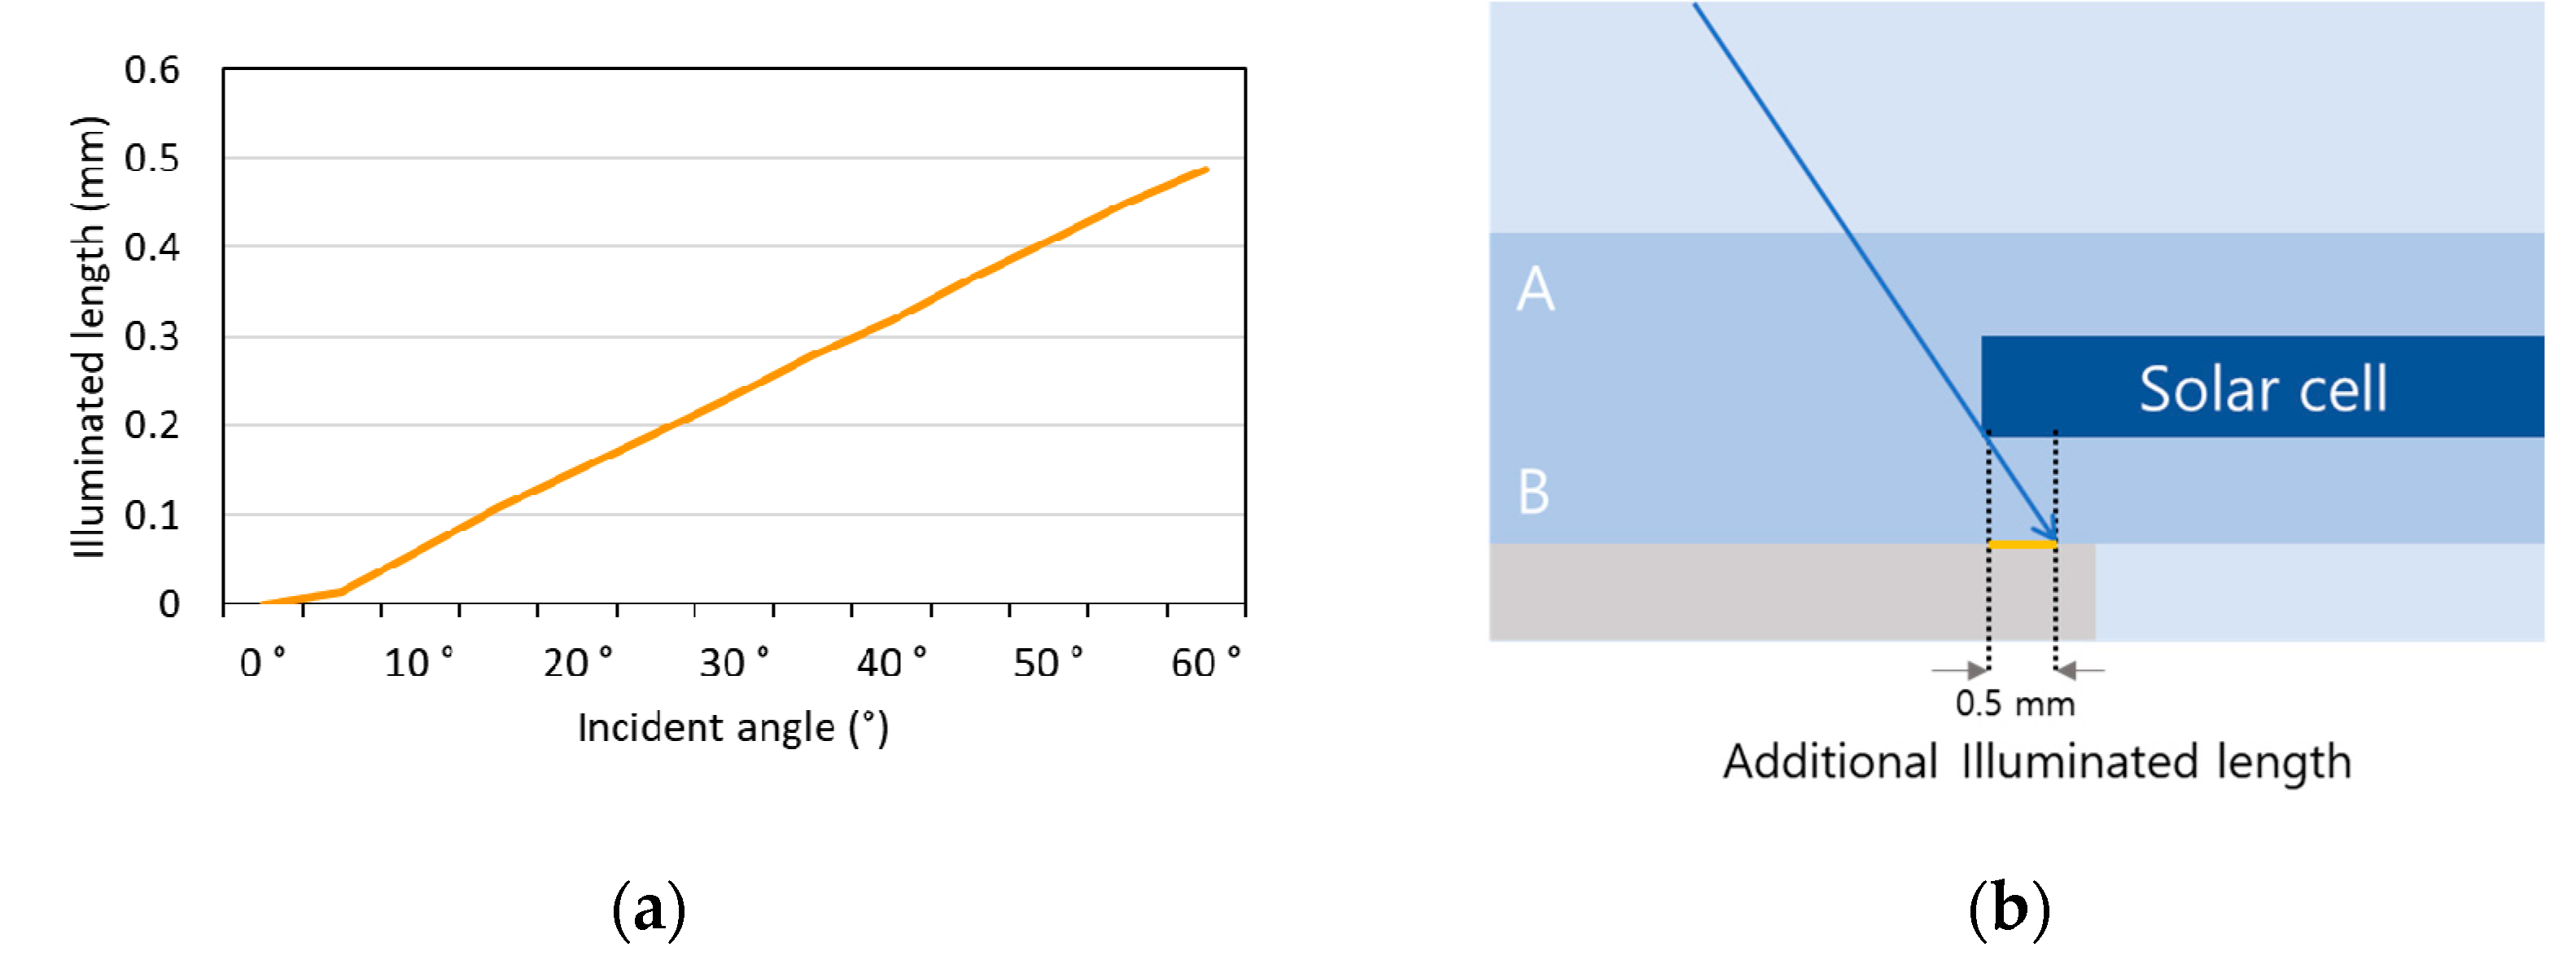
ref are further important parameters of the mesh backsheet in bifacial PV modules. In the following section, we study the dependence of module gains on the width of the white mesh area. The investigated module setup has a mesh backsheet and an EVA thickness of 450 µm. The contribution of light, especially on the rear side, is influenced by this width due to shading but the internal reflection gains are also affected. We calculate the additionally illuminated area under the cell depending on the incident angle, and the relevant width of this area for one side of the cell is shown in
Figure 11. The additional illuminated area increases from 0 mm to 0.5 mm when the incident angle is changed from 0 to 60 degrees. So, the maximum coated area width that will be illuminated up to its edge at the investigated maximum angle is 6 mm.
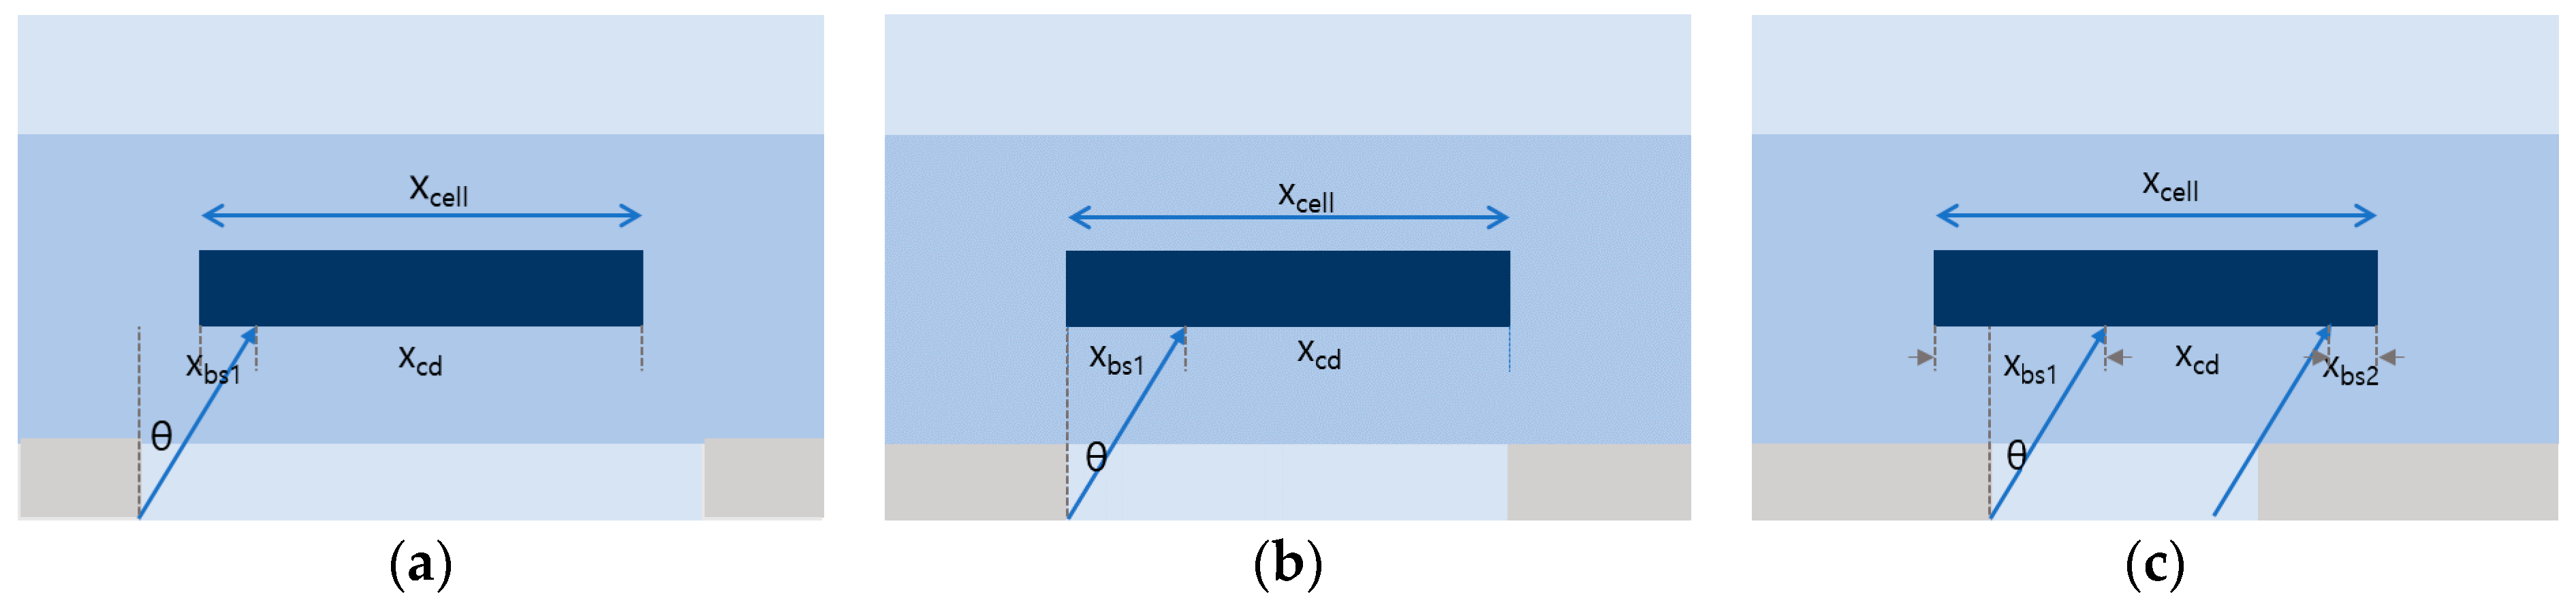
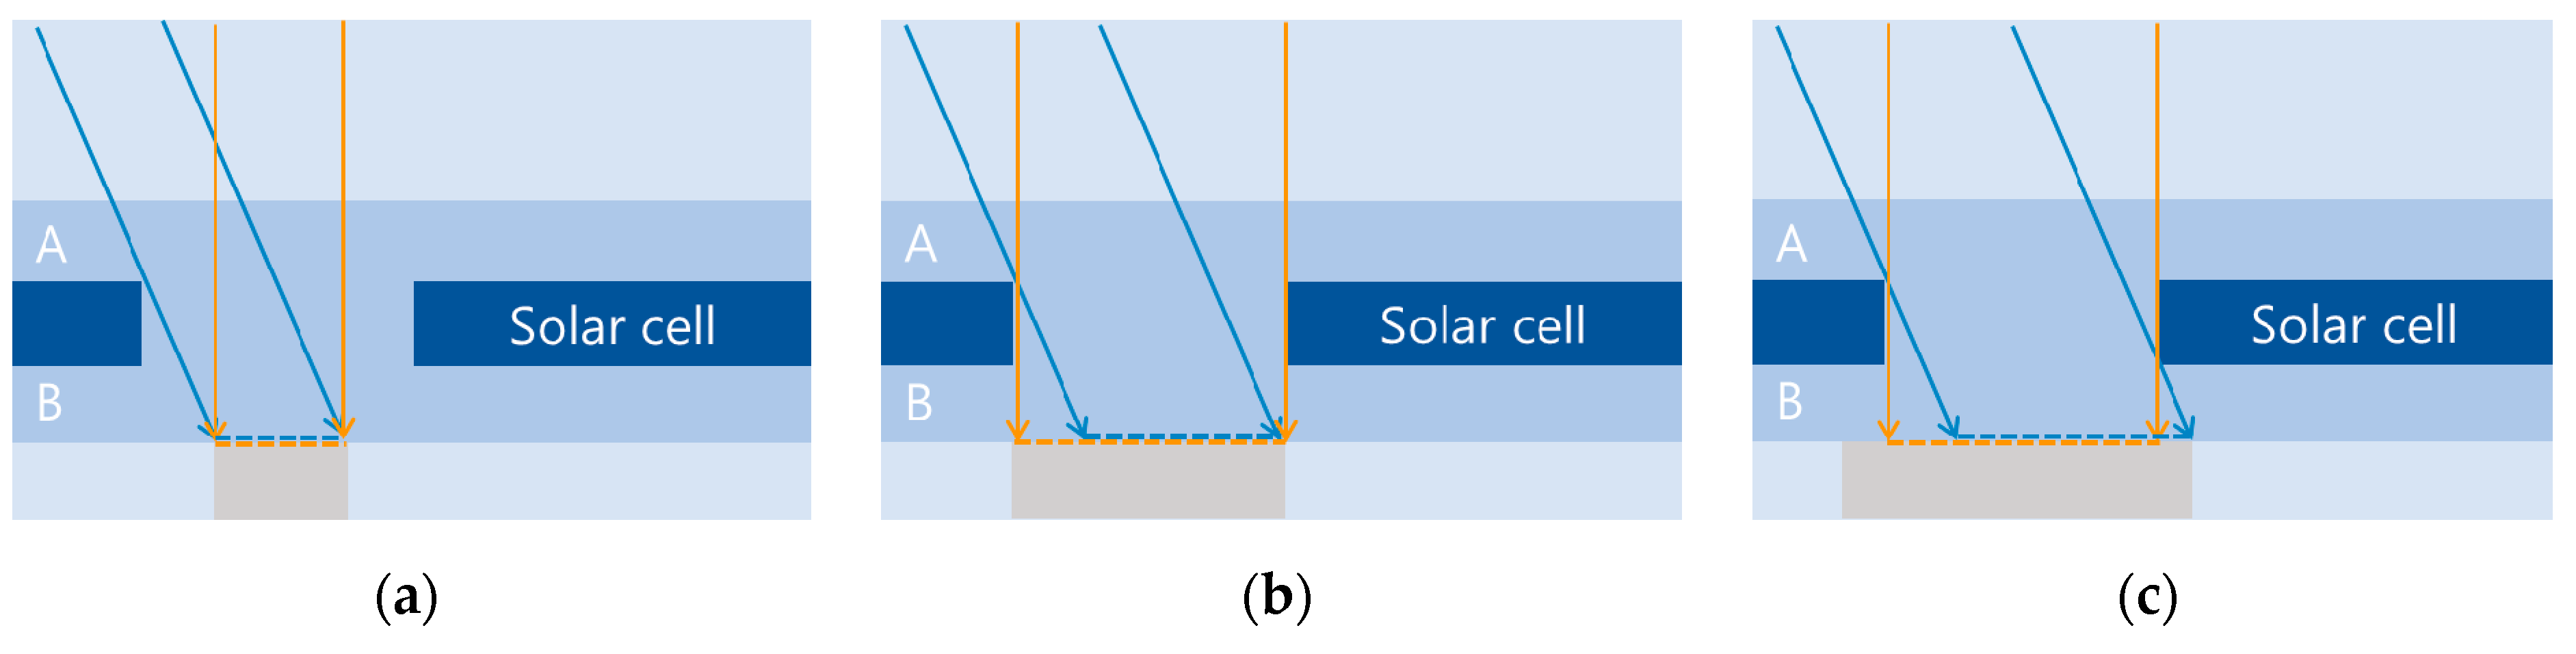
Figure 12 shows the reflecting backsheet area depending on the incident angle and width of the coated area of the backsheet. In
Figure 12a, the width of the coated backsheet is smaller than the illuminated backsheet area for both angles of incidence, so the reflecting areas are identical. In
Figure 12b, the increasing angle reduces the reflecting area due to shading from the left cell. In the last presented case in
Figure 12c, the reflecting area remains nearly the same but is shifted due to shading towards the right cell.
We vary the coated area from 3 mm to 7 mm in 1 mm steps at a fixed cell spacing of 5 mm; the coated area is centered.
Figure 13 shows the power gain due to internal reflection. It increases with increasing width until the full width is illuminated on one side. After this, it does not increase any further, as the transparent part of the backsheet only adds a very small contribution and most of the light is transmitted.
On the other hand, the power gain due to rear irradiance is negatively affected at higher incident angles, as already for a width of 4 mm, cell shading shows an impact. The power gain is reduced when the coated area is wider than cell distance regardless of the incident angle because of shading (see
Figure 7).
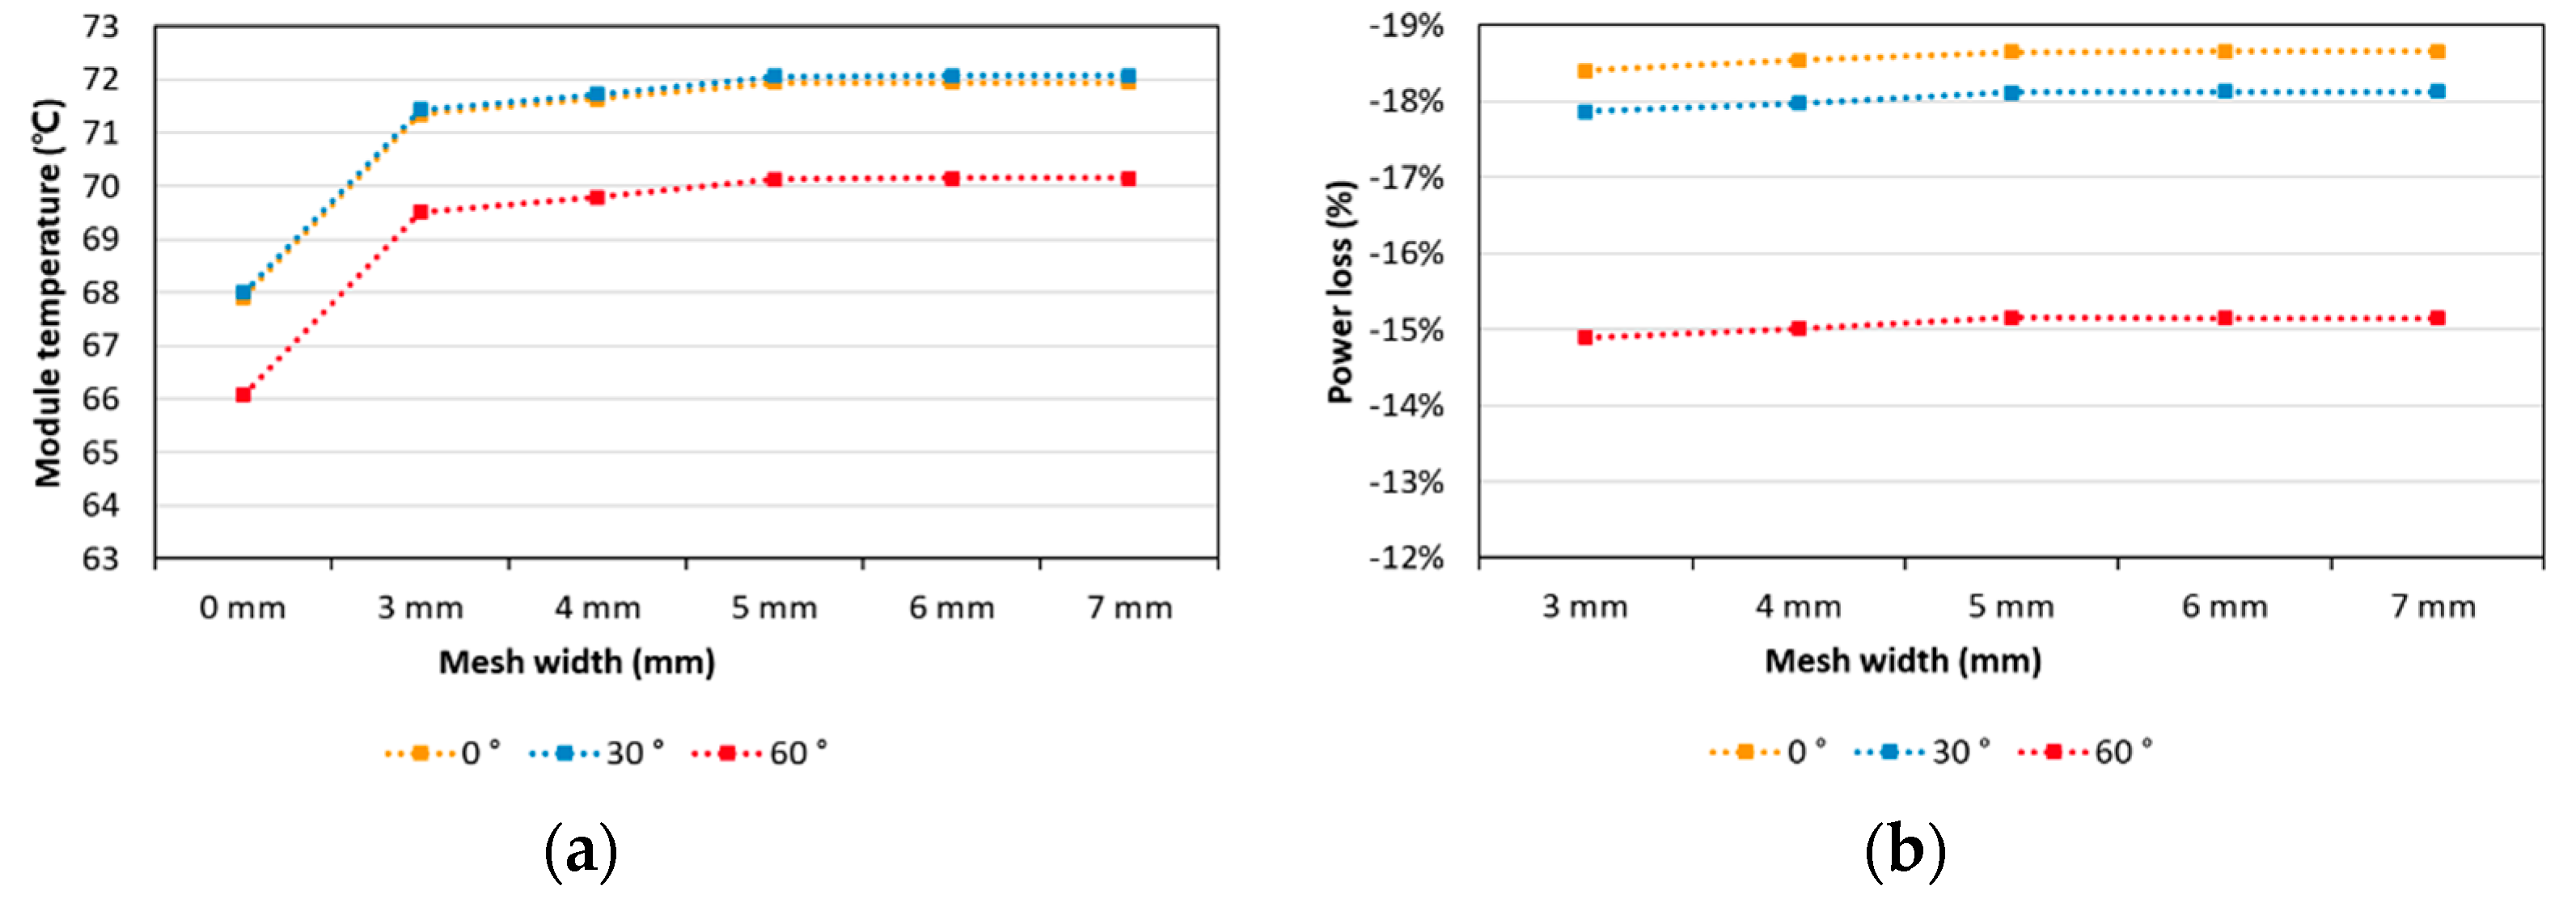
3.4. S4: Comparison of Module Temperature and Reflection Gains
So far, we have investigated module performance independent of operating temperature. In the following, we are taking the temperature into account. We calculate a steady-state operating temperature in each case, based on the model presented in Mittag et al. [
21]. The additional irradiance due to utilization of light incident on otherwise inactive module areas produces an additional power gain. On the other hand, the additionally trapped irradiance also produces more heat, causing a power loss due to a loss in cell performance [
22,
23,
24,
25].
Figure 14 shows the performance of a bifacial PV module with a mesh backsheet with consideration of the module operating temperature. As presented in
Figure 14a, the module temperature increases when increasing the width of the mesh regardless of incident angle, as long as the width is smaller than the cell spacing. Consequently, the power loss due to this change in operating temperature decreases when the width of the mesh is increased, as shown in
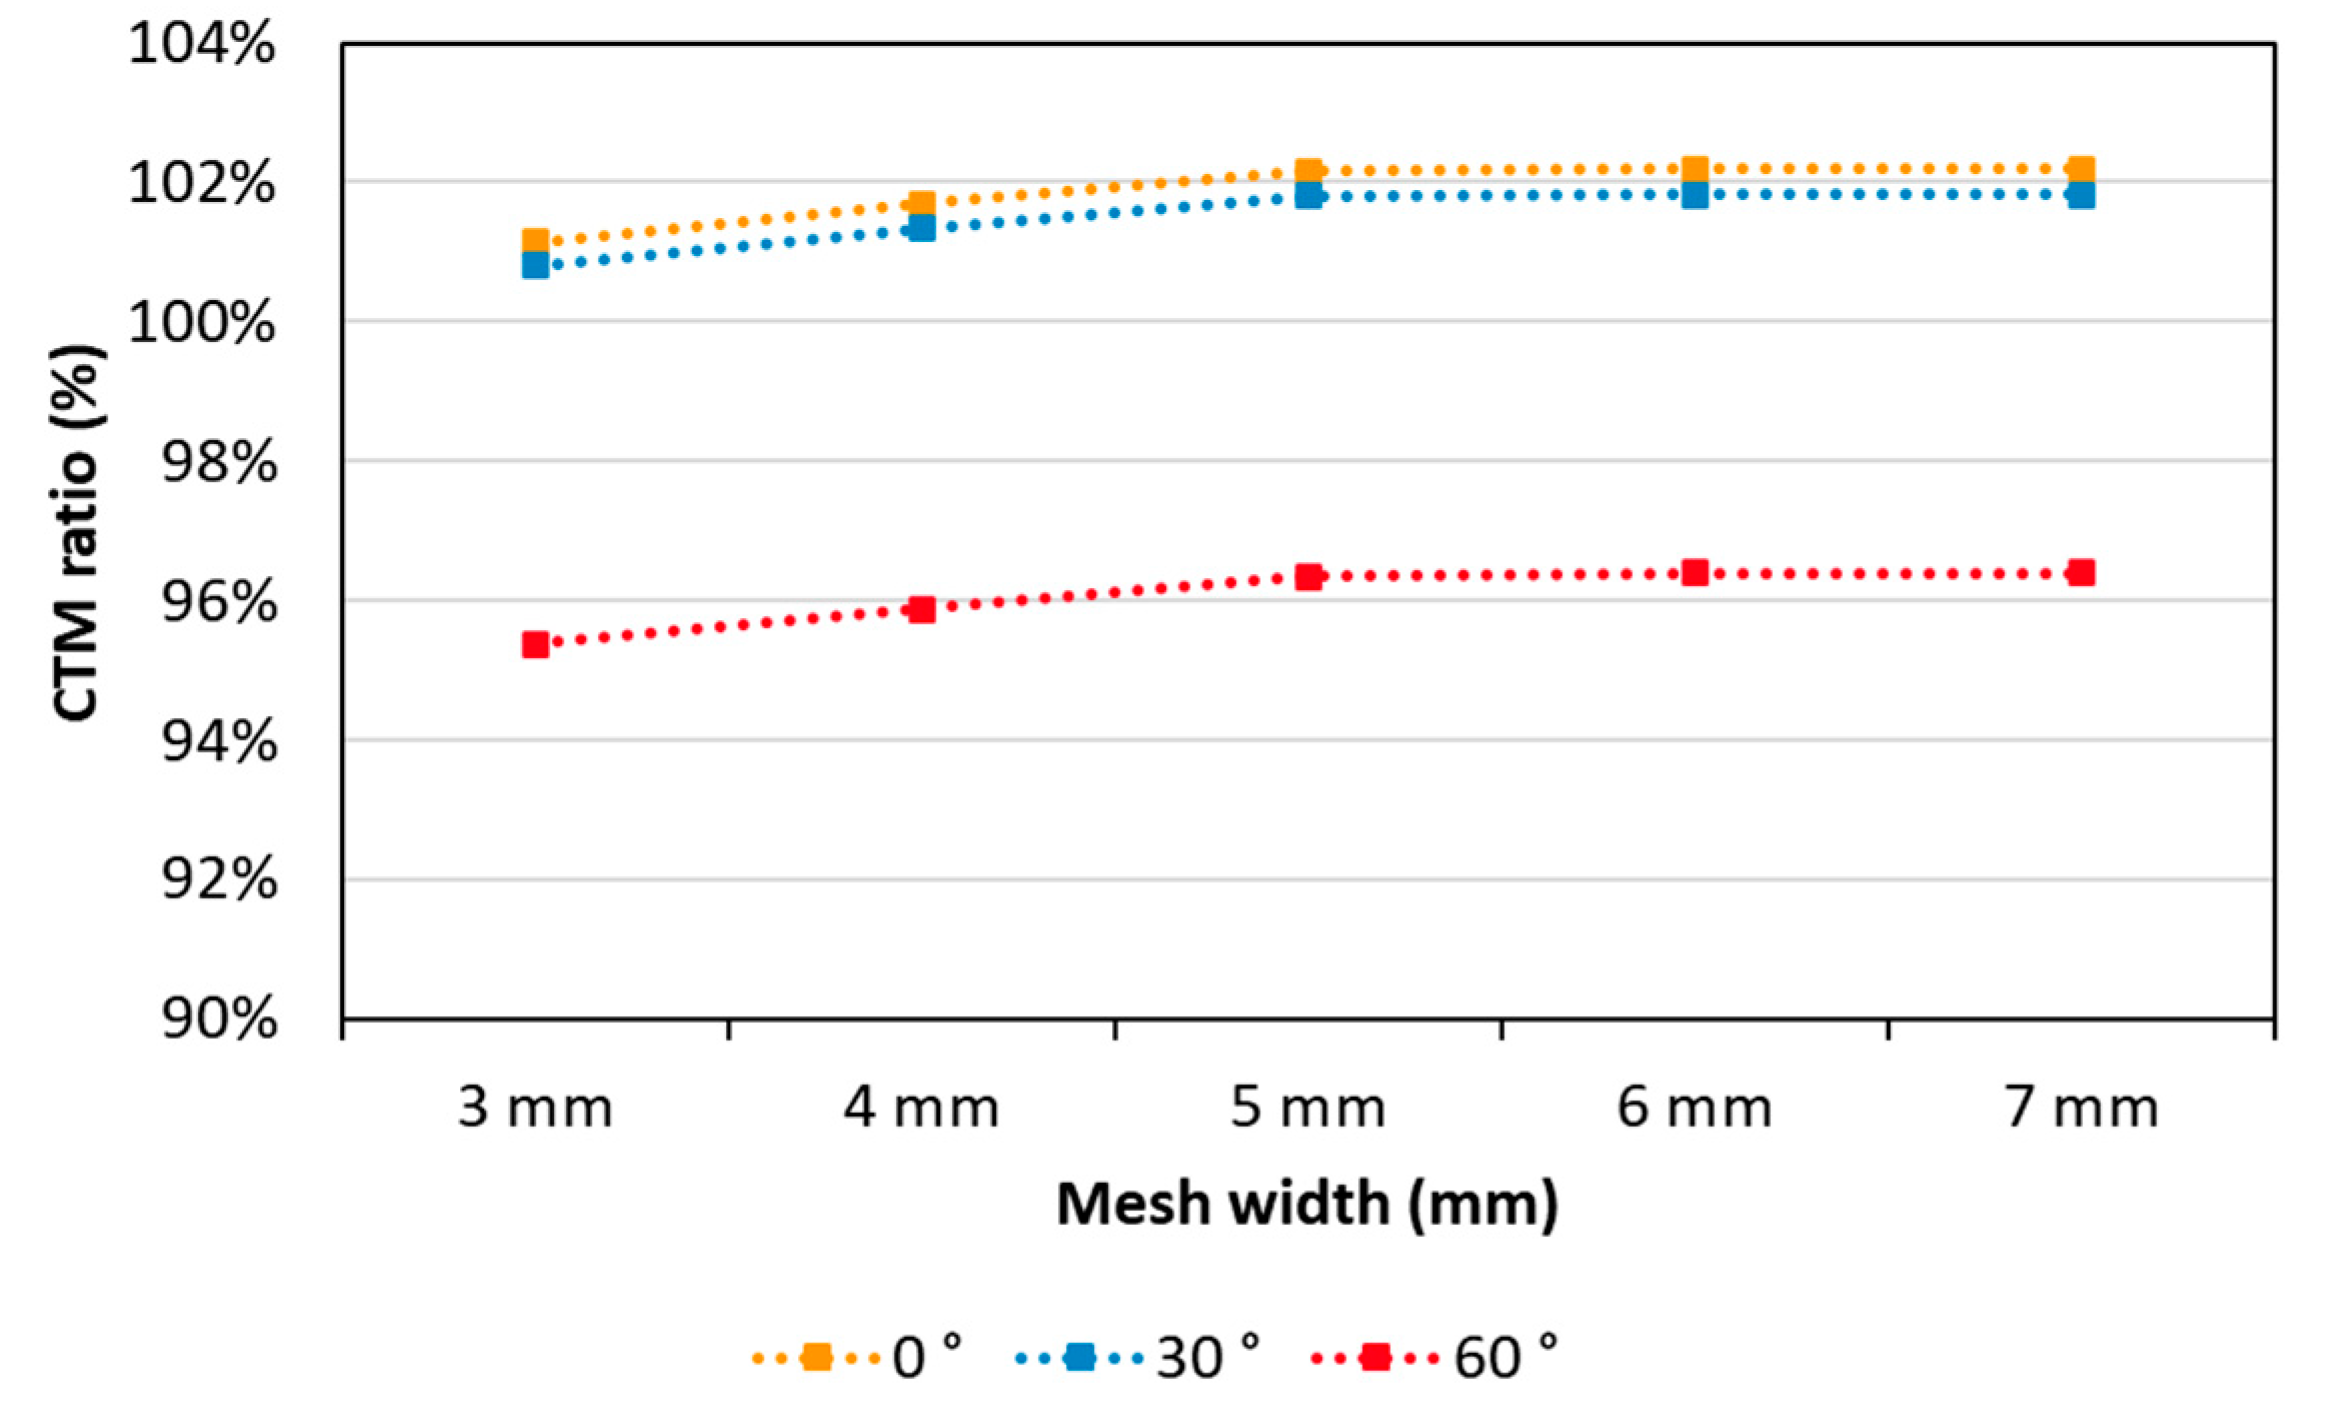
Figure 14b. Comparing the values at 3 mm and 5 mm widths at 0°, the module temperature decreases by 0.6 °C, corresponding to a power loss of 1.3%. Considering the total CTM ratio including power loss depending on operating temperature in
Figure 15, we observe a net increase of 1.04% from a CTM ratio of 101% at a 3 mm width to close to 102% at a 7 mm mesh width at normal incidence. The higher module temperature due to internal reflection produces higher power loss. Despite the additional power loss, the CTM ratio increases when the mesh width is increased.
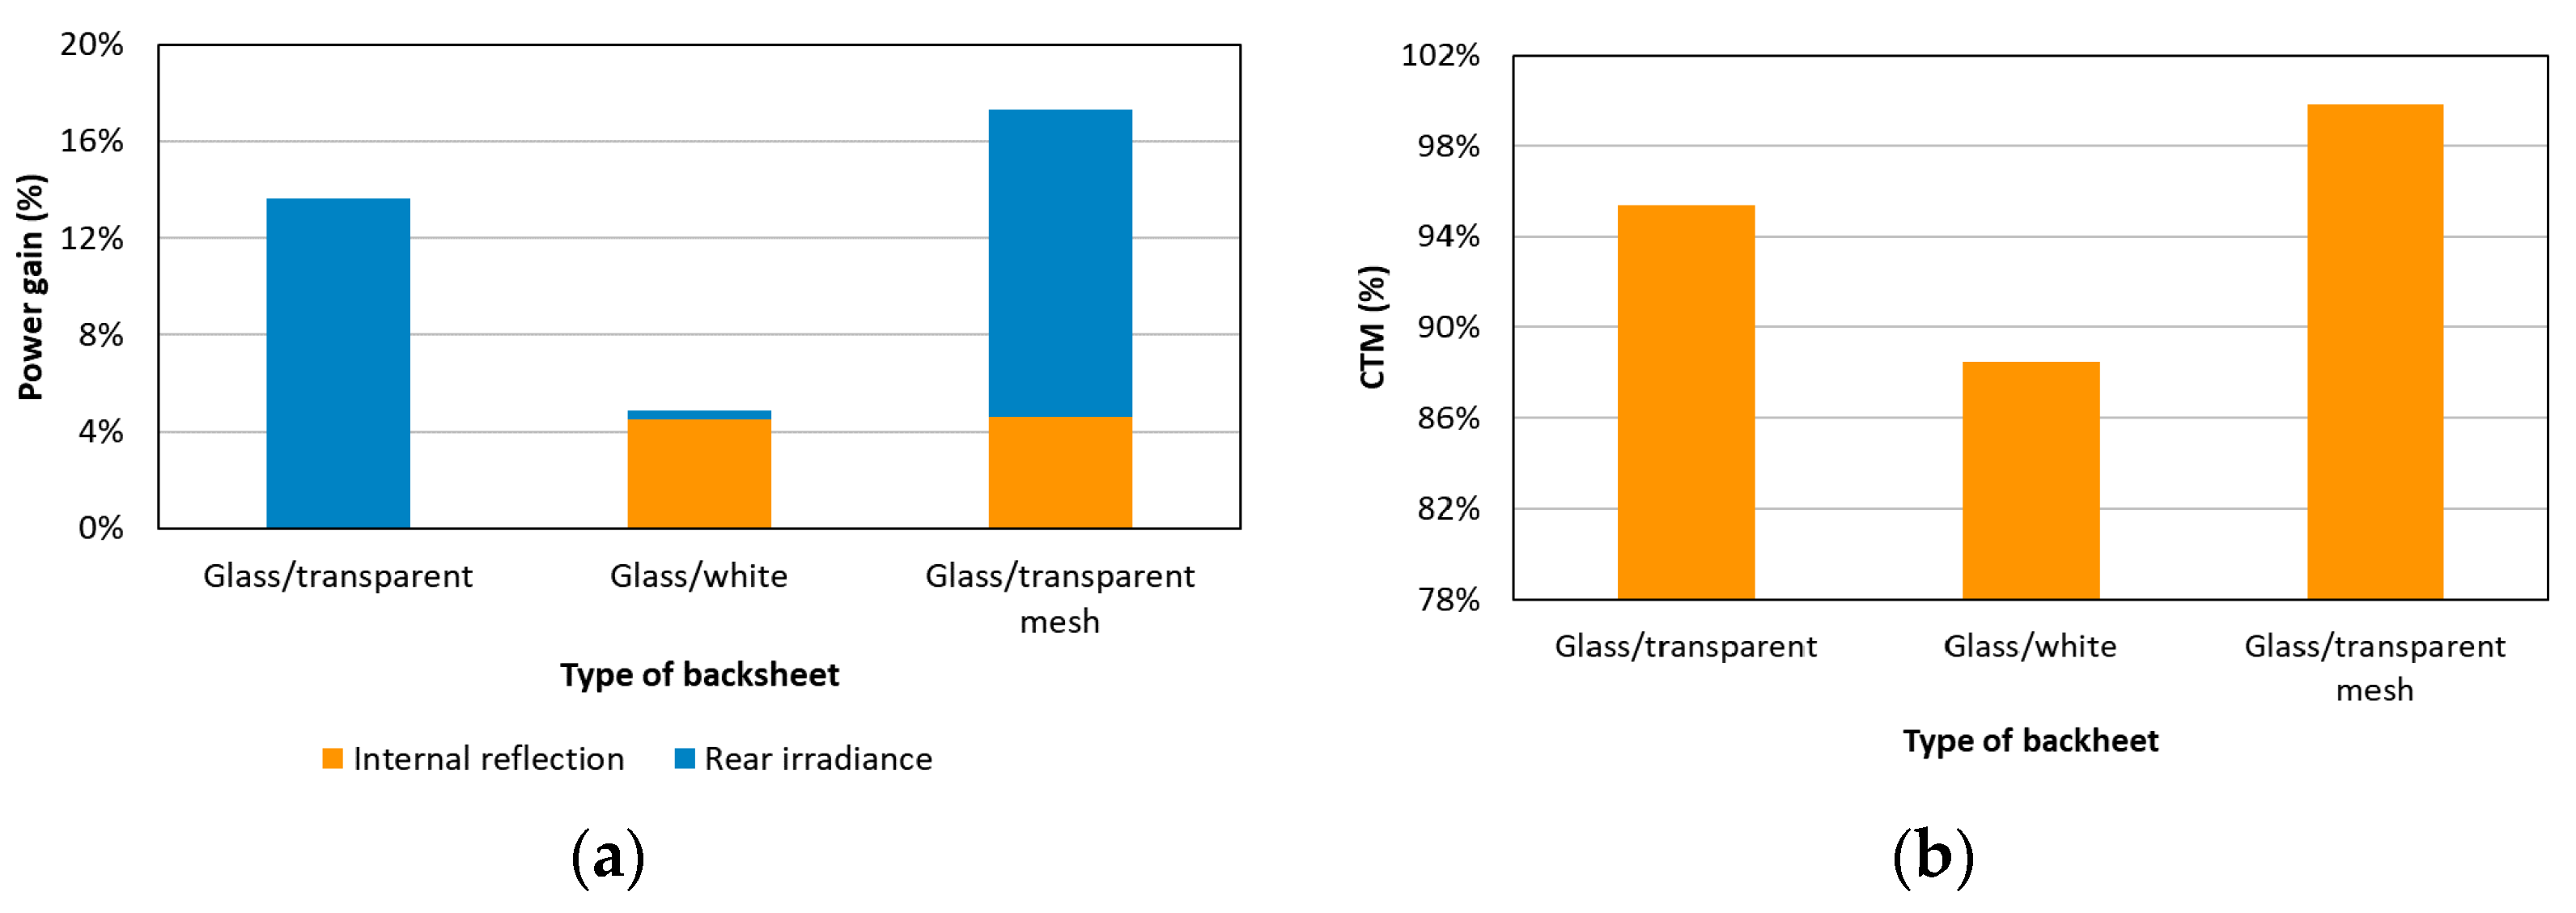
3.5. S5: Comparison of Mesh Backsheet with Uniform Backsheets
We compare the performance of bifacial PV modules under front and rear illumination with different types of backsheet:
transparent backsheet;
white backsheet;
mesh backsheet.
In this section, we use a bifacial cell with a bifaciality factor of 85% and the global hemispheric reflectance of the white backsheet and the coated area on the mesh backsheet are equal at 88%. The width of the mesh equals a cell distance of 5 mm. We investigate the module power with a normally incident front irradiance of 1000 W/m2 and rear irradiance of 200 W/m2.
Figure 16 shows the power gain and CTM ratio for the three types of backsheet. As presented in the figure, the power gain due to internal reflection is equal for the white and meshed backsheets. The power gain due to rear irradiance is equal for the transparent and the meshed backsheets. Therefore, we observe the highest CTM ratio for bifacial irradiance with the meshed backsheet as both effects can be utilized.
4. Conclusions
In this study, we present the models that allow for the power prediction of modules with selectively coated, “meshed” backsheets. We extended a previously developed simplified ray tracing approach using ray groups and evaluated the impact of different parameters of the design. We integrate this optical modeling into a complete cell-to-module (CTM) analysis toolbox.
We analyze the impact of the reflectance of the backsheet, the bifaciality of the solar cell, the module temperature and varying widths of the coated area for a bifacial PV module with a transparent mesh backsheet and compare the results with a homogeneous white and transparent backsheet.
First, we find that the internal reflection gains increase linearly with the isotropic reflectivity of the white backsheet area. For a cell distance of 5 mm, a power gain of approximately 2.5% was determined as the theoretical maximum for a diffuse reflector.
Second, we find that the bifaciality factor of the solar cell impacts the internal reflection gains, as a large part of the reflected light is redirected to the cell rear side. A decrease to 85% or 65% bifaciality yields a relative decrease in reflectance gains of −5.3% and −13.3%, respectively. The power gain from the module rear side increases linearly with bifaciality.
Third, we analyze the power gain depending on coated area width. When the mesh width increased from 3 mm to 7 mm, the power gain due to backsheet reflection is increased by 2%. On the other hand, the power gain due to rear irradiance is decreased by −2.5%.
Next, we analyze the effect of power gain due to reflectance of the meshed backsheet and power loss due to module temperature. We find that the additional internal reflection increases the power gain and the module temperature. We find that the power gain due to the improved internal reflection outweighs the power loss due to increased module temperature.
Finally, we compare the performance of bifacial PV modules with different types of backsheet. For an additional rear irradiance of 200 W/m², the CTM ratio of the module with a transparent mesh backsheet is 4.4% higher than that of a module with a transparent backsheet and 9.8% higher than that of a module with a white backsheet. We observe the highest CTM ratio and module power for modules with the mesh backsheet.
In this study, we theoretically analyzed the performance of PV modules with mesh backsheets. As a next step, measurements of modules with different mesh geometries under different angles of incidence are planned to validate our theoretical finding experimentally.
Author Contributions
Conceptualization, J.J., A.P. and M.M.; methodology, J.J. and A.P.; software, A.P. and J.J.; formal analysis, J.J.; resources, M.M.; writing—original draft preparation, J.J.; writing—review and editing, A.P., M.M. and K.L.; visualization, J.J.; supervision, A.P., M.M. and K.L.; project administration, M.M. and K.L.; funding acquisition, M.M. and K.L. All authors have read and agreed to the published version of the manuscript.
Funding
This work was supported by “Human Resources Program in Energy Technology” and “Energy R&D Program” of the Korea Institute of Energy Technology Evaluation and Planning (KETEP), granted financial resources from the Ministry of Trade, Industry & Energy, Republic of Korea (No. 20194010000180) and (No. 20173030068990).
Conflicts of Interest
The authors declare no conflict of interest.
Abbreviations
| BRDF | Bi-directional reflection distribution function of the backsheet | |
| BS | Backsheet | - |
| CTM ratio | Cell-to-module ratio | % |
| M | Loss matrix | |
| Egroup | Total irradiance of each ray group | W/m2 |
| fbs,group | Fraction of each ray group | |
| hb | Thickness of backsheet | m |
| heA | Thickness of top encapsulant | m |
| heB | Thickness of bottom encapsulant | m |
| hg | Thickness of glass | m |
| Pcb | Total power of ray group which hits cell back directly | W |
| Pcell | Total power of single cell | W |
| Pcell, STC | Total power of single cell without loss | W |
| Pcs | Total power of ray group which hits cell side directly | W |
| Pg.cf | Total power of ray group which hits cell front via front glass | W |
| Pg.cs | Total power of ray group which hits cell side via front glass | W |
| Pgain | Power gain of single cell | W |
| Pgroup | Total power of each ray group | W |
| Ploss | Power loss of single cell by operating temperature | W |
| Pmodule | Total power of module | W |
| xbs1 | Illuminated width depending on rear irradiance and layout of modules by x | m |
| xbs1 | Shaded width depending on rear irradiance and layout of modules by x | m |
| xgbs | Length which hits the front glass depending on rear irradiance by x | m |
| xref | Excess width underneath the cell | m |
| xs1 | Illuminated width depending on front irradiance and layout of modules by x | m |
| xs1 | Shaded width depending on front irradiance and layout of modules by x | m |
| ybs1 | Illuminated width depending on rear irradiance and layout of modules by y | m |
| ybs1 | Shaded width depending on rear irradiance and layout of modules by y | m |
| ygbs | Length which hits the front glass depending on rear irradiance by y | m |
| ys1 | Illuminated width depending on front irradiance and layout of modules by y | m |
| ys1 | Shaded width depending on front irradiance and layout of modules by y | m |
| wcell | Width of solar cell | m |
| bs | Threshold angle of reflected irradiance which hits backsheet directly | ° |
| cb | Threshold angle of reflected irradiance which hits cell back directly | ° |
| cf | Threshold angle of reflected irradiance which hits cell front directly | ° |
| g,cb | Threshold angle of reflected irradiance which hits cell back via front glass reflection | ° |
| g,cf | Threshold angle of reflected irradiance which hits cell front via front glass reflection | ° |
| g,t | Threshold angle of reflected irradiance which hits transparent backsheet via front glass reflection | ° |
References
- Saw, M.H.; Khoo, Y.S.; Singh, J.P.; Wang, Y. Enhancing optical performance of bifacial PV modules. Energy Procedia 2017, 124, 484–494. [Google Scholar] [CrossRef]
- Duffie, J.A.; Beckman, W.A. Solar Engineering of Thermal Processes, 2nd ed.; Chap. Jhon Wiley and Sons: New York, NY, USA, 1991. [Google Scholar]
- Libal, J.; Kopeck, R. Bifacial Photovolaics; Institution of Engineering and Technology: London, UK, 2018; pp. 17–18. [Google Scholar]
- Mittag, M.; Grünzweig, A.; Wiese, M.; Mahmoud, N.; Schmid, A.; Heinrich, M. Analysis of backsheet and rear cover reflection gains for bifacial solar cells. In Proceedings of the 33rd EUPVSEC, Amsterdam, The Netherlands, 25–29 September 2017; pp. 18–22. [Google Scholar]
- Singh, J.P.; Guo, S.; Peters, I.M.; Aberle, A.G.; Walsh, T.M. Comparison of glass/glass and glass/backsheet PV modules using bifacial silicon solar cells. IEEE J. Photovolt. 2015, 5, 783–791. [Google Scholar] [CrossRef]
- Pfreundt, A.; Mittag, M.; Heinrich, M.; Eitner, U. Rapid Calculation of the Backsheet Coupling Gain Using Ray Groups. In Proceedings of the 35th EUPVSEC, Brussels, Belgium, 24–28 September 2018; pp. 96–102. [Google Scholar]
- Gu, W.; Ma, T.; Ahmed, S.; Zhang, Y.; Peng, J. A comprehensive review and outlook of bifacial photovoltaic (bPV) technology. Energy Convers. Manag. 2020, 223, 113283. [Google Scholar] [CrossRef]
- Urrejola, E.; Valencia, F.; Fuentealba, E.; Deline, C.; Pelaez, S.A.; Meydbray, J.; Clifford, T.; Kopecek, R.; Stein, J.S. bifiPV2020 Bifacial Workshop: A Technology Overview; NREL/TP-5K00-77817.Oct 2020; National Renewable Energy Laboratory: Golden, CO, USA, 2020. [Google Scholar]
- Sng, E.; Ang, C.X.; Lim, L.H.I. Investigation and Analysis of Bifacial Photovoltaics Modules with Reflective Layer. In Proceedings of the 35th EUPVSEC, Brussels, Belgium, 24–28 September 2018; pp. 1260–1264. [Google Scholar]
- Sng, E.; Sahadevan, A.; Channabasappa Devihosur, S.; Rohini, S.; Malar, K.; Roy, S.; Lim, I.L.H. Optimisation of Bifacial Photovoltaics Module with Reflective Layer in Outdoor Performance. In Proceedings of the 36th EUPVSEC, Marseille, France, 9–13 September 2019; pp. 1007–1011. [Google Scholar]
- McIntosh, K.R.; Swanson, R.M.; Cotter, J.E. A simple ray tracer to compute the optical concentration of photovoltaic modules. Prog. Photovolt. Res. Appl. 2006, 14, 167–177. [Google Scholar] [CrossRef]
- Van Aken, B.B.; Okel, L.A.; Liu, J.; Luxembourg, S.L.; Van Roosmalen, J.A. White bifacial modules–improved STC performance combined with bifacial energy yield. In Proceedings of the 32nd EUPVSEC, Munich, Germany, 20–24 June 2016; pp. 42–47. [Google Scholar]
- Haedrich, I.; Eitner, U.; Wiese, M.; Wirth, H. Unified methodology for determining CTM ratios: Systematic prediction of module power. Sol. Energy Mater. Sol. Cells 2014, 131, 14–23. [Google Scholar] [CrossRef]
- Pfreundt, A.; Shahid, J.; Mittag, M. Cell-to-module Analysis beyond Standard Test Conditions. In Proceedings of the 47th IEEE Photovoltaic Specialists Conference, Virtual Meeting, 15 June–21 August 2020. [Google Scholar]
- Makrides, G.; Theristis, M.; Bratcher, J.; Pratt, J.; Georghiou, G.E. Five-year performance and reliability analysis of monocrystalline photovoltaic modules with different backsheet materials. Sol. Energy 2018, 171, 491–499. [Google Scholar] [CrossRef]
- Shamim, A.; Noman, M.; Khan, A.D. Effect of novel encapsulants and backsheets on short circuit current in interdigitated Back contact solar cells based PV modules. Optik 2020, 219, 165036. [Google Scholar] [CrossRef]
- Kim, N.; Lee, S.; Zhao, X.G.; Kim, D.; Oh, C.; Kang, H. Reflection and durability study of different types of backsheets and their impact on c-Si PV module performance. Sol. Energy Mater. Sol. Cells 2016, 146, 91–98. [Google Scholar] [CrossRef]
- Ponce-Alcántara, S.; Arangú, A.V.; Plaza, G.S. The importance of optical characterization of PV backsheets in improving solar module power. In Proceedings of the 8th International Photovoltaic Power Generation Conference Exhibition, Shanghai, China, 20–22 May 2014. [Google Scholar]
- Reise, C.; Baarah, G.; Schnabel, E.; Kräling, U.; Müller, B.; Chang, S.; Choe, Y.; Cho, H. From Bifaciality to Yield: Different Bifacial Cell Technologies May Differ Even More in Annual Outdoor Performance. In Proceedings of the 35th EUPVSE, Brussels, Belgium, 24–28 September 2018; pp. 1252–1255. [Google Scholar]
- Kopecek, R.; Veschetti, Y.; Gerritsen, E.; Schneider, A.; Comparotto, C.; Mihailetchi, V.D.; Lossen, J.; Libal, J. Bifaciality: One small step for technology, one giant leap for kWh cost reduction. Photovolt. Int. 2015, 26, 32–45. [Google Scholar]
- Mittag, M.; Vogt, L.; Herzog, C.; Neuhaus, H. Thermal modelling of photovoltaic modules in operation and production. In Proceedings of the 36th EUPVSEC, Marseille, France, 9–13 September 2019; pp. 892–900. [Google Scholar]
- Dupré, O.; Vaillon, R.; Green, M.A. Physics of the temperature coefficients of solar cells. Sol. Energy Mater. Sol. Cells 2015, 140, 92–100. [Google Scholar] [CrossRef]
- Nordmann, T.; Clavadetscher, L. Understanding temperature effects on PV system performance. In Proceeding of the 3rd WCPEC, Osaka, Japan, 11–18 May 2003. [Google Scholar]
- Deutsche Gesellschaft für Sonnenenergie (DGS). Planning and Installing Photovoltaic Systems: A Guide for Installers, Architects and Engineers, 3rd ed.; Routledge: New York, NY, USA, 2013; pp. 123–127. [Google Scholar]
- King, B.H.; Hansen, C.W.; Riley, D.; Robinson, C.D.; Pratt, L. Procedure to Determine Coefficients for the Sandia Array Performance Model (SAPM); SAND2016-5284; Sandia National Laboratories: Albuquerque, NM, USA, 2016; pp. 9–11. [Google Scholar]
Figure 1.
Overview on different module designs: (a) glass–backsheet; (b) glass–glass; (c) glass–meshed backsheet.
Figure 1.
Overview on different module designs: (a) glass–backsheet; (b) glass–glass; (c) glass–meshed backsheet.
Figure 2.
Different exemplary contributions of meshed backsheet on optical gains and losses in PV modules.
Figure 2.
Different exemplary contributions of meshed backsheet on optical gains and losses in PV modules.
Figure 3.
Waterfall diagram showing individual cell-to-module losses and gains, leading to the cell-to-module (CTM) ratio of the module.
Figure 3.
Waterfall diagram showing individual cell-to-module losses and gains, leading to the cell-to-module (CTM) ratio of the module.
Figure 4.
Power gain depending on irradiance.
Figure 4.
Power gain depending on irradiance.
Figure 5.
Threshold angles defining the borders of the different ray groups.
Figure 5.
Threshold angles defining the borders of the different ray groups.
Figure 6.
Illuminated area depending on the width of the coated backsheet area: (a) width is smaller than the cell distance; (b) width is the same as the cell distance; (c) width is larger than the cell distance. The dotted red line indicates the area on the coated backsheet where light redistribution needs to be considered; it is defined by the boundaries x1 and x2.
Figure 7.
Shaded area depending on the width of the coated backsheet area: (a) smaller than cell distance; (b) identical to cell distance; (c) larger than cell distance.
Figure 7.
Shaded area depending on the width of the coated backsheet area: (a) smaller than cell distance; (b) identical to cell distance; (c) larger than cell distance.
Figure 8.
Illuminated area depending on back surface irradiance.
Figure 8.
Illuminated area depending on back surface irradiance.
Figure 9.
Power gain due to internal reflection for different reflectivities of the mesh.
Figure 9.
Power gain due to internal reflection for different reflectivities of the mesh.
Figure 10.
Power gain depending on bifaciality factor: (a) power gain due to internal reflection; (b) power gain due to rear side irradiance.
Figure 10.
Power gain depending on bifaciality factor: (a) power gain due to internal reflection; (b) power gain due to rear side irradiance.
Figure 11.
Additional illuminated length: (a) additional illuminated length based on incident angles; (b) maximum additional illuminated length.
Figure 11.
Additional illuminated length: (a) additional illuminated length based on incident angles; (b) maximum additional illuminated length.
Figure 12.
Illuminated and reflecting areas for two different incident angles (yellow: 0°, blue: 60°): the width of the coated backsheet area is (a) smaller than cell distance; (b) identical to cell distance; (c) larger than cell distance.
Figure 12.
Illuminated and reflecting areas for two different incident angles (yellow: 0°, blue: 60°): the width of the coated backsheet area is (a) smaller than cell distance; (b) identical to cell distance; (c) larger than cell distance.
Figure 13.
Power gain depending on white backsheet width: (a) power gain due to irradiance from white backsheet; (b) power gain due to irradiance from back surface.
Figure 13.
Power gain depending on white backsheet width: (a) power gain due to irradiance from white backsheet; (b) power gain due to irradiance from back surface.
Figure 14.
Performance of bifacial PV module with transparent mesh backsheet considering the module operating temperature for different angles of incidence: (a) operating temperature; (b) power loss due to operating temperature compared to standard test conditions (25 °C).
Figure 14.
Performance of bifacial PV module with transparent mesh backsheet considering the module operating temperature for different angles of incidence: (a) operating temperature; (b) power loss due to operating temperature compared to standard test conditions (25 °C).
Figure 15.
CTM ratio depending on coated area.
Figure 15.
CTM ratio depending on coated area.
Figure 16.
Performance of bifacial PV module with transparent mesh backsheet depending on type of backsheet: (a) power gain depending on internal reflection and rear irradiance at each type of backsheet; (b) CTM ratio depending on type of backsheet.
Figure 16.
Performance of bifacial PV module with transparent mesh backsheet depending on type of backsheet: (a) power gain depending on internal reflection and rear irradiance at each type of backsheet; (b) CTM ratio depending on type of backsheet.
Table 1.
Definition of ray groups by reflectance angle and surface that is hit by the rays in this group.
Table 1.
Definition of ray groups by reflectance angle and surface that is hit by the rays in this group.
| Index | Angle Range | Target Area |
|---|
| g.bs | | coated backsheet area via front glass reflection |
| g.t | | transparent backsheet area via front glass reflection |
| g.cf | | cell front via front glass reflection |
| g.cs | | cell side via front glass reflection |
| cs | | cell side directly |
| cb | | cell back directly |
Table 2.
Variants of each simulation.
Table 2.
Variants of each simulation.
| | S1 | S2 | S3 | S4 | S5 |
|---|
| Cell gap | 5 mm |
| Reflectance | 64%, 88%, 100% | 64% | 64% | 64% | 88% |
| Bifaciality | 65% | 65%, 85%, 100% | 65% | 65% | 85% |
| Width of BS | 5 mm | 5 mm | 3–7 mm
(1 mm interval) | 3–7 mm
(1 mm interval) | 5 mm |
| Publisher’s Note: MDPI stays neutral with regard to jurisdictional claims in published maps and institutional affiliations. |
© 2021 by the authors. Licensee MDPI, Basel, Switzerland. This article is an open access article distributed under the terms and conditions of the Creative Commons Attribution (CC BY) license (http://creativecommons.org/licenses/by/4.0/).


