Article

The Impact of Cracks in BIPV Modules on Power Outputs: A Case Study Based on Measured and Simulated Data

Department of Architectural Engineering, Hanbat National University, Daejeon 34158, Korea
*
Author to whom correspondence should be addressed.
Energies 2021, 14(4), 836; https://doi.org/10.3390/en14040836
Submission received: 31 December 2020 / Revised: 25 January 2021 / Accepted: 27 January 2021 / Published: 5 February 2021
(This article belongs to the Collection Advanced Materials for Energy Conversion and Storage Devices)

Abstract

:
Crack issues afflicting a building integrated photovoltaics (BIPV) system are major concerns in terms of the system’s maintenance and power degradation. Although there may be many circumstances that bring about cracks in BIPV modules during the installation process, identifying the degradation of PV module efficiency resulting from the effects of cracks tends to be a very difficult task unless actual indoor or outdoor tests or detailed electroluminescence imaging tests are conducted. Many current studies have demonstrated that cracks may or may not impact the output performance of PV modules depending on the damage levels or where the damage is located. For BIPV applications such as replacement for building materials, there is still a lack of information and case studies addressing crack issues in a quantitative manner for evaluating BIPV output performance. Therefore, the objectives of this study are to investigate the effects of cracks in BIPV modules on power outputs and to identify detailed relationships between the cracks and power output based on experimental and simulated analysis. An experimental facility located in Daejeon, South Korea, was used to gather data from cracked and non-cracked BIPV modules. By using the field-measured data and facility’ information, a simulation model was developed using SolarPro software, and a simulated-based analysis was conducted to evaluate the impact of cracks in BIPV modules on output values after proper validation of the model. The results from this study reveal that cracks in BIPV modules exhibit significant degradation in BIPV modules’ outputs of up to 43% reduction during the experimental period. From the annual comparative results, output degradations of 34.6–35.4% were estimated when the BIPV modules included cracks. As a result, the cracks in the BIPV modules could be carefully addressed as issues occurring in the BIPV installation process.

1. Introduction

Energy consumption in the building sector is expected to increase until realistic resolutions can be designed and implemented effectively [1,2]. This increase in building energy consumption has also led to concerns regarding the emission of carbon dioxide (CO2) in the coming years. In response to these issues, renewable energy systems have been gaining attention to reduce building energy consumption by generating on-site clean electricity [3], thus enabling buildings to reach potential reductions in greenhouse gas emissions [4]. With the growing adoption of renewable energy systems in buildings, low or net-zero energy buildings have been considered as a realistic solution to not only decrease building energy usage [5], but also to reduce greenhouse gas emissions in the building sector [6]. Although there are several renewable energy systems, such as photovoltaics (PV), fuel cells, and wind power systems, that can be applied in various ways to building parts, PV systems are well known as suitable renewable systems for building applications because of their benefits such as lower costs and relatively ease of installation and maintenance [7]. In general, there are two classified PV applications to buildings: (1) building-attached PVs and (2) building-integrated PVs (BIPVs) [8,9]. The use of BIPVs can provide better functionality for facilitating limited building spaces in an effective manner by replacing building envelope materials with PV modules [10]. Shukla et al. [11] provided a good overview of BIPV technologies. From their conclusion, BIPV systems have great potential for reducing building energy consumption, as well as providing an esthetical and modern appearance. Jakica et al. [12] also presented an overview of BIPV applications by focusing on design methodologies and tools to accurately and time-efficiently simulate BIPV models to evaluate the thermal and daylighting performance of buildings. Tripathy et al. [13] pointed out that the considerable factors for a successful BIPV project were proper orientation of BIPV systems, avoidance of shading effects, and fitting architectural designs, as well as avoidance of defective PV modules. Among these issues, cracks of cells in PV modules are a concern with PV system’s maintenance and power reductions in the adopt BIPV systems [14]. In addition, PV cracking may cause fire as a result of parallel DC arc faults [15]. However, it is difficult to recognize and evaluate the effects of cracks in PV modules [14,15,16], and these cracks may or may not lead to a strong degradation in PV power outputs depending on the situation [17]. For BIPV applications used as replacement for building materials, there are still a lack of information and case studies addressing crack issues in a quantitative manner for BIPV performance. Therefore, to fill this research gap, the objectives of this study are to investigate the effects of cracks in BIPV modules on power output and to identify the detailed relationships between the cracks and power output based on analysis of experiments and simulations.

2. Methodology

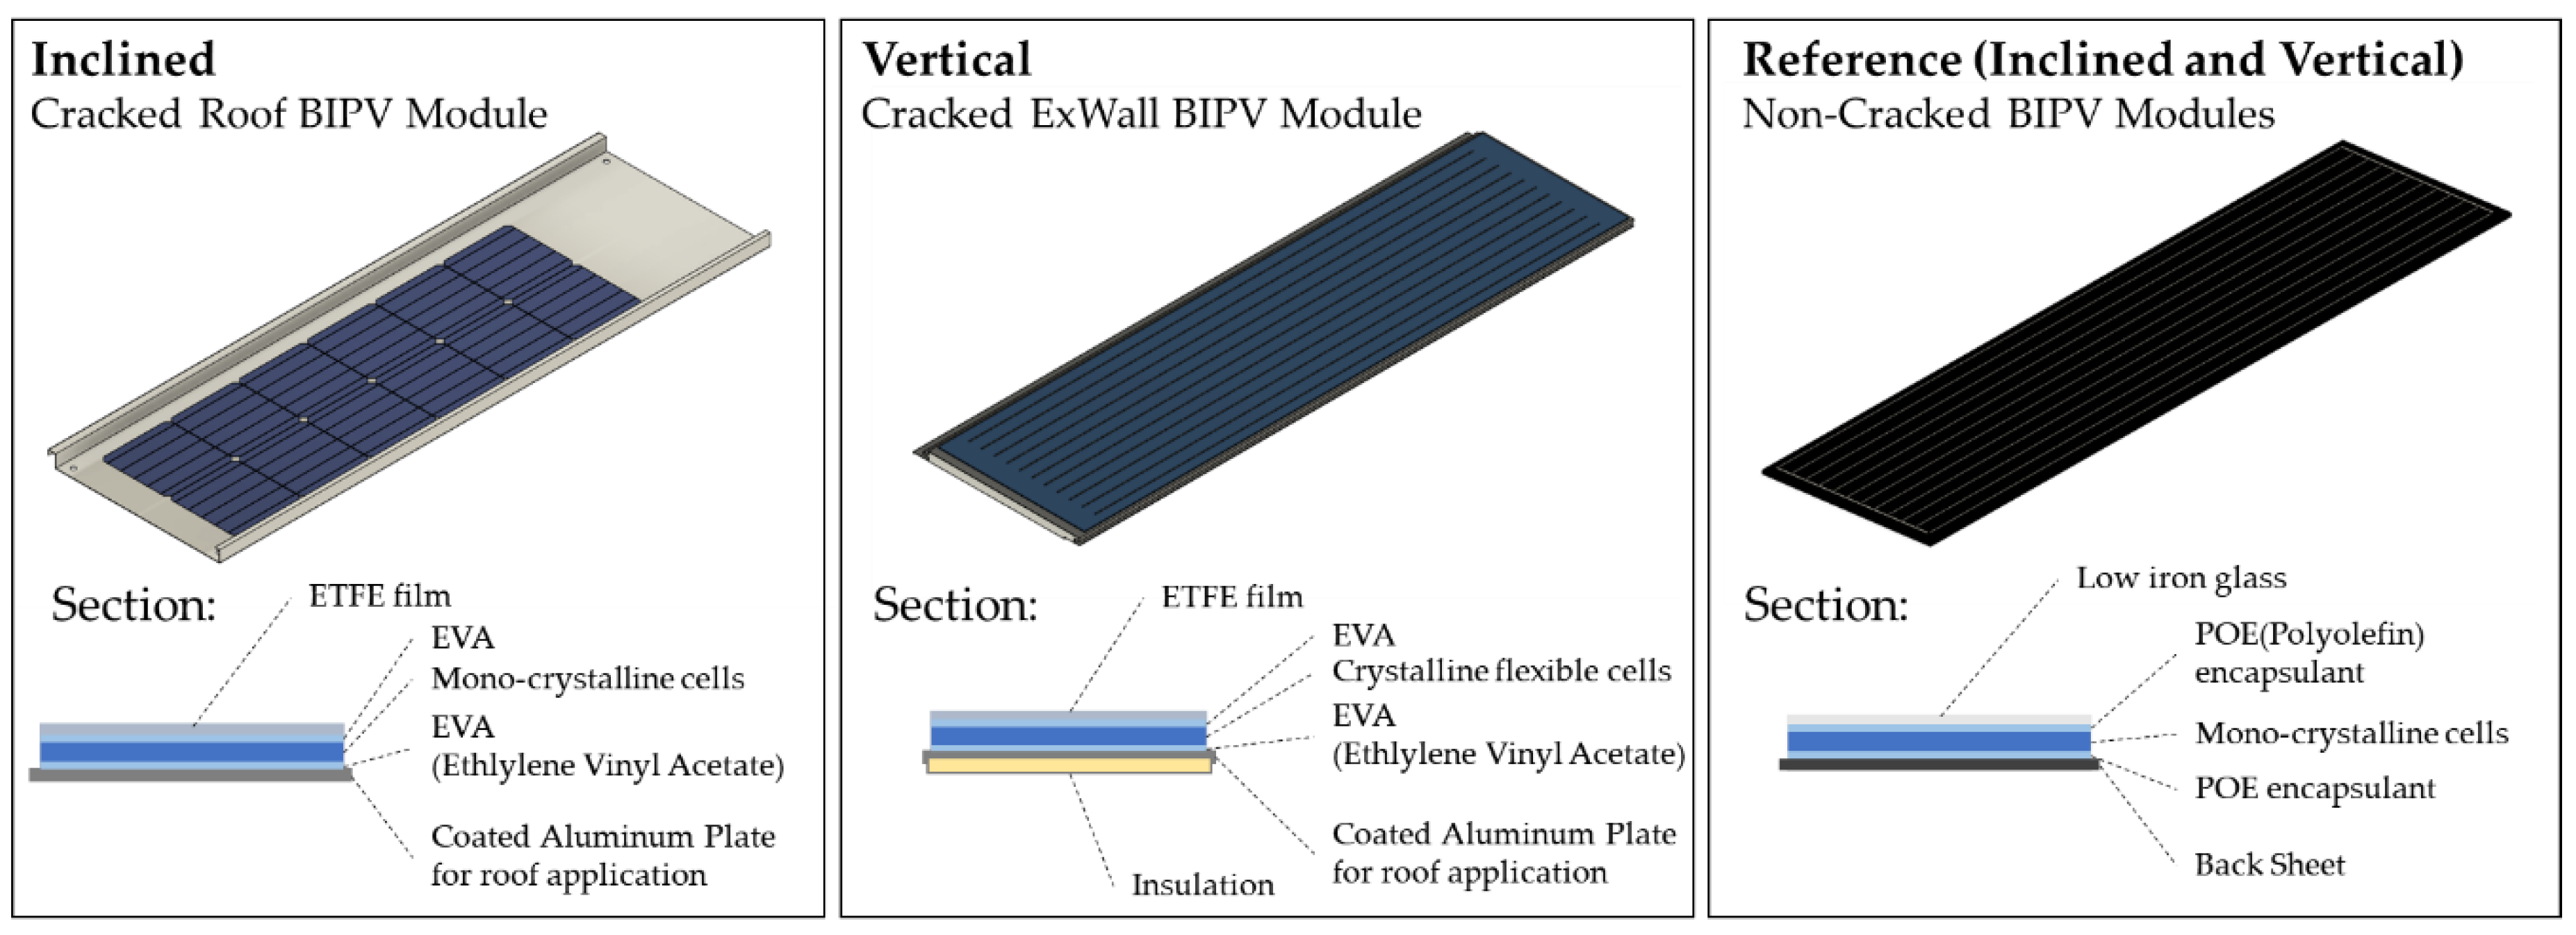
2.1. Overview of BIPV Modules

The three BIPV modules used in this study can be applied as BIPV or building-attached PV systems to declined roofs, vertical exterior walls, and common ground or rooftops. The three BIPV modules are all mono-crystalline silicon-type modules, but each BIPV module consists of different layers for each part of building envelope applications. The first type of BIPV module can be used for exterior wall applications, and its module consists of an exterior insulation panel and a mono-crystalline flexible PV module. The roof application module consists of an exterior roof finishing material and a mono-crystalline PV module. For the reference PV module, a common mono-crystalline PV module, including a glass-to-backsheet material, was used. Figure 1 depicts the three BIPV modules and their detailed sections.

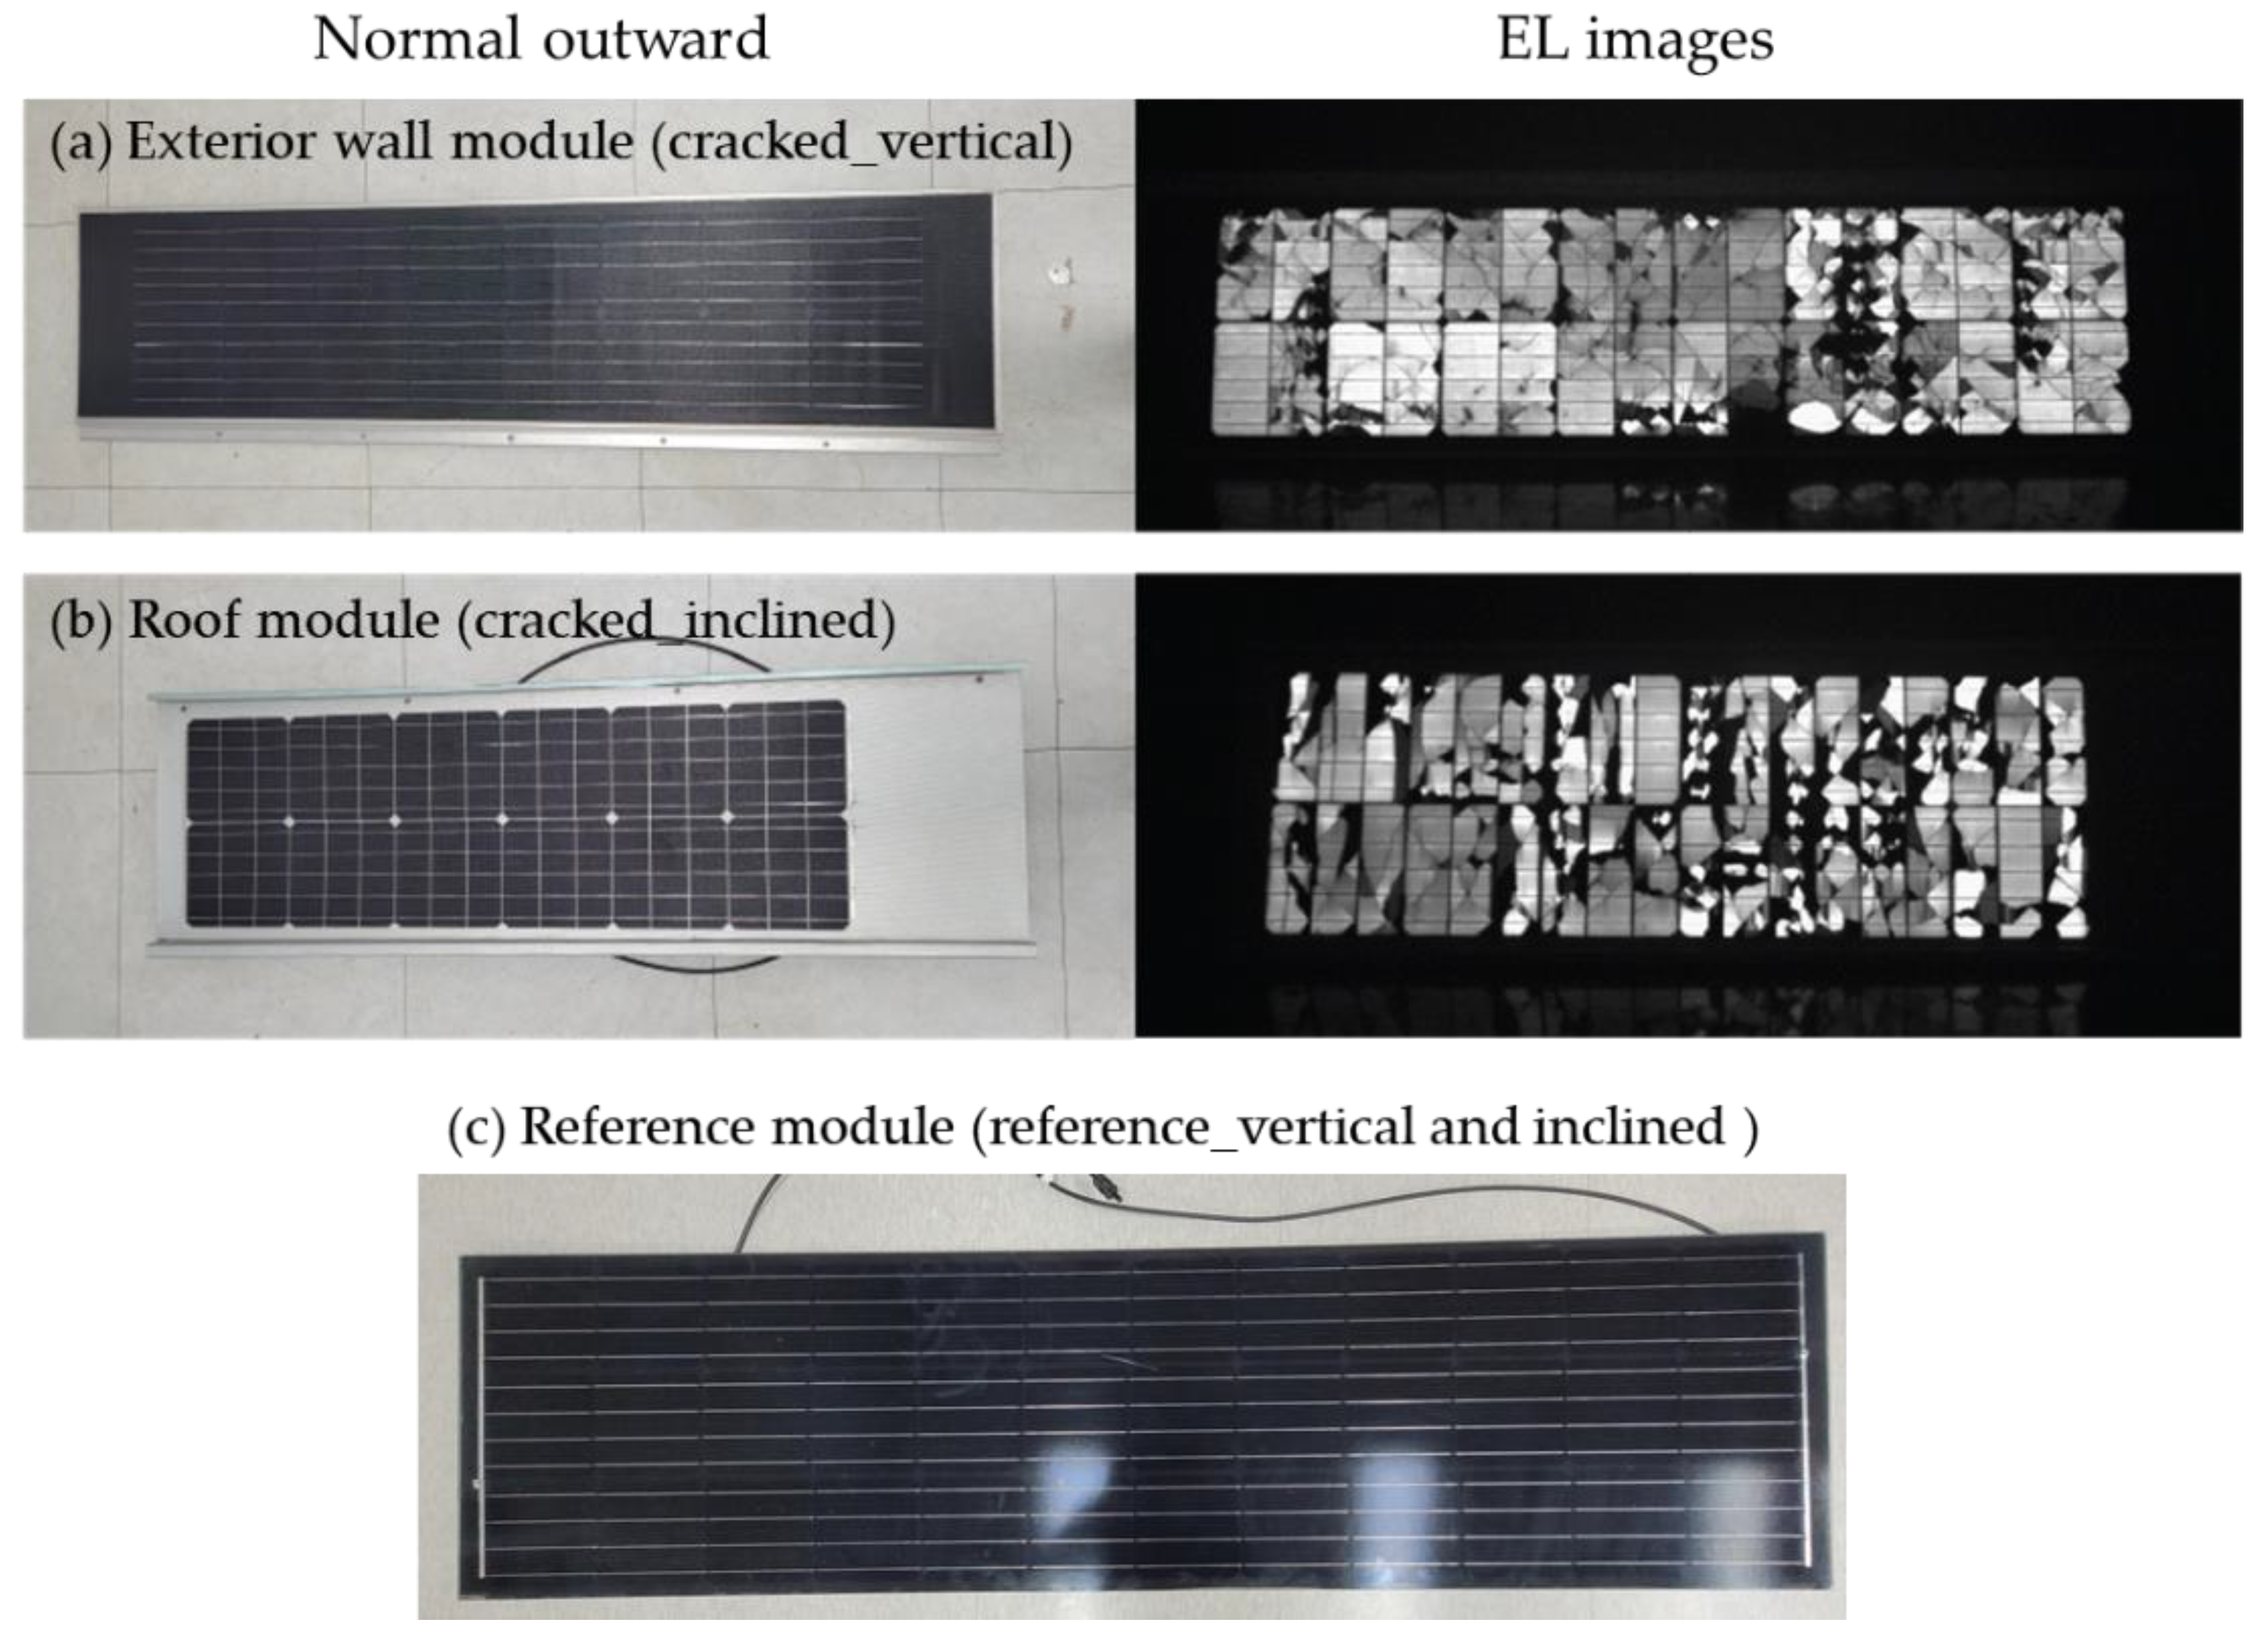
2.2. Description of Cracked and Non-Cracked BIPV Modules

Cracks are one of the primary causes of BIPV module’s degradation because they can lead to disconnections of cell parts and thus to an output power loss [18]. In general, it is difficult to recognize and detect the occurrence of cracks with the naked eye except by employing detailed electroluminescence (EL) imaging tests, especially when these modules are installed on building parts. There are various types of cracks in PV modules, including diagonal cross cracks, parallel to busbar cracks, perpendicular to busbar cracks, and multiple direction cracks [19]. These cracks may or may not lead to power reductions because the power output of a PV module can be affected differently depending on whether cracked cells are located on the same string or on different strings [20]. Buerhop et al. [21] defined a “damage factor D” to quantify the degree of cracked damage of the PV modules and thus to gain a better understanding of the degradation of pre-cracked PV modules. Based on their classification criteria, the damage factor D can be classified into six classes to determine the weighting factors W according to the severity and the average of the cell damage factors. The damage factor D of the module can be calculated as
D =   1 n i = 1 n W i
where W i is a weighting factor and n is the number of cells in a PV module. For example, if the damage factor D is ≥1.7%, many cracks are present with higher average crack areas, and if the damage factor D is ≤1.7%, the defined class includes few cracks with small crack areas. According to the classification criteria defined in Buerhop et al.’s study, the cracks of the BIPV modules used in this study exhibit a relatively high damage factor D, being 25.2% and 30.7% for vertical and inclined modules, respectively. Köntges et al. [16] conducted an experimental analysis of the direct impact of microcracks on the module power and the consequences after artificial aging. In their study, microcracks of cells in PV modules were classified into modes A, B, and C, as shown in Figure 2, as follows:
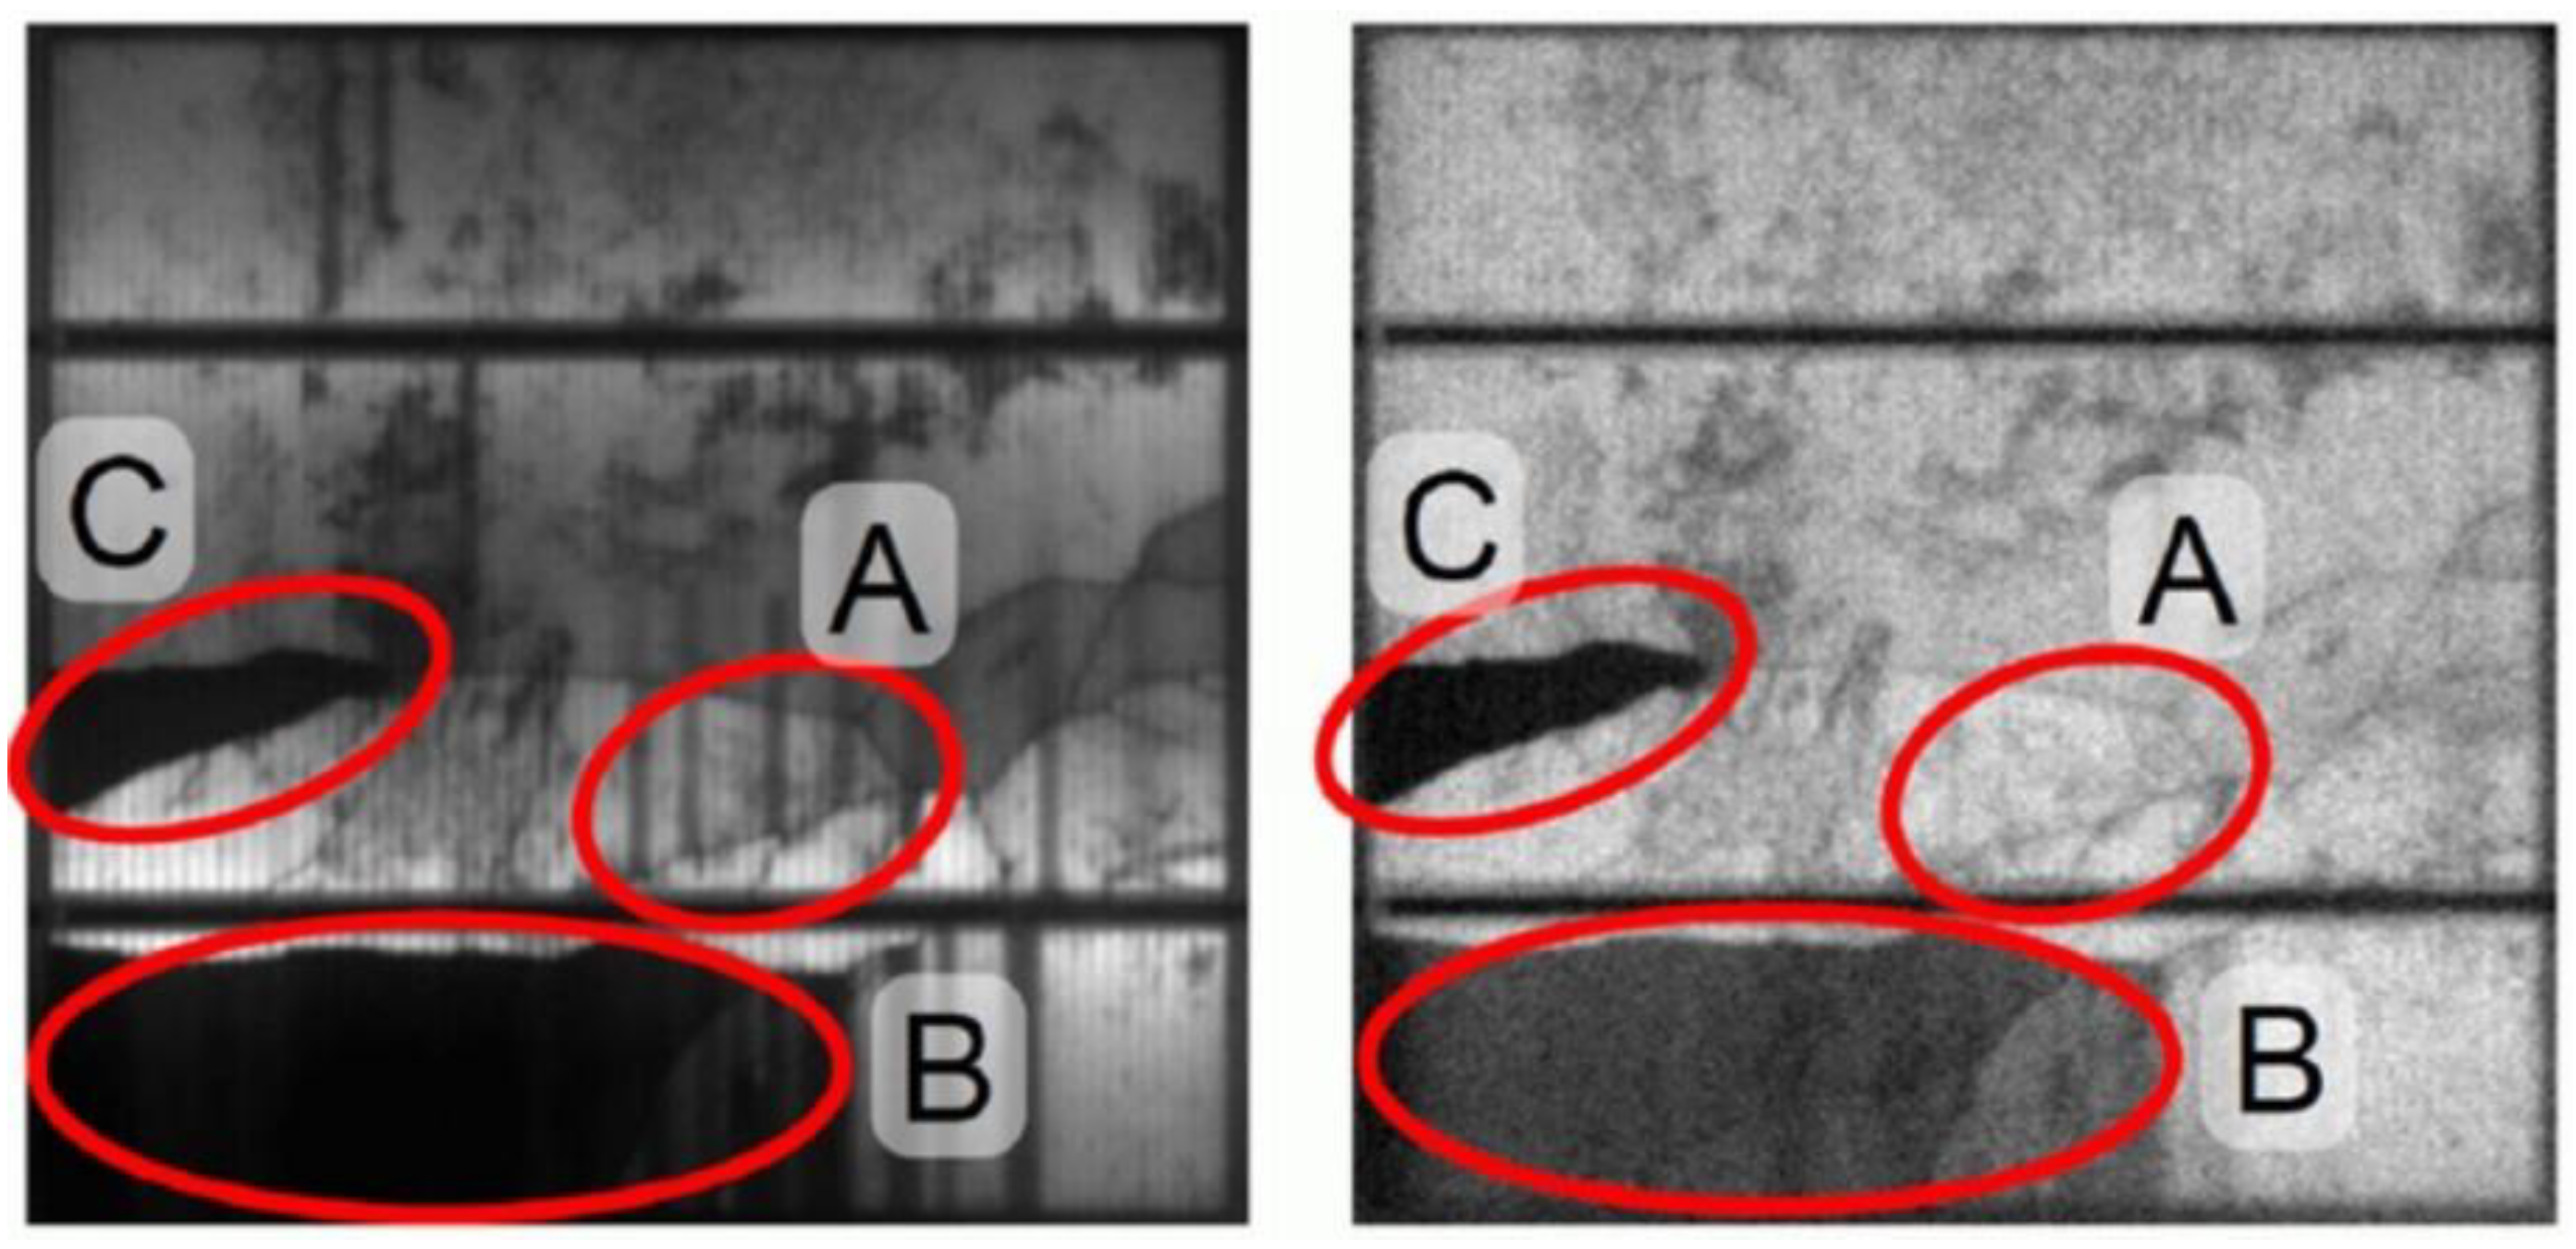
  • Mode A: If all cells of the PV module crack in mode A, the power loss is ~2.5%;
  • Mode B: If half the cells of the PV module crack in mode B, the power loss is nearly 10%;
  • Mode C: If an EL image taken at 1/10 of the short current reveals only background noise for the inactive cell part.
Based on Köntges et al.’s definition, our BIPV modules include mode B or C cracks in 31 of the vertical 32 cells and cracks in 35 of the inclined 36 cells, as shown in the EL images in Figure 3. Both power losses are ~30%, which is a severe crack status.
Figure 3 shows the occurrence of cracks in BIPV modules used in this study. As seen in this figure, it is difficult to distinguish crack issues from the module’s normal outward appearance, while the significant cell-level defects caused by cracks in the modules can be diagnosed with the EL image test. There might be many causes of cracks in BIPV modules during installation, but cracks of such BIPV modules mostly occur during transport as a result of vibration, mainly because of the different flexibilities between mono-crystalline cells and backsheet materials [22]. Note that, because it was recognized that the reference BIPV module’s performance was normally operated before and during the test period, two reference modules used for vertical and inclined plans were not considered for EL testing for this study.
Table 1 summarizes the performance characteristics of the BIPV modules used in this comparative study. In this table, all the detailed performance specifications of each model are presented. These include cracked modules for inclined and vertical positions, respectively, and the reference modules for both inclined and vertical positions, as well as the original information provided by the manufacturer for pristine modules. For the performance evaluation and validation process analysis based on measured data, only cracked and reference modules were used. It is interesting to note that, when cracks occur in PV modules, open-circuit voltage (Voc) and maximum power voltage (Vmp) values tend to increase, whereas the short-circuit current (Isc) and the current at maximum power (Imp) exhibit reduced values. Under these trends, the maximum power output value can decrease significantly when compared to that of pre-cracked module, based on the original manufacturer’s specification data. It should also be noted that the specification of the pre-cracked module is also used for the simulation-based annual analysis after the validation process is completed.

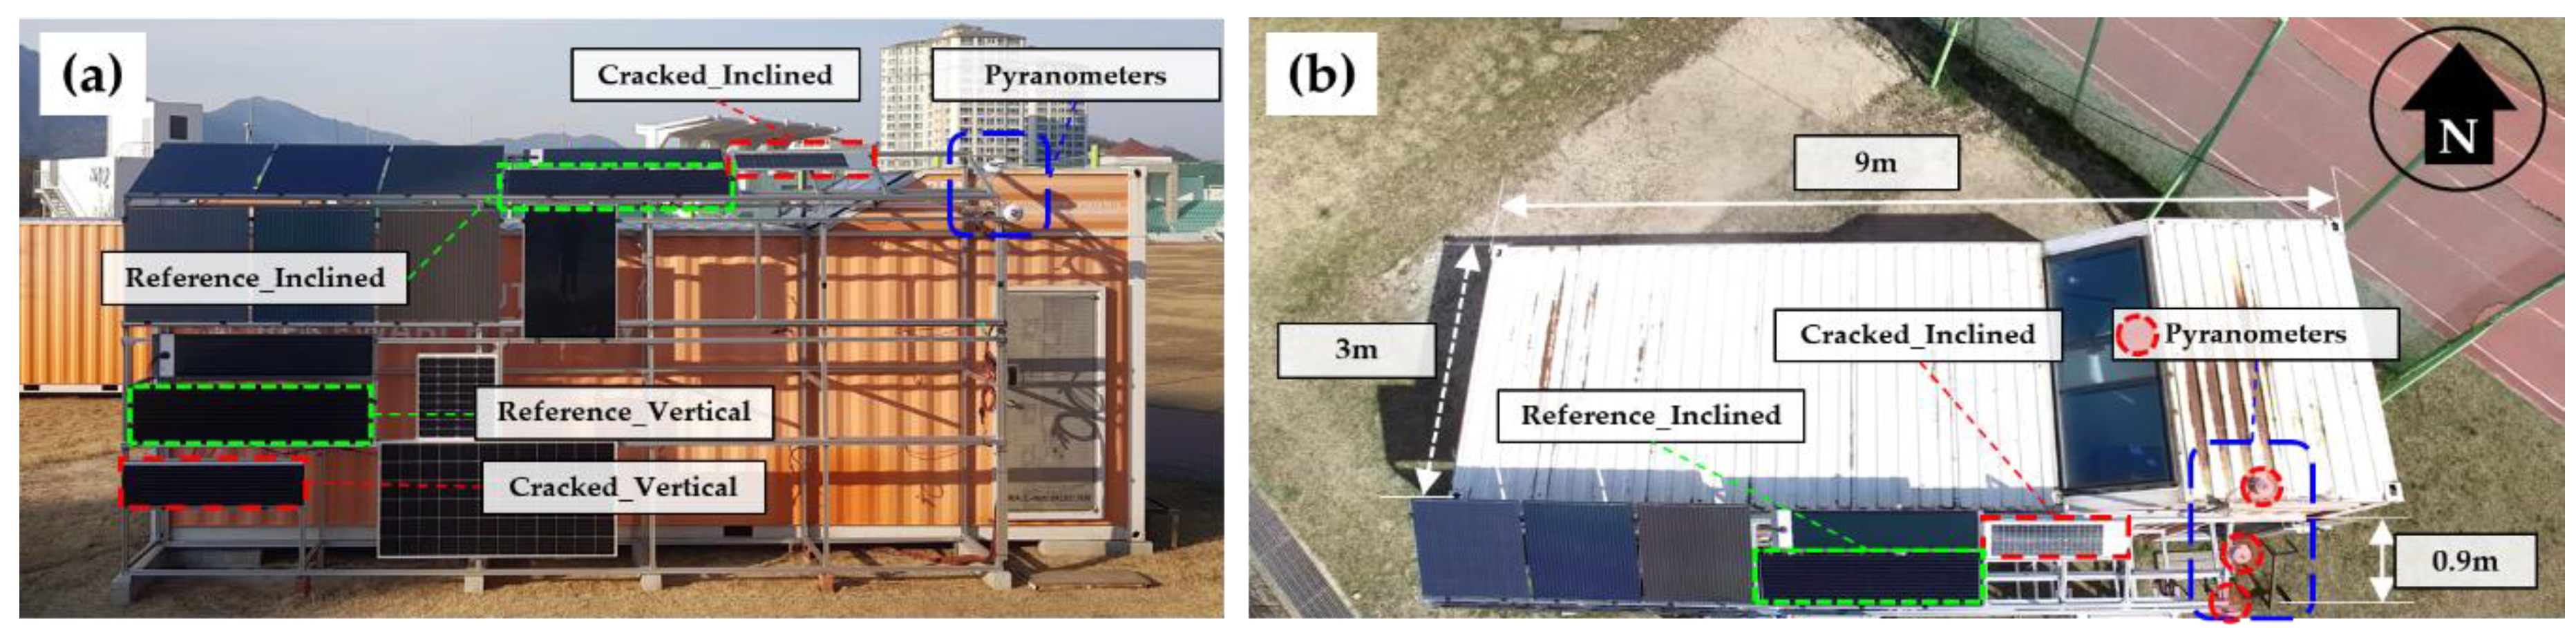
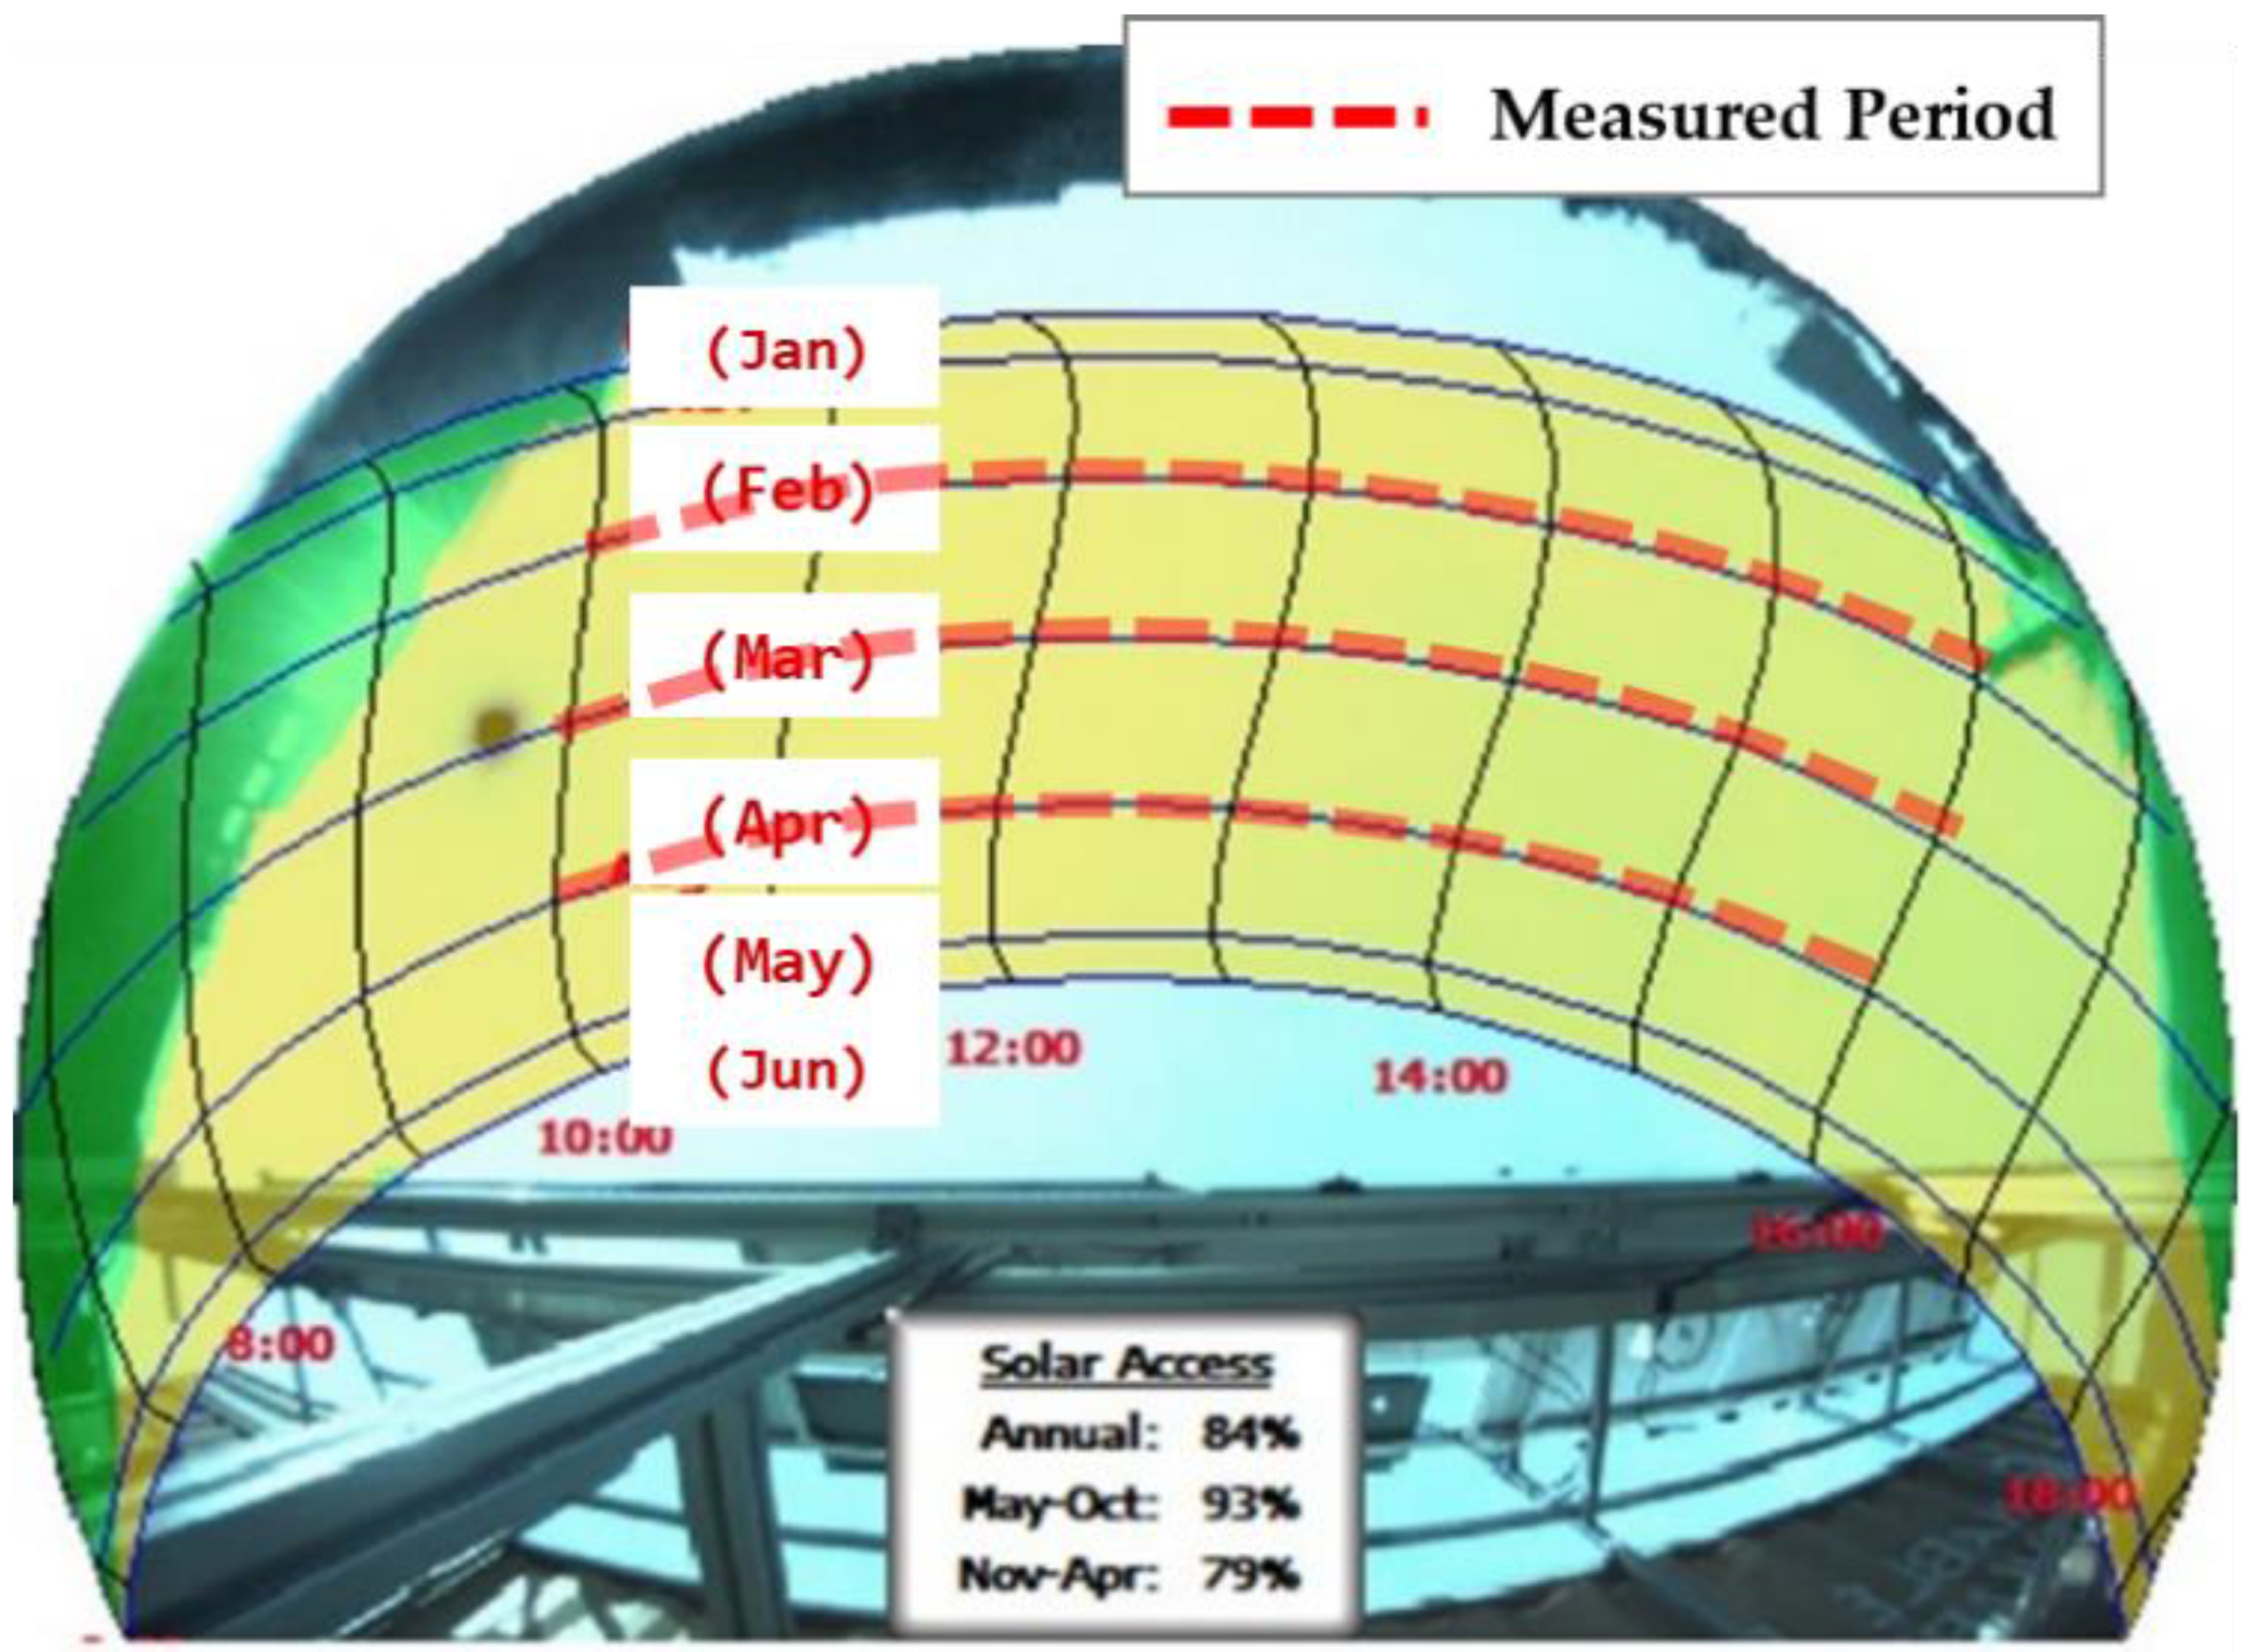
2.3. Field Test Facility Used for BIPV Modules

To test and investigate the impact of cracked PV modules on performance reductions compared to non-cracked PV modules (referred to as reference cases), an experimental facility for testing PV systems was constructed, as presented in Figure 4, at Hanbat National University in Daejeon, South Korea (latitude: 36°; longitude: 127°). This experimental facility is constructed of steel-frames, which are fixed and integrated with the full-scale BIPV mock-up (i.e., the orange colored container). The steel-framed test facility was designed and constructed to test the output performance of various PV modules (e.g., c-si and CIGS types) under outdoor conditions. Each single PV module was connected to a data-acquisition (DAC) system [23] and placed in the orange BIPV mock-up for monitoring. As shown in Figure 4, two single PV modules (i.e., reference and cracked modules) were used for this study on each south-facing frame with vertical and inclined tilts, including 90° and 30° tilt angles for the vertical and inclined cases, respectively. The global solar irradiance on each facing was measured by using three separate thermopile pyranometers, which were mounted on each south-facing plane (i.e., horizontal, vertical, and a 30° inclined angle); these irradiances measurements are used for analysis of PV performance and for validating the PV simulation.
Table 2 summaries measured parameters of the PV monitoring system. All the transient measurement data, presented in Table 2, were recorded for over three (3) months at a frequency of once per 10 min. A maximum power point tracking (MPPT) algorithm was programmed in the DAC monitoring system so that the power extraction can be maximized under all parameter conditions, including variations in voltage, current, or frequency. The ranges of the maximum voltage and current were 300 V and 20 A, respectively, and the maximum power was 600 W [23]. Note that, although this DAC system can read 10 samples per second, every 10 min was considered in this study mainly because of the limited long-term data storage. An average value per each hour was then used for experimental evaluation and validation based on simulated data. There were eight missing days in the three months (i.e., February 11, March 2, 3, 4, 14, 15, 16, and April 30) because of test facility maintenance. For the outdoor dry bulb air temperature, hourly outdoor air temperature data in Daejeon City from the Korea Meteorological Administration [24] was used. This outdoor air temperature was further used to pack a new weather file for validating the simulation.
Shading impact is also an important parameter for evaluating PV performance. Figure 5 depicts a sun-path diagram that presents obstructions in the surroundings. This sun-path diagram was captured using the Solar Test and Measurement Equipment [25], and this equipment can help easily identify specific shade-causing obstructions for the whole season. As seen in this figure, there are some shading effects in the early morning and late afternoon of each month. Therefore, certain hours (i.e., before 10 a.m. and after 5 p.m.) that include shade-causing obstructions were not considered for data collection and performance evaluation of the PV system. It should be noted that a total 574 h of data points (i.e., 7 h per day for 82 days for three months) were collected and used as the measured data for this study. Figure 6 presents the daily global plane irradiances in the horizontal, vertical, and inclined positions. As expected, global horizontal irradiances increased gradually, whereas in the vertical plane there was a decreasing tendency of plane irradiances. Based on the irradiance values of each south-facing plane, the PV performance was analyzed. A detailed description of the comparative analysis is presented in the following sections.

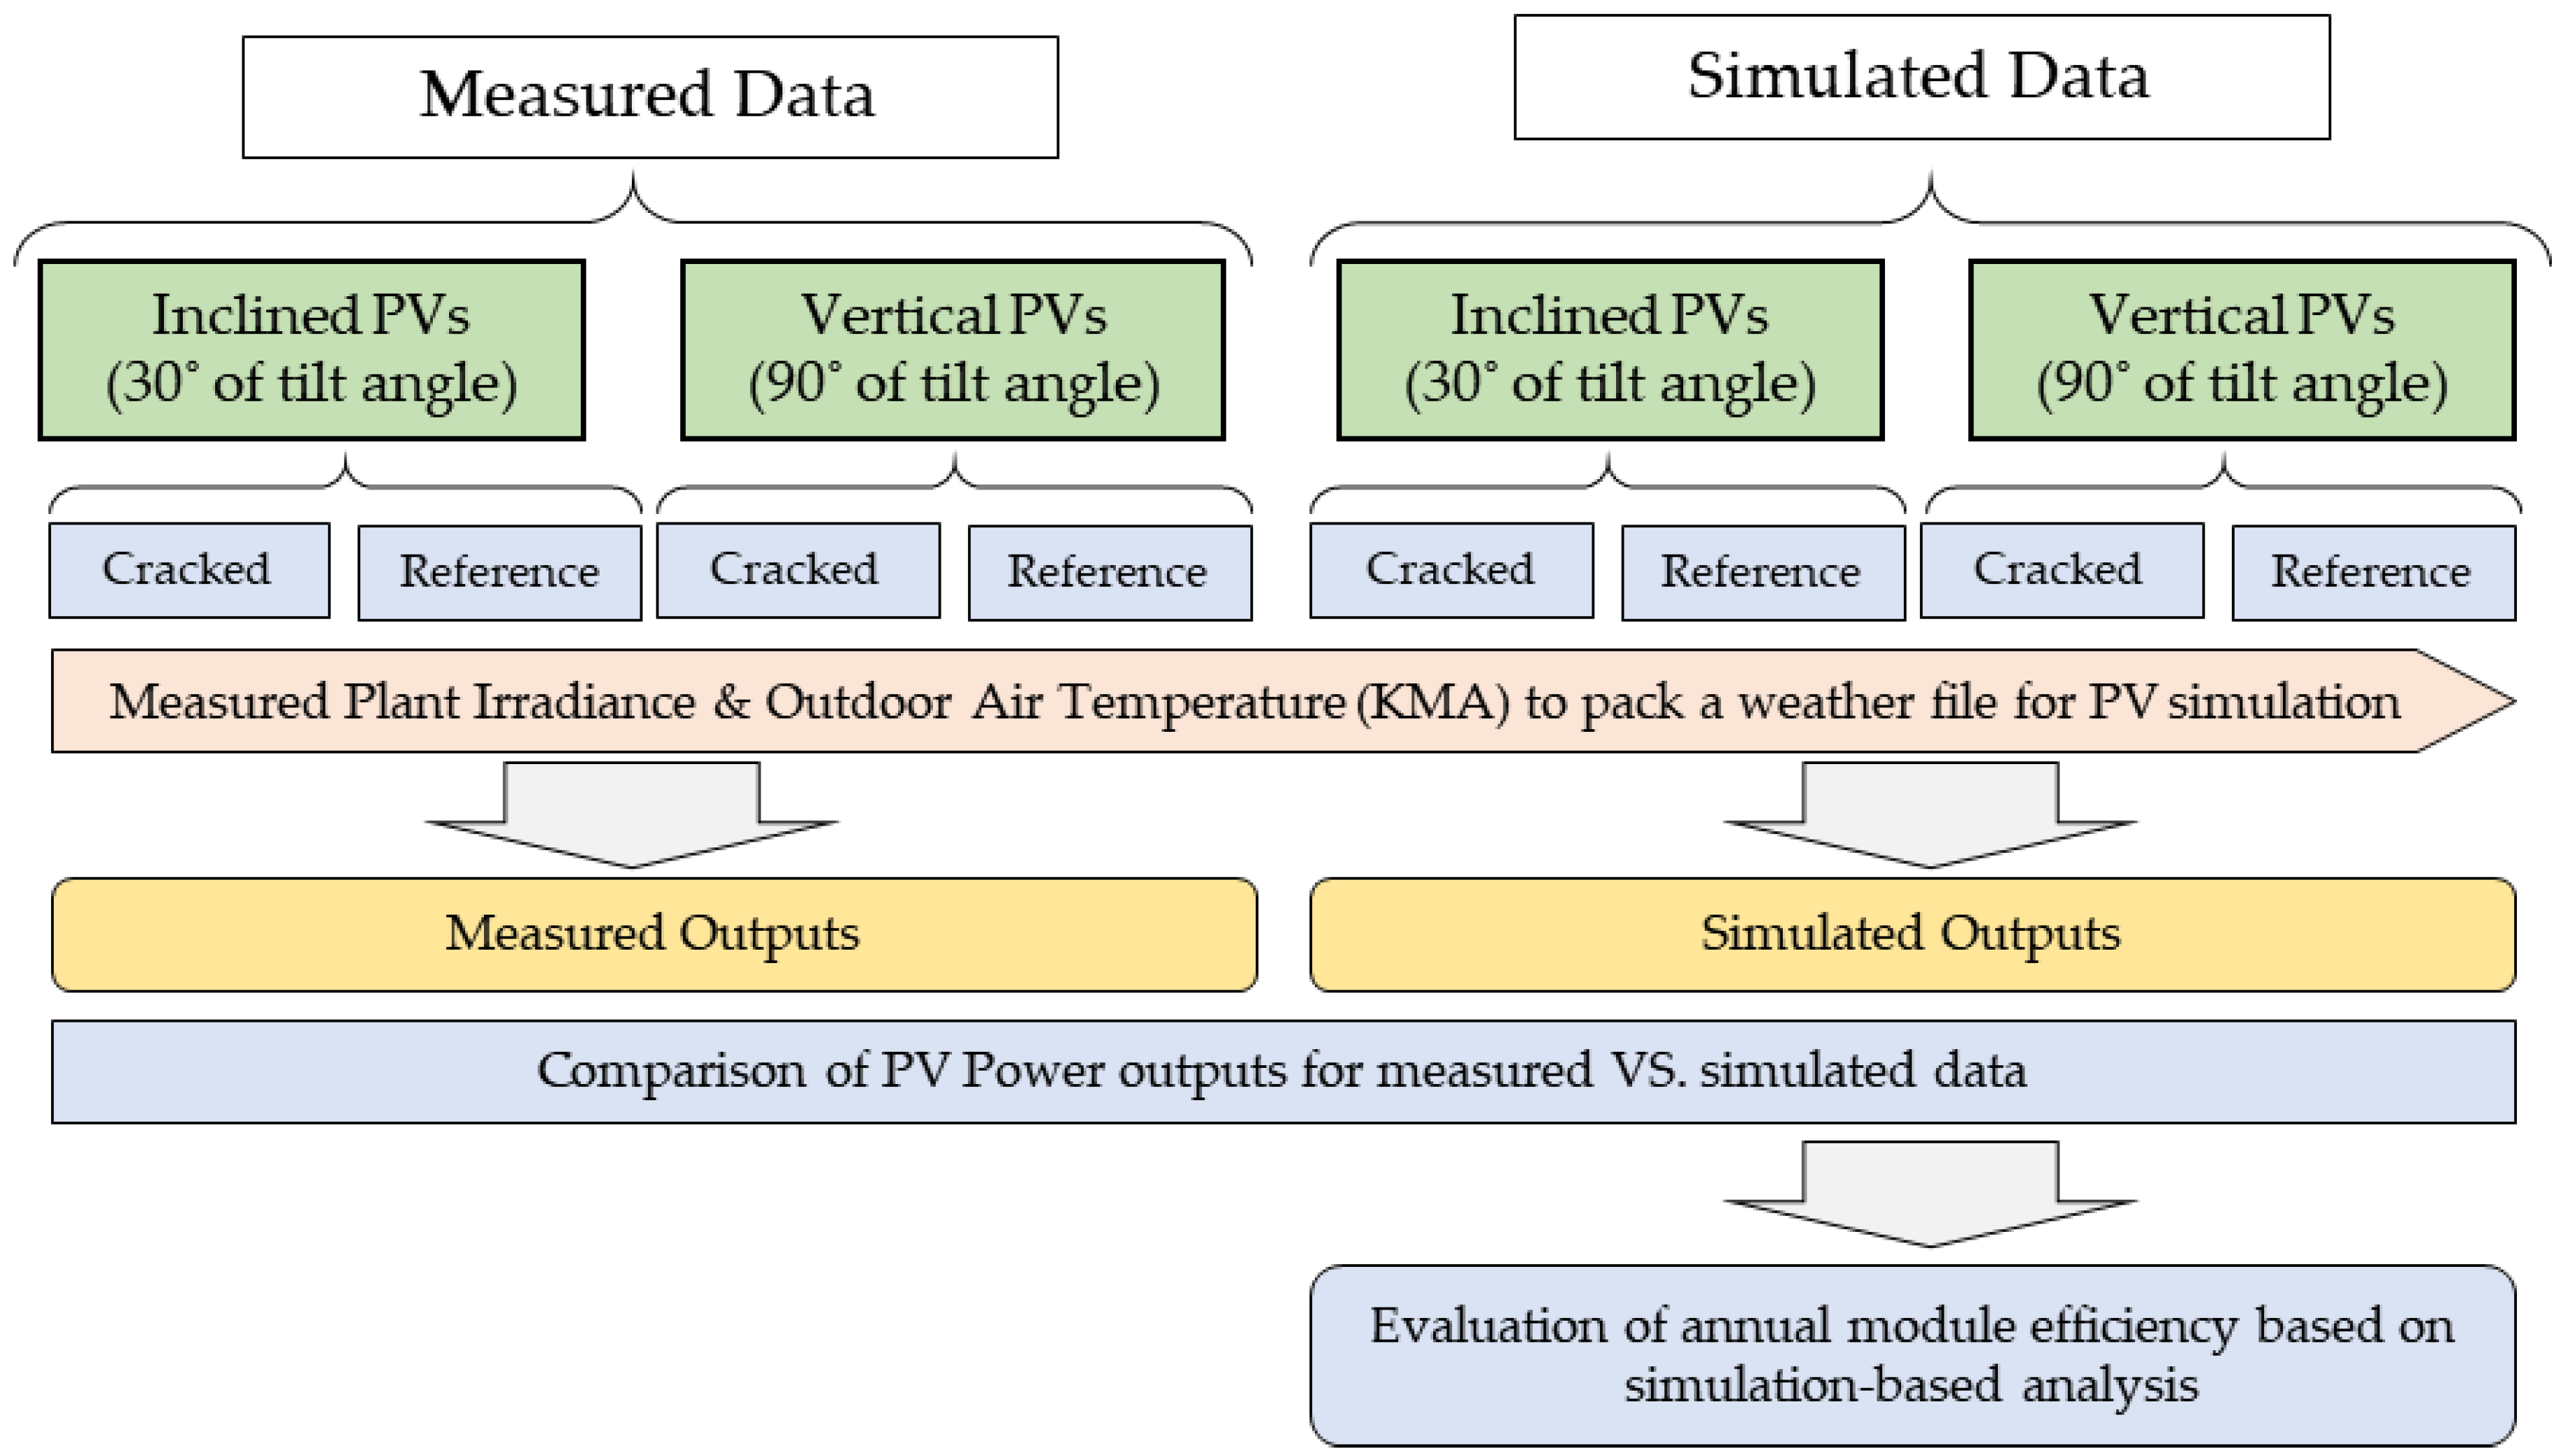
2.4. Simulation-Based PV Model

For simulation-based analysis, the SolarPro software tool, developed by Laplace System Company, Kyoto, Japan [26], was used. In the SolarPro program, the total global irradiance is determined based on the latitude and longitude of the area and the meteorological database. To calculate plane array irradiance, the Hay transposition model [26] was used by considering the direct, diffuse, and reflected solar components of the meteorological database. The total theoretical horizontal irradiance can be calculated by separating the total global horizontal irradiance into direct normal and diffuse horizontal irradiances as
I = 0.42 s i n H + 2.92 s i n H 0 2 s i n H 0 s i n 2 H 2.92 s i n H 0 4 s i n 2 H 0 s i n 3 H
I D N = 1.323 I s i n H 0.5466
I S N = I I D N s i n H
where I indicates global horizontal irradiance in units of k W / m 2 . I D N and I S H are direct normal and diffuse horizontal irradiances, respectively, in units of k W / m 2 ; and H and H 0 are the solar altitude and culminating solar altitude, respectively. Note that, if H ≤, all the irradiance values are assumed to be zero in this calculation.
Based on the calculated irradiances, SolarPro uses the equivalent one-diode model that employs equations for an empirical equivalent circuit model that consists of a DC current source, diode, and either one or two resistors to determine the current-voltage characteristics of a single module. The output current I p h a of a PV module can be determined by
I p h a = I p h I 0 e x p C V + I R s 1 V + I R s R p
C = q D p k T c
where I p h is the PV current; I o is the diode saturation current; R s and R p indicate the inner series and parallel resistances, respectively; q is the elementary charge; T c is the module temperature in kelvins; and D p is diode factor, which is the number of cell in-series multiplied by the diode efficiency index). In the SolarPro tool [26], the representative parameters that Equation (5) includes can be calculated by using
I p h = I p h 0 1 + 5.1029 · 10 4 T c 298.16 · 1.03 H a 0.003 1 e x p 8 H a
I o = I o 0 exp 0.09672 T c 298.16
R s = R s 0 1 + 3.3717 · 10 3 T c 298.16 + 9.7058 · 10 5 T c 298.16 2
R p = R p 0 1 + 5.7987 × 10 3 T c 298.16 + 1.6129 × 10 4 T c 298.16 2
where H a is the irradiance of the module surface in units of k W / m 2 ; I p h 0   and I o 0   are the PV current and diode saturation current, respectively, under the standard test condition; and R s 0   and R p 0   are the inner series and parallel resistances, respectively, under the standard test condition.
Experimental tests were conducted for three months (from February through April) as shown in Figure 5, and the measured PV outputs from the test were compared to the simulated outputs for the validation of the simulated model. For the PV simulation process, weather data are essential to accurately predict the output power of a PV system because of the considerable uncertainty involved with the input parameters of a weather data file. Therefore, actual global horizontal irradiances and outdoor air temperature obtained from the thermopile pyranometer and the Korea Meteorological Administration, respectively, were collected for this study and used to pack a weather data file for the SolarPro simulation. Using the packed weather file, two separate PV modules (referred to as reference and cracked modules) were modeled in SolarPro based on the PV module characteristics listed in Table 1, and the PV models were simulated for the same period as the measurements were taken to estimate hourly PV outputs. Hourly PV output profiles represent the hourly fit of the measured versus simulated data because the graphical analysis includes the time horizon comparison. The simulated PV outputs are also plotted versus the measured outputs to illustrate the relationship between the two values. In addition, to validate the simulated PV model in a statistical manner, the coefficient of variation of the root mean squared error (CV-RMSE) [27], was also used. Simulated models are declared to be validated if they produce CV-RMSE within ±30% when hourly data are compared [23]. The CV-RMSE can be calculated as
C V R M S E = 100 × i = 0 n y ^ i y i 2 / n m ¯
where y ^ i is the measured data sample, y i is the simulated data sample, and n is the number of data samples. In addition, after proper validation of the PV model simulated by SolarPro during the comparison period, a comparative analysis was conducted to evaluate the annual performance of the simulated PV models for non-cracked and cracked PV modules. Figure 7 depicts the flowchart of the data analysis for this comparative study.
As power yield and efficiency are major evaluation criteria for the analysis of PV performance evaluation based on data, the analysis criteria considered in this study are based on measured and simulated data. The power yield and efficiency values can be calculated as
η A = E A / ( H i × A a )
Y A = E A / P O
where η A is total efficiency; H i is total global solar irradiation in the plane in units of   k W / m 2 ; and E A is the total PV DC output in units of k W h ; A a is the overall PV area in units of m2; and Y A and P O indicate the array yield and power capacity in units of k W h / k W p and k W p , respectively. Using an array yield value enables determination of the best position for on-site PV generation. For example, if the same capacity is installed on both the horizontal and vertical planes, the generated values of the horizontal plane will be relatively high compared to those of the vertical plane.

3. Results and Discussion

This section presents and discusses the results off this comparative analysis based on measured and simulated data. The measured data taken from the test facility for three months (i.e., between 10 a.m. and 4 p.m. for February through April, excluding the eight missing days) are first analyzed for performance evaluation of cracked and reference modules. A graphical and statistical evaluation of the simulated BIPV model is then presented against the measured data to determine whether the simulated outputs from SolarPro are all within the acceptable criteria ranges. After proper validation, annual PV outputs are compared to evaluate the impact of cracks in the BIPV modules on annual power yields and efficiencies based on simulation-based data.

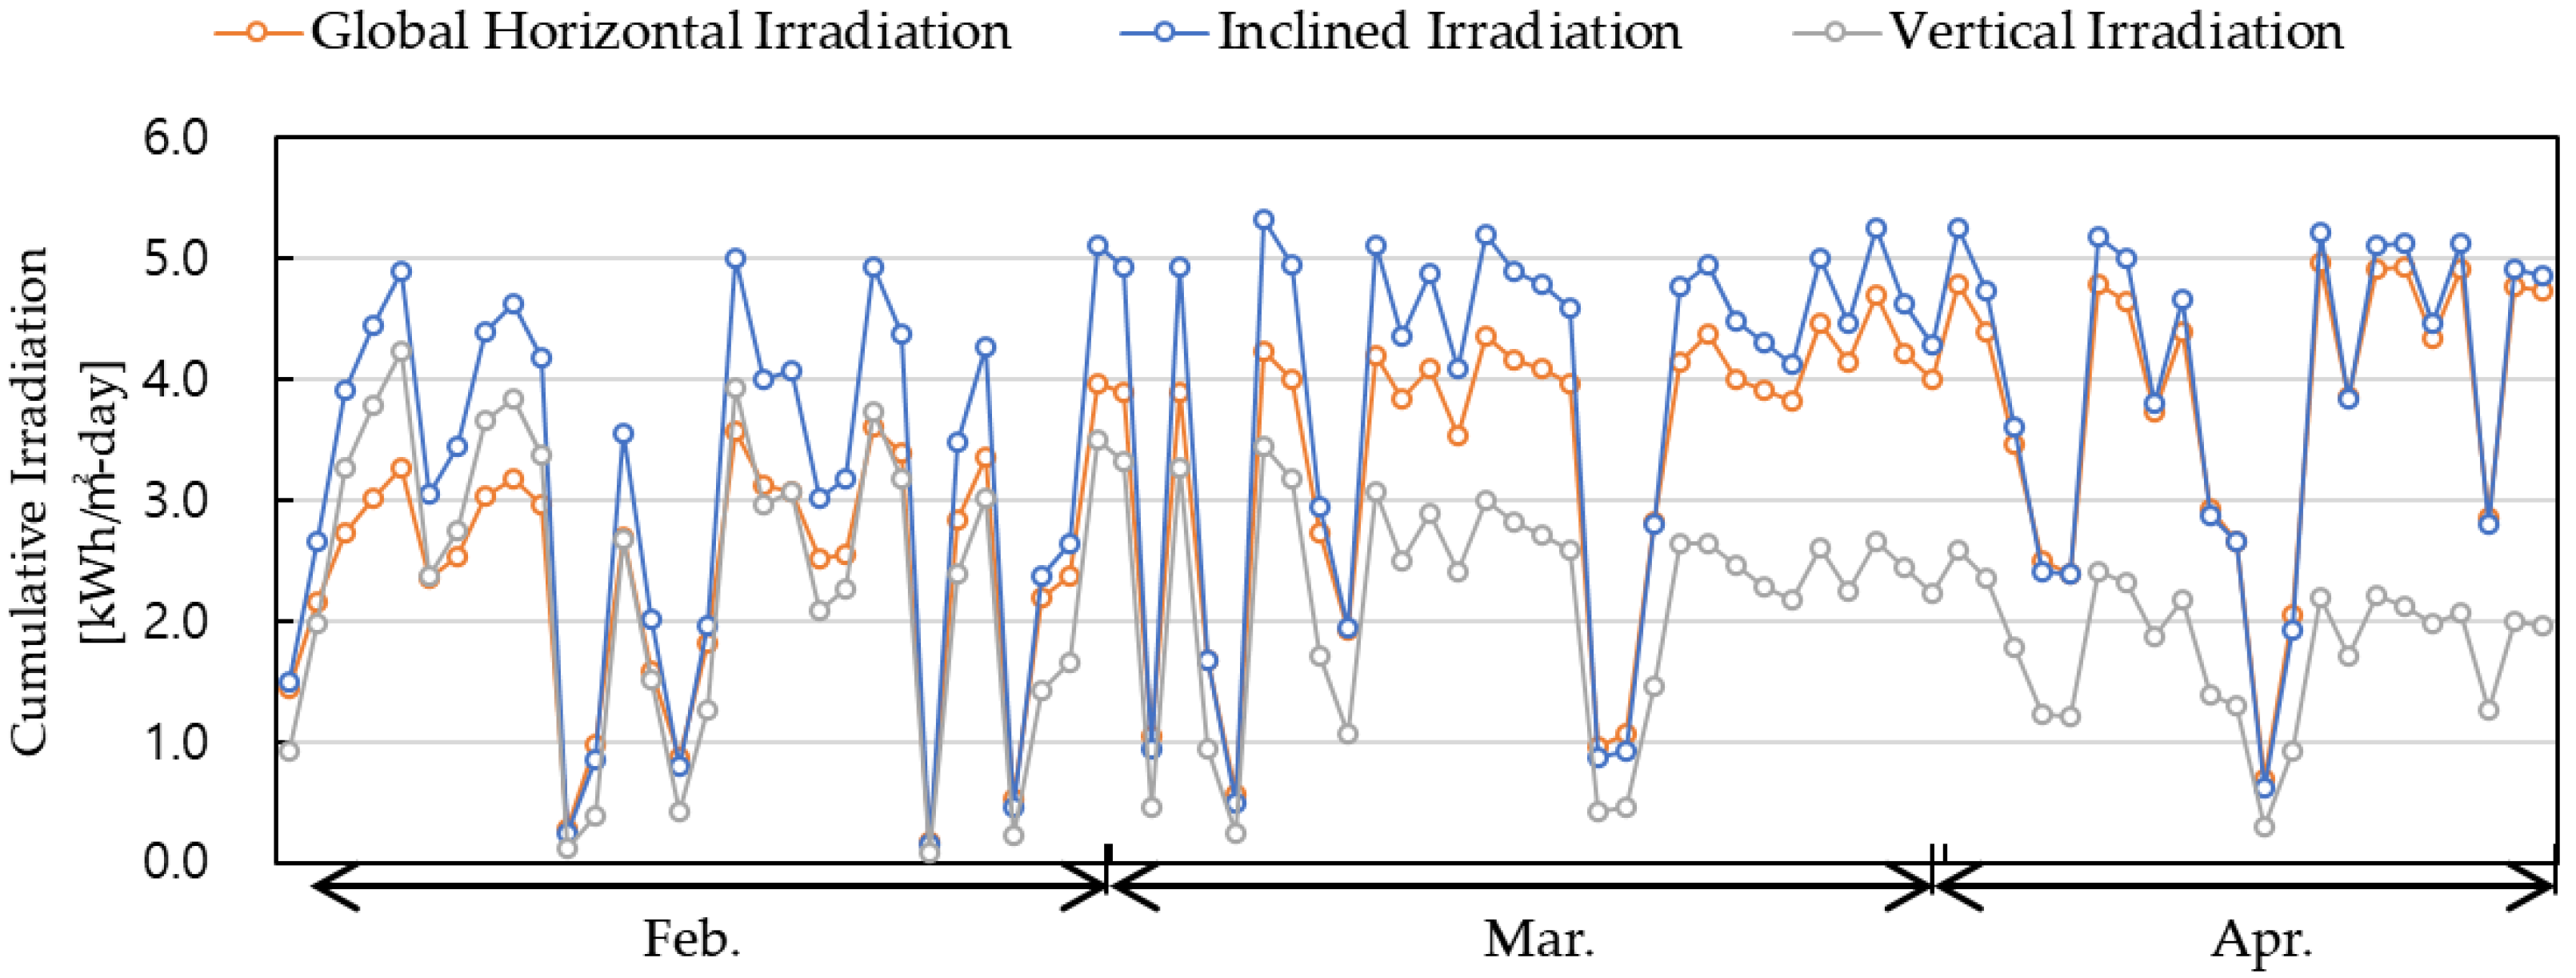
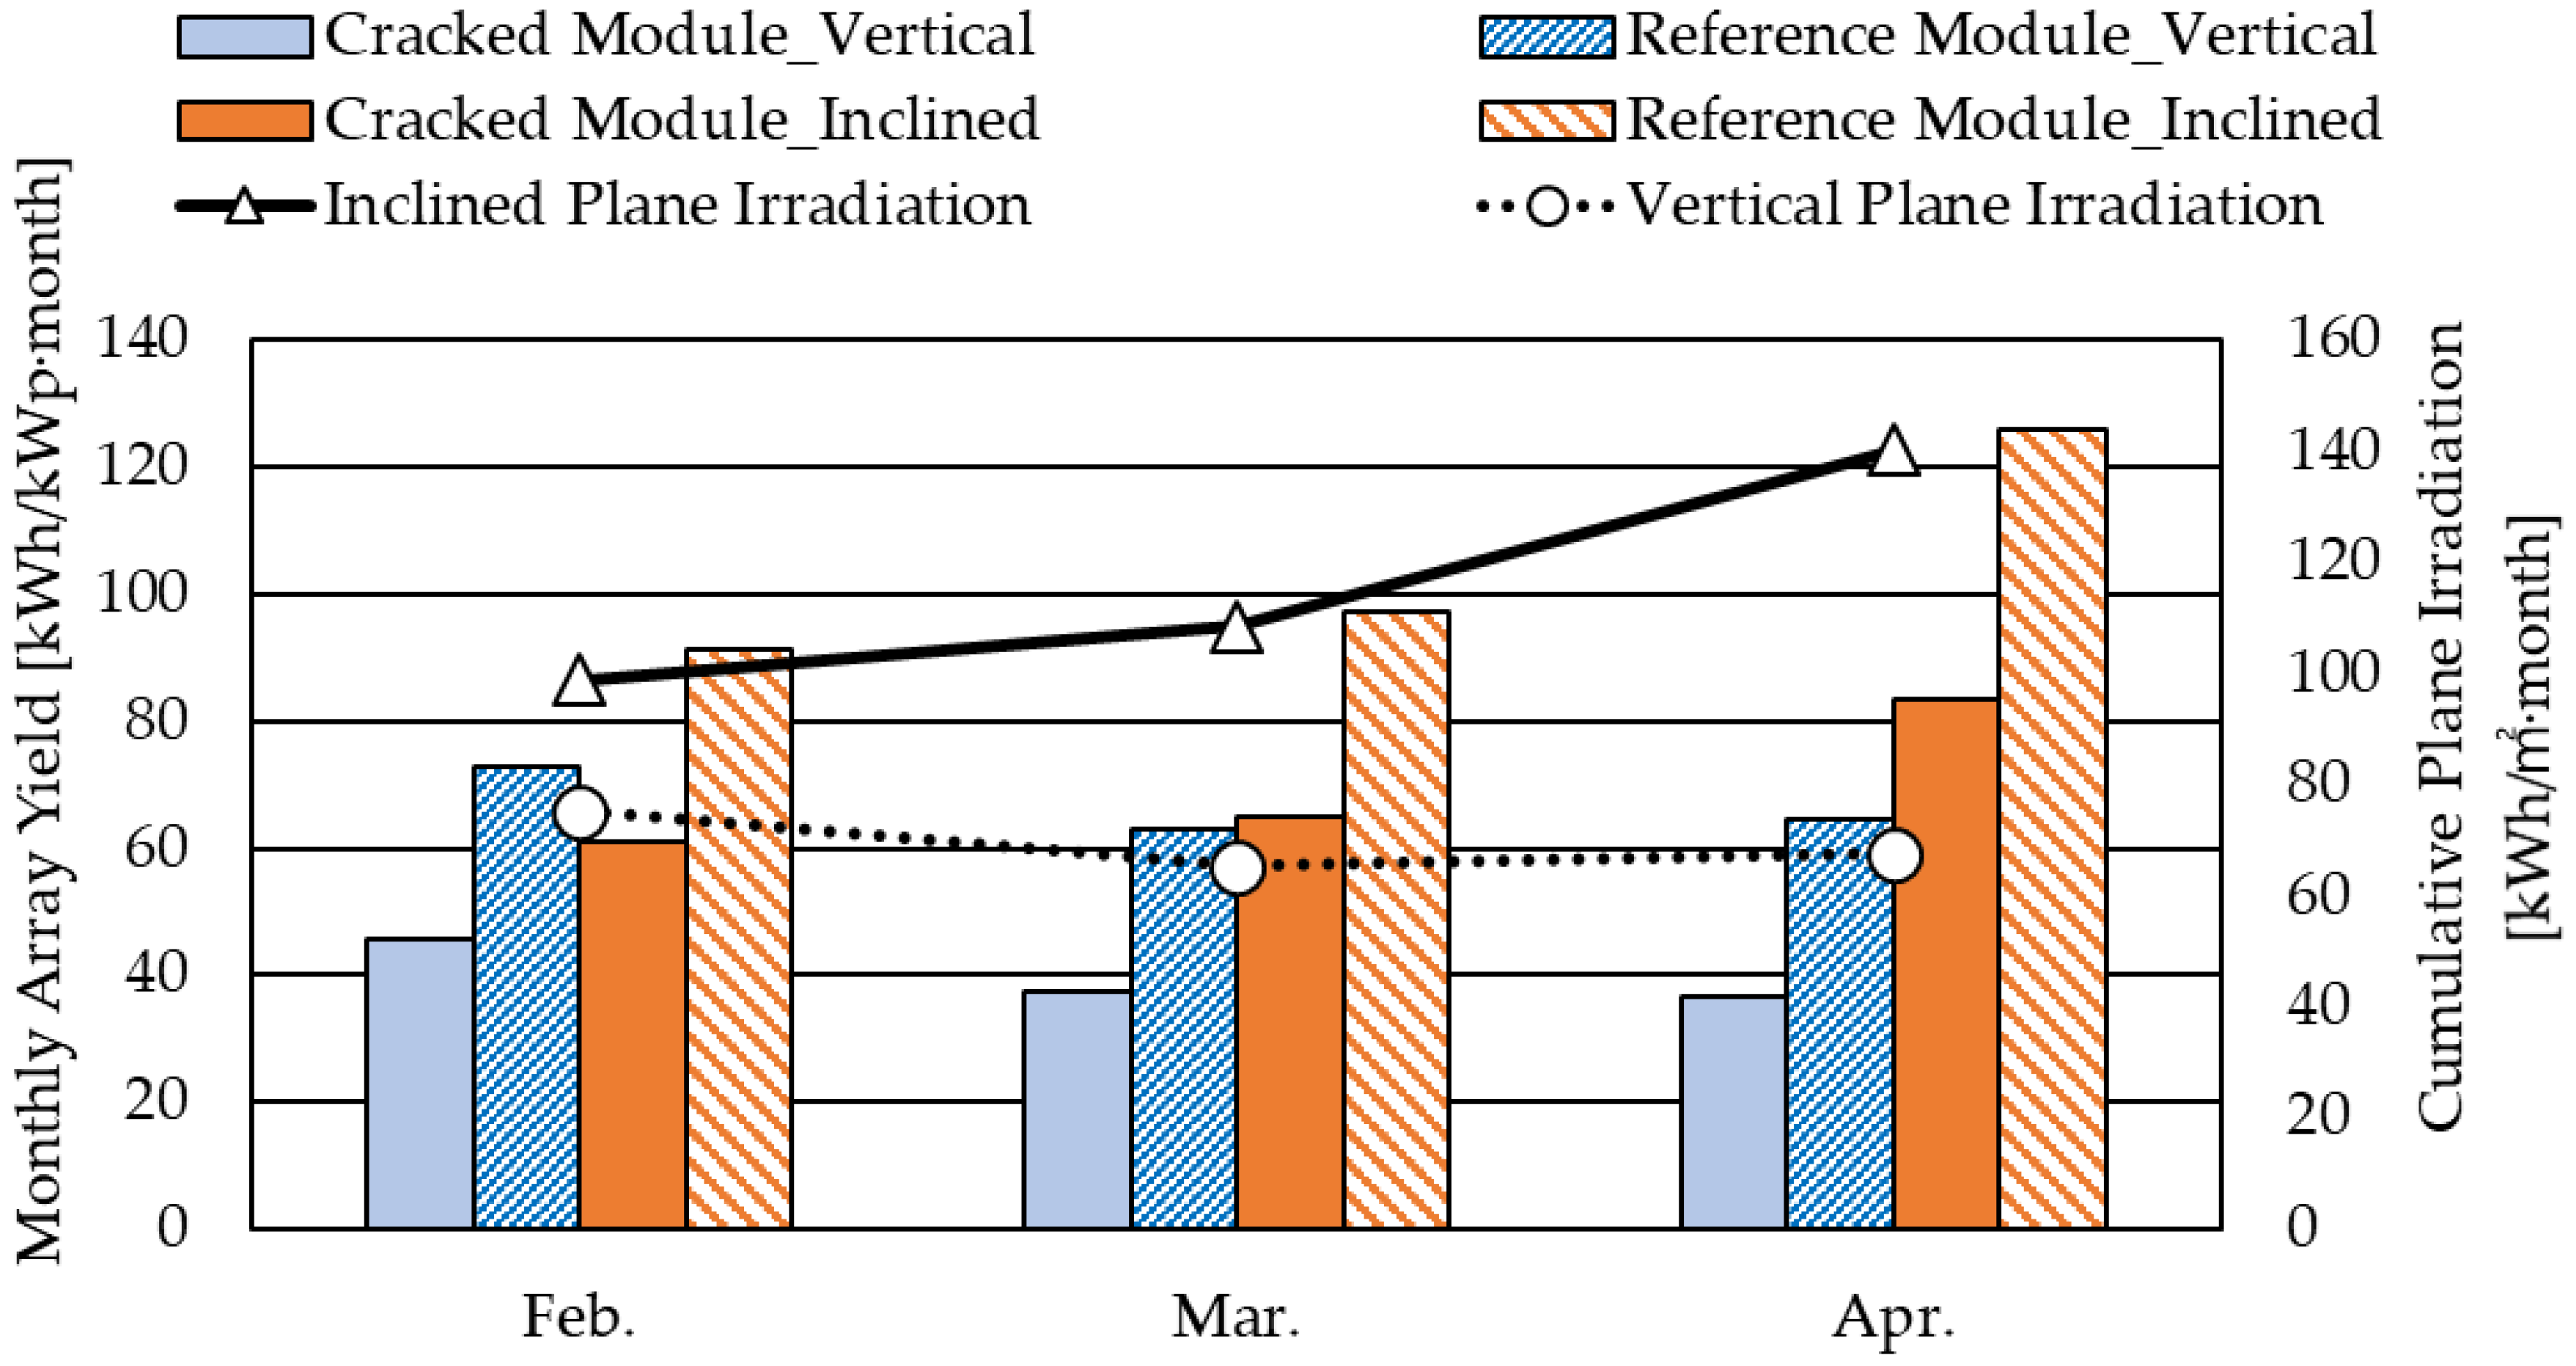
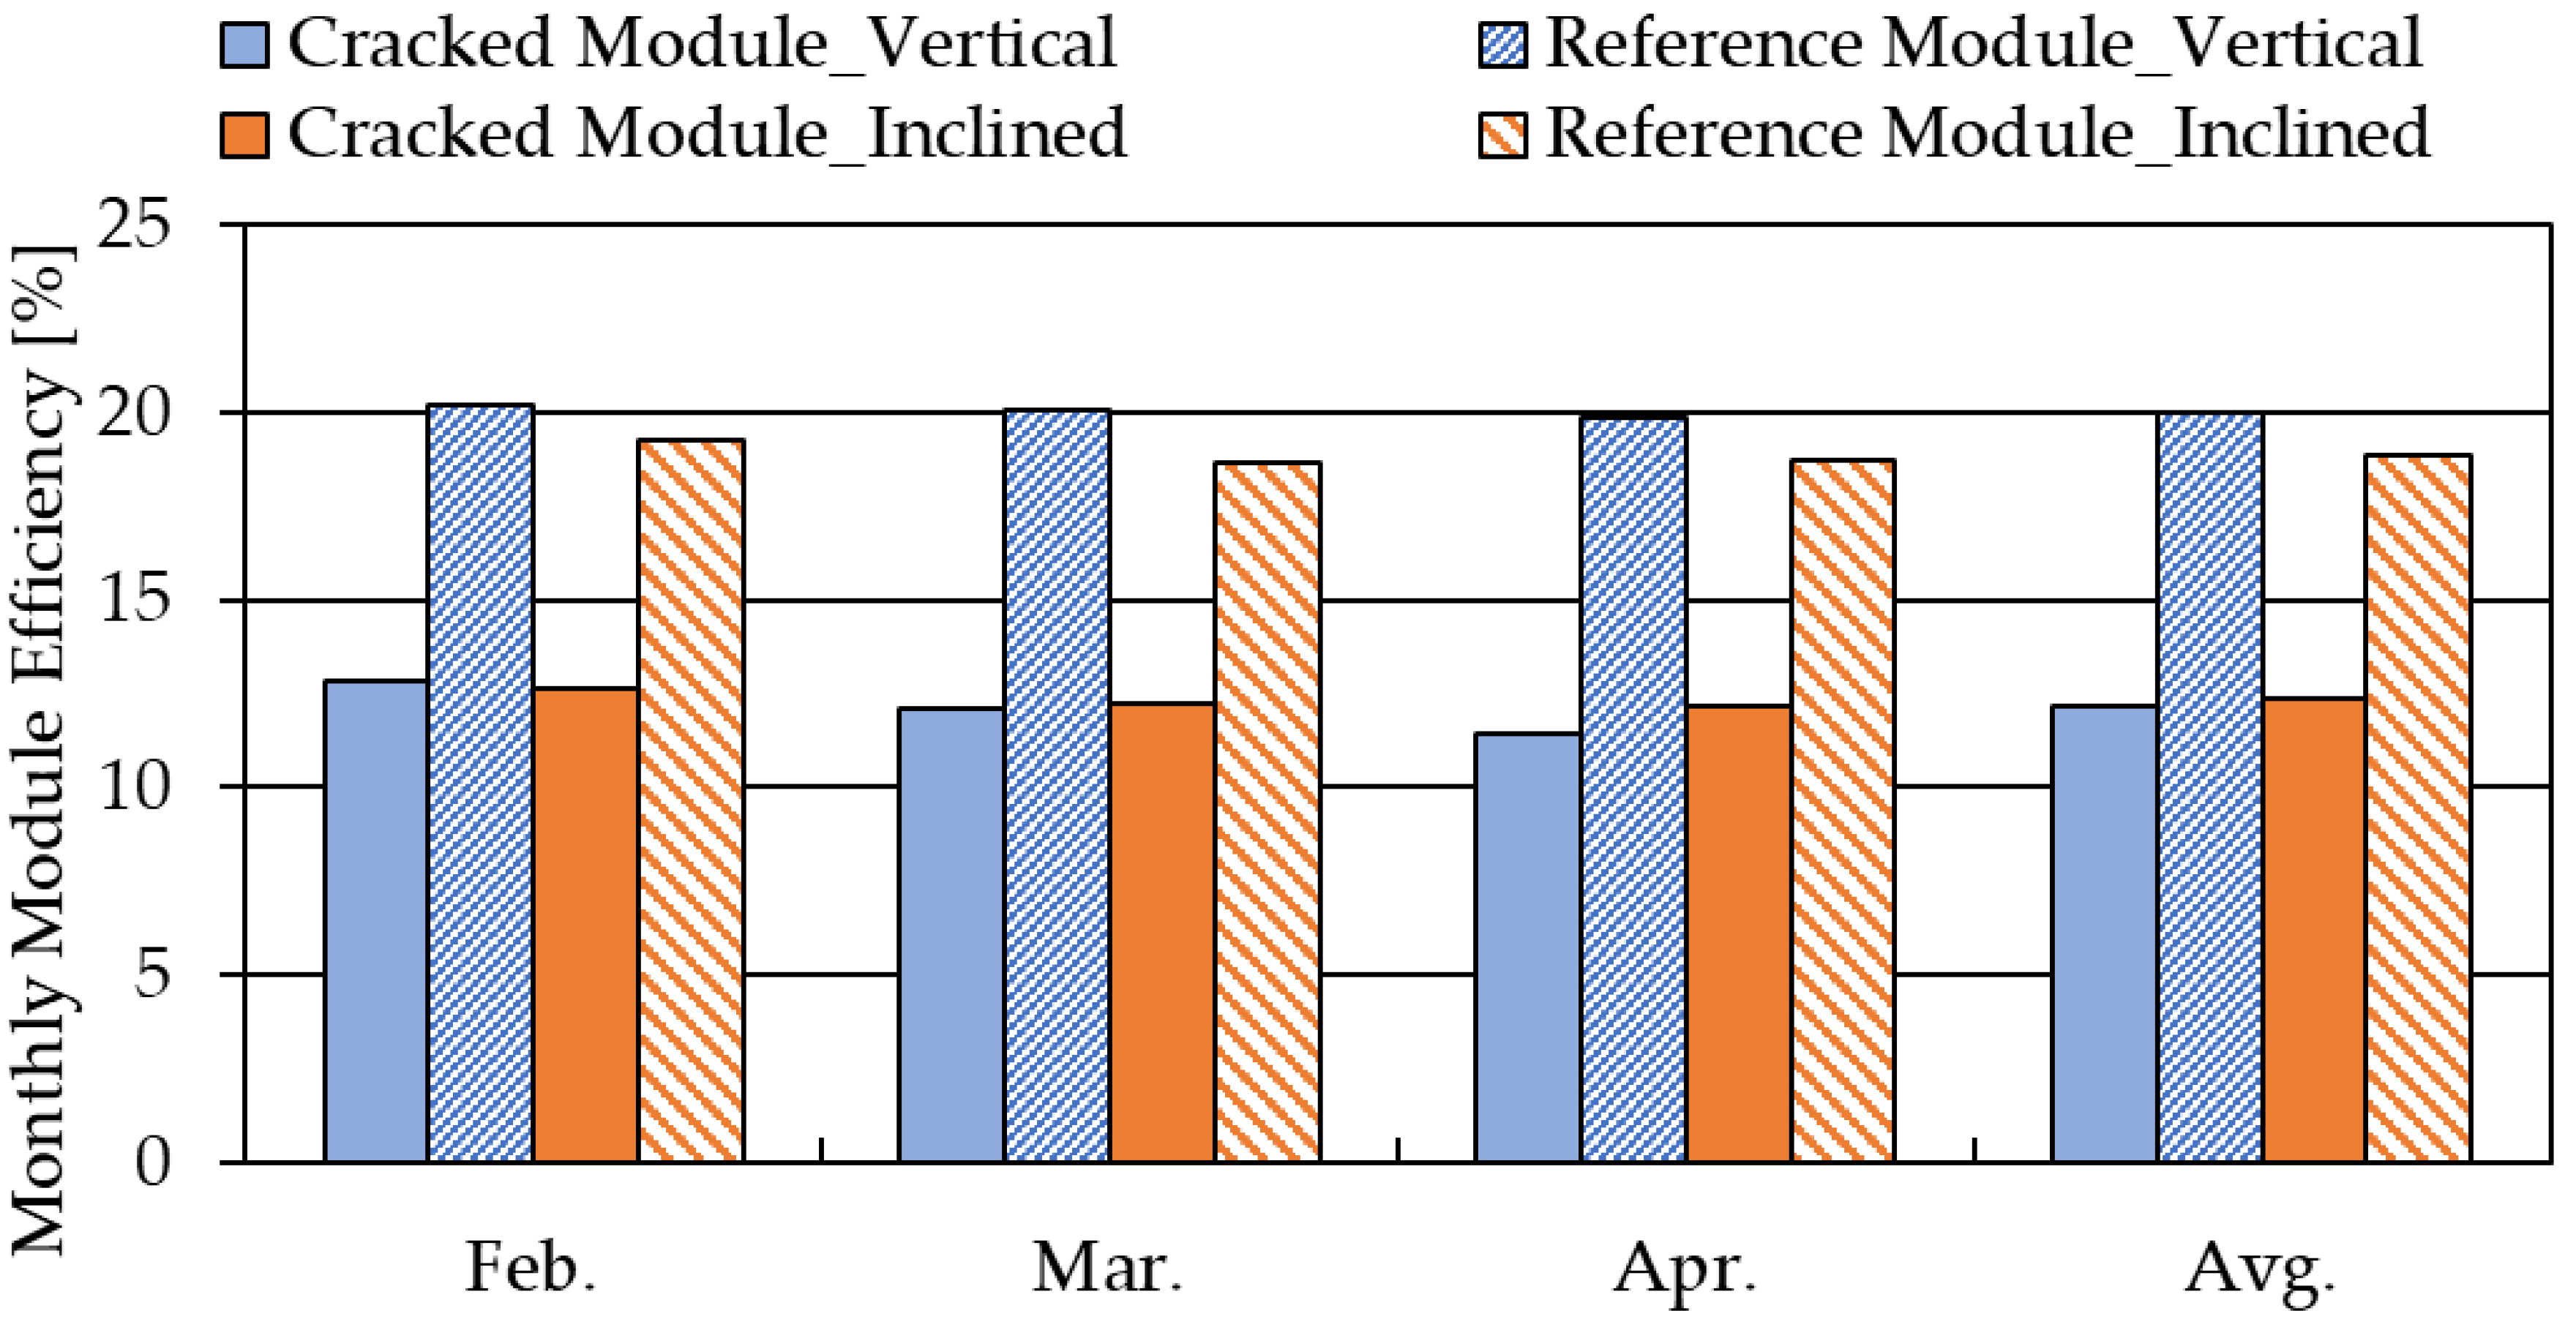
3.1. Performance Evaluation of BIPV Modules Based on Measured Data from the Test Facility

This subsection focuses on evaluating the output performance of BIPV modules based on measured data of cracked and reference modules, which are obtained from the test facility, as presented in Figure 4. Figure 8 shows a comparison of monthly power yields and plane irradiances for the cracked and reference modules of each plane position. As expected, cracked BIPV modules exhibit significant reductions in monthly power outputs for both vertical and inclined positions when compared to the reference modules (i.e., non-cracked modules). For example, in February, the percentage decreases in power outputs are 41% and 33% for vertical and inclined positions, respectively. The results from the other months also indicate that similar trends are followed, as shown in Figure 8. For the monthly trends of PV output yields, both cracked and reference modules installed in the inclined position exhibit increased output values as the inclined plane irradiances increase, while the vertical modules exhibit decreasing trends as the vertical plane irradiances decrease. Although it could be assumed that there might be a combined effect of other factors, such as surrounding obstructions and module temperature, for the reduced BIPV power output, it can be expected that those trends of decreased values highly depend on crack issues in the modules.
Because it is expected that changes in output power can reduce efficiency of PV modules, variations in efficiency for cracked and reference modules were also studied. Figure 9 presents a comparison of the monthly power efficiencies for the cracked and reference modules of each plane position corresponding to each month and the average value of three months. Examination of the extremes of the average value shows that the reference module has 20.0% and 18.5% PV output efficiencies for vertical and inclined plane positions, respectively. As expected, cracked BIPV modules exhibit significant reductions in output efficiency, being 12.2% and 12.5% for vertical and inclined plane positions, respectively.

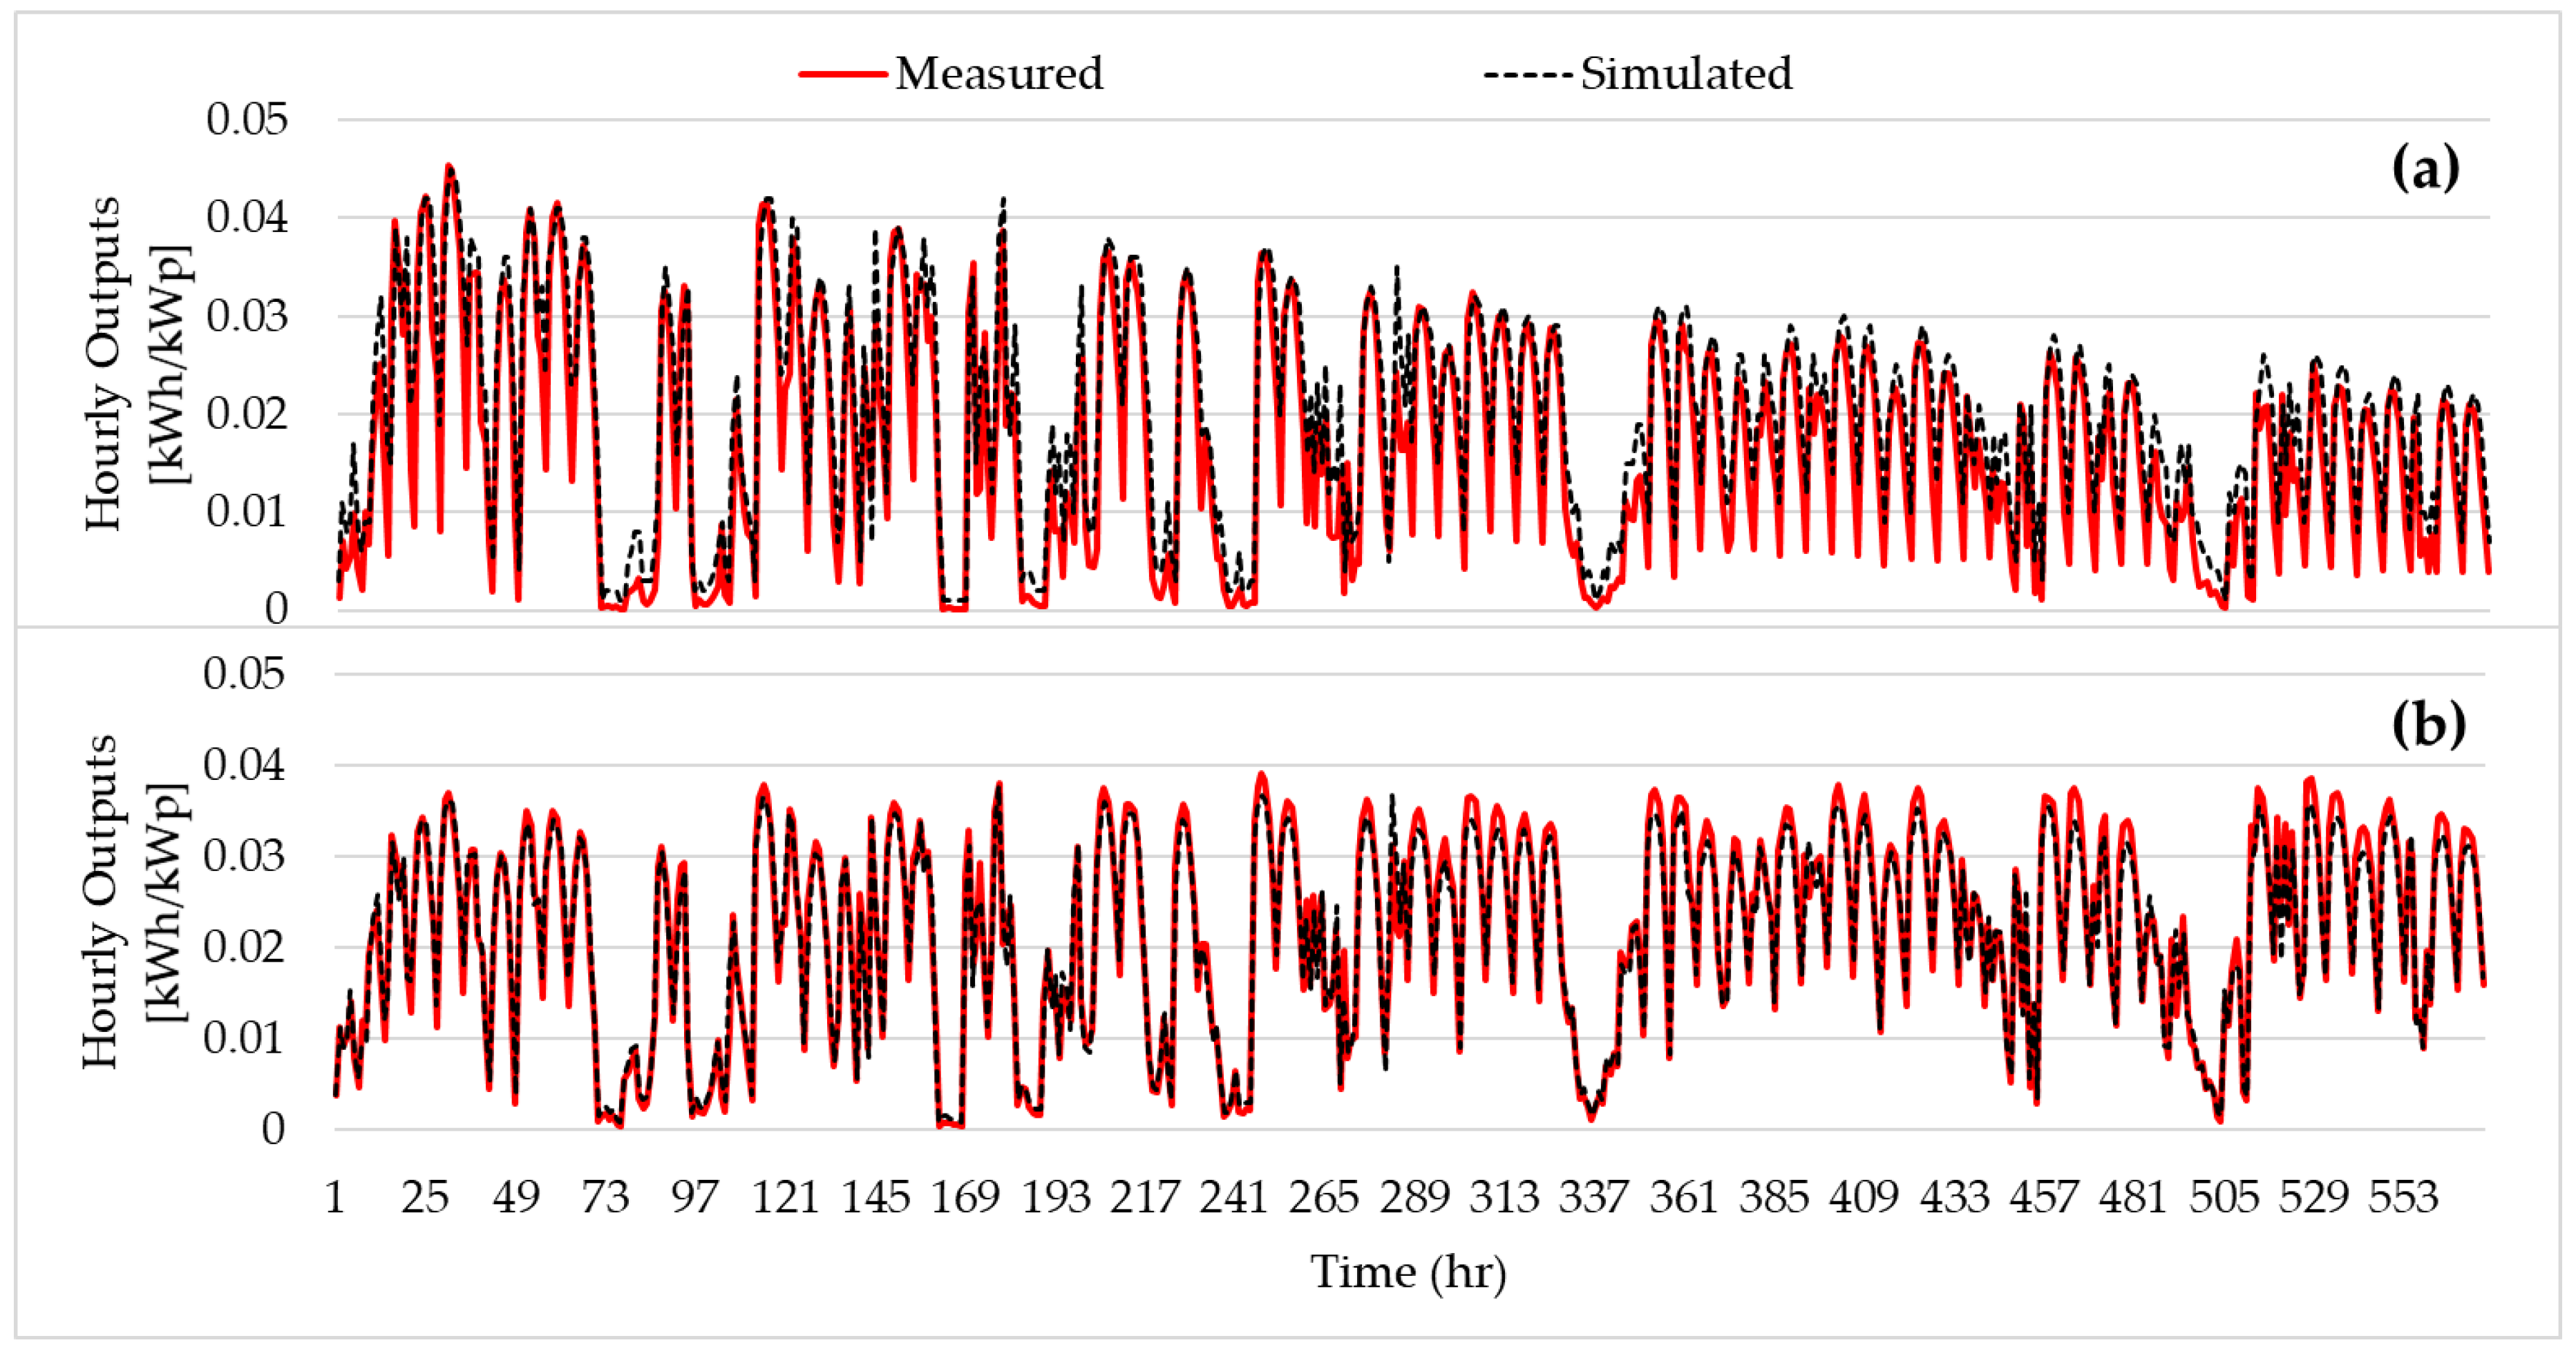
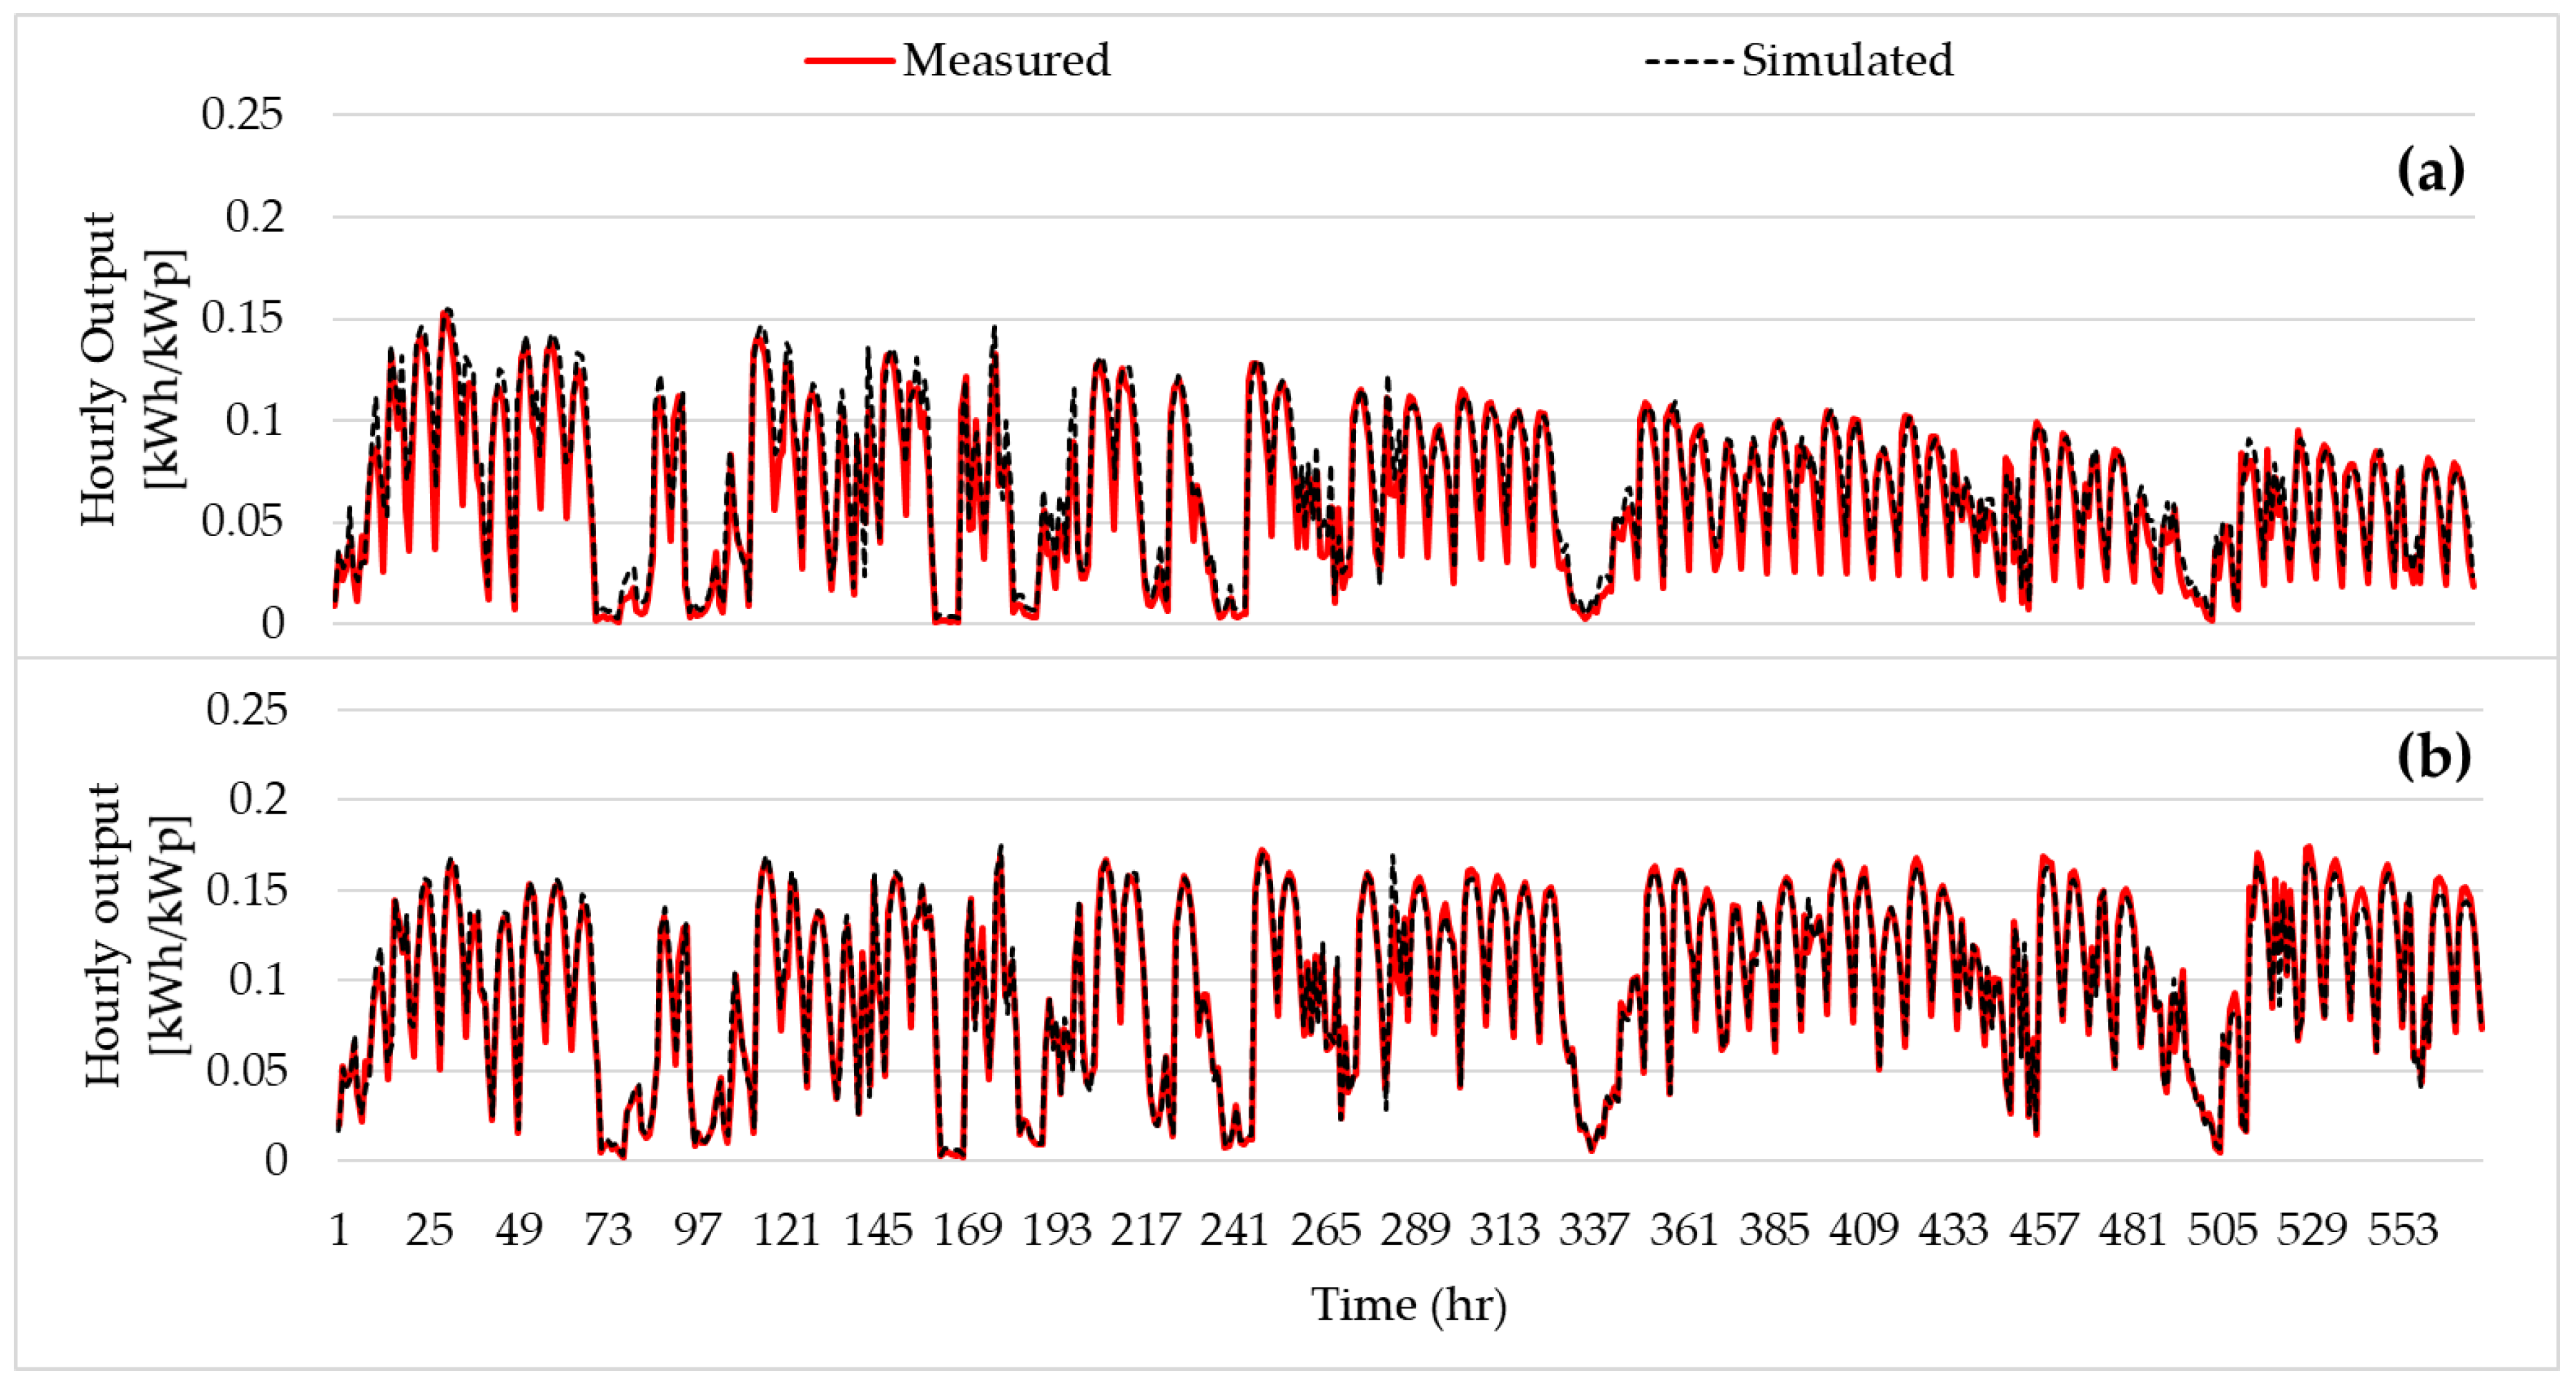
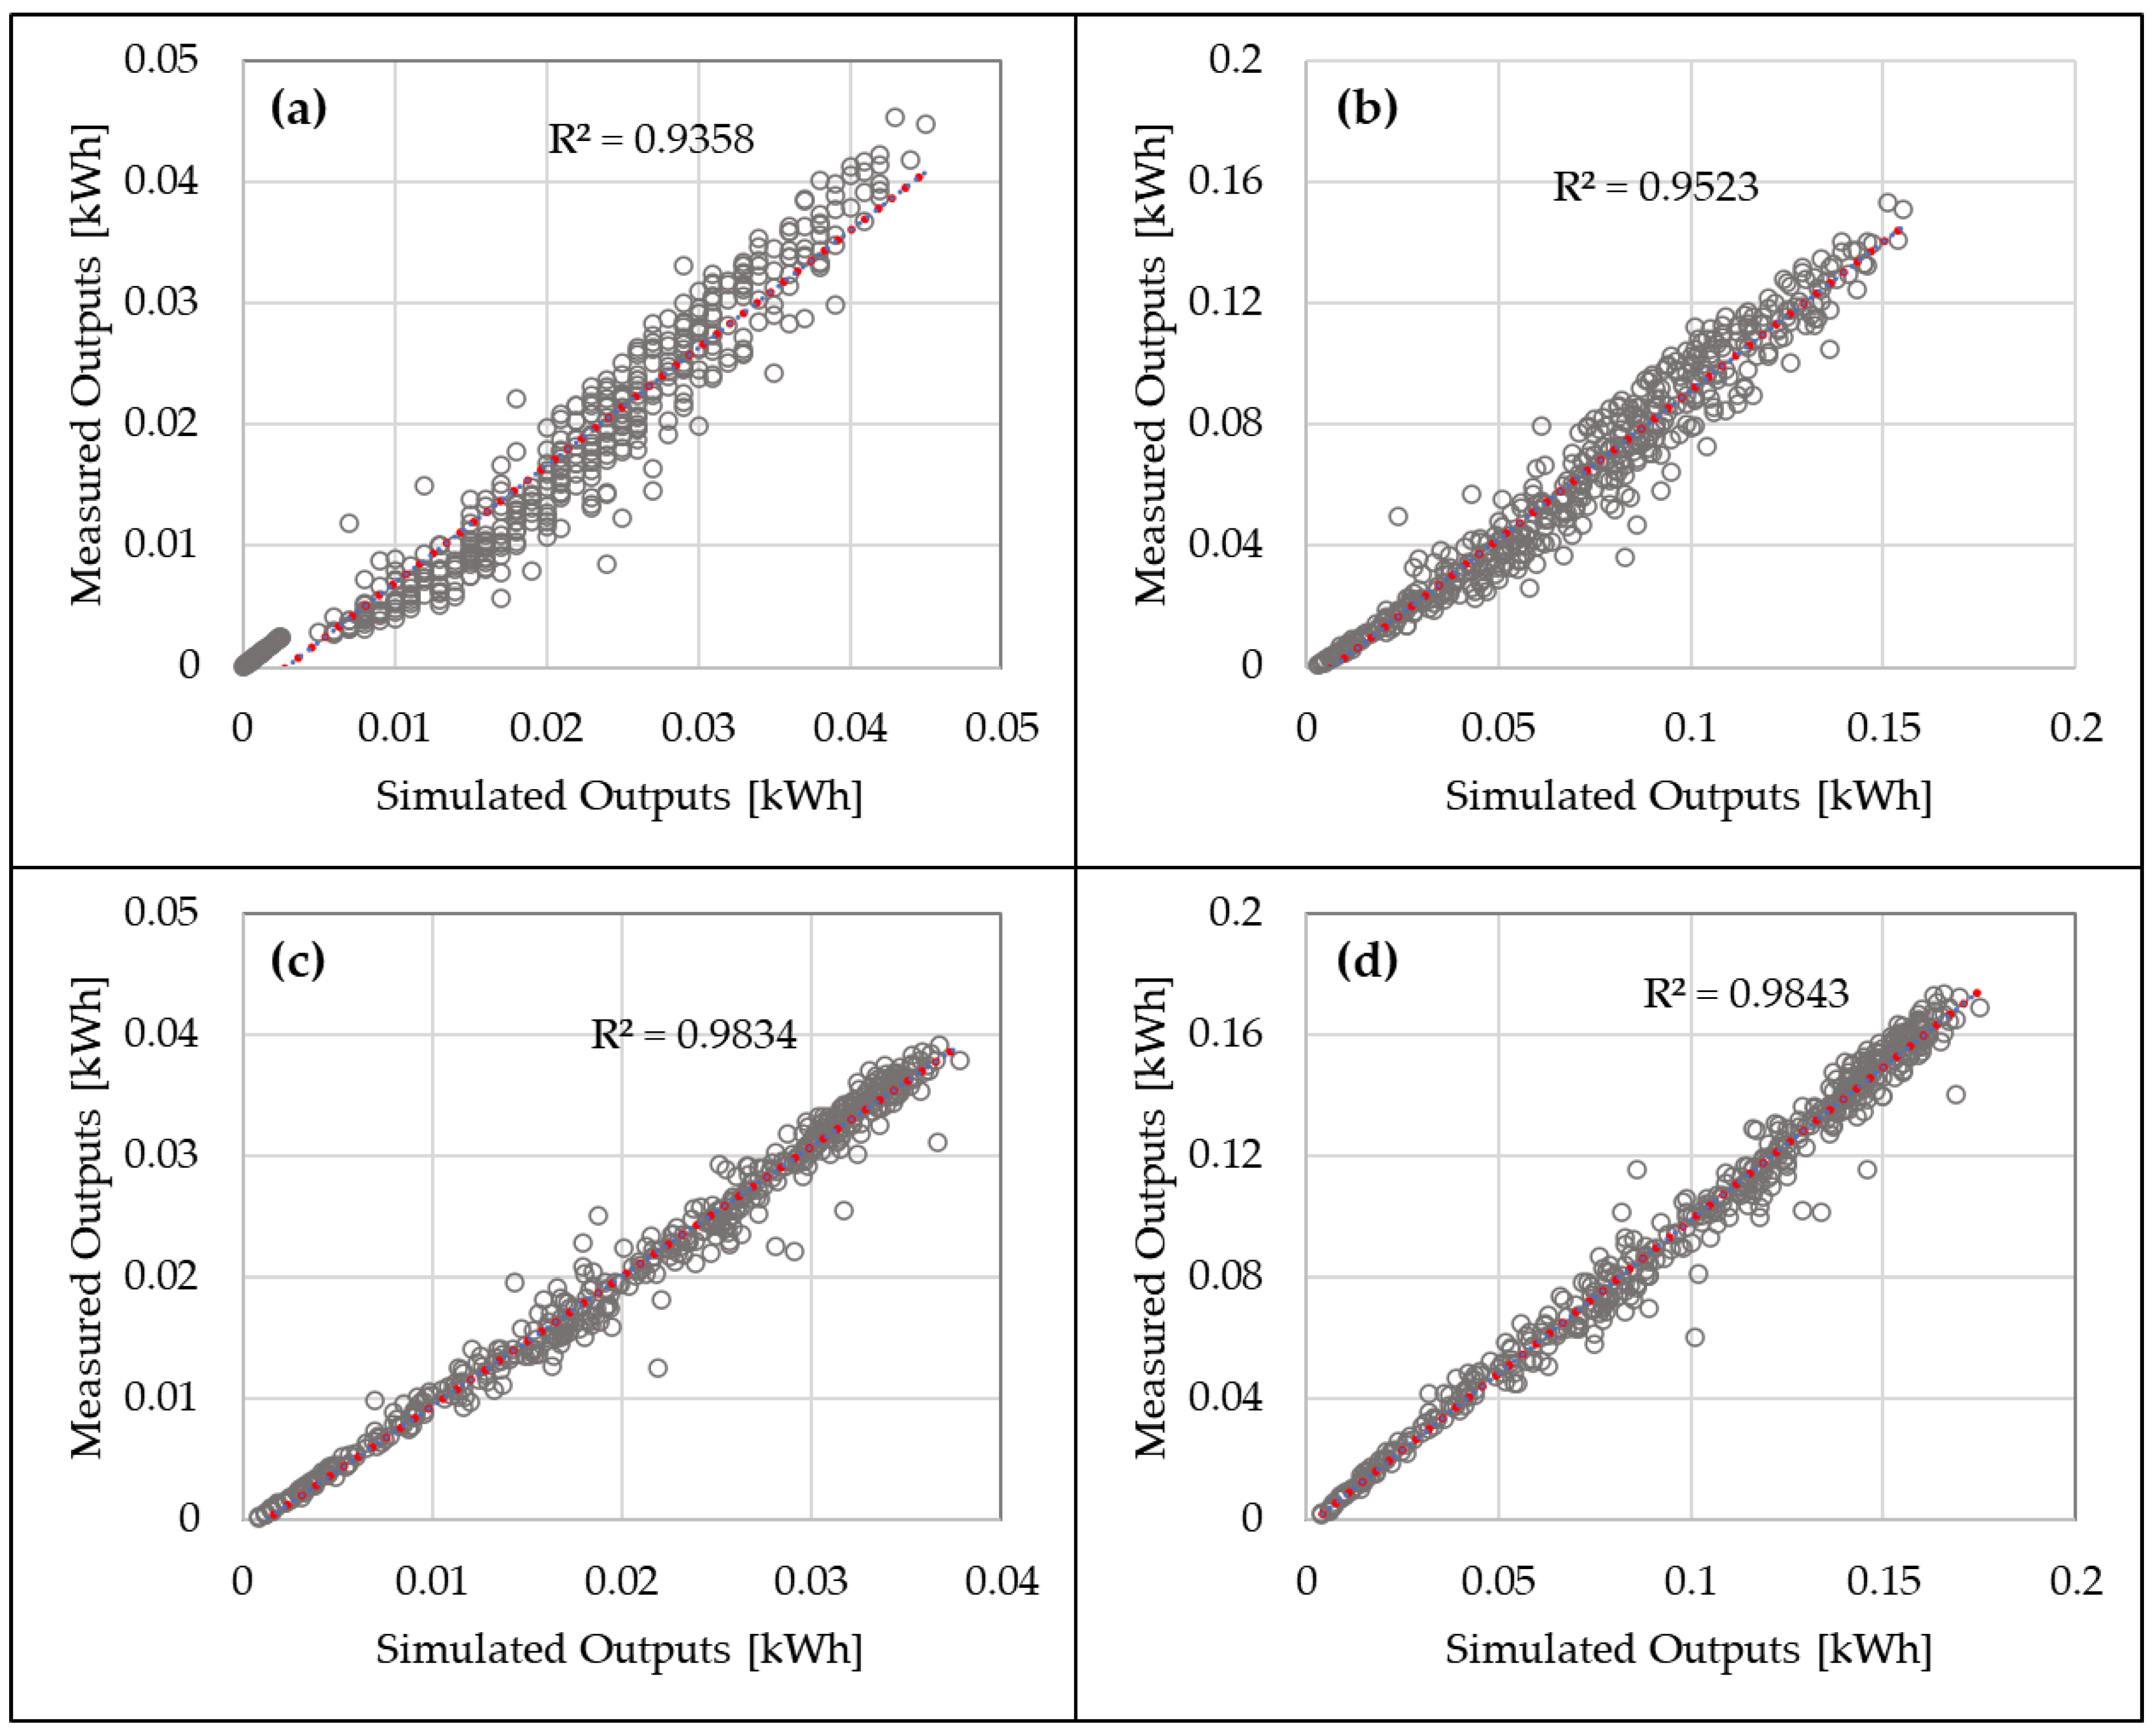
3.2. Comparison of PV Power Generation between Measured and Simulated Data

The simulated PV output was compared against the measured data to validate the simulated PV model. Figure 10 shows the hourly patterns of the simulated PV outputs for cracked BIPV modules compared to the measured data obtained from the test facility, including (a) vertical plane and (b) inclined plane positions. In addition, Figure 11 presents a comparison of the hourly output patterns for reference BIPV modules between the measured and simulated data for (a) vertical and (b) inclined plane positions. As seen in these figures, the comparison of each PV output illustrates acceptable agreements between the measured and simulated data for three months by presenting the simulated results following the measured outputs in a reasonable manner in most hours. It should be noted that hourly comparisons of PV outputs reveal that the simulated model often overpredicts the PV outputs in the morning and late afternoon of a day.
Figure 12 shows scatterplots of the hourly simulated data versus hourly measured data during comparison period (i.e., three months between 10 a.m. through 4 p.m.). As expected, it is observed that the simulated data agree reasonably well with the measured data in BIPV output performance for cracked and reference modules of each plane position. Acceptable agreements between the simulated and measured data under the criteria defined in ASHRAE Guideline 14 is also found as shown in Table 3, including the coefficient of variation of the CV-RMSE. ASHRAE Guideline 14 states that simulated models are validated if the CV-RMSE between the measured and simulated data is within ±30% when hourly data are compared. In addition, the coefficients of determination (R2) were calculated, as shown in Figure 12, for (a) module with cracked PV cells in the vertical plane, (b) the reference PV module in the vertical plane, (c) module with cracked PV cells in the inclined plane, and (d) the reference PV module in the inclined plane. As seen in those figures, a strong correlation between the simulated and the measured outputs is observed.

3.3. Evaluation of BIPV Module Yield and Efficiency from Simulation-Based Analysis

Because power yield and efficiency are major criteria for evaluating the performance of BIPV systems, we compared monthly power yields for modules before and after cracks and reference modules. The monthly power yield and efficiency values are determined by using Equations (12) and (13), respectively, and the comparative values are shown in Figure 13. Examination of this figure, shows that cracked modules exhibit significant reductions in vertical energy yields, by ~34.6% and ~35.4% for the minimum and maximum percentage reductions, respectively, when compared to non-cracked PV modules (i.e., modules before cracks and reference modules). Note that the pre-crack module indicates that the original manufacturer’s data, listed in Table 1, are used as inputs for the annual PV simulation. Figure 13 also illustrates the plane irradiations for vertical and inclined positions. As expected, the monthly vertical plane irradiation exhibits higher irradiation values during winter and lower values during summer, whereas opposite trends are observed for the inclined plane case. The results from the inclined PV case, as shown in Figure 13b also exhibit similar trends, resulting in significant reductions compared to the non-cracked PV modules.
Figure 14 shows the annual comparison of PV module yields and efficiencies for cracked and non-cracked modules for each plane condition. From this figure, it can be seen that the cracked modules undergo 35% degradation in annual PV yields for both vertical and inclined plane positions. In addition, the degradation of annual modules’ efficiency is ~35% for both vertical and inclined plane positions. These results indicate that such cracks in the BIPV modules used in this study can significantly reduce their output.

4. Conclusions

A quantitative comparative study of BIPV module outputs was quantitatively conducted to investigate the impact of cracks in BIPV modules on BIPV module performance based on measured and simulated data. The experiment was first conducted to measure the actual BIPV module’s outputs such as plane irradiances and weather data using the test facility. The measured data were analyzed to estimate output reductions in cracked modules for a certain measurement period, and the data were used for validating the simulated PV model. For the annual performance evaluation, the validated PV model was simulated in terms of cracked and non-cracked modules. Non-cracked modules were the reference BIPV module and the module that included the original manufacturer’s specification before the cracks occurred in the module. To reflect the adoption of different BIPV tilt angles, two plane angle cases with 30° and 90° for inclined and vertical plane cases, respectively, were considered. The results off this comparative study revealed that cracks in the modules could potentially affect the annual BIPV module outputs by significantly reducing output when compared to that of the reference module. The key findings off this study are as follows:
  • In terms of the performance evaluation of cracked and reference BIPV modules based on the measured data, cracked modules in the vertical plane exhibited significant reductions in their output, amounting to 40–43% reduction for the measurement period (i.e., February through April). The cracked modules in the inclined plane position also exhibited ≥33% output reduction when compared to that of the reference module in the same plane position.
  • The validation results indicated that the SolarPro tool can reasonably predict the power outputs of actual BIPV modules under the criteria defined in ASHRAE Guideline 14 by illustrating acceptable agreements between the measured and simulated data, as well as a strong correlation between each dataset.
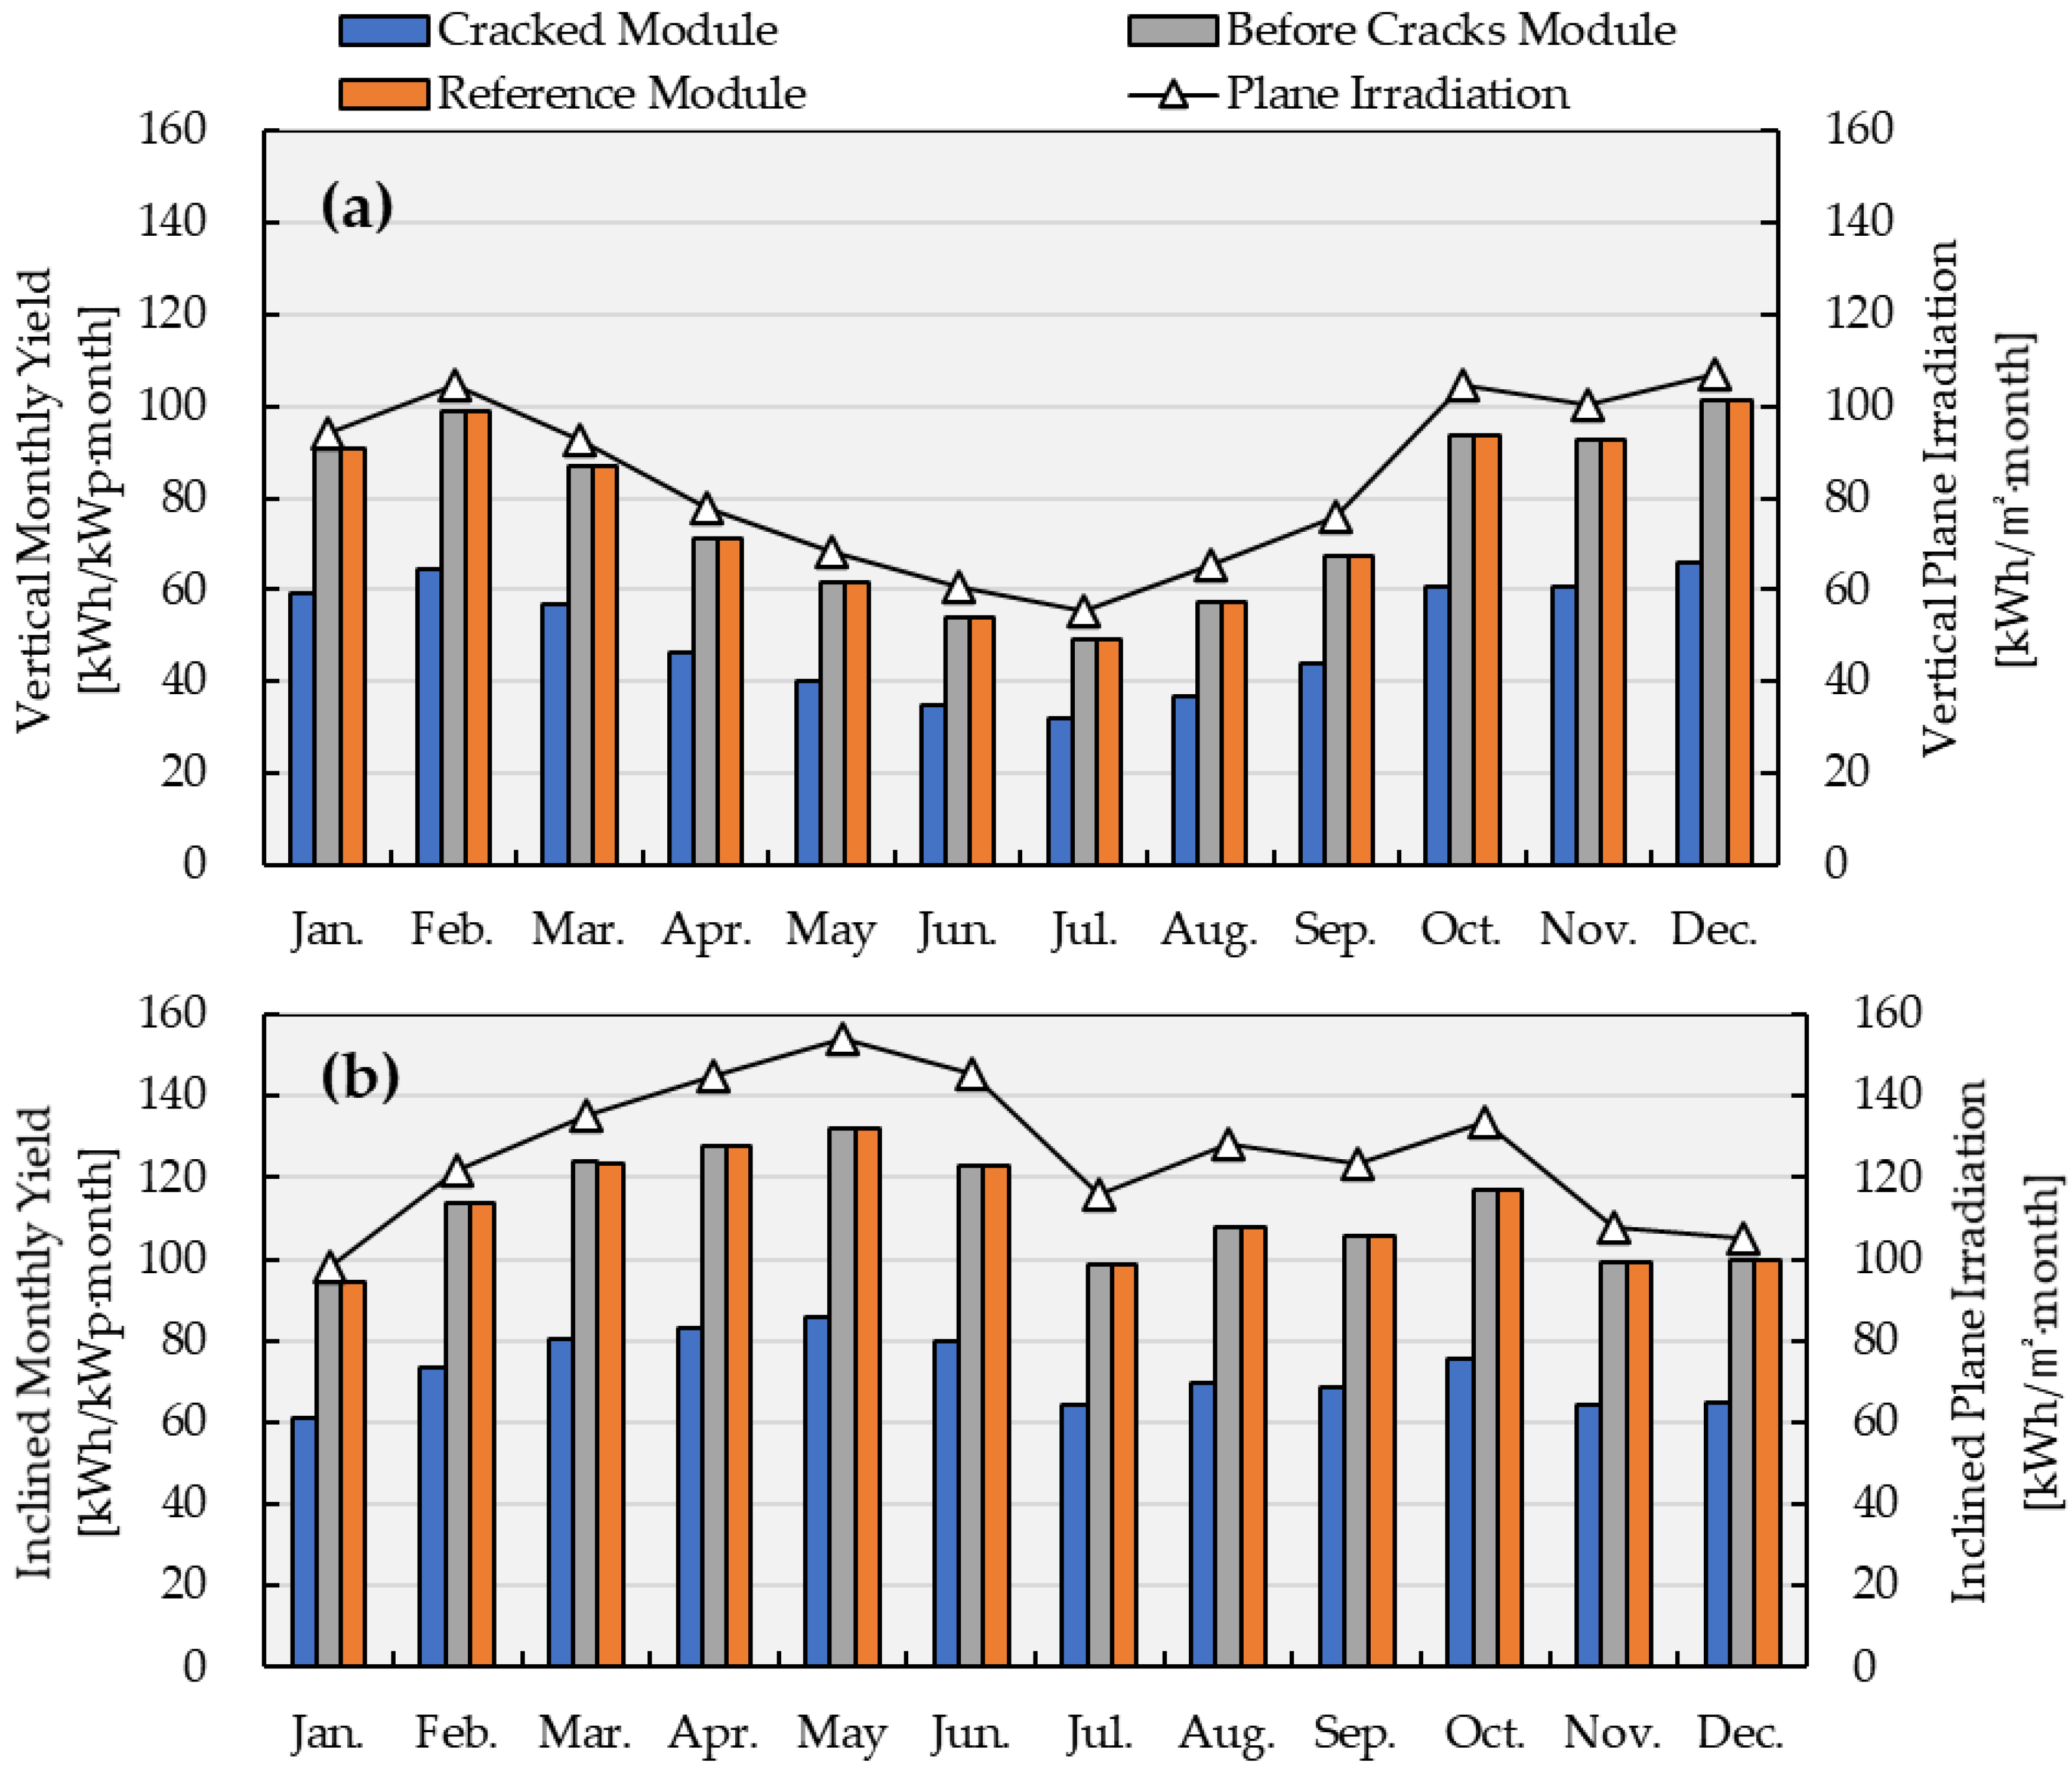
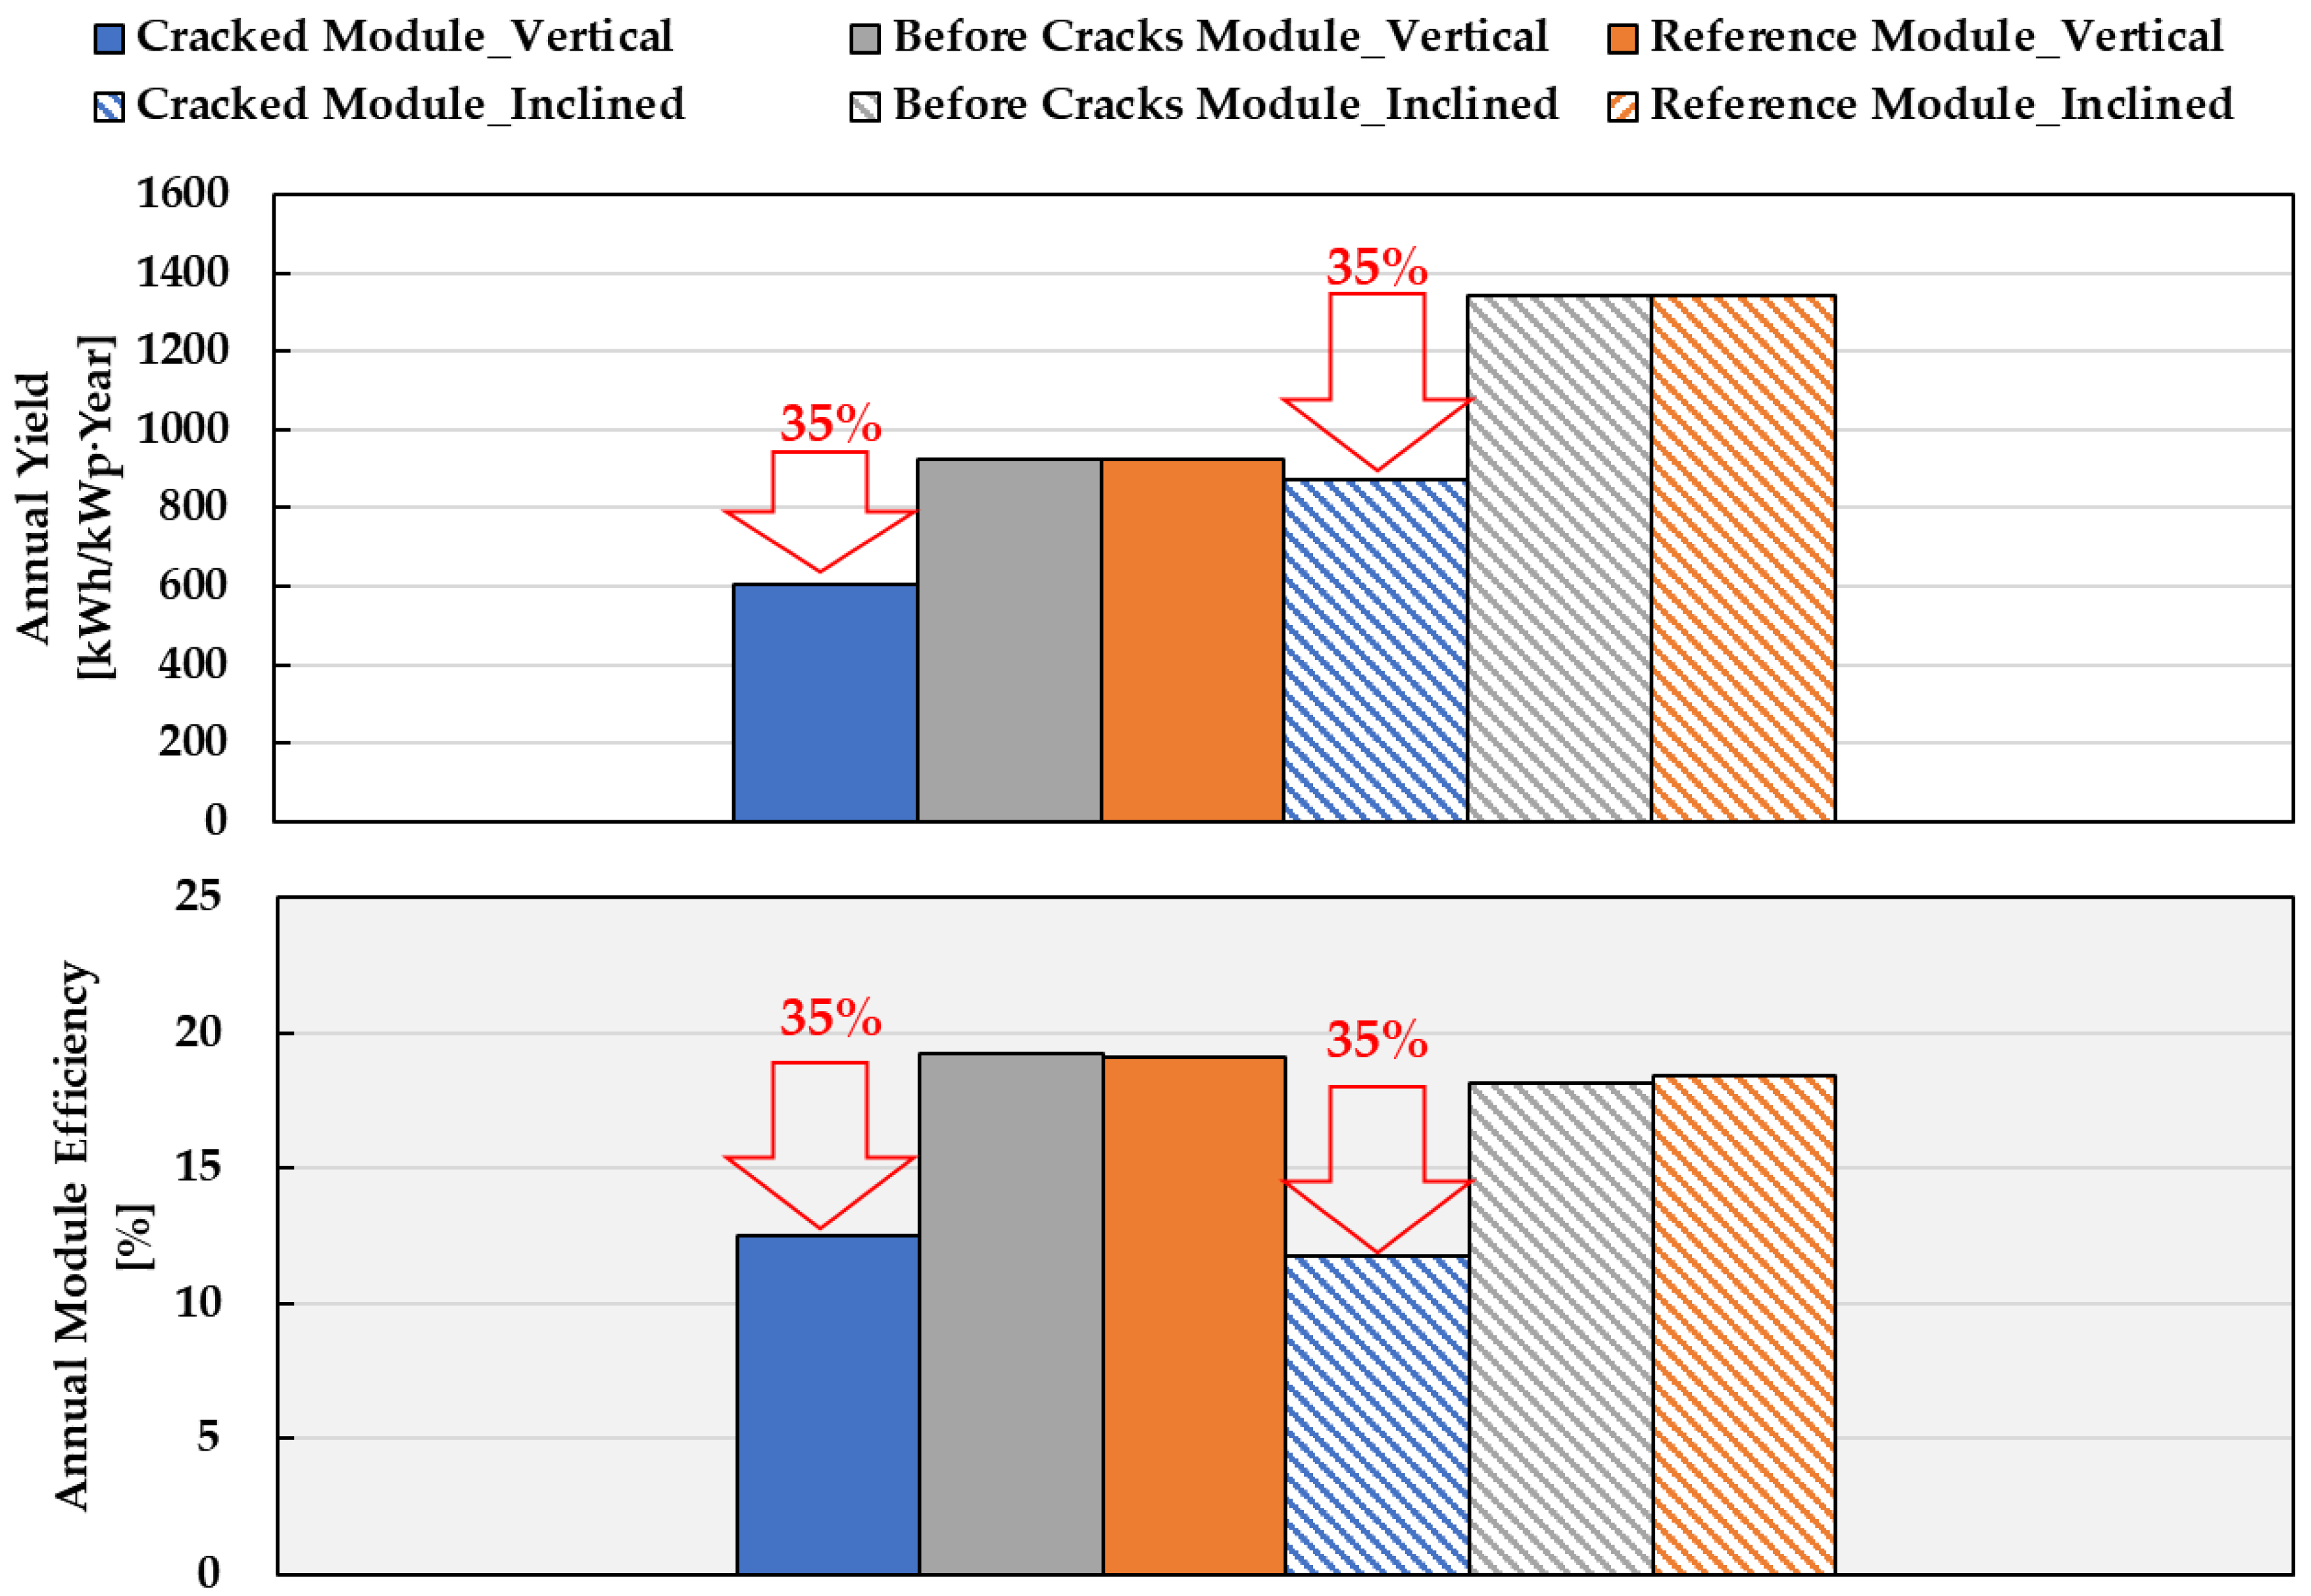
  • After proper validation of the simulated BIPV model, cumulative output yields and efficiencies were analyzed to investigate the impacts of the cracks in the BIPV modules on monthly and annual performance. The comparative results revealed that output reductions of ~34.6–35.4% occurred when cracks were present in the BIPV modules. As expected, for the vertical plane modules, the greatest output reductions were observed during the winter months, whereas the inclined place modules exhibited the greatest reductions in summer months. When annual reductions in BIPV output yields and efficiencies were analyzed, a 35% of reduction in both vertical and inclined plane modules was observed.
The results from this comparative study can provide useful insights into the impact of cracks in BIPV modules on high-level output performance. Based on the results from the measured and simulated data, it can be concluded that cracks in the BIPV modules can significantly impact BIPV output performance. However, the main issue with BIPV module’s cracks is that they are difficult to recognize and detect with the naked eye unless an actual outdoor test or detailed EL imaging is conducted. Cracks might occur in BIPV modules during their transportation from the factory to building sites or as a result of installation or other mechanical loads, such as snow loads and strong winds. In terms of this case study, the cracks of cells in the BIPV modules likely occurred during transportation as the result of vibrations. This was deduced primarily because the EL test indicated that the BIPV modules had significant damage throughout them, including large-sized cracks in most cells. Consequently, the cracks of cells in BIPV modules can be considered as important issues in terms of their transportation. In addition, it should be noted that BIPV modules can be frequently exposed to mechanical loads, and these loads can lead to significant cracks in the module cells and thus to power reductions.
It should be noted that, in this study, some limiting assumptions had to be made during the measurement and simulation analysis. For example, the experiment was conducted for only three months (i.e., February through April), and only two cracked types of BIPV modules were used mainly because of the limited resources available for the experiment. Based on these limitations, future work should be conducted including the use of various BIPV modules with and without cracks, for a more direct comparison. In addition, more experimental studies should be undertaken under different seasonal weather conditions.

Author Contributions

Conceptualization, K.-W.L., H.-M.L., D.-S.K., and J.-H.Y.; methodology, K.-W.L., H.-M.L., and D.-S.K.; software and simulation, K.-W.L. and H.-M.L.; formal analysis, K.-W.L.; investigation, K.-W.L. and H.-M.L.; resource, K.-W.L., H.-M.L., and J.-H.Y.; writing—original draft, K.-W.L. and D.-S.K.; writing—review and editing, D.-S.K., J.-H.Y., and H.-M.L., R.-D.L.; visualization, K.-W.L. and D.-S.K. All authors have read and agreed to the published version of the manuscript.

Funding

This research received no external funding.

Data Availability Statement

Not applicable.

Acknowledgments

This work was supported by the Korea Institute of Energy Technology Evaluation and Planning (KETEP) and the Ministry of Trade, Industry & Energy (MOTIE) of the Republic of Korea (No. 20182010600110). In addition, this work was supported by the Korea Institute of Energy Technology Evaluation and planning (KETEP) and the Ministry of Trade, Industry & Energy (MOTIE) of the Republic of Korea (No. 20204030200080).

Conflicts of Interest

The authors declare no conflict of interest.

References

  1. U.S. Energy Information Administration. In EIA Energy Outlook 2020 with Projections to 2050; EIA: Washington, DC, USA, 2020.
  2. Pylsy, P.; Lylykangas, K.; Kurnitski, J. Buildings’ energy efficiency measures effect on CO2 emissions in combined heating, cooling and electricity production. Renew. Sustain. Energy Rev. 2020, 134, 110299. [Google Scholar] [CrossRef]
  3. Kim, D.; Cho, H.; Koh, J.; Im, P. Net-zero energy building design and life-cycle cost analysis with air-source variable refrigerant flow and distributed photovoltaic systems. Renew. Sustain. Energy Rev. 2020, 118, 109508. [Google Scholar] [CrossRef]
  4. CSR. U.S. Carbon Dioxide Emissions in the Electricity Sector: Factors, Trends, and Projections. 2019. Available online: https://crsreports.congress.gov (accessed on 30 December 2020).
  5. Kim, D.; Cho, H.; Luck, R. Potential impacts of net-zero energy buildings with distributed photovoltaic power generation on the U.S. electrical grid. J. Energy Resour. Technol. Trans. Asme 2019, 141, 1–15. [Google Scholar] [CrossRef]
  6. Pinel, D.; Korpås, M.; Lindberg, K.B. Impact of the CO2 factor of electricity and the external CO2 compensation price on zero emission neighborhoods’ energy system design. Build. Environ. 2020, 187. [Google Scholar] [CrossRef]
  7. Pelle, M.; Lucchi, E.; Maturi, L.; Astigarraga, A.; Causone, F. Coloured BIPV technologies: Methodological and experimental assessment for architecturally sensitive areas. Energies 2020, 13, 4506. [Google Scholar] [CrossRef]
  8. Freitas, S.; Brito, M.C. Solar façades for future cities. Renew. Energy Focus 2019, 31, 73–79. [Google Scholar] [CrossRef]
  9. Al-Janahi, S.A.; Ellabban, O.; Al-Ghamdi, S.G. A novel BIPV reconfiguration algorithm for maximum power generation under partial shading. Energies 2020, 13, 4470. [Google Scholar] [CrossRef]
  10. Lee, H.; Yoon, J. Power performance analysis of a transparent DSSC BIPV window based on 2 year measurement data in a full-scale mock-up. Appl. Energy 2018, 225, 1013–1021. [Google Scholar] [CrossRef]
  11. Shukla, A.K.; Sudhakar, K.; Baredar, P. Recent advancement in BIPV product technologies: A review. Energy Build. 2017, 140, 188–195. [Google Scholar] [CrossRef]
  12. Jakica, N. State-of-the-art review of solar design tools and methods for assessing daylighting and solar potential for building-integrated photovoltaics. Renew. Sustain. Energy Rev. 2018, 81, 1296–1328. [Google Scholar] [CrossRef] [Green Version]
  13. Tripathy, M.; Sadhu, P.K.; Panda, S.K. A critical review on building integrated photovoltaic products and their applications. Renew. Sustain. Energy Rev. 2016, 61, 451–465. [Google Scholar] [CrossRef]
  14. Abdelhamid, M.; Singh, R.; Omar, M. Review of microcrack detection techniques for silicon solar cells. IEEE J. Photovolt. 2014, 4, 514–524. [Google Scholar] [CrossRef]
  15. Haase, F.; Kasewieter, J.; Nabavi, S.R.; Jansen, E.; Rolfes, R.; Kontges, M. Fracture probability, crack patterns, and crack widths of multicrystalline silicon solar cells in PV modules during mechanical loading. IEEE J. Photovolt. 2018, 8, 1510–1524. [Google Scholar] [CrossRef]
  16. Kntges, M.; Kunze, I.; Kajari-Schrder, S.; Breitenmoser, X.; Bjørneklett, B. The risk of power loss in crystalline silicon based photovoltaic modules due to micro-cracks. Sol. Energy Mater. Sol. Cells 2011, 95, 1131–1137. [Google Scholar] [CrossRef]
  17. Wen, T.K.; Yin, C.C. Crack detection in photovoltaic cells by interferometric analysis of electronic speckle patterns. Sol. Energy Mater. Sol. Cells 2012, 98, 216–223. [Google Scholar] [CrossRef]
  18. Kajari-Schröder, S.; Kunze, I.; Köntges, M. Criticality of cracks in PV modules. Energy Procedia 2012, 27, 658–663. [Google Scholar] [CrossRef] [Green Version]
  19. Köntges, M.; Kajari-Schröder, S.; Kunze, I.; Jahn, U. Crack Statistic of Crystalline Silicon Photovoltaic Modules. In Proceedings of the 26th European Photovoltaic Solar Energy Conference and Exhibition, Hamburg, Germany, 5–9 September 2011; pp. 3290–3294. [Google Scholar] [CrossRef]
  20. Arnaud, M.; Felix, H.; Marc, K. Impact of Cracks in Multicrystalline Silicon Solar Cells on PV Module Power—A Simulation Study Based on Field Data. IEEE J. Photovolt. 2015, 5, 1735–1741. [Google Scholar] [CrossRef]
  21. Buerhop, C.; Wirsching, S.; Bemm, A.; Pickel, T.; Hohmann, P.; Nieß, M.; Vodermayer, C.; Huber, A.; Glück, B.; Mergheim, J.; et al. Evolution of cell cracks in PV-modules under field and laboratory conditions. Prog. Photovolt. 2018, 26, 261–272. [Google Scholar] [CrossRef]
  22. Xiong, H. Formation and Orientational Distribution of Cracks Induced by Electromagnetic Induction Soldering in Crystalline Silicon Solar Cells. IEEE J. Photovolt. 2017, 7, 966–973. [Google Scholar] [CrossRef]
  23. Tne Tech CO. Specifications PV Module Outdoor I-V Measurement System; Tne Tech CO.: Giheung-gu, Korea, 2018. [Google Scholar]
  24. KMA. Korea Meteorological Administration (KMA). Available online: https://www.kma.go.kr/eng/index.jsp (accessed on 30 December 2020).
  25. Test, S.; Equipment, M. Solmetric SunEye 210 User’s Guide; Solmetric Corporation: Sebastopol, CA, USA, 2011. [Google Scholar]
  26. Co, L.S. Solar Pro Technical Documentation; LS Electric: Anyang-si, Korea, 2016; pp. 1–9. [Google Scholar]
  27. ANSI/ASHRAE. ASHRAE Guideline 14 Measurement of Energy and Demand Savings. Ashrae 2002, 8400, 170. [Google Scholar]
Figure 1. BIPV modules and their detailed sections.
Energies 14 00836 g001
Figure 2. Electroluminescence (EL) images of the same solar cell with crack modes A, B, and C. (Left) EL image taken at the short-circuit current. (Right) EL image taken at 10% of the short-circuit current obtained from [16].
Energies 14 00836 g002
Figure 3. Actual outward and EL images of cracked modules and an outward image of the reference module: (a) exterior wall, (b) roof, and (c) common BIPV modules.
Energies 14 00836 g003
Figure 4. Experimental facility for testing PV systems: (a) front view; (b) top view.
Energies 14 00836 g004
Figure 5. Sun-path diagram used to identify specific shade-causing obstructions by the measurement site [25].
Energies 14 00836 g005
Figure 6. Cumulative irradiances of each plane for three months.
Energies 14 00836 g006
Figure 7. Flowchart of data analysis for the comparative study.
Energies 14 00836 g007
Figure 8. Comparison of power yields and plane irradiances between reference and cracked modules.
Energies 14 00836 g008
Figure 9. Comparison of monthly efficiency between reference and cracked modules.
Energies 14 00836 g009
Figure 10. Comparison of hourly PV outputs between cracked measured and simulated data: (a) vertical and (b) inclined plane positions.
Energies 14 00836 g010
Figure 11. Comparison of hourly PV outputs between reference measured and simulated data: (a) vertical and (b) inclined plane positions.
Energies 14 00836 g011
Figure 12. Measured versus simulated data during the comparative period (three months) for (a) cracked-vertical, (b) reference-vertical, (c) cracked-inclined, and (d) reference-inclined modules.
Energies 14 00836 g012
Figure 13. Comparison of monthly module yields for cracked and non-cracked modules: (a) vertical and (b) inclined plane positions.
Energies 14 00836 g013
Figure 14. Comparison of annual module yields and efficiencies.
Energies 14 00836 g014
Table 1. Specification of each BIPV modules under Standard Test Condition (STC).
Installation ConditionInclined Plane
[Roof BIPV Application]
Vertical Plane
[Exterior Wall BIPV Application]
FeatureBefore CrackedCracked
(Inclined)
ReferenceBefore CrackedCracked
(Vertical)
Reference
Research purposeOnly Sim.Sim. & Exp.Sim. & Exp.Only Sim.Sim. & Exp.Sim. & Exp.
Pmax (W)6032.5181.180.052.0181.1
Voc (V)19.223.324.49.620.524.4
Isc (A)4.22.29.710.54.09.7
Vmp (V)16.017.919.88.016.119.8
Imp (A)3.71.89.210.03.29.2
FF (%)75.1263.5675.8579.3763.3276.46
Efficiency (%)20.411.020.921.113.720.9
Cell Area (cm2)2938.32938.38649.03793.93793.98649.0
Serial-Parallel36-136-116-236-1
Cut cell PV modulesThree cutFullHalf cutFull
NoteOriginal manifested performance dataRe-tested performance dataRe-tested performance dataOriginal manifested performance dataRe-tested performance dataRe-tested performance data
Table 2. Measured parameters of the monitoring system [23].
CategoryItem
Electrical & Temperature DataMaximum power ouput, Pmpp (W)
Maximum power voltage, Vmpp (V)
Maximum power current, Impp (A)
Open circuit voltage, Voc (V)
Short circuit current, Isc (A)
Fill factor, FF (%)
Module level I-V curve
Meteorological DataFrom monitoring systemHorizontal plane irradiation (W/m2)(0° of tilt angle)
Inclined plane irradiation (W/m2) (30° of tilt angle)
Vertical plane irradiation (W/m2) (90° of tilt angle)
From Korea Meteorological Administration (KMA)Hourly outdoor dry bulb air temperature (°C)
Table 3. CVRMSE comparison between measured and simulated data.
VerticalInclined
Cracked ModuleReference ModuleCracked ModuleReference Module
CV(RMSE) [%]26.2018.387.876.74
Publisher’s Note: MDPI stays neutral with regard to jurisdictional claims in published maps and institutional affiliations.

