Article

Numerical Simulation Analysis of Ag Crystallite Effects on Interface of Front Metal and Silicon in the PERC Solar Cell

1
Photovoltaic Laboratory, Korea Institute of Energy Research, Daejeon 34129, Korea
2
Convergence Materials Research Center, Innovative Technology Research Division, Gumi Electronics and Information Technology Research Institute (GERI), Gumi 39171, Korea
3
Department of Physics, Chungbuk National University, Cheongju 28644, Korea
*
Authors to whom correspondence should be addressed.
Energies 2021, 14(3), 592; https://doi.org/10.3390/en14030592
Submission received: 28 December 2020 / Revised: 13 January 2021 / Accepted: 14 January 2021 / Published: 25 January 2021
(This article belongs to the Collection Advanced Materials for Energy Conversion and Storage Devices)

Abstract

:
In the fabrication of crystalline silicon solar cells, the contact properties between the front metal electrode and silicon are one of the most important parameters for achieving high-efficiency, as it is an integral element in the formation of solar cell electrodes. This entails an increase in the surface recombination velocity and a drop in the open-circuit voltage of the solar cell; hence, controlling the recombination velocity at the metal-silicon interface becomes a critical factor in the process. In this study, the distribution of Ag crystallites formed on the silicon-metal interface, the surface recombination velocity in the silicon-metal interface and the resulting changes in the performance of the Passivated Emitter and Rear Contact (PERC) solar cells were analyzed by controlling the firing temperature. The Ag crystallite distribution gradually increased corresponding to a firing temperature increase from 850 C to 950 C. The surface recombination velocity at the silicon-metal interface increased from 353 to 599 cm/s and the open-circuit voltage of the PERC solar cell decreased from 659.7 to 647 mV. Technology Computer-Aided Design (TCAD) simulation was used for detailed analysis on the effect of the surface recombination velocity at the silicon-metal interface on the PERC solar cell performance. Simulations showed that the increase in the distribution of Ag crystallites and surface recombination velocity at the silicon-metal interface played an important role in the decrease of open-circuit voltage of the PERC solar cell at temperatures of 850–900 C, whereas the damage caused by the emitter over fire was determined as the main cause of the voltage drop at 950 C. These results are expected to serve as a steppingstone for further research on improvement in the silicon-metal interface properties of silicon-based solar cells and investigation on high-efficiency solar cells.

1. Introduction

Among the recent trends of research in the photovoltaic industry, a Passivated Emitter and Rear Contact (PERC) structure that minimizes surface recombination through passivation layers on the front and rear sides of a solar cell has gained considerable interest. The front-side recombination of PERC solar cells directly impact the open-circuit voltage of solar cells and is one of the key factors affecting the efficiency loss of solar cells. This front-side recombination is represented as leakage current in reverse direction on the equivalent circuit, and the leakage current is defined as saturation current density. In a solar cell structure, differences arise in the diffusion length according to the absorption coefficient of the solar spectrum, and with the sunlight entering the silicon substrate, the absorption rate decreases, which leads to an exponential decrease in the photogeneration rate, and thus the saturation current density is the highest at the front-side of the solar cell. The surface recombination velocity has the highest value at the electrode part at the front-side of the solar cell, and thus the highest value is observed at saturation current density J 0 . m e t a l occurring at the electrode [1,2,3]. The high value of J 0 . m e t a l reduces the open-circuit voltage of solar cells; reducing J 0 . m e t a l is one of the pivotal factors in the manufacturing of high-efficiency solar cells [4,5,6,7,8,9]. In this context, while most research on solar cell efficiency enhancement has been conducted to date on the passivation properties of solar cells, as research with this approach is reaching its limit, there is a need for research with a strategic approach that focuses on reducing the recombination by electrodes.
In general, in crystalline silicon-based PERC solar cells, the front electrode is fabricated through a screen printing process. In the formation process of the front electrode, Ag paste is patterned in a grid form on the front surface of the silicon on which the SiN x passivation layer is formed, and then the electrode undergoes a firing process to complete the fabrication. In the firing process, the glass frit inside the Ag paste is fluidized and reacts with the front-side SiN x passivation layer, leading to fire through reaction. It has been reported that Ag crystallites are formed on the surface of the Si substrate in the fire through a reaction process, forming contacts with the emitter layer [10,11]. Ag crystallites formed in this way reduce the glass layer resistance formed by the firing process through reaction and they are regarded as an important element for achieving low contact resistance [12,13,14]. However, the Ag crystallites formed during the firing process may damage the emitter layer depending on the size and distribution. Such damage will lead to an increase in J 0 . m e t a l , a decrease in shunt resistance, and consequently degrading the solar cell performance [15].
In this study, the characteristics of Ag crystallites formation according to the electrode firing temperature of the solar cell were analyzed, and the effects of the changes in J 0 . m e t a l and surface recombination velocity on the electric properties of the silicon-based PERC solar cell were investigated. To obtain the electrical properties and J 0 . m e t a l value of the solar cell, the Suns–Voc was measured using various front metal pattern, and the values were obtained using the one-diode model. This method extracts the values using the fraction of the electrode area and the slope of J 0 . t o t a l [8,16,17]. In addition, after the electrode formation, the Ag crystallites on the silicon surface were observed using scanning electron microscopy (SEM). With the extracted J 0 . m e t a l value, surface recombination velocity was calculated using an equation, and based on the result, the effect of the metal–silicon contact on the electrical properties of the solar cell was analyzed through simulation.

2. Materials and Methods

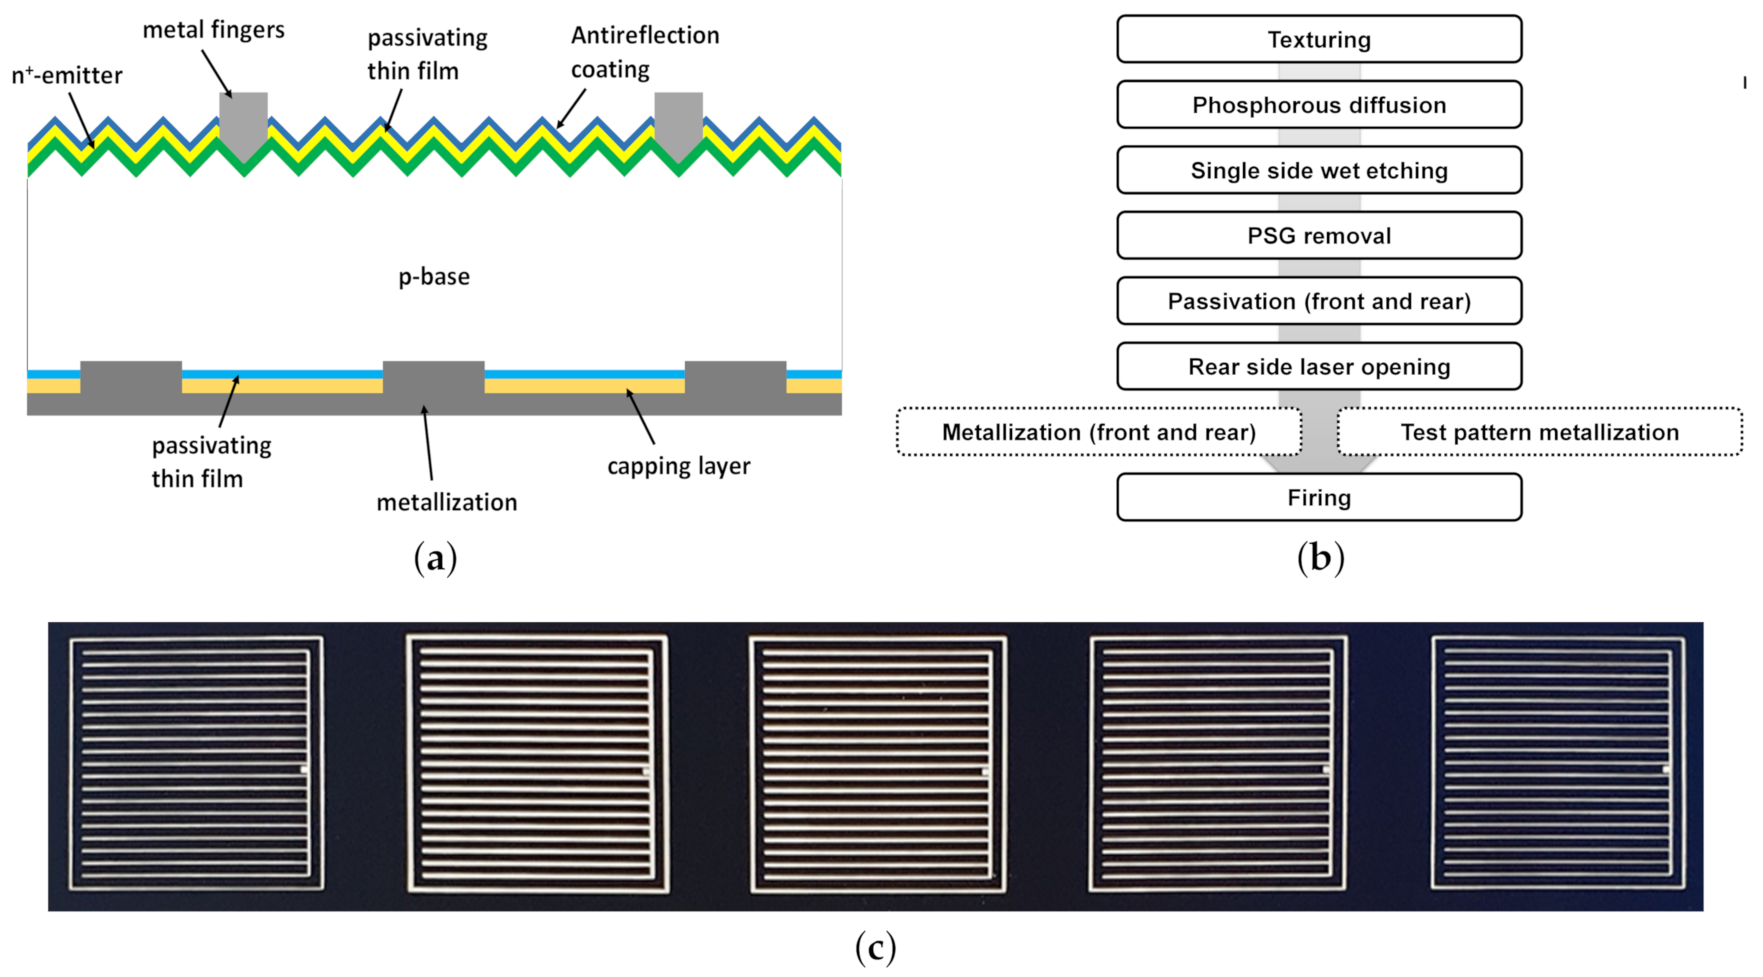
2.1. Solar Cell Preparation

As shown in Figure 1a, the wafer used in the experiment was a p-type Cz (Czochralski)-Si wafer of 6 inches, resistivity at 1–3 Ω · cm, and thickness around 180 μm. As shown in Figure 1b, the wafer texturing was performed using an alkaline solution, and then with a POCl 3 source, an emitter layer with sheet resistivity of about 85 Ω /sq was formed in a doping furnace. After forming the emitter layer, one side etching was performed using a wet isolation process, and the Phosphorus Silicate Glass (PSG) formed in the doping process was removed by immersion in a 10% HF solution for 30 s. The passivation layer was deposited using plasma enhanced chemical vapor deposition (PECVD) and atomic layer deposition (ALD) with SiN x (80 nm) on the front surface and Al 2 O 3 /SiN x (10/150 nm) on the rear surface. After the laser opening process for forming the local back surface field (BSF) on the rear side, the electrode was printed using a screen printing method.
Screen printing was conducted under two conditions: (1) preparation of the PERC solar cell and (2) preparation of J 0 . m e t a l measurement sample. As shown in Figure 1c, in the case of the sample for J 0 . m e t a l measurement, the H-pattern was printed with approximately a 4% fraction on the front surface using Ag paste. In addition, in the same way as the preparation of the PERC solar sample, Al paste was used for rear side printing, and for the front-side, the electrode pattern with 1–15% fraction was used for printing. The size of each electrode pattern was 2 cm × 2 cm, and 25 electrode patterns were printed on one side of the wafer. All samples were printed and subjected to a high-temperature firing process at three different temperatures: 850, which is the standard temperature, 900 and 950 C. The samples with different firing temperatures were used to investigate the firing temperature effects on the Ag crystallite distribution and J 0 . m e t a l values. It is noted that our firing temperature has to be higher than 800 C due to the fact that the lower firing temperature cannot appropriately form the electrically connected Ag electrode on the emitter region in silicon [18]. The diagram for the process of both samples is shown in Figure 1b. The electrical properties of the manufactured PERC solar cell were investigated using a light-biased current-voltage (LIV) measurement system. For the J 0 . m e t a l sample, saturation current density was measured using a Suns–Voc testing system and this value was used to calculate the recombination velocity.

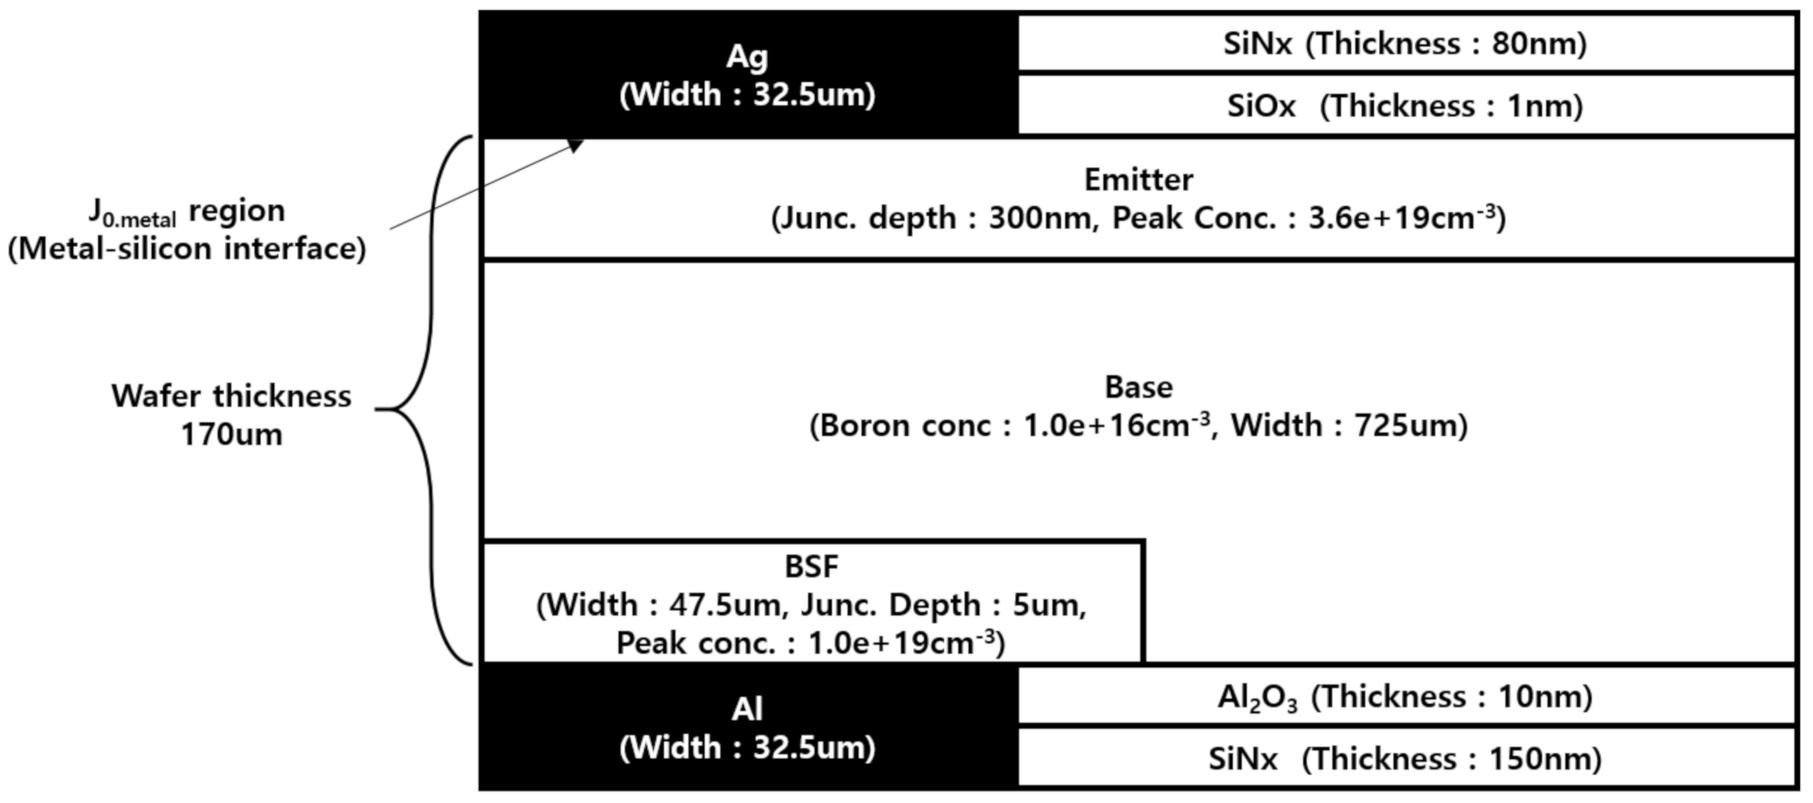
2.2. Solar Cell Simulation Define

In this study, for analysis of the impact on Ag crystallites distribution by firing temperature acquired experimentally, a numerical simulation method was used for systematic analysis. As shown in Figure 2, the the PERC solar cell structure was defined in a simple form to perform the simulation. A Technology Computer-Aided Design (TCAD) simulation program (Silvaco TCAD; ATLAS) was used for the solar cell simulation in this study. As for the simulation setup, a periodic boundary condition was assumed, and the repeated structure inside the solar cell was simplified for definition. For the reference solar cell of the simulation model, the thickness was defined at 170 μm and the width at 725 μm. The basic width of the front electrode was 65 μm and considering the periodic boundary condition, half of the width at 32.5 μm was set for the simulation. The rear electrode was set with the structure in the same pattern as in the front electrode, and the width was also set to be the same as the front electrode. At the lower part of the front electrode of the simulation model, surface recombination velocity was defined, and the data obtained from the experiment was used to investigate the change pattern. The surface recombination velocity was defined under the front electrode of the simulation model, and the change pattern was tracked by applying the experimentally extracted data.
The stack passivation conditions used in the actual process were applied to define the properties of the front/rear side anti-reflection coating layer. The front-side of the solar cell was defined with a SiN x /SiO x structure, at depths of 80 nm and 1 nm, respectively. The rear side of the solar cell was defined with an Al 2 O 3 /SiN x structure, at depths of 10 nm and 150 nm, respectively. For the doping condition of the front emitter, the junction depth was set at 300 nm and the peak concentration at 3.6 × 10 19 cm 3 . In the case of the front emitter, the distribution spans across the entire simulation domain, but in case of local BSF, the width was limited due to the local opening. The width of the local BSF was set at 47.5 μm and the junction depth was set at 5 μm. The peak concentration of BSF was defined at 1.0 × 10 19 cm 3 , and a Gaussian distribution was used for the impurity concentration distribution on the front and rear sides.

2.3. Calculation of Surface Recombination Velocity

Next, the J 0 . m e t a l value was extracted by Suns-Voc measurement. The J 0 . m e t a l of the PERC solar cell can be extracted by fitting the saturation current density value according to the metal fraction. In this case, J 0 . m e t a l can be calculated using the following equation [16].
J 0 . t o t a l = J 0 . b u l k + J 0 . r e a r m e t a l + J 0 . r e a r p a s s + J 0 . f r o n t m e t a l ( f ) + J 0 . f r o n t p a s s ( 1 f )
S l o p e = J 0 . f r o n t m e t a l J 0 . f r o n t p a s s
Here, J 0 . p a s s represents the saturation current density value of the area without the electrode on the solar cell surface and f represents the metal fraction. J 0 . m e t a l value was extracted through a commonly used one-diode model, and it was assumed that the ideality factor m value was sufficiently ideal (m = 1) to extract the J 0 . m e t a l value using only the J 0 . t o t a l value [8,16,17].
Then, J 0 . m e t a l was converted to surface recombination velocity (S e f f ) to calculate the simulation. For this conversion, the following equation was used [4,19].
J 0 . e m i t t e r = J 0 . f r o n t m e t a l ( f ) + J 0 . f r o n t p a s s ( 1 f )
S e f f = J 0 . e m i t t e r · N A q n i 2
where, S e f f represents the surface recombination velocity, J 0 . e m i t t e r is the saturation leakage current of an emitter layer, q is the electronic charge, n i the intrinsic carrier concentration and N A the doping concentration. The above two equations can be reorganized as follows.
S e f f = [ J 0 . f r o n t m e t a l ( f ) + J 0 . f r o n t p a s s ( 1 f ) ] · N A q n i 2
Through the above equation, the relationship between J 0 . m e t a l and the surface recombination velocity can be represented, and the results obtained using the experiment and equation are illustrated below.

3. Results and Discussion

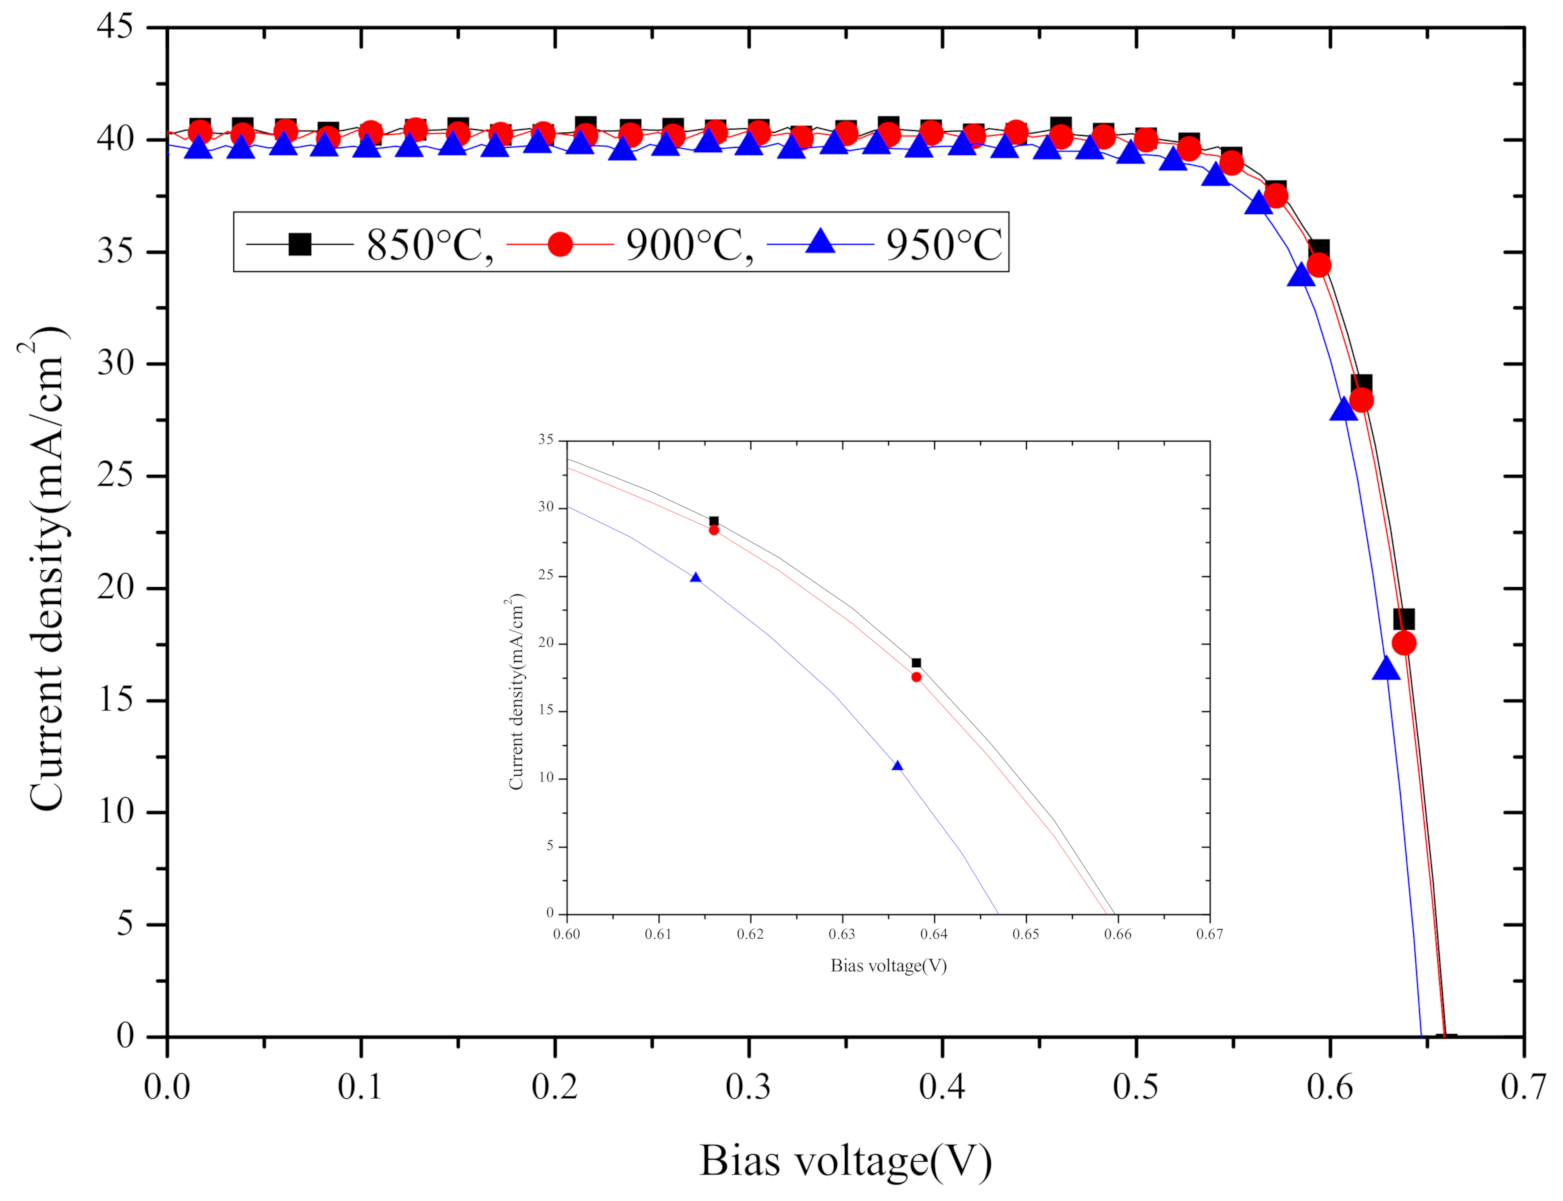
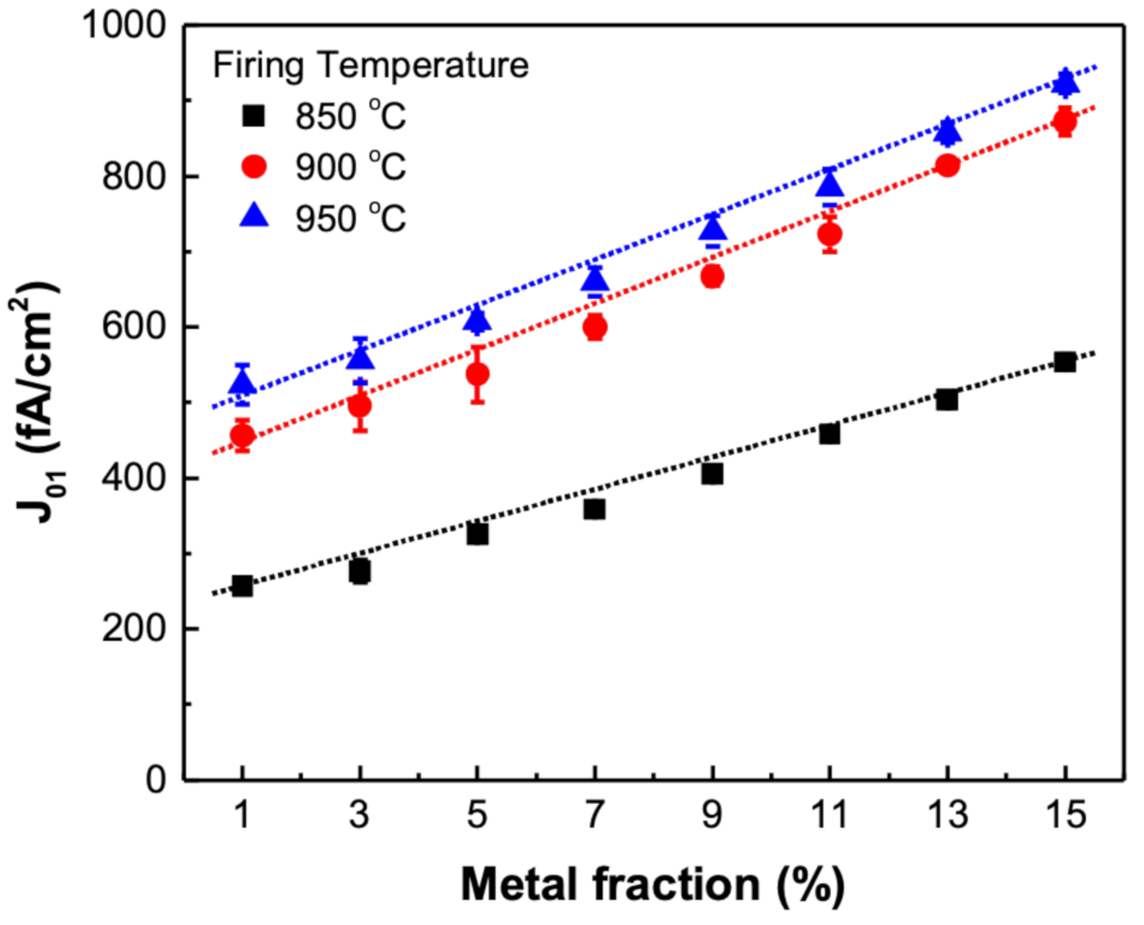
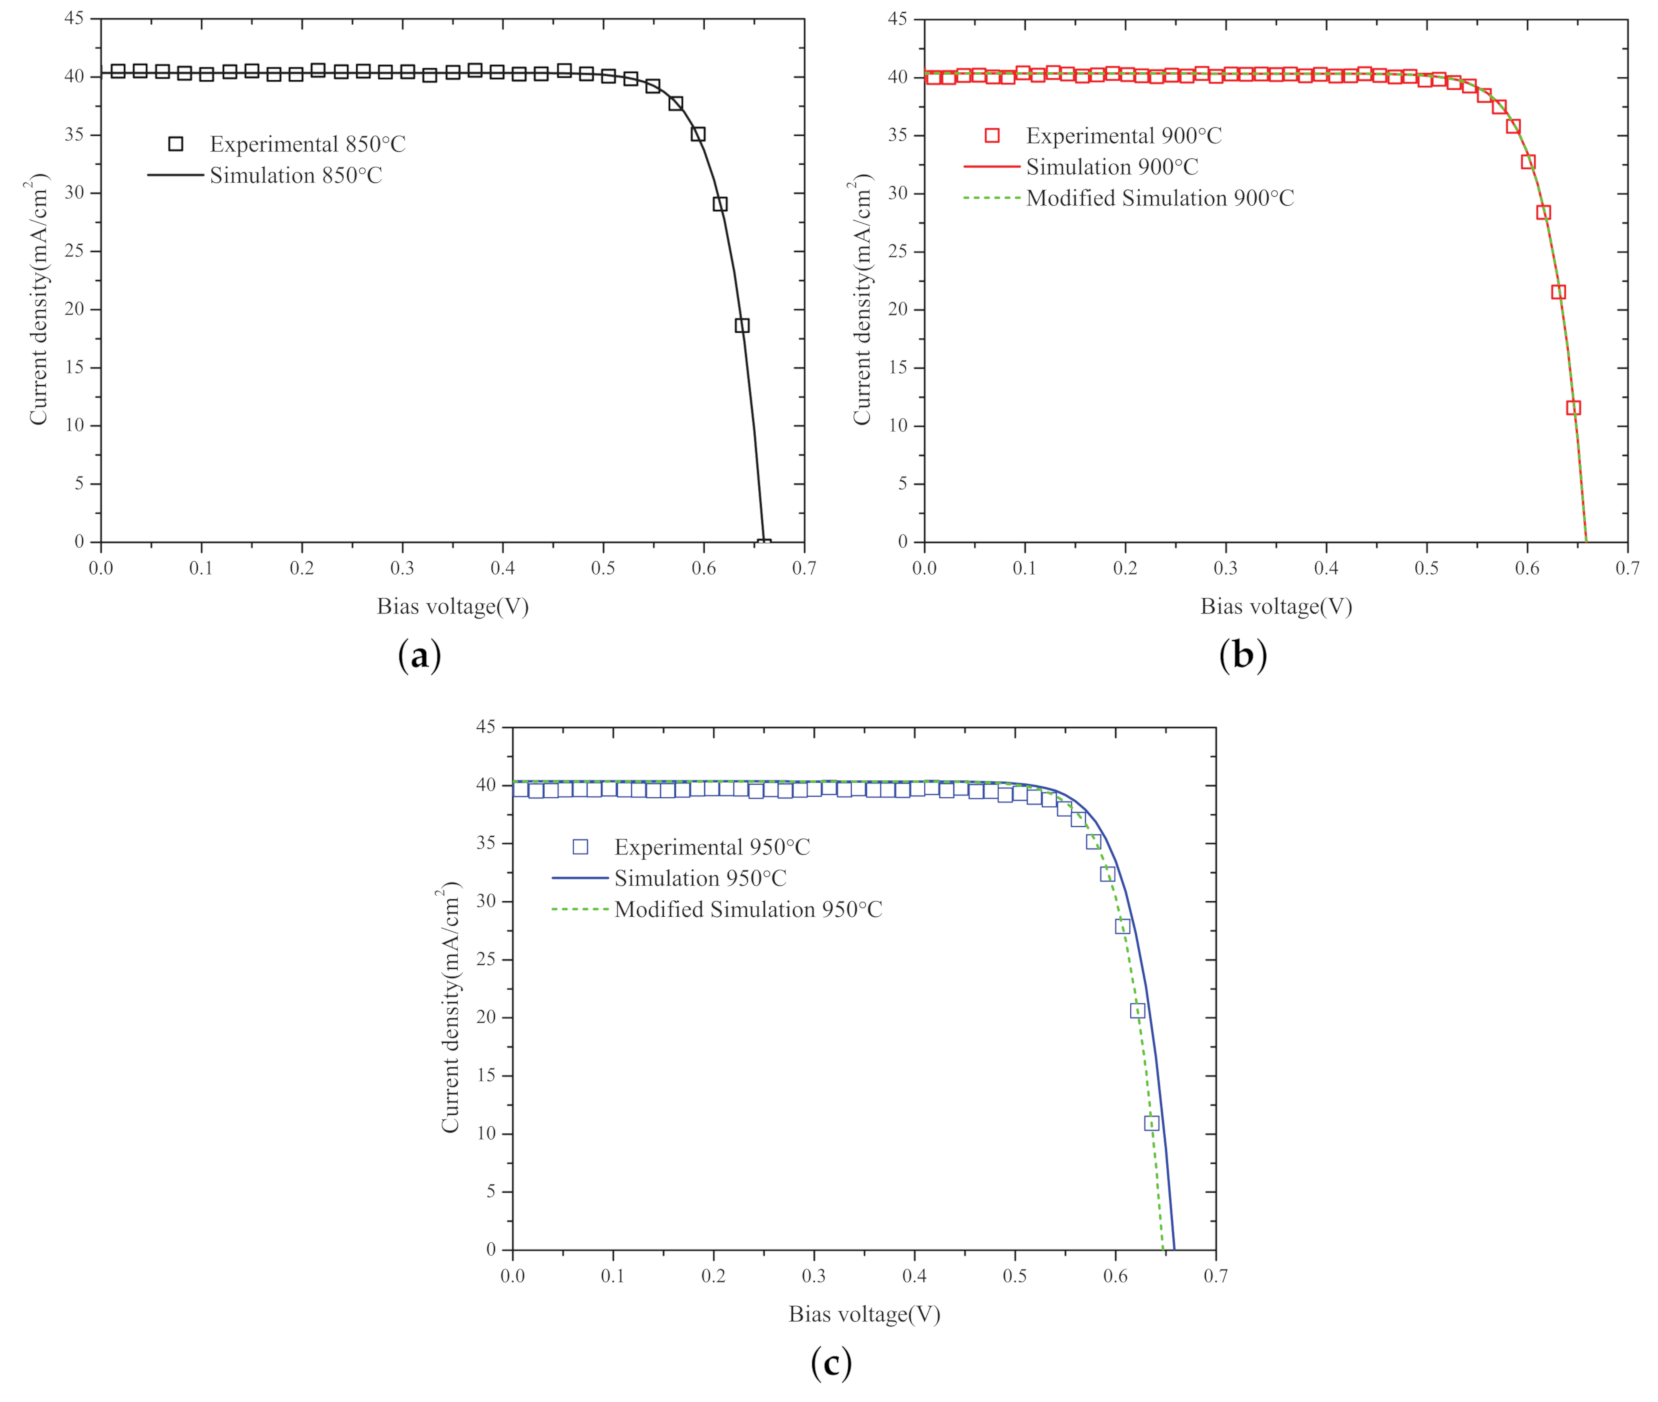
3.1. Electrical Properties of the Perc Solar Cell

For the simulation, two sample conditions, a PERC solar cell and a J 0 . m e t a l measurement sample, were fabricated and electric properties were measured with the prepared sample using the solar simulator (Light I-V), and Suns–Voc system. First, Figure 3 and Table 1 respectively show a graph and values of the PERC solar cell LIV measurements according to the firing temperature. As a result of LIV measurements, the open-circuit voltage of the sample decreased by about 1 mV from 659.7 mV (850 C) to 658.8 mV (900 C) with the increase in the firing temperature. However, when the firing temperature was 950 C, the open-circuit voltage sharply decreased to 647.0 mV.
It was investigated whether the decrease in the open-circuit voltage due to the firing temperature change in the PERC solar cell is associated with the size and distribution of Ag crystallites. SEM analysis was performed on the Si surface to determine the shape of Ag crystallite with increasing firing temperature. The sample was immersed in 68% nitric acid for 15 min to remove the Ag bulk area, and the glass frit was removed by immersing it in a 10% hydrofluoric acid solution for 2 min. Figure 4 shows the results of observing the size and distribution of Ag crystallites on the Si surface using SEM. It can be observed that the distribution and size of Ag crystallites on the Si surface increase as the firing temperature increases from 850 C to 950 C.
When the temperature rises in the firing process, the glass frits mixed in the paste are fluidized, and the passivation layer is etched to react with Si on the solar cell surface. At this time, Ag + ions inside the glass frit react with Si to form Ag crystallites [20,21].
Since the diffusion rates of glass frits and Ag + ions increase with temperature, the size and distribution of Ag crystallites increase with the firing temperature. This agrees with the previous description of the increased size of the Ag crystallites as the firing temperature increased. This leads to the etching of the passivation layer and increasing the recombination velocity on the solar cell surface and reducing the open-circuit voltage in the contact surface area between Si and the metal. As shown in Figure 3, in the result of this experiment, the reason for the drop in the open-circuit voltage with increasing firing temperature was the increase in the size of Ag crystallites. In the case of Ag crystallite distribution, the distribution determination through the local SEM surface images alone is difficult, but it was reported in a prior study by the authors that it can be quantitatively analyzed that the firing temperature rise increases the size and distribution of Ag crystallites [22]. The surfaces of silicon solar cells have pyramid structure. During a diffusion process for emitter formation, the top position of the pyramid structure inevitably has a higher doping concentration than valley position. Generally knowns, emitter doping concentration affects on the Ag crystallite growth, so it can easily be formed on the top of the pyramid structure than slope and valley position [23]. Based on this result, it was analyzed that with the increase in the firing temperature, the increased Ag crystallites caused the increase in the surface recombination velocity and the consequent drop in the open-circuit voltage.
As shown in Figure 5, J 0 . m e t a l of the PERC solar cell can be extracted by fitting the saturation current density value according to the metal fraction. Figure 5 shows that the saturation current density values according to the front electrode fraction at temperatures from 850 C to 950 C were determined. The J 0 . m e t a l value was obtained using the respective temperature gradient values in the saturation current density graph, and these are listed in Table 1. The J 0 . m e t a l value increased from 2165 fA/cm 2 at 850 C to 2798 fA/cm 2 at 900 C, and further to 3044 fA/cm 2 at 950 C. Using the extracted J 0 . m e t a l , S e f f was calculated through Equation (5), and the result showed a gradual increase at 353 cm/s, 570 cm/s, and 599 cm/s, respectively.
This result supports the relationship between the size of Ag crystallites and firing temperature discussed above and shows that the surface recombination velocity values may differ depending on the growth environment of Ag crystallites. However, considering the above results, although the saturation current density between 900 C and 950 C changed less than the saturation current density change between 850 C and 950 C, in Figure 3, at 950 C, more pronounced drop in the open-circuit voltage can be seen. To analyze these aspects, a numerical analysis simulation was performed to examine the effect of the change in Ag crystallites under ideal conditions.

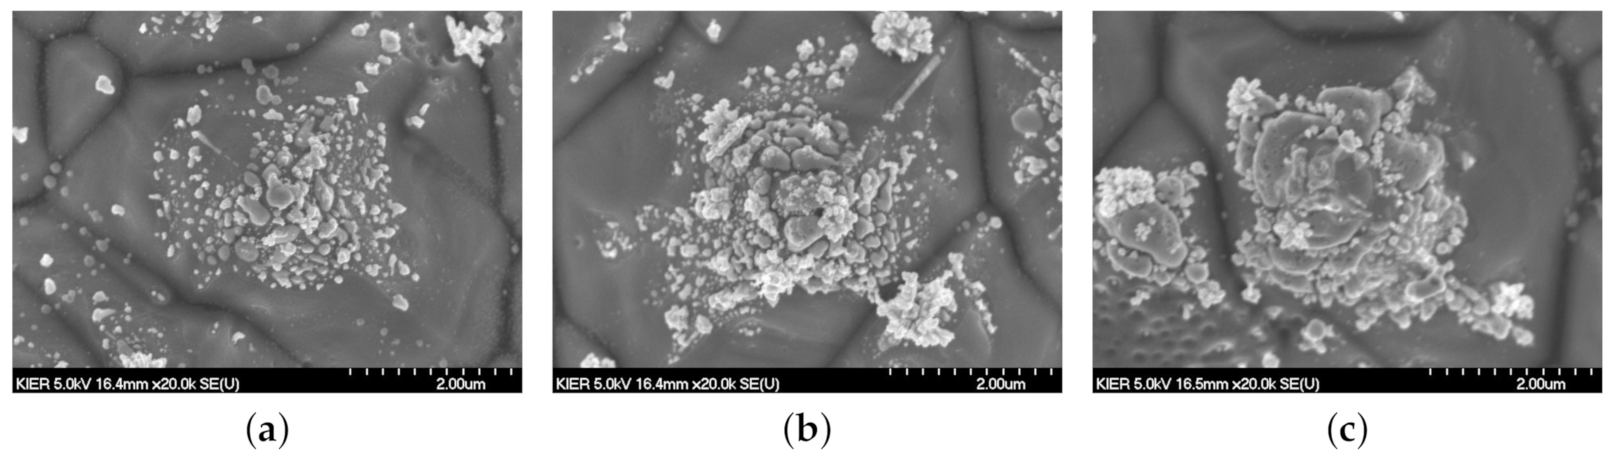
3.2. Simulation Results

Using a numerical simulation model, the effect of the change in surface recombination velocity on the solar cell performance was calculated and illustrated in Figure 6. For simplified representation of the complex recombination correlation inside the PERC solar cell, LIV data at 850 C was used as a reference. The difference in the surface recombination velocity values at 900 C and 950 C from the reference value at 850 C was used for the analysis of the effect on the solar cell performance. As shown in Table 1, at 850 C, the experimental and simulation results showed good agreement with each other. In this condition, the surface recombination velocity was set to be 570 cm/s to apply the surface recombination state at 950 C, and the result showed a very similar pattern to the trend of actually measured LIV values when the firing temperature increased from 850 C to 900 C.
Since the two sets of values are not exactly the same, the surface recombination velocity extracted by fitting the 900 C LIV data obtained from the experimental measurement in the simulation shows a value of 548.1 cm/s. This indicates a difference of only 21.9 cm/s compared to the estimated value at 570 cm/s in the calculation, which suggests an error of approximately 3.84%. As the simulation result showed a similar pattern to the surface recombination velocity changes of Ag crystallites obtained by experimental measurements, it is considered that the recombination properties of Ag crystallites have induced changes in the PERC solar cell performance.
The trend shown at 900 C is different from that observed at 950 C. In the sample for the J 0 m e a s u r e m e n t , when the extracted value of the surface recombination velocity was used in the simulation at the 950 C condition, the simulation result was not consistent with the LIV data of the PERC solar cell at 950 C. The open-circuit voltage of the 950 C PERC solar cell is 647.0 mV, and the value calculated through the simulation is 658.56 mV, showing a difference of 11.56 mV, indicating an error at 1.79%. This corresponds to a 107-fold increase in error compared to an error of 0.017% at 900 C. To analyze the sharp error increase, a simulation fitting was conducted to obtain the consistent value with the LIV data of the 950 C PERC solar cell, and, in this case, the extracted surface recombination velocity is calculated at 4287 cm/s (see the modified simulation 950 C in Figure 6 and 950-simul.modified in Table 1). This corresponds to a difference of 3688 cm/s compared to the measurement data, and this difference is considered to be due to factors other than the characteristics of Ag crystallites occurring in the electrode. In the J 0 m e a s u r e m e n t sample, the possibility of over fire occurrence is considered to be smaller than the sample for the PERC solar cell, and in the actual process of PERC solar cell fabrication, it was considered that the emitter layer of the solar cell is damaged due to over fire. It is speculated that the leakage current from the damaged emitter layer has caused the rapid increase in the overall surface recombination velocity of the solar cell.
Based on these results, the characteristics of Ag crystallites in the front electrode of the solar cell were analyzed, and the recombination properties of Ag crystallites according to the temperatures in the firing process were defined, which enabled the investigation of the effect of the surface recombination on the performance of the PERC solar cell. In conclusion, for Ag crystallites, compared to other measures, such as improving the contact resistance, surface recombination is the main driver in reducing the open-circuit voltage of the solar cells. Therefore, by suppressing the formation of Ag crystallites and minimizing its occurrence, the surface recombination on the front electrode will be reduced, enabling the fabrication of highly efficient solar cells. In addition, the formation of excessive Ag crystallites is highly likely to cause a sharp increase in the recombination velocity from the front emitter damage, and in this regard, measures to improve the temperature condition control are imperative.

4. Conclusions

This study investigated the distribution of Ag crystallites, saturation current density, surface recombination velocity, and changes in the performance of PERC solar cells at the silicon–metal interface for different firing temperatures. Furthermore, TCAD simulation was employed for in-depth analysis of factors degrading the solar cell performance. The experimental results confirmed that as the firing temperature increased from 850 C to 950 C, the distribution of Ag crystallites increased, leading to an increase in the surface recombination velocity at the silicon-electrode interface. The open-circuit voltage of PERC solar cells decreased with increasing firing temperature, indicating that the performance degradation of solar cells can be attributed to the increase in the distribution of Ag crystallites and the consequent increase in the surface recombination velocity. The in-depth analysis on the cause of the performance degradation of the solar cell using TCAD simulation showed that at temperatures of 850–900 C, the analysis results showed that the increase in the surface recombination velocity due to the increased distribution of Ag crystallites caused the changes in the open-circuit voltage of the PERC solar cell, whereas at temperatures of 900–950 C, over fire from the emitter damage was the main cause of the sharp decrease in the open-circuit voltage. These results are expected to provide a useful contribution to future research on the improvement of silicon solar cell performance by controlling firing temperature and changing Ag crystallites distribution in the field of PERC solar cell manufacturing and research.

Author Contributions

Conceptualization, M.S.J., M.G.K. and S.M.K.; methodology, M.S.J. and Y.L.; software, M.S.J., Y.L., S.M.K. and K.-H.K.; validation, M.S.J., Y.L. and S.M.K.; formal analysis, M.S.J. and S.C.; investigation, M.S.J. and M.G.K.; data curation, M.S.J., M.G.K. and S.M.K.; writing—original draft preparation, M.S.J., Y.L. and S.M.K.; writing—review and editing, S.M.K. and H.-e.S.; visualization, M.S.J. and S.M.K. All authors have read and agreed to the published version of the manuscript.

Funding

This research received no external funding.

Acknowledgments

This work was supported by the Korea Institute of Energy Technology Evaluation and Planning (KETEP) and the Ministry of Trade, Industry & Energy (MOTIE) of the Republic of Korea (No. 20183010014320) & (No. 20183010013880). This work was supported by the National Research Foundation of Korea(NRF) grant funded by the Korea government(MSIT) (No. 2020R1A2C1099974) and was conducted under the framework of the Research and Development Program of the Korea Institute of Energy Research (B7-2426). This research was also supported by a grant(The core project-564) from Gumi Core Components and Materials Technology Development Program of the Gumi Regional Government, 2020.

Conflicts of Interest

The authors declare no conflict of interest.

Abbreviations

The following abbreviations are used in this manuscript:
PERCPassivated Emitter and Rear Contact
V o c Open-circuit voltage
SEMScanning Electron Microscopy
CzCzochralski
PSGPhosphorus Silicate Glass
ALDAtomic Layer Deposition
BSFBack Surface Field
LIVLight-biased current-voltage measurement
TCADTechnology Computer-Aided Design
ARCAnti-reflection coating
S e f f Effective Surface Recombination Velocity

References

  1. Feldmann, F.; Bivour, M.; Reichel, C.; Hermle, M.; Glunz, S.W. Passivated rear contacts for high-efficiency n-type Si solar cells providing high interface passivation quality and excellent transport characteristics. Sol. Energy Mater. Sol. Cells 2014, 120, 270–274. [Google Scholar] [CrossRef]
  2. Meier, S.; Wasmer, S.; Fell, A.; Wöhrle, N.; Greulich, J.; Wolf, A. Efficiency Potential of p-type PERT vs. PERC Solar Cells. In Proceedings of the 2018 IEEE 7th World Conference on Photovoltaic Energy Conversion (WCPEC) (a Joint Conference of 45th IEEE PVSC, 28th PVSEC & 34th EU PVSEC), Waikoloa Village, HI, USA, 10–15 June 2018; pp. 3578–3583. [Google Scholar]
  3. Fischer, M. ITRPV 10th edition 2019–report release and key findings. Technical report. In Proceedings of the PV Cell Tech Conference, Penang, Malaysia, 12–13 March 2019. [Google Scholar]
  4. Hannebauer, H.; Sommerfeld, M.; Müller, J.; Dullweber, T.; Brendel, R. Analysis of the emitter saturation current density of industrial type silver screen-printed front contacts. In Proceedings of the 27th EU PVSEC, Frankfurt, Germany, 24–28 September 2012; Volume 1360. [Google Scholar]
  5. Min, B.; Dastgheib-Shirazi, A.; Altermatt, P.; Kurz, H. Accurate determination of the emitter saturation current density for industrial P-diffused emitters. In Proceedings of the 29th EU PV Energy Conference, Amsterdam, The Netherlands, 22–26 September 2014; p. 463. [Google Scholar]
  6. Hoenig, R.; Glatthaar, M.; Clement, F.; Greulich, J.; Wilde, J.; Biro, D. New measurement method for the investigation of space charge region recombination losses induced by the metallization of silicon solar cells. Energy Procedia 2011, 8, 694–699. [Google Scholar] [CrossRef]
  7. Müller, J.; Bothe, K.; Gatz, S.; Haase, F.; Mader, C.; Brendel, R. Recombination at laser-processed local base contacts by dynamic infrared lifetime mapping. J. Appl. Phys. 2010, 108, 124513. [Google Scholar] [CrossRef]
  8. Edler, A.; Mihailetchi, V.D.; Koduvelikulathu, L.J.; Comparotto, C.; Kopecek, R.; Harney, R. Metallization–induced recombination losses of bifacial silicon solar cells. Prog. Photovolt. Res. Appl. 2015, 23, 620–627. [Google Scholar] [CrossRef]
  9. Reichel, C.; Granek, F.; Benick, J.; Schultz-Wittmann, O.; Glunz, S. Comparison of emitter saturation current densities determined by injection-dependent lifetime spectroscopy in high and low injection regimes. Prog. Photovolt. Res. Appl. 2012, 20, 21–30. [Google Scholar] [CrossRef]
  10. Ballif, C.; Huljić, D.; Willeke, G.; Hessler-Wyser, A. Silver thick-film contacts on highly doped n-type silicon emitters: Structural and electronic properties of the interface. Appl. Phys. Lett. 2003, 82, 1878–1880. [Google Scholar] [CrossRef]
  11. Schubert, G.; Huster, F.; Fath, P. Physical understanding of printed thick-film front contacts of crystalline Si solar cells—Review of existing models and recent developments. Sol. Energy Mater. Sol. Cells 2006, 90, 3399–3406. [Google Scholar] [CrossRef]
  12. Hilali, M.M.; Sridharan, S.; Khadilkar, C.; Shaikh, A.; Rohatgi, A.; Kim, S. Effect of glass frit chemistry on the physical and electrical properties of thick-film Ag contacts for silicon solar cells. J. Electron. Mater. 2006, 35, 2041–2047. [Google Scholar] [CrossRef]
  13. Vinod, P. Specific contact resistance and carrier tunneling properties of the silver metal/porous silicon/p-Si ohmic contact structure. J. Alloys Compd. 2009, 470, 393–396. [Google Scholar] [CrossRef]
  14. Hörteis, M.; Gutberlet, T.; Reller, A.; Glunz, S.W. High-temperature contact formation on n-type silicon: Basic reactions and contact model for seed-layer contacts. Adv. Funct. Mater. 2010, 20, 476–484. [Google Scholar] [CrossRef]
  15. Shanmugam, V.; Khanna, A.; Basu, P.K.; Aberle, A.G.; Mueller, T.; Wong, J. Impact of the phosphorus emitter doping profile on metal contact recombination of silicon wafer solar cells. Sol. Energy Mater. Sol. Cells 2016, 147, 171–176. [Google Scholar] [CrossRef]
  16. Inns, D.; Poplavskyy, D. Measurement of metal induced recombination in solar cells. In Proceedings of the 2015 IEEE 42nd Photovoltaic Specialist Conference (PVSC), New Orleans, LA, USA, 14–19 June 2015; pp. 1–4. [Google Scholar]
  17. Fellmeth, T.; Born, A.; Kimmerle, A.; Clement, F.; Biro, D.; Preu, R. Recombination at metal-emitter interfaces of front contact technologies for highly efficient silicon solar cells. Energy Procedia 2011, 8, 115–121. [Google Scholar] [CrossRef]
  18. Grupp, G.; Huljic, D.; Preu, R.; Willeke, G.; Luther, J. Peak firing temperature dependence of the microstructure of ag thick-film contacts on silicon solar cells-a detailed afm study of the interface. In Proceedings of the 20th EC PVSEC, Barcelona, Spain, 6–10 June 2005. [Google Scholar]
  19. Aberle, A.G. Surface passivation of crystalline silicon solar cells: A review. Prog. Photovolt. Res. Appl. 2000, 8, 473–487. [Google Scholar] [CrossRef]
  20. Hong, K.K.; Cho, S.B.; You, J.S.; Jeong, J.W.; Bea, S.M.; Huh, J.Y. Mechanism for the formation of Ag crystallites in the Ag thick-film contacts of crystalline Si solar cells. Sol. Energy Mater. Sol. Cells 2009, 93, 898–904. [Google Scholar] [CrossRef]
  21. Qin, J.; Zhang, W.; Bai, S.; Liu, Z. Study on the sintering and contact formation process of silver front side metallization pastes for crystalline silicon solar cells. Appl. Surf. Sci. 2016, 376, 52–61. [Google Scholar] [CrossRef]
  22. Jeong, M.S.; Min, K.H.; Choi, S.; Kang, M.G.; Jeong, K.T.; Lee, E.T.; Kang, Y.; Kim, D.; Lee, H.S.; Song, H.E.; et al. Correlation between the open-circuit voltage and recombination loss at metal-silicon interfaces of crystalline silicon solar cells. Sol. Energy Mater. Sol. Cells 2020, 210, 110519. [Google Scholar] [CrossRef]
  23. Cabrera, E.; Olibet, S.; Rudolph, D.; Vullum, P.E.; Kopecek, R.; Reinke, D.; Herzog, C.; Schwaderer, D.; Schubert, G. Impact of excess phosphorus doping and Si crystalline defects on Ag crystallite nucleation and growth in silver screen-printed Si solar cells. Prog. Photovolt. Res. Appl. 2015, 23, 367–375. [Google Scholar] [CrossRef]
Figure 1. Passivated Emitter and Rear Contact (PERC) solar cell sample preparation, (a) PERC solar cell structure, (b) PERC solar cell manufacturing process, (c) metal pattern for measuring J 0 . m e t a l .
Energies 14 00592 g001
Figure 2. Schematic diagram and definition of periodic boundary domain on simplified PERC solar cell structure to perform a Technology Computer-Aided Design (TCAD) simulation for numerical calculation.
Energies 14 00592 g002
Figure 3. Light-biased current-voltage (LIV) results of the PERC solar cell depending on temperature conditions.
Energies 14 00592 g003
Figure 4. SEM images of Ag crystallite surface with the increase of temperature. (a) Firing temperature of 850 C, (b) firing temperature of 900 C, (c) firing temperature of 950 C.
Energies 14 00592 g004
Figure 5. J 01 vs. the metal fraction on the front electrode fraction.
Energies 14 00592 g005
Figure 6. LIV data compared to numerical simulation results for the PERC solar cells. (a) Firing temperature 850 C, (b) firing temperature 900 C, (c) firing temperature 950 C.
Energies 14 00592 g006
Table 1. Results of the PERC solar cell LIV measurements for different firing temperatures, and a comparison with simulation.
Firing Temperature ( C)V o c (mV)J s c (mA/cm 2 )FF (%)Eff. (%)J 0 . m e t a l (fA/cm 2 ) S e f f (cm/s)
850659.740.3681.3921.672165353
850-simul.659.6740.360781.443721.6843-353
900658.840.2681.2121.542798570
900-simul.658.6940.360481.456921.6553-570
900-simul. modified658.7940.360481.456221.6583-548.1
950647.039.6881.3020.873044599
950-simul.658.5640.360381.458521.6515-599
950-simul. modified647.040.355481.278521.2219-4287
Publisher’s Note: MDPI stays neutral with regard to jurisdictional claims in published maps and institutional affiliations.

